Embed Size (px)
Citation preview
SC I ENCE ADVANCES | R E S EARCH ART I C L E
SPACE SC I ENCES
1Image Analysis Group, Technical University of Dortmund, Otto-Hahn-Str. 4, D-44227Dortmund, Germany. 2Sternberg Astronomical Institute, Moscow State University, Uni-versitetskij pr., 13, 119234 Moscow, Russia.*Corresponding author. Email: [email protected]
Wöhler et al., Sci. Adv. 2017;3 : e1701286 8 September 2017
Copyright © 2017
The Authors, some
rights reserved;
exclusive licensee
American Association
for the Advancement
of Science. No claim to
original U.S. Government
Works. Distributed
under a Creative
Commons Attribution
NonCommercial
License 4.0 (CC BY-NC).
hD
ownloaded from
Time-of-day–dependent global distribution of lunarsurficial water/hydroxylChristian Wöhler,1* Arne Grumpe,1 Alexey A. Berezhnoy,2 Vladislav V. Shevchenko2
Anewset of time-of-day–dependent globalmapsof the lunar near-infraredwater/hydroxyl (H2O/OH) absorptionbandstrength near 2.8 to 3.0 mmconstructed on the basis ofMoonMineralogyMapper (M3) data is presented. The analyzedabsorption band near 2.8 to 3.0 mm indicates the presence of surficial H2O/OH. To remove the thermal emissioncomponent from the M3 reflectance spectra, a reliable and physically realistic mapping method has been developed.Our maps show that lunar highlands at high latitudes show a stronger H2O/OH absorption band in the lunar morningand evening than at midday. The amplitude of these time-of-day–dependent variations decreases with decreasing lati-tude of the highland regions,where belowabout 30°, absorption strengthbecomes nearly constant during the lunar dayat a similar level as in the high-latitude highlands atmidday. The lunarmaria exhibit weaker H2O/OHabsorption than thehighlands at all, but showing a smaller difference from highlands absorption levels in themorning and evening than atmidday. The level aroundmidday is generally higher for low-Ti than for high-Timare surfaces, where it reaches near-zerovalues. Our observations contrast with previous studies that indicate a significant concentration of surficial H2O/OH athigh latitudes only. Furthermore, althoughour results generally support the commonly acceptedmechanismofH2O/OHformation by adsorption of solar wind protons, they suggest the presence of amore strongly bounded surficial H2O/OHcomponent in the lunar highlands and parts of the mare regions, which is not removed by processes such as diffusion/thermal evaporation and photolysis in the course of the lunar day.
ttp:/
on January 31, 2020/advances.sciencemag.org/
INTRODUCTIONNear-infrared reflectance spectra acquired by the Moon MineralogyMapper (M3) instrument (1) are known to exhibit an absorption bandaround 2.8- to 3.0-mm wavelength, indicating the presence of surficialwater (H2O) and/or hydroxyl (OH) (2). Previous studies have led to thegeneral understanding that a strong H2O/OH absorption band is onlypresent in the lunar highlands at high selenographic latitudes beyond50° to 60° north and south, respectively, whereas the absorption bandhas been found to be weak or absent at lower latitudes (2). Thedependence of the H2O/OH absorption band on time of day has notbeen examined in the study by Pieters et al. (2). The solar wind hasbeen suggested by Pieters et al. (2) as themost likely source of theH2O/OH species that elicit the 3-mm band, but hydrated minerals are alsoconsidered possible. A strong contrast in H2O/OH absorption depthbetween mare and highland terrains has been described in the studyby McCord et al. (3), with mare surfaces exhibiting a near-zero absorp-tion strength. Furthermore, the results of McCord et al. (3) suggest atime-of-day–dependent variation of the H2O/OH absorption strength,which is found to be strongly correlated with the illuminationconditions and, thus, the local surface temperature. Near-infraredspectra acquired during the Deep Impact mission exhibit variationsof the lunar H2O/OH absorption depth with selenographic latitudeand local time of day (4). For a region in Mare Imbrium, the H2O/OH absorption depth has been found to decrease to a near-zero value,whereas in a highland region south ofMareHumboldtianum, theH2O/OH absorption depth decreases at midday to about 50% of its morningvalue (4). For the region around the lunar crater Boguslawsky located inthe illuminated southern polar nearside highlands, the H2O/OH ab-sorption strength has been found to decrease from a high level in the
lunar morning to a lower but still nonzero level atmidday (5). For thermalemission removal and surface temperature estimation, we used themethods described in Wöhler et al. (5). For a few selected points onthe lunar surface, Bandfield et al. (6) found that the H2O/OH absorptionband is present not only at high latitudes but also at low latitudes underboth oblique and steep illumination. The data of Bandfield et al. (6) sug-gest that the H2O/OH absorption strength is largely independent ofsolar incidence angle. Inside the lunar swirl ReinerGamma, theH2O/OHabsorption band is observed in the study by Bandfield et al. (6) to beless strong than outside the swirl, which leads to the conclusion of asolar wind origin of the H2O-related absorption near 2.95 mm (6). Thetime-of-day dependence of the H2O/OH absorption strength is notexamined specifically by Bandfield et al. (6). For the results obtained fromthe study by Bandfield et al. (6), the method of Bandfield et al. (7) forsurface temperature estimation was used, which accounts for the surfaceroughness.
Data acquired by the Lunar Prospector Neutron Spectrometer indi-cate the presence of hydrogen near the lunar poles (8), interpreted asH2Oice therein. As an alternative explanation, Starukhina and Shkuratov (9)proposed that the Lunar Prospector neutron flux–based observations ofpolar H, described, for example, in the study by Feldman et al. (8), mayresult from solar wind protons, which are adsorbed by the regolith andremain stable because of the low surface temperature in the lunar polarregions. Starukhina andShkuratov (9) suggested that protons fromEarth’smagnetotail are a source of H in permanently shadowed regions (9). Hy-drogen maps of higher resolution have been constructed using data ofthe Lunar Reconnaissance Orbiter (LRO) Lunar Exploration NeutronDetector (LEND), where water-equivalent hydrogen abundances of upto 0.5 weight % (wt %) at depths of up to 1 m have been inferred forpermanently shadowed regions at high latitudes (10). Furthermore,LEND data indicate an increased hydrogen content in the upper 1-mlayer on pole-facing slopes at high selenographic latitudes (11), as wellas time-of-day–dependent variations of the hydrogen content (12). AstudybyLivengood et al. (12) found the equatorial hydrogen concentration
1 of 10

SC I ENCE ADVANCES | R E S EARCH ART I C L E
on January 31, 2020http://advances.sciencem
ag.org/D
ownloaded from
to be maximal in the early morning, decreasing to its minimum inthe late afternoon. Livengood et al. (12) invoked volatile species ori-ginating from larger depth below the lunar surface to explain the ob-served hydrogen concentrations, which are so high that hydrogendelivery by the solar wind andmeteoroid impacts alone is consideredinsufficient (12).
However, a factor impeding analysis of the H2O/OH absorptionband depth is the thermal emission component that severely affectsthe spectral radiancesmeasured byM3 in the correspondingwavelengthrange, which needs to be corrected on the basis of an accurate estima-tion of the surface temperature. For the M3 level 2 spectral reflectancedata released on the Planetary Data System (PDS) (13), the approach ofClark et al. (14) has been used for surface temperature estimation andthermal emission removal (15). Clark et al. (14) point out that themethodproposed therein yields inaccurate surface temperature estimates inthe presence of a strong pyroxene-related spectral absorption bandaround 2 mm. These absorption bands are present throughout thelunar maria, hence in significant fractions of the lunar surface. Further-more, especially for high incidence angles (oblique illumination), therough surface of the Moon cannot be regarded as isothermal, that is,being characterized by a single temperature; it is instead characterizedby a mixture of different temperature values due to the nonuniform in-clination of different surface facetswith respect to illumination direction(7,16).Anapproach to account for the surface roughnesswhen estimatingthe surface temperature is proposed in the study byBandfield et al. (7),which is based on statistical modeling of the facet inclination. Themethods for artificial generation of rough surfaces and estimation of theirtemperatures under solar illumination introduced by Davidsson et al.(16) and Bandfield et al. (7), respectively, will be discussed in some detailin Materials andMethods. A preliminary analysis by Bandfield et al.,which probed how accounting for the surface roughness influences thederived strength of the lunar H2O/OH absorption band (6, 17), relyingon the surface temperature estimation method of Bandfield et al. (7),suggests that the surface temperatures estimated with the method ofClark et al. (14) are too low and that the H2O/OH absorption band isactually more pronounced than previously assumed. The results ofWöhler et al. (5) are in accordance with this general finding. Hence,H2O/OH absorption band depths derived from the M3 level 2 radiancedata on the PDS should be treated with care.
Thus, this paper concentrates on aspects of (i) the spatial distributionof lunar surficial H2O/OH on the lunar surface, (ii) the strength of the
Wöhler et al., Sci. Adv. 2017;3 : e1701286 8 September 2017
time-of-day–dependent variations of the density of surficial H2O/OH,and (iii) the relevance of the mechanism of solar wind proton adsorp-tion as an explanation of the observed behavior of theH2O/OH absorp-tion band depth.
RESULTSOverview of the M3 data processing frameworkHere, a new set of time-of-day–dependent globalmaps of the lunarH2O/OH absorption strength is presented. Our approach completely relies ontheM3 level 1B radiance data set available on the PDS. The thermal emis-sion removal has been performed on the basis of the method introducedbyWöhler et al. (5). Thismethod relies on the thermal equilibrium–basedapproach of Shkuratov et al. (18) but extends it by incorporating aniterative adjustment of surface temperature and spectral reflectance untilboth quantities have converged toward a consistent solution. Further-more, a correction for surface roughness is applied using an approachsimilar to that of Davidsson et al. (16). The Hapke model (19, 20) is usedto normalize the spectral reflectance to a uniform illumination andviewing geometry. The effect of local topography on the reflectancespectra is eliminated using the GLD100 topographic map (21). The spa-tial resolution of the original M3 data set of 140 m per pixel (1) has beenreduced to 20 pixels per degree longitude and latitude, corresponding toabout 1.5 km at the lunar equator. The resulting normalized reflectancespectra were then used to compute the relative H2O/OH band depthintegrated over M3 channels 78 to 84 between 2697 and 2936 nm (heretermed OHIBD) after division by a linear continuum fitted to M3 chan-nels 74 to 77 (2537 to 2657 nm) just shortward of the H2O/OH absorp-tion band [see the study byWöhler et al. (5) andMaterials andMethodsfor details on our data processing framework].
A typical M3 reflectance spectrum illustrating the removal of thethermal emission component, comparing our method with that ofClark et al. (14), is shown in Fig. 1. The shape of the mare soil reflectancespectrum corrected with ourmethod (Fig. 1A) is largely linear with weakabsorption bands near 1 and 2 mm, whereas the highland soil reflectancespectrum is of convex shape (Fig. 1B). This is a plausible result becausesimilar shapes have beenmeasured in the laboratory for the finely grainedfractions of, for example, Apollo mare sample 10084 (22) and Apollohighland sample 62231 (23), respectively. However, the reflectancespectra shown in the study by Taylor et al. (22, 23) do not extend intothe wavelength range of the H2O/OH absorption band.
Fig. 1. Typical M3 reflectance spectra illustrating the removal of the thermal emission component using the surface temperature taken from the PDS andobtained with our method, respectively. (A) Mare surface (12.64°E, 20.00°N; local time, 12:45). (B) Highland surface (167.90°E, 20.01°N; local time, 11:32).
2 of 10
SC I ENCE ADVANCES | R E S EARCH ART I C L E
on January 31, 2020http://advances.sciencem
ag.org/D
ownloaded from
A
B
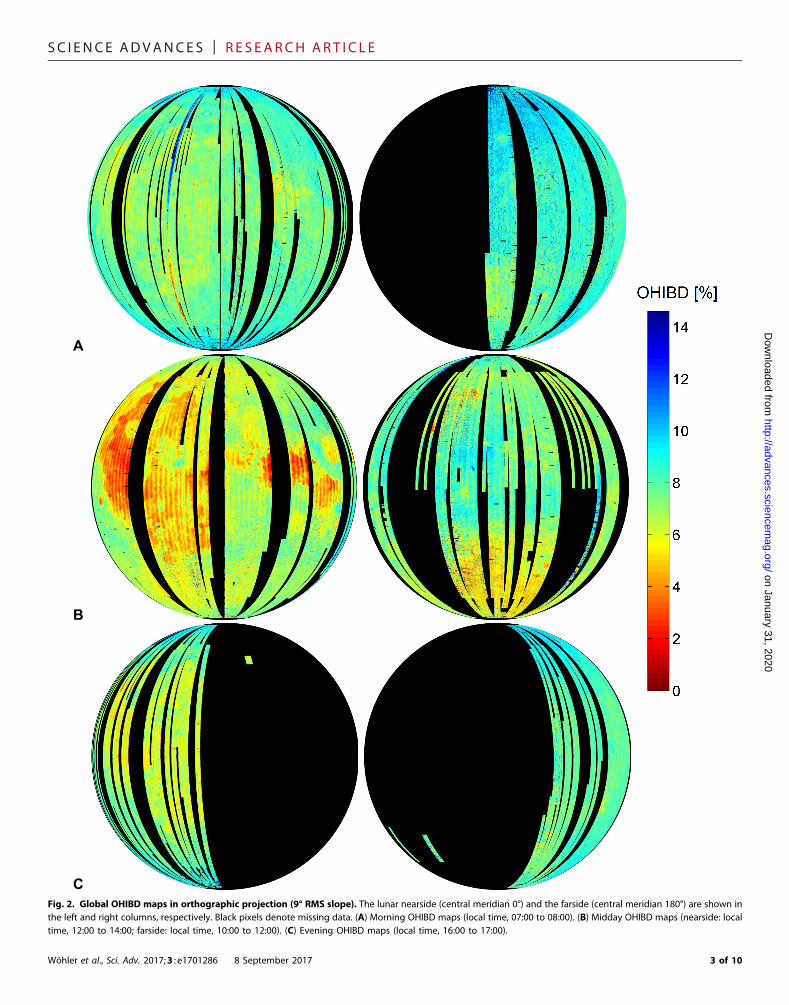
CFig. 2. Global OHIBD maps in orthographic projection (9° RMS slope). The lunar nearside (central meridian 0°) and the farside (central meridian 180°) are shown inthe left and right columns, respectively. Black pixels denote missing data. (A) Morning OHIBD maps (local time, 07:00 to 08:00). (B) Midday OHIBD maps (nearside: localtime, 12:00 to 14:00; farside: local time, 10:00 to 12:00). (C) Evening OHIBD maps (local time, 16:00 to 17:00).
Wöhler et al., Sci. Adv. 2017;3 : e1701286 8 September 2017 3 of 10

SC I ENCE ADVANCES | R E S EARCH ART I C L E
on January 31, 2020http://advances.sciencem
ag.org/D
ownloaded from
Time-of-day–dependent global and regional OHIBD mapsThe OHIBD maps for morning, midday, and evening illumination areshown in Fig. 2. Given the range of wavelengths used for OHIBD esti-mation (2697 to 2936 nm), the OHIBD values mainly characterize thebehavior of the OH absorption band at 2.82 mm, but H2O also has someinfluence on the OHIBD values because the 2.95-mmH2O band overlapswith that wavelength range as well.
In the lunar morning (07:00 to 08:00 in Fig. 2), the OHIBD in the il-luminated polar highlands is higher by 20 to 30% than in the equatorialhighlands. Near the equator, a clearly nonzero highlandOHIBD level canbe observed. TheOHIBD in the lunarmaria is lower by 10 to 15% than inthe equatorial highlands, where the lowest OHIBD values are found forthe high-Ti mare basalts, such as Mare Tranquillitatis and westernOceanus Procellarum [see, for example, the study by Lucey et al. (24) orBhatt et al. (25) for lunar Ti abundance maps]. In the lunar morning, thehighest OHIBD level in mare areas can be found in Mare Crisium, MareNectaris, and Mare Serenitatis. At lunar midday (12:00 to 14:00 on thenearside and 10:00 to 12:00 on the farside in Fig. 2), there is no obviouslatitude dependence of the OHIBD. The OHIBD level in the equatorialhighlands is about 10 to 15% lower than in themorning. In the lunarmaria,low OHIBD values can be observed, where the maximal level is found inMare Crisium,Mare Serenitatis, andMare Nectaris, and the lowest level isfound in the high-Ti basalts of Mare Tranquillitatis, northeastern MareFecunditatis, centralMare Imbrium, andwesternOceanusProcellarum.In the lunar evening (16:00 to17:00 inFig. 2), theOHIBDdifferencebetween
Wöhler et al., Sci. Adv. 2017;3 : e1701286 8 September 2017
the equatorial and thepolar highlands is similar to that in themorning.Thehighland OHIBD level is similar as that in the morning, whereas the mareOHIBD level is higher than that at midday, but about 20% lower than thatin themorning.The lowestOHIBDvalues aremainly found in the high-Timare basalts of Mare Imbrium and Oceanus Procellarum. The time-of-day–dependent OHIBD behavior for two selected regions, exhibiting aboundary between high- and low-Ti mare basalts and a boundary be-tween mare and highland areas, respectively, is shown in Fig. 3.
The relative OHIBD decrease in the illuminated polar highlandsbetween morning and midday corresponds to ~30%, whereas thelow-latitude highlands exhibit a nearly constant, nonzero OHIBD level.Relatively small time-of-day–dependent OHIBD variations of ~20% arefound in Mare Crisium, Mare Nectaris, Mare Serenitatis, and the SouthPole–Aitkenbasin. In the high-Ti basalts ofMareTranquillitatis and cen-tral Mare Imbrium, the time-of-day–dependent relative OHIBDvariations are much larger and correspond to ~50 to 70%. In the high-lands, the time-of-day–dependent OHIBD behavior is symmetric withrespect to midday, whereas it is slightly asymmetric in the lunar mariawith a difference of ~20% between the OHIBD level in the morning andevening, that is, 1 to 2 lunar hours after sunrise and before sunset, respec-tively. In regions at low latitudes illuminated obliquely in the morningand evening, surface parts inclined toward the sun, thus being warmerthan even surface parts, exhibit higher OHIBD values, whereas coldersurface parts inclined away from the sun have a lower OHIBD comparedto even surfaces (Fig. 3). A similar behavior is apparent in the evening.
Fig. 3. Regional OHIBD maps. (A) Boundary between high- and low-Ti mare basalts in western Oceanus Procellarum: Excerpt from LRO Camera (LROC) Wide-Angle Camera(WAC) mosaic (51), M3-based Ti wt % abundance map obtained with the method of Bhatt et al. (25), and OHIBD maps (morning, midday, and afternoon). (B) Boundarybetween mare and highland areas south of the crater Pythagoras: Excerpt from LROC WAC mosaic (51) and OHIBD maps (morning, midday, and afternoon). (C) Regionaround the craters Copernicus and Eratosthenes: Excerpt from LROC WAC mosaic (51) and OHIBD maps (morning, midday, and afternoon) (color coding as in Fig. 2).
4 of 10
SC I ENCE ADVANCES | R E S EARCH ART I C L E
However, this topography dependence of the OHIBD can only be clearlyobserved for steep slopes that occur particularly in the walls of not stronglydegraded craters, such as Copernicus and Eratosthenes (Fig. 3).
on January 31, 2020http://advances.sciencem
ag.org/D
ownloaded from
DISCUSSIONComparison with previous resultsThe presented observations of the time-of-day–dependent OHIBD are incontrast to the previous results of Pieters et al. (2), where the H2O/OH ab-sorption depth is found to be zero at latitudes below about 50° in bothmareand highland regions. Themost likely reason for this discrepancy is that theresults in the study byPieters et al. (2) were obtainedwith the thermal emis-sionremoval techniqueofClark (26),whichcanbeconsideredapredecessorof Clark et al. (14). In contrast to our thermal emission removal approach(5), the methods of Clark et al. (14) and Clark (26) are based on specificassumptions about the shape of the reflectance spectrum. Regarding theeffect of local topography near the equator under oblique illumination,a strong inverse correlation between solar irradiance and H2O/OHabsorption depth is found in the study by McCord et al. (3) withoutperforming a thermal emission removal. This result of McCord et al.(3) contradicts our observation of a (typically weak) positive correlationbetween solar irradiance andOHIBDat low latitudes in the lunarmorningand evening.
In principle, it may be possible that the observed time-of-day–dependent OHIBD variations can, in part, be attributed to the varyingtime-of-day–dependent surface temperatures. For example, spectro-scopic analyses of asteroids indicate that the width of the broad absorp-tion band of olivine around 1-mmwavelength increases significantly withincreasing temperature in the range of 83 to 448 K (27). A similar vari-ation of the absorption band width around 2-mmwavelength is demon-strated in the study by Hinrichs and Lucey (28) for orthopyroxene in thetemperature range of 100 to 400 K. Spectral analyses of ordinary and car-bonaceous chondritemeteorites, aswell as eucrite andhowardite samples,show a considerable temperature dependence of the depth and positionof the absorptionbandsnear 1 and2mmin the temperature range of 80 to400 K (28). However, the dependence of the spectrum of a lunar samplein the same temperature range is shown in the study by Hinrichs andLucey (28) to be very weak. Analysis of the temperature dependence ofthe depth,width, and integrated depthof several absorptionbands of hex-agonal H2O ice (however, not including the 3-mm absorption band)reveals strong temperature effects on all three band parameters in therange of 20 to 270 K (29). At the lunar equator, the surface temperature
Wöhler et al., Sci. Adv. 2017;3 : e1701286 8 September 2017
differences between theM3morning/afternoon andmidday observationsmay exceed 100 K. However, at high latitudes, the OHIBD variations arestronger than near the equator, whereas the surface temperature differ-ences are only a few tens of kelvin between morning and midday obser-vations [for example, about 20 K on even surface at 73°S (5)] and thusmuch smaller than the temperature ranges analyzed in the studybyLuceyet al. (27),Hinrichs andLucey (28), andGrundy and Schmitt (29).Hence,it is unlikely that the changing surface temperature has a major directeffect on the time-of-day–dependent OHIBD variations.
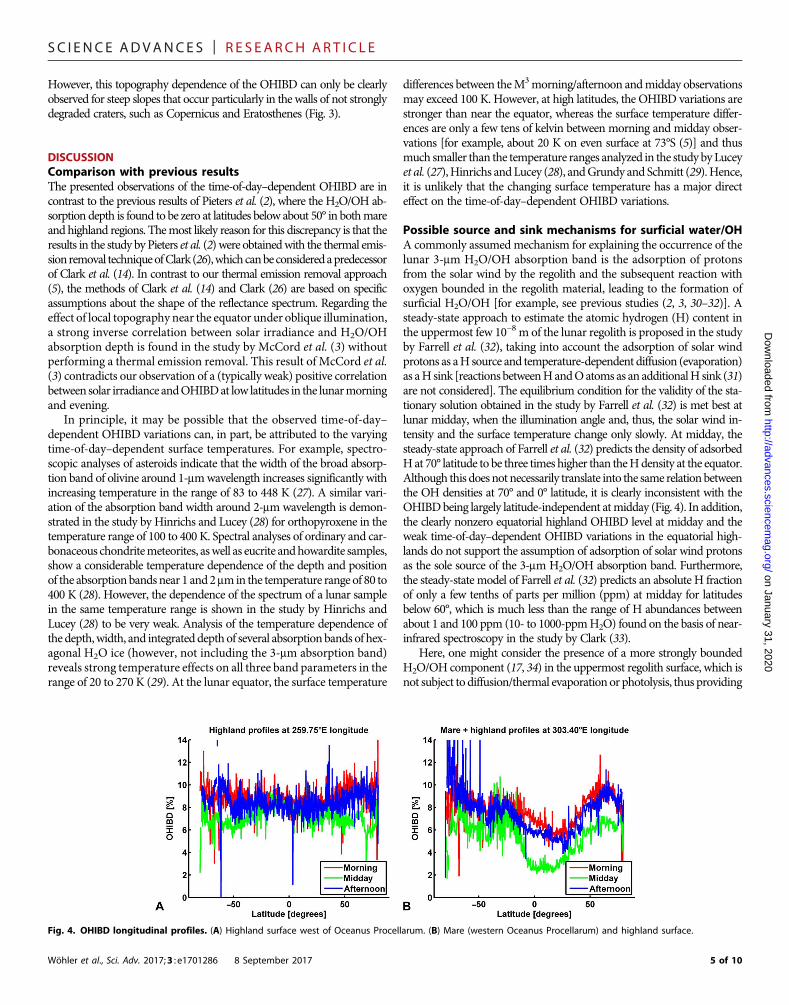
Possible source and sink mechanisms for surficial water/OHA commonly assumed mechanism for explaining the occurrence of thelunar 3-mm H2O/OH absorption band is the adsorption of protonsfrom the solar wind by the regolith and the subsequent reaction withoxygen bounded in the regolith material, leading to the formation ofsurficial H2O/OH [for example, see previous studies (2, 3, 30–32)]. Asteady-state approach to estimate the atomic hydrogen (H) content inthe uppermost few 10−8 m of the lunar regolith is proposed in the studyby Farrell et al. (32), taking into account the adsorption of solar windprotons as aH source and temperature-dependent diffusion (evaporation)as aH sink [reactions betweenHandOatoms as an additionalH sink (31)are not considered]. The equilibrium condition for the validity of the sta-tionary solution obtained in the study by Farrell et al. (32) is met best atlunar midday, when the illumination angle and, thus, the solar wind in-tensity and the surface temperature change only slowly. At midday, thesteady-state approach of Farrell et al. (32) predicts the density of adsorbedHat 70° latitude to be three times higher than theHdensity at the equator.Although this does not necessarily translate into the same relationbetweenthe OH densities at 70° and 0° latitude, it is clearly inconsistent with theOHIBDbeing largely latitude-independent atmidday (Fig. 4). In addition,the clearly nonzero equatorial highland OHIBD level at midday and theweak time-of-day–dependent OHIBD variations in the equatorial high-lands do not support the assumption of adsorption of solar wind protonsas the sole source of the 3-mm H2O/OH absorption band. Furthermore,the steady-state model of Farrell et al. (32) predicts an absolute H fractionof only a few tenths of parts per million (ppm) at midday for latitudesbelow 60°, which is much less than the range of H abundances betweenabout 1 and 100 ppm (10- to 1000-ppmH2O) found on the basis of near-infrared spectroscopy in the study by Clark (33).
Here, one might consider the presence of a more strongly boundedH2O/OH component (17, 34) in the uppermost regolith surface, which isnot subject to diffusion/thermal evaporationor photolysis, thus providing
Fig. 4. OHIBD longitudinal profiles. (A) Highland surface west of Oceanus Procellarum. (B) Mare (western Oceanus Procellarum) and highland surface.
5 of 10

SC I ENCE ADVANCES | R E S EARCH ART I C L E
on January 31, 2020http://advances.sciencem
ag.org/D
ownloaded from
a “background signal,” which is stronger for highland than for maresurfaces. The observed OHIBD behavior could then be explained bythe additive effect of the constant strongly bounded component plus atime-of-day–dependent variable component governed by the competingprocesses of H adsorption from the solar wind (3, 30–32), diffusion/thermal evaporation of H, OH, and H2O (5, 30–32), photolysis of OHand H2O (5, 31, 35), and reactions between H and O atoms (31). Therelative importance of thesemechanisms depends on a variety of factorssuch as solar illumination conditions, surface reflectance, surface tem-perature, and kinetic properties of the involved chemical reactions. Forexample, the generally lower OHIBD level in the lunarmaria comparedto the highlands might be explained by higher surface temperatures inthe lunar maria due to their lower albedo, leading to a stronger OHdiffusion. Similarly, the observation of increased OHIBD values onmore steeply illuminated warmer slopes of not strongly degradedimpact craters may be explained such that for these surfaces shortlyafter sunrise and before sunset, the adsorption ofH supersedes the lossof H2O/OH caused by diffusion/thermal evaporation and photolysis.
Onemight expect systematicOHIBDdifferences between the nearsideand farside at midday due to the influence of Earth’s magnetotail plasma,because theMoon is located insideEarth’smagnetotail for a period of timeof about 1 week around fullMoon (9). The interactions between themag-netotail plasma and the lunar surface are of highly complex nature (36).Figure 2B indicates that the midday OHIBD in the nearside southernhighlands around 0° longitude is lower by ~10 to 20% than the middayOHIBD in the northern farside highlands around 180° longitude(outside the South Pole–Aitken basin). However, this observationshould not be overinterpreted because the nearside highlands are morestrongly contaminated by material from nearby mare regions thanfarside highlands and have a slightlymoremafic composition (37), whichmay result in a reduced OHIBD level. Further differences betweensouthern nearside and northern farside highlands may be due to thepresence of the ray system of the prominent crater Tycho in the south-ern nearside highlands around the 0° meridian. These compositionaleffects might also be an explanation for the observed difference in theOHIBD level. Besides, the study Starukhina and Shkuratov (9) statesthat the proton flux at the lunar surface is similar during expositionto the solar wind and when the Moon is located inside Earth’s mag-netotail, which would rather predict an absence of systematicnearside versus farside OHIBD differences at lunar midday.
All in all, our results suggest that the observed near-infrared spectralsignature of lunar surficial H2O/OH can be explained by a combinedmechanism involving the presence of endogenous H2O/OH stronglybounded by the lunar regolith, as well as processes and reactions inducedby the adsorption of protons from the solar wind by the regolithmaterial.
MATERIALS AND METHODSSurface temperature estimationOur M3 data processing framework relies on the level 1B spectral radi-ance image data published on the PDS (13), which we resampled to aresolution of 20 pixels per degree (about 1.5 km at the lunar equator).The measured spectral radiance is a superposition of a reflectedcomponent and a thermal emission component, where the latter hasto be subtracted from the radiance spectrumbefore any further analysis.This step requires the accurate estimation of the surface temperatureand the spectral emissivity. The approach used in this work closelyfollows the method of Shkuratov et al. (18), where according to the as-sumption of thermal equilibriumand a smooth surface, the local surface
Wöhler et al., Sci. Adv. 2017;3 : e1701286 8 September 2017
temperature T is given by
T ¼ T0
ffiffiffiffiffiffiffiffiffiffiffiffiffiffiffiffiffiffiffiffiffiffiffiffiffiffiffiffiffið1� AdhÞ cos i4
pð1Þ
where i is the solar incidence angle, Adh is the spectrally integrated di-rectional hemispherical albedo, and T0 is the temperature of a perfectlyabsorbing surfaceperpendicularly illuminatedby the sun. For 1–astronomicalunit solar distance, it isT0 = 394K (18). The value ofAdh depends on thewell-known solar spectral irradiance and the directional-hemisphericalspectral reflectance of the surface, which can be inferred from the bi-directional spectral reflectance, as shown in the study by Shkuratov et al.(18), where in this work, theHapkemodel (19, 20) was used for reflectancemodeling, that is, the single-scattering albedo of the Hapke model wasadapted to themeasured bidirectionalM3 reflectances. The wavelength in-tegral was then separated into three ranges. In the range of 461 to 2936 nm,we used the M3-derived reflectance model to evaluate the directional-hemispherical reflectance as defined by Hapke (20, 38). Because the re-flectance shows a monotonously increasing behavior, a second-orderpolynomial is adapted to the M3-derived reflectance. In the range of250 to 461 nm, the measured M3 spectral reflectance was extrapolatedusing this polynomial. The spectral reflectance is well known to drop tolowvalues at longerwavelengths.We thus used a constant approximationof 0.016 for the directional-hemispherical reflectance in the range of 3000to 17,000 nm. Beyond 17,000 nm, the solar spectral irradiance has beenneglected. Eventually, Adh was computed using a numerical integrationfor each of the three wavelength ranges, respectively.
According to Shkuratov et al. (18), the wavelength-dependent spec-tral emissivity is
eðlÞ ¼ 1� rhdðlÞ ð2Þ
which follows Kirchhoff’s law and has been confirmed experimentally,for example, by Arpin et al. (39). In Eq. 2, rhd(l) is the hemispherical-directional reflectance at wavelength l, as defined by Shkuratov et al.(18) and Hapke (38). The thermal emission component resulting froma black body of the surface temperature T was multiplied by the M3-derived spectral emissivity e(l) and subtracted from the spectral radi-ance. The solar irradiance is weak in the range of 3000 to 17,000 nm,and thus, a variation of the assumed constant spectral reflectance valuebeyond 3000 nm by 0.1 has a negligible effect on Adh and thus onlyresults in a change in surface temperature of the order 10− 1 K.
A division of the thermally corrected radiance spectrum by the solarirradiance spectrum yields the bidirectional reflectance spectrum. Be-cause the reflectance depends on the surface temperature T, an initialvalue of T was computed by adapting a superposition of a standard re-flectance spectrum and a black body emission spectrum of temperatureT to the M3 data (40). On the basis of this initial value, the reflectancewas derived, and a surface temperature was computed according toEq. (1), which, in turn, allows for computing refined values of rhd(l),e(l),Adh, and T. Thus, T and e(l) were estimated simultaneously. Thisprocedure is iterated until the average temperature change per iterationcycle falls below0.001K.Hence, our approach ensures that, for all wave-lengths within theM3 spectral range, exactly the spectral emissivity thatfollows from the measured reflectance spectrum was used for thermalemission removal in a self-consistent manner.
In particular, when the illumination of the surface is oblique, an ad-ditional factor that has a strong effect on the surface temperature is theroughness of the surface (7). Because of the low thermal conductivity of
6 of 10

SC I ENCE ADVANCES | R E S EARCH ART I C L E
on January 31, 2020http://advances.sciencem
ag.org/D
ownloaded from
the lunar regolith, surface facets inclined away from the sun may bemuch colder than nearby surface facets inclined toward the sun, suchthat the surface area covered by an image pixel cannot be described byone single temperature value but rather by a superposition of blackbodies with different temperatures (7, 16). In the study by Davidssonet al. (16), random surfaces are constructed on the basis of four basicshapes: concave spherical segments, parallel sinusoidal trenches, ran-dom Gaussians, and fractals. The first two approaches do not involverandom shapes, and the parameters of the basic shapes are chosen suchthat the desired root mean square (RMS) slope is obtained. For the ran-domGaussianmethod ofDavidsson et al. (16), an increasing number oftwo-dimensional Gaussians with randomly chosen heights, widths, andpositions are superposed until the desired RMS slope is obtained. In thefractals method of Davidsson et al. (16), the height-scale parameter ofan algorithm that generates fractal surfaces is adjusted until the desiredRMS slope is obtained. In contrast, we used the Fourier transform–basedmethod ofMuinonen and Saarinen (41) and Lagerros (42), whichgenerates a random surface with a Gaussian autocorrelation and aGaussian distribution of the normal directions of the surface facets,given the user-defined RMS slope. A summary of this method can befound in the appendix of Wöhler et al. (5). The approach of Davidssonet al. (16) which is most similar to the method of Muinonen andSaarinen (41) and Lagerros (42), is the fractals technique because bothyield surfaces with facets having a Gaussian distribution of surfacenormal orientations. An RMS slope of 9° is found in the study byWöhleret al. (5) based on a comparison of the spatial scale of thermal equi-librium in the lunar regolith with the three-dimensional regolith mapsof Helfenstein and Shepard (43) constructed using in situ close-rangestereo photograph.
For computing rhd(l), e(l), and Adh, the spectral behavior of lunarsurface materials was modeled using reflectance spectra from the cata-log of the Lunar Soil CharacterizationConsortium (22, 23). The thermalequilibrium–based surface temperature estimation approach was thenapplied to each surface facet, and the thermal emission spectrum of therough surface was determined by summing up the individual emittedradiance spectra of all facets.
Although this summed emission spectrum is composed of the emis-sion spectra ofmany black bodies of different temperatures, for the tem-perature range encountered on the lunar surface and wavelengths lessthan 3000 nm (roughly the upper limit of the M3 wavelength range), aclose approximation across the wavelength range shortward of 3 mmbythe emission spectrum of a single black body with an effective tempera-ture Teff is possible, as shown in Fig. 5. The differences between Teff and
Wöhler et al., Sci. Adv. 2017;3 : e1701286 8 September 2017
the temperature T of a smooth surface with the same spectral behaviorilluminated at the same incidence angle were stored as a correctionfunction depending on the average surface albedo and the incidence an-gle (5). The final correction of theM3 level 1B radiance data for thermalemission was then performed on the basis of the obtained pixel-wisespectral emissivity e(l) and effective temperature Teff.
The RMS slope has been derived in the study by Bandfield et al. (7)by comparison betweenmodeled temperatures and data of the LRODi-viner instrument, relying on four equatorial locations situated at lati-tudes less than 6°. For equatorial morning and afternoon local timesshortly after 06:00 and shortly before 18:00, an RMS slope of 5° to10° has been obtained in the study by Bandfield et al. (7), whereasaround midday (09:00 to 15:00), the estimated RMS slope is largerand corresponds to 20° (7). Because the RMS slope is a purely geometricquantity, this dependence of RMS slope on incidence angle is un-expected. However, at the small incidence angles at lunar midday, theroughness-related brightness temperature differences modeled in thestudy by Bandfield et al. (7) are nearly independent of the RMS slope,at least the analysis in the study by Bandfield et al. (7) shows that this isthe case around 10:00 to 14:00 local time, where the results of the 10°RMS slopemodel fit similarly well with the observations as the results ofthe 20° RMS slope model, given the measurement scatter. Hence, at il-lumination angles under which the assumed value of the RMS slope hasa significant effect on the surface temperature and thus on theH2O/OHabsorption band depth, that is, at high latitudes and in the equatorialmorning and afternoon, the RMS slope inferred by Bandfield et al.(7) is largely consistent with our assumed value of 9°. Only at those il-lumination angles where the influence of the RMS slope is weak, ourassumed RMS slope is smaller than the value derived in the study byBandfield et al. (7).
To illustrate the effect of different RMS slope angles on our globalOHIBD maps, we have included additional global OHIBD maps forRMS slopes of 0° and 20° in the Supplementary Materials. For high inci-dence angles, the effective surface temperature Teff exceeds the tempera-ture T of an identically illuminated smooth surface, and the difference(Teff − T) increases with increasing RMS slope (5). The strength of theH2O/OH absorption band then increases with increasing RMS slope.In this case, all facets of a smooth surface are illuminated at an identicallyhigh incidence angle. For a rough surface, the distribution of facet nor-mals causes half of the facets to be illuminatedmore steeply than a roughsurface (thus to become warmer than a smooth surface) and the otherhalf to be illuminated more obliquely (thus to become less warm thana smooth surface). Because of the strong increase in the thermal emission
Fig. 5. Comparison between the thermal emission spectrum of a surface with RMS slope of 9° (solid line) and the thermal emission of a single black bodywith the best-fitting effective temperature Teff (dashed line). (A) Incidence angle 60°. (B) Incidence angle 75°. The emissivity was computed on the basis of thereflectance spectrum of lunar highland sample 62231 (23).
7 of 10
SC I ENCE ADVANCES | R E S EARCH ART I C L E
on January 31, 2020http://advances.sciencem
ag.org/D
ownloaded from
with the fourth power of the surface temperature, the effect of the moresteeply illuminated facets supersedes that of the more obliquely illumi-nated facets, leading to Teff >T and increasingH2O/OH absorption banddepth with increasing RMS slope. In contrast, for low incidence angles,Teff is slightly lower than T (5), such that at low latitudes at midday, theH2O/OHabsorption band depth decreaseswith increasingRMS slope. Inthis case, for a smooth surface, all facet normals have the same small in-cidence angle. In contrast, for a rough surface, the distribution of facetnormals causes some facets to be illuminated steeply, thus having tem-peratures similar to T, whereas many facets are illuminated at higher in-cidence angles, thus having temperatures below T, leading to Teff < T.
All in all, the maps in figs. S1 and S2 show that the global propertiesof the OHIBD, especially its latitude dependence at different times ofday, remain the same, independent of the actually assumed RMS slope.Thus, the results described in this paper do not critically depend on theassumed specific value of the RMS slope angle.
Photometric correctionBecause the spectral reflectance depends on the pixel-specific incidenceand emission angles, it is necessary to correct the reflectance spectraphotometrically, that is, to normalize them to a uniform illuminationand observation geometry to allow for a direct comparison betweenspectra. To determine the local, topography-dependent incidence andemission angles, we used the GLD100 lunar topographic map (21). TheGLD100 is well suitable for this purpose because it is mentioned in thestudy by Scholten et al. (21) that the smallest structures reliably recover-able in it have a size of about 1.5 km, corresponding to the resolution ofthe resampled M3 spectral radiance data. The pixel-specific incidenceand emission angles were then determined on the basis of the solar il-lumination vector and the spacecraft observation vector published onthe PDS for eachM3 image pixel and the surface normal vector inferredfrom the GLD100. On the basis of the spectral reflectance and the inci-dence and emission angle, the spectrum of the single scattering albedowas computed based on the Hapke model (19, 20). The model param-eters besides the single-scattering albedo, that is, the two parameters ofthe double Henyey-Greenstein single-particle scattering function (20),the strength and width of the opposition effect [(20); see also the studyby Shkuratov et al. (44)], and the photometric roughness parameter(19), are adopted from the first lunar solution by Warell (45). Theuniform illumination and observation geometry of 30° incidence angleand 0° emission angle (46) was then inserted into the Hapke model tocompute the normalized reflectance spectrum, which has been used forall analyses of this work. There exists a so-called “ground truth correc-
Wöhler et al., Sci. Adv. 2017;3 : e1701286 8 September 2017
tion” (47, 48), which we have not applied to the level 1B spectral radi-ance data. It corrects for the effects of different detector temperatures.The correction consists of a wavelength-dependent correction factorthat was designed to recover the shape of the 1-mm absorption bandof mature lunar soils. This correction factor was derived from an anal-ysis of the continuum-removed M3 spectra and a reference laboratoryspectrum (47). However, the ground truth correction has been designedto not interfere with the spectral reflectance in the range of 2500 to3000 nm (47). It is thus not relevant for this study and is not discussedfurther. For more detailed information about the M3 data processingframework, see previous studies (5, 40, 49, 50).
ThemiddayOHIBDmaps in Figs. 2 and 3 show strip-like artifacts inthe north-south direction. They are not due to OHIBD variations fromoneM3 image to the other but result fromOHIBD gradients within in-dividual M3 images in cross-track direction. Our photometric correc-tion is based on the full Hapke model (19, 20) without simplification.Of course, the Hapke model parameters might exhibit local deviationsfrom the assumed global values ofWarell (45), but the strip-like artifactsoccur at midday at all latitudes and for both lunar maria and highlands.We, thus, assume that the artifacts may likely be caused by detector-specific effects such as detector temperature–dependent inaccuracies ofthe M3 flat-field correction.
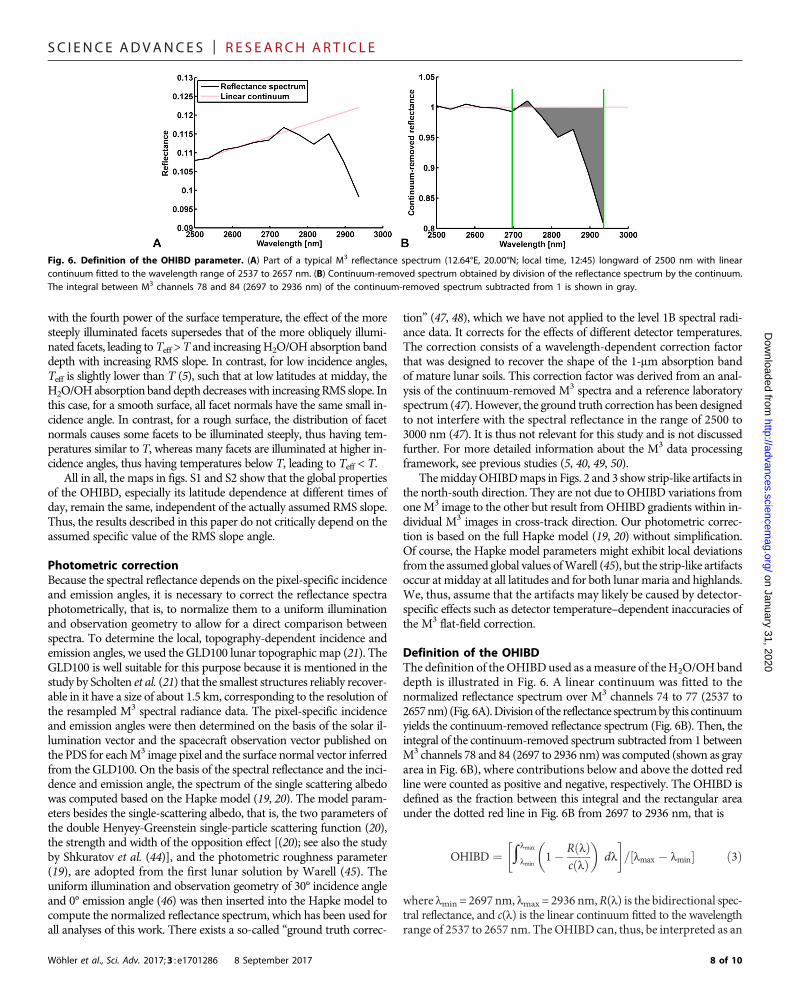
Definition of the OHIBDThe definition of the OHIBD used as ameasure of theH2O/OH banddepth is illustrated in Fig. 6. A linear continuum was fitted to thenormalized reflectance spectrum over M3 channels 74 to 77 (2537 to2657nm) (Fig. 6A).Divisionof the reflectance spectrumby this continuumyields the continuum-removed reflectance spectrum (Fig. 6B). Then, theintegral of the continuum-removed spectrum subtracted from 1 betweenM3 channels 78 and 84 (2697 to 2936 nm)was computed (shown as grayarea in Fig. 6B), where contributions below and above the dotted redline were counted as positive and negative, respectively. The OHIBD isdefined as the fraction between this integral and the rectangular areaunder the dotted red line in Fig. 6B from 2697 to 2936 nm, that is
OHIBD ¼ ∫lmax
lmin1� RðlÞ
cðlÞ� �
dl
� �=½lmax � lmin� ð3Þ
where lmin = 2697 nm, lmax = 2936 nm,R(l) is the bidirectional spec-tral reflectance, and c(l) is the linear continuum fitted to the wavelengthrange of 2537 to 2657 nm. TheOHIBD can, thus, be interpreted as an
Fig. 6. Definition of the OHIBD parameter. (A) Part of a typical M3 reflectance spectrum (12.64°E, 20.00°N; local time, 12:45) longward of 2500 nm with linearcontinuum fitted to the wavelength range of 2537 to 2657 nm. (B) Continuum-removed spectrum obtained by division of the reflectance spectrum by the continuum.The integral between M3 channels 78 and 84 (2697 to 2936 nm) of the continuum-removed spectrum subtracted from 1 is shown in gray.
8 of 10
SC I ENCE ADVANCES | R E S EARCH ART I C L E
average relative absorption strength across the wavelength interval of2697 to 2936 nm.
SUPPLEMENTARY MATERIALSSupplementary material for this article is available at http://advances.sciencemag.org/cgi/content/full/3/9/e1701286/DC1fig. S1. Global OHIBD maps in orthographic projection (0° RMS slope).fig. S2. Global OHIBD maps in orthographic projection (20° RMS slope).
on January 31, 2020http://advances.sciencem
ag.org/D
ownloaded from
REFERENCES AND NOTES1. C. M. Pieters, J. Boardman, B. Buratti, A. Chatterjee, R. Clark, T. Glavich, R. Green, J. Head,
P. Isaacson, E. Malaret, T. McCord, J. Mustard, N. Petro, C. Runyon, M. Staid, J. Sunshine,L. Taylor, S. Tompkins, P. Varanasi, M. White, The Moon mineralogy mapper (M3) onChandrayaan-1. Curr. Sci. 96, 500–505 (2009).
2. C. M. Pieters, J. N. Goswami, R. N. Clark, M. Annadurai, J. Boardman, B. Buratti, J.-P. Combe,M. D. Dyar, R. Green, J. W. Head, C. Hibbitts, M. Hicks, P. Isaacson, R. Klima, G. Kramer,S. Kumar, E. Livo, S. Lundeen, E. Malaret, T. McCord, J. Mustard, J. Nettles, N. Petro,C. Runyon, M. Staid, J. Sunshine, L. A. Taylor, S. Tompkins, P. Varanasi, Character andspatial distribution of OH/H2O on the surface of the Moon seen by M3 on Chandrayaan-1.Science 326, 568–572 (2009).
3. T. B. McCord, L. A. Taylor, J.-P. Combe, G. Kramer, C. M. Pieters, J. M. Sunshine, R. N. Clark,Sources and physical processes responsible for OH/H2O in the lunar soil as revealed bythe Moon Mineralogy Mapper (M3). J. Geophys. Res. 116, E00G05 (2011).
4. J. M. Sunshine, T. L. Farnham, L. M. Feaga, O. Groussin, F. Merlin, R. E. Milliken,M. F. A’Hearn, Temporal and spatial variability of lunar hydration as observed by theDeep Impact spacecraft. Science 326, 565–568 (2009).
5. C. Wöhler, A. Grumpe, A. A. Berezhnoy, E. A. Feoktistova, N. A. Evdokimova, K. Kapoor,V. V. Shevchenko, Temperature regime and water/hydroxyl behavior in the craterBoguslawsky on the Moon. Icarus 285, 118–136 (2017).
6. J. L. Bandfield, M. J. Poston, R. L. Klima, C. S. Edwards, A prominent and ubiquitous OH/H2Ofeature in corrected lunar spectra. Proc. Lunar Planet. Sci. XLVIII, abstract no. 2083 (2017).
7. J. L. Bandfield, P. O. Hayne, J.-P. Williams, B. T. Greenhagen, D. A. Paige, Lunar surfaceroughness derived from LRO Diviner Radiometer observations. Icarus 248, 357–372 (2015).
8. W. C. Feldman, S. Maurice, A. B. Binder, B. L. Barraclough, R. C. Elphic, D. J. Lawrence,Fluxes of fast and epithermal neutrons from Lunar Prospector: Evidence for water ice atthe lunar poles. Science 281, 1496–1500 (1998).
9. L. V. Starukhina, Y. G. Shkuratov, The Lunar Poles: Water ice or chemically trappedhydrogen? Icarus 147, 585–587 (2000).
10. A. B. Sanin, I. G. Mitrofanov, M. L. Litvak, B. N. Bakhtin, J. G. Bodnarik, W. V. Boynton,G. Chin, L. G. Evans, K. Harshman, F. Fedosov, D. V. Golovin, A. S. Kozyrev, T. A. Livengood,A. V. Malakhov, T. P. McClanahan, M. I. Mokrousov, R. D. Starr, R. Z. Sagdeev,V. I. Tret’yakov, A. A. Vostrukhin, Hydrogen distribution in the lunar polar regions. Icarus283, 20–30 (2017).
11. T. P. McClanahan, I. G. Mitrofanov, W. V. Boynton, G. Chin, J. Bodnarik, G. Droege,L. G. Evans, D. Golovin, D. Hamara, K. Harshman, M. Litvak, T. A. Livengood, A. Malakhov,E. Mazarico, G. Milikh, G. Nandikotkur, A. Parsons, R. Sagdeev, A. Sanin, R. D. Starr, J. J. Su,J. Murray, Evidence for the sequestration of hydrogen-bearing volatiles towards theMoon’s southern pole-facing slopes. Icarus 255, 88–99 (2015).
12. T. A. Livengood, G. Chin, R. Z. Sagdeev, I. G. Mitrofanov, W. V. Boynton, L. G. Evans,M. L. Litvak, T. P. McClanahan, A. B. Sanin, R. D. Starr, J. J. Su, Moonshine: Diurnally varyinghydration through natural distillation on the Moon, detected by the Lunar ExplorationNeutron Detector (LEND). Icarus 255, 100–115 (2015).
13. Planetary Data System (PDS) (2017); http://pds-imaging.jpl.nasa.gov/volumes/m3.html.14. R. N. Clark, C. M. Pieters, R. O. Green, J. W. Boardman, N. E. Petro, Thermal removal
from near-infrared imaging spectroscopy data of the Moon. J. Geophys. Res. 116, E00G16(2011).
15. P. Isaacson, S. Besse, N. Petro, J. Nettles; M3 Team, “M3 overview and working withM3 data” (Technical Report, 2011); http://pds-imaging.jpl.nasa.gov/documentation/Isaacson_M3_Workshop_Final.pdf.
16. B. J. R. Davidsson, H. Rickman, J. L. Bandfield, O. Groussin, P. J. Gutiérrez, M. Wilska,M. T. Capria, J. P. Emery, J. Helbert, L. Jorda, A. Maturilli, T. G. Mueller, Interpretation ofthermal emission. I. The effect of roughness for spatially resolved atmosphereless bodies.Icarus 252, 1–21 (2015).
17. J. L. Bandfield, C. S. Edwards, M. J. Poston, R. L. Klima, Lunar H2O/OH- distributions:Revised infrared spectra from improved thermal corrections. Proc. Lunar Planet. Sci.XXXXVII, abstract no. 1594 (2016).
18. Y. Shkuratov, V. Kaydash, V. Korokhin, Y. Velikodsky, N. Opanasenko, G. Videen, Opticalmeasurements of the Moon as a tool to study its surface. Planet. Space Sci. 59, 1326–1371 (2011).
Wöhler et al., Sci. Adv. 2017;3 : e1701286 8 September 2017
19. B. Hapke, Bidirectional reflectance spectroscopy: 3. Correction for macroscopic roughness.Icarus 59, 41–59 (1984).
20. B. Hapke, Bidirectional reflectance spectroscopy: 5. The coherent backscatter oppositioneffect and anisotropic scattering. Icarus 157, 523–534 (2002).
21. F. Scholten, J. Oberst, K.-D. Matz, T. Roatsch, M. Wählisch, E. J. Speyerer, M. S. Robinson,GLD100: The near-global lunar 100 m raster DTM from LROC WAC stereo image data.J. Geophys. Res. 117, E00H17 (2012).
22. L. A. Taylor, C. M. Pieters, L. P. Keller, R. V. Morris, D. S. McKay, Lunar Mare Soils: Spaceweathering and the major effects of surface-correlated nanophase Fe. J. Geophys. Res.106, 27985–27999 (2001).
23. L. A. Taylor, C. Pieters, A. Patchen, D.-H. S. Taylor, R. V. Morris, L. P. Keller, D. S. McKay,Mineralogical and chemical characterization of lunar highland soils: Insights into thespace weathering of soils on airless bodies. J. Geophys. Res. 115, E02002 (2010).
24. P. G. Lucey, D. T. Blewett, B. L. Jolliff, Lunar iron and titanium abundance algorithms based on finalprocessing of Clementine ultraviolet-visible images. J. Geophys. Res. 105, 20297–20305 (2000).
25. M. Bhatt, U. Mall, C. Wöhler, A. Grumpe, R. Bugiolacchi, A comparative study of ironabundance estimation methods: Application to the western nearside of the Moon. Icarus248, 72–88 (2015).
26. R. N. Clark, Planetary reflectance measurements in the region of planetary thermal emission.Icarus 40, 94–103 (1979).
27. P. G. Lucey, K. Keil, R. Whitely, The influence of temperature on the spectra of theA-asteroids and implications for their silicate chemistry. J. Geophys. Res. 103, 5865–5871(1998).
28. J. L. Hinrichs, P. G. Lucey, Temperature-dependent near-infrared spectral properties ofminerals, meteorites, and lunar soil. Icarus 155, 169–180 (2002).
29. W. M. Grundy, B. Schmitt, The temperature-dependent near-infrared absorption spectrumof hexagonal H2O ice. J. Geophys. Res. 103, 25809–25822 (1998).
30. L. Starukhina, Water detection on atmosphereless celestial bodies: Alternative explanationsof the observations. J. Geophys. Res. 106, 14701–14710 (2001).
31. W. M. Farrell, D. M. Hurley, M. I. Zimmerman, Solar wind implantation into lunar regolith:Hydrogen retention in a surface with defects. Icarus 255, 116–126 (2015).
32. W. M. Farrell, D. M. Hurley, V. J. Esposito, J. L. McLain, M. I. Zimmerman, The statisticalmechanics of solar wind hydroxylation at the Moon, within lunar magnetic anomalies,and at Phobos. J. Geophys. Res. 122, 269–289 (2017).
33. R. N. Clark, Detection of adsorbed water and hydroxyl on the Moon. Science 326, 562–564(2009).
34. A. E. Saal, E. H. Hauri, M. L. Cascio, J. A. Van Orman, M. C. Rutherford, R. F. Cooper, Volatilecontent of lunar volcanic glasses and the presence of water in the Moon’s interior.Nature 454, 192–195 (2008).
35. E. H. Mitchell, U. Raut, D. Fulvio, M. J. Schaible, C. A. Dukes, R. A. Baragiola, Ultravioletphotodesorption as a driver of water migration on the lunar surface. Planet. Space Sci. 89,42–46 (2013).
36. A. Bhardwaj, M. B. Dhanya, A. Alok, S. Barabash, M. Wieser, Y. Futaana, P. Wurz, A. Vorburger,M. Holmström, C. Lue, Y. Harada, K. Asamura, A new view on the solar wind interaction withthe Moon. Geosci. Lett. 2, 10 (2015)
37. P. G. Lucey, Mineral maps of the Moon. Geophys. Res. Lett. 31, L08701 (2004).38. B. Hapke, Theory of Reflectance and Emittance Spectroscopy (Cambridge Univ. Press,
2012).39. K. A. Arpin, M. D. Losego, A. N. Cloud, H. Ning, J. Mallek, N. P. Sergeant, L. Zhu, Z. Yu,
B. Kalanyan, G. N. Parsons, G. S. Girolami, J. R. Abelson, S. Fan, P. V. Braun, Three-dimensionalself-assembled photonic crystals with high temperature stability for thermal emissionmodification. Nat. Commun. 4, 2630 (2013).
40. C. Wöhler, A. Grumpe, A. Berezhnoy, M. U. Bhatt, U. Mall, Integrated topographic,photometric and spectral analysis of the lunar surface: Application to impact melt flowsand ponds. Icarus 235, 86–122 (2014).
41. K. Muinonen, K. Saarinen, Ray optics approximation for Gaussian random cylinders.J. Quant. Spectrosc. Radiat. Transfer 64, 201–218 (2000).
42. J. S. V. Lagerros, Thermal physics of asteroids. IV. Thermal infrared beaming.Astron. Astrophys. 332, 1123–1132 (1998).
43. P. Helfenstein, M. K. Shepard, Submillimeter-scale topography of the lunar regolith.Icarus 141, 107–131 (1999).
44. Y. G. Shkuratov, M. A. Kreslavsky, A. A. Ovcharenko, D. G. Stankevich, E. S. Zubko, C. Pieters,G. Arnold, Opposition effect from Clementine data and mechanisms of backscatter.Icarus 141, 132–155 (1999).
45. J. Warell, Properties of the Hermean regolith: IV. Photometric parameters of Mercury andthe Moon contrasted with Hapke modelling. Icarus 167, 271–286 (2004).
46. C. M. Pieters, The Moon as a spectral calibration standard enabled by lunar samples: TheClementine example. New Views Moon II, abstract no. 8025 (1999).
47. P. J. Isaacson, N. E. Petro, C. M. Pieters, S. Besse, J. W. Boardman, R. N. Clark, R. O. Green,S. Lundeen, E. Malaret, S. McLaughlin, J. M. Sunshine, L. A. Taylor, Development,importance, and effect of a ground truth correction for the Moon Mineralogy Mapperreflectance data set. J. Geophys. Res. 118, 369–381 (2013).
9 of 10
SC I ENCE ADVANCES | R E S EARCH ART I C L E
48. S. Lundeen, S. McLaughlin, R. Alanis, Moon Mineralogy Mapper Data Product SoftwareInterface Specification, PDS document version 9.10, JPL D-39032 (Jet PropulsionLaboratory, 2011).
49. A. Grumpe, F. Belkhir, C. Wöhler, Construction of lunar DEMs based on reflectancemodelling. Adv. Space Res. 53, 1735–1767 (2014).
50. A. Grumpe, C. Wöhler, Recovery of elevation from estimated gradient fields constrainedby digital elevation maps of lower lateral resolution. ISPRS J. Photogramm. Remote Sens.94, 37–54 (2014).
51. E. J. Speyerer, M. S. Robinson, B. W. Denevi; LROC Science Team, Lunar ReconnaissanceOrbiter Camera global morphological map of the Moon. Proc. Lunar Planet. Sci. XXXXII,abstract no. 2387 (2011).
AcknowledgmentsFunding: A.A.B. and V.V.S. were supported by the Russian Foundation for Basic Research–Deutsche Forschungsgemeinschaft (RFBR-DFG) grant no. 15-52-12369. C.W. and A.G. weresupported by RFBR-DFG grant no. WO 1800/7-1. Author contributions: C.W. wrote the majorpart of the text and prepared the figures. A.G. contributed to the text and generated datafor the figures. A.A.B. contributed to the text, analysis of the global OHIBD maps, and
Wöhler et al., Sci. Adv. 2017;3 : e1701286 8 September 2017
discussion of the source and sink mechanisms. V.V.S. contributed to the discussion of theglobal OHIBD maps and the source and sink mechanisms. Competing interests: Theauthors declare that they have no competing interests. Data and materials availability:The global OHIBD maps shown in this paper can be downloaded from the institutionalwebsite of the Image Analysis Group at the Technical University of Dortmund University(www.bv.e-technik.tu-dortmund.de/cms/de/forschung/Bildsequenzen_und_Referenzdaten/index.html). All data needed to evaluate the conclusions in the paper are present in thepaper and/or the Supplementary Materials. Additional data related to this paper may be requestedfrom the authors.
Submitted 21 April 2017Accepted 10 August 2017Published 8 September 201710.1126/sciadv.1701286
Citation: C. Wöhler, A. Grumpe, A. A. Berezhnoy, V. V. Shevchenko, Time-of-day–dependentglobal distribution of lunar surficial water/hydroxyl. Sci. Adv. 3, e1701286 (2017).
10 of 10
on January 31, 2020http://advances.sciencem
ag.org/D
ownloaded from
dependent global distribution of lunar surficial water/hydroxyl−Time-of-dayChristian Wöhler, Arne Grumpe, Alexey A. Berezhnoy and Vladislav V. Shevchenko
DOI: 10.1126/sciadv.1701286 (9), e1701286.3Sci Adv
ARTICLE TOOLS http://advances.sciencemag.org/content/3/9/e1701286
MATERIALSSUPPLEMENTARY http://advances.sciencemag.org/content/suppl/2017/09/01/3.9.e1701286.DC1
REFERENCES
http://advances.sciencemag.org/content/3/9/e1701286#BIBLThis article cites 47 articles, 4 of which you can access for free
PERMISSIONS http://www.sciencemag.org/help/reprints-and-permissions
Terms of ServiceUse of this article is subject to the
is a registered trademark of AAAS.Science AdvancesYork Avenue NW, Washington, DC 20005. The title (ISSN 2375-2548) is published by the American Association for the Advancement of Science, 1200 NewScience Advances
License 4.0 (CC BY-NC).Science. No claim to original U.S. Government Works. Distributed under a Creative Commons Attribution NonCommercial Copyright © 2017 The Authors, some rights reserved; exclusive licensee American Association for the Advancement of
on January 31, 2020http://advances.sciencem
ag.org/D
ownloaded from