Embed Size (px)
Citation preview
Dale E. Van Zante and Mark P. WernetGlenn Research Center, Cleveland, Ohio
Tip Vortex and Wake Characteristics of aCounterrotating Open Rotor
NASA/TM—2012-217713
October 2012
AIAA–2012–4039
https://ntrs.nasa.gov/search.jsp?R=20120016637 2020-03-05T17:24:08+00:00Z
NASA STI Program . . . in Profi le
Since its founding, NASA has been dedicated to the advancement of aeronautics and space science. The NASA Scientifi c and Technical Information (STI) program plays a key part in helping NASA maintain this important role.
The NASA STI Program operates under the auspices of the Agency Chief Information Offi cer. It collects, organizes, provides for archiving, and disseminates NASA’s STI. The NASA STI program provides access to the NASA Aeronautics and Space Database and its public interface, the NASA Technical Reports Server, thus providing one of the largest collections of aeronautical and space science STI in the world. Results are published in both non-NASA channels and by NASA in the NASA STI Report Series, which includes the following report types: • TECHNICAL PUBLICATION. Reports of
completed research or a major signifi cant phase of research that present the results of NASA programs and include extensive data or theoretical analysis. Includes compilations of signifi cant scientifi c and technical data and information deemed to be of continuing reference value. NASA counterpart of peer-reviewed formal professional papers but has less stringent limitations on manuscript length and extent of graphic presentations.
• TECHNICAL MEMORANDUM. Scientifi c
and technical fi ndings that are preliminary or of specialized interest, e.g., quick release reports, working papers, and bibliographies that contain minimal annotation. Does not contain extensive analysis.
• CONTRACTOR REPORT. Scientifi c and
technical fi ndings by NASA-sponsored contractors and grantees.
• CONFERENCE PUBLICATION. Collected papers from scientifi c and technical conferences, symposia, seminars, or other meetings sponsored or cosponsored by NASA.
• SPECIAL PUBLICATION. Scientifi c,
technical, or historical information from NASA programs, projects, and missions, often concerned with subjects having substantial public interest.
• TECHNICAL TRANSLATION. English-
language translations of foreign scientifi c and technical material pertinent to NASA’s mission.
Specialized services also include creating custom thesauri, building customized databases, organizing and publishing research results.
For more information about the NASA STI program, see the following:
• Access the NASA STI program home page at http://www.sti.nasa.gov
• E-mail your question to [email protected] • Fax your question to the NASA STI
Information Desk at 443–757–5803 • Phone the NASA STI Information Desk at 443–757–5802 • Write to:
STI Information Desk NASA Center for AeroSpace Information 7115 Standard Drive Hanover, MD 21076–1320
Dale E. Van Zante and Mark P. WernetGlenn Research Center, Cleveland, Ohio
Tip Vortex and Wake Characteristics of aCounterrotating Open Rotor
NASA/TM—2012-217713
October 2012
AIAA–2012–4039
National Aeronautics andSpace Administration
Glenn Research CenterCleveland, Ohio 44135
Prepared for the48th Joint Propulsion Conference and Exhibitcosponsored by AIAA, ASME, SAE, and ASEEAtlanta, Georgia, July 30 to August 1, 2012
Acknowledgments
This work was sponsored by the NASA Environmentally Responsible Aviation Project of the Integrated SystemsResearch Program. The PIV measurement team included Randy Locke, Adam Wroblewski, and Gary Clayo. CsabaHorvath assisted with the fi gures presenting the PIV data.
Available from
NASA Center for Aerospace Information7115 Standard DriveHanover, MD 21076–1320
National Technical Information Service5301 Shawnee Road
Alexandria, VA 22312
Available electronically at http://www.sti.nasa.gov
Trade names and trademarks are used in this report for identifi cation only. Their usage does not constitute an offi cial endorsement, either expressed or implied, by the National Aeronautics and
Space Administration.
Level of Review: This material has been technically reviewed by technical management.
NASA/TM—2012-217713 1
Tip Vortex and Wake Characteristics of a Counterrotating Open Rotor
Dale E. Van Zante and Mark P. Wernet
National Aeronautics and Space Administration Glenn Research Center Cleveland, Ohio 44135
Abstract
One of the primary noise sources for Open Rotor systems is the interaction of the forward rotor tip vortex and blade wake with the aft rotor. NASA has collaborated with General Electric on the testing of a new generation of low noise, counterrotating Open Rotor systems. Three-dimensional particle image velocimetry measurements were acquired in the intra-rotor gap of the Historical Baseline blade set. The velocity measurements are of sufficient resolution to characterize the tip vortex size and trajectory as well as the rotor wake decay and turbulence character. The tip clearance vortex trajectory is compared to results from previously developed models. Forward rotor wake velocity profiles are shown. Results are presented in a form as to assist numerical modeling of Open Rotor system aerodynamics and acoustics.
Nomenclature
X,Y Cartesian PIV coordinates, inches Z Axial PIV coordinate, inches MSTA Model Station axial coordinate, inches U,V Velocity components in X and Y directions, ft/s W Velocity component (axial) in Z direction, ft/s Vr Radial velocity, ft/s Vtheta Tangential velocity, ft/s ORPR Open Rotor Propulsion Rig
Introduction
The Open Rotor based propulsion system offers the potential for substantial fuel burn reductions, greater than 20 percent, compared to contemporary turbofan based propulsion systems. The increase in fuel costs and greater emphasis on reducing carbon emmisions have both contributed to the renewed interest in Open Rotors.
Open Rotor concepts, previously called propfans, were studied extensively in the 1980s as a result of the oil price shocks of the 1970s. Development advanced as far as flight test engines. For example, the General Electric (GE) Unducted Fan (UDF) engine flew on both MD-80 and 727 airframes. Oil prices stabilized and interest in these radical new engine concepts waned. The UDF program at GE ended in 1989.
The 1980s demonstrator engines were memorable for their unique, scimitar shaped blades, their fuel burn reduction, and their noise levels. Design systems of the time were limited in their ability to optimize for both performance and acoustics simultaneously. The current generation of open rotors have been designed with both three-dimensional aerodynamics tools and computational aeroacoustics tools. This has enabled the new designs to match the best aero performance of the 1980s but with much improved noise characteristics. The goal of the current work is to achieve 15 to 17 EPNdB cumulative margin to the Chapter 4 noise regulations.
NASA/TM
A 198current wiPropulsioacoustic dprevious ffrom Sterea phased aproprietarfor Open totality ofand analy
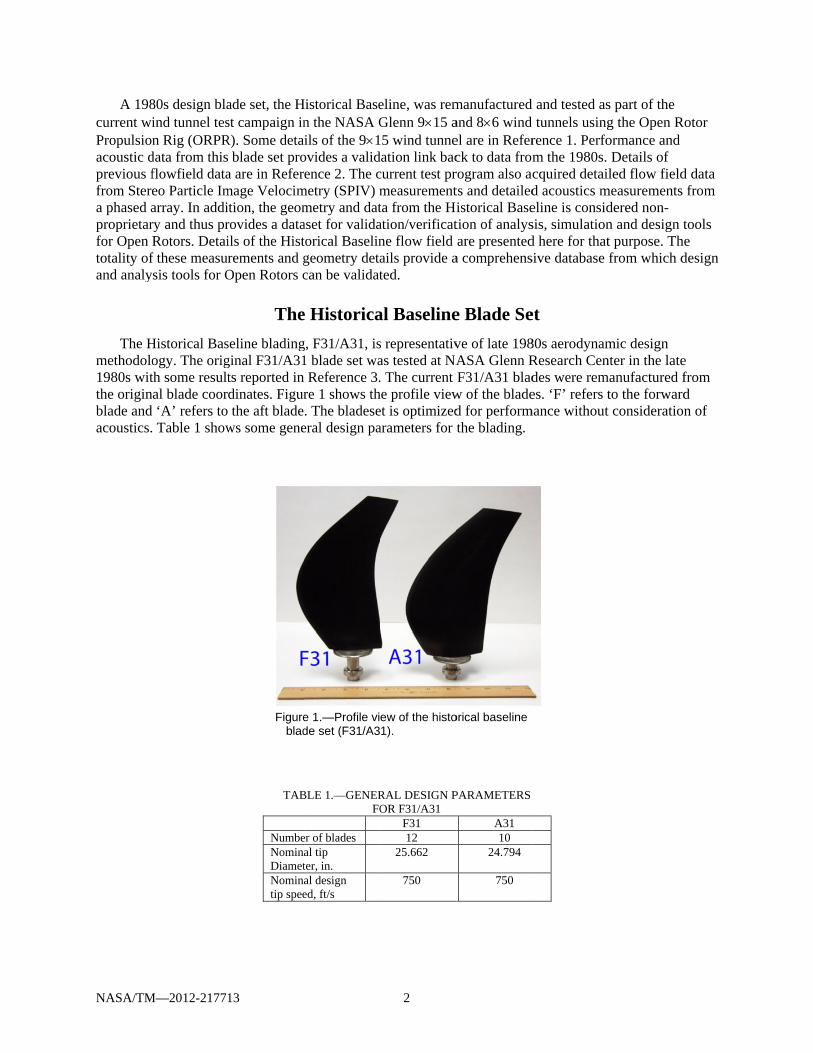
The Hmethodolo1980s witthe originblade andacoustics.
M—2012-21771
80s design blaind tunnel tesn Rig (ORPR
data from thisflowfield dataeo Particle Imarray. In addiry and thus prRotors. Detaif these measurysis tools for O
Historical Basogy. The origth some result
nal blade coord ‘A’ refers to
Table 1 show
13
ade set, the Hst campaign inR). Some deta
blade set proa are in Refermage Velocimtion, the geom
rovides a datails of the Histrements and gOpen Rotors c
The
seline bladingginal F31/A31ts reported in dinates. Figurthe aft blade
ws some gene
Figureblad
TAB
NumbeNominaDiametNominatip spee
Historical Basen the NASA Gils of the 91
ovides a validence 2. The c
metry (SPIV) mmetry and dataset for validatorical Baselingeometry detacan be validat
e Historica
g, F31/A31, is1 blade set wa
Reference 3.re 1 shows th. The bladeseeral design pa
e 1.—Profile vide set (F31/A3
BLE 1.—GENERFO
er of blades al tip ter, in. al design ed, ft/s
2
eline, was remGlenn 915 a5 wind tunne
dation link baccurrent test prmeasurementta from the Hiation/verificatne flow field ails provide ated.
al Baseline
s representativas tested at NA. The current
he profile viewet is optimizedarameters for
ew of the histo1).
RAL DESIGN POR F31/A31
F31 12
25.662
750
manufactured and 86 wind el are in Referck to data fromrogram also acts and detailedistorical Basetion of analysare presented
a comprehens
e Blade Se
ve of late 198ASA Glenn RF31/A31 blad
w of the bladed for performthe blading.
orical baseline
PARAMETERS
A31 10
24.794
750
d and tested astunnels using
rence 1. Perfom the 1980s. cquired detaid acoustics meline is considsis, simulationd here for thatsive database
et
80s aerodynamResearch Cendes were remes. ‘F’ refers t
mance without
s part of the g the Open Rormance and Details of led flow field
measurements dered non-n and design tt purpose. Thefrom which d
mic design nter in the late
manufactured fto the forwardt consideration
otor
d data from
tools e design
e from d n of
NASA/TM
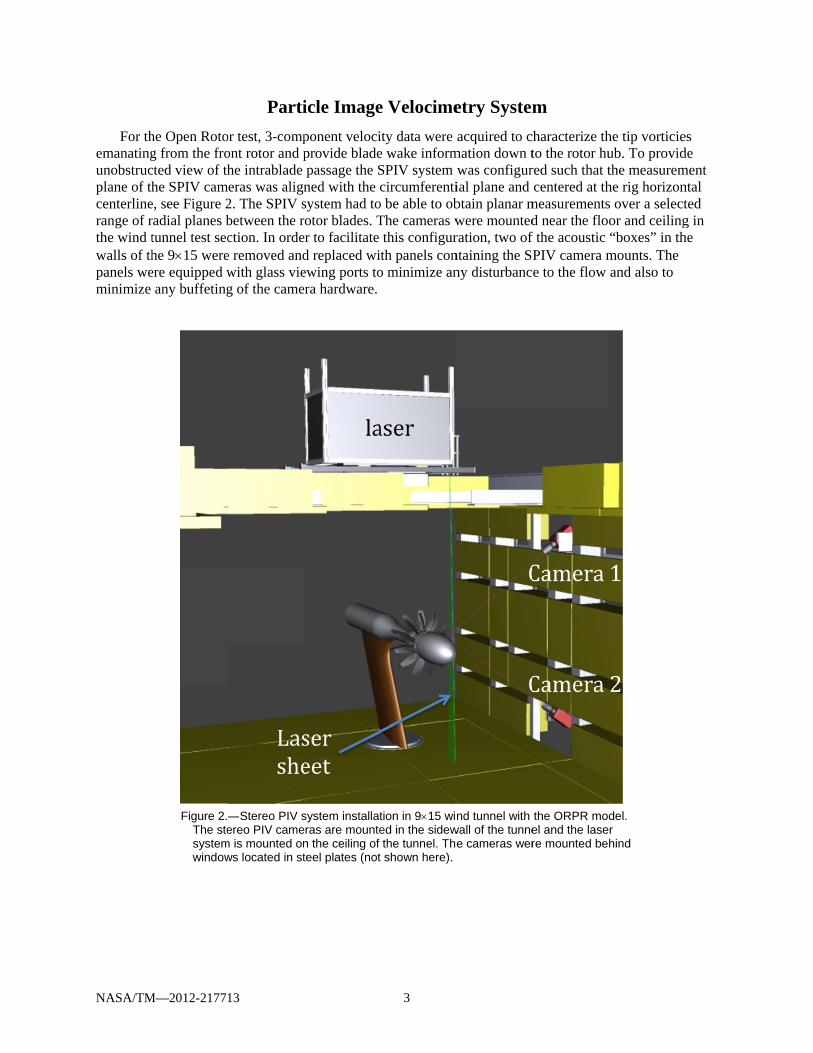
For themanatingunobstrucplane of thcenterlinerange of rthe wind twalls of thpanels weminimize
M—2012-21771
he Open Rotog from the frocted view of thhe SPIV cam
e, see Figure 2radial planes btunnel test seche 915 wereere equipped w
any buffeting
Figure 2.—The stesystemwindow
13
Parti
or test, 3-compont rotor and phe intrablade eras was align2. The SPIV sbetween the rction. In ordee removed andwith glass vieg of the came
—Stereo PIV sereo PIV came
m is mounted onws located in st
icle Image
ponent velociprovide bladepassage the Sned with the csystem had torotor blades. Ter to facilitate d replaced wiewing ports toera hardware.
system installateras are mounten the ceiling of teel plates (not
3
e Velocime
ity data were e wake informSPIV system circumferenti
o be able to obThe cameras wthis configurth panels con
o minimize an
tion in 915 wied in the sidewthe tunnel. Th
t shown here).
etry System
acquired to cmation down twas configurial plane and btain planar mwere mountedration, two of ntaining the Sny disturbanc
nd tunnel with wall of the tunnee cameras wer
m
characterize thto the rotor hured such that tcentered at th
measurementsd near the flof the acoustic PIV camera me to the flow
the ORPR moel and the lasere mounted be
he tip vorticieub. To providthe measuremhe rig horizons over a selector and ceiling“boxes” in th
mounts. The and also to
del.
er hind
es de ment ntal ted g in he
NASA/TM
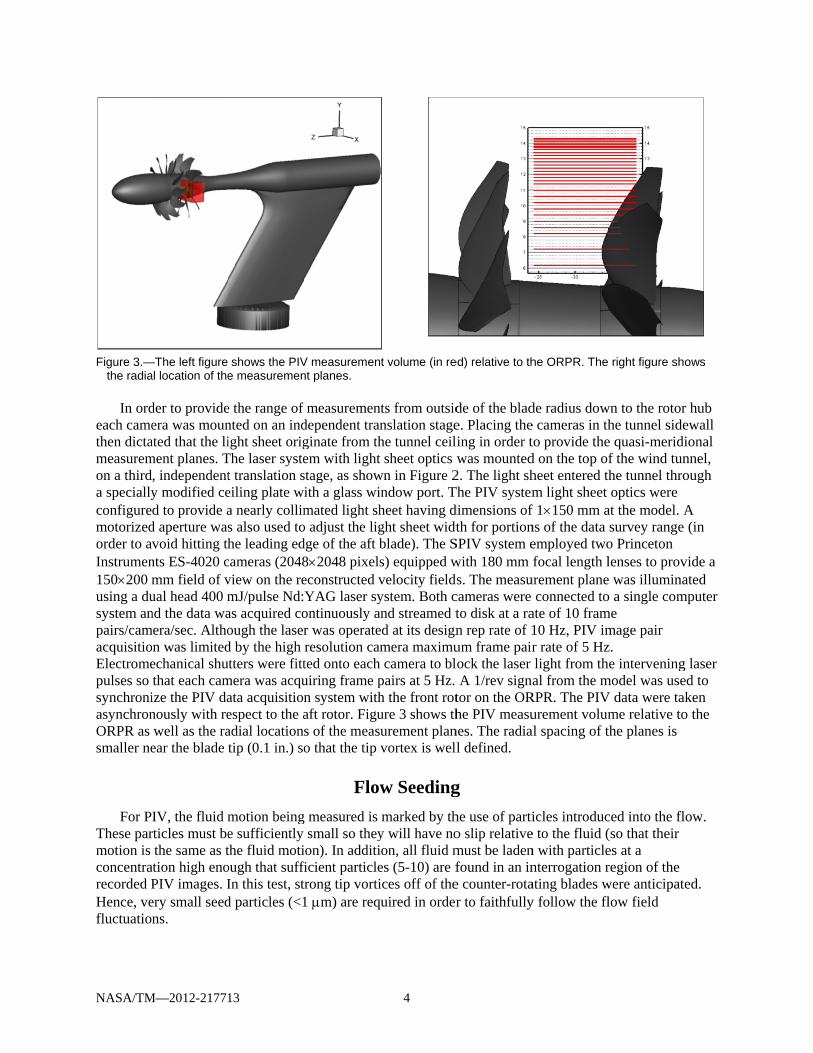
Figure 3.—the radia
In ord
each camethen dictameasuremon a thirda speciallyconfiguremotorizedorder to aInstrumen150200 musing a dusystem anpairs/camacquisitioElectromepulses so synchroniasynchronORPR as smaller ne
For PThese parmotion is concentrarecorded PHence, vefluctuatio
M—2012-21771
—The left figure al location of the
der to provideera was moun
ated that the liment planes. T
, independenty modified ced to provide a
d aperture wasvoid hitting th
nts ES-4020 cmm field of vual head 400 mnd the data wa
mera/sec. Althon was limitedechanical shuthat each camize the PIV danously with rewell as the ra
ear the blade
IV, the fluid mrticles must bethe same as t
ation high enoPIV images. Iery small seedns.
13
shows the PIVe measuremen
e the range of nted on an indight sheet orig
The laser systet translation seiling plate wa nearly collims also used tohe leading ed
cameras (2048view on the remJ/pulse Nd:as acquired coough the laserd by the high utters were fittmera was acquata acquisitionespect to the aadial locationtip (0.1 in.) so
motion beinge sufficiently the fluid motiough that suffiIn this test, std particles (<1
V measuremennt planes.
f measuremendependent tranginate from them with lightstage, as showith a glass wimated light sh
o adjust the ligdge of the aft b82048 pixelseconstructed vYAG laser syontinuously ar was operateresolution camted onto eachuiring frame pn system withaft rotor. Figus of the measo that the tip
Flow
g measured is small so they
ion). In additificient particletrong tip vorti1 m) are req
4
t volume (in re
nts from outsidnslation stagehe tunnel ceilt sheet optics wn in Figure 2
ndow port. Theet having dght sheet widtblade). The Ss) equipped wvelocity fieldystem. Both cnd streamed t
ed at its designmera maximucamera to bl
pairs at 5 Hz. h the front roture 3 shows thurement planvortex is well
w Seeding
marked by thy will have noion, all fluid mes (5-10) are fices off of the
quired in order
ed) relative to th
de of the blade. Placing theling in order twas mounted
2. The light shThe PIV systemdimensions ofth for portion
SPIV system ewith 180 mm s. The measu
cameras were to disk at a ran rep rate of 1um frame pairlock the laser A 1/rev sign
tor on the ORhe PIV measu
nes. The radial defined.
g
he use of partio slip relativemust be ladenfound in an ine counter-rotar to faithfully
he ORPR. The
de radius dowe cameras in thto provide thed on the top oheet entered thm light sheet
f 1150 mm ans of the data employed twofocal length l
urement planeconnected to
ate of 10 fram10 Hz, PIV imr rate of 5 Hzlight from thal from the m
RPR. The PIVurement volumal spacing of t
icles introduce to the fluid (n with particlenterrogation rating blades wy follow the fl
right figure sh
wn to the rotorhe tunnel sidee quasi-meridif the wind tunhe tunnel throoptics were
at the model. Asurvey range o Princeton lenses to prove was illuminao a single comme mage pair z. he interveningmodel was useV data were ta
me relative tothe planes is
ced into the fl(so that their es at a region of the were anticipatlow field
ows
r hub ewall ional nnel, ough
A (in
vide a ated
mputer
g laser ed to aken o the
low.
ed.
NASA/TM
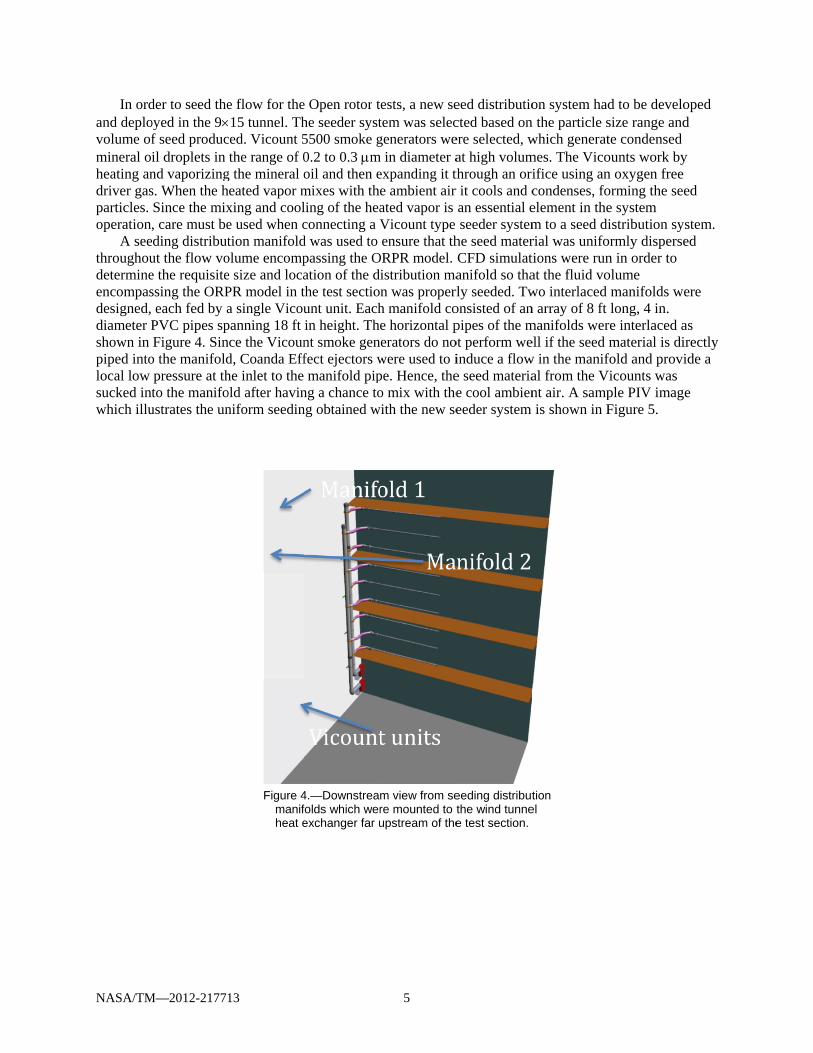
In ordand deplovolume ofmineral oiheating andriver gasparticles. operation,
A seethroughoudetermineencompasdesigned, diameter Pshown in piped intolocal low sucked intwhich illu
M—2012-21771
der to seed theoyed in the 9f seed producil droplets in nd vaporizings. When the hSince the mix, care must beding distribut
ut the flow voe the requisitessing the ORPeach fed by a
PVC pipes spFigure 4. Sin
o the manifoldpressure at thto the manifo
ustrates the un
13
e flow for the15 tunnel. Th
ced. Vicount 5the range of 0
g the mineral oheated vapor mxing and coole used when ction manifold
olume encompe size and locaPR model in ta single Vicoupanning 18 ft nce the Vicound, Coanda Effhe inlet to the old after havinniform seedin
Figure 4manifheat e
e Open rotor the seeder syst5500 smoke g0.2 to 0.3 moil and then emixes with theling of the heaconnecting a Vd was used to passing the Oation of the dthe test sectiount unit. Eachin height. Thent smoke genfect ejectors wmanifold pip
ng a chance tong obtained w
4.—Downstreamfolds which werexchanger far u
5
ests, a new setem was selecgenerators we
m in diameter aexpanding it te ambient air ated vapor is Vicount type ensure that th
ORPR model. istribution man was properlh manifold coe horizontal perators do no
were used to ipe. Hence, theo mix with the
with the new se
m view from sere mounted to tupstream of the
eed distributiocted based onere selected, wat high volumthrough an orir it cools and can essential eseeder system
he seed materCFD simulatanifold so tha
rly seeded. Twonsisted of anpipes of the mot perform weinduce a flowe seed materiae cool ambieneeder system
eeding distributthe wind tunnee test section.
on system hadn the particle swhich generatmes. The Vicoifice using ancondenses, foelement in them to a seed dirial was unifotions were runat the fluid vowo interlaced n array of 8 ft manifolds werell if the seed w in the manifal from the Vnt air. A sampis shown in F
tion el
d to be develosize range andte condensed ounts work byn oxygen free orming the seee system istribution sy
ormly dispersen in order to olume manifolds welong, 4 in.
re interlaced amaterial is di
fold and proviVicounts was
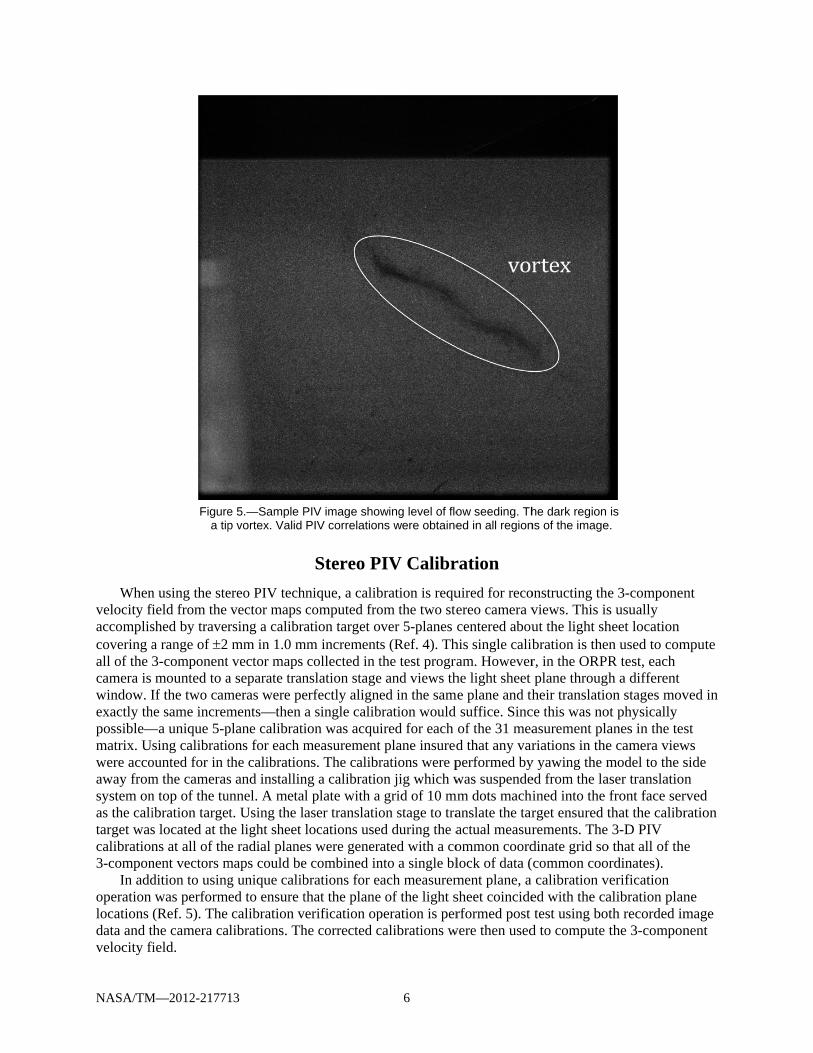
ple PIV imagFigure 5.
oped d
y
ed
stem. ed
ere
as irectly ide a
e
NASA/TM
Whenvelocity fiaccompliscovering aall of the camera is window. Iexactly thpossible—matrix. Uwere accoaway fromsystem onas the calitarget wascalibration3-compon
In addoperation locations data and tvelocity fi
M—2012-21771
Figurea tip
n using the stefield from the shed by travera range of 2 3-componentmounted to a
If the two camhe same increm—a unique 5-p
sing calibratiounted for in tm the camerasn top of the tuibration targes located at thns at all of thenent vectors mdition to usingwas perform(Ref. 5). The
the camera cafield.
13
e 5.—Sample Pp vortex. Valid
ereo PIV techvector maps rsing a calibramm in 1.0 m
t vector maps a separate tranmeras were pements—then plane calibrations for each mthe calibrations and installin
unnel. A metat. Using the l
he light sheet e radial plane
maps could beg unique calibed to ensure tcalibration v
alibrations. Th
PIV image showPIV correlation
Stereo P
hnique, a calibcomputed froation target o
mm incrementcollected in t
nslation stageerfectly alignea single calibion was acquimeasurementns. The calibrng a calibratiol plate with aaser translatiolocations use
es were genere combined inbrations for ethat the plane
verification ophe corrected c
6
wing level of flons were obtaine
PIV Calibr
bration is requom the two stever 5-planes s (Ref. 4). Ththe test prograe and views thed in the sam
bration would ired for each t plane insuredrations were pon jig which w
grid of 10 mon stage to trad during the aated with a co
nto a single blach measurem
e of the light speration is percalibrations w
ow seeding. Thed in all region
ration
uired for recoereo camera vcentered abou
his single calibam. Howeverhe light sheet
me plane and thd suffice. Sinc
of the 31 mead that any varperformed bywas suspende
mm dots machianslate the taractual measurommon coordlock of data (ment plane, asheet coinciderformed post
were then used
he dark region ns of the image
onstructing theviews. This isut the light shbration is ther, in the ORPRplane throughheir translatio
ce this was noasurement plariations in the
y yawing the med from the lained into the rget ensured trements. The dinate grid socommon coocalibration v
ed with the catest using bot
d to compute
is
e.
e 3-componens usually heet location n used to comR test, each h a different on stages movot physically anes in the tese camera viewmodel to the saser translationfront face serthat the calibr3-D PIV
o that all of therdinates).
verification alibration planth recorded imthe 3-compon
nt
mpute
ved in
st ws side n rved ration
e
ne mage nent
NASA/TM—2012-217713 7
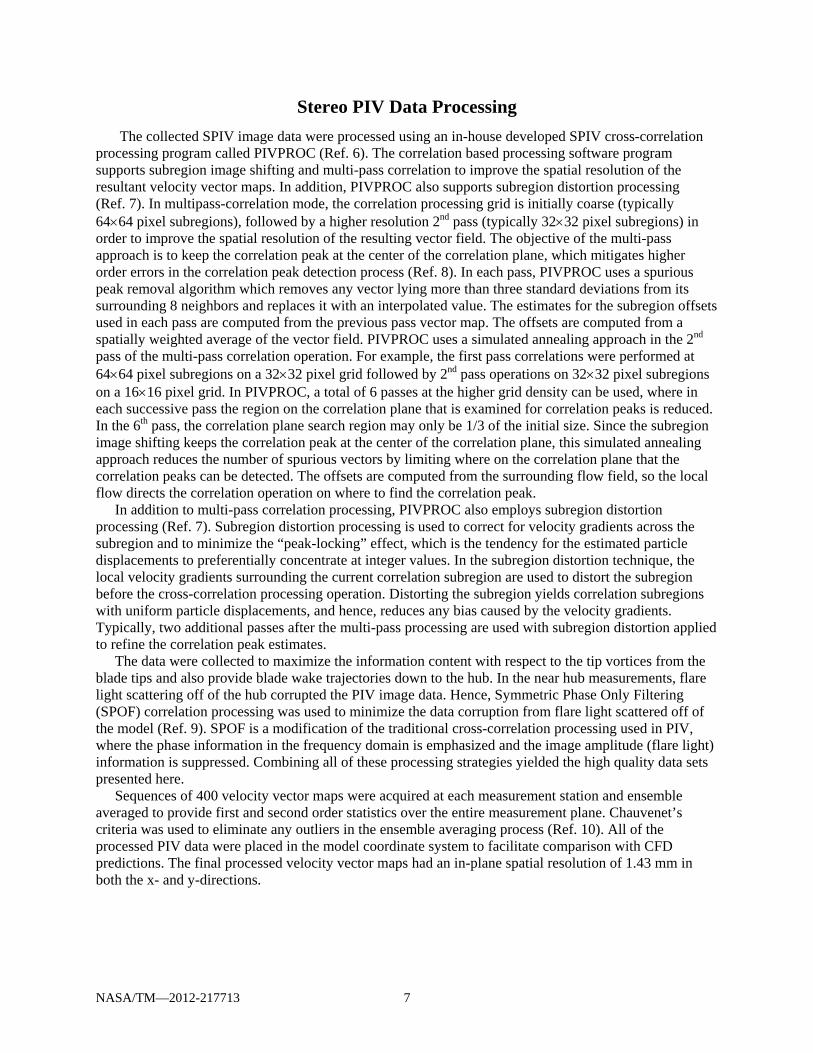
Stereo PIV Data Processing
The collected SPIV image data were processed using an in-house developed SPIV cross-correlation processing program called PIVPROC (Ref. 6). The correlation based processing software program supports subregion image shifting and multi-pass correlation to improve the spatial resolution of the resultant velocity vector maps. In addition, PIVPROC also supports subregion distortion processing (Ref. 7). In multipass-correlation mode, the correlation processing grid is initially coarse (typically 6464 pixel subregions), followed by a higher resolution 2nd pass (typically 3232 pixel subregions) in order to improve the spatial resolution of the resulting vector field. The objective of the multi-pass approach is to keep the correlation peak at the center of the correlation plane, which mitigates higher order errors in the correlation peak detection process (Ref. 8). In each pass, PIVPROC uses a spurious peak removal algorithm which removes any vector lying more than three standard deviations from its surrounding 8 neighbors and replaces it with an interpolated value. The estimates for the subregion offsets used in each pass are computed from the previous pass vector map. The offsets are computed from a spatially weighted average of the vector field. PIVPROC uses a simulated annealing approach in the 2nd pass of the multi-pass correlation operation. For example, the first pass correlations were performed at 6464 pixel subregions on a 3232 pixel grid followed by 2nd pass operations on 3232 pixel subregions on a 1616 pixel grid. In PIVPROC, a total of 6 passes at the higher grid density can be used, where in each successive pass the region on the correlation plane that is examined for correlation peaks is reduced. In the 6th pass, the correlation plane search region may only be 1/3 of the initial size. Since the subregion image shifting keeps the correlation peak at the center of the correlation plane, this simulated annealing approach reduces the number of spurious vectors by limiting where on the correlation plane that the correlation peaks can be detected. The offsets are computed from the surrounding flow field, so the local flow directs the correlation operation on where to find the correlation peak.
In addition to multi-pass correlation processing, PIVPROC also employs subregion distortion processing (Ref. 7). Subregion distortion processing is used to correct for velocity gradients across the subregion and to minimize the “peak-locking” effect, which is the tendency for the estimated particle displacements to preferentially concentrate at integer values. In the subregion distortion technique, the local velocity gradients surrounding the current correlation subregion are used to distort the subregion before the cross-correlation processing operation. Distorting the subregion yields correlation subregions with uniform particle displacements, and hence, reduces any bias caused by the velocity gradients. Typically, two additional passes after the multi-pass processing are used with subregion distortion applied to refine the correlation peak estimates.
The data were collected to maximize the information content with respect to the tip vortices from the blade tips and also provide blade wake trajectories down to the hub. In the near hub measurements, flare light scattering off of the hub corrupted the PIV image data. Hence, Symmetric Phase Only Filtering (SPOF) correlation processing was used to minimize the data corruption from flare light scattered off of the model (Ref. 9). SPOF is a modification of the traditional cross-correlation processing used in PIV, where the phase information in the frequency domain is emphasized and the image amplitude (flare light) information is suppressed. Combining all of these processing strategies yielded the high quality data sets presented here.
Sequences of 400 velocity vector maps were acquired at each measurement station and ensemble averaged to provide first and second order statistics over the entire measurement plane. Chauvenet’s criteria was used to eliminate any outliers in the ensemble averaging process (Ref. 10). All of the processed PIV data were placed in the model coordinate system to facilitate comparison with CFD predictions. The final processed velocity vector maps had an in-plane spatial resolution of 1.43 mm in both the x- and y-directions.
NASA/TM
The awe try to moil based Small aero2 nsec jittinfluencinensures thprocessingsubregioncloser to speaks candisplacemas 1 percdisplacemVerificati400 measustatistical presented
M—2012-21771
accuracy of thminimize anyseeders produodynamic diater in the laserng the measurhat we are obtg further ensu
ns or any peaksurfaces than
n be nominallyments were 16cent of full sc
ments. The useon helps to avurements whioutliers are rhere are 1 p
F
13
P
he PIV measury bias errors, luced the smalameter equater pulse timingrement accurataining high qures that we ak-locking effewould otherw
y estimated to6 pixels. Henccale. Smaller de of calibratiovoid any bias ich are then eremoved usingpercent of full
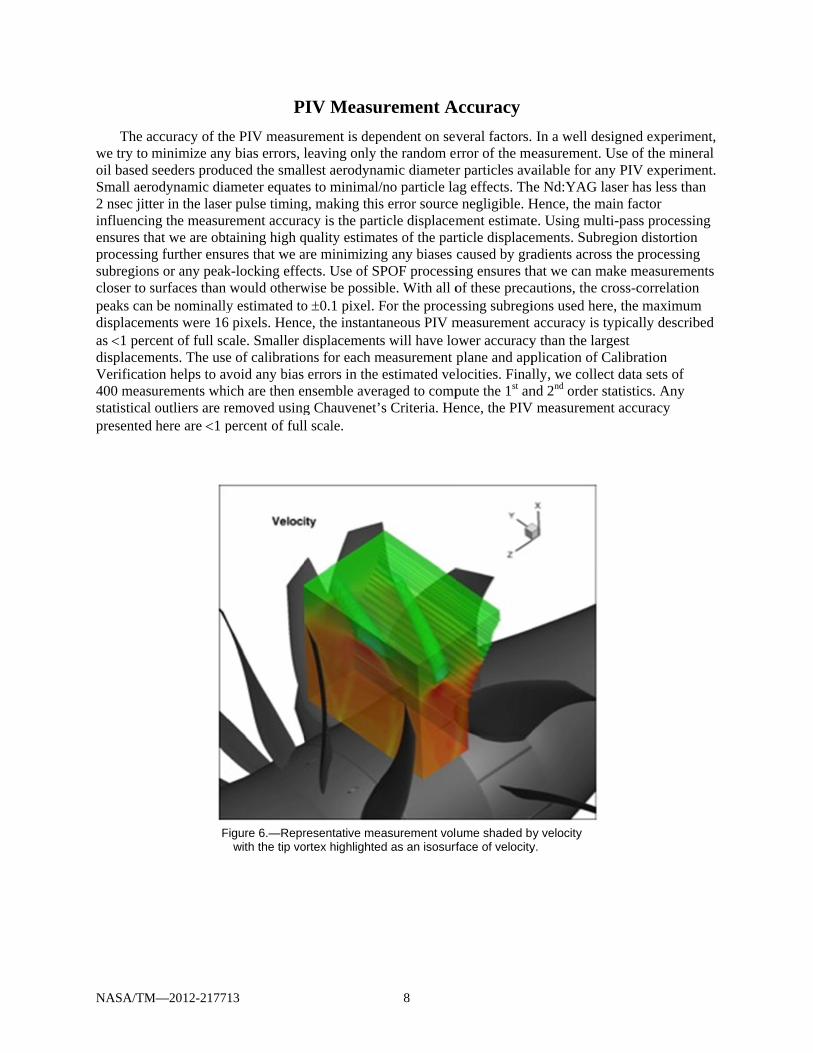
igure 6.—Reprwith the tip vo
PIV Measu
rement is depleaving only tllest aerodynaes to minimal/g, making thisacy is the partquality estimaare minimizinects. Use of SPwise be possibo 0.1 pixel. Fce, the instantdisplacementons for each m
errors in the ensemble averg Chauvenet’l scale.
resentative meortex highlighte
8
urement A
pendent on sevthe random eamic diameter/no particle las error sourceticle displacemates of the parng any biases POF processible. With all oFor the proceaneous PIV ms will have lo
measurement pestimated vel
raged to comps Criteria. He
easurement voled as an isosurf
Accuracy
veral factors. rror of the mer particles avaag effects. The negligible. Hment estimaterticle displacecaused by graing ensures thof these precassing subregi
measurement ower accuracyplane and applocities. Finalpute the 1st anence, the PIV
ume shaded bface of velocity
In a well deseasurement. Uailable for an
he Nd:YAG laHence, the mae. Using multements. Subreadients acrosshat we can maautions, the crions used hereaccuracy is ty
y than the largplication of Clly, we collecnd 2nd order st
V measuremen
y velocity
y.
signed experimUse of the mi
ny PIV experimaser has less tain factor ti-pass procesegion distortios the processiake measuremross-correlatie, the maximuypically descrgest
Calibration ct data sets oftatistics. Any
nt accuracy
ment, neral ment. than
ssing on ing ments on um ribed
fy
NASA/TM—2012-217713 9
Results
PIV flowfield measurements were acquired for multiple operating conditions and forward rotor phase positions for the Historical Baseline blade set. Table 2 lists the data conditions and repeat measurement (23Aug10e). Figure 6 shows a representative data volume at one phase step. Two phase steps of the forward rotor were acquired for each operating condition so that the tip vortex would be captured in the higher radial resolution portion of the measurement grid for the entire axial extent of the vortex. This is a consequence of slicing a helical shaped flow feature with flat planes. Results from both phase steps are used to determine the vortex core trajectory. The resolution of the forward blade wake does not change with phase step so representative results are shown for one phase step only.
TABLE 2.—GENERAL TEST CONDITIONS PIV data set
name Blade set Model
config Blade pitch
angle, Front/Aft
Front rotor, rpm
#PIV measurement planes
Front rotor PIV delay phase step
23Aug10a F31/A31 Take Off 40.1/40.8 6444 30 0 23Aug10b F31/A31 Take Off 40.1/40.8 6453 30 14.7 23Aug10c F31/A31 Take Off 40.1/40.8 5680 30 0 23Aug10d F31/A31 Take Off 40.1/40.8 5684 30 16.7 23Aug10e F31/A31 Take Off 40.1/40.8 6452 24 0 25Aug10a F31/A31 Approach 33.5/35.7 5704 30 0 25Aug10b F31/A31 Approach 33.5/35.7 5707 30 18.1
Tip Vortex Behavior
The size, strength, trajectory and decay rate of the forward rotor tip vortex are all key parameters in assessing the acoustic influence of this flow feature on the system. For example, aft rotor clipping is a possible noise mitigation strategy in which the aft rotor is shortened sufficiently so that the tip vortex does not interact with the blade. However, aft clipping can have a negative impact on system efficiency so a minimal amount of clipping is desired to obtain the acoustic benefit without a substantial efficiency loss.
Several models for the tip vortex interaction have been developed. See Majjigi, et al. (Ref. 11) for one example of a model developed at GE. The GE model was developed based on analytical assumptions about the vortex and some limited experimental data. The data available at the time consisted of 1) helicopter rotor in hover data for the tip vortex trajectory and 2) data from finite span airfoils at angle of attack in a wind tunnel (for vortex decay). Neither of these data are necessarily representative of the vortex character and flow conditions experienced by counter rotating open rotors. Majjigi, et al. noted many times that the accuracy, completeness, and sophistication of the model can be extended with the inclusion of more representative data.
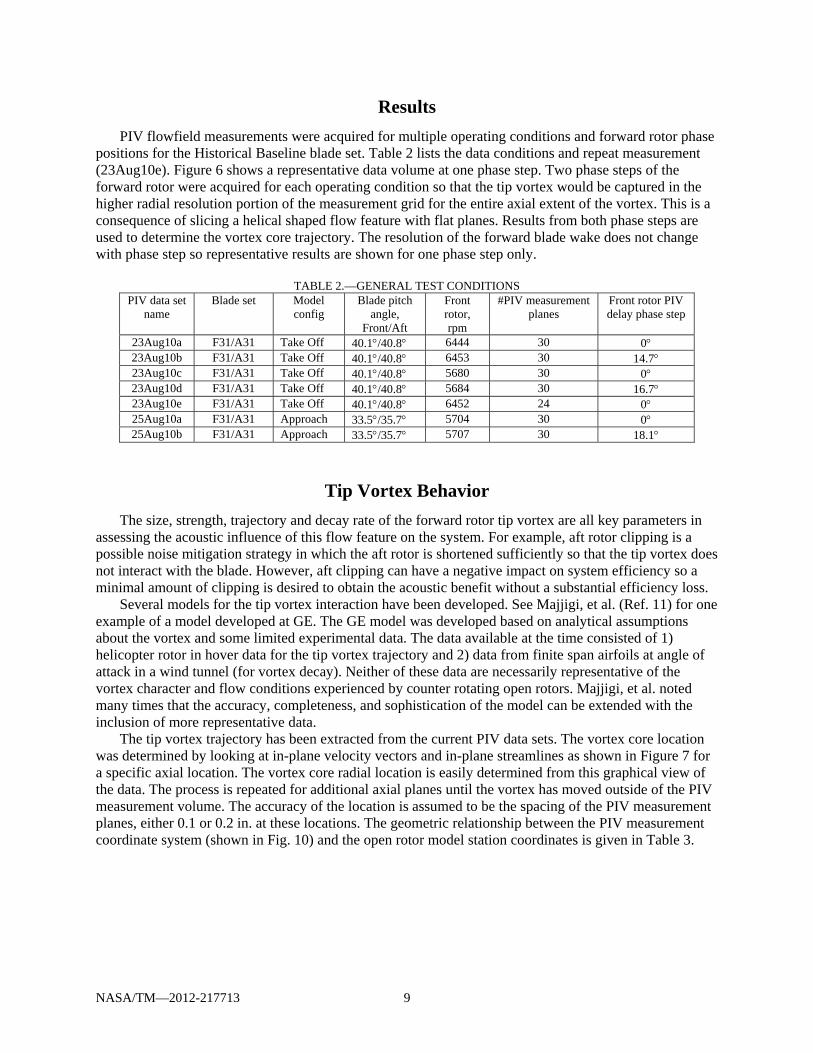
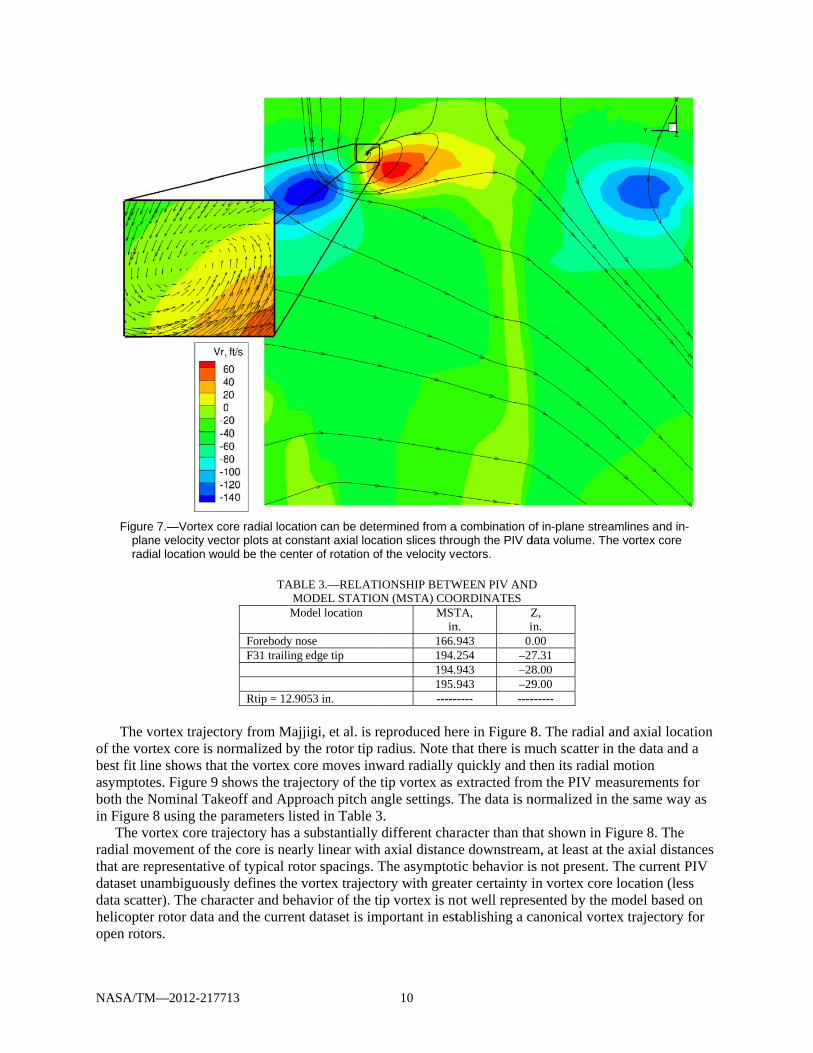
The tip vortex trajectory has been extracted from the current PIV data sets. The vortex core location was determined by looking at in-plane velocity vectors and in-plane streamlines as shown in Figure 7 for a specific axial location. The vortex core radial location is easily determined from this graphical view of the data. The process is repeated for additional axial planes until the vortex has moved outside of the PIV measurement volume. The accuracy of the location is assumed to be the spacing of the PIV measurement planes, either 0.1 or 0.2 in. at these locations. The geometric relationship between the PIV measurement coordinate system (shown in Fig. 10) and the open rotor model station coordinates is given in Table 3.
NASA/TM
Figureplanradi
The v
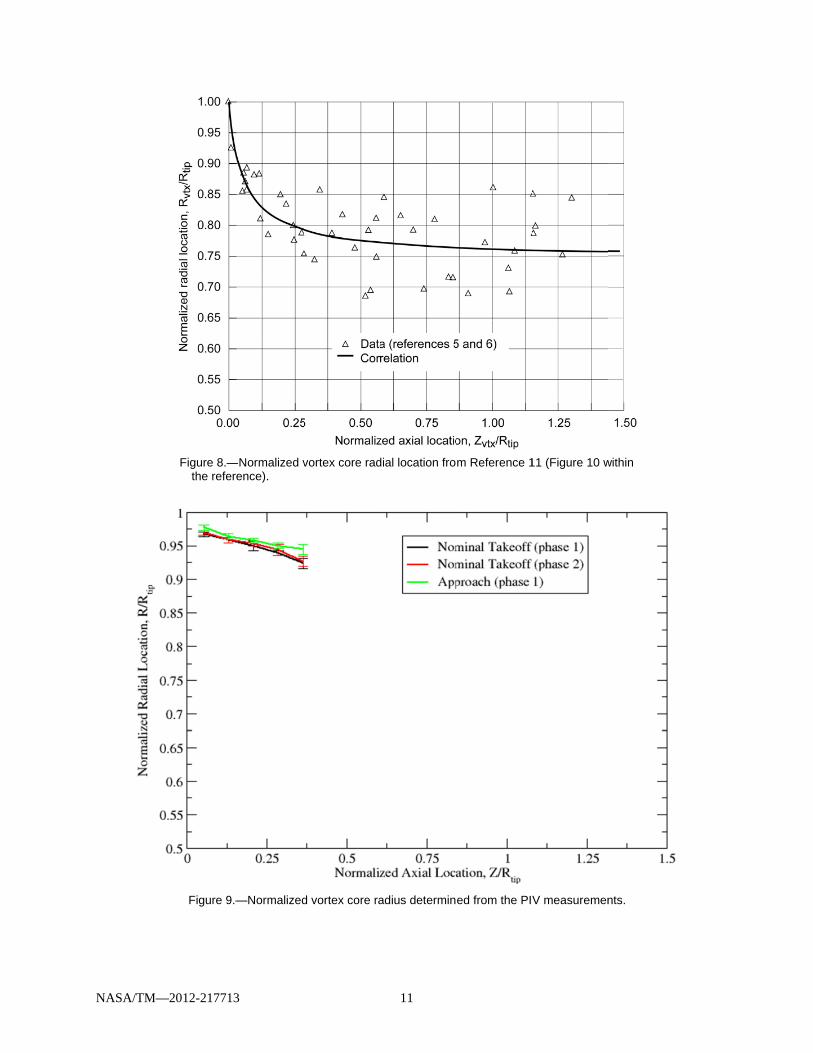
of the vorbest fit linasymptoteboth the Nin Figure
The voradial movthat are redataset undata scattehelicopteropen rotor
M—2012-21771
e 7.—Vortex cone velocity vectal location wou
vortex trajectortex core is none shows that es. Figure 9 shNominal Take8 using the p
ortex core trajvement of the
epresentative nambiguouslyer). The charar rotor data anrs.
13
ore radial locatiotor plots at conuld be the cente
TABLMOMo
Forebody noF31 trailing Rtip = 12.90
ory from Majjormalized by
the vortex cohows the trajeeoff and Apprarameters listjectory has a e core is nearlof typical rot
y defines the vacter and behand the current
on can be detestant axial locaer of rotation of
LE 3.—RELATIODEL STATIOodel location
ose edge tip
053 in.
jigi, et al. is rethe rotor tip r
ore moves inwectory of the roach pitch anted in Table 3substantially ly linear withor spacings. Tvortex trajectoavior of the tit dataset is im
10
ermined from aation slices throf the velocity ve
IONSHIP BETWN (MSTA) COO
MSTin
166.194.194.195.-----
eproduced heradius. Note thward radially tip vortex as ngle settings. 3. different char
h axial distancThe asymptotory with greaip vortex is no
mportant in est
a combination oough the PIV dectors.
WEEN PIV ANDORDINATES TA, n.
Zi
943 0.254 –27943 –28943 –29
----- ----
ere in Figure 8that there is mquickly and textracted fromThe data is n
racter than thce downstreamtic behavior isater certainty iot well represtablishing a c
of in-plane streadata volume. Th
D
Z, in. .00 7.31 8.00 9.00 ------
8. The radial much scatter inthen its radialm the PIV me
normalized in
hat shown in Fm, at least at ts not present.in vortex coresented by the canonical vort
amlines and inhe vortex core
and axial locan the data andl motion easurements fthe same way
Figure 8. The the axial dista The current Pe location (lesmodel based
tex trajectory
-
ation d a
for y as
ances PIV ss
d on for
NASA/TM
M—2012-21771
Figure 8.—the refe
Figure 9
13
—Normalized verence).
9.—Normalized
vortex core rad
d vortex core ra
11
dial location fro
adius determin
m Reference 1
ed from the PIV
11 (Figure 10 w
V measuremen
within
nts.
NASA/TM
Additimeasuremimprove tguiding dadvanced
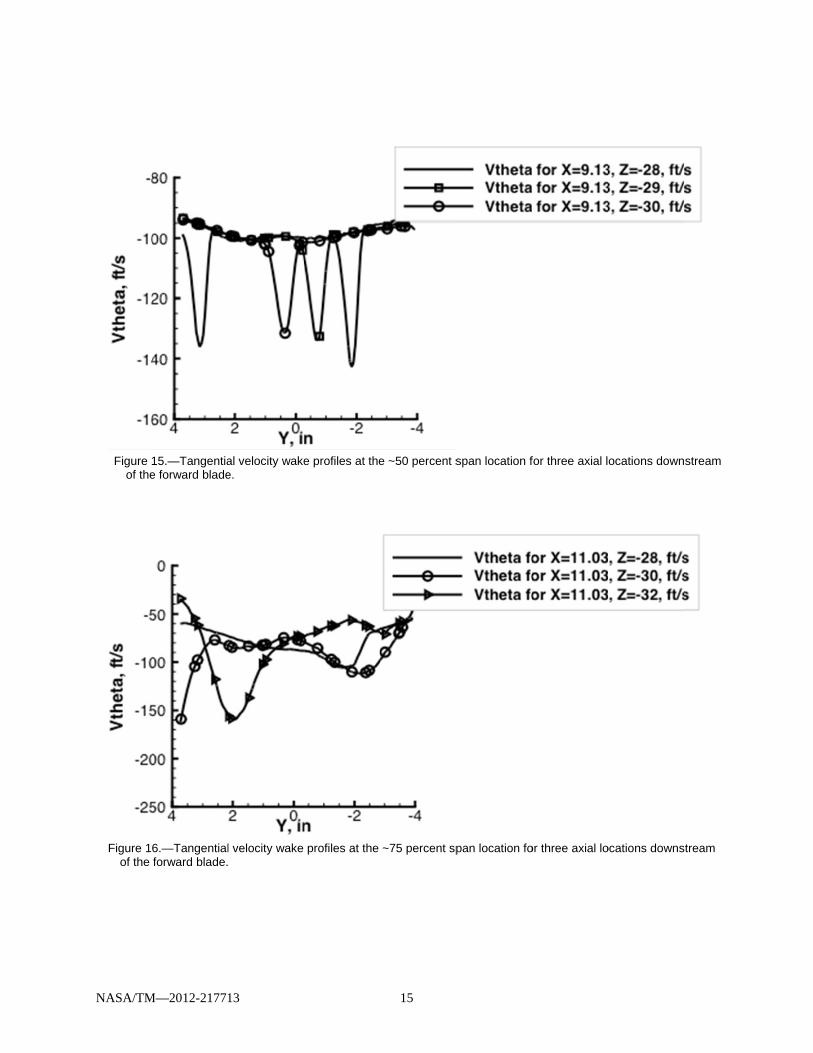
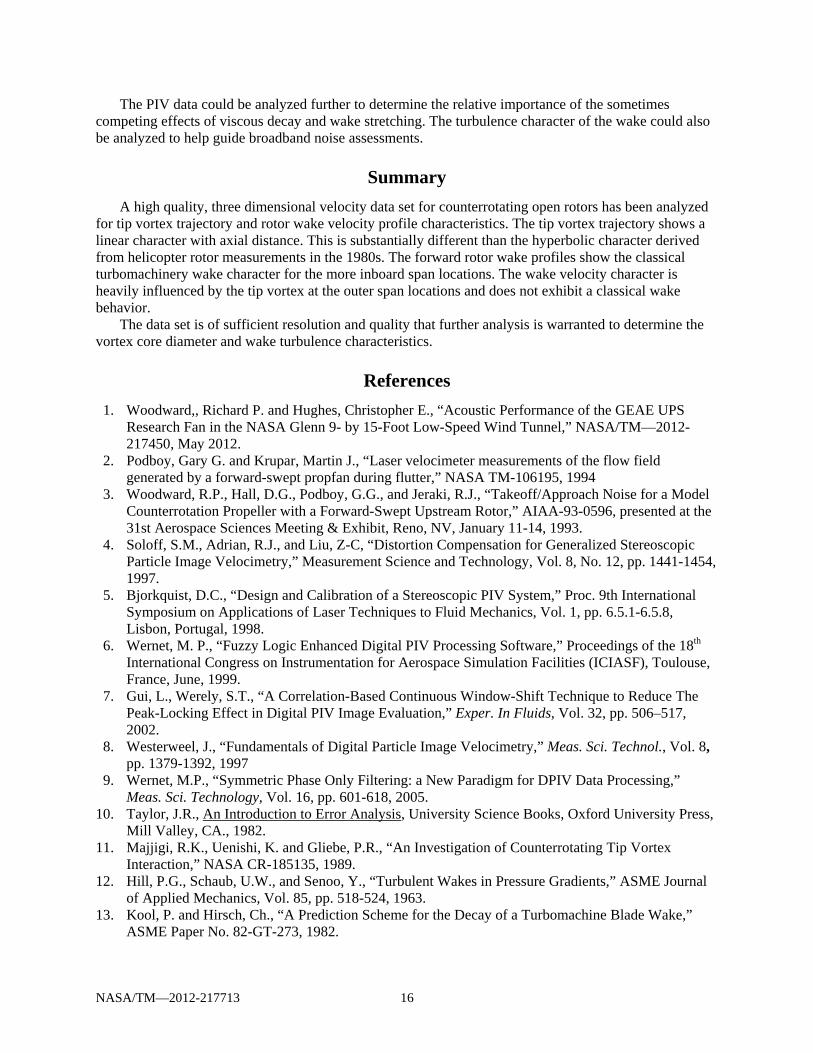
The shwake genecaused byand 13. Aprofiles ar
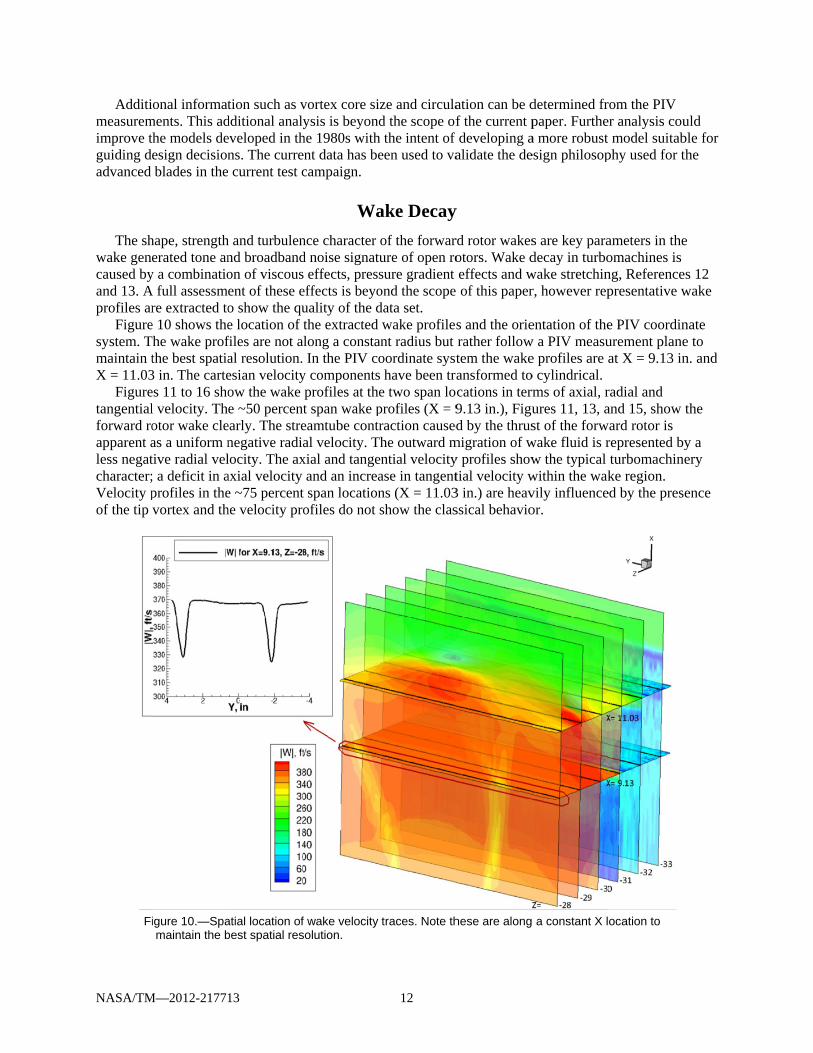
Figuresystem. Tmaintain tX = 11.03
Figuretangentialforward roapparent aless negatcharacter;Velocity pof the tip
Fi
M—2012-21771
onal informatments. This adthe models deesign decisionblades in the
hape, strengtherated tone an
y a combinatioA full assessm
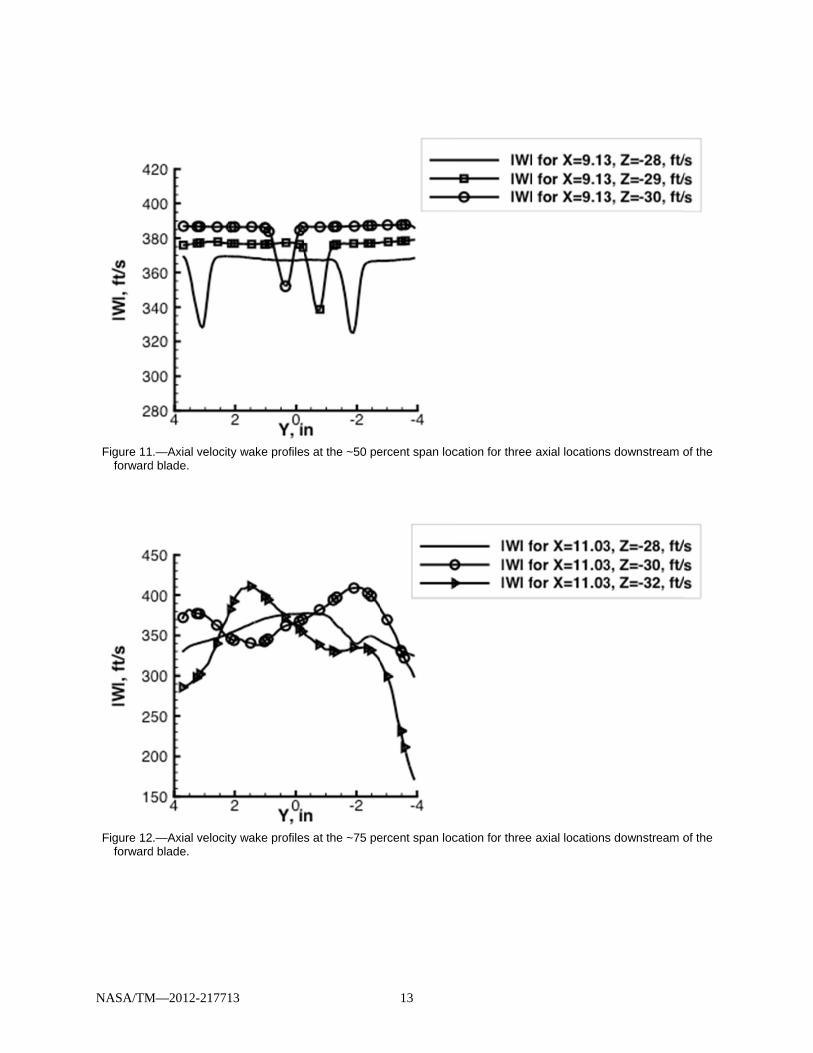
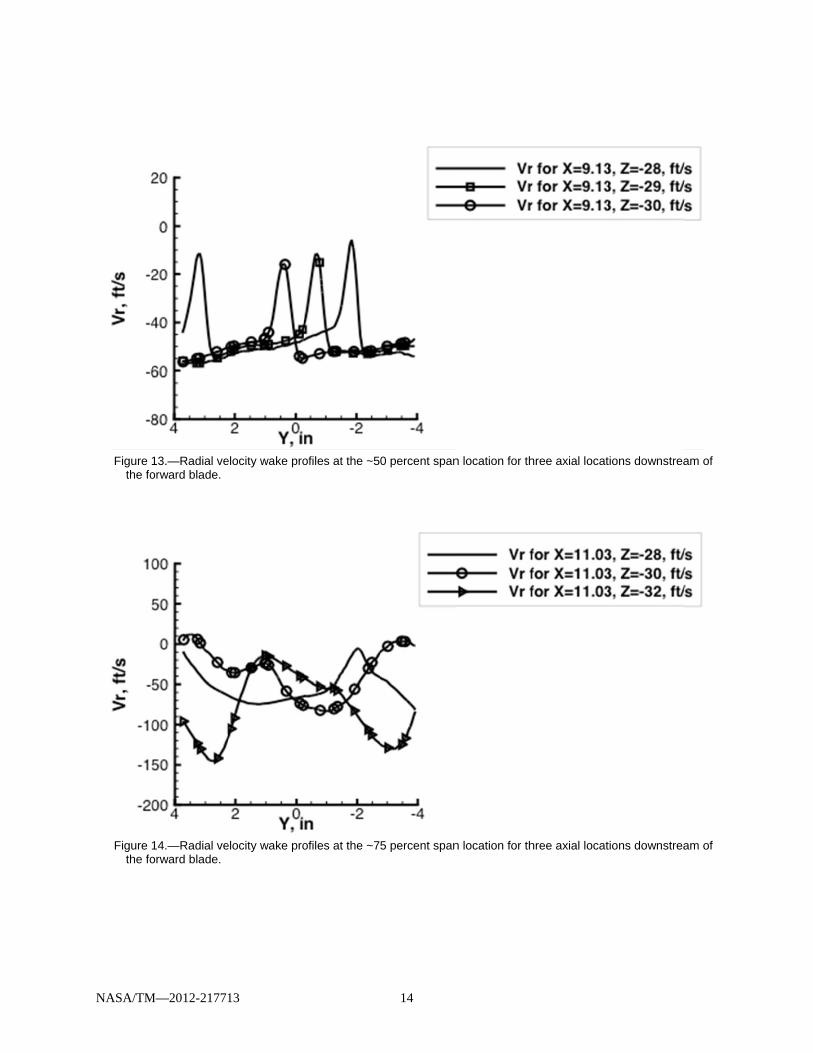
re extracted toe 10 shows theThe wake profthe best spatia3 in. The cartees 11 to 16 shol velocity. Thotor wake cleas a uniform ntive radial vel; a deficit in aprofiles in thevortex and th
igure 10.—Spamaintain the b
13
tion such as vdditional analyeveloped in thns. The curren current test c
h and turbulennd broadbandon of viscous ent of these eo show the que location of tfiles are not alal resolution. esian velocityow the wake e ~50 percent
early. The strenegative radialocity. The axaxial velocity e ~75 percent he velocity pro
atial location of best spatial res
vortex core sizysis is beyond
he 1980s withnt data has becampaign.
Wa
nce character d noise signatu
effects, presseffects is beyouality of the dthe extracted long a constaIn the PIV co
y componentsprofiles at thet span wake peamtube contral velocity. Th
xial and tangeand an increaspan location
ofiles do not s
wake velocity olution.
12
ze and circulad the scope of the intent of een used to va
ake Decay
of the forwarure of open rosure gradient ond the scope data set. wake profilesnt radius but oordinate syst have been trae two span loprofiles (X = 9raction causedhe outward m
ential velocityase in tangentns (X = 11.03show the clas
traces. Note th
ation can be df the current p
f developing aalidate the de
y
rd rotor wakesotors. Wake deffects and w of this paper
s and the orierather followtem the wakeansformed tocations in term9.13 in.), Figud by the thrus
migration of wy profiles showtial velocity w3 in.) are heavssical behavio
hese are along
determined frpaper. Furthea more robust esign philosop
s are key paradecay in turbowake stretchinr, however rep
entation of thew a PIV measue profiles are ao cylindrical. rms of axial, rures 11, 13, ast of the forw
wake fluid is rw the typical within the wakvily influenceor.
a constant X l
rom the PIV er analysis cou
model suitabphy used for t
ameters in theomachines is ng, Referencepresentative w
e PIV coordinurement planeat X = 9.13 in
radial and and 15, show
ward rotor is represented byturbomachineke region.
ed by the pres
ocation to
uld ble for the
e
es 12 wake
nate e to n. and
the
y a ery
ence
NASA/TM
Figure 11forward
Figure 12forward
M—2012-21771
.—Axial velocitd blade.
.—Axial velocitd blade.
13
ty wake profiles
ty wake profiles
s at the ~50 pe
s at the ~75 pe
13
ercent span loc
ercent span loc
cation for three
cation for three
axial locations
axial locations
s downstream o
s downstream o
of the
of the
NASA/TM
Figure the fo
Figure the fo
M—2012-21771
13.—Radial veorward blade.
14.—Radial veorward blade.
13
elocity wake pro
elocity wake pro
ofiles at the ~5
ofiles at the ~7
14
0 percent span
5 percent span
n location for th
n location for th
hree axial locat
hree axial locat
tions downstrea
tions downstrea
am of
am of
NASA/TM
Figure of the
Figure 1of the
M—2012-21771
15.—Tangentiae forward blade
6.—Tangentialforward blade.
13
al velocity wakee.
l velocity wake
e profiles at the
profiles at the
15
e ~50 percent s
~75 percent sp
span location f
pan location fo
for three axial l
or three axial lo
ocations down
ocations downs
stream
tream
NASA/TM—2012-217713 16
The PIV data could be analyzed further to determine the relative importance of the sometimes competing effects of viscous decay and wake stretching. The turbulence character of the wake could also be analyzed to help guide broadband noise assessments.
Summary
A high quality, three dimensional velocity data set for counterrotating open rotors has been analyzed for tip vortex trajectory and rotor wake velocity profile characteristics. The tip vortex trajectory shows a linear character with axial distance. This is substantially different than the hyperbolic character derived from helicopter rotor measurements in the 1980s. The forward rotor wake profiles show the classical turbomachinery wake character for the more inboard span locations. The wake velocity character is heavily influenced by the tip vortex at the outer span locations and does not exhibit a classical wake behavior.
The data set is of sufficient resolution and quality that further analysis is warranted to determine the vortex core diameter and wake turbulence characteristics.
References
1. Woodward,, Richard P. and Hughes, Christopher E., “Acoustic Performance of the GEAE UPS Research Fan in the NASA Glenn 9- by 15-Foot Low-Speed Wind Tunnel,” NASA/TM—2012-217450, May 2012.
2. Podboy, Gary G. and Krupar, Martin J., “Laser velocimeter measurements of the flow field generated by a forward-swept propfan during flutter,” NASA TM-106195, 1994
3. Woodward, R.P., Hall, D.G., Podboy, G.G., and Jeraki, R.J., “Takeoff/Approach Noise for a Model Counterrotation Propeller with a Forward-Swept Upstream Rotor,” AIAA-93-0596, presented at the 31st Aerospace Sciences Meeting & Exhibit, Reno, NV, January 11-14, 1993.
4. Soloff, S.M., Adrian, R.J., and Liu, Z-C, “Distortion Compensation for Generalized Stereoscopic Particle Image Velocimetry,” Measurement Science and Technology, Vol. 8, No. 12, pp. 1441-1454, 1997.
5. Bjorkquist, D.C., “Design and Calibration of a Stereoscopic PIV System,” Proc. 9th International Symposium on Applications of Laser Techniques to Fluid Mechanics, Vol. 1, pp. 6.5.1-6.5.8, Lisbon, Portugal, 1998.
6. Wernet, M. P., “Fuzzy Logic Enhanced Digital PIV Processing Software,” Proceedings of the 18th
International Congress on Instrumentation for Aerospace Simulation Facilities (ICIASF), Toulouse, France, June, 1999.
7. Gui, L., Werely, S.T., “A Correlation-Based Continuous Window-Shift Technique to Reduce The Peak-Locking Effect in Digital PIV Image Evaluation,” Exper. In Fluids, Vol. 32, pp. 506–517, 2002.
8. Westerweel, J., “Fundamentals of Digital Particle Image Velocimetry,” Meas. Sci. Technol., Vol. 8, pp. 1379-1392, 1997
9. Wernet, M.P., “Symmetric Phase Only Filtering: a New Paradigm for DPIV Data Processing,” Meas. Sci. Technology, Vol. 16, pp. 601-618, 2005.
10. Taylor, J.R., An Introduction to Error Analysis, University Science Books, Oxford University Press, Mill Valley, CA., 1982.
11. Majjigi, R.K., Uenishi, K. and Gliebe, P.R., “An Investigation of Counterrotating Tip Vortex Interaction,” NASA CR-185135, 1989.
12. Hill, P.G., Schaub, U.W., and Senoo, Y., “Turbulent Wakes in Pressure Gradients,” ASME Journal of Applied Mechanics, Vol. 85, pp. 518-524, 1963.
13. Kool, P. and Hirsch, Ch., “A Prediction Scheme for the Decay of a Turbomachine Blade Wake,” ASME Paper No. 82-GT-273, 1982.

REPORT DOCUMENTATION PAGE Form Approved OMB No. 0704-0188
The public reporting burden for this collection of information is estimated to average 1 hour per response, including the time for reviewing instructions, searching existing data sources, gathering and maintaining the data needed, and completing and reviewing the collection of information. Send comments regarding this burden estimate or any other aspect of this collection of information, including suggestions for reducing this burden, to Department of Defense, Washington Headquarters Services, Directorate for Information Operations and Reports (0704-0188), 1215 Jefferson Davis Highway, Suite 1204, Arlington, VA 22202-4302. Respondents should be aware that notwithstanding any other provision of law, no person shall be subject to any penalty for failing to comply with a collection of information if it does not display a currently valid OMB control number. PLEASE DO NOT RETURN YOUR FORM TO THE ABOVE ADDRESS.
1. REPORT DATE (DD-MM-YYYY) 01-10-2012
2. REPORT TYPE Technical Memorandum
3. DATES COVERED (From - To)
4. TITLE AND SUBTITLE Tip Vortex and Wake Characteristics of a Counterrotating Open Rotor
5a. CONTRACT NUMBER
5b. GRANT NUMBER
5c. PROGRAM ELEMENT NUMBER
6. AUTHOR(S) Van Zante, Dale, E.; Wernet, Mark, P.
5d. PROJECT NUMBER
5e. TASK NUMBER
5f. WORK UNIT NUMBER WBS 699959.02.09.03.05
7. PERFORMING ORGANIZATION NAME(S) AND ADDRESS(ES) National Aeronautics and Space Administration John H. Glenn Research Center at Lewis Field Cleveland, Ohio 44135-3191
8. PERFORMING ORGANIZATION REPORT NUMBER E-18418
9. SPONSORING/MONITORING AGENCY NAME(S) AND ADDRESS(ES) National Aeronautics and Space Administration Washington, DC 20546-0001
10. SPONSORING/MONITOR'S ACRONYM(S) NASA
11. SPONSORING/MONITORING REPORT NUMBER NASA/TM-2012-217713
12. DISTRIBUTION/AVAILABILITY STATEMENT Unclassified-Unlimited Subject Category: 07 Available electronically at http://www.sti.nasa.gov This publication is available from the NASA Center for AeroSpace Information, 443-757-5802
13. SUPPLEMENTARY NOTES
14. ABSTRACT One of the primary noise sources for Open Rotor systems is the interaction of the forward rotor tip vortex and blade wake with the aft rotor. NASA has collaborated with General Electric on the testing of a new generation of low noise, counterrotating Open Rotor systems. Three-dimensional particle image velocimetry measurements were acquired in the intra-rotor gap of the Historical Baseline blade set. The velocity measurements are of sufficient resolution to characterize the tip vortex size and trajectory as well as the rotor wake decay and turbulence character. The tip clearance vortex trajectory is compared to results from previously developed models. Forward rotor wake velocity profiles are shown. Results are presented in a form as to assist numerical modeling of Open Rotor system aerodynamics and acoustics.15. SUBJECT TERMS Aeroacoustics; Propeller noise; Noise reduction
16. SECURITY CLASSIFICATION OF: 17. LIMITATION OF ABSTRACT UU
18. NUMBER OF PAGES
24
19a. NAME OF RESPONSIBLE PERSON STI Help Desk (email:[email protected])
a. REPORT U
b. ABSTRACT U
c. THIS PAGE U
19b. TELEPHONE NUMBER (include area code) 443-757-5802
Standard Form 298 (Rev. 8-98)Prescribed by ANSI Std. Z39-18