Embed Size (px)
Citation preview

Title: Comparison of Intralaminar and Interlaminar Mode-I Fracture Toughness of Unidirectional IM7/8552 Graphite/Epoxy Composite
Authors: Michael W. Czabaj James G. Ratcliffe
ABSTRACT
The intralaminar and interlaminar mode-I fracture-toughness of a unidirectional IM7/8552 graphite/epoxy composite were measured using compact tension (CT) and double cantilever beam (DCB) test specimens, respectively. Two starter crack geometries were considered for both the CT and DCB specimen configurations. In the first case, starter cracks were produced by 12.5 µm thick, Teflon film inserts. In the second case, considerably sharper starter cracks were produced by fatigue precracking. For each specimen configuration, use of the Teflon film starter cracks resulted in initially unstable crack growth and artificially high initiation fracture-toughness values. Conversely, specimens with fatigue precracks exhibited stable growth onset and lower initiation fracture toughness. For CT and DCB specimens with fatigue precracks, the intralaminar and interlaminar initiation fracture toughnesses were approximately equal. However, during propagation, the CT specimens exhibited more extensive fiber bridging, and rapidly increasing R-curve behavior as compared to the DCB specimens. Observations of initiation and propagation of intralaminar and interlaminar fracture, and the measurements of fracture toughness, were supported by fractographic analysis using scanning electron microscopy.
Michael W. Czabaj, Durability, Damage Tolerance, and Reliability Branch, NASA Langley Research Center, Hampton, VA 23681
James G. Ratcliffe, National Institute of Aerospace, Hampton, VA, resident at Durability, Damage Tolerance, and Reliability Branch, NASA Langley Research Center, Hampton, VA 23681
INTRODUCTION
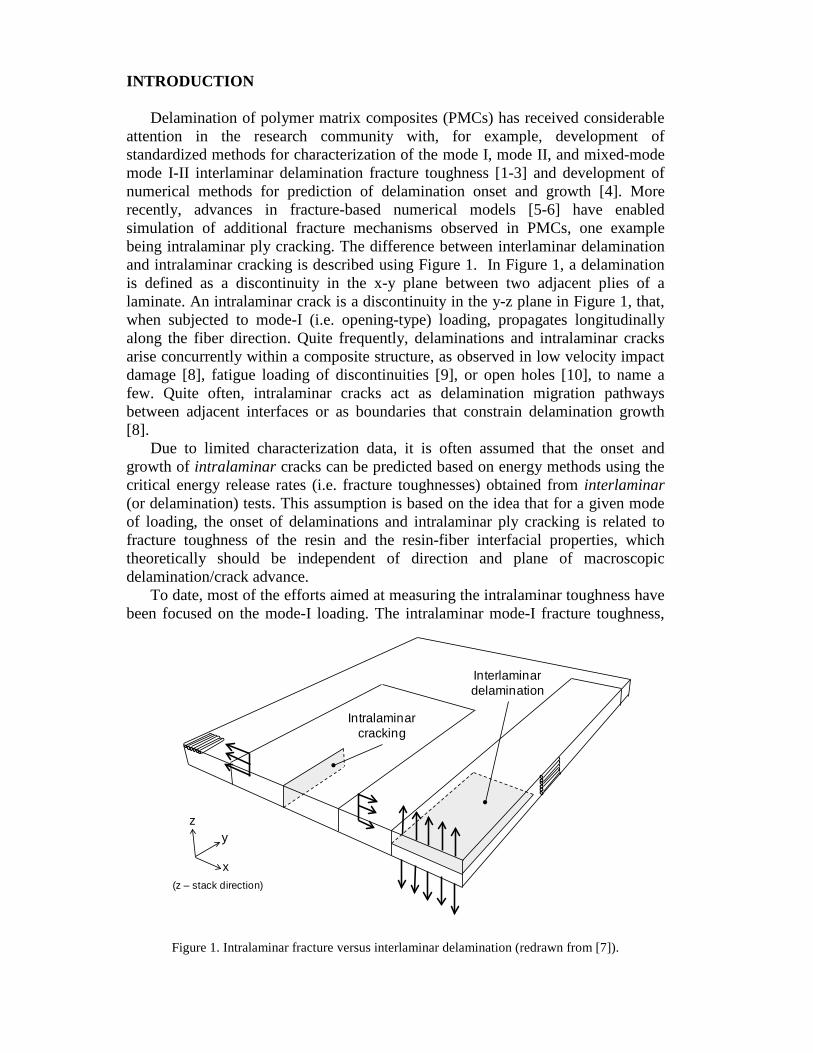
Delamination of polymer matrix composites (PMCs) has received considerable attention in the research community with, for example, development of standardized methods for characterization of the mode I, mode II, and mixed-mode mode I-II interlaminar delamination fracture toughness [1-3] and development of numerical methods for prediction of delamination onset and growth [4]. More recently, advances in fracture-based numerical models [5-6] have enabled simulation of additional fracture mechanisms observed in PMCs, one example being intralaminar ply cracking. The difference between interlaminar delamination and intralaminar cracking is described using Figure 1. In Figure 1, a delamination is defined as a discontinuity in the x-y plane between two adjacent plies of a laminate. An intralaminar crack is a discontinuity in the y-z plane in Figure 1, that, when subjected to mode-I (i.e. opening-type) loading, propagates longitudinally along the fiber direction. Quite frequently, delaminations and intralaminar cracks arise concurrently within a composite structure, as observed in low velocity impact damage [8], fatigue loading of discontinuities [9], or open holes [10], to name a few. Quite often, intralaminar cracks act as delamination migration pathways between adjacent interfaces or as boundaries that constrain delamination growth [8].
Due to limited characterization data, it is often assumed that the onset and growth of intralaminar cracks can be predicted based on energy methods using the critical energy release rates (i.e. fracture toughnesses) obtained from interlaminar (or delamination) tests. This assumption is based on the idea that for a given mode of loading, the onset of delaminations and intralaminar ply cracking is related to fracture toughness of the resin and the resin-fiber interfacial properties, which theoretically should be independent of direction and plane of macroscopic delamination/crack advance.
To date, most of the efforts aimed at measuring the intralaminar toughness have been focused on the mode-I loading. The intralaminar mode-I fracture toughness,
Figure 1. Intralaminar fracture versus interlaminar delamination (redrawn from [7]).
Interlaminar delamination
Intralaminarcracking
x
yz
(z – stack direction)
GIc-intra, has been measured for a number of unidirectional PMC systems including graphite/epoxies [12-26], glass/epoxies [12,15,27], and graphite/thermoplastics [7,28-31]. Several test geometries have been used, including the double cantilever beam (DCB) test [16,19,20-21,24,28-30], the compact tension (CT) test [12-14,17,22,25,27,31], the three-point bend (3PB) and four-point bend (4PB) tests [11,13-14,29], the mixed bending-tension (MBT) test [26], and the double-torsion test [15].
In most of the proposed tests, the intralaminar starter cracks have been created by means of mechanical notching of the composite using disk cutters [15,22,31,25], jeweler saw [14], broach-like tools [11,17], diamond-coated wires [13,19], and razor blades [16,20-21,23,28]. More recently, several attempts have been made at creating intralaminar starter cracks by pre-implanting thin Teflon films through the thickness of the laminate [23-24,26]. In [23], Teflon film was partially inserted through the thickness of the laminate to create transverse intralaminar starter cracks. In a number of studies, prior to toughness measurements, the machined or pre-implanted starter cracks were advanced 1-10 mm using static mode-I loading or wedging the specimens open in order to create precracks with fronts akin to naturally occurring cracks [16,20-21,24,28-30].
Computation of GIc-intra has been based on a number of different data reduction methods. Typically, GIc-intra was computed based on the change in the specimen’s compliance, C, with the crack length, a, using the following expression:
aC
bPG c
iIc ∂∂
=− 2
2
ntra (1)
where Pc is the critical force at the onset of fracture, and b is specimen width. To evaluate (1), functions relating specimen compliance to crack length, C(a), were determined experimentally [12,15,24-26]. This procedure is often referred to as compliance calibration (CC). Typically C(a) was expressed as a function of crack length alone; however, in several cases, the expressions for C(a) was augmented with additional constant parameters related to the experimentally measured elastic properties of the composite [16,20-21,28-30]. In several studies, particularly those employing the CT, three-point bend, and four-point bend test geometries, critical stress intensity factors (SIF), Kc, were computed and converted to fracture toughnesses using the fundamental equation Gc=Kc
2/E*, where E* is the experimentally determined effective modulus of the composite. The expressions for Kc were typically adopted from analytical expressions derived for the standardized testing of metallic articles [11,14,22-23,28]. In some cases, finite element (FE) analysis was used to compute Kc at the onset of crack initiation [22,27]. In another example, fracture toughness was computed using a J-integral-type approach [19].
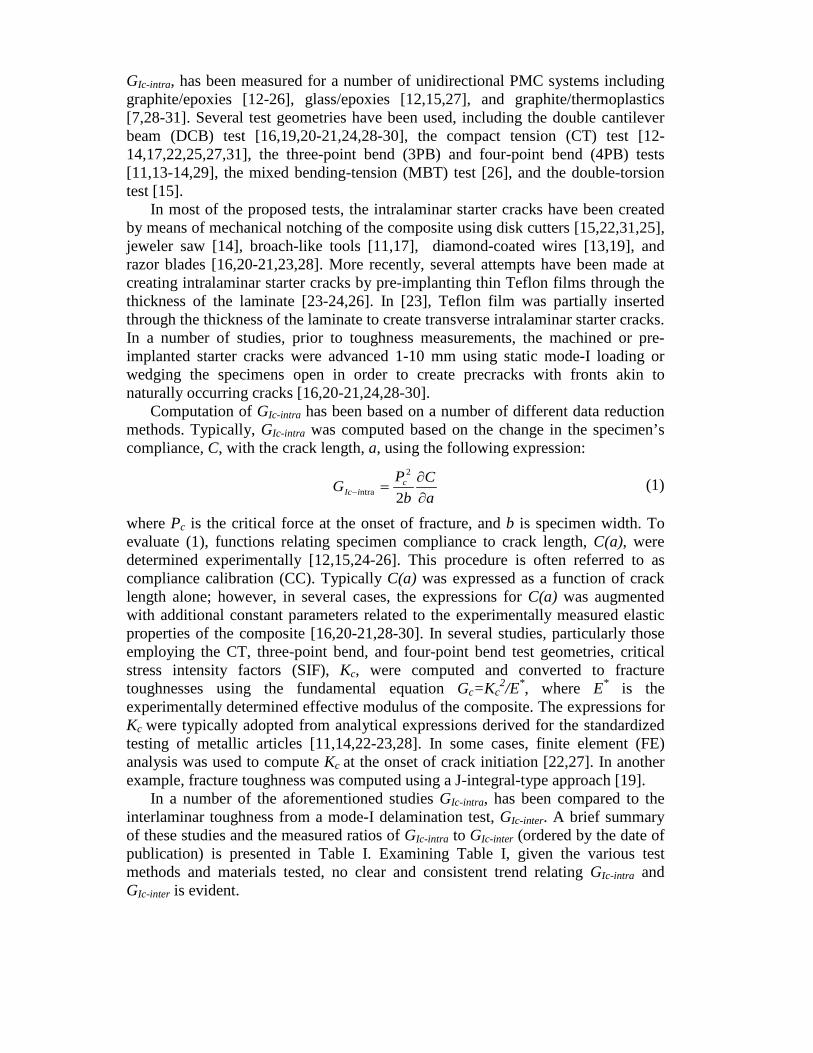
In a number of the aforementioned studies GIc-intra, has been compared to the interlaminar toughness from a mode-I delamination test, GIc-inter. A brief summary of these studies and the measured ratios of GIc-intra to GIc-inter (ordered by the date of publication) is presented in Table I. Examining Table I, given the various test methods and materials tested, no clear and consistent trend relating GIc-intra and GIc-inter is evident.
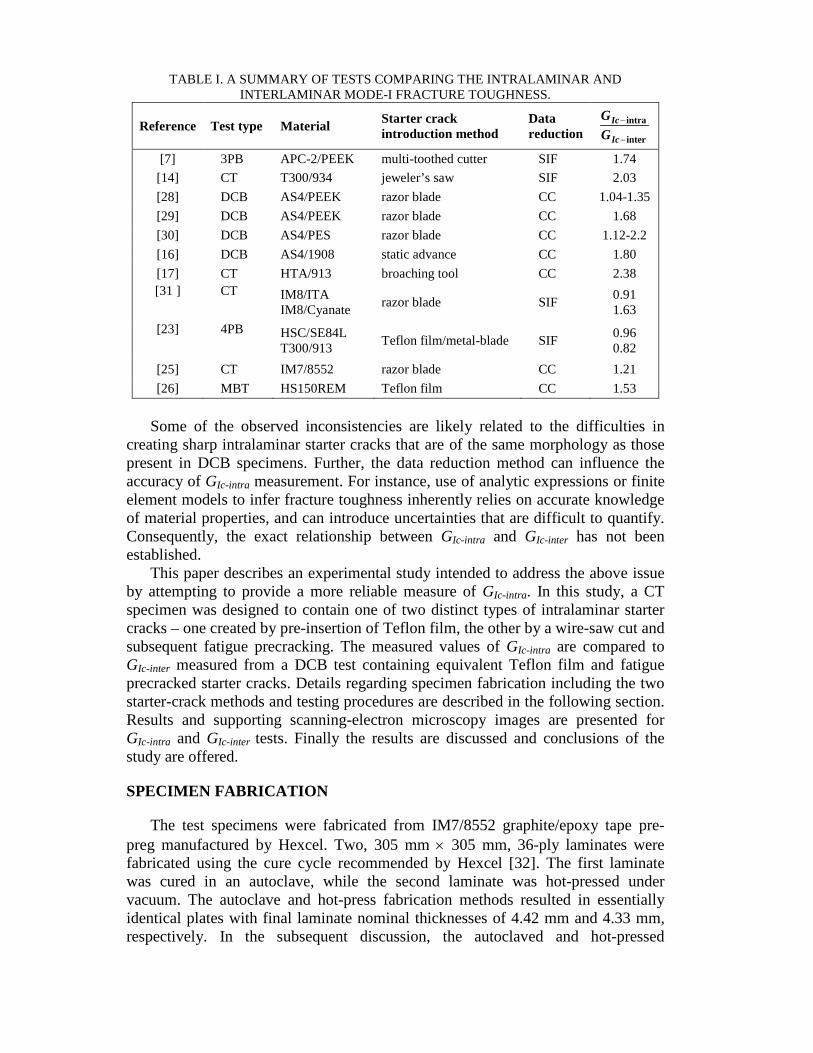
TABLE I. A SUMMARY OF TESTS COMPARING THE INTRALAMINAR AND INTERLAMINAR MODE-I FRACTURE TOUGHNESS.
Reference Test type Material Starter crack introduction method
Data reduction inter
intra
−
−
Ic
Ic
GG
[7] 3PB APC-2/PEEK multi-toothed cutter SIF 1.74 [14] CT T300/934 jeweler’s saw SIF 2.03 [28] DCB AS4/PEEK razor blade CC 1.04-1.35 [29] DCB AS4/PEEK razor blade CC 1.68 [30] DCB AS4/PES razor blade CC 1.12-2.2 [16] DCB AS4/1908 static advance CC 1.80 [17] CT HTA/913 broaching tool CC 2.38 [31 ] CT IM8/ITA
IM8/Cyanate razor blade SIF 0.91 1.63
[23] 4PB HSC/SE84L T300/913 Teflon film/metal-blade SIF 0.96
0.82 [25] CT IM7/8552 razor blade CC 1.21 [26] MBT HS150REM Teflon film CC 1.53
Some of the observed inconsistencies are likely related to the difficulties in
creating sharp intralaminar starter cracks that are of the same morphology as those present in DCB specimens. Further, the data reduction method can influence the accuracy of GIc-intra measurement. For instance, use of analytic expressions or finite element models to infer fracture toughness inherently relies on accurate knowledge of material properties, and can introduce uncertainties that are difficult to quantify. Consequently, the exact relationship between GIc-intra and GIc-inter has not been established.
This paper describes an experimental study intended to address the above issue by attempting to provide a more reliable measure of GIc-intra. In this study, a CT specimen was designed to contain one of two distinct types of intralaminar starter cracks – one created by pre-insertion of Teflon film, the other by a wire-saw cut and subsequent fatigue precracking. The measured values of GIc-intra are compared to GIc-inter measured from a DCB test containing equivalent Teflon film and fatigue precracked starter cracks. Details regarding specimen fabrication including the two starter-crack methods and testing procedures are described in the following section. Results and supporting scanning-electron microscopy images are presented for GIc-intra and GIc-inter tests. Finally the results are discussed and conclusions of the study are offered.
SPECIMEN FABRICATION
The test specimens were fabricated from IM7/8552 graphite/epoxy tape pre-preg manufactured by Hexcel. Two, 305 mm × 305 mm, 36-ply laminates were fabricated using the cure cycle recommended by Hexcel [32]. The first laminate was cured in an autoclave, while the second laminate was hot-pressed under vacuum. The autoclave and hot-press fabrication methods resulted in essentially identical plates with final laminate nominal thicknesses of 4.42 mm and 4.33 mm, respectively. In the subsequent discussion, the autoclaved and hot-pressed
specimens will be designated with an initial number of “1” and “2”, respectively (e.g. 2-CT-5 indicates the fifth CT specimen from the hot-pressed laminate).
GIc-intra was measured using the CT specimens, while GIc-inter was measured using the DCB specimens. To remove any uncertainties arising from fabrication of specimens from different laminates, a laminate layup was developed that allowed for fabrication of CT and DCB specimens from the same plate. A typical plate layout including the adopted numbering scheme is depicted in Figure 2. Typically, a single 305 mm × 305 mm laminate produced eight CT specimens and approximately ten-to-eleven, 25.4 mm wide, DCB specimens. During layup, a 76.2 mm × 305 mm, 12.5 µm thick Teflon insert (gray region in Fig. 2) was placed in the mid-plane of the laminate to create the interlaminar starter crack.
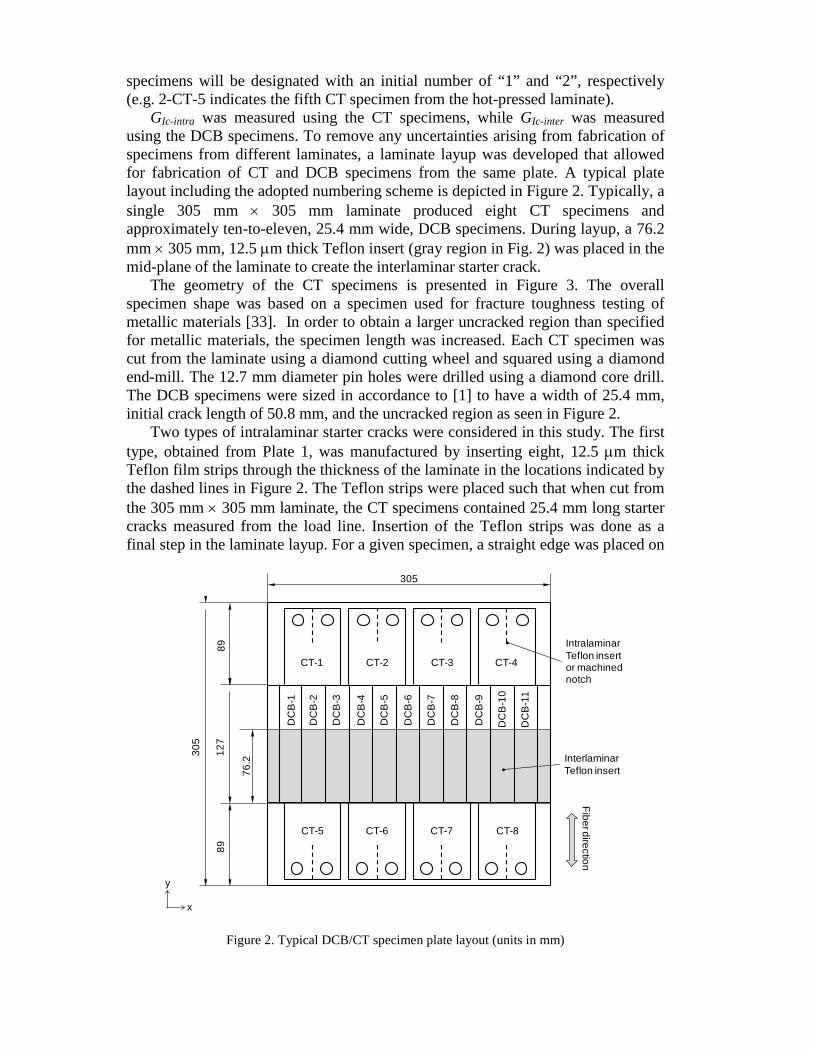
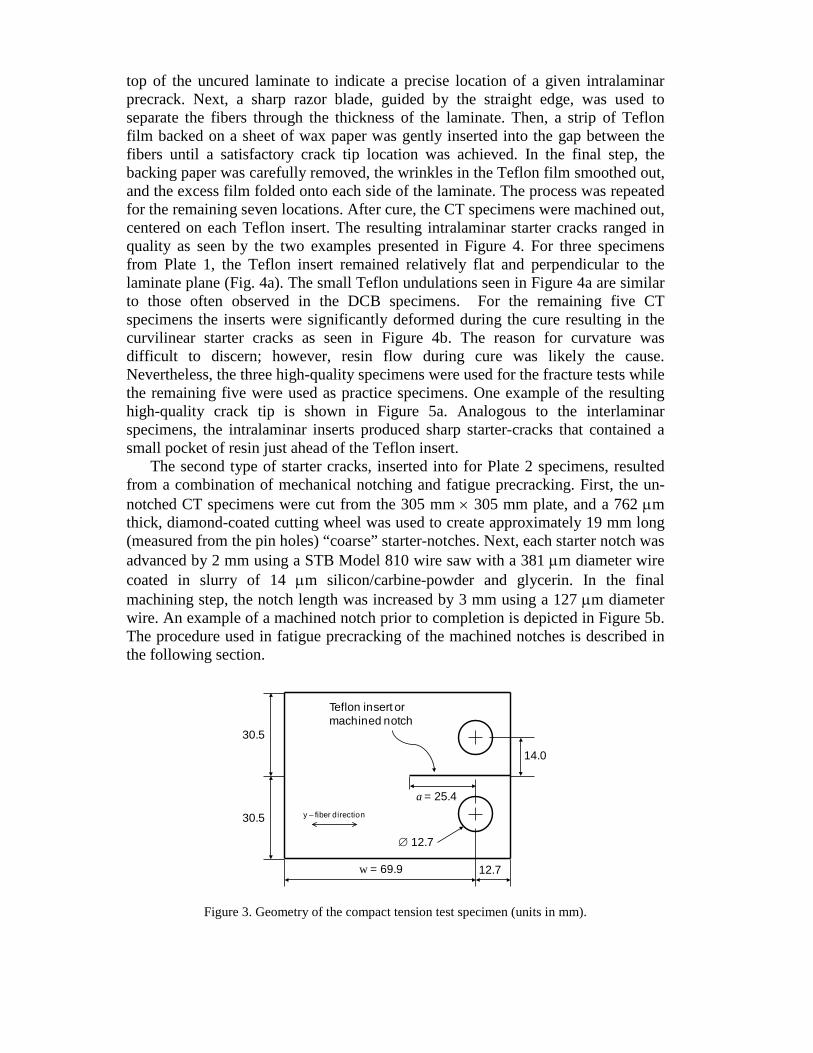
The geometry of the CT specimens is presented in Figure 3. The overall specimen shape was based on a specimen used for fracture toughness testing of metallic materials [33]. In order to obtain a larger uncracked region than specified for metallic materials, the specimen length was increased. Each CT specimen was cut from the laminate using a diamond cutting wheel and squared using a diamond end-mill. The 12.7 mm diameter pin holes were drilled using a diamond core drill. The DCB specimens were sized in accordance to [1] to have a width of 25.4 mm, initial crack length of 50.8 mm, and the uncracked region as seen in Figure 2.
Two types of intralaminar starter cracks were considered in this study. The first type, obtained from Plate 1, was manufactured by inserting eight, 12.5 µm thick Teflon film strips through the thickness of the laminate in the locations indicated by the dashed lines in Figure 2. The Teflon strips were placed such that when cut from the 305 mm × 305 mm laminate, the CT specimens contained 25.4 mm long starter cracks measured from the load line. Insertion of the Teflon strips was done as a final step in the laminate layup. For a given specimen, a straight edge was placed on
Figure 2. Typical DCB/CT specimen plate layout (units in mm)
CT-1 CT-2 CT-3 CT-4
CT-5 CT-6 CT-7 CT-8
DC
B-1
DC
B-2
DC
B-3
DC
B-4
DC
B-5
DC
B-6
DC
B-7
DC
B-8
DC
B-9
DC
B-1
0
DC
B-1
1
InterlaminarTeflon insert
IntralaminarTeflon insert or machined notch
305
127
8989
76.2
305
Fiber direction
x
y
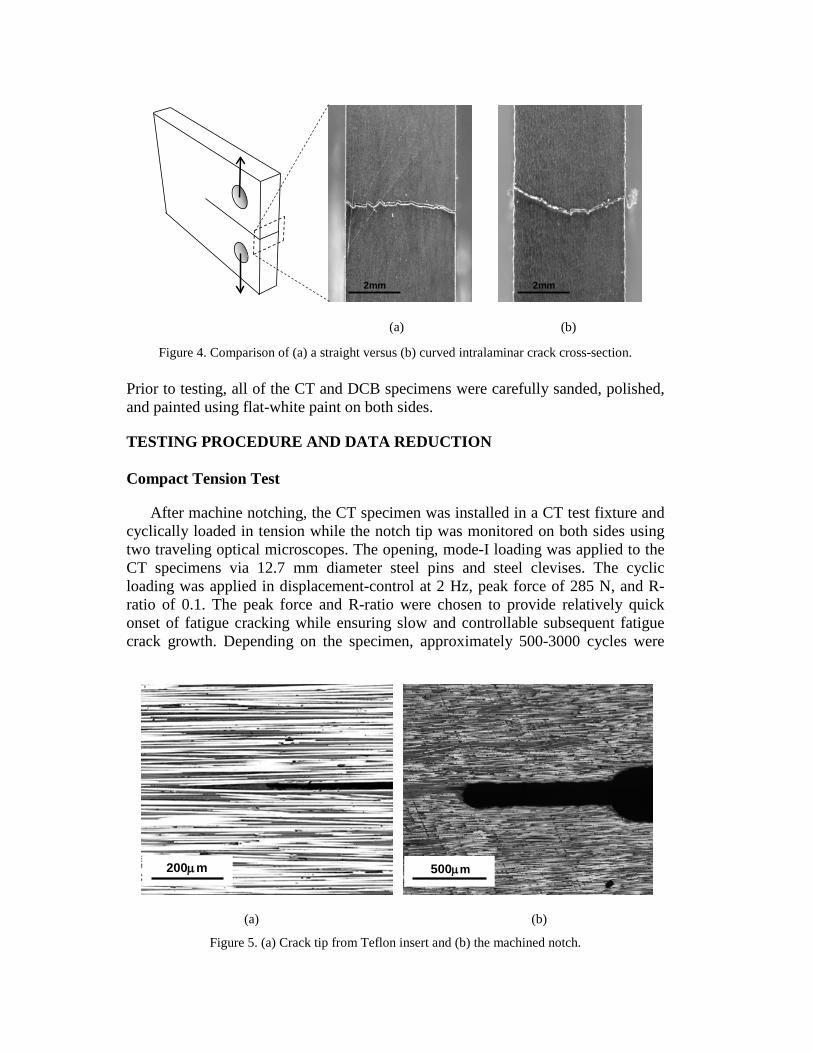
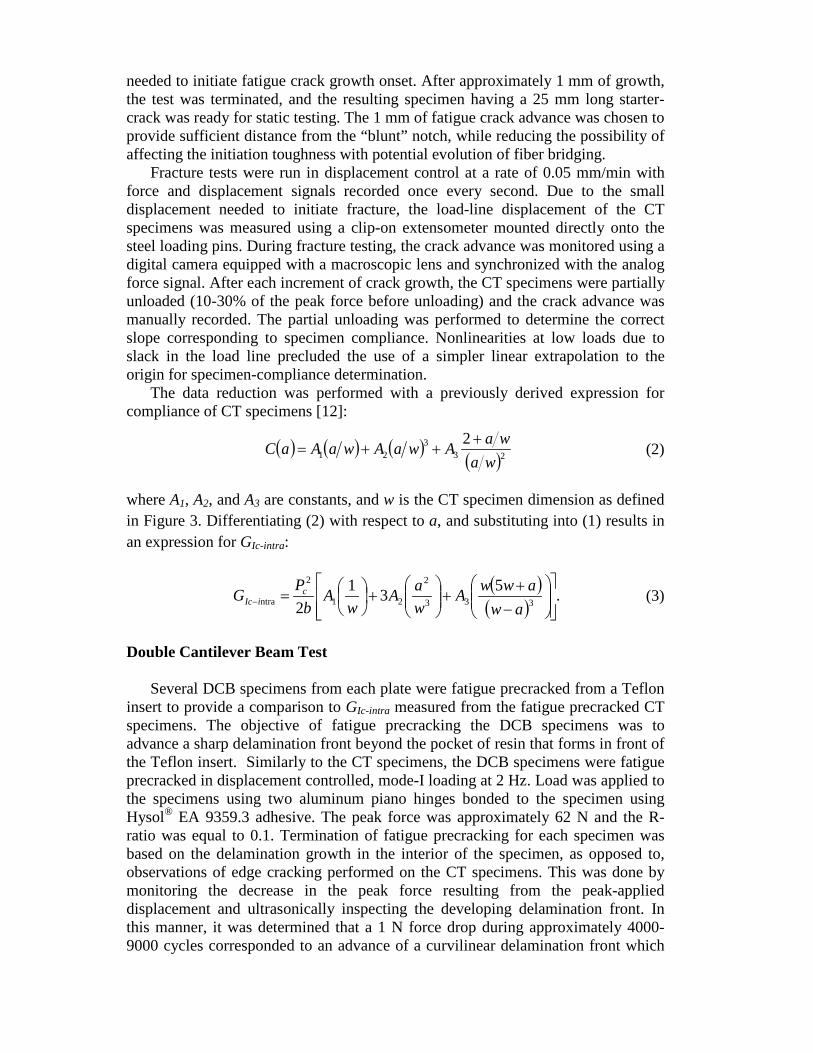
top of the uncured laminate to indicate a precise location of a given intralaminar precrack. Next, a sharp razor blade, guided by the straight edge, was used to separate the fibers through the thickness of the laminate. Then, a strip of Teflon film backed on a sheet of wax paper was gently inserted into the gap between the fibers until a satisfactory crack tip location was achieved. In the final step, the backing paper was carefully removed, the wrinkles in the Teflon film smoothed out, and the excess film folded onto each side of the laminate. The process was repeated for the remaining seven locations. After cure, the CT specimens were machined out, centered on each Teflon insert. The resulting intralaminar starter cracks ranged in quality as seen by the two examples presented in Figure 4. For three specimens from Plate 1, the Teflon insert remained relatively flat and perpendicular to the laminate plane (Fig. 4a). The small Teflon undulations seen in Figure 4a are similar to those often observed in the DCB specimens. For the remaining five CT specimens the inserts were significantly deformed during the cure resulting in the curvilinear starter cracks as seen in Figure 4b. The reason for curvature was difficult to discern; however, resin flow during cure was likely the cause. Nevertheless, the three high-quality specimens were used for the fracture tests while the remaining five were used as practice specimens. One example of the resulting high-quality crack tip is shown in Figure 5a. Analogous to the interlaminar specimens, the intralaminar inserts produced sharp starter-cracks that contained a small pocket of resin just ahead of the Teflon insert.
The second type of starter cracks, inserted into for Plate 2 specimens, resulted from a combination of mechanical notching and fatigue precracking. First, the un-notched CT specimens were cut from the 305 mm × 305 mm plate, and a 762 µm thick, diamond-coated cutting wheel was used to create approximately 19 mm long (measured from the pin holes) “coarse” starter-notches. Next, each starter notch was advanced by 2 mm using a STB Model 810 wire saw with a 381 µm diameter wire coated in slurry of 14 µm silicon/carbine-powder and glycerin. In the final machining step, the notch length was increased by 3 mm using a 127 µm diameter wire. An example of a machined notch prior to completion is depicted in Figure 5b. The procedure used in fatigue precracking of the machined notches is described in the following section.
Figure 3. Geometry of the compact tension test specimen (units in mm).
30.5
w = 69.9 12.7
14.0
a = 25.4
∅ 12.7
Teflon insert or machined notch
30.5 y – fiber direction
Prior to testing, all of the CT and DCB specimens were carefully sanded, polished, and painted using flat-white paint on both sides.
TESTING PROCEDURE AND DATA REDUCTION
Compact Tension Test
After machine notching, the CT specimen was installed in a CT test fixture and cyclically loaded in tension while the notch tip was monitored on both sides using two traveling optical microscopes. The opening, mode-I loading was applied to the CT specimens via 12.7 mm diameter steel pins and steel clevises. The cyclic loading was applied in displacement-control at 2 Hz, peak force of 285 N, and R-ratio of 0.1. The peak force and R-ratio were chosen to provide relatively quick onset of fatigue cracking while ensuring slow and controllable subsequent fatigue crack growth. Depending on the specimen, approximately 500-3000 cycles were
(a) (b)
Figure 5. (a) Crack tip from Teflon insert and (b) the machined notch.
200µm 500µm
(a) (b)
Figure 4. Comparison of (a) a straight versus (b) curved intralaminar crack cross-section.
2mm 2mm
needed to initiate fatigue crack growth onset. After approximately 1 mm of growth, the test was terminated, and the resulting specimen having a 25 mm long starter-crack was ready for static testing. The 1 mm of fatigue crack advance was chosen to provide sufficient distance from the “blunt” notch, while reducing the possibility of affecting the initiation toughness with potential evolution of fiber bridging.
Fracture tests were run in displacement control at a rate of 0.05 mm/min with force and displacement signals recorded once every second. Due to the small displacement needed to initiate fracture, the load-line displacement of the CT specimens was measured using a clip-on extensometer mounted directly onto the steel loading pins. During fracture testing, the crack advance was monitored using a digital camera equipped with a macroscopic lens and synchronized with the analog force signal. After each increment of crack growth, the CT specimens were partially unloaded (10-30% of the peak force before unloading) and the crack advance was manually recorded. The partial unloading was performed to determine the correct slope corresponding to specimen compliance. Nonlinearities at low loads due to slack in the load line precluded the use of a simpler linear extrapolation to the origin for specimen-compliance determination.
The data reduction was performed with a previously derived expression for compliance of CT specimens [12]:
( ) ( ) ( )( )23
321
2wa
waAwaAwaAaC +++= (2)
where A1, A2, and A3 are constants, and w is the CT specimen dimension as defined in Figure 3. Differentiating (2) with respect to a, and substituting into (1) results in an expression for GIc-intra:
( )( )
.5312 333
2
21
2
ntra
−+
+
+
=− aw
awwAwaA
wA
bPG c
iIc (3)
Double Cantilever Beam Test
Several DCB specimens from each plate were fatigue precracked from a Teflon insert to provide a comparison to GIc-intra measured from the fatigue precracked CT specimens. The objective of fatigue precracking the DCB specimens was to advance a sharp delamination front beyond the pocket of resin that forms in front of the Teflon insert. Similarly to the CT specimens, the DCB specimens were fatigue precracked in displacement controlled, mode-I loading at 2 Hz. Load was applied to the specimens using two aluminum piano hinges bonded to the specimen using Hysol® EA 9359.3 adhesive. The peak force was approximately 62 N and the R-ratio was equal to 0.1. Termination of fatigue precracking for each specimen was based on the delamination growth in the interior of the specimen, as opposed to, observations of edge cracking performed on the CT specimens. This was done by monitoring the decrease in the peak force resulting from the peak-applied displacement and ultrasonically inspecting the developing delamination front. In this manner, it was determined that a 1 N force drop during approximately 4000-9000 cycles corresponded to an advance of a curvilinear delamination front which
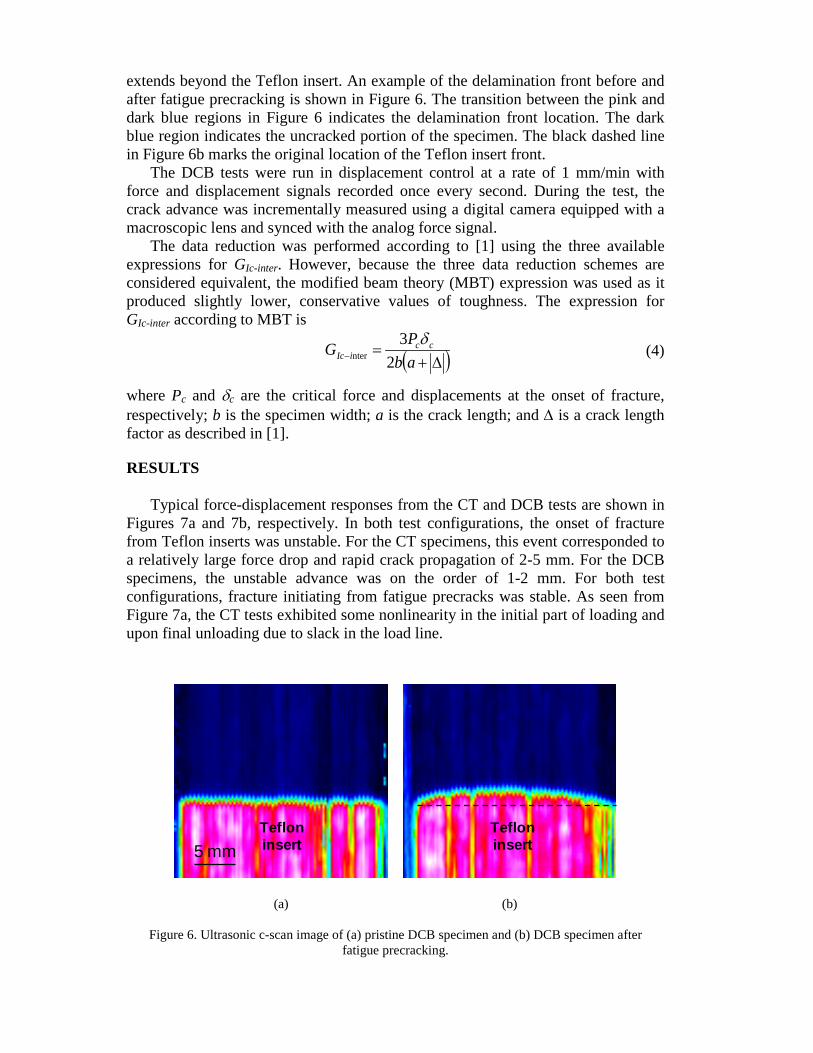
extends beyond the Teflon insert. An example of the delamination front before and after fatigue precracking is shown in Figure 6. The transition between the pink and dark blue regions in Figure 6 indicates the delamination front location. The dark blue region indicates the uncracked portion of the specimen. The black dashed line in Figure 6b marks the original location of the Teflon insert front.
The DCB tests were run in displacement control at a rate of 1 mm/min with force and displacement signals recorded once every second. During the test, the crack advance was incrementally measured using a digital camera equipped with a macroscopic lens and synced with the analog force signal.
The data reduction was performed according to [1] using the three available expressions for GIc-inter. However, because the three data reduction schemes are considered equivalent, the modified beam theory (MBT) expression was used as it produced slightly lower, conservative values of toughness. The expression for GIc-inter according to MBT is
( )∆+=− ab
PG cciIc 2
3nter
δ (4)
where Pc and δc are the critical force and displacements at the onset of fracture, respectively; b is the specimen width; a is the crack length; and ∆ is a crack length factor as described in [1].
RESULTS
Typical force-displacement responses from the CT and DCB tests are shown in Figures 7a and 7b, respectively. In both test configurations, the onset of fracture from Teflon inserts was unstable. For the CT specimens, this event corresponded to a relatively large force drop and rapid crack propagation of 2-5 mm. For the DCB specimens, the unstable advance was on the order of 1-2 mm. For both test configurations, fracture initiating from fatigue precracks was stable. As seen from Figure 7a, the CT tests exhibited some nonlinearity in the initial part of loading and upon final unloading due to slack in the load line.
(a) (b)
Figure 6. Ultrasonic c-scan image of (a) pristine DCB specimen and (b) DCB specimen after fatigue precracking.
5 mmTeflon insert
Teflon insert
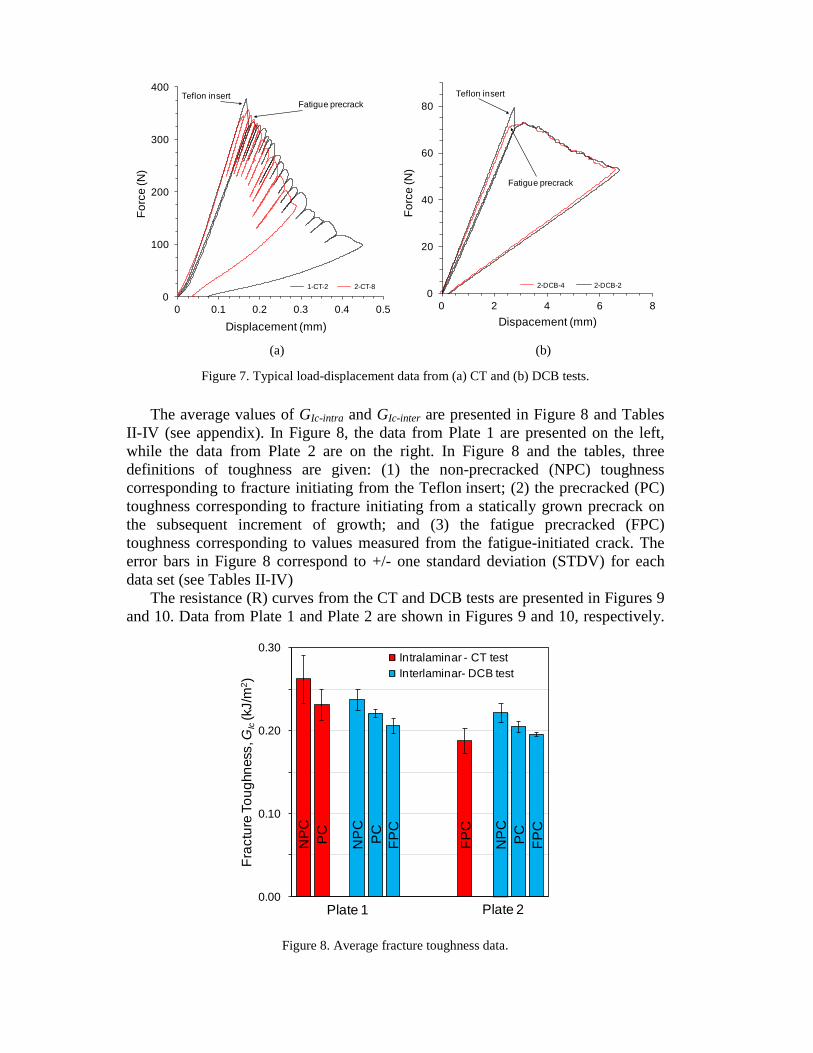
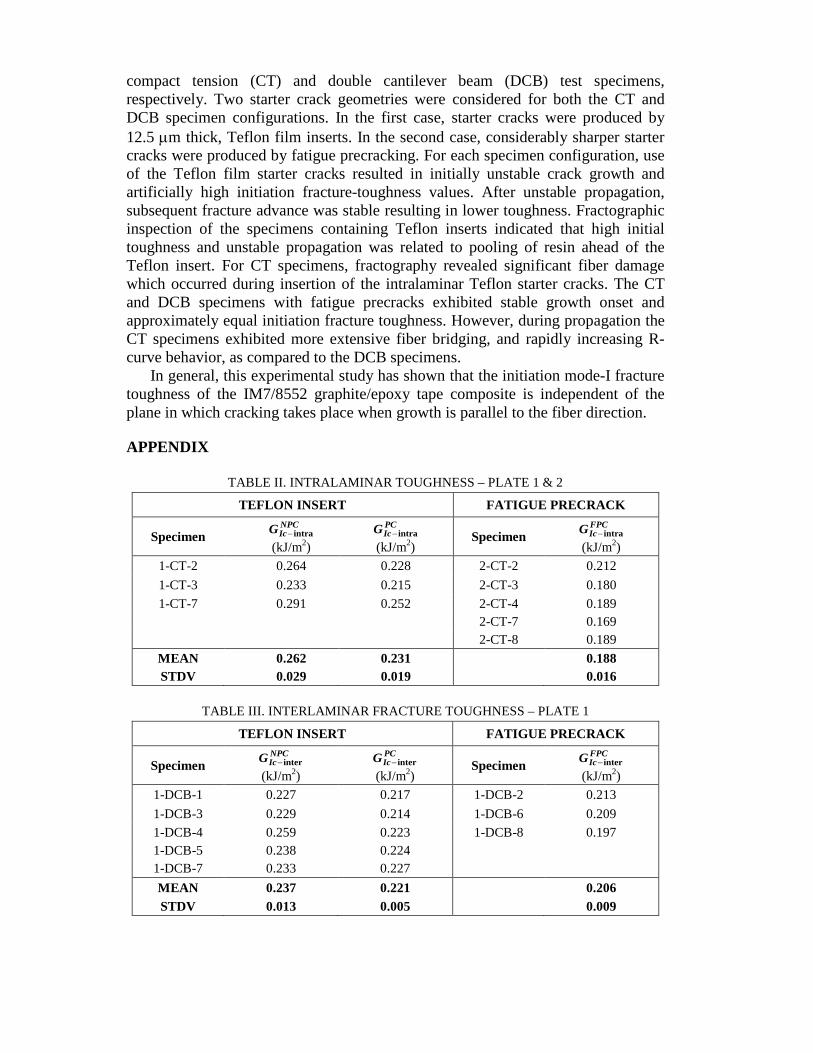
The average values of GIc-intra and GIc-inter are presented in Figure 8 and Tables II-IV (see appendix). In Figure 8, the data from Plate 1 are presented on the left, while the data from Plate 2 are on the right. In Figure 8 and the tables, three definitions of toughness are given: (1) the non-precracked (NPC) toughness corresponding to fracture initiating from the Teflon insert; (2) the precracked (PC) toughness corresponding to fracture initiating from a statically grown precrack on the subsequent increment of growth; and (3) the fatigue precracked (FPC) toughness corresponding to values measured from the fatigue-initiated crack. The error bars in Figure 8 correspond to +/- one standard deviation (STDV) for each data set (see Tables II-IV)
The resistance (R) curves from the CT and DCB tests are presented in Figures 9 and 10. Data from Plate 1 and Plate 2 are shown in Figures 9 and 10, respectively.
(a) (b)
Figure 7. Typical load-displacement data from (a) CT and (b) DCB tests.
0
100
200
300
400
0 0.1 0.2 0.3 0.4 0.5
Forc
e (N
)
Displacement (mm)
1-CT-2 2-CT-8
Teflon insertFatigue precrack
0
20
40
60
80
0 2 4 6 8
Forc
e (N
)
Dispacement (mm)
2-DCB-4 2-DCB-2
Teflon insert
Fatigue precrack
Figure 8. Average fracture toughness data.
0.00
0.10
0.20
0.30
Frac
ture
Tou
ghne
ss, G
Ic(k
J/m
2 )
Intralaminar - CT testInterlaminar- DCB test
Plate 1 Plate 2
NP
CP
C PC
NP
C
FPC
FPC
PC
NP
C
FPC
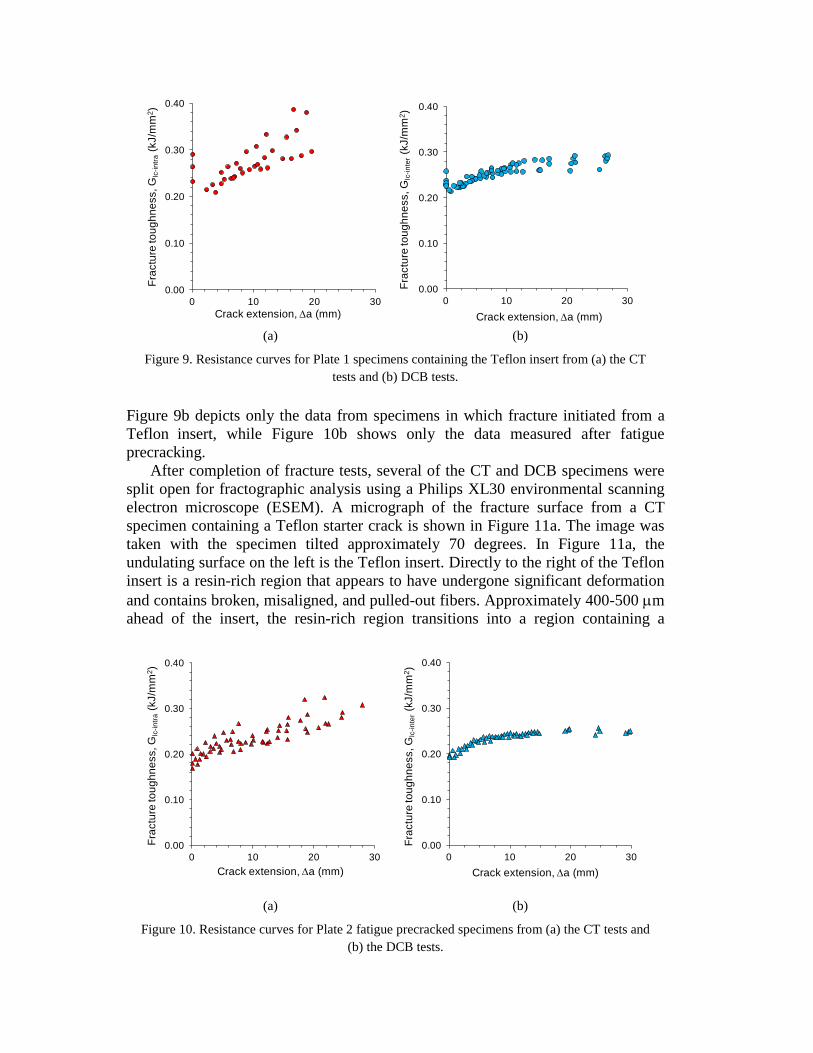
Figure 9b depicts only the data from specimens in which fracture initiated from a Teflon insert, while Figure 10b shows only the data measured after fatigue precracking.
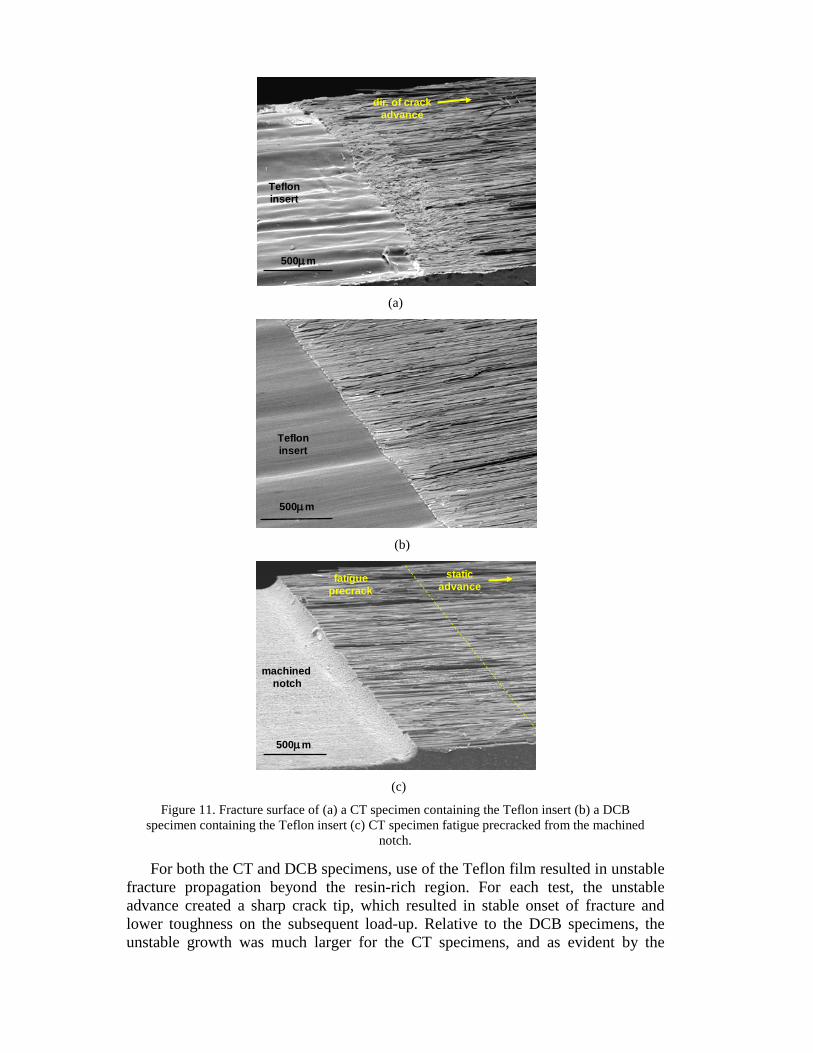
After completion of fracture tests, several of the CT and DCB specimens were split open for fractographic analysis using a Philips XL30 environmental scanning electron microscope (ESEM). A micrograph of the fracture surface from a CT specimen containing a Teflon starter crack is shown in Figure 11a. The image was taken with the specimen tilted approximately 70 degrees. In Figure 11a, the undulating surface on the left is the Teflon insert. Directly to the right of the Teflon insert is a resin-rich region that appears to have undergone significant deformation and contains broken, misaligned, and pulled-out fibers. Approximately 400-500 µm ahead of the insert, the resin-rich region transitions into a region containing a
(a) (b)
Figure 9. Resistance curves for Plate 1 specimens containing the Teflon insert from (a) the CT tests and (b) DCB tests.
0.00
0.10
0.20
0.30
0.40
0 10 20 30
Frac
ture
toug
hnes
s, G
Ic-in
tra(k
J/m
m2 )
Crack extension, ∆a (mm)
0.00
0.10
0.20
0.30
0.40
0 10 20 30
Frac
ture
toug
hnes
s, G
Ic-in
ter(k
J/m
m2 )
Crack extension, ∆a (mm)
(a) (b)
Figure 10. Resistance curves for Plate 2 fatigue precracked specimens from (a) the CT tests and (b) the DCB tests.
0.00
0.10
0.20
0.30
0.40
0 10 20 30
Frac
ture
toug
hnes
s, G
Ic-in
tra(k
J/m
m2 )
Crack extension, ∆a (mm)
0.00
0.10
0.20
0.30
0.40
0 10 20 30
Frac
ture
toug
hnes
s, G
Ic-in
ter(k
J/m
m2 )
Crack extension, ∆a (mm)
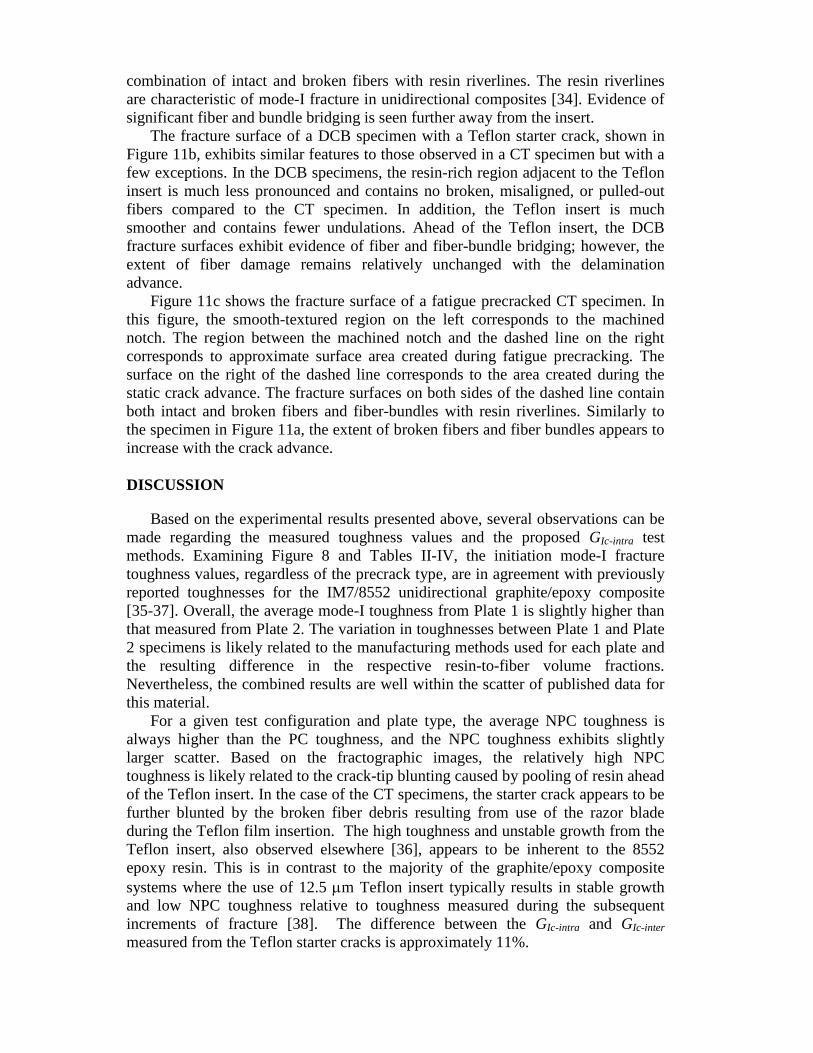
combination of intact and broken fibers with resin riverlines. The resin riverlines are characteristic of mode-I fracture in unidirectional composites [34]. Evidence of significant fiber and bundle bridging is seen further away from the insert.
The fracture surface of a DCB specimen with a Teflon starter crack, shown in Figure 11b, exhibits similar features to those observed in a CT specimen but with a few exceptions. In the DCB specimens, the resin-rich region adjacent to the Teflon insert is much less pronounced and contains no broken, misaligned, or pulled-out fibers compared to the CT specimen. In addition, the Teflon insert is much smoother and contains fewer undulations. Ahead of the Teflon insert, the DCB fracture surfaces exhibit evidence of fiber and fiber-bundle bridging; however, the extent of fiber damage remains relatively unchanged with the delamination advance.
Figure 11c shows the fracture surface of a fatigue precracked CT specimen. In this figure, the smooth-textured region on the left corresponds to the machined notch. The region between the machined notch and the dashed line on the right corresponds to approximate surface area created during fatigue precracking. The surface on the right of the dashed line corresponds to the area created during the static crack advance. The fracture surfaces on both sides of the dashed line contain both intact and broken fibers and fiber-bundles with resin riverlines. Similarly to the specimen in Figure 11a, the extent of broken fibers and fiber bundles appears to increase with the crack advance.
DISCUSSION
Based on the experimental results presented above, several observations can be made regarding the measured toughness values and the proposed GIc-intra test methods. Examining Figure 8 and Tables II-IV, the initiation mode-I fracture toughness values, regardless of the precrack type, are in agreement with previously reported toughnesses for the IM7/8552 unidirectional graphite/epoxy composite [35-37]. Overall, the average mode-I toughness from Plate 1 is slightly higher than that measured from Plate 2. The variation in toughnesses between Plate 1 and Plate 2 specimens is likely related to the manufacturing methods used for each plate and the resulting difference in the respective resin-to-fiber volume fractions. Nevertheless, the combined results are well within the scatter of published data for this material.
For a given test configuration and plate type, the average NPC toughness is always higher than the PC toughness, and the NPC toughness exhibits slightly larger scatter. Based on the fractographic images, the relatively high NPC toughness is likely related to the crack-tip blunting caused by pooling of resin ahead of the Teflon insert. In the case of the CT specimens, the starter crack appears to be further blunted by the broken fiber debris resulting from use of the razor blade during the Teflon film insertion. The high toughness and unstable growth from the Teflon insert, also observed elsewhere [36], appears to be inherent to the 8552 epoxy resin. This is in contrast to the majority of the graphite/epoxy composite systems where the use of 12.5 µm Teflon insert typically results in stable growth and low NPC toughness relative to toughness measured during the subsequent increments of fracture [38]. The difference between the GIc-intra and GIc-inter measured from the Teflon starter cracks is approximately 11%.
For both the CT and DCB specimens, use of the Teflon film resulted in unstable fracture propagation beyond the resin-rich region. For each test, the unstable advance created a sharp crack tip, which resulted in stable onset of fracture and lower toughness on the subsequent load-up. Relative to the DCB specimens, the unstable growth was much larger for the CT specimens, and as evident by the
(a)
(b)
(c)
Figure 11. Fracture surface of (a) a CT specimen containing the Teflon insert (b) a DCB specimen containing the Teflon insert (c) CT specimen fatigue precracked from the machined
notch.
500µm
Teflon insert
dir. of crack advance
500µm
Teflon insert
500µm
machinednotch
static advance
fatigue precrack
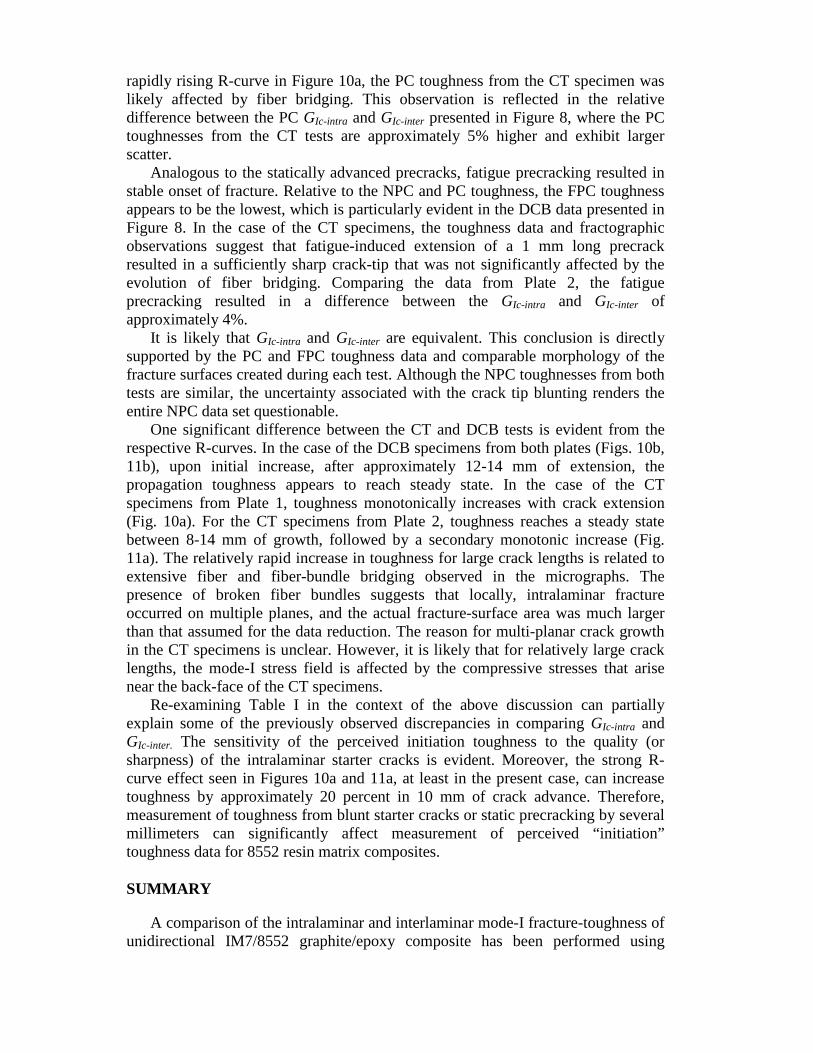
rapidly rising R-curve in Figure 10a, the PC toughness from the CT specimen was likely affected by fiber bridging. This observation is reflected in the relative difference between the PC GIc-intra and GIc-inter presented in Figure 8, where the PC toughnesses from the CT tests are approximately 5% higher and exhibit larger scatter.
Analogous to the statically advanced precracks, fatigue precracking resulted in stable onset of fracture. Relative to the NPC and PC toughness, the FPC toughness appears to be the lowest, which is particularly evident in the DCB data presented in Figure 8. In the case of the CT specimens, the toughness data and fractographic observations suggest that fatigue-induced extension of a 1 mm long precrack resulted in a sufficiently sharp crack-tip that was not significantly affected by the evolution of fiber bridging. Comparing the data from Plate 2, the fatigue precracking resulted in a difference between the GIc-intra and GIc-inter of approximately 4%.
It is likely that GIc-intra and GIc-inter are equivalent. This conclusion is directly supported by the PC and FPC toughness data and comparable morphology of the fracture surfaces created during each test. Although the NPC toughnesses from both tests are similar, the uncertainty associated with the crack tip blunting renders the entire NPC data set questionable.
One significant difference between the CT and DCB tests is evident from the respective R-curves. In the case of the DCB specimens from both plates (Figs. 10b, 11b), upon initial increase, after approximately 12-14 mm of extension, the propagation toughness appears to reach steady state. In the case of the CT specimens from Plate 1, toughness monotonically increases with crack extension (Fig. 10a). For the CT specimens from Plate 2, toughness reaches a steady state between 8-14 mm of growth, followed by a secondary monotonic increase (Fig. 11a). The relatively rapid increase in toughness for large crack lengths is related to extensive fiber and fiber-bundle bridging observed in the micrographs. The presence of broken fiber bundles suggests that locally, intralaminar fracture occurred on multiple planes, and the actual fracture-surface area was much larger than that assumed for the data reduction. The reason for multi-planar crack growth in the CT specimens is unclear. However, it is likely that for relatively large crack lengths, the mode-I stress field is affected by the compressive stresses that arise near the back-face of the CT specimens.
Re-examining Table I in the context of the above discussion can partially explain some of the previously observed discrepancies in comparing GIc-intra and GIc-inter. The sensitivity of the perceived initiation toughness to the quality (or sharpness) of the intralaminar starter cracks is evident. Moreover, the strong R-curve effect seen in Figures 10a and 11a, at least in the present case, can increase toughness by approximately 20 percent in 10 mm of crack advance. Therefore, measurement of toughness from blunt starter cracks or static precracking by several millimeters can significantly affect measurement of perceived “initiation” toughness data for 8552 resin matrix composites. SUMMARY
A comparison of the intralaminar and interlaminar mode-I fracture-toughness of unidirectional IM7/8552 graphite/epoxy composite has been performed using
compact tension (CT) and double cantilever beam (DCB) test specimens, respectively. Two starter crack geometries were considered for both the CT and DCB specimen configurations. In the first case, starter cracks were produced by 12.5 µm thick, Teflon film inserts. In the second case, considerably sharper starter cracks were produced by fatigue precracking. For each specimen configuration, use of the Teflon film starter cracks resulted in initially unstable crack growth and artificially high initiation fracture-toughness values. After unstable propagation, subsequent fracture advance was stable resulting in lower toughness. Fractographic inspection of the specimens containing Teflon inserts indicated that high initial toughness and unstable propagation was related to pooling of resin ahead of the Teflon insert. For CT specimens, fractography revealed significant fiber damage which occurred during insertion of the intralaminar Teflon starter cracks. The CT and DCB specimens with fatigue precracks exhibited stable growth onset and approximately equal initiation fracture toughness. However, during propagation the CT specimens exhibited more extensive fiber bridging, and rapidly increasing R-curve behavior, as compared to the DCB specimens.
In general, this experimental study has shown that the initiation mode-I fracture toughness of the IM7/8552 graphite/epoxy tape composite is independent of the plane in which cracking takes place when growth is parallel to the fiber direction.
APPENDIX
TABLE II. INTRALAMINAR TOUGHNESS – PLATE 1 & 2
TEFLON INSERT FATIGUE PRECRACK
Specimen NPCIcG intra−
(kJ/m2)
PCIcG intra−
(kJ/m2) Specimen
FPCIcG intra−
(kJ/m2) 1-CT-2 0.264 0.228 2-CT-2 0.212 1-CT-3 0.233 0.215 2-CT-3 0.180 1-CT-7 0.291 0.252 2-CT-4 0.189
2-CT-7 0.169 2-CT-8 0.189
MEAN 0.262 0.231 0.188 STDV 0.029 0.019 0.016
TABLE III. INTERLAMINAR FRACTURE TOUGHNESS – PLATE 1
TEFLON INSERT FATIGUE PRECRACK
Specimen NPCIcG inter−
(kJ/m2)
PCIcG inter−
(kJ/m2) Specimen
FPCIcG inter−
(kJ/m2) 1-DCB-1 0.227 0.217 1-DCB-2 0.213 1-DCB-3 0.229 0.214 1-DCB-6 0.209 1-DCB-4 0.259 0.223 1-DCB-8 0.197 1-DCB-5 0.238 0.224 1-DCB-7 0.233 0.227 MEAN 0.237 0.221 0.206 STDV 0.013 0.005 0.009
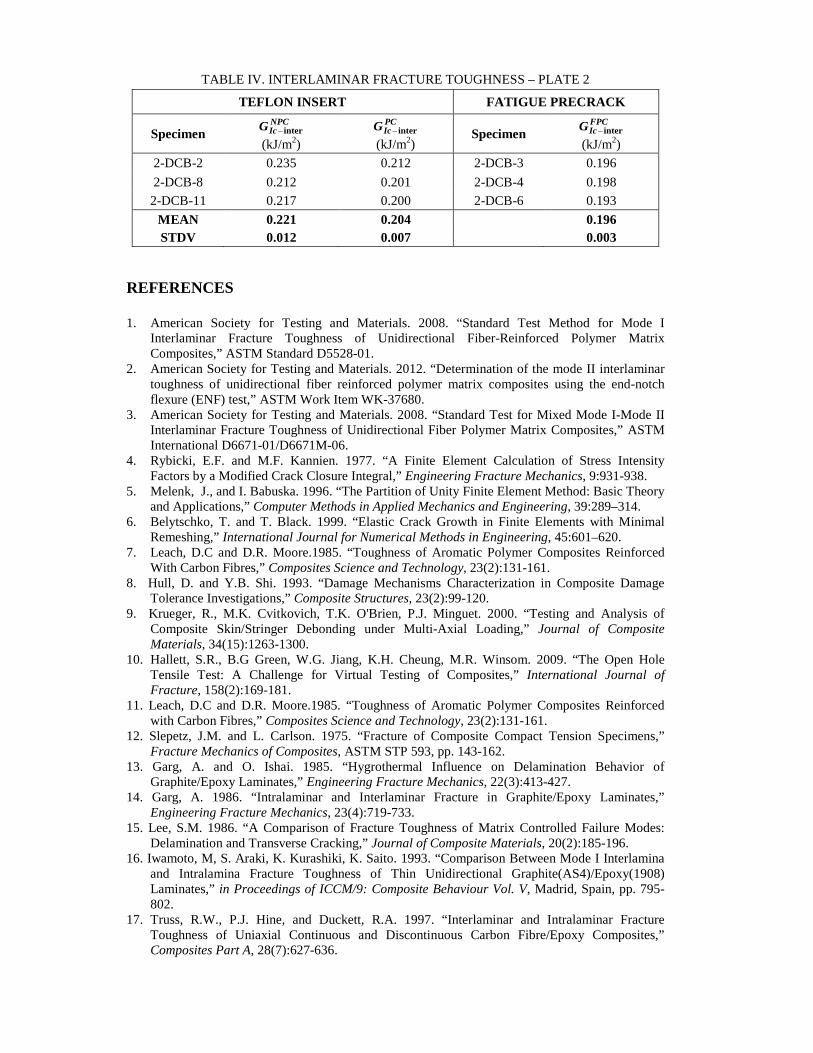
TABLE IV. INTERLAMINAR FRACTURE TOUGHNESS – PLATE 2
TEFLON INSERT FATIGUE PRECRACK
Specimen NPCIcG inter−
(kJ/m2)
PCIcG inter−
(kJ/m2) Specimen
FPCIcG inter−
(kJ/m2) 2-DCB-2 0.235 0.212 2-DCB-3 0.196 2-DCB-8 0.212 0.201 2-DCB-4 0.198
2-DCB-11 0.217 0.200 2-DCB-6 0.193 MEAN 0.221 0.204 0.196 STDV 0.012 0.007 0.003
REFERENCES
1. American Society for Testing and Materials. 2008. “Standard Test Method for Mode I Interlaminar Fracture Toughness of Unidirectional Fiber-Reinforced Polymer Matrix Composites,” ASTM Standard D5528-01.
2. American Society for Testing and Materials. 2012. “Determination of the mode II interlaminar toughness of unidirectional fiber reinforced polymer matrix composites using the end-notch flexure (ENF) test,” ASTM Work Item WK-37680.
3. American Society for Testing and Materials. 2008. “Standard Test for Mixed Mode I-Mode II Interlaminar Fracture Toughness of Unidirectional Fiber Polymer Matrix Composites,” ASTM International D6671-01/D6671M-06.
4. Rybicki, E.F. and M.F. Kannien. 1977. “A Finite Element Calculation of Stress Intensity Factors by a Modified Crack Closure Integral,” Engineering Fracture Mechanics, 9:931-938.
5. Melenk, J., and I. Babuska. 1996. “The Partition of Unity Finite Element Method: Basic Theory and Applications,” Computer Methods in Applied Mechanics and Engineering, 39:289–314.
6. Belytschko, T. and T. Black. 1999. “Elastic Crack Growth in Finite Elements with Minimal Remeshing,” International Journal for Numerical Methods in Engineering, 45:601–620.
7. Leach, D.C and D.R. Moore.1985. “Toughness of Aromatic Polymer Composites Reinforced With Carbon Fibres,” Composites Science and Technology, 23(2):131-161.
8. Hull, D. and Y.B. Shi. 1993. “Damage Mechanisms Characterization in Composite Damage Tolerance Investigations,” Composite Structures, 23(2):99-120.
9. Krueger, R., M.K. Cvitkovich, T.K. O'Brien, P.J. Minguet. 2000. “Testing and Analysis of Composite Skin/Stringer Debonding under Multi-Axial Loading,” Journal of Composite Materials, 34(15):1263-1300.
10. Hallett, S.R., B.G Green, W.G. Jiang, K.H. Cheung, M.R. Winsom. 2009. “The Open Hole Tensile Test: A Challenge for Virtual Testing of Composites,” International Journal of Fracture, 158(2):169-181.
11. Leach, D.C and D.R. Moore.1985. “Toughness of Aromatic Polymer Composites Reinforced with Carbon Fibres,” Composites Science and Technology, 23(2):131-161.
12. Slepetz, J.M. and L. Carlson. 1975. “Fracture of Composite Compact Tension Specimens,” Fracture Mechanics of Composites, ASTM STP 593, pp. 143-162.
13. Garg, A. and O. Ishai. 1985. “Hygrothermal Influence on Delamination Behavior of Graphite/Epoxy Laminates,” Engineering Fracture Mechanics, 22(3):413-427.
14. Garg, A. 1986. “Intralaminar and Interlaminar Fracture in Graphite/Epoxy Laminates,” Engineering Fracture Mechanics, 23(4):719-733.
15. Lee, S.M. 1986. “A Comparison of Fracture Toughness of Matrix Controlled Failure Modes: Delamination and Transverse Cracking,” Journal of Composite Materials, 20(2):185-196.
16. Iwamoto, M, S. Araki, K. Kurashiki, K. Saito. 1993. “Comparison Between Mode I Interlamina and Intralamina Fracture Toughness of Thin Unidirectional Graphite(AS4)/Epoxy(1908) Laminates,” in Proceedings of ICCM/9: Composite Behaviour Vol. V, Madrid, Spain, pp. 795-802.
17. Truss, R.W., P.J. Hine, and Duckett, R.A. 1997. “Interlaminar and Intralaminar Fracture Toughness of Uniaxial Continuous and Discontinuous Carbon Fibre/Epoxy Composites,” Composites Part A, 28(7):627-636.
18. Cowley, K.D. and P. Beaumont.1997. “The Interlaminar and Intralaminar Fracture Toughness of Carbon-Fibre/Polymer Composites: The effect of temperature,” Composites Science and Technology, 57(11):1433-1444.
19. Sørensen, B.F. and T.K. Jacobsen. 1998. “Large-Scale Bridging in Composites: R-curves and Bridging Laws,” Composites Part A, 29(11):1443-1451.
20. Iwamoto, M., Q.Q., Ni, T. Fujiwara, and K. Kurashiki. 1999. “Intralaminar Fracture Mechanism in Unidirectional CFRP Composites. I. Intralaminar Toughness and AE Characteristics,” Engineering Fracture Mechanics, 64(6):721-745.
21. Iwamoto, M., Q.Q., Ni, T. Fujiwara, and K. Kurashiki. 1999. “Intralaminar Fracture Mechanism in Unidirectional CFRP Composites - Part II: Analysis,” Engineering Fracture Mechanics, 64(6):747-764.
22. Jose, S., R.R. Kumar, M.K. Jana, G.V. Rao. 2001. “Intralaminar Fracture Toughness of a Cross-Ply Laminate and its Constituent Sub-Laminates,” Composites Science and Technology, 61(8):1115-1122.
23. Pinho, S.T., P. Robinson, and L. Iannucci. 2009. “Developing a Four Point Bend Specimen to Measure the Mode I Intralaminar Fracture Toughness of Unidirectional Laminated Composites,” Composites Science and Technology, 69(7-8):1303-1309.
24. de Moura, M.F.S.F., R.D.S.G Campilho, A.M. Amaro, P.N.B. Reis. 2010. “Interlaminar and Intralaminar Fracture Characterization of Composites Under Mode I Loading,” Composite Structures, 92:144-149.
25. Gutkin, R., M.L. Laffan, S.T. Pinho, P. Robinson, P.T. Curtis. 2011. “Modelling the R-curve Effect and its Specimen-Dependence,” International Journal of Solids and Structures, 48(11-12):1767-1777.
26. Macedo, F.S., A.B. Pereira, A.B. de Morais. 2012. “Mixed Bending-Tension (MBT) Test For Mode I Interlaminar and Intralaminar Fracture,” Composites Science and Technology, 72(9):1049-1055.
27. Parhizgar, S, L.W. Zachary, and C. T. Sun. 1982. “Application of the Principles of Linear Fracture Mechanics to the Composite Materials,” International Journal of Fracture, 20(1):3-15.
28. Hine, P.J., B. Brew, R.A. Duckett, and I.M. Ward. 1988. “The Fracture Behaviour of Carbon Fibre Reinforced Poly(Ether Etherketone),” Composites Science and Technology, 33(1):35-71.
29. Hine, P.J., B. Brew, R.A. Duckett, and I.M. Ward. 1989. “Failure Mechanisms in Continuous Carbon-Fibre Reinforced PEEK Composites,” Composites Science and Technology, 35(1):31-51.
30. Hine, P.J., B. Brew, R.A. Duckett, and I.M. Ward. 1992. “Failure Mechanisms in Carbon-Fibre-Reinforced Poly(Ether Sulphone),” Composites Science and Technology, 43(1):37-47.
31. Cowley, K.D. and P.W.R. Beaumont. 1997. “The Interlaminar and Intralaminar Fracture Toughness of Carbon-Fibre/Polymer Composites: The Effect of Temperature,” Composites Science and Technology, 57(11):1433-1444.
32. Hexcel Corporation, 2007. “HexPly® 8552 Product Data Sheet,” http://hexcel.com. 33. American Society for Testing and Materials. 2006. “Standard Test Method for Measurement of
Fracture Toughness,” ASTM Standard E1820-06. 34. Greenhalgh, E.S. 2009. Failure Analysis and Fractography of Polymer Composites, Woodhead
Publishing Ltd., pp. 303-315. 35. Hansen, P. and R. Martin. 1999. “DCB, 4ENF and MMB Delamination Characterization of
S2/8552 and IM7/8552,” Technical Report N68171-98-M-5177, Materials Engineering Research Laboratory Ltd. (MERL), Hartford, U.K.
36. Schön, J., T. Nyman, A. Blom, and H. Ansell. 2000. “A Numerical and Experimental Investigation of Delamination Behaviour in the DCB Specimens,” Composites Science and Technology, 60(2):173-184.
37. Murri, G.B. 2012. “Evaluation of Delamination Onset and Growth Characterization Methods Under Mode I Fatigue Loading” in Proceedings of the American Society for Composites - Twenty-Seventh Technical Conference, Arlington, TX.
38. Murri. G.B. and Martin, R.H. (1993). Effect of Initial Delamination on Mode I and Mode II Interlaminar Fracture Toughness and Fatigue Fracture Threshold, Composite Materials: Fatigue and Fracture, Fourth Volume, ASTM STP 1156, W.W. Stinchcomb and N.E. Asbaugh, eds., pp. 239-256.