Embed Size (px)
Citation preview

U.S. DEPARTMENT OF EDUCATION ______________________________________________________________________________________________________
Title I Accountability and School Improvement From 2001 to 2004
_______________________________________________________________________________________________________
3-6-06

Title I Accountability and School Improvement From 2001 to 2004
Prepared by:
SRI International Christine Padilla
Heidi Skolnik Alejandra Lopez-Torkos
Katrina Woodworth Andrea Lash
Patrick M. Shields
Policy Studies Associates Katrina G. Laguarda
Consultant Jane L. David
For:
U.S. Department of Education Office of Planning, Evaluation and Policy Development
Policy and Program Studies Service
2006
This report was prepared for the U.S. Department of Education under Contract Number ED00CO0091 with SRI International. Collette Roney served as the contracting officer’s representative. The views expressed herein do not necessarily represent the positions or policies of the Department of Education. No official endorsement by the U.S. Department of Education is intended or should be inferred. U.S. Department of Education Margaret Spellings Secretary Office of Planning, Evaluation and Policy Development Tom Luce Assistant Secretary Policy and Program Studies Service Alan Ginsburg Director Program and Analytic Studies Division David Goodwin Director April 2006 This report is in the public domain. Authorization to reproduce it in whole or in part is granted. While permission to reprint this publication is not necessary, the suggested citation is: U.S. Department of Education, Office of Planning, Evaluation and Policy Development, Policy and Program Studies Service, Title I Accountability and School Improvement From 2001 to 2004, Washington, D.C., 2006. Copies of this report may be ordered in the following ways:
• Mail. Write to:
ED Pubs Education Publications Center U.S. Department of Education P.O. Box 1398 Jessup, MD 20794-1398
• Fax. Dial 301-470-1244.
• Telephone (toll-free). Dial 1-877-433-7827 (1-877-4-ED-PUBS). If 877 service is not yet available in
your area, call 1-800-872-5327 (1-800-USA-LEARN). Those who use a telecommunications device for the deaf (TDD) or a teletypewriter (TTY) should call 1-800-437-0833.
• Electronic mail. Send your request to: [email protected].
• Online. Order a copy of the report at: www.edpubs.org. This report may also be downloaded from the
Department’s Web site at www.ed.gov/about/offices/list/opepd/ppss/reports.html#title. • Alternate formats. Upon request, this publication is available in alternate formats such as Braille, large
print, or computer diskette. For more information, please contact the Department’s Alternate Format Center at 202-260-9895 or 202-205-8113.
Acknowledgments
The development of this report was performed under the guidance of staff from the U.S. Department of Education, Office of Planning, Evaluation and Policy Development. Collette Roney of the Policy and Program Studies Service was the project officer. The Evaluation of Title I Accountability Systems and School Improvement Efforts is the result of collaborative work by SRI International, Policy Studies Associates (PSA), and the Consortium for Policy Research in Education (CPRE). Among the staff who contributed to the research were: Katherine Baisden, Camille Esch, Roneeta Guha, Heather Hough, Raymond McGhee, Juliet Tiffany-Morales, Cimone Satele, Amy Seligman, Lisa Uperesa, and Andrew Wayne from SRI; Michael Rubenstein, Christina Russell, Darxavia Stephens, Brenda Turnbull, Lisa Weiner, and Imeh Williams from PSA; Mark Duffy, Margaret Goertz, and Melissa Prosky from CPRE. Harold Javitz of SRI was responsible for designing the sampling plan and developing the statistical techniques for longitudinal analyses. Vanessa Barrat of SRI was responsible for maintaining multiple databases, conducting survey analyses, and contributing to the design of the longitudinal analyses. Organization and editing were done by Deborah DuCharme, Laurie Fox, and Klaus Krause. The authors would like to thank the state and local school district staff who participated in the TASSIE data collection efforts: the 1,300 school districts and 739 Title I schools that completed three annual surveys; the state department of education staffs that participated in two annual surveys; and in particular, state staff from our five case study states—Arizona, Louisiana, Maryland, Michigan, and Washington. The 15 school districts and 20 case study schools within these states were generous with both their time and attention to this evaluation work. We learned a great deal from these individuals and hope the lessons gained from their efforts will be of use to policymakers and other education staff at all levels of the system. An external advisory panel provided assistance in reviewing study methods and prioritizing issues to investigate, as well as reviewing and providing feedback on project reports. The advisory panel consisted of Karen Bachofer, director of standards, assessment, and accountability, San Diego City Schools; Rolf Blank, director of education indicators, Council of Chief State School Officers; Mitchell Chester, assistance superintendent of the Office of Assessment, Ohio Department of Education; Ronald Friend, formerly director of the Office of Comprehensive Planning and School Support, Maryland Department of Education; Margaret McLaughlin, associate director of the Institute for the Study of Exceptional Children and Youth, University of Maryland; Jennifer O’Day, American Institutes for Research; Charlene Rivera, director of the Institute for Equity and Excellence in Education, George Washington University; Russell Rumberger, director of the Linguistic Minority Research Institute, University of California at Santa Barbara.
iii

Contents
Executive Summary ....................................................................................................................xi
I. Introduction............................................................................................................................ 1
Overview of the Study ............................................................................................................. 2
Overview of the Report............................................................................................................ 3
II. Context .................................................................................................................................... 5
Background: Accountability Provisions of NCLB ................................................................... 5
Title I Schools and Districts Identified for Improvement ........................................................ 7
Districts With Identified Schools..................................................................................... 12
Districts Identified for Improvement ............................................................................... 13
Knowledge of Accountability Elements ................................................................................ 14
III. Title I Choice and Supplemental Educational Services.................................................... 15
Public School Choice Under Title I ....................................................................................... 15
Eligibility and Participation ............................................................................................. 16
Choice Options................................................................................................................. 19
Barriers to Providing and Exercising Choice................................................................... 22
Supplemental Educational Services....................................................................................... 27
Eligibility and Participation ............................................................................................. 27
Providers of Supplemental Services and How They Are Chosen.................................... 30
Barriers to Providing and Participating in Supplemental Services.................................. 34
Communication With Parents Under NCLB .......................................................................... 36
Public Reporting .................................................................................................................... 41
School and District Report Cards .................................................................................... 41
State Reporting................................................................................................................. 44
Summary ................................................................................................................................ 45
v
IV. School Improvement and District Assistance.................................................................... 47
School Actions ....................................................................................................................... 47
Planning, Data Uses, New Curricula, and Curriculum Alignment .................................. 49
Professional Development, School-Based Assistance, and Other Resources.................. 53
District Assistance ................................................................................................................. 60
Planning, Data Use, and Curriculum Alignment ............................................................. 60
Professional Development, School-Based Assistance, and Other Resources.................. 63
Targeting of Assistance to Schools Within Districts ............................................................. 71
State Organization of Support to Identified Title I Schools .................................................. 74
Statewide Systems of School Support ............................................................................. 75
Use of School Improvement Reserve Funds.................................................................... 77
Factors Associated With Changes in Improvement Status .................................................... 78
Summary ................................................................................................................................ 80
V. Corrective Actions and Restructuring ............................................................................... 83
District Actions ...................................................................................................................... 83
State Actions .......................................................................................................................... 87
Schools’ Reports of District and State Actions ..................................................................... 89
Summary ................................................................................................................................ 91
VI. Conclusions ........................................................................................................................... 93
References .................................................................................................................................R-1
Appendix A: Methods..............................................................................................................A-1
Appendix B: Additional Exhibits ...........................................................................................B-1
vi

Exhibits
Executive Summary
Exhibit S1 Distribution of Identified Title I Schools in 2001-02 and 2003-04, by District Size (Student Enrollment)....................................................................xiii
Exhibit S2 Distribution of Identified Title I Schools Compared With All Title I Schools in 2003-04, by District Poverty ................................................................xiv
Exhibit S3 Distribution of Continuously Identified and No Longer Identified Title I Schools in 2003-04, by District Size....................................................................... xv
Exhibit S4 Participation in Title I Choice and Supplemental Services, Among Districts With Identified Schools .........................................................................................xvi
Exhibit S5 Districts With Different Numbers of Identified Schools Among Districts With Identified Schools in 2002-03 and 2003-04 ..................................xvii
Exhibit S6 Supplemental Service Providers in 2003 and 2004 .............................................xviii
Exhibit S7 Elements of a Statewide System of School Support............................................... xx
Exhibit S8 Major Focus of District Resources on Strategies for Improving Identified Schools in 2003-04................................................................................xxi
Exhibit S9 Engagement in Improvement Strategies in 2003-04, by School Identification Status ..............................................................................................xxii
Exhibit S10 School Reports of Assistance Received From School-Based Staff Developers and School Support Teams in 2003-04, by School Identification Status ............xxiii
II. Context
Exhibit 1 Summary of Key NCLB Accountability Requirements .............................................. 6
Exhibit 2 Distribution of Identified Title I Schools in 2001-02 and 2003-04, by District Size............................................................................................................. 8
Exhibit 3 Distribution of Identified Title I Schools Compared With All Title I Schools, by District Poverty ........................................................................................ 9
Exhibit 4 Distribution of Continuously Identified and No Longer Identified Title I Schools in 2003-04, by District Size.......................................................................... 10
Exhibit 5 Number of States With Varying Percentages of Their Schools Identified Schools Identified for Improvement, 2003-04 and 2004-05...................................... 11
Exhibit 6 Districts With Different Numbers of Identified Title I Schools, Among Districts With Identified Schools in 2002-03 and 2003-04 ....................................... 13
vii

III. Title I Choice and Supplemental Services
Exhibit 7 Districts and Schools Required to Offer Title I Choice, Those That Offered Choice, and Students Who Exercised Choice in 2002-03 and 2003-04................... 16
Exhibit 8 Average Number of Schools With Students Eligible to Exercise Choice, Among Districts That Provided Title I Choice in 2003-04 ...................................... 17
Exhibit 9 Percentage of Districts With No Student Transfers Under the Title I Choice Option in 2003-04, Among Districts That Offered Choice, by District Size ......................................................................................................... 18
Exhibit 10 Average Number of Alternate Elementary Schools Available to Parents With Students in Identified Title I Schools in 2003-04, Among Districts That Offered Choice, by District Size ...................................................................... 20
Exhibit 11 Options for Parents Not Always an Improvement ................................................... 21
Exhibit 12 Steps Taken by Districts to Increase the Range of Choices Available to Parents With Children in Identified Schools in 2003-04, Among Districts That Offered Title I Choice ....................................................................... 22
Exhibit 13 Top Challenges Faced by Districts That Implemented Title I Choice in 2003-04 ................................................................................................................ 23
Exhibit 14 Factors That Influence Parents’ Decisions to Transfer Their Children to Another School..................................................................................................... 25
Exhibit 15 Other Stumbling Blocks ........................................................................................... 26
Exhibit 16 Districts and Schools Required to Offer Supplemental Services, Those That Offered Supplemental Services, and Students Who Participated in 2002-03 and 2003-04................................................................................................ 28
Exhibit 17 Average Number of Students in Identified Schools Who Were Eligible for Supplemental Services in 2003-04, Among Districts That Provided Services, by Urbanicity ............................................................................................ 29
Exhibit 18 District Policy Regarding the Provision of Supplemental Services in 2002-03 and 2003-04, Among Districts That Provided Services............................. 30
Exhibit 19 Criteria for Selecting Supplemental Service Providers in 2003-04 ......................... 31
Exhibit 20 State Standards and Process for Monitoring Providers and Withdrawing Approval From Providers................................................................... 32
Exhibit 21 Supplemental Service Providers in Case Study States in April 2003 and 2004....... 33
Exhibit 22 Supplemental Service Providers in April 2003 and 2004 ........................................ 34
Exhibit 23 Top Challenges Faced by Districts That Implemented Supplemental Services, Among Districts That Offered Services in 2003-04 ................................................ 35
Exhibit 24 District Challenges in Working With Providers....................................................... 36
viii
Exhibit 25 Timing of Notification to Parents of Students in Identified Title I Schools About Eligibility for School Choice and Supplemental Services in 2003-04, Among Districts That Provided Choice and Supplemental Services ....................... 37
Exhibit 26 Average Number of Students Who Transferred, by Timing of District Notification, Among Districts That Provided Choice in 2003-04............................ 38
Exhibit 27 Number of Communication Methods Used by Districts in 2003-04 to Notify Parents About Their Title I Choice and Supplemental Services Options, Among Districts That Provided These Options......................................... 39
Exhibit 28 District Efforts to Communicate With Parents......................................................... 41
Exhibit 29 Information Included in School and District Report Cards, Among Districts That Had School and District Report Cards in 2003-04............................ 42
IV. School Improvement and District Assistance
Exhibit 30 Engagement in Improvement Strategies in 2003-04, by School Identification Status.................................................................................................. 48
Exhibit 31 Variations in Uses of School Plans in Case Study Schools ..................................... 50
Exhibit 32 Sources of Information Used by Schools to Inform Their Planning Process in 2002-3 and 2003-04, Among Schools With a Written School Plan ....... 50
Exhibit 33 Trends in Data Use in Case Study Schools .............................................................. 51
Exhibit 34 Principal Reports of District or State Support for Curriculum Alignment............... 53
Exhibit 35 Types of Professional Development Emphasized in Schools in 2003-04................ 54
Exhibit 36 School Reports of Assistance Received From School-Based Staff Developers and School Support Teams in 2003-04, by School Identification Status................. 55
Exhibit 37 Case Study Examples of Staff Developer Activities................................................ 57
Exhibit 38 Average Percentage of Teacher Participation in Each of Three Types of Professional Development in 2003-04, by School Identification Status ............. 58
Exhibit 39 Title I Schools Receiving Four Types of Special Funding in 2003-04, by School Identification Status................................................................................. 59
Exhibit 40 Funding for School-Based Staff Developers in Case Study Schools ....................... 60
Exhibit 41 Percent of Districts Placing a Major Focus on Strategies for Improving Identified Schools, 2001-02 to 2003-04 ................................................................... 61
Exhibit 42 Topics Addressed by District-Sponsored Professional Development in 2003-04 ... 64
Exhibit 43 Percent of Teachers in Continuously Identified Schools That Participated in Three Types of Professional Development in 2003-04........................................ 65
Exhibit 44 District-Sponsored Staff Assistance for Identified Title I Schools in 2003-04........ 66
ix

Exhibit 45 Case Study District Resource Constraints................................................................ 67
Exhibit 46 Focus of Assistance Most Commonly Provided by School-Based Staff Developers and School Support Teams in 2003-04 ................................................. 68
Exhibit 47 Time Spent in Identified Schools by School Support Teams and Distinguished Teachers/Other Consultants (Those Sponsored by Both Districts and States) in 2003-04 ............................................................................... 69
Exhibit 48 District Assistance to Identified Title I Schools in 2003-04, by District Size ......... 70
Exhibit 49 Districts That Provided Assistance to Identified Title I Schools Only, Among Districts That Provided Assistance and Had Identified Title I Schools, Schools That Missed AYP, and Higher-Performing Schools in 2003-04................ 72
Exhibit 50 District-Sponsored Assistance Among Districts With Identified Title I Schools in 2003-04, Compared With Districts Whose Schools Had Missed AYP for One Year Only ........................................................................................... 74
Exhibit 51 Elements of a Statewide System of School Support in 2003-04.............................. 76
Exhibit 52 District Reports of State-Sponsored Assistance to Identified Title I Schools in 2003-04................................................................................................... 77
Exhibit 53 Expected Probability of Exiting Improvement Status in 2003-04 for Four Types of Identified Schools ....................................................................... 80
V. Corrective Actions and Restructuring
Exhibit 54 Distribution of the Number of Schools in Corrective Action in 2003-04, Among Districts With These Schools ...................................................................... 84
Exhibit 55 Corrective Actions Taken in 2003-04, Among Districts With Schools in Corrective Action ..................................................................................................... 85
Exhibit 56 Restructuring Efforts Taken in 2003-04, Among Districts With Schools in Restructuring ............................................................................................................ 86
Exhibit 57 Corrective Actions Taken by States With Title I Schools in Corrective Action in 2003-04..................................................................................................... 87
Exhibit 58 Restructuring Efforts Taken by States With Title I Schools in Restructuring in 2003-04.......................................................................................... 88
Exhibit 59 Examples of Variations in State Interventions With Identified Schools and Districts.............................................................................................................. 89
Exhibit 60 Principals’ Reports of Corrective Actions Taken by the State or District, by School Identification Status in 2003-04 ................................................ 90
x

Executive Summary
Accountability stands at the center of the No Child Left Behind Act (NCLB). The logic of NCLB is straightforward: improving the nation’s schools for all children requires the establishment of clear and high standards, the identification of schools in which students are not meeting those standards, options for parents of students in schools identified for improvement, support for struggling schools, and—for those schools that continue to perform poorly—increasingly rigorous interventions.
This report presents the key findings over the three years of the study. Findings from
2002-03, the first full year of NCLB implementation, showed that states and districts were making progress in implementing accountability systems under NCLB but that big gaps remained between their existing systems of accountability and the NCLB vision of coherent systems that support all schools and all students to reach high standards. During 2003-04, educators at all levels of the education system continued efforts to implement the accountability provisions of NCLB closing the gap in some areas but not all as described below.
To understand how states, districts, and schools are implementing the Title I accountability
provisions of the No Child Left Behind Act, the U.S. Department of Education commissioned the Evaluation of Title I Accountability Systems and School Improvement Efforts (TASSIE). The study began in 2001-02 and continued to collect data through 2003-04 from a variety of sources:
• A yearly survey of district Title I administrators in a nationally representative sample of
approximately 1,300 districts out of 11,200 districts nationally that received Title I funds during the study period.
• A yearly survey of principals in a nationally representative sample of 739 Title I schools identified for improvement in 2001-02 out of 4,100, drawn from the 1,300 sampled districts.
• Yearly case study visits to 20 schools identified for improvement under Title I in 15 districts in five states.
• Interviews of all state Title I administrators and analyses of state accountability systems components.
Overall, states, districts, and schools were responding to NCLB requirements in different
ways; these differences were often associated with district size, urbanicity, and poverty. Five themes capture the trends observed over the duration of the study, each of which is described in greater detail in the report:
• Identified schools in small districts were more likely to exit improvement status than those in large districts; thus, identified schools became more concentrated in large districts.
xi
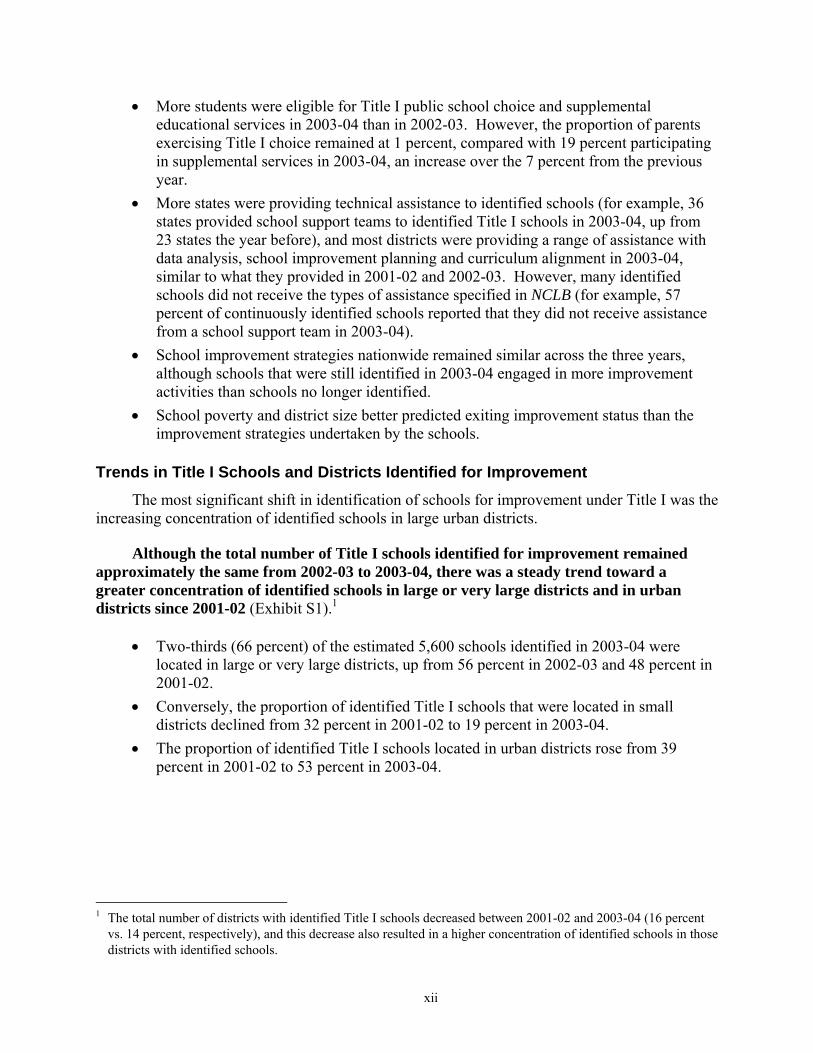
• More students were eligible for Title I public school choice and supplemental educational services in 2003-04 than in 2002-03. However, the proportion of parents exercising Title I choice remained at 1 percent, compared with 19 percent participating in supplemental services in 2003-04, an increase over the 7 percent from the previous year.
• More states were providing technical assistance to identified schools (for example, 36 states provided school support teams to identified Title I schools in 2003-04, up from 23 states the year before), and most districts were providing a range of assistance with data analysis, school improvement planning and curriculum alignment in 2003-04, similar to what they provided in 2001-02 and 2002-03. However, many identified schools did not receive the types of assistance specified in NCLB (for example, 57 percent of continuously identified schools reported that they did not receive assistance from a school support team in 2003-04).
• School improvement strategies nationwide remained similar across the three years, although schools that were still identified in 2003-04 engaged in more improvement activities than schools no longer identified.
• School poverty and district size better predicted exiting improvement status than the improvement strategies undertaken by the schools.
Trends in Title I Schools and Districts Identified for Improvement The most significant shift in identification of schools for improvement under Title I was the
increasing concentration of identified schools in large urban districts. Although the total number of Title I schools identified for improvement remained
approximately the same from 2002-03 to 2003-04, there was a steady trend toward a greater concentration of identified schools in large or very large districts and in urban districts since 2001-02 (Exhibit S1).1
• Two-thirds (66 percent) of the estimated 5,600 schools identified in 2003-04 were
located in large or very large districts, up from 56 percent in 2002-03 and 48 percent in 2001-02.
• Conversely, the proportion of identified Title I schools that were located in small districts declined from 32 percent in 2001-02 to 19 percent in 2003-04.
• The proportion of identified Title I schools located in urban districts rose from 39 percent in 2001-02 to 53 percent in 2003-04.
1 The total number of districts with identified Title I schools decreased between 2001-02 and 2003-04 (16 percent
vs. 14 percent, respectively), and this decrease also resulted in a higher concentration of identified schools in those districts with identified schools.
xii
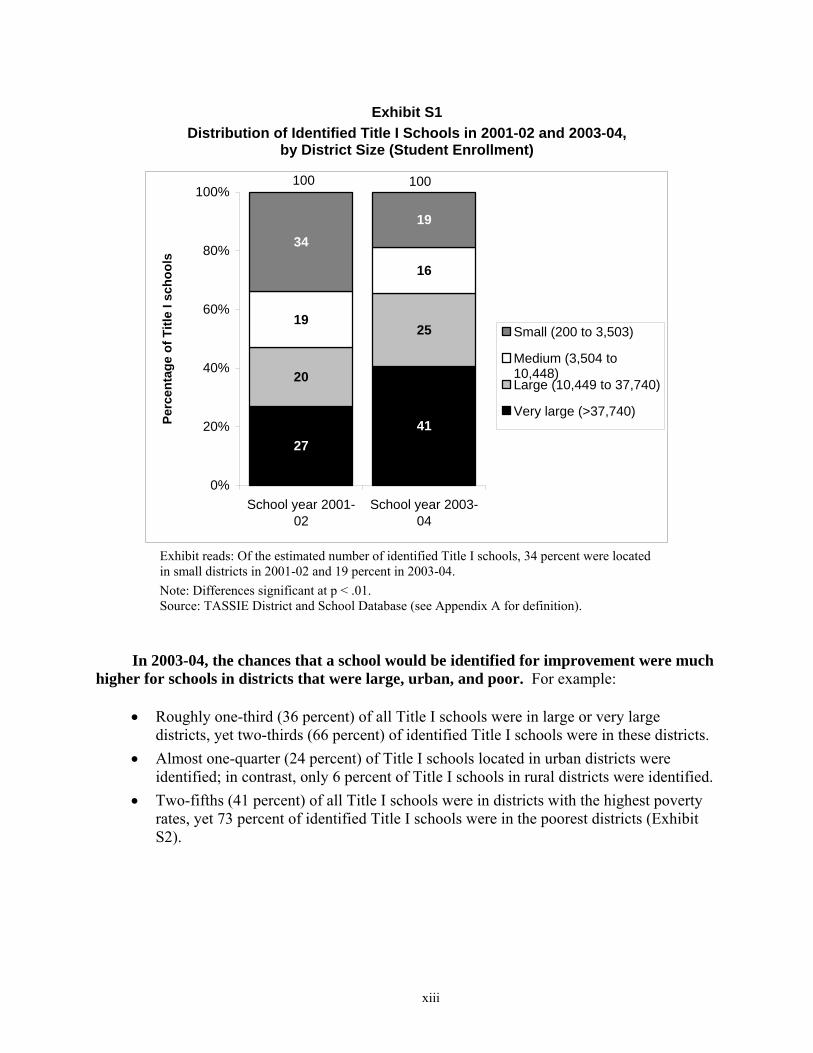
Exhibit S1 Distribution of Identified Title I Schools in 2001-02 and 2003-04,
by District Size (Student Enrollment)
4127
20
25
16
19
1934
0%
20%
40%
60%
80%
100%
School year 2001-02
School year 2003-04
Perc
enta
ge o
f Titl
e I s
choo
ls
Small (200 to 3,503)
Medium (3,504 to10,448)Large (10,449 to 37,740)
Very large (>37,740)
100 100
Exhibit reads: Of the estimated number of identified Title I schools, 34 percent were located in small districts in 2001-02 and 19 percent in 2003-04. Note: Differences significant at p < .01. Source: TASSIE District and School Database (see Appendix A for definition).
In 2003-04, the chances that a school would be identified for improvement were much higher for schools in districts that were large, urban, and poor. For example:
• Roughly one-third (36 percent) of all Title I schools were in large or very large
districts, yet two-thirds (66 percent) of identified Title I schools were in these districts. • Almost one-quarter (24 percent) of Title I schools located in urban districts were
identified; in contrast, only 6 percent of Title I schools in rural districts were identified. • Two-fifths (41 percent) of all Title I schools were in districts with the highest poverty
rates, yet 73 percent of identified Title I schools were in the poorest districts (Exhibit S2).
xiii
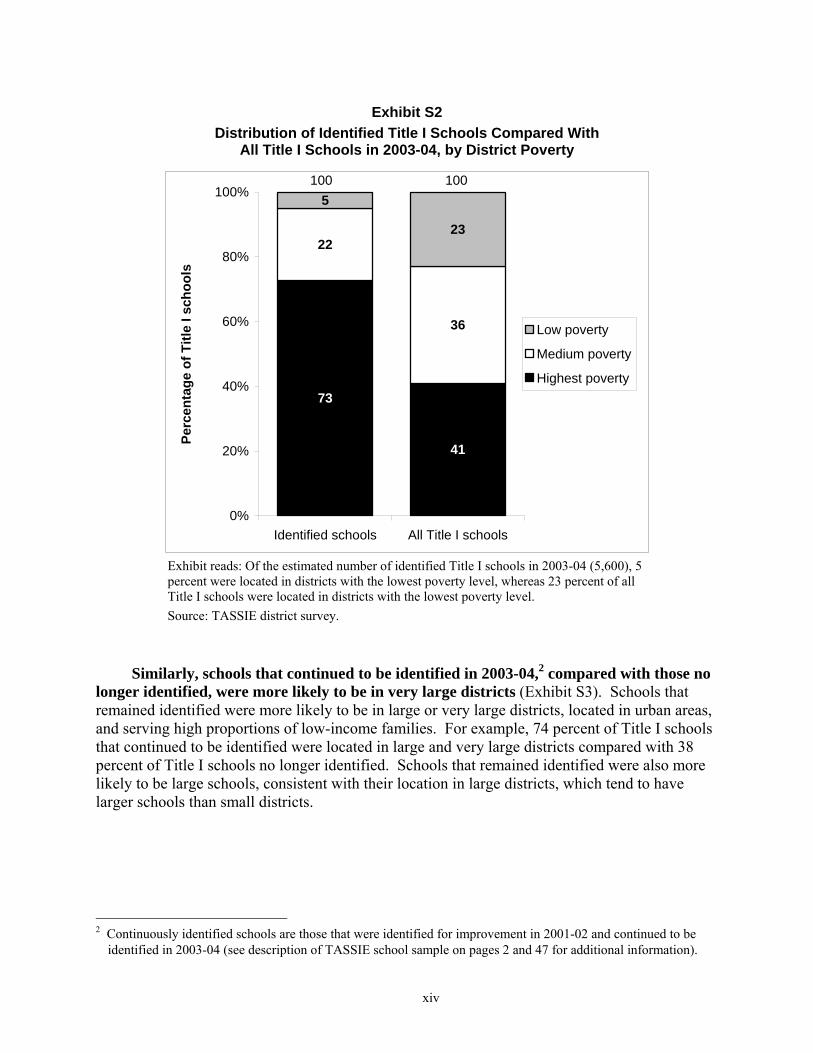
Exhibit S2 Distribution of Identified Title I Schools Compared With
All Title I Schools in 2003-04, by District Poverty
73
41
22
36
5
23
0%
20%
40%
60%
80%
100%
Identified schools All Title I schools
Perc
enta
ge o
f Titl
e I s
choo
ls
Low poverty
Medium poverty
Highest poverty
100100
Exhibit reads: Of the estimated number of identified Title I schools in 2003-04 (5,600), 5 percent were located in districts with the lowest poverty level, whereas 23 percent of all Title I schools were located in districts with the lowest poverty level. Source: TASSIE district survey.
Similarly, schools that continued to be identified in 2003-04,2 compared with those no
longer identified, were more likely to be in very large districts (Exhibit S3). Schools that remained identified were more likely to be in large or very large districts, located in urban areas, and serving high proportions of low-income families. For example, 74 percent of Title I schools that continued to be identified were located in large and very large districts compared with 38 percent of Title I schools no longer identified. Schools that remained identified were also more likely to be large schools, consistent with their location in large districts, which tend to have larger schools than small districts.
2 Continuously identified schools are those that were identified for improvement in 2001-02 and continued to be
identified in 2003-04 (see description of TASSIE school sample on pages 2 and 47 for additional information).
xiv
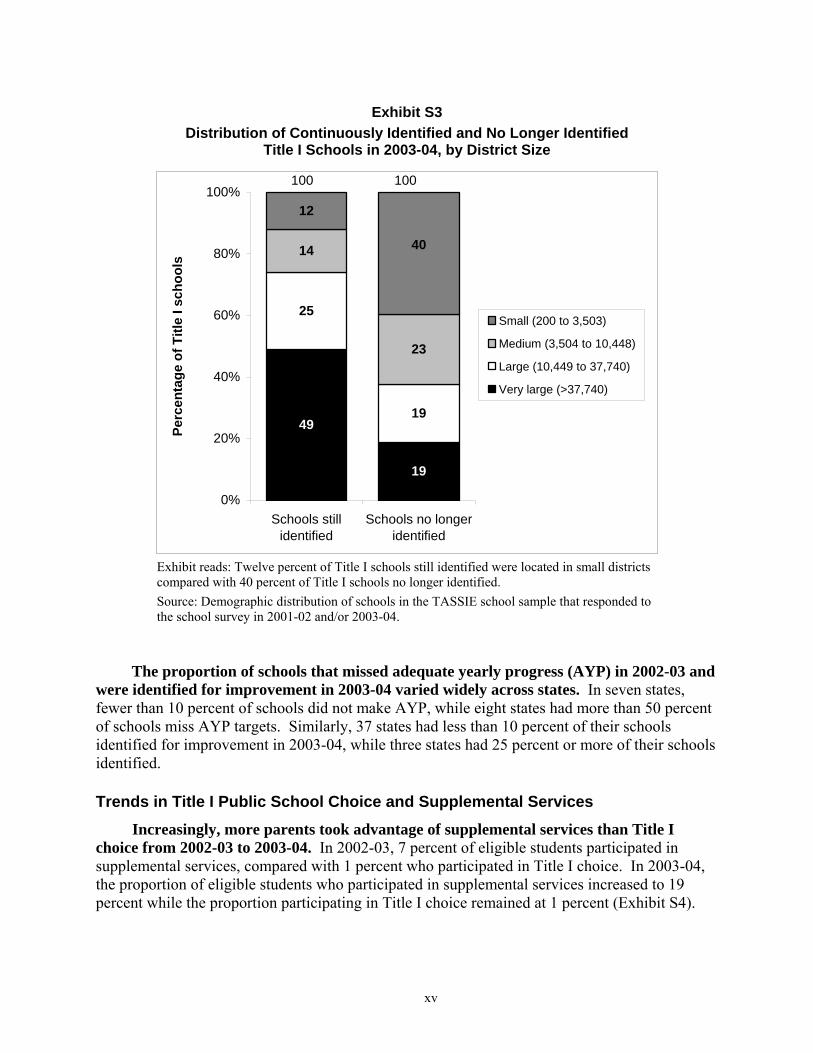
Exhibit S3 Distribution of Continuously Identified and No Longer Identified
Title I Schools in 2003-04, by District Size
19
4919
25
23
14 40
12
0%
20%
40%
60%
80%
100%
Schools stillidentified
Schools no longeridentified
Perc
enta
ge o
f Titl
e I s
choo
ls
Small (200 to 3,503)
Medium (3,504 to 10,448)
Large (10,449 to 37,740)
Very large (>37,740)
100100
Exhibit reads: Twelve percent of Title I schools still identified were located in small districts compared with 40 percent of Title I schools no longer identified. Source: Demographic distribution of schools in the TASSIE school sample that responded to the school survey in 2001-02 and/or 2003-04.
The proportion of schools that missed adequate yearly progress (AYP) in 2002-03 and were identified for improvement in 2003-04 varied widely across states. In seven states, fewer than 10 percent of schools did not make AYP, while eight states had more than 50 percent of schools miss AYP targets. Similarly, 37 states had less than 10 percent of their schools identified for improvement in 2003-04, while three states had 25 percent or more of their schools identified.
Trends in Title I Public School Choice and Supplemental Services Increasingly, more parents took advantage of supplemental services than Title I
choice from 2002-03 to 2003-04. In 2002-03, 7 percent of eligible students participated in supplemental services, compared with 1 percent who participated in Title I choice. In 2003-04, the proportion of eligible students who participated in supplemental services increased to 19 percent while the proportion participating in Title I choice remained at 1 percent (Exhibit S4).
xv

Exhibit S4 Participation in Title I Choice and Supplemental Services,
Among Districts With Identified Schools
School choice Supplemental services 2002-03 2003-04 2002-03 2003-04
Students (among districts that provided options):
Number eligible3
Number who participated Proportion who participated
1,535,000 18,000
1%
2,752,000+
32,000 1%
592,000 42,000
7%
1,331,000*
258,000*
19% Schools:
Number where option required Number where option offered Proportion where option offered
6,000 5,000
84%
5,600 4,600 83%
1,300
800 58%
3,100 2,500 83%
Districts: Number with schools where option
required Number with schools where option
offered Proportion where option offered
1,800
1,200
66%
1,600 1,100 67%
1,100
500
48%
1,100 600 57%
Exhibit reads: Among districts that had identified schools and offered choice in 2002-03, an estimated 1,535,000 students nationwide were eligible for Title I choice; in 2003-04, the estimate was 2,752,000 students. Among district that had identified schools and offered supplemental services in 2002-03, an estimated 592,000 students nationwide were eligible for supplemental services; for 2003-04, the estimate was 1,331,000. Note: + indicates significant differences at p<.01; * indicates significant differences at p < .05. Source: TASSIE district survey.
The number of students eligible for and participating in choice nationally increased between 2002-03 and 2003-04, but the proportion of students who transferred remained at 1 percent. The percentage remained the same because the number of students eligible for choice and the number exercising choice increased at about the same rate. Although the number of students eligible for choice increased substantially from 2002-03 to 2003-04, the number of districts and schools offering choice changed little. This pattern probably reflects the increasing numbers of identified schools in large and urban districts and the declining numbers in small districts (Exhibit S1). Small districts had an average of one school with students eligible for choice, whereas very large districts had an average of 30 schools. As a result, in 2003-04, 4 percent of districts had 13 or more identified schools compared with 2 percent in 2002-03 (Exhibit S5). Additionally, schools in larger districts tend to have larger school enrollments than their small and rural counterparts thereby increasing the number of students eligible for Title I choice.
3 Not all districts that should have provided choice and supplemental services reported providing these options and
thus did not provide eligibility data. As a result, the number of students eligible is underestimated and the proportion participating is overestimated. The margins of error for the estimates are: 1.5 million +/- .6 million; 2.75 million +/- .7 million; 592,000 +/- .6 million; 1.3 million +/- .34 million (see Appendix A).
xvi

Exhibit S5 Districts With Different Numbers of Identified Schools Among
Districts With Identified Schools in 2002-03 and 2003-04
74 70
1513
10 112 4
0%
20%
40%
60%
80%
100%
2002-03 2003-04
Perc
enta
ge o
f Titl
e I s
choo
ls
13 or more identifiedschools in thedistricts
5 to 12 identifiedschools in thedistricts
3 to 4 identifiedschools in thedistricts
1 to 2 identifiedschools in thedistricts
10 10
Exhibit reads: In 2002-03, among districts nationwide that had Title I schools identified for improvement, 2 percent had 13 or more identified Title I schools compared with 12 percent in 2003-04. Notes: Percentages may not add to 100 because of rounding. Source: TASSIE district survey.
Two-thirds of the districts required to offer choice that did so gave parents a choice
among all other schools in the districts not identified for improvement. Other options, such as all other schools within a certain geographic zone, were provided less frequently. Of the one-third of districts required to offer choice that did not do so, most were small with limited or no alternate schools from which to choose. As identified schools became more concentrated in large urban districts, it appeared that these districts too were finding it difficult to identify alternatives, especially at the middle and high school levels where the average number of alternate schools was two or less. Case study indicated that large urban districts were providing alternatives that were not always higher performing than the sending school. For example, one district offered to parents as options alternate schools that they thought were likely to miss AYP at the end of the year because they had few schools to choose among.
In both 2002-03 and 2003-04, roughly half the districts that were required to offer
supplemental services actually provided services. Over half of the districts (57 percent) required to offer supplemental services in 2003-04 did so, but among these districts 16 percent did not have any students sign up for services. Thus overall, 48 percent of districts required to offer supplemental services actually provided services in 2003-04, the same percentage as in 2002-03. These data are supported by district reports that, among districts not yet providing supplemental services in 2003-04, the primary reason for not providing services (68 percent) was
xvii

that no parents had signed up for services. Still, the increases in the numbers of eligible and participating students were substantial in 2003-04 compared with 2002-03. Much of the increase was in urban and very large districts, which tend to have large numbers of eligible students (an average of 9,000 and 16,000 eligible students, respectively), and reflecting the concentration of identified schools in these districts.
Supplemental service providers were primarily non-faith-based and non-online private providers (Exhibit S6). The number of private providers more than doubled from 2003 to 2004 and increased from 58 percent to 69 percent of all approved providers. Case study data indicated that monitoring supplemental service providers and evaluating their performance continued to be a challenge for states.
Exhibit S6 Supplemental Service Providers in 2003 and 2004
April 2003 April 2004 Difference
Type of provider Number of providers
Percent of total
Number of providers
Percent of total
Number of providers
Percent of total
Private: • Faith-based • Online • Other private
providers
18 98
472
2 10 46
96 162 984
5 9
55
78 64 512
3 -1 9
Districts and public schools 326 32 431 24 105 -8 Colleges and universities 32 3 38 2 6 -1 Other or unknown types 71 7 68 4 3 -3 Total 1,017 100 1,779 100 762 NA
Exhibit reads: In states that approved supplemental service providers, 18 approved providers (2 percent) were private faith-based organizations as of April 2003; as of April 2004, 96 approved providers (5 percent) were private faith-based organizations, a increase of 78 faith-based providers (3 percent more of all approved providers). Notes: Includes data from 47 states and the District of Columbia. Two states did not have schools required to provide supplemental services in 2003-04 and data were not available from one state. Sources: Policy and Program Studies Service unpublished database (PPSS 2004) and TASSIE state survey.
Districts reported that the challenges they most frequently faced in implementing Title I choice included the time needed for implementation (51 percent), the availability of alternatives (50 percent), and transportation (26 percent). Time to set up Title I choice alternatives and transportation were particularly challenging to very large districts (e.g., 70 percent reported time as a great to moderate implementation challenge), which had an average of 30 schools with eligible students. Additionally, as suggested by participation rates, case study data, and other data sources, parents continued to prefer to provide their children with extra assistance in their home school rather than transfer their child when a school is identified for improvement. Parent interviews revealed that a number of factors other than a school’s identification status (e.g., how well their children were achieving, the availability of special programs, the proximity of alternate schools to their home) influenced their decision to send their children to another school. The number of students receiving supplemental services increased
xviii

significantly between 2002-03, but this was not the case for the number of students transferring under Title I choice (Exhibit S4).
The most commonly reported district challenge in implementing supplemental services was lack of providers, especially in small and medium-size districts. In both 2002-03 and 2003-04, lack of providers in the area, as well as concerns about the appropriateness and quality of providers, provided districts with the most significant implementation challenges. Over time, states and districts appeared to improve the mechanics of offering choice and supplemental services, although districts struggled with communicating well with parents, and states had not figured out how to monitor the performance of providers adequately. For example, districts that offered Title I choice in 2003-04 and not in the prior year reported that implementation challenges were more significant compared with districts that offered Title I choice in both 2003-04 and 2002-03. Case study states expressed a need for technical assistance in how to assess provider performance in improving student academic achievement.
A majority (65 percent) of districts did not notify parents about their choice options prior to the opening of school, often because states had not provided timely notification on the AYP status of schools. For example, 11 states provided initial 2003-04 data on whether or not schools had met AYP to districts between September 2003 and January 2004. The timing of parental notification did not appear to influence rates of participation among students eligible for Title I choice; the average percentage of students in a district were not significantly different in districts that notified parents about their Title I school choice options before the beginning of the school year or after the start of the school year (5 percent compared with 13 percent). Case study data indicated that contacting and communicating clearly with parents about the availability of choice and supplemental services continued to present challenges to districts in 2003-04. At the same time, more districts (69 percent) provided parents with information about school performance on school report cards, although many of the report cards did not meet all the NCLB requirements for content.
Trends in State and District Assistance and School Improvement More states had systems of school support required under NCLB in place in 2003-04
than in 2002-03 (Exhibit S7). Moreover, states reported that their systems of support were serving larger proportions of identified schools than they had the year before. The majority of states reported that they served all or nearly all of their identified Title I schools via school support teams, distinguished educators, and/or other types of assistance.
xix

Exhibit S7 Elements of a Statewide System of School Support
2319
39
12
36
30
41
23
0
10
20
30
40
50
School supportteams
Distinguishededucators
Other types ofassistance
All threeelements of a
school supportsystem in
place
Num
ber o
f sta
tes
2002-03 2003-04
Exhibit reads: Twenty-three states had organized school support teams to serve Title I identified schools in 2002-03, compared with 36 states in 2003-04. Source: TASSIE state survey.
In 2003-04, almost all districts provided identified schools with some type of assistance on basic school improvement tasks such as writing an improvement plan and analyzing data, as they had in previous years (Exhibit S8). Districts continued to offer professional development on topics related to their school improvement priorities. In general, district activity in these areas had not changed since 2001-02, the year before NCLB went into effect. Moreover, districts with identified schools and other types of schools typically provided the same assistance to all their schools.
Schools continued to focus on increased data use, better planning, and adoption of new instructional programs as their primary improvement strategies. To improve their students’ performance, many identified schools reported a focus on achievement results (95 percent), adopted new curricula within the last three years (53 to 60 percent), or used school reform models (40 percent). The profile of school improvement strategies adopted by the cohort of Title I schools identified for improvement the year before NCLB went into effect changed very little after NCLB took effect. For example, in 2001-02 through 2003-04, more schools reported placing a major focus on increasing the use of student achievement data and matching curriculum and instruction with standards and assessments than on other school improvement strategies, such as teacher professional development.
xx

Exhibit S8 Major Focus of District Resources on Strategies for Improving
Identified Schools in 2003-04
45
64
50
54
35
28
75
76
0 20 40 60 80 100
Selecting and/or implementing a schoolreform model
Increasing monitoring and district oversight
Selecting and/or implementing a new curriculumor instructional program
Using research to inform decisions aboutimprovement strategies
Improving the school planning process
Increasing the quality and quantity of teacher andprincipal professional development
Matching curriculum and instruction withstandards and/or assessments
Increasing the use of student achievement data
Percentage of districts
%
Exhibit reads: In 2003-04, 76 percent of districts with identified schools reported that increasing the use of student achievement data was a major focus of district assistance. Source: TASSIE district survey.
However, continuously identified schools—those that were originally identified in
2001-02 and remained identified in 2003-04—reported conducting more improvement activities than their counterparts that were no longer identified (Exhibit S9). For example, 53 percent of continuously identified schools reported having adopted a mathematics curriculum within the last three years, compared with 35 percent of those no longer identified.
xxi

Exhibit S9 Engagement in Improvement Strategies in 2003-04,
by School Identification Status
53
60
95
100
35
41
76
89
0 20 40 60 80 10
Having a writtenschool plan
Using studentachievement data to
inform schoolimprovement efforts
Adoption of a newreading/language arts
curriculum
Adoption of a newmathematics
curriculum
Percentage of Title I schools
0
Continuously identified No longer identified
%
Exhibit reads: Fifty-three percent of continuously identified Title I schools had adopted a new mathematics curriculum within the last 3 years, compared with 35 percent of Title I schools no longer identified. Note: Differences significant at p < .05. Source: TASSIE principal survey. Although a much higher percentage of continuously identified schools compared to
those no longer identified received assistance from a school-based staff developer or support team, substantial numbers of identified schools did not receive such help, either because they were in districts and states that did not provide that assistance or because states or districts could not serve all of their identified schools. In spite of increases in state assistance, more than half (57 percent) of the continuously identified schools did not receive assistance from a school support team, and a more than a third (37 percent) did not receive assistance from a school-based staff developer (Exhibit S10).
xxii

Exhibit S10 School Reports of Assistance Received from School- Based Staff Developers and School Support Teams
in 2003-04, by School Identification Status
63
43
33
11
0 20 40 60 80 100
Assistancereceived fromschool support
team
Assistancereceived fromschool-based
staff developer
Percentage of Title I schools
Continuously identified No longer identified
%
Exhibit reads: Sixty-three percent of continuously identified Title I schools received assistance from a school-based staff developer, compared with 33 percent of schools that were no longer identified in 2003-04. Note: Differences significant at p < .05. Source: TASSIE principal survey.
Principals reported receiving little support and assistance for themselves. Only 14
percent reported receiving help from a mentor or coach, 26 percent reported that they met regularly with other principals of low-performing schools, and 6 percent said they had special supervision or reporting requirements.
In 2003-04, larger districts were more likely than smaller districts to provide
assistance of all kinds to their identified schools, as was true in previous years. Larger districts consistently reported higher levels of support for identified schools in most of the improvement strategies described above. In addition, the gap between smaller and larger districts did not change over the three years.
The presence or absence of various school improvement activities in a school had little
effect on the probability that a school would exit improvement once school poverty and district size were taken into account. School poverty and district size were strong predictors of whether a school would exit improvement status or remain identified for improvement. Of the seven improvement strategies and supports analyzed, only curriculum alignment—with an emphasis on professional development in this area—contributed to predicting whether a school would exit improvement, over and above demographic factors.
xxiii

Corrective Actions and Restructuring In 2003-04, only 6 percent of Title I districts had schools in corrective action (700
districts accounting for an estimated 2,000 schools). The majority of districts with identified schools (57 percent) did not have any schools in corrective action, and most of those that did had only one such school. The most common corrective actions taken by districts and states were appointing an outside expert to advise the school and requiring the implementation of a new research-based curriculum. Few districts (about 200) and states (12) indicated that they had any Title I schools identified for restructuring. Among the small group of schools identified for four or more years, very few reported any interventions associated with restructuring.
Conclusions If the trend of increasing concentration of identified schools in large urban districts
continues, it will increase the demands on large urban districts to provide support and assistance. This trend is consistent with research that indicates that many of the schools with chronic low achievement and students with the greatest needs are found in large urban districts (see for example, David and Shields 2001). Given the finding that some identified schools were receiving little or no assistance in 2003-04, large districts could find themselves stretched further beyond their capacity to provide support and assistance.
The expansion of Title I choice faces two major challenges. One is the need to create more
viable alternate school choices for parents. Even with only 1 percent of eligible students exercising choice, districts are not always able to provide satisfactory options. With the increasing concentration of identified schools, large districts will have an increasingly difficult time providing alternatives, especially at the middle and high school levels. Small rural districts are already having trouble. The second challenge is the hesitancy of parents to move their children to a school outside the neighborhood. Some of the apparent reluctance may be due to lack of information and understanding about the options. Several data sources point to the preferences of parents to have their children nearby and the appeal of tutoring in their home school.
Supplemental services are more appealing to parents, with slightly fewer than one-fifth of
eligible students participating. For supplemental services to reach more students means meeting three challenges. First, small and rural districts will need access to providers; to date, case study data indicate online providers are not always a solution because some students lack access to needed technology and some online programs have limits as to the types of student they can adequately serve (i.e., certain age groups, students who are limited-English proficient, and students with special needs) may not be able to access online providers. Second, states need assistance in figuring out how to monitor and assess the effectiveness of providers. Third, districts need help in working with providers and in communicating clearly with parents. If the numbers of parents requesting supplemental services increases, these challenges will intensify.
Although states and districts have taken many steps to provide support and assistance to
schools identified as in need of improvement, many schools are not receiving the more intensive assistance needed to make progress (e.g., from school-based staff developers). Most states and districts will require increased capacity to support identified schools (e.g., resources, knowledge
xxiv
base) and to deliver effective assistance. Districts were able to provide traditional types of assistance with planning and uses of achievement data, but they proved less able to help schools with the core work of instructional improvement through the efforts of school support teams, school-based staff developers, or other forms of intensive support. Districts will need assistance in determining how to work more strategically and intensively with schools that continue to miss AYP.
Compared to their counterparts who had exited improvement status as of the end of the
2002-03 school year, the finding that higher proportions of continuously identified schools were engaged in most of the improvement and support activities measured raises several issues. That they were conducting greater numbers of improvement activities and yet remained identified suggests three explanations. First, because continuously identified schools tend to be urban and poor, it is likely that they will still be identified in spite of all their activities because they are working with some of the most educationally disadvantaged populations: poor minority urban youth, many of whom are just learning English. A second explanation is the related finding that schools with more diverse populations are more likely to miss AYP (see for example, Novak and Fuller 2003). The third, supported strongly by the case studies, is that schools are grabbing at solutions—programs and strategies they think will increase scores quickly. As a result, they are doing many activities but not taking the kinds of coherent and sustained approaches that have the potential for a long-term payoff. Leadership by principals could play a role here; very few reported receiving support or assistance for themselves.
The finding that school poverty and district size better predicted exiting improvement
status than the improvement strategies undertaken by the schools is consistent with the historical relationship between economic status and test scores (see Coleman et al. 1966; Jencks 1972; Jencks and Phillips 1998). Given the relative contribution of improvement activities to schools exiting improvement, it appears likely that the schools that continue to be identified will need much more intensive assistance and more time to implement improvement strategies than they have had thus far.
xxv

I. Introduction
The Evaluation of Title I Accountability Systems and School Improvement Efforts study
tracked changes in states, districts, and schools in the 2001-02 school year, the year during which No Child Left Behind Act (NCLB) was signed into law, through its second full year of implementation in 2003-04. During 2001-04, states and districts took steps to align their accountability systems with NCLB and to help improve student achievement in Title I schools that did not meet required performance standards.
This report presents the key findings over the three years of the study. Findings from
2002-03, the first full year of NCLB implementation, showed that states and districts were making progress in implementing accountability systems under NCLB but that big gaps remained between their existing systems of accountability and the vision embodied in NCLB of coherent systems that support all schools and all students to reach high standards (U.S. Department of Education 2005b). During 2003-04, educators at all levels of the education system continued efforts to implement the accountability provisions of NCLB. This report describes how states, districts, and schools implemented Title I accountability and school improvement provisions in 2003-04 and discusses changes from the first and second years of the study.
Overall, states, districts, and schools were responding to NCLB requirements in different
ways; these differences were often associated with district size, urbanicity, and poverty. Five themes capture the trends observed over the duration of the study. Each has implications for the future of NCLB and is elaborated in this report.
• Identified Title I schools in small districts were more likely to exit improvement status than those in large districts; thus, identified schools became more concentrated in large districts.
• More students were eligible for choice and supplemental services in 2003-04 than in 2002-03; however, the proportion of parents exercising Title I choice remained small (1 percent) compared with 19 percent participating in supplemental services in 2003-04, an increase over the 7 percent from the previous year.
• More states, but not all, were providing technical assistance to identified schools (for example, 36 states provided school support teams to identified Title I schools in 2003-04, up from 23 states the year before), and most districts were providing a range of assistance with data analysis, school improvement planning and curriculum alignment in 2003-04, similar to what they provided in 2001-02 and 2002-03. However, many identified schools did not receive the types of assistance specified in NCLB (e.g., 57 percent of continuously identified schools reported that they did not receive assistance from a school support team in 2003-04).
• School improvement strategies remained similar across the three years, although schools that were still identified in 2003-04 engaged in more improvement activities than schools no longer identified.
1
• School poverty and district size better predicted exiting improvement status than the improvement strategies undertaken by the schools.
Overview of the Study Data collection for the study began in 2001-02, the last year of NCLB’s predecessor, the
Improving America’s Schools Act (IASA); the subsequent years 2002-03 and 2003-04 were the first two years in which states, districts, and schools operated under NCLB. The study was designed to investigate the means by which districts and schools were implementing accountability provisions under Title I, including the incentives provided to Title I schools to help them improve.
Data collection for this report consisted of four components that span the three years of the
study (additional information about the samples can be found in Appendix A):
• A yearly survey of district Title I administrators in a nationally representative sample of approximately 1,300 districts out of 11,200 districts nationally that received Title I funds during the study period. Districts were stratified according to size (enrollment), degree of poverty (based on the percentage of children living in poverty within each district), and population density (rural, suburban, urban). Response rates ranged from 88 to 91 percent across the three years of survey administration.
• A yearly survey of principals in a nationally representative sample of 739 Title I schools identified for improvement in 2001-02 drawn from the 1,300 sampled districts. Following this cohort of schools over three years allowed for an assessment of the extent of change in improvement status during the transitional period; factors or school characteristics that may have affected schools either exiting improvement status or remaining identified were also investigated. The schools from this sample that exited improvement status are referred to in this document as “no longer identified.” The schools that did not exit are referred to as “continuously identified.” It should be noted that this sample of schools is not representative of Title I schools identified since the inception of NCLB nor of schools that will be identified when NCLB is fully implemented in the future. Response rates ranged from 85 to 86 percent across the three years of survey administration.
• Yearly case study visits to 20 schools identified for improvement under Title I in 15 districts in five states. The five states were selected for variation on three critical accountability dimensions: state adequate yearly progress (AYP) definition, alignment of Title I and the general state accountability systems, and the state process for identifying schools in need of improvement. Within each of the five states, three districts were selected: a large urban district, a suburban district, and a rural district. Within each urban district, two elementary schools identified for improvement were selected. In the rural and suburban districts, one elementary school was chosen (often the only identified school in those districts). In each case study site, district staff, school staff, and parents of students in identified schools were interviewed.
2
• Interviews of state Title I administrators. Respondents included state Title I directors and accountability staff. These interviews, along with the examination of Consolidated State Application Accountability Workbooks for State Grants under NCLB (2003), provide a national picture of accountability systems and procedures, including state assistance to districts and schools. State data were gathered from 50 states and the District of Columbia. Tabulations of state data are based on interviews with staff in 48 states and the District of Columbia; two states did not respond to the telephone survey.
Statistics are reported only when the unweighted sample was 20 or more. Statistically
significant differences are noted in exhibits. Group differences reported in the text were statistically significant at p < .05. Details on the statistical tests and the standard errors of statistical estimates can be found in Appendix B.
Overview of the Report The report findings are organized around three topics related to the major accountability
provisions of NCLB: (1) public school choice and supplemental services, including communication with the public (Chapter III); (2) school improvement activities and the assistance provided to schools by states and districts (Chapter IV); and (3) corrective actions and restructuring activities (Chapter V). Schools and districts become subject to these accountability provisions when they are identified for improvement.
To understand the implementation of these provisions, it is important to have a picture of
the accountability requirements that were in effect during the last two years of the study. Similarly, it is important to understand the nature of the schools, districts, and states that are the subject of this evaluation. Therefore, Chapter II describes the range of schools that were identified for improvement under NCLB and that did not achieve adequate yearly progress and the districts that supported these schools in 2003-04. Consequences for schools identified for improvement are presented in Chapters III through V. Chapter VI presents the study’s conclusions. Findings based on survey data generally are presented as national estimates while findings based on case study data are presented as examples to help illustrate the more representative findings. Appendix A provides additional information on data collection and analysis methods, while Appendix B provides additional survey data for exhibits where only significant differences between years or types of districts and schools are provided to focus attention on particular items (the reader is directed to go to Appendix B where this occurs).
3

II. Context
The No Child Left Behind Act (NCLB) has framed a common goal for educators: to ensure
that no child, regardless of background, is left behind by the nation’s public education system. In particular, NCLB has strengthened accountability requirements for schools, districts, and states and has addressed the shortcomings and uneven implementation of accountability systems under the previous reauthorization of Title I. This chapter describes the accountability provisions of NCLB, followed by a description of the Title I districts and schools identified for improvement that are the subject of the study.
Because NCLB became law during the first year of the study and went into effect the
following year, the three-year investigation covers a period of changes from the previous reauthorization of Title I to the first two years of the implementation of accountability under NCLB.
Background: Accountability Provisions of NCLB Accountability stands at the center of NCLB. The logic of NCLB is clear: improving the
nation’s schools for all children requires the establishment of clear and high standards, the identification of schools in which students are not meeting those standards, options for parents of students in low-performing schools, support for struggling schools, and—for those schools that continue to perform poorly—increasingly rigorous interventions.
NCLB requires states to develop and implement a single, statewide accountability system
that is effective in ensuring that all districts and schools make AYP, and to hold accountable those schools that do not show progress. The legislation was designed to help all students reach proficiency by 2013-14 by requiring that states create annual assessments that measure what children know and can do in reading and mathematics in grades 3 through 8, as well as testing at least once between grades 10 and 12 by 2005-06, and in science by 2007-08 (Exhibit 1).4
Assessment data are to be disaggregated for students by poverty level, race, ethnicity,
disability, and limited English proficiency (LEP) status to ensure that attention is focused on all students and that all schools are held accountable for reaching AYP targets for students in each major subgroup at the school. In addition to AYP calculations based primarily on state assessment results in reading or language arts and mathematics, NCLB requires that AYP definitions include minimum assessment participation rate targets of 95 percent, graduation rates for high schools, and at least one other state-selected academic indicator for elementary and middle schools. Annual school “report cards” are required to provide comparative information on the quality of all schools so that parents can make more informed choices about their children’s education. The report cards are to show how well all of a school’s students are doing in regard to meeting standards, and they also must chart the progress of subgroups. This later aspect is used to track the closing of the achievement gap between various student populations.
4 NCLB does not require that science assessments be used to determine AYP.
5

Exhibit 1 Summary of Key NCLB Accountability Requirements
Topics NCLB requirements
Single, statewide system All students must be assessed by the same state assessment, and AYP definitions must apply to all schools and districts in the state, both Title I and non-Title I.
Public reporting State and district report cards are required to include information on state assessment results, schools and districts identified for improvement, and certain other information.
Performance measures used in AYP definitions
Annual state assessments must be administered to students in reading or language arts and mathematics. Assessments must be administered at least once in grades 3-5 and 6-9 until 2005-06, when all grades 3-8 must be assessed; assessments also must be administered at least once in grades 10-12. Assessment participation rates, graduation rates, and another academic indicator for elementary and middle schools must be included. States can include additional indicators.
Criteria for state definitions of AYP for schools
The criteria must include absolute targets for measures of school performance in reading or English language arts and mathematics. Participation rate targets must be at least 95 percent. The criteria must provide for all students to reach proficiency within 12 years (by 2013-14) and set annual measurable objectives and intermediate goals. The baseline achievement must be calculated by following a specific formula. The criteria must include separate, absolute targets for key groups of students (all students, major racial and ethnic groups, economically disadvantaged students, students with disabilities, and LEP students). Districts may use additional criteria to add schools to, but not subtract them from, state lists of identified schools.
AYP for districts The formula for AYP must be the same for districts as for schools. Identification of schools for improvement
Title I schools that do not make AYP for two consecutive years must be identified for improvement under Title I.
Identification of schools for corrective action
Title I schools that do not meet AYP for four years (after at least two years in improvement status) must be identified for corrective action.
Identification of schools for restructuring
Title I schools that do not make AYP for five and six years (after at least three and four years in improvement status) must be identified for restructuring (planning for restructuring for one year, then restructuring the following year).
Identification of districts for improvement
Districts that do not make AYP for two consecutive years must be identified for improvement under Title I. Districts that do not make AYP for four years (after at least two years of improvement status) must be identified for corrective action under Title I.
Exiting improvement, corrective action, and restructuring status
A school or district may exit from improvement, corrective action, or restructuring status when it makes AYP for two consecutive years following its identification for improvement, corrective action, or restructuring.
(continued, next page)
6

Exhibit 1 (continued) Summary of Key NCLB Accountability Requirements
Topics NCLB requirements
District assistance for schools identified for improvement
Districts must provide technical assistance to identified schools to: • Develop and implement their school improvement plans. • Analyze assessment data. • Identify and implement professional development, instructional
strategies, and methods of instruction derived from relevant scientifically based research
• Analyze and revise the school budget to more effectively allocate school resources to support activities most likely to increase student achievement.
Consequences for schools identified for improvement
Schools must develop or revise a school improvement plan. Schools must spend not less than 10 percent of their Title I funds for professional development.
Parents of students in identified schools must be offered the option to transfer their child to a non-identified school in the district, with transportation provided.
Districts must offer students from low-income families in identified schools supplemental educational services from an approved provider (beginning in year two of improvement).
Consequences for schools identified for corrective action
Consequences from years one and two of improvement continue to apply. Districts must implement one of a series of corrective actions defined in the legislation.
Consequences for schools identified for restructuring
Consequences from years one and two of improvement continue to apply. Districts must spend the first year planning to implement at least one of a series of school restructuring efforts. During the second year, districts must implement the schools’ restructuring plans.
Consequences for districts identified for improvement
Districts must develop or revise a district improvement plan. Districts must spend not less than 10 percent of their Title I funds for professional development.
States must provide technical assistance to identified districts. Consequences for districts identified for corrective action
States must implement one of a series of corrective actions for identified districts.
State assistance for identified districts and schools
States are required to establish a statewide system of support—including school support teams, distinguished principals, and distinguished teachers—to assist schools and districts identified for improvement and corrective action, as well as other districts and schools receiving Title I funds.
Title I Schools and Districts Identified for Improvement The number of identified schools remained roughly the same from 2002-03 to
2003-04—although the demographic distribution of identified schools, and of districts with identified schools, shifted. An estimated 5,600 Title I schools were identified for improvement
7

in 2003-04, compared with an estimated 6,000 identified schools in 2002-03. This represents about 12 percent of all Title I schools, compared with 13 percent in 2002-03.5
Exhibit 2 Distribution of Identified Title I Schools in 2001-02 and 2003-04,
by District Size
4127
20
25
16
19
1934
0%
20%
40%
60%
80%
100%
School year 2001-02
School year 2003-04
Perc
enta
ge o
f Titl
e I s
choo
ls
Small (200 to 3,503)
Medium (3,504 to10,448)Large (10,449 to 37,740)
Very large (>37,740)
100 100
Exhibit reads: Of the estimated number of identified Title I schools, 34 percent were located in small districts in 2001-02 compared with 19 percent in 2003-04. Notes: Differences significant at p < .01. (See Appendix B for complete data table.) Source: TASSIE District and School Database (see Appendix A for definition).
Between 2001-02 and 2003-04, there was a steady trend toward a greater concentration of identified schools in large or very large districts and in urban districts. Sixty-six percent of schools identified in 2003-04 were in large or very large districts, compared with 48 percent in 2001-02 and 56 percent in 2002-03. This figure represents a disproportionate share because large and very large districts only contain about one-third (36 percent) of all Title I schools. Comparing 2001-02 to 2003-04, there was a decline in the proportion of identified
5 Estimates of the number of identified Title I schools (5,565 schools with a margin of error +/- 550) and districts
with identified schools are based on data from the TASSIE District and School Database and vary slightly from estimates derived from respondents to the district survey. The estimate of the number of identified schools in 2003-04 is consistent with the number of identified schools reported by the U.S. Government Accountability Office (6,200 schools) and Education Week (5,869 schools). The majority (65 percent) of Title I schools identified for improvement in 2003-04 were elementary schools, but this proportion is smaller than the 71 percent of all Title I schools that are elementary.
8

Title I schools from small districts—from 34 percent to 19 percent (Exhibit 2). Over half (53 percent) of identified Title I schools were located in urban districts in 2003-04, compared with 39 percent in 2001-02.
Schools that served higher percentages of low-income families were
disproportionately represented among identified schools. Whereas about 41 percent of all Title I schools fit into the highest poverty category, 72 percent of all identified schools were in this same category. Only 5 percent of identified Title I schools were in the lowest of the three poverty categories even though a quarter (23 percent) of all Title I schools are in this category (Exhibit 3).
Exhibit 3
Distribution of Identified Title I Schools Compared With All Title I Schools in 2003-04, by District Poverty
73
41
22
36
5
23
0%
20%
40%
60%
80%
100%
Identified schools All Title I schools
Perc
enta
ge o
f Titl
e I s
choo
ls
Low poverty
Medium poverty
Highest poverty
100100
Exhibit reads: Of the estimated number of identified Title I schools in 2003-04 (5,600), 5 percent were located in districts with the lowest poverty level, whereas 23 percent of all Title I schools were located in districts with the lowest poverty level. Notes: Title I status (identified, not identified) was significantly associated with district poverty at p < .01. (See Appendix B for the complete data table.) Source: TASSIE district survey.
These findings converge with a 2004 report from the U.S. Government Accountability
Office (GAO) that found that schools identified in 2003-04 were disproportionately located in
9

urban and suburban areas and enrolled larger proportions of minority students and students from low-income families (GAO 2004).6
Similarly, continuously identified schools in 2003-04 compared with those no longer
identified were more likely to be in very large districts (Exhibit 4).7 The same pattern was found based on district urbanicity, district poverty, and size of the school. That is, schools that remained identified were also more likely to be located in urban areas (55 percent compared with 32 percent for non-identified schools), serving high proportions of low-income families (77 percent compared with 44 percent for non-identified schools), and to be large schools consistent
Exhibit 4 Distribution of Continuously Identified and No Longer Identified
Title I Schools in 2003-04, by District Size
19
4919
25
23
14 40
12
0%
20%
40%
60%
80%
100%
Schools stillidentified
Schools no longeridentified
Perc
enta
ge o
f Titl
e I s
choo
ls
Small (200 to 3,503)
Medium (3,504 to 10,448)
Large (10,449 to 37,740)
Very large (>37,740)
100100
Exhibit reads: Twelve percent of Title I schools still identified were located in small districts compared with 40 percent of Title schools no longer identified. Notes: Title I status (identified, not identified) was significantly associated with district size at p < .01. Percentages may exceed 100 percent because of rounding. (See Appendix B for complete data table.) Source: Demographic distribution of schools in the TASSIE school sample that responded to the school survey in 2001-02 and/or 2003-04.
6 It should be noted that samples and methods may vary across studies. Thus, although findings that converge
across studies strengthen the reliability of each given finding, specific percentages and other statistics are not directly comparable across studies.
7 As noted in the introduction, “continuously identified” schools are those that were identified for improvement at the beginning of this study in 2001-02 and continued to be identified in 2003-04.
10

with their location in large districts that tend to have larger schools than small districts (35 percent of identified schools had enrollments of more than 750 students compared with 15 percent of schools no longer identified).
The proportion of schools that were identified for improvement in 2003-04 varied
widely across states. For example, 37 states had less than 10 percent of their schools identified for improvement in 2003-04, while three states had 25 percent or more of their schools identified. Data collected by Education Week (2004) includes one additional year of data. Their data indicate that variation in the number of identified schools across states continued in 2004-05 but shifted as fewer states had small proportions of identified schools and more states had larger percentages of their schools identified. For example, in 2003-04, almost three-quarters of the states (37 states) had fewer than 10 percent of their schools identified; in 2004-05, more than half of the states (28 states) had 10 percent or more of their schools identified (Exhibit 5). This same data base showed that there was a substantial increase in the number of identified schools nationwide in 2004-05.
Exhibit 5
Number of States With Varying Percentages of Their Schools Identified for Improvement, 2003-04 and 2004-05
38
11
20
35
22
2
0
10
20
30
40
50
60
2003-04 2004-05
Num
ber o
f sta
tes
0% of all schoolsin state
1% to 9% of allschools in state
10% to 24% of allschools in state
25% or more ofall schools instate
51 50
Exhibit reads: In 2003-04, two states had no schools identified for improvement. In 2004-05, no states had none of their schools identified. Note: One state’s 2004-05 data was not yet available. Source: For school year 2003-04, Education Week (2004), with missing values for nine states filled in from TASSIE state data. For 2004-05 data, Education Week.
11

Similarly, state data indicate that there was a great deal of variation across states in the proportion of schools that missed AYP in 2003-04 (based on 2002-03 testing). For example, seven states had less than 10 percent of their schools miss AYP targets in 2003-04, while eight states had more than 50 percent of their schools miss AYP targets. State data indicated that 26,323 schools nationwide did not achieve AYP for school year 2003-04. This number represents 28 percent of all schools in the nation.8
The relationship between district size and the proportion of schools not meeting AYP
reflects the role of subgroups in school identification. Under NCLB, if a school contains a minimum number of students (as defined by the states) in specific subgroups (e.g., low income, racial and ethnic minorities, LEP, students with disabilities), schools are held accountable for the academic outcomes of those groups, in addition to the academic outcomes of the entire school. Large or diverse schools are likely to have more student groups containing the state-defined minimum number of students, and consequently have more performance targets to meet. Because it is more difficult for schools with many targets to meet all of their performance goals, districts with larger or more diverse schools are more likely to have a higher percentage of schools miss their targets and be identified for improvement under NCLB (see, for example, Novak and Fuller 2003). TASSIE data allowed only limited analysis of this issue, but tends to support this conclusion (see also, GAO 2004).
Districts With Identified Schools
The total number of districts with identified Title I schools decreased between 2001-02 and 2003-04. From 2002-03 to 2003-04, this decrease resulted in a higher concentration of identified schools in those districts with identified schools. An estimated 1,500 school districts had identified Title I schools in 2003-04. This number represents 14 percent of districts nationwide. In 2001-02, 21 percent of Title I districts were found to have at least one identified school; in 2002-03, this proportion was 16 percent. About 300 districts nationwide that had identified schools in 2002-03 no longer had any in 2003-04.
In 2002-03, almost three-quarters (74 percent) of the districts with identified schools had only one or two such schools to provide assistance, and in 2003-04, the proportion of districts having just one or two identified schools was 70 percent. Conversely, in 2002-03, only 2 percent of the districts with identified schools had 13 or more identified schools, but in 2003-04, 4 percent of those districts with at least one identified school had 13 or more such schools (Exhibit 6).
Districts with identified Title I schools in 2003-04 were more likely to be large, urban,
and poor, compared with districts without identified schools. For example, 55 percent of districts with identified schools were in the highest poverty level (more than 22 percent of students eligible for free or reduced-price lunches), compared with 21 percent of those districts without identified Title I schools. Whereas overall, 5 percent of Title I districts were classified as urban districts, 17 percent of districts with identified schools were urban. Twenty-three
8 An Education Week report, published in late 2004, showed a total of 24,611 schools that did not make AYP for
2003-04. Because some states include non-Title I schools in their reports, it is not possible to specify the percentage of these schools that are non-Title I schools.
12

percent of districts with identified schools were large districts, compared with 4 percent of those districts without identified schools.
Exhibit 6
Districts With Different Numbers of Identified Title I Schools, Among Districts With Identified Title I Schools in 2002-03 and 2003-04
74 70
1513
10 112 4
0%
20%
40%
60%
80%
100%
2002-03 2003-04
Perc
enta
ge o
f Titl
e I s
choo
ls
13 or more identifiedschools in thedistricts
5 to 12 identifiedschools in thedistricts
3 to 4 identifiedschools in thedistricts
1 to 2 identifiedschools in thedistricts
10 10
Exhibit reads: In 2002-03, among districts nationwide that had identified Title I schools, 2 percent had 13 or more identified Title I schools. In 2003-04, among districts nationwide that had identified Title I schools, 12 percent had 13 or more identified Title I schools. Notes: Percentages may not add to 100 because of rounding. (See Appendix B for the complete data table.) Source: TASSIE 2003-04 district survey.
Districts Identified for Improvement
In 2003-04, eight states had identified a total of 51 districts for improvement; this number represents less than 1 percent of districts nationwide. However, in 2003-04, 23 percent of districts had been designated as not having achieved AYP.9 Any of these districts that miss AYP again based on 2004-05 testing will be identified. However, as noted in a report by the Council of Chief State School Officers (Forte Fast and Erpenhach 2004), a sizable portion of states applied and received approval for amendments to their accountability plans; these amendments will alter the formulas used to identify districts for improvement (e.g., for a district to be identified for improvement, it would have to miss AYP at each of three grade levels: elementary, middle, and high school, for two years in a row), thus likely reducing the rate at which districts will miss AYP, all else being equal.
9 This percentage was obtained from the TASSIE state data collection process.
13

Knowledge of Accountability Elements Knowledge of NCLB school accountability requirements increased among district
administrators in 2003-04. Eighty-nine percent of district Title I administrators reported that they understood all or most elements of AYP determination for their schools, and the percentage who understood all or most of the elements for district AYP determination was essentially the same. In 2002-03, 76 percent of district administrators reported that they had this knowledge.
The accuracy of school principals’ report of their identification status improved
markedly in 2003-04, compared with 2002-03. Ninety-three percent of principals of continuously identified schools were aware of this status. In the previous year, 66 percent of principals of identified schools were aware of their schools’ status. It is important to note that this measure of improved awareness can be generalized only to the population of schools identified in 2001-02 and that continued to be identified in 2003-04 (i.e., this group of schools has been identified for at least three years and therefore have had several years of involvement in the accountability process).
District and school staff were clearer about the basis for AYP and identification than
in the previous year in three of the five case study states but not clear about the consequences of different designations. Across the case study sites in 2003-04, school and district staff were more aware of the basis for AYP designations and identification status in over half the districts. Confusion continued, however, in districts in two states, one where the state accountability process remains the most salient and another where the state changed its labeling system for schools. School staff were less familiar than district staff about the basis for identification and were particularly uninformed about the consequences associated with different determinations.
14

III. Title I Choice and Supplemental Educational Services
Public school choice under Title I, allowing parents with children in Title I schools
identified for improvement to transfer their child to another public school, is a key strategy in NCLB for improving educational outcomes. Under NCLB, for Title I schools that do not make AYP for two consecutive years (i.e., “identified schools”), districts must provide parents of students in these schools with the option of transferring their child to a school in the district that has not been identified for improvement and provide transportation. If a school does not make AYP for three years (one year after being identified), districts must provide low-income parents of children in these schools with the option of supplemental educational services from state-approved providers for their children.
NCLB also requires that a district make available an amount up to 20 percent of the
district’s Title I, Part A, allocation to fund Title I choice-related transportation and supplemental services. Unlike public school choice, supplemental services are offered only to children from low-income families and not to parents of all children in identified Title I schools. Districts are to notify parents about these options so that they have time to make informed decisions for each school year. Notification about Title I choice and supplemental services is an extension of NCLB’s underlying principle of providing parents and the public with a clear understanding of the progress for which schools are being held accountable.
In brief, the findings show that the proportion of students who participated in Title I school
choice remained at 1 percent in both 2002-03 and 2003-04. Small and rural districts were the least likely to have students who transferred schools and had the fewest alternatives from which to choose. The percentage of parents choosing to enroll their children in supplemental services increased from 7 percent to 19 percent over the same period. Still, fewer than half the districts required to offer supplemental services did so. States and districts improved at the mechanics of offering choice and supplemental services in 2003-04, but districts still faltered in timely notification of parents and states struggled in monitoring the performance of supplemental service providers.
These findings are elaborated below, looking first at public school choice under Title I and
then supplemental services. Under public school choice, the findings are organized in three sections: eligibility and participation in Title I choice, choice options, and barriers to providing and exercising choice. Under supplemental services, the findings are organized in three parallel sections: eligibility and participation in supplemental services, providers of supplemental services and how they are approved, and barriers to providing and participating in supplemental services. The chapter then presents findings on how parents are notified about Title I choice and supplemental services, followed by findings on the broader topic of public reporting by states and districts under NCLB.
Public School Choice Under Title I NCLB requires districts to give parents of all children enrolled in Title I schools identified
for school improvement, corrective action, or restructuring the opportunity to transfer their
15

children to a school in the district that has not been so identified. Public school choice must be offered to such students by the next school year, unless prohibited by state law. Districts are required only to offer public school choice options within the district; however, if all public schools in the district to which students might transfer have been identified as needing improvement, the districts must “to the extent practicable” establish cooperative agreements with other districts to provide public school choice options. Children who transfer schools under Title I choice are allowed to remain in the school to which they transfer until they complete the highest grade in that school; however, the district is no longer required to provide transportation services if the originating school makes AYP standards for two consecutive years and thus exits improvement status (see U.S. Department of Education nonregulatory guidance, 2004b).
Eligibility and Participation
Among districts that provided Title I choice in 2003-04, an estimated 2.75 million students were eligible to exercise choice because they were enrolled in an identified Title I school; about 3 percent of these students requested a transfer from an identified school, and about 1 percent then transferred to another school (Exhibit 7). The number of eligible students in 2003-04 increased substantially, while the number and percentage of districts and schools offering choice remained consistent. This likely reflects the increasing concentration of identified schools in large and urban districts and the increase in the number of middle and high schools identified. Urban schools are typically much larger than their counterparts in small and rural districts. Districts that did not provide Title I choice were primarily small (82 percent), and rural (88 percent).
Exhibit 7 Districts and Schools Required to Offer Title I Choice, Those That Offered Choice,
and Students Who Exercised Choice in 2002-03 and 2003-04 2002-03 2003-04 Students (among districts that provided choice):
Number eligible Number who participated Proportion who participated
1,535,000
18,000 1%
2,752,000*
32,000 1%
Schools: Number where choice required Number where choice offered Proportion where choice offered
6,000 5,000
84%
5,600 4,600
83% Districts:
Number with schools where choice required Number with schools where choice offered Proportion where choice offered
1,800 1,200
66%
1,600 1,100
67% Exhibit reads: Among districts that had identified schools and offered choice in 2002-03, an estimated 1,535,000 students nationwide were eligible for Title I choice; in 2003-04, the estimate was 2,752,000 students. *Notes: Asterisk indicates significant differences at p < .01. The number of students eligible is underestimated, and therefore the percent participating is overestimated, because not all districts that should have provided choice reported providing this option and thus did not provide eligibility data (about 21 percent of the districts with identified Title I schools). The estimated 1.5 million has a margin of error of +/- .6 million, and 2.75 million has a margin of error of +/- .7 million. The estimates in this exhibit vary slightly from those presented earlier because they are based on respondents to the district survey and not the TASSIE District and School Database.
Source: TASSIE district survey.
16

Although the number of students eligible for choice nationally increased between 2002-03 and 2003-04, the percentage of students who transferred remained constant (1 percent). The percentage remained the same because both the number of students eligible for and the number exercising choice increased proportionately.
Districts varied widely in the number of schools with students eligible for choice; the
largest districts had by far the most schools (Exhibit 8). The average of four schools per district masks the large difference between small districts with an average of one school and very large districts with an average of 30 schools. Similarly, urban districts had more schools required to offer choice (12 schools) than suburban (two schools) and rural (one school). Again, these findings are consistent with the increase in the number of identified schools in the largest urban districts. Districts with large numbers of schools required to offer choice faced greater logistical challenges in setting up their choice programs (see discussion below regarding barriers to implementation).
Exhibit 8
Average Number of Schools With Students Eligible to Exercise Choice, Among Districts That Provided
Title I Choice in 2003-04
4
1
2
4
30
0 10 20 30 4
All districts
Small districts
Mediumdistricts
Large districts
Very largedistricts
Mean number of schools
0
Exhibit reads: The average number of schools with students eligible to exercise choice in very large districts that were required to provide choice and did so was 30. (See Appendix B for the complete data set.) Source: TASSIE district survey.
While there were large differences in the average number of schools with students eligible
for Title I choice across districts, there were no significant differences in the percentage of Title I schools required to offer Title I choice by district size (between 23 and 29 percent). Larger districts have greater numbers of Title I schools and proportionately greater numbers of identified schools than smaller districts.
17
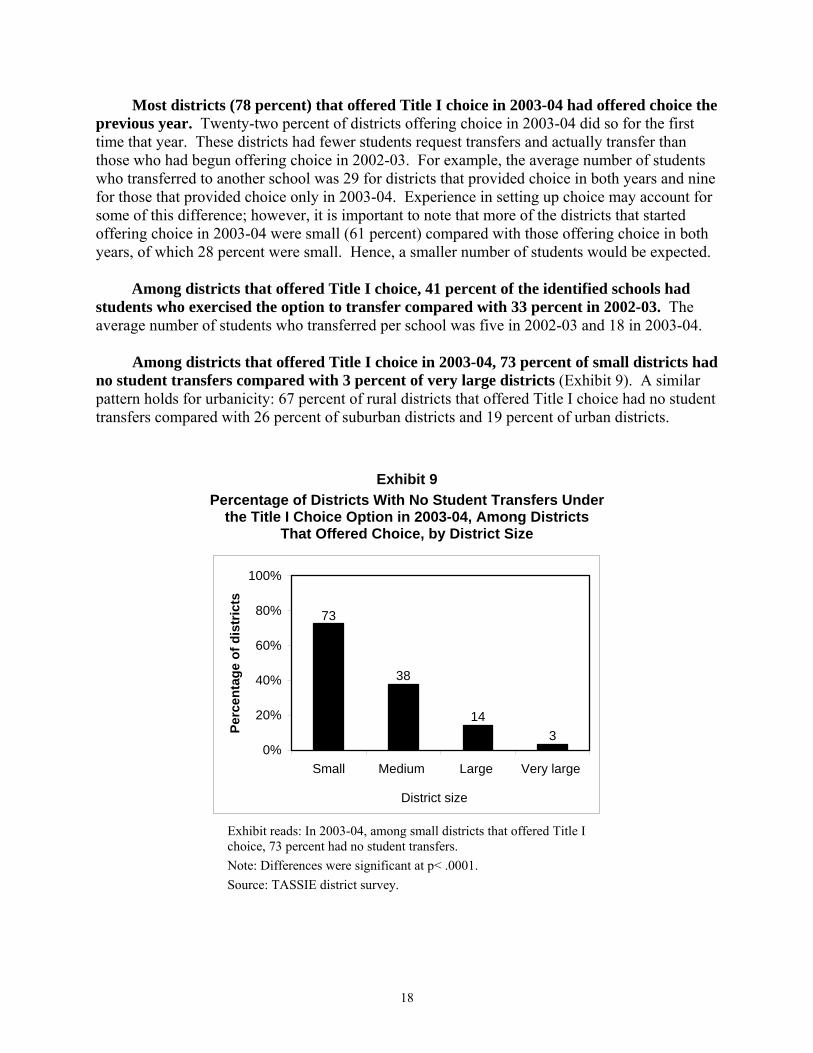
Most districts (78 percent) that offered Title I choice in 2003-04 had offered choice the previous year. Twenty-two percent of districts offering choice in 2003-04 did so for the first time that year. These districts had fewer students request transfers and actually transfer than those who had begun offering choice in 2002-03. For example, the average number of students who transferred to another school was 29 for districts that provided choice in both years and nine for those that provided choice only in 2003-04. Experience in setting up choice may account for some of this difference; however, it is important to note that more of the districts that started offering choice in 2003-04 were small (61 percent) compared with those offering choice in both years, of which 28 percent were small. Hence, a smaller number of students would be expected.
Among districts that offered Title I choice, 41 percent of the identified schools had students who exercised the option to transfer compared with 33 percent in 2002-03. The average number of students who transferred per school was five in 2002-03 and 18 in 2003-04.
Among districts that offered Title I choice in 2003-04, 73 percent of small districts had
no student transfers compared with 3 percent of very large districts (Exhibit 9). A similar pattern holds for urbanicity: 67 percent of rural districts that offered Title I choice had no student transfers compared with 26 percent of suburban districts and 19 percent of urban districts.
Exhibit 9 Percentage of Districts With No Student Transfers Under
the Title I Choice Option in 2003-04, Among Districts That Offered Choice, by District Size
73
38
143
0%
20%
40%
60%
80%
100%
Small Medium Large Very large
District size
Perc
enta
ge o
f dis
tric
ts
Exhibit reads: In 2003-04, among small districts that offered Title I choice, 73 percent had no student transfers. Note: Differences were significant at p< .0001. Source: TASSIE district survey.
18

Choice Options
Most districts that offered Title I choice provided parents with choices among several schools in the district not identified for improvement. Fewer options existed in small districts and fewer existed at the middle and high school level across districts.
Two-thirds of districts that offered Title I choice gave parents a choice of all other
schools in the district at the appropriate grade level that were not identified for improvement. Small districts were more likely than large districts to offer parents all other schools not identified for improvement. Eighty-five percent of small districts and 74 percent of medium districts offered all other schools in the district at the appropriate grade level, compared with 39 percent of very large districts and 46 percent of large districts. Other options specified in the survey were provided less frequently by districts offering choice: 18 percent offered a subset of schools that had been paired with the sending school, 17 percent offered all other schools within a certain geographic zone, and 9 percent offered public schools outside the district. Urban districts (28 percent) and suburban districts (20 percent) were more likely than rural districts (10 percent) to offer a subset of schools that had been paired with the sending school.
In both 2002-03 and 2003-04, the majority of districts (77 percent and 71 percent,
respectively) were able to provide parents with at least two alternate schools at the elementary level. The larger and more urban the district, the more alternate schools were available to families at the elementary and middle school grades (see, for example, Exhibit 10). Overall, the average number of alternate schools available to families at the elementary level was five (the median was two), the average at the middle school level was two (the median was one), and the average at the high school level was one (the median was zero). The smaller numbers of alternate schools at the upper grade levels are the result of two factors. One is that there are fewer middle and high schools than elementary. The other is that proportionately more middle and high schools were identified for improvement in 2003-04, compared with all Title I schools (GAO 2004). Roughly 24 percent of all schools identified for improvement were middle schools, while 16 percent of all Title I schools were middle schools; 11 percent of all schools identified were high schools, while 9 percent of all Title I schools were high schools. Conversely, 61 percent of all Title I schools identified for improvement were elementary schools, where 71 percent of all Title I schools were elementary.10 At the same time, overall, more than three-quarters (76 percent) of students who actually transferred schools in 2003-04 received their first choice of schools.
10 The remaining 4 percent are defined as “other” schools, which include ungraded schools (GAO 2004). GAO also
reported that parents of eligible students in their eight case study districts were generally offered fewer transfer options for middle and high school students because districts tended to have fewer middle and high schools than elementary schools.
19

Exhibit 10 Average Number of Alternate Elementary Schools Available to Parents With Students in Identified Title I Schools in 2003-04,
Among Districts That Offered Choice, by District Size
12
6
4
2
6
2 2
5
21
* *0
2
4
6
8
10
12
14
Very large Large Medium Small
District size
Num
ber o
f ele
men
tary
sch
ools
Elementary School Middle school High school
Exhibit reads: Among very large districts that offered Title I choice in 2003-04, the average number of alternate schools available to families in identified Title I elementary schools was 12, compared with six alternate elementary schools in large districts, four in medium districts, and two in small districts. (See Appendix B for the complete data set.) Note: * too few cases to report. Source: TASSIE district survey.
The school choice options districts provided to parents were not necessarily higher
performing schools, even in districts that offered all schools not identified. The case study districts provided several examples of this phenomenon (Exhibit 11). For example, one district offered to parents as options alternate schools that they thought were likely to miss AYP at the end of the year because they had few schools to offer as alternatives to identified schools. Findings from the GAO report on the implementation of Title I choice in 2003-04 were similar. Among the eight case study districts they visited, many schools that districts offered as transfer options had not met state performance goals in the prior year, and some were at risk themselves of having to offer choice in the following year. Officials from large urban GAO case study districts stated that they would have had few schools to offer as choices if they had not offered Title I schools that had failed to make AYP for one year (GAO 2004). One of the very large TASSIE urban case study districts with 40 percent of its schools identified conducted a capacity study in August 2003 and found that there were very few schools to serve as choice options and none at the middle school level.
20

Exhibit 11 Options for Parents Not Always an Improvement
In one large case study district, several parents chose to transfer their children to a newly opened school that had lower scores than the sending school and missed AYP its first year. Because the school moved into a new facility and changed its name, the clock was restarted for determining school improvement status. In another large case study district, parents explained that they preferred to leave their children in the identified school because it offered an array of programs not found in the alternate schools, particularly programs for limited English speaking students.
Both this study’s case study districts and those of GAO illustrate that as the number of identified schools increased, the number of alternate schools decreased. This trend was especially acute at the middle and high school level where a higher proportion of schools had been identified, coupled with the smaller numbers of secondary schools relative to elementary schools. Fourteen percent of districts responded on the district survey that they were unable to increase the range of choices available to parents or increase the number of spaces in schools that could receive transfers in 2003-04.
Half of districts offering Title I choice took some steps to increase the options available to parents of children in identified Title I schools. The most frequently reported approach (22 percent) was to provide supplemental services from state-approved providers at schools in the first year of improvement status (Exhibit 12). Still, more than half (51 percent) of districts that provided Title I choice did not report taking any steps in 2003-04 to increase the range of choices available to parents, given the small number of students that requested transfers. Nine percent of districts offering Title I choice reported negotiating agreements with neighboring districts. The success of interdistrict choice depends on the feasibility of such transfers, including the capacity and willingness of neighboring districts to accept transfers and the willingness of parents to have their child transported out of the district. Case study data suggested that currently these options are not attractive to receiving districts or parents.
21

Exhibit 12 Steps Taken by Districts to Increase the Range of Choices Available
to Parents With Children in Identified Schools in 2003-04, Among Districts That Offered Title I Choice
16
1
9
10
22
0 5 10 15 20 25
Other steps
Creating schools within schools to accommodatestudents who wish to transfer
Negotiating an agreement with one or moreneighboring districts to accommodate students
who wish to transfer
Adding teachers and/or classrooms to schoolswithin the district that are not identified for
improvement
Offering supplemental educational services fromstate-approved providers to students in Title I
schools in their first year of improvement
Percentage of districts%
Exhibit reads: Among districts that offered Title I choice in 2003-04, 22 percent of districts offered supplemental services from approved providers to students in Title I schools in their first year of improvement. Source: TASSIE district survey.
Barriers to Providing and Exercising Choice Districts consistently reported several challenges in implementing Title I choice,
including time for implementation, availability of alternatives, and transportation. The biggest challenges reported by districts did not change from 2002-03 to 2003-04 nor did they differ between districts that implemented choice and those that did not, among all districts required to implement choice in those years. Among districts that offered Title I choice, various challenges were reported by 26 percent or more districts to exist to a great or moderate extent (Exhibit 13). The two challenges cited most frequently concerned space in receiving schools: 50 percent of districts reported that both lack of space in alternate schools was a great or moderate challenge and that creating more space (through adding on classrooms, for example) in alternate schools were great or moderate challenges. The adequacy of the required 20 percent set-aside of an amount equal to the district’s Title I allocation to provide transportation for Title I choice and supplemental services was reported as a minor problem by the most (86 percent) of districts.
Two challenges—the amount of time needed to set up Title I choice alternatives and the lack of transportation to alternate schools—differed by district size and urbanicity. The largest
22
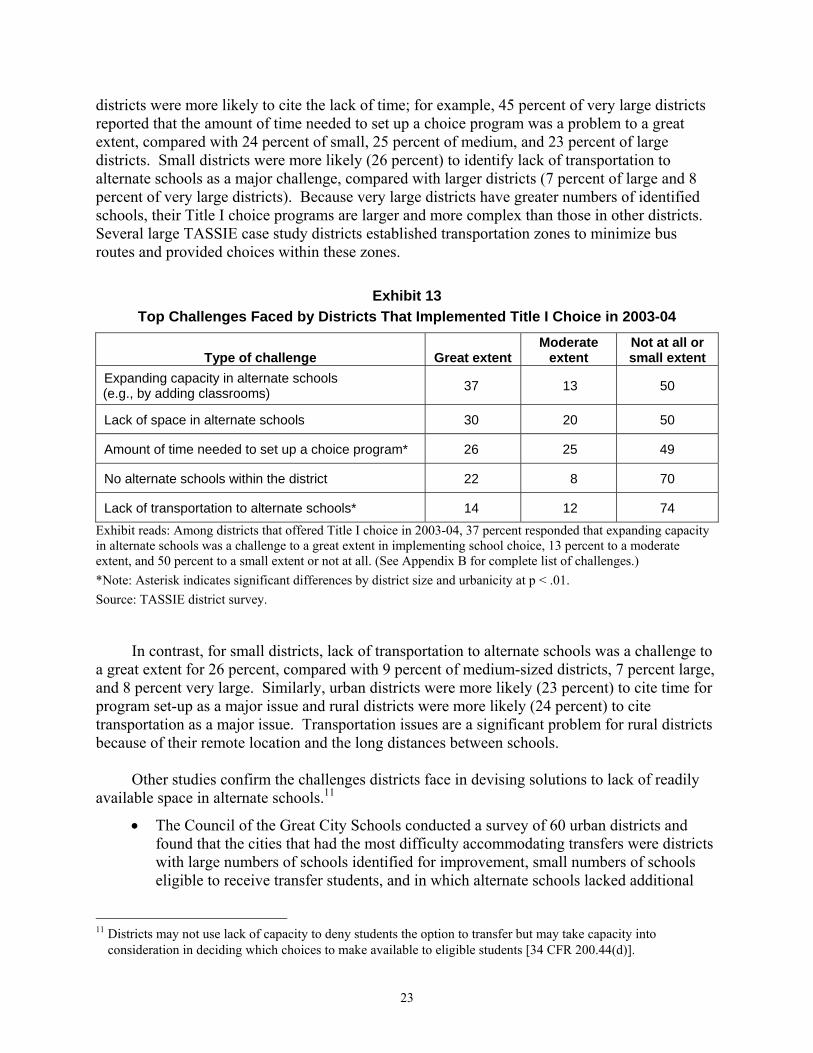
districts were more likely to cite the lack of time; for example, 45 percent of very large districts reported that the amount of time needed to set up a choice program was a problem to a great extent, compared with 24 percent of small, 25 percent of medium, and 23 percent of large districts. Small districts were more likely (26 percent) to identify lack of transportation to alternate schools as a major challenge, compared with larger districts (7 percent of large and 8 percent of very large districts). Because very large districts have greater numbers of identified schools, their Title I choice programs are larger and more complex than those in other districts. Several large TASSIE case study districts established transportation zones to minimize bus routes and provided choices within these zones.
Exhibit 13 Top Challenges Faced by Districts That Implemented Title I Choice in 2003-04
Type of challenge Great extent Moderate
extent Not at all or small extent
Expanding capacity in alternate schools (e.g., by adding classrooms) 37 13 50
Lack of space in alternate schools 30 20 50
Amount of time needed to set up a choice program* 26 25 49
No alternate schools within the district 22 8 70
Lack of transportation to alternate schools* 14 12 74 Exhibit reads: Among districts that offered Title I choice in 2003-04, 37 percent responded that expanding capacity in alternate schools was a challenge to a great extent in implementing school choice, 13 percent to a moderate extent, and 50 percent to a small extent or not at all. (See Appendix B for complete list of challenges.) *Note: Asterisk indicates significant differences by district size and urbanicity at p < .01. Source: TASSIE district survey.
In contrast, for small districts, lack of transportation to alternate schools was a challenge to a great extent for 26 percent, compared with 9 percent of medium-sized districts, 7 percent large, and 8 percent very large. Similarly, urban districts were more likely (23 percent) to cite time for program set-up as a major issue and rural districts were more likely (24 percent) to cite transportation as a major issue. Transportation issues are a significant problem for rural districts because of their remote location and the long distances between schools.
Other studies confirm the challenges districts face in devising solutions to lack of readily
available space in alternate schools.11
• The Council of the Great City Schools conducted a survey of 60 urban districts and found that the cities that had the most difficulty accommodating transfers were districts with large numbers of schools identified for improvement, small numbers of schools eligible to receive transfer students, and in which alternate schools lacked additional
11 Districts may not use lack of capacity to deny students the option to transfer but may take capacity into
consideration in deciding which choices to make available to eligible students [34 CFR 200.44(d)].
23

classroom space. This is in contrast to cities with small numbers of identified schools, underutilized buildings, and space for portables already owned; 23 of the 46 urban districts that responded to the question could not fill all transfer requests in 2003-04. Receiving schools faced problems mostly related to overcrowding and increases in class sizes that could have a dampening effect on achievement over time. Districts that sought transfers to neighboring districts did not receive approvals (Casserly 2004).
• Half of the eight districts GAO visited in 2003-04 did not grant as many transfers as were requested because of constraints on the building capacities of many of their schools. GAO found officials struggling to find practical and realistic ways to offer choice when classrooms, budgets, and time frames were limited. Some of these officials had studied the suggestions offered in the U.S. Department of Education’s February 2004 guidance but considered creation of virtual or charter schools to be long-term projects that could not provide capacity in time to meet short deadlines. Cost considerations were a major issue in several districts where capacity constraints had limited the number of transfers under NCLB.
Even where space is available in receiving schools, staff must be added if more than a few
students transfer in. In one case study site, the new staff were moved from the identified school to the receiving school. Difficulties related to building capacity are unlikely to diminish in the future and could become more pronounced if the number of students eligible to transfer or those transferring increases and the number of schools available as potential transfer options decreases.
Districts that implemented Title I choice for the first time in 2003-04 reported that the
absence of alternate schools and inadequate information for parents were greater challenges than did districts implementing choice in 2002-03 and 2003-04. Among districts that offered Title I choice in 2003-04 and not in 2002-03, 60 percent reported that the absence of alternate schools within the district was a major challenge compared with 12 percent of districts that had a year’s experience. Similarly, among districts that provided choice for the first time in 2003-04, 41 percent reported that inadequate information for parents about the status of their child’s school as identified for improvement was not a challenge at all compared with 85 percent of districts with experience implementing choice. Experience appeared to make a difference. Another factor is that most (61 percent) of the districts implementing choice for the first time in 2003-04 were small (and were only 22 percent of districts implementing choice in 2003-04).
The small proportion (1 percent) of eligible students who requested a transfer to a
school not identified for improvement in 2003-04 continued to reflect the many considerations that go into parents’ choice of schools for their children. Focus groups of parents in the case study districts revealed a number of factors other than the identification status of a school influenced parents’ decisions to send their children to another school (Exhibit 14). These considerations included how well their children were achieving, the availability of special programs, and the proximity of alternate schools to their home. Late and inadequate parent notification (Exhibit 15) and limited choices among transfer schools, also contributed to low participation rates.
24
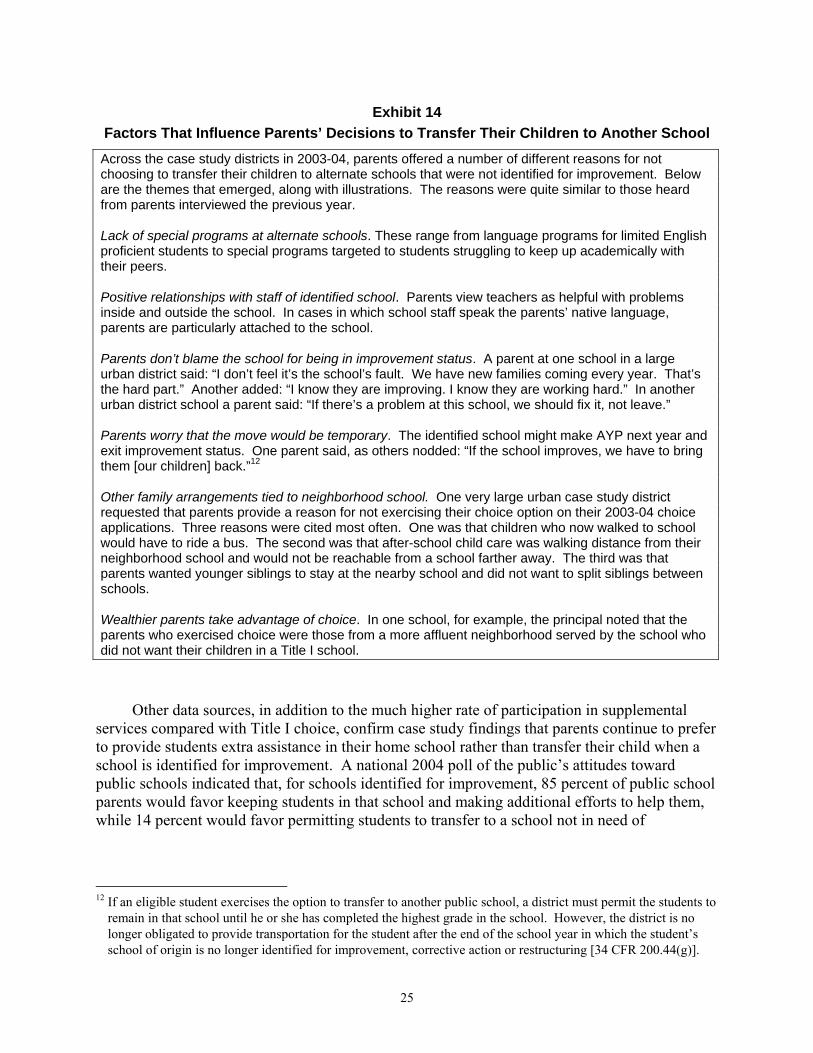
Exhibit 14 Factors That Influence Parents’ Decisions to Transfer Their Children to Another School
Across the case study districts in 2003-04, parents offered a number of different reasons for not choosing to transfer their children to alternate schools that were not identified for improvement. Below are the themes that emerged, along with illustrations. The reasons were quite similar to those heard from parents interviewed the previous year.
Lack of special programs at alternate schools. These range from language programs for limited English proficient students to special programs targeted to students struggling to keep up academically with their peers.
Positive relationships with staff of identified school. Parents view teachers as helpful with problems inside and outside the school. In cases in which school staff speak the parents’ native language, parents are particularly attached to the school.
Parents don’t blame the school for being in improvement status. A parent at one school in a large urban district said: “I don’t feel it’s the school’s fault. We have new families coming every year. That’s the hard part.” Another added: “I know they are improving. I know they are working hard.” In another urban district school a parent said: “If there’s a problem at this school, we should fix it, not leave.”
Parents worry that the move would be temporary. The identified school might make AYP next year and exit improvement status. One parent said, as others nodded: “If the school improves, we have to bring them [our children] back.”12
Other family arrangements tied to neighborhood school. One very large urban case study district requested that parents provide a reason for not exercising their choice option on their 2003-04 choice applications. Three reasons were cited most often. One was that children who now walked to school would have to ride a bus. The second was that after-school child care was walking distance from their neighborhood school and would not be reachable from a school farther away. The third was that parents wanted younger siblings to stay at the nearby school and did not want to split siblings between schools.
Wealthier parents take advantage of choice. In one school, for example, the principal noted that the parents who exercised choice were those from a more affluent neighborhood served by the school who did not want their children in a Title I school.
Other data sources, in addition to the much higher rate of participation in supplemental
services compared with Title I choice, confirm case study findings that parents continue to prefer to provide students extra assistance in their home school rather than transfer their child when a school is identified for improvement. A national 2004 poll of the public’s attitudes toward public schools indicated that, for schools identified for improvement, 85 percent of public school parents would favor keeping students in that school and making additional efforts to help them, while 14 percent would favor permitting students to transfer to a school not in need of
12 If an eligible student exercises the option to transfer to another public school, a district must permit the students to
remain in that school until he or she has completed the highest grade in the school. However, the district is no longer obligated to provide transportation for the student after the end of the school year in which the student’s school of origin is no longer identified for improvement, corrective action or restructuring [34 CFR 200.44(g)].
25
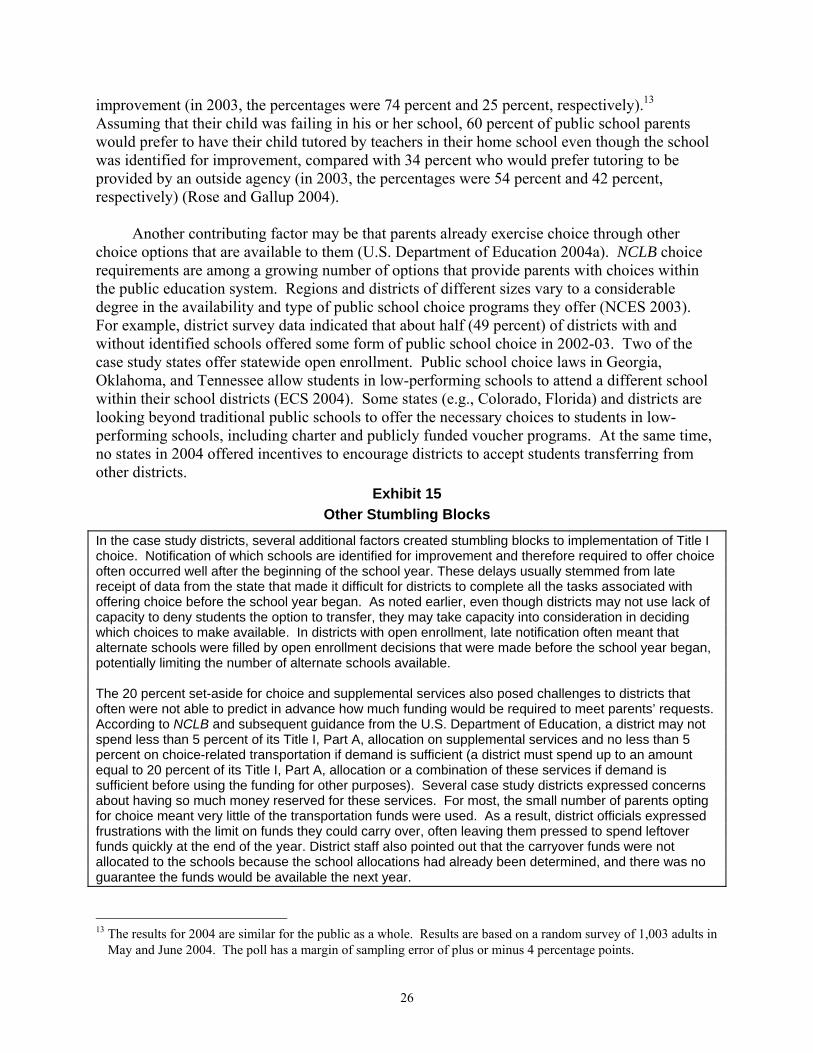
improvement (in 2003, the percentages were 74 percent and 25 percent, respectively).13 Assuming that their child was failing in his or her school, 60 percent of public school parents would prefer to have their child tutored by teachers in their home school even though the school was identified for improvement, compared with 34 percent who would prefer tutoring to be provided by an outside agency (in 2003, the percentages were 54 percent and 42 percent, respectively) (Rose and Gallup 2004).
Another contributing factor may be that parents already exercise choice through other
choice options that are available to them (U.S. Department of Education 2004a). NCLB choice requirements are among a growing number of options that provide parents with choices within the public education system. Regions and districts of different sizes vary to a considerable degree in the availability and type of public school choice programs they offer (NCES 2003). For example, district survey data indicated that about half (49 percent) of districts with and without identified schools offered some form of public school choice in 2002-03. Two of the case study states offer statewide open enrollment. Public school choice laws in Georgia, Oklahoma, and Tennessee allow students in low-performing schools to attend a different school within their school districts (ECS 2004). Some states (e.g., Colorado, Florida) and districts are looking beyond traditional public schools to offer the necessary choices to students in low-performing schools, including charter and publicly funded voucher programs. At the same time, no states in 2004 offered incentives to encourage districts to accept students transferring from other districts.
Exhibit 15 Other Stumbling Blocks
In the case study districts, several additional factors created stumbling blocks to implementation of Title I choice. Notification of which schools are identified for improvement and therefore required to offer choice often occurred well after the beginning of the school year. These delays usually stemmed from late receipt of data from the state that made it difficult for districts to complete all the tasks associated with offering choice before the school year began. As noted earlier, even though districts may not use lack of capacity to deny students the option to transfer, they may take capacity into consideration in deciding which choices to make available. In districts with open enrollment, late notification often meant that alternate schools were filled by open enrollment decisions that were made before the school year began, potentially limiting the number of alternate schools available. The 20 percent set-aside for choice and supplemental services also posed challenges to districts that often were not able to predict in advance how much funding would be required to meet parents’ requests. According to NCLB and subsequent guidance from the U.S. Department of Education, a district may not spend less than 5 percent of its Title I, Part A, allocation on supplemental services and no less than 5 percent on choice-related transportation if demand is sufficient (a district must spend up to an amount equal to 20 percent of its Title I, Part A, allocation or a combination of these services if demand is sufficient before using the funding for other purposes). Several case study districts expressed concerns about having so much money reserved for these services. For most, the small number of parents opting for choice meant very little of the transportation funds were used. As a result, district officials expressed frustrations with the limit on funds they could carry over, often leaving them pressed to spend leftover funds quickly at the end of the year. District staff also pointed out that the carryover funds were not allocated to the schools because the school allocations had already been determined, and there was no guarantee the funds would be available the next year.
13 The results for 2004 are similar for the public as a whole. Results are based on a random survey of 1,003 adults in
May and June 2004. The poll has a margin of sampling error of plus or minus 4 percentage points.
26

Supplemental Educational Services Supplemental services under NCLB, intended to increase the academic performance of
students in schools identified for improvement, were first required and implemented in the 2002-03 school year. Students from low-income families who attend Title I schools that are in their second year of school improvement, corrective action, or restructuring are eligible for supplemental services.
Implementing the supplemental services provisions of NCLB involves a number of parties.
State must develop criteria for selecting supplemental service providers, approve providers, publish lists of the approved providers, monitor providers, and remove ineffective providers from state lists. A variety of types of organizations may serve as providers, such as for-profit and nonprofit entities, school districts, faith-based organizations, and public or private schools. School districts are responsible for coordinating student enrollment in services, including notifying parents of their children’s eligibility to receive supplemental services, providing parents with adequate information to select providers for their children, and consulting with parents and providers to develop specific educational goals for students receiving services. The actual service provided must be consistent with the state’s academic content standards as well as the instruction provided by the school district and meet certain additional criteria. Findings regarding the implementation of these activities are described below.
Eligibility and Participation
Between 2002-03 and 2003-04, the number of students eligible for supplemental services increased from under 600,000 to about 1.3 million, as did the percent participating (from 7 to 19 percent). About the same number and percentage of districts (1,100 districts, or 11 percent) were required to offer supplemental services in 2003-04 as in 2002-03, but the number of schools within these districts with students eligible to receive services increased (from 1,300 to 3,100 schools), as well as the percentage of schools that offered services (from 58 percent to 83 percent) (Exhibit 16).
Roughly half of the districts required to offer supplemental services provided services
in 2003-04 and 2002-03. Among the districts required to offer supplemental services in 2003-04, 57 percent did so. However, among these districts, 16 percent did not have any students sign up for services; thus, less than half of districts (48 percent) required to offer supplemental services actually provided services to eligible students, the same percentage as in 2002-03. These data are supported by district reports that, among districts not yet providing services in 2003-04, the primary reason (68 percent) for not providing services was that no parents had signed up for services. Other reasons for not providing supplemental services included no providers in the area (36 percent) and not having received a list of approved providers from the state (14 percent). Despite having less than half of the districts required to provide services doing so, the number and percent of students participating increased in 2003-04, particularly in the largest districts which had the largest number of identified schools. As was true with Title I choice, the average number of schools with students eligible for supplemental services was greater (29 schools) in very large districts, compared with four in large districts and two in medium districts.
27

Exhibit 16 Districts and Schools Required to Offer Supplemental Services, Those That Offered
Supplemental Services, and Students Who Participated in 2002-03 and 2003-04 2002-03 2003-04
Students (among districts that provided services): Number eligible Number who participated Proportion who participated
592,000 42,000
7%
1,331,000*
258,000*
19% Schools:
Number where services required Number where services offered Proportion where services offered
1,300
800 58%
3,100 2,500
83% Districts:
Number with schools where services required Number with schools where services offered Proportion where services offered
1,100
500 48%
1,100
600 57%
Exhibit reads: Among districts that provided supplemental services in 2002-03, an estimated 592,000 students nationwide were eligible for supplemental services; for 2003-04, the estimate is 1,331,000 students. *Notes: Asterisk indicates differences were significant at p < .05. The number of students eligible is underestimated, and therefore the percent participating is overestimated, because not all districts that should have provided choice and supplemental services reported providing these options and thus did not provide eligibility data (about 15 percent of the 11 percent of districts required to provide services). The estimated 592,000 has a margin of error of +/- .6 million, and 1.3 million has a margin of error of +/- .34 million. Source: TASSIE district survey.
The average number of students eligible for supplemental services varied widely by district size and urbanicity. For example, urban districts providing supplemental services on average reported more than 9,000 students eligible to receive services in 2003-04 (Exhibit 17). Overall, 25 percent of districts providing supplemental services reported having on average over 1,000 eligible students. At the same time, the average percentage of students that received supplemental services was similar across districts that provided services. For example, the average percentage of eligible students receiving services in urban districts was 22 percent, compared with 20 percent in suburban districts and 17 percent in rural districts.
28

Exhibit 17 Average Number of Students in Identified Schools Who Were Eligible
for Supplemental Services in 2003-04, Among Districts That Provided Services, by Urbanicity
437958
9,119
0
1,000
2,000
3,000
4,000
5,000
6,000
7,000
8,000
9,000
10,000
Rural Suburban Urban
Type of districts
Num
ber o
f stu
dent
s
Exhibit reads: Among districts required to provide supplemental services and did so in 2003-04, the average number of students eligible to receive these services in rural districts was 437. Notes: There were significant differences in the average number of students who were eligible for services by district urbanicity at p < .01.
Source: TASSIE district survey.
Among districts that provided supplemental services in 2003-04, half (52 percent) made services available to all low-income students because the demand for did not exceed the funds available (Exhibit 18). Some districts (23 percent) made services available to all low-income students even though demand exceeded Title I funding requirements.14 If district funds available are insufficient to provide supplemental services to each eligible student whose parent requests services, the district must give priority to providing services to the lowest-achieving eligible students (U.S. Department of Education 2003a). In 2003-04, 20 percent of districts gave priority to the lowest-achieving students. The percentage of districts following each of these
14 NCLB establishes a joint funding mechanism for choice-related transportation and supplemental education
services. Unless a lesser amount is needed to meet the demand for choice-related transportation and to satisfy all requests for supplemental services, a district must spend up to an amount equal to 20 percent of its Title I, Part A, allocation before putting any restrictions on its spending for choice-relate transportation, supplemental services, or a combination of both. A district may not spend less than 5 percent of its Title I, Part A, allocation on supplemental services and no less than 5 percent on choice-related transportation if demand is sufficient.
29
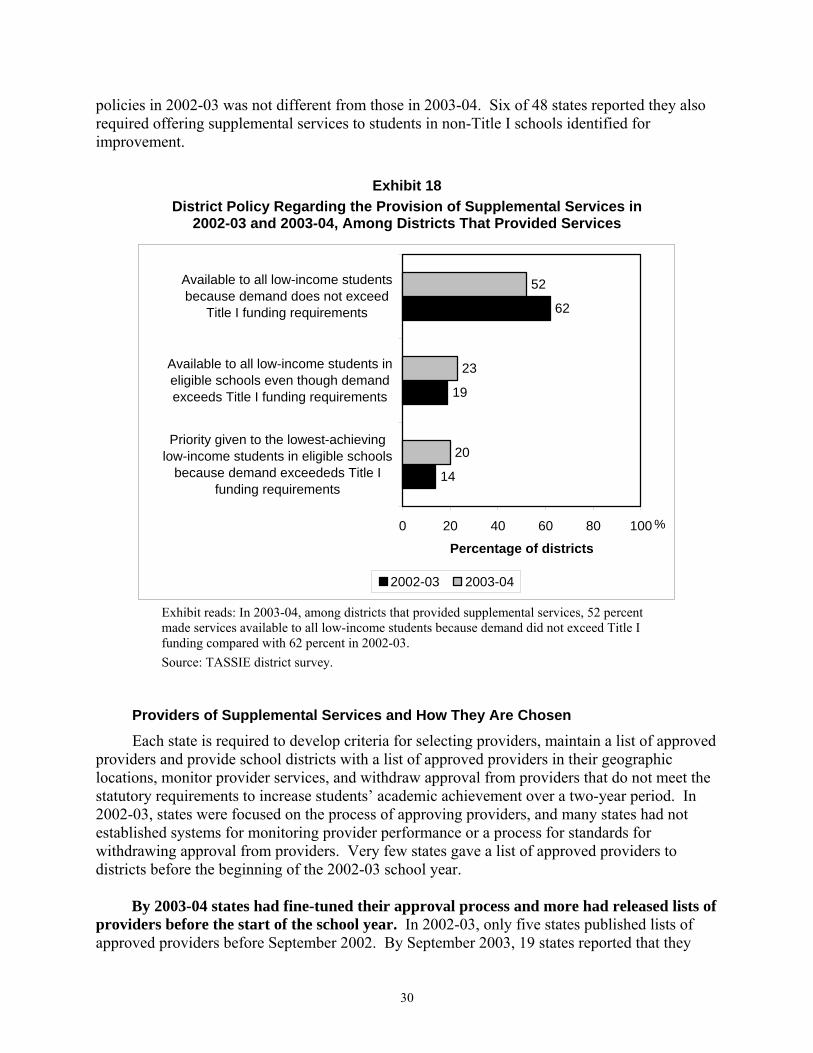
policies in 2002-03 was not different from those in 2003-04. Six of 48 states reported they also required offering supplemental services to students in non-Title I schools identified for improvement.
Exhibit 18 District Policy Regarding the Provision of Supplemental Services in
2002-03 and 2003-04, Among Districts That Provided Services
62
19
14
52
23
20
0 20 40 60 80 100
Priority given to the lowest-achievinglow-income students in eligible schools
because demand exceededs Title Ifunding requirements
Available to all low-income students ineligible schools even though demandexceeds Title I funding requirements
Available to all low-income studentsbecause demand does not exceed
Title I funding requirements
Percentage of districts
2002-03 2003-04
%
Exhibit reads: In 2003-04, among districts that provided supplemental services, 52 percent made services available to all low-income students because demand did not exceed Title I funding compared with 62 percent in 2002-03. Source: TASSIE district survey.
Providers of Supplemental Services and How They Are Chosen
Each state is required to develop criteria for selecting providers, maintain a list of approved providers and provide school districts with a list of approved providers in their geographic locations, monitor provider services, and withdraw approval from providers that do not meet the statutory requirements to increase students’ academic achievement over a two-year period. In 2002-03, states were focused on the process of approving providers, and many states had not established systems for monitoring provider performance or a process for standards for withdrawing approval from providers. Very few states gave a list of approved providers to districts before the beginning of the 2002-03 school year.
By 2003-04 states had fine-tuned their approval process and more had released lists of
providers before the start of the school year. In 2002-03, only five states published lists of approved providers before September 2002. By September 2003, 19 states reported that they
30
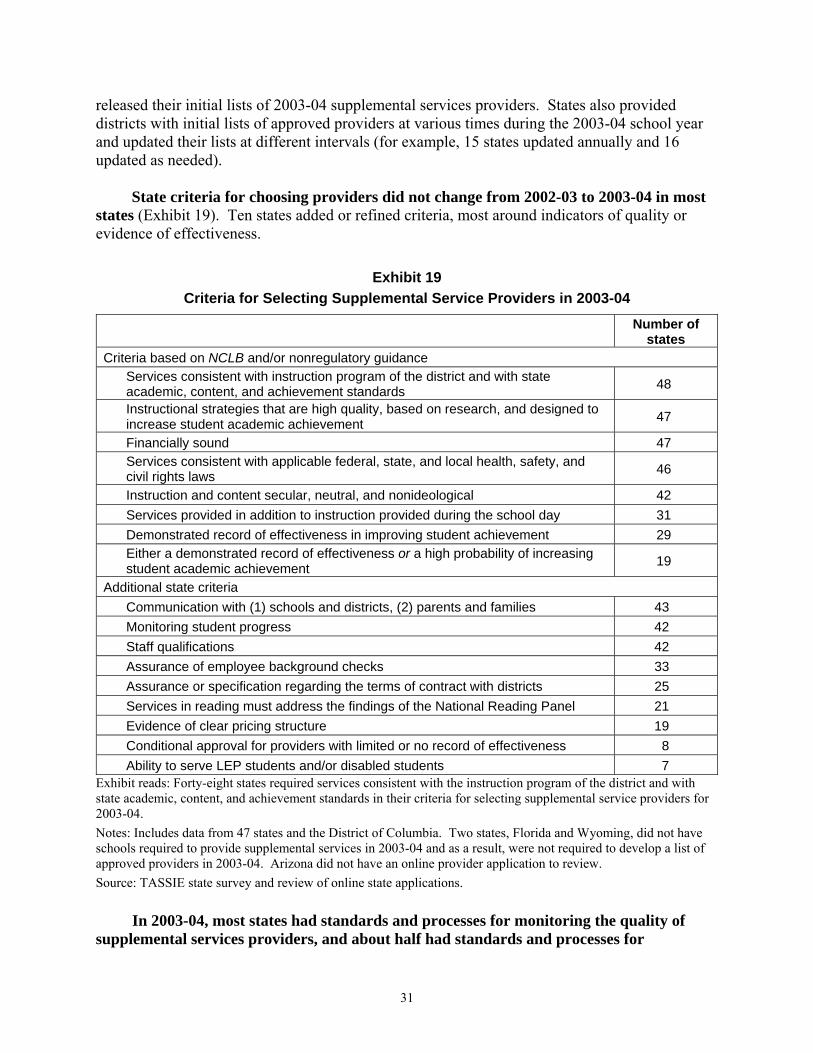
released their initial lists of 2003-04 supplemental services providers. States also provided districts with initial lists of approved providers at various times during the 2003-04 school year and updated their lists at different intervals (for example, 15 states updated annually and 16 updated as needed).
State criteria for choosing providers did not change from 2002-03 to 2003-04 in most
states (Exhibit 19). Ten states added or refined criteria, most around indicators of quality or evidence of effectiveness.
Exhibit 19
Criteria for Selecting Supplemental Service Providers in 2003-04
Number of
states Criteria based on NCLB and/or nonregulatory guidance
Services consistent with instruction program of the district and with state academic, content, and achievement standards 48
Instructional strategies that are high quality, based on research, and designed to increase student academic achievement 47
Financially sound 47 Services consistent with applicable federal, state, and local health, safety, and civil rights laws 46
Instruction and content secular, neutral, and nonideological 42 Services provided in addition to instruction provided during the school day 31 Demonstrated record of effectiveness in improving student achievement 29 Either a demonstrated record of effectiveness or a high probability of increasing student academic achievement 19
Additional state criteria Communication with (1) schools and districts, (2) parents and families 43 Monitoring student progress 42 Staff qualifications 42 Assurance of employee background checks 33 Assurance or specification regarding the terms of contract with districts 25 Services in reading must address the findings of the National Reading Panel 21 Evidence of clear pricing structure 19 Conditional approval for providers with limited or no record of effectiveness 8 Ability to serve LEP students and/or disabled students 7
Exhibit reads: Forty-eight states required services consistent with the instruction program of the district and with state academic, content, and achievement standards in their criteria for selecting supplemental service providers for 2003-04. Notes: Includes data from 47 states and the District of Columbia. Two states, Florida and Wyoming, did not have schools required to provide supplemental services in 2003-04 and as a result, were not required to develop a list of approved providers in 2003-04. Arizona did not have an online provider application to review. Source: TASSIE state survey and review of online state applications.
In 2003-04, most states had standards and processes for monitoring the quality of
supplemental services providers, and about half had standards and processes for
31
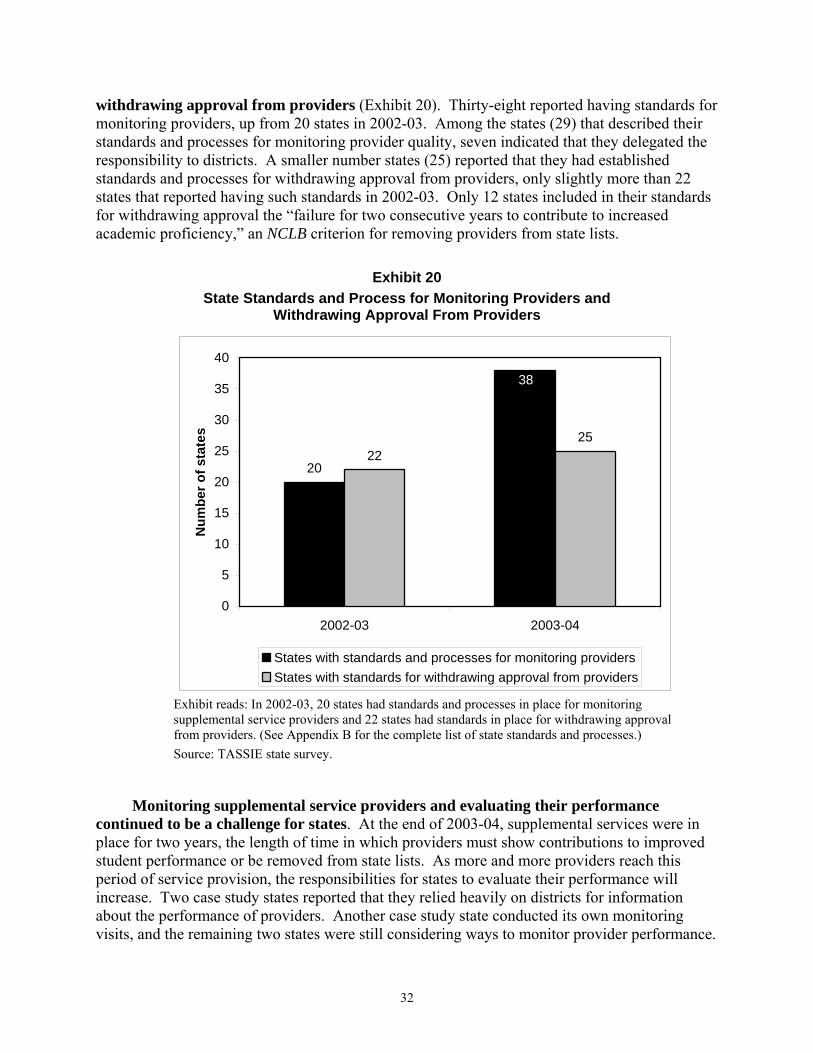
withdrawing approval from providers (Exhibit 20). Thirty-eight reported having standards for monitoring providers, up from 20 states in 2002-03. Among the states (29) that described their standards and processes for monitoring provider quality, seven indicated that they delegated the responsibility to districts. A smaller number states (25) reported that they had established standards and processes for withdrawing approval from providers, only slightly more than 22 states that reported having such standards in 2002-03. Only 12 states included in their standards for withdrawing approval the “failure for two consecutive years to contribute to increased academic proficiency,” an NCLB criterion for removing providers from state lists.
Exhibit 20
State Standards and Process for Monitoring Providers and Withdrawing Approval From Providers
2022
25
38
0
5
10
15
20
25
30
35
40
2002-03 2003-04
Num
ber o
f sta
tes
States with standards and processes for monitoring providersStates with standards for withdrawing approval from providers
Exhibit reads: In 2002-03, 20 states had standards and processes in place for monitoring supplemental service providers and 22 states had standards in place for withdrawing approval from providers. (See Appendix B for the complete list of state standards and processes.) Source: TASSIE state survey.
Monitoring supplemental service providers and evaluating their performance continued to be a challenge for states. At the end of 2003-04, supplemental services were in place for two years, the length of time in which providers must show contributions to improved student performance or be removed from state lists. As more and more providers reach this period of service provision, the responsibilities for states to evaluate their performance will increase. Two case study states reported that they relied heavily on districts for information about the performance of providers. Another case study state conducted its own monitoring visits, and the remaining two states were still considering ways to monitor provider performance.
32

A U.S. Department of Education study of the implementation of supplemental services also found several of its case study states relied on districts for information about the performance of providers and expressed interest in more technical assistance, especially with assessing provider performance in improving student academic achievement (U.S. Department of Education 2005a).
The number of providers on state lists increased from 2002-03 to 2003-04 in a
majority of states and few providers were removed. Out of 48 states and the District of Columbia, 37 states increased their number of providers between April 2003 and April 2004, three states had a decrease in the number of providers (a net loss of 12 providers), 15 and four states had no data available in April 2003 on which to base a comparison. Only four states reported that providers were removed from state lists (e.g., because financial irregularities were discovered). The five case study states illustrate the variety in number of providers and increase from 2003 to 2004 (Exhibit 21).
Exhibit 21
Supplemental Service Providers in Case Study States in April 2003 and 2004
Total number of providers operating in the state April 2003 April 2004 Difference
Arizona 27 26 -1 Louisiana 8 14 6 Maryland 2 14 12 Michigan 17 65 48 Washington 13 29 16
Exhibit reads: Arizona had 27 approved providers as of April 2003, and the number of approved providers had declined by one by April 2004. Sources: Policy and Program Studies Service, unpublished database (PPSS 2004), and verified through the TASSIE state survey.
Approved providers represented a variety of organizations in 2003-04, but private providers (not including private faith-based and online providers) continued to be the dominant type of provider (Exhibit 22). As of April 2004, the period of survey data collection, 69 percent of providers were private providers (e.g., nonprofit private groups or for-profit organizations such as Sylvan Educational Solutions, Kaplan Educational Centers, etc.) compared with 58 percent one year earlier. Districts and public schools were a smaller portion of all providers in April 2004 (24 percent) than in April 2003 (32 percent). In 2003-04, 37 percent of districts required to offer supplemental services were providers themselves. This percent dropped to 26 percent in 2004-05, reflecting the fact that some districts were identified for improvement and therefore unable to be supplemental service providers (CEP 2005).
15 Other states may have lost providers because they withdrew their application to provide services, but this did not
impact the net gain in the total number of providers serving these states.
33

Exhibit 22 Supplemental Service Providers in April 2003 and 2004
April 2003 April 2004 Difference
Type of provider Number of providers
Percent of total
Number of providers
Percent of total
Number of providers
Percent of total
Private: • Faith-based • Online • Other private providers
18 98 472
2 10 46
96 162 984
5 9 55
78 64 512
3 -1 9
Districts and public schools 326 32 431 24 105 -8 Colleges and universities 32 3 38 2 6 -1 Other or unknown types 71 7 68 4 3 -3 Total 1,017 100 1,779 100 762 NA
Exhibit reads: In states that approved supplemental service providers, 18 (2 percent of all approved providers) were private faith-based organizations as of April 2003; as of April 2004, 96 (5 percent) were private faith-based organizations, a increase of 78 faith-based providers (3 percent more of all approved providers). Notes: Includes data from 47 states and the District of Columbia. Two states, Florida and Wyoming, did not have schools required to provide supplemental services in 2003-04. Data were not available from Maine. Totals may not add to 100 percent because of rounding. Sources: Policy and Program Studies Service, unpublished database (PPSS 2004), and the TASSIE state survey.
Barriers to Providing and Participating in Supplemental Services
The most significant challenge to implementing supplemental services, particularly for small and medium districts, was a lack of providers available to serve the district. As was true in 2002-03, lack of providers in the area, as well as concerns about the appropriateness and quality of providers, headed the list of challenges (Exhibit 23). Lack of providers in the area was especially problematic for small and rural districts. Forty-two percent of small and medium districts reported that lack of providers in the area was a challenge to a great extent, compared with 15 percent of large districts and very large districts. Whereas a greater percentage of suburban districts (23 percent) and urban districts (18 percent) reported that a lack of high quality services was a challenge to a great extent compared with 8 percent of rural districts.
Even providers approved to operate statewide were not available to serve small and rural
districts in the case study sites. Those that offered online services did not solve the problem because few families had online access. The U.S. Department of Education study of the implementation of supplemental services found that several state coordinators reported the same problems (U.S. Department of Education 2005a).
34

Exhibit 23 Top Challenges Faced by Districts That Implemented Supplemental Services, Among
Districts That Offered Services in 2003-04
Type of challenge Great extent Moderate
extent Not at all or small extent
Lack of providers in the area*+ 30 31 39 Lack of approved providers offering services at needed grade levels 25 14 61
Lack of approved providers offering services to meet the needs of specific student populations 17 23 60
Approved providers did not offer high-quality services*+ 16 17 67
Lack of approved providers in needed subject areas 14 9 77 Providers have not yet established a reputation with parents* 11 28 61
Competition from existing after-school programs 10 26 64 Exhibit reads: Among districts that had identified schools and offered supplemental services, 30 percent responded that lack of providers in the area was a challenge to a great extent in implementing supplemental services, 31 percent to a moderate extent, and 39 percent to a small extent or not at all. (See Appendix B for the complete list of challenges.) Note: * indicates significant difference by district size in the extent to which a challenge existed (between p < .05 and p < .0001); + indicates significant difference by urbanicity (between p < .05 and p < .01) for this challenge. Source: TASSIE district survey.
Quality of providers’ services, lack of providers’ reputation with parents, and difficulty negotiating contracts with providers also continued to be challenges districts faced to a moderate or great extent. Quality of supplemental services proved to be less of a problem for small and medium districts than for large and very large districts. Two-thirds (66 percent) of small and medium districts did not report service quality as a challenge compared with one-third of large (36 percent) and very large (31 percent) districts. Negotiating contracts also proved more challenging for larger districts. The adequacy of the required 20 percent set-aside of an amount equal to the district’s Title I allocation to meet all requests for supplemental services and to provide transportation for Title I choice was reported as a minor problem by the majority (89 percent) of districts, regardless of size. More than half (51 percent) of the district respondents listed “other” challenges, such as inadequate district staff to ensure implementation consistent with the law, lack of parent and student interest in a longer school day, and lack of transportation home for students after services were provided.
Among districts providing supplemental services, the extent of challenges did not change from 2002-03 to 2003-04. However, districts that provided supplemental services to their eligible students reported challenges to a lesser extent than districts who did not offer supplemental services to eligible students. For example, 30 percent of districts that provided supplemental services reported lack of providers in the area as a major problem (one faced to a great extent) compared with 59 percent of districts that did not provide services to eligible students.
35
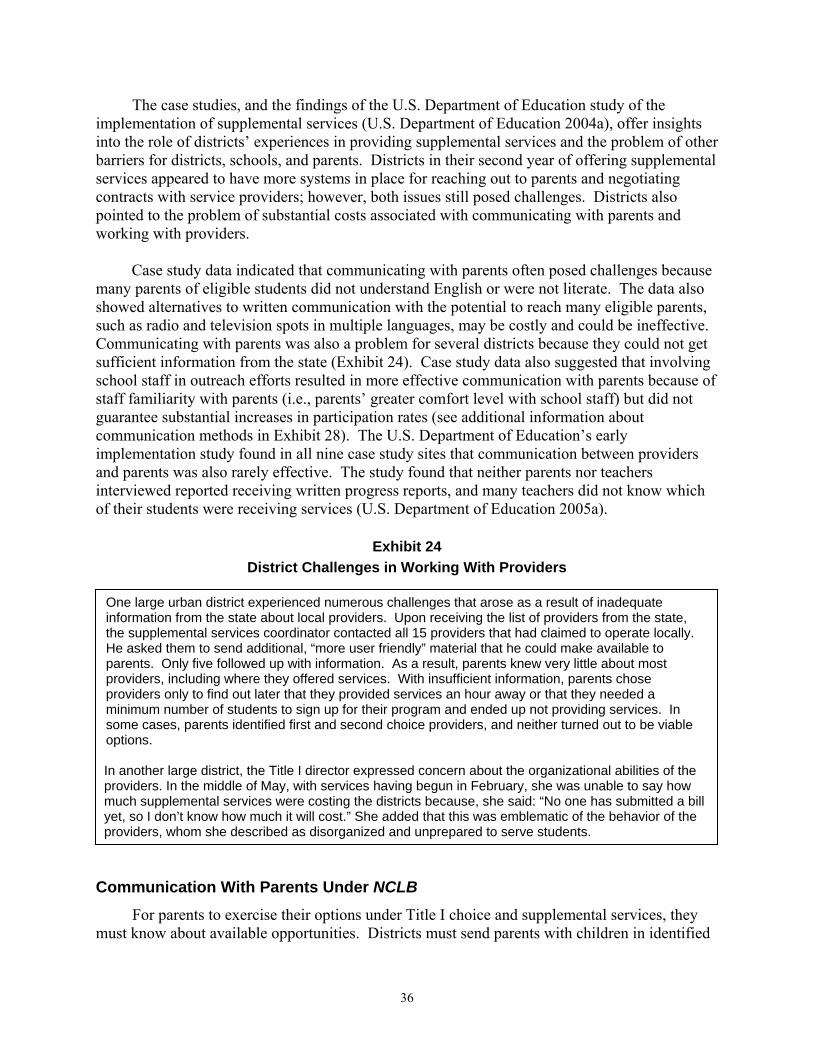
The case studies, and the findings of the U.S. Department of Education study of the implementation of supplemental services (U.S. Department of Education 2004a), offer insights into the role of districts’ experiences in providing supplemental services and the problem of other barriers for districts, schools, and parents. Districts in their second year of offering supplemental services appeared to have more systems in place for reaching out to parents and negotiating contracts with service providers; however, both issues still posed challenges. Districts also pointed to the problem of substantial costs associated with communicating with parents and working with providers.
Case study data indicated that communicating with parents often posed challenges because
many parents of eligible students did not understand English or were not literate. The data also showed alternatives to written communication with the potential to reach many eligible parents, such as radio and television spots in multiple languages, may be costly and could be ineffective. Communicating with parents was also a problem for several districts because they could not get sufficient information from the state (Exhibit 24). Case study data also suggested that involving school staff in outreach efforts resulted in more effective communication with parents because of staff familiarity with parents (i.e., parents’ greater comfort level with school staff) but did not guarantee substantial increases in participation rates (see additional information about communication methods in Exhibit 28). The U.S. Department of Education’s early implementation study found in all nine case study sites that communication between providers and parents was also rarely effective. The study found that neither parents nor teachers interviewed reported receiving written progress reports, and many teachers did not know which of their students were receiving services (U.S. Department of Education 2005a).
Exhibit 24 District Challenges in Working With Providers
C
m
One large urban district experienced numerous challenges that arose as a result of inadequate information from the state about local providers. Upon receiving the list of providers from the state, the supplemental services coordinator contacted all 15 providers that had claimed to operate locally. He asked them to send additional, “more user friendly” material that he could make available to parents. Only five followed up with information. As a result, parents knew very little about most providers, including where they offered services. With insufficient information, parents chose providers only to find out later that they provided services an hour away or that they needed a minimum number of students to sign up for their program and ended up not providing services. In some cases, parents identified first and second choice providers, and neither turned out to be viable options. In another large district, the Title I director expressed concern about the organizational abilities of the providers. In the middle of May, with services having begun in February, she was unable to say how much supplemental services were costing the districts because, she said: “No one has submitted a billyet, so I don’t know how much it will cost.” She added that this was emblematic of the behavior of the providers, whom she described as disorganized and unprepared to serve students.
ommunication With Parents Under NCLB For parents to exercise their options under Title I choice and supplemental services, they
ust know about available opportunities. Districts must send parents with children in identified
36

Title I schools, a written notification about the schools’ status and about school improvement activities, how they can help to increase their child’s achievement, and about Title I school choice and supplemental services, as appropriate. Districts must notify parents with children in identified schools about their options for Title I choice before the school year begins so that they have time to make informed decisions. Districts should also notify parents as early in the school year as possible about supplemental services. Contacting and communicating clearly with parents about the availability of choice and supplemental services continued to present challenges to districts in 2003-04 and appeared to influence rates of participation.
A majority of districts did not notify parents of their choice options prior to the opening of school. Sixty-five percent of districts with identified Title I schools did not notify parents of their public school choice option before the beginning of the 2003-04 school year (Exhibit 25). Similarly, 76 percent of districts notified parents about their children’s eligibility for supplemental services after the beginning of the 2003-04 school year. There was considerable variability in the average number of weeks before and after the beginning of the 2003-04 school year that notification took place. For example:
• Among districts that notified parents before the 2003-04 school year about their school
choice options, the majority (68 percent) did so one to four weeks before school began. • Almost half of the districts (46 percent) that notified parents after the beginning of the
2003-04 school year about their school choice options did so one to four weeks after school began.
Exhibit 25
Timing of Notification to Parents of Students in Identified Title I Schools About Eligibility for School Choice and Supplemental Services in 2003-04, Among
Districts That Provided Choice and Supplemental Services
School choice Supplemental services
When parents were notified Percent of districts
Average number of
weeks Percent of districts
Average number of
weeks Before the beginning of the 2003-04 school year 35 6 23 7
At the beginning of the 2003-04 school year 38 Not applicable 29 Not applicable
After the beginning of the 2003-04 school year 26 7 43 8
District had not notified parents as of spring 2004 1 Not applicable 4 Not applicable
Exhibit reads: Among districts that provided public school choice under Title I in 2003-04, 35 percent notified parents of children in identified Title I schools about their eligibility for public school choice before the beginning of the 2003-04 school year (on average, six weeks before the beginning of the school year). Among districts that provided supplemental services in 2003-04, 23 percent notified eligible parents about their supplemental services options before the beginning of the 2003-04 school year (on average, seven weeks before the beginning of the school year). Source: TASSIE district survey.
37

Based on the case studies, late parental notification for supplemental services appeared to have less effect than for Title I choice because supplemental services usually began well after the opening of school and often began again during the second semester. However, both for parents and for districts, late notification to choose an alternate school had greater repercussions because it meant moving students and staff after the beginning of the school year.
Many districts were not meeting the mandate of notifying parents before the
beginning of the 2003-04 school year, often because of late notification by states. States were not always providing timely notification to districts regarding whether their schools met AYP targets in the previous years’ testing and which schools were identified for improvement. Fifteen states provided districts with initial AYP data in June and July 2003, another 18 provided initial AYP data in August 2003, and 11 states provided initial AYP data between September 2003 and January 2004 (four states indicated that they provided the data at multiple times during the 2003-04 school year).
Exhibit 26
Average Number of Students Who Transferred, by Timing of District Notification, Among Districts That Provided Choice in 2003-04
35
69
1512
0
10
20
30
40
50
60
70
80
All Notified beforethe beginning of
the 2003-04school year
Notified at thebeginning of the
2003-04school year
Notified after thebeginning of the
2003-04school year
Ave
rage
num
ber o
f stu
dent
s
Exhibit reads: Among districts that provided choice options in 2003-04, the mean number of students who transferred was 35. In districts where parents were notified about their school choice options before the beginning of the 2003-04 school year, an average of 69 students transferred. In districts where parents where notified at the beginning of the school year, an average of 15 students transferred. In districts where parents were notified after the beginning of the school year, an average of 12 students transferred. Source: TASSIE district survey.
38
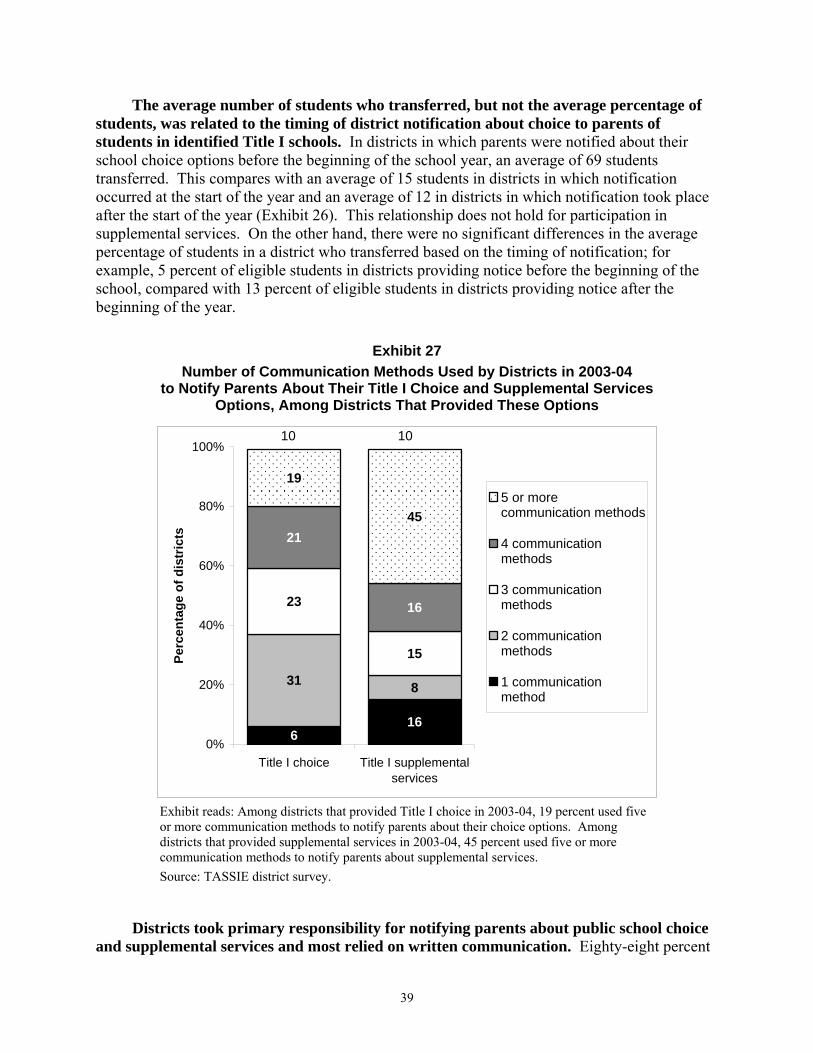
The average number of students who transferred, but not the average percentage of students, was related to the timing of district notification about choice to parents of students in identified Title I schools. In districts in which parents were notified about their school choice options before the beginning of the school year, an average of 69 students transferred. This compares with an average of 15 students in districts in which notification occurred at the start of the year and an average of 12 in districts in which notification took place after the start of the year (Exhibit 26). This relationship does not hold for participation in supplemental services. On the other hand, there were no significant differences in the average percentage of students in a district who transferred based on the timing of notification; for example, 5 percent of eligible students in districts providing notice before the beginning of the school, compared with 13 percent of eligible students in districts providing notice after the beginning of the year.
Exhibit 27
Number of Communication Methods Used by Districts in 2003-04 to Notify Parents About Their Title I Choice and Supplemental Services
Options, Among Districts That Provided These Options
166
831
15
23
21
16
45
19
0%
20%
40%
60%
80%
100%
Title I choice Title I supplementalservices
Perc
enta
ge o
f dis
tric
ts
5 or morecommunication methods
4 communicationmethods
3 communicationmethods
2 communicationmethods
1 communicationmethod
1010
Exhibit reads: Among districts that provided Title I choice in 2003-04, 19 percent used five or more communication methods to notify parents about their choice options. Among districts that provided supplemental services in 2003-04, 45 percent used five or more communication methods to notify parents about supplemental services. Source: TASSIE district survey.
Districts took primary responsibility for notifying parents about public school choice
and supplemental services and most relied on written communication. Eighty-eight percent
39
of districts used written communication to notify parents of their choice options, as did 89 percent of districts when communicating about supplemental services. At the same time, the majority of districts used more than one communication approach (Exhibit 27). Communication strategies employed by districts included the following:
• Parent meetings to publicize and discuss school choice options (40 percent) or to
publicize and discuss supplemental services (62 percent). • Public service announcements and news stories in local newspapers or on television
about choice (17 percent) and supplemental services (37 percent). • Enrollment fairs or other events where parents of students in schools identified for
improvement could learn about alternate schools for transfer options (8 percent) or could learn about providers and the services they offer (38 percent).
• Phone messages to parents and telephone hotlines about choice (5 percent) and supplemental services (24 percent).
• Outreach to parents by school-parent advisory committees about choice (11 percent) and about supplemental services (21 percent).
• Information provided at district enrollment or welcome centers about choice (15 percent) and supplemental services (9 percent).
• Announcements at school board meetings about choice (26 percent) and supplemental services (25 percent).
Districts involved school staff in communicating with parents about the school’s
identification status and their options, particularly about supplemental services. Eighteen percent of continuously identified schools in 2003-04 indicated that the district alone communicated with parents about Title I choice, and 12 percent indicated that the district alone communicated with parents about supplemental services. These are declines from 2002-03, when 32 percent of continuously identified schools reported that the district alone handled communications with parents about choice, and 31 percent reported that the district alone handled communications about supplemental services. In 2003-04, more than half (55 percent) of continuously identified schools reported that they held parent meetings to publicize and discuss school choice options, and half (50 percent) reported that school staff had discussed supplemental services options with parents.
Contacting and communicating clearly with parents about the availability of
supplemental services still presents challenges to school districts. Case study districts struggled to find effective means to communicate with families. In some cases, districts did not put much effort into communicating with families. For example, one medium size district did not mail out information on providers to parents to save cost, informing parents that they had to come to the district office to review the list of providers. In most cases, however, districts attempted to reach parents and found that their efforts fell short (Exhibit 28).
40

Exhibit 28 District Efforts to Communicate With Parents
dpEtuprgst
P
bhDq(m
In one large urban district, district staff sent letters to families, including information from the state on local providers, and set up an orientation for parents, providers, a staff person from the school, and a staff person from the Title I office. Each school with eligible students had one of these orientations at the school building. School staff reported, however, that these efforts were insufficient to reach the families they serve, especially the parents of children who could most benefit from supplemental services. For example, the assistant principal characterized the notification process as “spotty but earnest.” She added: “With our students and parents if we want them to do something, we have to do eight things”—that is, use eight different communication strategies. The Title I director was optimistic that more families would sign up next year: “My hope for next year is to educate the parentsa little more so they can take advantage of the service.” In several case study sites, district staff learned that combining information about Title I choice and supplemental services in parent information meetings or materials led to misunderstandings among parents because of the different eligibility requirements for students. Some parents who were interested in supplemental services but not choice were surprised to learn that their children were not eligible because they were not low income.
41
State and district report cards are important tools for promoting accountability of schools, istricts, and states by publicizing data about student performance and program effectiveness for arents, policymakers, and other stakeholders. The NCLB legislation and U.S. Department of ducation final guidance issued September 2003 (U.S. Department of Education 2003b) specify
he content of these report cards and requirements for providing the public with a clear nderstanding of the progress for which schools are being held accountable. State report cards rovide information about the performance of districts and states as a whole, whereas district eport cards provide information down to the school level. Data on report cards fall into three eneral categories: assessment data (student performance on tests), accountability data (whether chools and districts made adequate yearly progress in improving student achievement), and eacher quality data.
ublic Reporting
Districts must issue report cards annually and may use whatever format they determine to e most effective in presenting information in a concise, understandable manner. Districts also ave the flexibility to determine when during the school year they will issue report cards. istrict report cards must include information about assessments, accountability, and teacher uality as it applies to the district as a whole and as it applies to each school served by the district Exhibit 29). Individual school report cards are not required, but information about each school ust be included in the district report card.
School and District Report Cards

45
55
69
82
89
68
70
79
84
99
NA
NA
NA
13
38
28
51
38
50
88
90
72
75
84
86
99
20
NA
0 10 20 30 40 50 60 70 80 90 100
Student performance on statewide academic assessments
School performance on state assessments, compared with students in the district and state as awhole
Student performance on statewide academic assessments compared to the state’s annualmeasurable objectives
Most recent two-year trend data of student performance on statewide academic assessments
Percentage of students not tested
Attendance rates
Graduation rates (for high schools)
Whether the school has been identified for improvement under NCLB or number and percentage ofTitle I schools identified for improvement, corrective action or restructuring
Names of Title I schools that have been identified for improvement and the length of time identified
Percentage of teachers teaching with emergency or provisional credentials
Percentage of teachers teaching with emergency or provisional credentials in high-povertycompared to low-poverty schools
Percentage of classes not taught by highly qualified teachers or percentage of core academicclasses not taught by highly qualified teachers
Percentage of core academic classes not taught by highly qualified teachers in high-povertycompared to low-poverty schools
The information included varies by school because schools are responsible for producing reportcards
Percentage of Title I schoolsDistricts w ith district report cardsDistricts w ith school report cards
%
Exhibit reads: Among all districts that had school report cards, 13 percent reported that the information in school report cards varied by school because the schools are responsible for producing report cards. This item is not applicable for district report cards. (All of the elements listed except for the first item are required by NCLB; four additional items are required by NCLB for district level data indicated by “not applicable for school.”)
Information Included in School and District Report Cards, Among Districts That Had School or District Report Cards in 2003-04
Exhibit 29
Source: TASSIE district survey.
42

Though not required under NCLB, most districts also reported preparing school
report cards. Eighty-seven percent of Title I districts reported preparing school report cards in 2003-04, up from 81 percent in 2002-03 but down from 93 percent in 2001-02. The data provided most frequently on school report cards were similar to the data included in district report cards. In 2003-04, school report cards more commonly included data on whether a school was identified for improvement (69 percent of Title I districts with school report cards), up from 35 percent in 2002-03.
Among districts that had school report cards in 2003-04, assessment data were
provided most often. Districts must report on the percentage of students tested, their proficiency level, comparisons with statewide data, and most recent two-year trend data in student achievement by grade level in at least reading and mathematics. Ninety-nine percent of Title I districts provided student performance on state tests, and 84 percent provided comparative district and state data (Exhibit 29).
By 2003-04, more districts were including accountability data and teacher quality data—
but not all districts were doing so in a manner consistent with NCLB requirements. There was some improvement in the degree to which school report cards were providing information outlined in NCLB (Exhibit 29).
Districts with school report cards increased their reporting of accountability data substantially from 2002-03 to 2003-04, but almost one-third still did not provide school-level accountability data. NCLB requires three types of accountability data: overall and subgroup data comparing student achievement to state objectives, data on additional state indicators (e.g., attendance, graduation rates) used in AYP determinations, and information on the district and schools making AYP (U.S. Department of Education 2003b). In 2003-04, accountability data were included in school report cards in 69 percent of Title I districts with report cards and in 75 percent of districts with identified schools and report cards.
In 2003-04, more than 70 percent of Title I districts that prepared school report cards
included school assessment data for student subgroups for five of the six categories (all except migrant status) specified in NCLB—between 71 and 84 percent of districts with a subgroup enrollment of 10 percent or more (compared with 60 percent in 2002-03).16 Over 80 percent of districts with school and district report cards included attendance and graduation rates (for high schools) (Exhibit 29).
Teacher quality data were the least likely of the three types of data to be reported in 2003-04. Each district must provide, for the district as a whole and for each school within the district, information on the professional qualifications of all public school teachers, the
16 A threshold of 10 percent per subgroup was established for analysis to exclude districts with very small subgroup
populations (i.e., districts where the subgroup population was too small to be included on report cards). This threshold does not necessarily reflect the district’s actual minimum number of students per subgroup for reporting purposes as defined in each state accountability plan. There was very little difference in the percentage of districts that provided information on school report cards among districts with identified schools that had school report cards, compared with all Title I districts that prepared school report cards.
43
percentage of all teachers teaching with emergency or provisional credentials, and the percentage of classes not taught by highly qualified teachers (as the term is defined in NCLB). Among Title I districts providing school report cards in 2003-04, 55 percent included information on the percentage of teachers teaching with emergency or provisional credentials, and 45 percent included information on the percentage of classes not taught by highly qualified teachers; an improvement over 43 percent and 32 percent, respectively, in 2002-03. In 13 percent of districts with school report cards, the information included varied by school because schools are responsible for producing their own report cards.
As was true with school report cards, not all Title I districts prepared district report
cards in 2003-04: more than two-thirds (70 percent) of Title I districts prepared district report cards, and 81 percent of districts with identified schools did so in 2003-04.17 A higher percentage of Title I districts with identified schools (93 percent), compared with all Title I districts (87 percent), made school report cards available in 2003-04.
The results for district reporting were similar to those for school report cards—
assessment data were most often reported, along with attendance and graduation rates; assessment data were also broken down by student subgroups (Exhibit 30). For example, 99 percent of districts that prepared district report cards included student performance on statewide academic assessments, 86 percent compared their districts’ performance with state averages, and 90 percent included district attendance rates. District report cards also included school assessment data broken down by student subgroups. More than 70 percent of districts that prepared district report cards included district assessment data for student subgroups for five of seven categories specified in NCLB (except migrant and Title I eligibility status): between 73 and 89 percent of districts with a subgroup enrollment of 10 percent or more.
Only half (50 percent) of district report cards included the number and percentage of Title I
schools identified for improvement, corrective action, or restructuring in the district. District report cards were no more likely than school report cards to include teacher quality data.
State Reporting
States have the responsibility for producing and distributing state report cards and may, as is the case in many states, prepare and produce district report cards on behalf of their districts. State report cards must include information related to assessments, accountability, and teacher quality for all districts in the state. The assessment data required is similar to that for districts: (1) information on the percentage of students tested, (2) information on student achievement at each proficiency level, and (3) the most recent two-year trend data in student achievement in each subject and for each grade. The accountability data required on the state report card is also similar to that for districts: a comparison between actual student achievement levels and the state’s annual measurable objectives in reading or language arts and mathematics overall and by subgroup, data on student performance on the state’s additional academic indicators used in making AYP determinations, and information on the districts and schools making AYP.
17 Data on the content of district report cards were not collected in previous years.
44

The majority of states made state-level, district-level, and school-level assessment data disaggregated by student subgroups publicly available. An analysis of state Web sites in May-June 2004 found that the majority of states (44) made state-level data disaggregated by student subgroups publicly available on their state Web site.18 The majority of states also made district-level (41 states) and school-level data (43 states) disaggregated by student subgroups available on their state Web sites.
In 2003-04, 40 states publicly reported the improvement status of all their schools,
including non-Title I schools.19 These data suggest that a fifth of states (10) had yet to comply with NCLB accountability data reporting requirements. In addition to the NCLB-required components of the report cards, some states include additional information, such as data about school climate; 27 states provide information about the school safety category, such as number of student suspensions or expulsions (Olson 2004).
Reporting of school performance varied widely from state to state in 2003-04 (ECS 2004),
taking the form of one or more of the following: (1) a statewide list of schools that did not make AYP, (2) a list of only Title I schools that did not make AYP, (3) a list of schools that did not make AYP based on 2002-03 test results only, (4) a list of schools that did not make AYP in previous years, and (5) a list of schools that did not make AYP or schools “identified for improvement” (the only group required by NCLB).
Although providing information to the public is an important tool for promoting school
accountability, case study data suggested that a critical issue was the manner in which information was presented: data provided in multiple forms did not necessarily make the data more understandable. Some states provided report cards that were simply hard to read. Multiple report cards and data sources for each school were also confusing, as were the multiple ratings that schools received in states with accountability initiatives that operated in tandem with the NCLB system. This problem went beyond the case study states. Education Week reported that 19 states have more than one report card per school and 16 states have separate report cards designed specifically to address the requirements in NCLB (Olson 2004).
Summary In 2003-04, parents continued to take advantage of supplemental services at a higher rate
than Title I choice. The percentage of eligible students participating in Title I choice remained at 1 percent from 2002-03 to 2003-04, while participation in supplemental services increased from
18 Online state data was reviewed as one measure of public availability of state report card data since the non-
regulatory guidance suggests that states disseminate their report cards in multiple ways such as state Web sites. Disaggregated student subgroup data were not always easily located on the state Web site (i.e., regarding state-level subgroup data in four states, district-level subgroup data in two states, and school-level subgroup data in two states).
19 Title I of NCLB requires states that receive Title I funds to report schools “identified for improvement” before the beginning of the school year [Section 1111(h)(1)], but delays in making initial and final AYP calculations prevented a number of states from reporting on identified schools before the beginning of the 2003-04 school year. As of early October 2004, 20 states had not yet released school report cards with achievement data for 2003-04 (Olson 2004).
45
7 to 19 percent. For a host of reasons, parents preferred supplemental services their child could receive at their neighborhood schools over the school transfer option.
Two-thirds of the districts offering Title I choice gave parents a choice among all other
schools in the districts not identified for improvement. Of the one-third of districts required to offer choice that did not do so, most were small with limited or no alternate schools from which to choose. As identified schools became more concentrated in large urban districts, these districts also found it difficult to identify alternatives, especially at the middle and high school levels. Already large urban districts were providing alternatives that were not always higher performing than the sending school.
The biggest challenges in implementing Title I choice included the availability of
alternatives, the time it took to set up the transfer program, and transportation. Time to set up the transfer program and transportation were particularly challenging to large districts that had on average 30 schools with eligible students. Lack of available providers in the area was especially acute for small and rural districts. Half the districts that offered Title I choice did not take steps to increase choice options to expand choice available to parents because parent demand for Title I choice was low. When districts did take such steps, choosing supplemental services was the most commonly mentioned option (by one-fifth of such districts).
In both 2002-03 and 2003-04, roughly half the districts required to offer supplemental
services did so. Still, the increase in the number of eligible and participating students was substantial. Much of the increase was in urban and very large districts that had an average of 9,000 and 16,000 eligible students in 2003-04, respectively, reflecting the concentration of identified schools in these districts.
Supplemental services providers were primarily non-faith-based and non-online private
providers. Lack of providers was the biggest barrier to implementation, especially in small and medium districts. States and districts appeared to get better at the mechanics of offering Title I choice and supplemental services although they struggled with communicating well with parents, and neither states nor districts had figured out how to adequately assess the performance of providers.
Districts fell short on notifying parents about their choice options prior to the opening of school, often because states had not provided timely notification on the AYP status of schools. At the same time, more districts (69 percent) provided parents with information about school performance on school report cards, although many of the report cards did not meet all the NCLB requirements for content. For example, teacher quality data was generally reported less often than school assessment data.
46

IV. School Improvement and District Assistance
To achieve the goal that all students reach proficiency by 2013-14, NCLB calls for greater
accountability, coupled with increased assistance to schools in which too many children are not meeting state standards for proficiency in reading and mathematics. NCLB lays out specific steps that states and districts must take to assist schools identified for improvement. States must establish statewide systems of support that provide assistance directly to schools. Districts must provide ongoing technical assistance as schools develop and implement their school plans. In particular, districts must help schools analyze student achievement data and develop plans for improvement, revise their budgets so that resources are effectively allocated to the activities most likely to increase student academic achievement, implement professional development, and put in place instructional practices that have shown evidence of effectiveness. Schools, in turn, are expected to develop and implement two-year plans that provide road maps for their efforts to improve curriculum and instruction and raise student achievement.
Both the survey and case study data indicate that most schools and districts were taking
action to implement the requirements of NCLB and taking specific steps to raise the achievement of all their students. Schools were engaged in a range of improvement strategies, and in many areas, those schools continuously identified for improvement from 2001-02 through 2003-04 were more likely to be taking steps to promote school improvement. Similarly, almost all districts were providing identified schools with some types of assistance on school improvement tasks. Both school and district activities showed little change over the three years of the study. By 2003-04, more states, but still not all, were providing the kinds of assistance to identified schools required under NCLB (e.g., 36 states in 2003-04 compared with 23 states in 2002-03 had school support teams). In spite of these efforts to provide schools with support, many identified schools did not receive assistance specified in NCLB.
This chapter elaborates and supports the findings on the implementation of NCLB school improvement strategies. The first section describes schools’ actions to improve. This is followed by a discussion of districts’ and states’ actions to help schools, including a look at whether the neediest schools were receiving the most assistance. Finally, an analysis of the factors associated with changes in improvement status is presented.
School Actions This section highlights differences between continuously identified schools and those
schools no longer identified in 2003-04,20 looking both at schools’ actions in 2003-04 and 20 The “continuously identified” schools were roughly 40 percent of a nationally representative sample of 589
schools identified for improvement in 2001-02 that responded to the principal survey in 2003-04. These schools were representative of schools identified for improvement in 2001-02 and still identified for improvement in 2003-04. Those schools “no longer identified” were representative of schools identified for improvement in 2001-02 that later exited improvement status. The two groups of schools were quite different in their demographic profiles: the continuously identified schools were poorer and tended to be in larger and more urban districts than schools no longer identified. Neither sample was representative of the population of identified schools in 2003-04, the final year of the study and two years into the implementation of NCLB.
47

patterns of change, or lack thereof, over the three years of the study. The section focuses on school improvement activities and support for them drawing on the principal survey and case studies.
Overall, continuously identified schools were more likely to engage in improvement
strategies and somewhat more likely than schools no longer identified to engage in certain types of professional development. Changes from 2001-02 to 2003-04 were not dramatic, either for the whole sample or for continuously identified schools, although some interesting exceptions are noted below.
Continuously identified schools were more likely to report that they implemented
four of seven improvement strategies analyzed, than schools no longer identified (Exhibit 30). For example, 53 percent of continuously identified schools reported having adopted a mathematics curriculum within the last three years, compared with 35 percent of those no longer identified.
Exhibit 30 Engagement in Improvement Strategies in 2003-04,
by School Identification Status
100
95
60
53
89
76
41
35
0 20 40 60 80 10
Having a writtenschool plan
Using studentachievement data to
inform schoolimprovement efforts
Adoption of a newreading/language arts
curriculum
Adoption of a newmathematicscurriculum
Percentage of Title I schools0
Continuously identified No longer identified
%
Exhibit reads: Fifty-three percent of continuously identified Title I schools had adopted a new mathematics curriculum within the last three years, compared with 35 percent of Title I schools no longer identified. Notes: Differences significant at p < .05. (See Appendix B for the complete list of strategies.) Source: TASSIE principal survey.
48

There were no statistically significant differences between continuously identified schools and schools no longer identified with respect to teacher collaboration,21 aligning curriculum and instruction with standards and assessments, and use of a school reform model.
Although significantly higher percentages of continuously identified schools reported
engaging in four of the seven strategies, the rank order of the strategies engaged in was almost identical for both sets of schools in 2003-04. The three most commonly used strategies for both groups were having a written school plan (93 percent), using student achievement data to inform school improvement efforts (83 percent), and teacher collaboration (82 percent).
The remainder of this discussion of school improvement activities focuses on the use of
two sets of strategies outlined under NCLB: (1) school planning, data use, curriculum adoption and alignment; and (2) professional development, school-based assistance, and access to resources.
Planning, Data Uses, New Curricula, and Curriculum Alignment
NCLB expects schools, with assistance from their districts, to create plans based on data to guide their improvement efforts and to put in place curricula that will lead to students’ reaching standards. By 2003-04, almost all schools (both continuously identified and those no longer identified) had school improvement plans in place, with the vast majority of principals reporting that they used state assessment data to create their plans and used research-based improvement strategies to implement them. Many schools reported adopting new curricula as a major improvement strategy, especially those schools continuously identified for improvement. Both continuously identified schools and schools no longer identified reported adopting their new curricula because their district required it and because the new curricula was aligned with state or district standards or assessments.
Almost all schools reported having school improvement plans and relying on test
score data in a variety of forms to prepare or revise their plans in 2003-04. These findings hold for continuously identified schools and those no longer identified. However, the frequency with which school plans were used varied considerably (Exhibit 31). For example, just over half of schools (53 percent) reported that they monitored their school plans at least quarterly, and one-in-five (20 percent) reported monitoring their plans only once per year.
21 Types of teacher collaboration included on the TASSIE principal survey were: (1) teacher work groups to discuss
student assessment data to make decisions about instruction, (2) teacher work groups to analyze samples of students work, (3) teacher work groups to develop teaching materials or activities for particular classes, and (4) teachers’ observations in other teachers’ classrooms to offer feedback and ideas.
49

Exhibit 31 Variations in Uses of School Plans in Case Study Schools
Case study schools varied in (a) the extent to which faculty were involved in the development of the school plan, (b) the extent to which faculty were aware of the contents of the plan, and (c) whether faculty used the plan as a guide and point of reference beyond annual plan development or updates. In only a few case study schools was the plan used as a touchstone in regular faculty or team meetings. In these exceptions, the plan was referred to as “basically our bible” and “it is what really drives the bus.” In 2003-04, several schools adopted new curricula as a result of district mandates or a Reading First grant. In these cases, adoption of a new curriculum did not mesh with its school plan, which marginalized the role of the plan. For example, in some schools that had both a Reading First implementation plan and a school improvement plan, attention shifted away from the school improvement plan in favor of the Reading First plan.
Overall, the percentage of schools reporting a major focus on the school planning process declined, from 52 percent in 2001-02 to 42 percent in 2003-04 (although this was not the case for the subset of continuously identified schools). In contrast, however, the percentage of schools reporting a major focus on the use of student achievement data increased (from 76 percent to 83 percent); for the subset of continuously identified schools, the increase was greater (from 76 percent to 95 percent).
Exhibit 32
Sources of Information Used by Schools to Inform Their Planning Process in 2003-04 and 2002-03, Among Schools With a Written School Plan
77
83
97
65
71
91
0 20 40 60 80 100
Student performance on state test, disaggregatedby student demograhic characteristics (e.g.,
poverty, race/ethnicity, and gender)
Student performance on state test, disaggregatedfor special student populations (e.g., special
education, LEP, and migrant students)
Overall student performance on state test
Percentage of Title I schools2003-04 2002-03%
Exhibit reads: Among schools that had a written school plan in 2003-04, 97 percent used overall student performance on the state test to inform the school planning process, compared with 91 percent in 2002-03. Notes: Differences significant at p < .05. (See Appendix B for the complete data set.) Source: TASSIE principal survey.
50
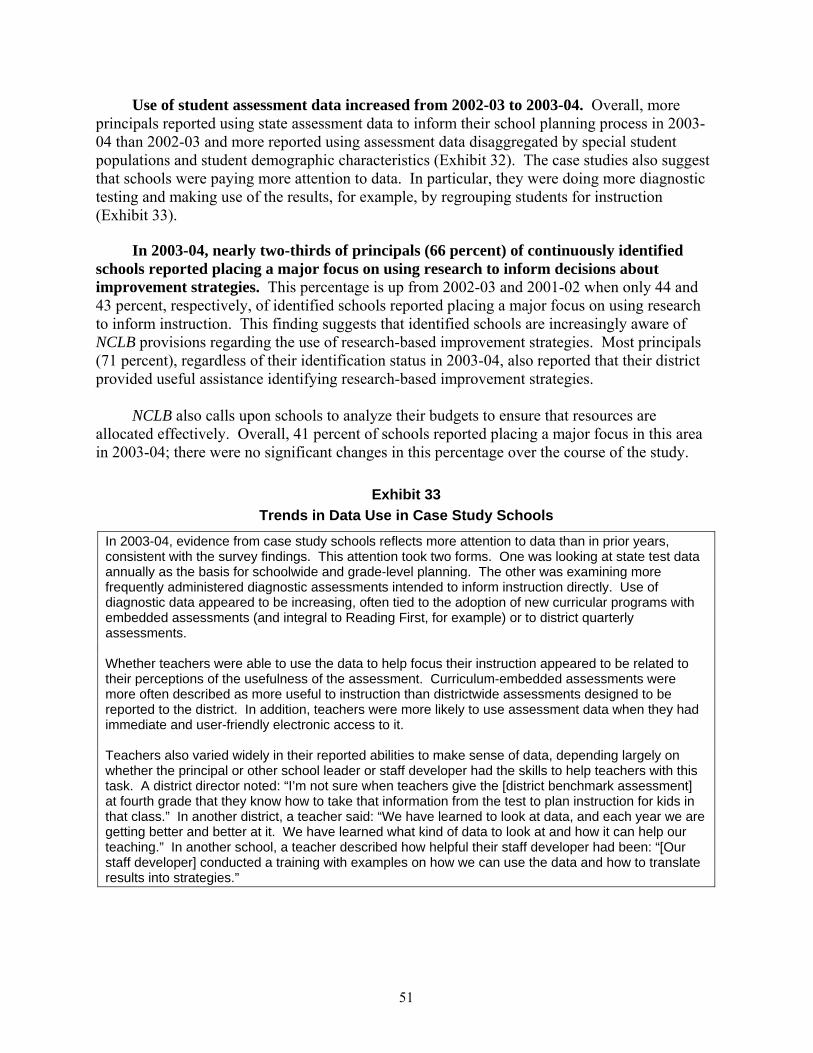
Use of student assessment data increased from 2002-03 to 2003-04. Overall, more principals reported using state assessment data to inform their school planning process in 2003-04 than 2002-03 and more reported using assessment data disaggregated by special student populations and student demographic characteristics (Exhibit 32). The case studies also suggest that schools were paying more attention to data. In particular, they were doing more diagnostic testing and making use of the results, for example, by regrouping students for instruction (Exhibit 33).
In 2003-04, nearly two-thirds of principals (66 percent) of continuously identified schools reported placing a major focus on using research to inform decisions about improvement strategies. This percentage is up from 2002-03 and 2001-02 when only 44 and 43 percent, respectively, of identified schools reported placing a major focus on using research to inform instruction. This finding suggests that identified schools are increasingly aware of NCLB provisions regarding the use of research-based improvement strategies. Most principals (71 percent), regardless of their identification status in 2003-04, also reported that their district provided useful assistance identifying research-based improvement strategies.
NCLB also calls upon schools to analyze their budgets to ensure that resources are
allocated effectively. Overall, 41 percent of schools reported placing a major focus in this area in 2003-04; there were no significant changes in this percentage over the course of the study.
Exhibit 33 Trends in Data Use in Case Study Schools
In 2003-04, evidence from case study schools reflects more attention to data than in prior years, consistent with the survey findings. This attention took two forms. One was looking at state test data annually as the basis for schoolwide and grade-level planning. The other was examining more frequently administered diagnostic assessments intended to inform instruction directly. Use of diagnostic data appeared to be increasing, often tied to the adoption of new curricular programs with embedded assessments (and integral to Reading First, for example) or to district quarterly assessments. Whether teachers were able to use the data to help focus their instruction appeared to be related to their perceptions of the usefulness of the assessment. Curriculum-embedded assessments were more often described as more useful to instruction than districtwide assessments designed to be reported to the district. In addition, teachers were more likely to use assessment data when they had immediate and user-friendly electronic access to it. Teachers also varied widely in their reported abilities to make sense of data, depending largely on whether the principal or other school leader or staff developer had the skills to help teachers with this task. A district director noted: “I’m not sure when teachers give the [district benchmark assessment] at fourth grade that they know how to take that information from the test to plan instruction for kids in that class.” In another district, a teacher said: “We have learned to look at data, and each year we are getting better and better at it. We have learned what kind of data to look at and how it can help our teaching.” In another school, a teacher described how helpful their staff developer had been: “[Our staff developer] conducted a training with examples on how we can use the data and how to translate results into strategies.”
51

Continuously identified schools were more likely to have adopted new curricula—both reading or language arts and mathematics—than schools that were no longer identified. In 2003-04, 60 percent of continuously identified schools had adopted a new reading or language arts curriculum within the last three years, compared with 41 percent of schools that were no longer identified. Similarly, 53 percent of continuously identified schools had adopted a new mathematics curriculum within the last three years; this compares to 35 percent of schools that had exited improvement status.
Reasons given for adopting new curricula did not differ between continuously identified
and no longer identified schools, with one exception: continuously identified schools were more likely to report that they adopted a new curriculum because they were identified for improvement. However, only 30 percent of continuously identified schools cited this reason for adopting a reading or language arts curriculum, and only 20 percent of continuously identified schools cited it for adopting a new mathematics curriculum. Other reasons were chosen by larger percentages of schools. Half or more of both sets of schools reported that adoption occurred because the district required it (57 percent of continuously identified schools and 49 percent of those no longer identified in reading or language arts) and that it was consistent with state or district standards or assessments (71 percent in mathematics and 74 percent in reading or language arts, respectively).
The percentage of schools using a school reform model decreased from 47 percent in
2001-02 to 31 percent in 2003-04. However, among continuously identified schools, there was no change over time in the percentage reporting using a school reform model (that is, the proportion of identified schools using school reform models remained in the 40 to 50 percent range).
Most schools reported several efforts to align their curricula with standards and
assessments. In addition to adopting new curricula in support of curricular alignment, 85 percent of principals reported that the majority of educators at their schools participated in professional development aimed at ensuring that their curricula and instruction are consistent with standards and assessments. These actions are consistent with the finding that nearly three-fourths (72 percent) of schools reported that a major focus of their school improvement efforts was matching curriculum and instruction with standards and assessments. There were no differences between continuously identified schools and those no longer identified.
Schools received assistance from states and districts in their efforts to align curricula
and instruction with standards. Seventy-five percent of principals reported that the district or state supported the alignment of curriculum and instruction with state or district standards by analyzing available student achievement data to identify specific strengths and weaknesses related to the attainment of standards (see Exhibit 34). Similarly, two-thirds of principals indicated that the state or district published detailed curriculum guides with standards, frameworks, and pacing sequences. Fewer than half of principals responded that the state or district had developed classroom-embedded assessments with a standard scoring rubric to monitor progress.
52
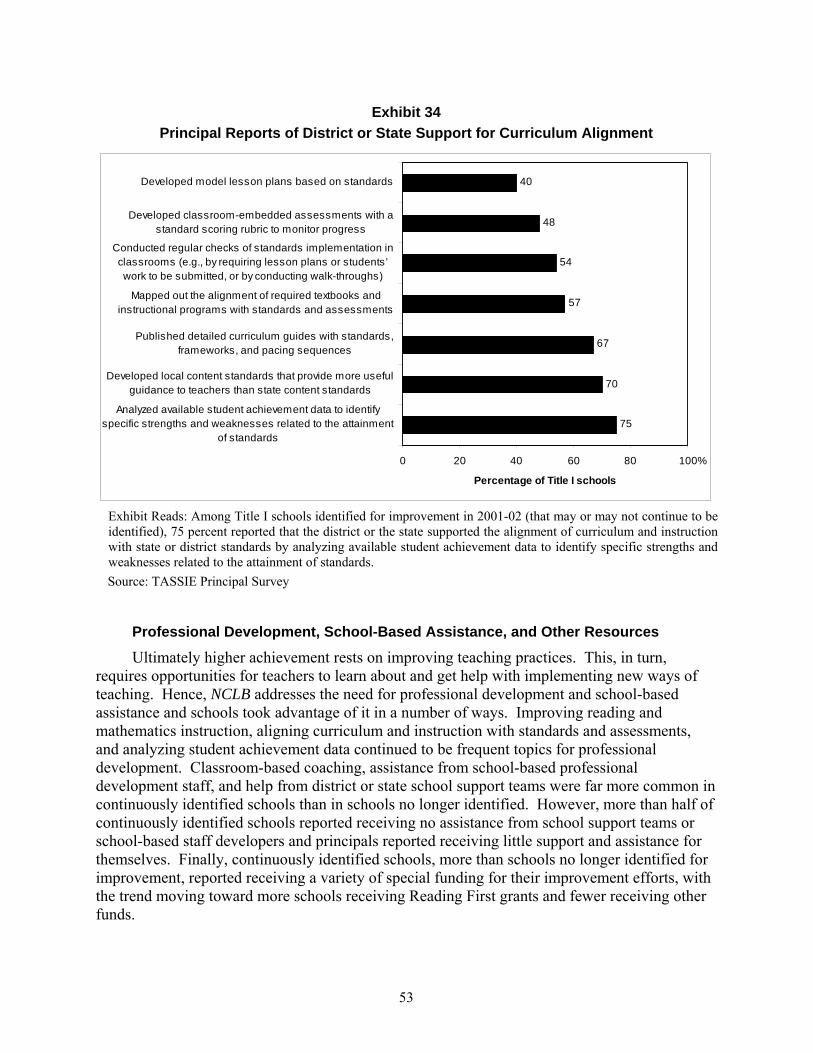
Exhibit 34 Principal Reports of District or State Support for Curriculum Alignment
75
70
67
57
54
48
40
0 20 40 60 80 100
Analyzed available student achievement data to identifyspecific strengths and weaknesses related to the attainment
of standards
Developed local content standards that provide more usefulguidance to teachers than state content standards
Published detailed curriculum guides with standards,frameworks, and pacing sequences
Mapped out the alignment of required textbooks andinstructional programs with standards and assessments
Conducted regular checks of standards implementation inclassrooms (e.g., by requiring lesson plans or students’work to be submitted, or by conducting walk-throughs)
Developed classroom-embedded assessments with astandard scoring rubric to monitor progress
Developed model lesson plans based on standards
Percentage of Title I schools
%
Exhibit Reads: Among Title I schools identified for improvement in 2001-02 (that may or may not continue to be identified), 75 percent reported that the district or the state supported the alignment of curriculum and instruction with state or district standards by analyzing available student achievement data to identify specific strengths and weaknesses related to the attainment of standards. Source: TASSIE Principal Survey
Professional Development, School-Based Assistance, and Other Resources
Ultimately higher achievement rests on improving teaching practices. This, in turn, requires opportunities for teachers to learn about and get help with implementing new ways of teaching. Hence, NCLB addresses the need for professional development and school-based assistance and schools took advantage of it in a number of ways. Improving reading and mathematics instruction, aligning curriculum and instruction with standards and assessments, and analyzing student achievement data continued to be frequent topics for professional development. Classroom-based coaching, assistance from school-based professional development staff, and help from district or state school support teams were far more common in continuously identified schools than in schools no longer identified. However, more than half of continuously identified schools reported receiving no assistance from school support teams or school-based staff developers and principals reported receiving little support and assistance for themselves. Finally, continuously identified schools, more than schools no longer identified for improvement, reported receiving a variety of special funding for their improvement efforts, with the trend moving toward more schools receiving Reading First grants and fewer receiving other funds.
53
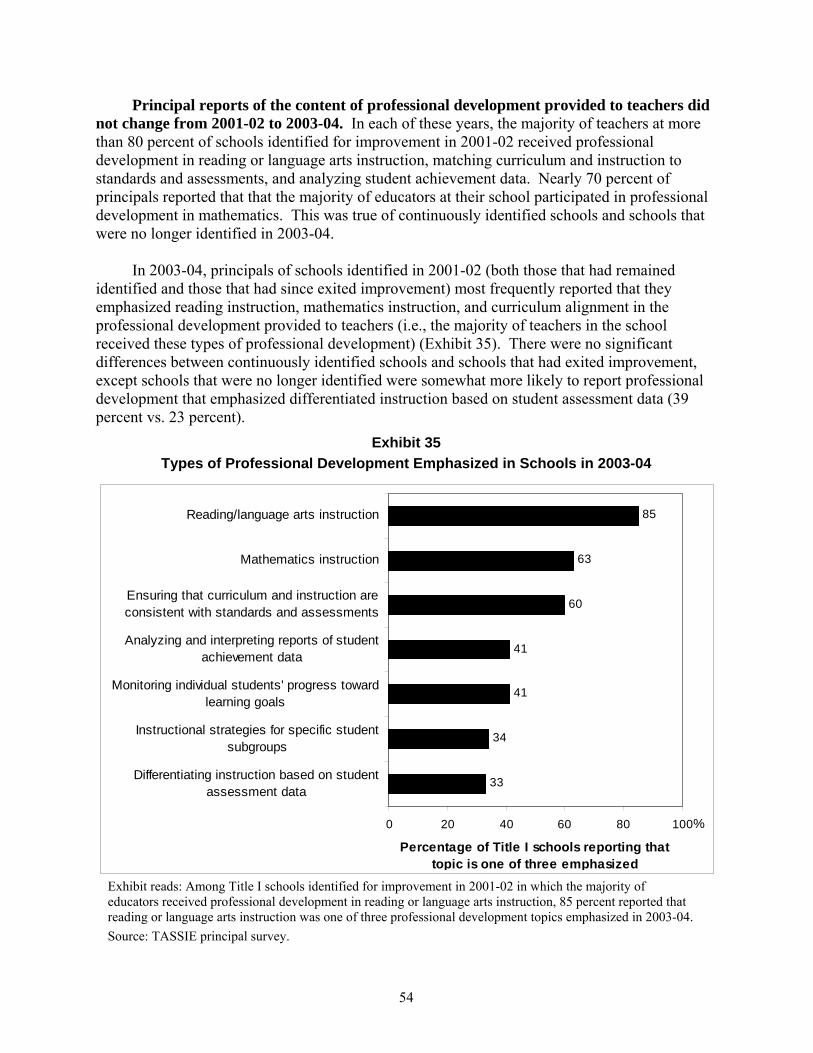
Principal reports of the content of professional development provided to teachers did not change from 2001-02 to 2003-04. In each of these years, the majority of teachers at more than 80 percent of schools identified for improvement in 2001-02 received professional development in reading or language arts instruction, matching curriculum and instruction to standards and assessments, and analyzing student achievement data. Nearly 70 percent of principals reported that that the majority of educators at their school participated in professional development in mathematics. This was true of continuously identified schools and schools that were no longer identified in 2003-04.
In 2003-04, principals of schools identified in 2001-02 (both those that had remained
identified and those that had since exited improvement) most frequently reported that they emphasized reading instruction, mathematics instruction, and curriculum alignment in the professional development provided to teachers (i.e., the majority of teachers in the school received these types of professional development) (Exhibit 35). There were no significant differences between continuously identified schools and schools that had exited improvement, except schools that were no longer identified were somewhat more likely to report professional development that emphasized differentiated instruction based on student assessment data (39 percent vs. 23 percent).
Exhibit 35 Types of Professional Development Emphasized in Schools in 2003-04
33
34
41
41
60
63
85
0 20 40 60 80 100
Differentiating instruction based on studentassessment data
Instructional strategies for specific studentsubgroups
Monitoring individual students' progress towardlearning goals
Analyzing and interpreting reports of studentachievement data
Ensuring that curriculum and instruction areconsistent with standards and assessments
Mathematics instruction
Reading/language arts instruction
%
Percentage of Title I schools reporting that topic is one of three emphasized
Exhibit reads: Among Title I schools identified for improvement in 2001-02 in which the majority of educators received professional development in reading or language arts instruction, 85 percent reported that reading or language arts instruction was one of three professional development topics emphasized in 2003-04. Source: TASSIE principal survey.
54
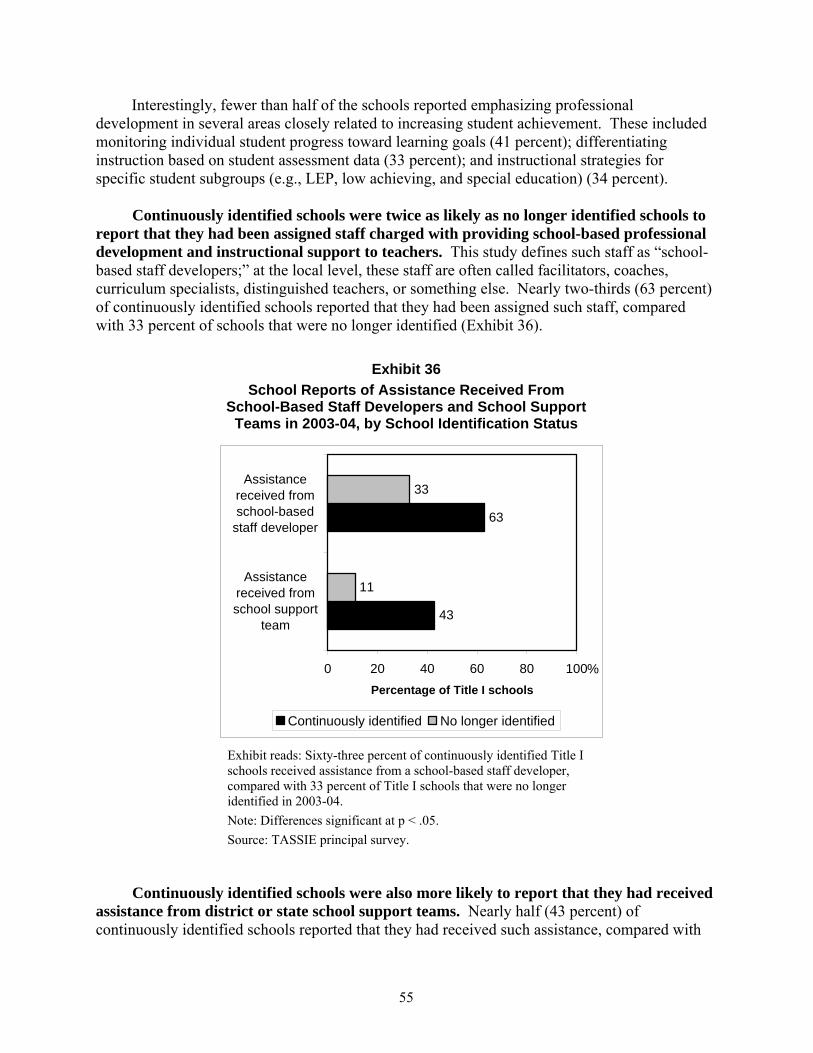
Interestingly, fewer than half of the schools reported emphasizing professional development in several areas closely related to increasing student achievement. These included monitoring individual student progress toward learning goals (41 percent); differentiating instruction based on student assessment data (33 percent); and instructional strategies for specific student subgroups (e.g., LEP, low achieving, and special education) (34 percent).
Continuously identified schools were twice as likely as no longer identified schools to
report that they had been assigned staff charged with providing school-based professional development and instructional support to teachers. This study defines such staff as “school-based staff developers;” at the local level, these staff are often called facilitators, coaches, curriculum specialists, distinguished teachers, or something else. Nearly two-thirds (63 percent) of continuously identified schools reported that they had been assigned such staff, compared with 33 percent of schools that were no longer identified (Exhibit 36).
Exhibit 36
School Reports of Assistance Received From School-Based Staff Developers and School Support
Teams in 2003-04, by School Identification Status
63
43
33
11
0 20 40 60 80 100
Assistancereceived fromschool support
team
Assistancereceived fromschool-based
staff developer
Percentage of Title I schools
Continuously identified No longer identified
%
Exhibit reads: Sixty-three percent of continuously identified Title I schools received assistance from a school-based staff developer, compared with 33 percent of Title I schools that were no longer identified in 2003-04. Note: Differences significant at p < .05. Source: TASSIE principal survey.
Continuously identified schools were also more likely to report that they had received assistance from district or state school support teams. Nearly half (43 percent) of continuously identified schools reported that they had received such assistance, compared with
55

only 11 percent of schools no longer identified (Exhibit 36). This study defines school support teams broadly as a team of educators who provide school-based assistance. These teams are typically comprised of a group of educators, each with a particular area of expertise, and are often charged with conducting needs assessments and supporting school planning processes. Compared to school-based staff developers, school support teams typically spend fewer days working with an individual school. At the local level, school support teams go by a variety of different names. As shown later in this chapter, larger districts were more likely than smaller districts to provide assistance to schools via school support teams, and, in fact, schools in larger districts were more likely to report receiving help from support teams.
These findings suggest that continuously identified schools may have had access to more
intensive and more school-based professional development. Another possible explanation observed in case study sites is that schools lost their school-based staff developers when they exited improvement status.
Still, over half (57 percent) of the continuously identified schools did not receive
assistance from a school support team, and a third (37 percent) did not receive assistance from a school-based staff developer (Exhibit 36). Although more continuously identified schools received more of these types of school-based assistance than their no longer identified counterparts, substantial numbers of identified schools did not receive such help and, among schools receiving school-based assistance, the levels of support varied.
Overall, one-quarter of schools (26 percent) reported relatively high levels of assistance
from school-based staff, amounting to one additional full-time-equivalent staff member or more. The intensity of assistance provided by school-based staff developers was relatively modest in many other schools, however. All told, school-based staff developers spent less than 45 days per year (one day per week or less) in more than a third of schools. Seventeen percent of schools received fewer than 10 days of assistance per year.
Case study data offer examples of a wide variety of activities and a range of capabilities of
school-based staff developers (Exhibit 37). According to principal surveys, the most common activities of school-based staff developers were: professional development (coaching and workshops), helping improve reading or language arts instruction, and analyzing student achievement data.
56
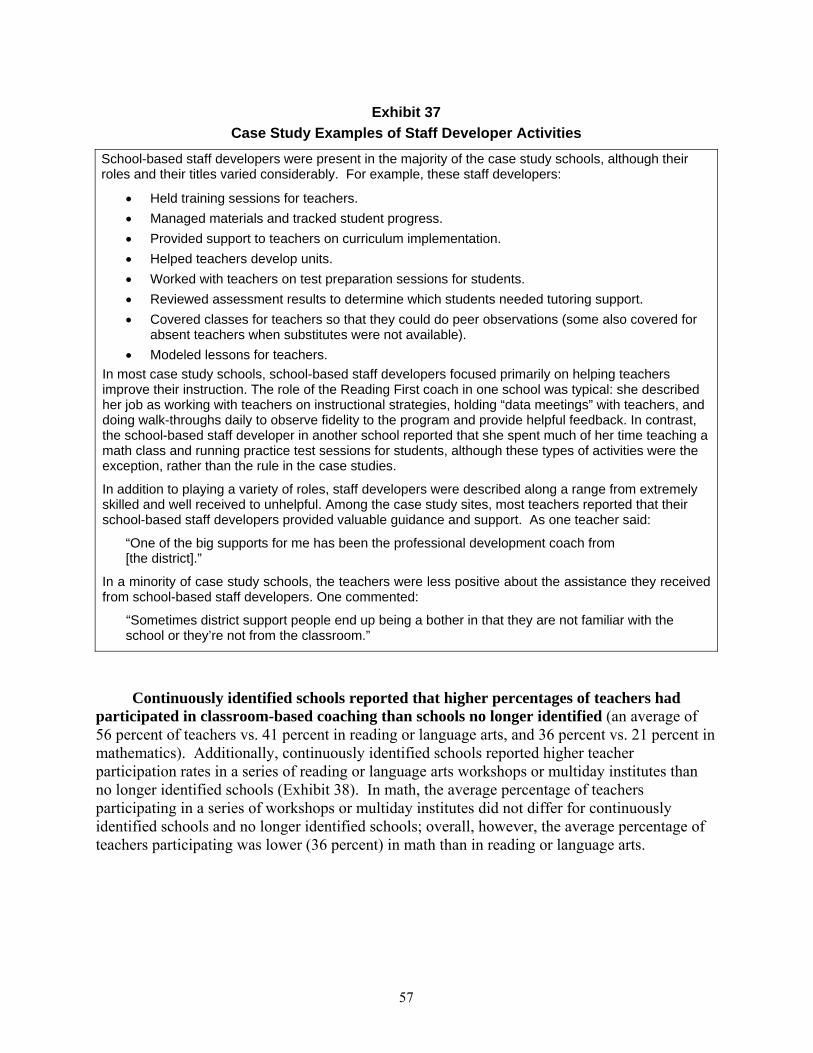
Exhibit 37 Case Study Examples of Staff Developer Activities
School-based staff developers were present in the majority of the case study schools, although their roles and their titles varied considerably. For example, these staff developers:
• Held training sessions for teachers. • Managed materials and tracked student progress. • Provided support to teachers on curriculum implementation. • Helped teachers develop units. • Worked with teachers on test preparation sessions for students. • Reviewed assessment results to determine which students needed tutoring support. • Covered classes for teachers so that they could do peer observations (some also covered for
absent teachers when substitutes were not available). • Modeled lessons for teachers.
In most case study schools, school-based staff developers focused primarily on helping teachers improve their instruction. The role of the Reading First coach in one school was typical: she described her job as working with teachers on instructional strategies, holding “data meetings” with teachers, and doing walk-throughs daily to observe fidelity to the program and provide helpful feedback. In contrast, the school-based staff developer in another school reported that she spent much of her time teaching a math class and running practice test sessions for students, although these types of activities were the exception, rather than the rule in the case studies.
In addition to playing a variety of roles, staff developers were described along a range from extremely skilled and well received to unhelpful. Among the case study sites, most teachers reported that their school-based staff developers provided valuable guidance and support. As one teacher said:
“One of the big supports for me has been the professional development coach from [the district].”
In a minority of case study schools, the teachers were less positive about the assistance they received from school-based staff developers. One commented:
“Sometimes district support people end up being a bother in that they are not familiar with the school or they’re not from the classroom.”
Continuously identified schools reported that higher percentages of teachers had
participated in classroom-based coaching than schools no longer identified (an average of 56 percent of teachers vs. 41 percent in reading or language arts, and 36 percent vs. 21 percent in mathematics). Additionally, continuously identified schools reported higher teacher participation rates in a series of reading or language arts workshops or multiday institutes than no longer identified schools (Exhibit 38). In math, the average percentage of teachers participating in a series of workshops or multiday institutes did not differ for continuously identified schools and no longer identified schools; overall, however, the average percentage of teachers participating was lower (36 percent) in math than in reading or language arts.
57

Exhibit 38 Average Percentage of Teacher Participation in Each of Three Types of Professional Development in 2003-04, by School Identification Status
68
56
36
56
41
21
0 20 40 60 80 100
Teachers who participated in a series ofworkshops or a multiday institute asreading/language arts professional
development
Teachers who participated in classroom-based coaching as reading/language arts
professional development
Teachers who participated in classroom-based coaching as mathematics
professional development
Mean percentage of teachers
Continuously identified No longer identified
%
Exhibit reads: Among Title I schools continuously identified for improvement since 2001-02, a mean of 36 percent of teachers participated in classroom-based coaching in mathematics, compared with 21 percent in Title I schools no longer identified. Note: Differences significant at p < .05. Source: TASSIE principal survey.
Principals reported receiving little support and assistance for themselves. Only 14
percent reported receiving help from a mentor or coach, 25 percent reported that they met regularly with other principals of low-performing schools, and 6 percent said they had special supervision or reporting requirements. Principals of continuously identified schools were more likely than principals of schools no longer identified to report attending regular meetings or study groups with other principals of low-performing schools (40 percent vs. 19 percent) to work collaboratively to problem solve; there were no differences for the other types of support.
Continuously identified schools were more likely to receive special funding than those
no longer identified, suggesting that states and districts were successfully targeting Title I identified schools for additional financial support. In 2003-04, continuously identified schools were more likely than schools that had exited improvement to report receiving each of four types of special funding (Exhibit 39). For example, continuously identified schools were far more likely to have received a special grant to support school improvement (55 percent vs. 25 percent) and to have received additional Title I funding earmarked to support school improvement (66 percent vs. 25 percent) than schools no longer identified. Interestingly, middle schools were more often the recipients of funds from these sources (based on the whole school sample), with the exception of Reading First subgrants, which are targeted to elementary schools.
58

Exhibit 39 Title I Schools Receiving Four Types of Special Funding in 2003-04,
by School Identification Status
66
55
28
24
25
25
10
16
0 20 40 60 80 100
Comprehensive School Reform (CSR)program
Reading First
Special grant to support schoolimprovement
Additional Title I funding, earmarked tosupport school improvement
Percentage of Title I schools
Continuously identified No longer identified
%
Exhibit reads: Sixty-six percent of Title I schools that continued to be identified for improvement in 2003-04 received additional Title I funds earmarked for school improvement, compared with 25 percent of Title I schools that were no longer identified. Note: Differences significant at p < .05. Source: TASSIE principal survey.
Overall, increasing percentages of schools were receiving Reading First grants, while
decreasing percentages were receiving special grants to support school improvement. Among all elementary schools identified for improvement in 2001-02, those reporting receiving Reading First grants increased from 12 percent in 2001-02 to 18 percent in 2003-04. In contrast, the percentage of schools receiving special grants to support school improvement decreased from 58 percent to 35 percent over the three years. However, the percentage of continuously identified schools receiving special grants to support school improvement (55 percent in 2003-04) did not change from 2001-02 to 2003-04.
Sources of funding for specific school improvement strategies, such as professional
development and school-based assistance, can be difficult to pinpoint. For example, in one case study district the school used a school improvement grant to pay for professional development services. Here the district did not directly deliver or pay for the services; however, the district was instrumental in helping the school obtain the grant (Exhibit 40).
59

Exhibit 40 Funding for School-Based Staff Developers in Case Study Schools
Case study schools illustrated different ways in which schools obtained extra staff to provide school-based professional development and instructional support. Although some schools had such staff assigned by the district, others used grants to the school to fund school-based staff developers. For example, schools participating in Reading First used this grant money to hire full-time staff developers, called reading coaches in those districts. One such school also had a state-funded reading specialist who visited the school once a week. Another school in a large, decentralized district chose to allocate a portion of its budget to hire two full-time curriculum specialists to support teachers’ development in reading and mathematics. In several cases where school-based staff developers were supported by district funds, decreases in district budgets led to the removal or reduction in time of these support staff, whether or not the school was identified for improvement.
District Assistance NCLB requires districts to provide identified schools with basic assistance related to
managing their school improvement efforts. Districts must help schools analyze student achievement data to determine why they were identified for improvement, write an improvement plan, revise their budgets so that resources are effectively allocated to the activities most likely to increase student achievement, implement professional development, and put in place practices that have shown evidence of effectiveness. Because these tasks are closely related to the core functions of the district central office (e.g., financial management and management of information systems, professional development, curriculum adoption), it is not surprising that districts reported that these tasks were a major focus of their technical assistance to identified schools.
Planning, Data Use, and Curriculum Alignment
For the most part, priorities for district assistance to schools have remained the same since the implementation of NCLB in 2002-03. Districts with identified Title I schools continued to help schools use achievement data, match curriculum and instruction with standards and assessments, and plan improvements in order to raise student achievement. Only a small percentage reported not doing this.
Increasing the use of student achievement data and matching curriculum and
instruction with standards and assessments continued to be top priorities for district assistance in all three years of the study (Exhibit 41). Improving the school planning process and increasing the quantity and quality of professional development also continued to be a major focus of district assistance all three years.
60

Exhibit 41 Percent of Districts Placing a Major Focus on Strategies for Improving
Identified Schools, 2001-02 to 2003-04
50
54
35
28
75
76
45
64
51
37
32
28
77
86
61
63
45
59
54
79
36
23
26
76
0 20 40 60 80 100
Selecting and/or implementing a school reformmodel
Increasing monitoring and district oversight*
Selecting and/or implementing a new curriculum orinstructional program
Using research to inform decisions aboutimprovement strategies
Improving the school planning process
Increasing the quality and quantity of teacher andprincipal professional development*
Matching curriculum and instruction with standardsand/or assessments
Increasing the use of student achievement data
Percentage of districts2003-04 2002-03 2001-02
%
Exhibit reads: In 2001-02, 79 percent of districts with identified schools reported that increasing the use of student achievement data to inform classroom instruction was a major focus of district assistance. Note: An asterisk indicates that the difference between 2001-02 and 2003-04 is statistically significant at p < .05. Source: TASSIE district survey.
District priorities for assistance have not changed a great deal in the years since NCLB went into effect, with two exceptions. In 2003-04, more districts with identified Title I schools reported that improving the quantity and quality of teacher professional development was a major focus of district assistance than in 2001-02 (64 percent vs. 54 percent of districts with identified Title I schools). In addition, more districts with identified Title I schools reported that increasing district monitoring and oversight was a major focus of district assistance (35 percent vs. 23 percent), although the number of districts reporting monitoring and oversight as a major focus remained low overall.
In 2003-04, consistent with their reported priorities, nearly all districts with identified
Title I schools continued to assist those schools with tasks related to school improvement planning, as they had in previous years. For example, 98 percent of districts reported that they
61

helped their identified Title I schools write or revise a school improvement plan; 92 percent of districts with identified Title I schools reported the same assistance in 2001-02, the year before NCLB went into effect. Similarly, 91 percent of districts reported that they helped schools analyze student achievement data to identify specific academic problems that caused the school to be identified; 98 percent of districts reported the same assistance two years earlier.
Nearly three-quarters of districts assisted their identified Title I schools with
analyzing and revising their budgets so that school resources are used more effectively, as required under NCLB. The percentage of districts providing this type of assistance to their identified Title I schools had not changed in three years, since the law was first enacted. Seventy-one percent of districts reported that they provided this assistance to their identified Title I schools in 2003-04, compared with 72 percent in 2002-03 and 74 percent in 2001-02. More than one-quarter (29 percent) of districts with identified Title I schools still did not provide this assistance in 2003-04. In that same year, just over half of all principals (54 percent) of schools reported that their district provided them with useful assistance in analyzing and revising their school budget; the other half of schools either did not receive this type of assistance or did not find the assistance useful.
By the end of the second year of NCLB implementation (2003-04), more than a third of
districts with identified Title I schools provided these schools with assistance on all of the following tasks related to data analysis and planning:
• Review data to be sure identification is valid. • Analyze student achievement data to identify specific academic problems that caused
the school to be identified. • Identify research-based improvement strategies. • Provide additional data analysis, e.g., additional disaggregation or analysis of
diagnostic assessments. • Analyze and revise the school’s budget so that school resources are allocated
effectively. • Write or revise the school’s improvement plan. • Monitor progress throughout the school year toward goals established in the school
improvement plan. Districts with identified Title I schools also continued to support the alignment of
curriculum with academic content standards and assessments, reporting similar levels of activity in 2003-04 as in previous years. For example, nearly all districts with identified Title I schools (90 percent) reported providing teachers with professional development on aligning curriculum and instruction with standards and assessments. A majority of districts with identified Title I schools reported that they produced detailed curriculum guides with standards, frameworks, and pacing sequences for use by teachers (65 percent), local content standards (59 percent), and classroom assessments with a standard scoring rubric to monitor progress (58 percent). Just over three-quarters (76 percent) reported that they conducted regular checks of standards implementation in classrooms.
62

Fewer than 10 percent of districts with identified Title I schools reported that they
provided no support of any kind to those schools with tasks related to analyzing achievement data, planning for improvement, and aligning curriculum with standards. Nearly all districts provided their identified schools with at least some of these types of assistance. In 2003-04, only 11 percent of identified schools were located in districts that provided no assistance of any kind with planning and data use; fewer than 3 percent were located in districts that provided no assistance of any kind with curriculum alignment.
Professional Development, School-Based Assistance, and Other Resources
NCLB requires that districts help identified schools to secure adequate professional development for teachers and to adopt instructional practices that have shown evidence of effectiveness in raising student achievement. Districts did so, with reading or language arts instruction the most widespread professional development topic. However, while districts increasingly required identified schools to spend 10 percent of their Title I allocation on professional development, fewer than half assigned professional development staff, school support teams, or principal mentors to these schools, leaving a significant number of schools with no such support. As in previous years, large districts were more likely to provide all of these kinds of assistance than did smaller ones.
In 2003-04, districts with identified Title I schools continued to offer professional
development on topics related to their school improvement priorities, with slightly less attention paid to aligning curriculum and instruction to standards and assessments in 2003-04 than the year before. Reading or language arts instruction, data analysis, curriculum alignment, and strategies for specific student subgroups continued to be the most commonly reported topics of district-sponsored professional development in districts with identified schools (Exhibit 42). The percentage of districts with identified Title I schools offering professional development on curricular alignment dropped from 97 percent in 2002-03 to 86 percent in 2003-04. Percentages on other topics remained unchanged.
63

Exhibit 42 Topics Addressed by District-Sponsored Professional Development in 2003-04
95
88
86
86
80
75
65
44
0 20 40 60 80 100
Implementation of a school reform model
Differentiating instruction based on studentassessment data
Monitoring individual students' progress towardlearning goals
Mathematics instruction
Improving instruction for specificstudent subgroups
Aligning curriculum and instruction withstandards and assessments
Analyzing and interpreting studentachievement data
Reading/language arts instruction
Percentage of districts
%
Exhibit reads: In 2003-04, 95 percent of districts with identified Title I schools offered district-sponsored professional development to teachers on the topic of reading or language arts instruction. Source: TASSIE district survey.
In 2003-04, traditional forms of professional development—workshops, institutes, and conferences—were more universally supported by districts with identified Title I schools than other kinds, including classroom-based coaching, teacher work groups of various kinds, or classroom observations. Nearly all districts with identified Title I schools (95 percent) reported that they provided professional development workshops or institutes for teachers; 83 percent of districts sent teachers to conferences. Principals confirmed this pattern in their reports of the types of professional development teachers participated in. The majority of continuously identified schools received assistance in the form of one-time workshops or a series of workshops (Exhibit 43).
64
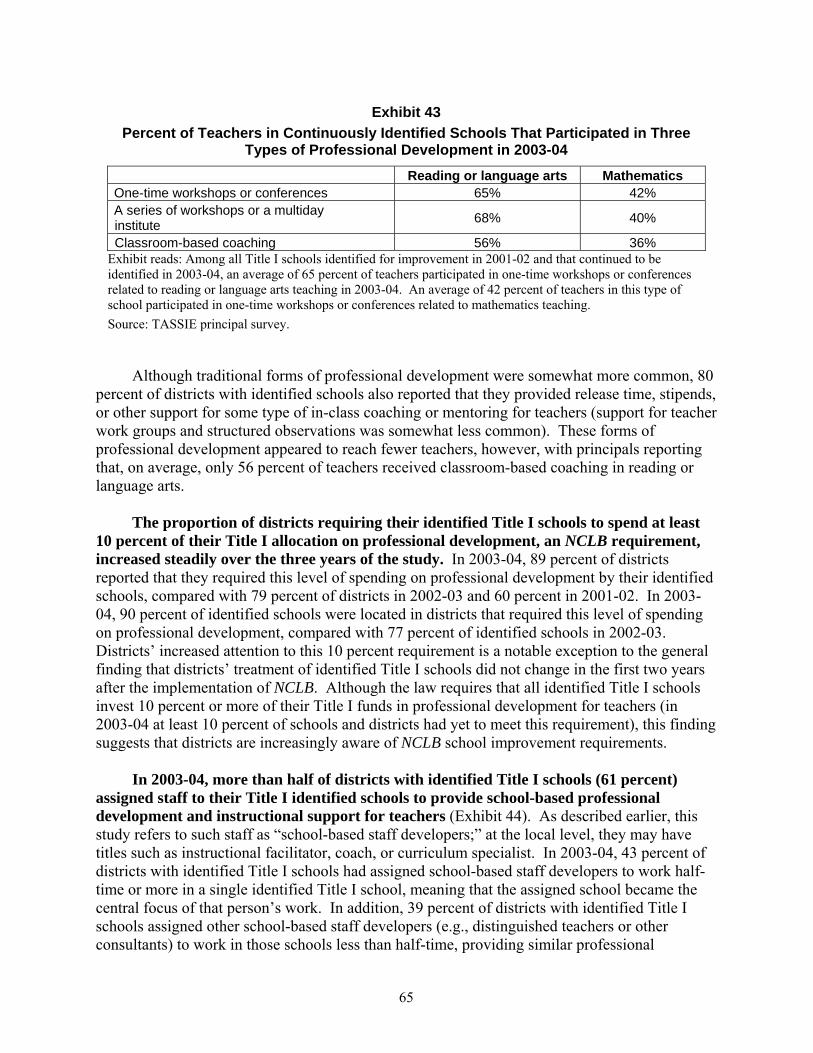
Exhibit 43 Percent of Teachers in Continuously Identified Schools That Participated in Three
Types of Professional Development in 2003-04
Reading or language arts Mathematics One-time workshops or conferences 65% 42% A series of workshops or a multiday institute 68% 40%
Classroom-based coaching 56% 36% Exhibit reads: Among all Title I schools identified for improvement in 2001-02 and that continued to be identified in 2003-04, an average of 65 percent of teachers participated in one-time workshops or conferences related to reading or language arts teaching in 2003-04. An average of 42 percent of teachers in this type of school participated in one-time workshops or conferences related to mathematics teaching. Source: TASSIE principal survey.
Although traditional forms of professional development were somewhat more common, 80
percent of districts with identified schools also reported that they provided release time, stipends, or other support for some type of in-class coaching or mentoring for teachers (support for teacher work groups and structured observations was somewhat less common). These forms of professional development appeared to reach fewer teachers, however, with principals reporting that, on average, only 56 percent of teachers received classroom-based coaching in reading or language arts.
The proportion of districts requiring their identified Title I schools to spend at least
10 percent of their Title I allocation on professional development, an NCLB requirement, increased steadily over the three years of the study. In 2003-04, 89 percent of districts reported that they required this level of spending on professional development by their identified schools, compared with 79 percent of districts in 2002-03 and 60 percent in 2001-02. In 2003-04, 90 percent of identified schools were located in districts that required this level of spending on professional development, compared with 77 percent of identified schools in 2002-03. Districts’ increased attention to this 10 percent requirement is a notable exception to the general finding that districts’ treatment of identified Title I schools did not change in the first two years after the implementation of NCLB. Although the law requires that all identified Title I schools invest 10 percent or more of their Title I funds in professional development for teachers (in 2003-04 at least 10 percent of schools and districts had yet to meet this requirement), this finding suggests that districts are increasingly aware of NCLB school improvement requirements.
In 2003-04, more than half of districts with identified Title I schools (61 percent)
assigned staff to their Title I identified schools to provide school-based professional development and instructional support for teachers (Exhibit 44). As described earlier, this study refers to such staff as “school-based staff developers;” at the local level, they may have titles such as instructional facilitator, coach, or curriculum specialist. In 2003-04, 43 percent of districts with identified Title I schools had assigned school-based staff developers to work half-time or more in a single identified Title I school, meaning that the assigned school became the central focus of that person’s work. In addition, 39 percent of districts with identified Title I schools assigned other school-based staff developers (e.g., distinguished teachers or other consultants) to work in those schools less than half-time, providing similar professional
65
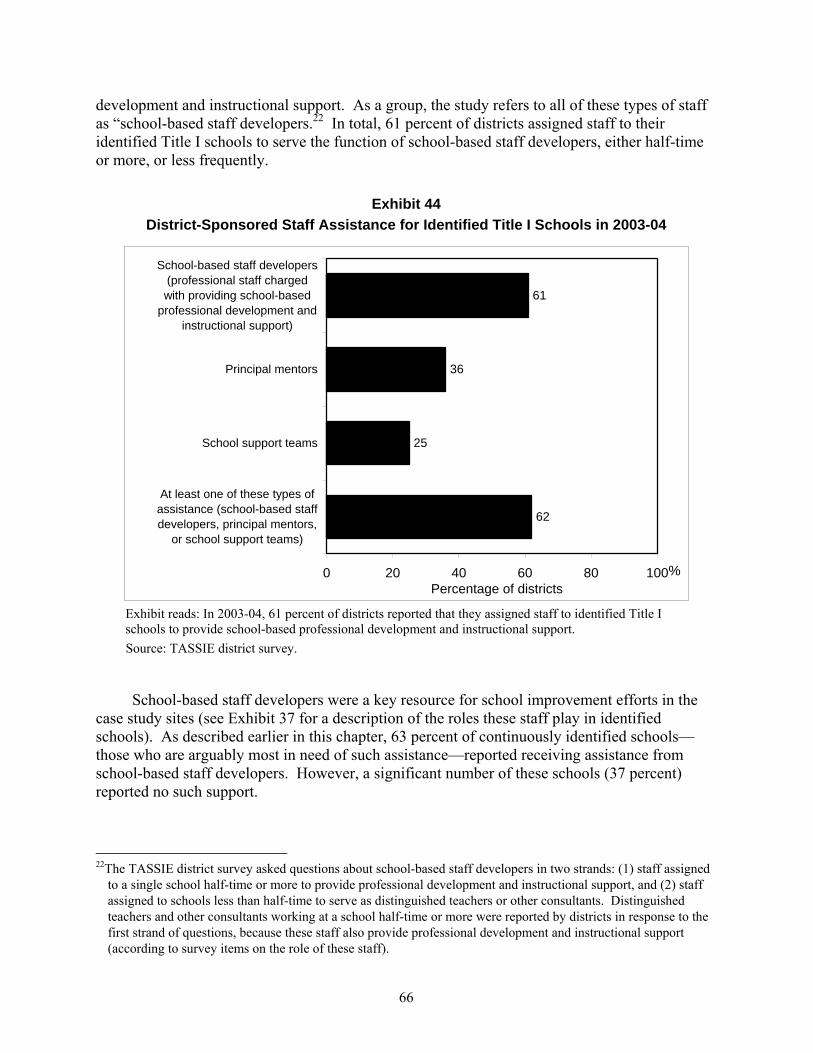
development and instructional support. As a group, the study refers to all of these types of staff as “school-based staff developers.22 In total, 61 percent of districts assigned staff to their identified Title I schools to serve the function of school-based staff developers, either half-time or more, or less frequently.
Exhibit 44
District-Sponsored Staff Assistance for Identified Title I Schools in 2003-04
62
25
36
61
0 20 40 60 80 100
At least one of these types ofassistance (school-based staffdevelopers, principal mentors,
or school support teams)
School support teams
Principal mentors
School-based staff developers(professional staff chargedwith providing school-based
professional development andinstructional support)
Percentage of districts%
Exhibit reads: In 2003-04, 61 percent of districts reported that they assigned staff to identified Title I schools to provide school-based professional development and instructional support. Source: TASSIE district survey.
School-based staff developers were a key resource for school improvement efforts in the
case study sites (see Exhibit 37 for a description of the roles these staff play in identified schools). As described earlier in this chapter, 63 percent of continuously identified schools—those who are arguably most in need of such assistance—reported receiving assistance from school-based staff developers. However, a significant number of these schools (37 percent) reported no such support.
22The TASSIE district survey asked questions about school-based staff developers in two strands: (1) staff assigned
to a single school half-time or more to provide professional development and instructional support, and (2) staff assigned to schools less than half-time to serve as distinguished teachers or other consultants. Distinguished teachers and other consultants working at a school half-time or more were reported by districts in response to the first strand of questions, because these staff also provide professional development and instructional support (according to survey items on the role of these staff).
66

In addition to school-based staff developers, just over a third of districts with identified Title I schools assigned principal mentors to those schools and one-quarter of districts assigned district-sponsored school support teams to identified Title I schools. As described earlier, school support teams consist of teams of educators who typically assist schools with conducting needs assessments and supporting school planning processes. Compared with school-based staff developers, school support teams typically spend fewer days working with an individual school.
The proportion of districts providing district-sponsored school support teams to identified
Title I schools had not increased significantly since 2001-02. The proportion of districts reporting that they assigned a mentor to the principals of identified Title I schools increased, from 21 percent in 2001-02 to 36 percent in 2003-04.
Nearly all of the districts that sponsored principal mentors and school support teams for
identified Title I schools provided those schools with assistance in the form of school-based staff developers as well. In 2003-04, 62 percent of districts with identified Title I schools provided those schools with one or more forms of staff assistance—either school-based staff developers, principal mentors, or school support teams (Exhibit 44). More than a third of districts with identified Title I schools (38 percent) provided none of these types of assistance to their identified schools.
In 2003-04, about a fifth of identified Title I schools were located in districts that did
not provide any of the types of school-based assistance described above. That is, 21 percent of identified Title I schools were located in districts that provided no school-based staff developers, principal mentors, or school support teams to their identified Title I schools. Data from the 15 case study districts suggest that lack of resources, both financial and human, may help explain why many districts did not provide these types of assistance (Exhibit 45).
Exhibit 45
Case Study District Resource Constraints
All but two of the 15 case study districts reported that declining budgets and limited staff had limited their capacity to help their identified schools. Several districts had experienced declining budgets for several years; several more districts reported budget pressures in 2003-04. As a result, districts had fewer funds available to support teacher professional development. One superintendent noted that people are paid to be trained in the business world, but, he said, “Here we don’t have money for per diem or weekends or summer, so we have to do [training] during the workday. But if we pull [teachers] out for training, the kids lose a whole day of instruction.” In addition, districts in 2003-04 had fewer staff in the district office who could work with schools than in previous years. The smallest districts had no staff to play that role. Even districts with staff available to work in the schools were concerned that those staff did not have the skills and knowledge needed to provide school-based staff development and instructional support. Districts pointed particularly to lack of staff with the skills and knowledge to address the needs of LEP students, both in the district office and in schools. The smallest districts mentioned lack of cultural awareness of Latino and Native American students among district and school staff and lack of materials and computers. Even the largest districts reported lack of capacity to provide school-based staff development. One district official said, “We don’t have the people with the necessary expertise.”
67

Nearly all school-based staff developers and school support teams deployed by districts with identified Title I schools focused their work on the same general goals: improving reading or language arts instruction, providing professional development to teachers, and supporting the analysis of student achievement data. Consistent with reported district priorities for school improvement, each of these types of staff focused on reading or language arts more often than on mathematics instruction, and each worked with teachers on analyzing and using student achievement data to inform instruction (Exhibit 46). Districts reported that school-based staff developers assigned half-time or more to a single school were more likely to provide teacher professional development in the form of coaching or workshops than those assigned to the school less than half-time (school-based staff developers working half-time or more provided teacher professional development in 89 percent of districts, compared with 65 percent of districts for school-based staff developers working less than half-time). School support teams paid particular attention to helping schools develop improvement plans, with 74 percent of districts reporting that this was a focus of their work. School-based staff developers and school support teams worked on curriculum mapping or alignment in only about half of districts.
Exhibit 46 Focus of Assistance Most Commonly Provided by School-Based Staff Developers
and School Support Teams in 2003-04
77
79
85
74
77
85
0 20 40 60 80 100
Developing a school improvement plan
Reading/language arts instruction
Analyzing and interpreting student achievement data
Providing teacher professional development(e.g., coaching, workshops)
Analyzing and interpreting student achievement data
Reading/language arts instruction
Percentage of districts
School support teamsSchool-based staff developers
%
Exhibit reads: Eighty-five percent of districts where school-based staff developers operated reported that improving reading or language arts instruction was a focus of their work. (See Appendix B for the complete data set.) Source: TASSIE district survey.
68
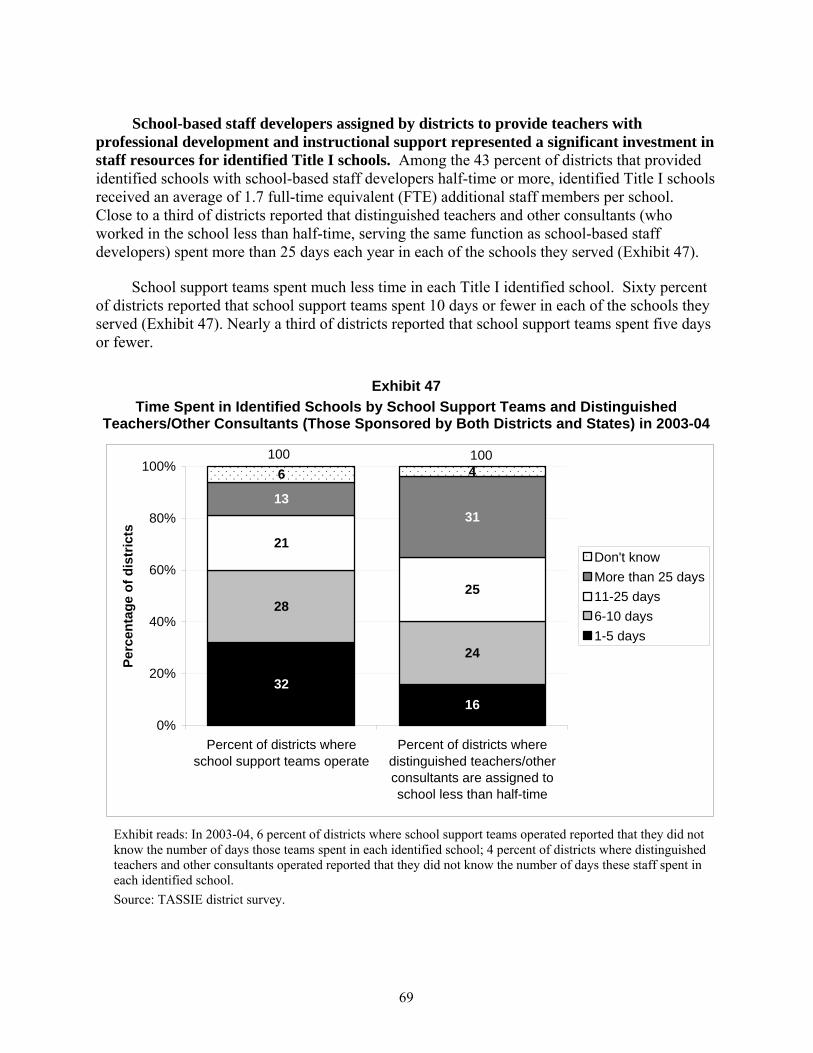
School-based staff developers assigned by districts to provide teachers with
professional development and instructional support represented a significant investment in staff resources for identified Title I schools. Among the 43 percent of districts that provided identified schools with school-based staff developers half-time or more, identified Title I schools received an average of 1.7 full-time equivalent (FTE) additional staff members per school. Close to a third of districts reported that distinguished teachers and other consultants (who worked in the school less than half-time, serving the same function as school-based staff developers) spent more than 25 days each year in each of the schools they served (Exhibit 47).
School support teams spent much less time in each Title I identified school. Sixty percent of districts reported that school support teams spent 10 days or fewer in each of the schools they served (Exhibit 47). Nearly a third of districts reported that school support teams spent five days or fewer.
Exhibit 47
Time Spent in Identified Schools by School Support Teams and Distinguished Teachers/Other Consultants (Those Sponsored by Both Districts and States) in 2003-04
1632
24
28
21
25
3113
6 4
0%
20%
40%
60%
80%
100%
Percent of districts whereschool support teams operate
Percent of districts wheredistinguished teachers/otherconsultants are assigned toschool less than half-time
Perc
enta
ge o
f dis
tric
ts
Don't knowMore than 25 days11-25 days6-10 days1-5 days
100100
Exhibit reads: In 2003-04, 6 percent of districts where school support teams operated reported that they did not know the number of days those teams spent in each identified school; 4 percent of districts where distinguished teachers and other consultants operated reported that they did not know the number of days these staff spent in each identified school. Source: TASSIE district survey.
69

In 2003-04, larger districts were more likely than other districts to provide assistance to their identified Title I schools, as was true in previous years. Larger districts consistently reported higher levels of support for identified Title I schools in most areas tracked by the study: support for planning and data use, district-sponsored professional development, support for curriculum alignment, school-based staff developers, and other forms of staff assistance (principal mentors and school support teams) (Exhibit 48). In addition, the gap between smaller and larger districts did not change over the three years of the study. Larger districts were more likely to provide identified schools with an extensive range of assistance on topics related to planning, data use, and curriculum alignment. They were also more likely to sponsor professional development on an extensive range of topics.
Exhibit 48
District Assistance to Identified Title I Schools in 2003-04, by District Size
44
51
63
64
65
89
57
23
27
14
14
11
57
40
39
24
24
11
69
50
53
44
33
33
0 20 40 60 80 10
Extensive range of assistance with curriculumalignment
Extensive range of assistance with professionaldevelopment
District-sponsored school support teams
Special supervision or lines of reporting forprincipals
Extensive range of assistance with planning anddata use
School-based staff developers
Percentage of districts0
Small Medium Large Very large
Exhibit reads: In 2003-04, 89 percent of very large districts provided identified Title I schools with school-based staff developers, compared with 69 percent of large districts, 57 percent of medium districts, and 57 percent of small districts. (See Appendix B for complete data set.) Note: Variation by district size is statistically significant at p < .05. (See Appendix A for a description of the indices shown in this table (e.g., “extensive range of assistance with planning and data use”), pages A-6 to A-13.) Source: TASSIE district survey.
70

Small districts of fewer than 3,000 students—serving roughly a fifth of all identified schools in 2003-04 (Exhibit 2)—provided assistance of all kinds less often. In fact, only a minority of small districts provided their identified schools with the kinds of assistance that were commonplace among very large districts. About a third (35 percent) of small districts, for example, provided identified schools with school-based staff developers who were assigned to the school more than half-time, compared with three-quarters (74 percent) of very large districts. Just over a half (57 percent) of small districts provided identified schools with any type of school-based staff developer, compared with 89 percent of very large districts (Exhibit 48). Similarly, only 14 percent of small districts offered on-site assistance in the form of school support teams, compared with 63 percent of very large districts.
For their part, continuously identified Title I schools in larger districts were more
likely to report that they had received assistance from school-based staff developers and school support teams than continuously identified schools in smaller districts. For example, 74 percent of continuously identified Title I schools in very large districts reported that they had received assistance from school-based staff developers, compared with 58 to 60 percent of continuously identified schools in large and medium districts, and 34 percent in small districts. Similarly, 49 percent of continuously identified schools located in very large districts reported that they had received assistance from a school support team, compared with 35 to 39 percent of continuously identified schools in medium and large districts, and 29 percent in small districts.
In some cases, larger districts also provided more intensive assistance to identified
schools than smaller districts. For example, school support teams sponsored by smaller districts spent fewer days, on average, in each identified school than those sponsored by large districts and very large districts. Very large districts assigned more full-time-equivalent (FTE) school-based staff developers to each identified school, on average, than smaller districts. Larger districts were also more likely to report that identified Title I schools had access to special funding streams to support school improvement activities, such as Reading First funds, Comprehensive School Reform funds, special grants to support school improvement, and Title I funds specially earmarked to support school improvement.
Targeting of Assistance to Schools Within Districts In 2003-04, approximately 300 districts nationwide served three different types of schools:
identified Title I schools, schools that had missed AYP for just one year, and higher-performing schools. These districts were faced with choices about targeting assistance to their Title I identified schools, and differentiating the assistance they provided identified schools from the assistance they provided to other schools with strong records of student achievement. They had to make choices about which schools to serve and whether identified Title I schools would receive more or different kinds of assistance. Although they represented a small number of districts, these districts served a relatively large number of identified Title I schools—approximately 1,800, or a third (31 percent) of identified Title I schools nationwide.
In 2003-04, districts that served schools with varying levels of performance continued to
assist all of their schools, not just those identified for improvement under Title I, although some provided more staff resources and more intensive assistance to their identified Title I schools than to schools not identified. Districts with schools identified for improvement generally
71

reported carrying out assistance required under NCLB more than did districts with no identified schools.
In 2003-04, districts typically provided most kinds of assistance to all schools, whether
the schools were higher-performing, lower-performing (having missed AYP), or an identified Title I school. A minority of districts with all three types of schools chose to target specific efforts to identified Title I schools only (Exhibit 49). For example, 44 percent required
Exhibit 49
Districts That Provided Assistance to Identified Title I Schools Only, Among Districts That Provided Assistance and Had Identified Title I Schools, Schools That Missed AYP,
and Higher-Performing Schools in 2003-04
23
23
18
6
42
35
24
44
3
15
0 20 40 60 80 100
Assistance identifying research-based improvementstrategies
Assistance writing or revising the school’s improvement plan
Requirement that Title I schools spend at least 10 percent oftheir Title I allocation on professional development
Assistance analyzing and revising the school’s budget sothat school resources would be effectively allocated
Mentor or coach for the principal
District-sponsored school support teams
Special supervision or lines of reporting for principals
New mathematics curriculum or instructional program
New reading curriculum or instructional program
School reform model
Percentage of districts targeting assistance to identified Title I schools only
Adoption RequirementsAdditional Staffing or External AssistanceAssistance with School Improvement Planning
%
Exhibit reads: Among districts that required the adoption of school reform models and that had identified Title I schools, schools that had missed AYP for one year only, and higher-performing schools, 44 percent required the adoption of school reform models of their identified Title I schools, but not for the other types of schools. Source: TASSIE district survey.
72

the adoption of a school reform model in identified Title I schools only; fewer districts required new curriculum adoption only by identified Title I schools (15 percent in reading, 3 percent in mathematics).
Some districts provided more staff resources and more intensive assistance to their
identified Title I schools than to those not identified. For example, of those districts that assigned school-based staff developers and were faced with choices about how to allocate those staff among higher-performing, lower-performing, and identified schools, 30 percent reported that identified Title I schools received more full-time-equivalent staff developers than schools that were not identified. Of districts that assigned schools additional teachers to reduce class size and faced choices about how to allocate those staff, 30 percent reported that identified schools received more teachers than schools that were not identified. Some districts with identified Title I schools also provided greater monitoring and oversight of their identified Title I schools. For example, 42 percent of districts reported that they established special supervision or lines of reporting for principals of identified Title I schools.
Districts with identified Title I schools were more likely to report that they had
undertaken assistance activities specifically required under NCLB than were districts without identified schools. To explore whether districts with identified Title I schools might provide more or different types of assistance than districts that were not responsible for implementing NCLB school improvement requirements, the study compared assistance provided by districts with identified Title I schools and assistance provided by districts whose schools had missed AYP for one year only (and that had no experience with identified schools during the entire study period). Districts with identified schools were more likely than other districts to report that they helped their schools with writing or revising a school improvement plan or with analyzing a school budget (Exhibit 50). Districts with identified schools also were more likely to report that they required their identified schools to spend at least 10 percent of their budget on professional development, as required under NCLB, than districts with schools that had not been identified. Although not specifically required under NCLB, districts with identified schools were also more likely to report that they assigned school-based staff developers to identified Title I schools. These differences between the two district samples are large and consistent across many different types of assistance, as well as within districts of the same size. Although larger districts are more likely to have identified schools and are also more likely to offer various kinds of assistance, large districts with identified Title I schools were still more likely to provide assistance of various kinds than districts of a similar size with Title I schools that had not been identified. These findings suggest that districts required to engage in school improvement efforts under NCLB for identified schools were more likely to do so than districts with schools that had missed AYP for the first time.
73

Exhibit 50 District-Sponsored Assistance Among Districts With Identified Title I
Schools in 2003-04, Compared With Districts Whose Schools Had Missed AYP for One Year Only
1
21
34
49
60
76
30
45
50
71
89
98
0 20 40 60 80 100
Required adoption of a school reform model
Required adoption of new reading/language artscurricula
Required Title I schools to spend at least 10percent of Title I allocation on professional
development
Percentage of districts
Districts with Title I Identified Schools
Districts with schools that missed AYP for one
%
Exhibit reads: In 2003-04, 98 percent of districts with identified schools reported that they helped those schools write or revise a school improvement plan, compared with 76 percent of districts with schools that had missed AYP for one year only. Notes: Differences significant at p < .05. (See Appendix B for complete data set.) Source: TASSIE district survey.
State Organization of Support to Identified Title I Schools Although districts are the most immediate source of assistance for identified Title I
schools, states are responsible for providing resources—both human and financial—to districts and schools identified for improvement. Specifically, states are responsible for establishing a “statewide system of intensive and sustained support” centered around a network of school support teams, distinguished educators and other technical assistance. In addition, during the period covered by this study, NCLB required states to set aside 2 percent of their Title I, Part A, funds to support school improvement activities (this required amount increased to 4 percent in 2004-05). States were required to pass 95 percent of the school improvement reserve to districts to support schools, but states were allowed to reserve up to 5 percent to pay for state-level school improvement activities.
74
Statewide Systems of School Support
NCLB requires that all states organize school support teams and cadres of distinguished principals and teachers to serve as the focal point of their system of support for identified Title I schools. As required under NCLB, school support teams must include some or all of the following: principals and teachers from higher-performing Title I schools (known as “distinguished teachers” and “distinguished principals”), pupil services personnel, parents, higher education representatives, state education agency staff, representatives of federal regional assistance centers, and outside consultants. School support teams work with identified Title I schools to review school operations, design a school improvement plan, and monitor the implementation of the plan. They also provide feedback to states and districts on the effectiveness of school personnel. In 2003-04, more states had school support teams and distinguished educators in place than before. Despite this increase in state-supported assistance, however, less than half the districts with identified Title I schools reported that their identified Title I schools had received such state-sponsored assistance.
More states had systems of school support in place in 2003-04 than in 2002-03. Of the
50 states and the District of Columbia, 36 states reported having school support teams in place in 2003-04, compared with 23 the year before (Exhibit 51). Twelve states reported that they did not have school support teams in place (an additional three states did not answer the question because they did not have identified Title I schools in 2003-04 or because the appropriate respondent could not be reached). Of those 12, three reported that they were in the process of organizing teams, and eight reported that they had no plans to organize teams because they were already providing schools with services through other means (for example, through individual state education agency staff). Although NCLB requires that all states organize school support teams to provide assistance to identified schools, some states maintain that they can provide these services more efficiently through other mechanisms.
States took a wide variety of approaches to organizing and deploying school support teams.
In two-thirds of states with school support teams, the state education agency has primary responsibility for recruiting and training team members, assigning support teams to schools, and supervising with work of support teams. Regional or intermediate education agencies in 10 states took primary responsibility for activities such as staffing, training, assigning, and supervising support teams. In seven states, districts played a role either in staffing teams, assigning them to schools, or supervising their work.
School support team members had a variety of professional backgrounds. Most often (in
about half of states), they were district administrators with experience in working with low-performing schools. Fourteen of the 36 states with school support teams assigned distinguished teachers to those teams (i.e., teachers from higher-performing Title I schools), and 11 assigned distinguished principals (also from higher-performing schools). States also used staff from regional education agencies, retired teachers, college and university faculty, current classroom teachers, and state education agency staff to make up school support teams. Most states operated multiple teams, depending on the number of schools to be served, and teams had an average of five members each.
75

Exhibit 51 Elements of a Statewide System of School Support in 2003-04
2319
39
12
36
30
41
23
0
10
20
30
40
50
School supportteams
Distinguishededucators
Other types ofassistance
All threeelements of aschool support
system inplace
Num
ber o
f sta
tes
2002-03 2003-04
Exhibit reads: Twenty-three states had organized school support teams to serve identified Title I schools in 2002-03, compared with 36 states in 2003-04. Note: Based on data from 46 states. Source: TASSIE state survey.
In addition to school support teams, 30 states had identified distinguished educators to
serve identified schools (Exhibit 51). In some states, these distinguished educators served on school support teams, and in other states, they worked independently with identified Title I schools. Forty-one states offered other types of assistance, including technical assistance from state education agency staff, professional development, assistance from regional centers, or additional funding. Nearly half of all states had all three elements of a school support system in place, compared with 12 states the year before (Exhibit 51).
State systems of school support served a larger proportion of identified schools than
they had the year before. The majority of states reported they served all or nearly all of their identified Title I schools through school support teams, distinguished educators, and other types of assistance. Despite these reports from states, only 46 percent of districts with identified Title I schools reported that those schools received any type of assistance from the state (i.e., school support team, distinguished teacher, or other consultants; see Exhibit 52). These districts served 45 percent of all identified Title I schools in 2003-04. About a quarter of districts (24 percent) with identified Title I schools reported that those schools received assistance from a state-sponsored school support team, 7 percent reported that they received assistance from a state-sponsored distinguished teacher, and 27 percent of districts reported that their identified schools received assistance from other consultants sponsored by the state.
76
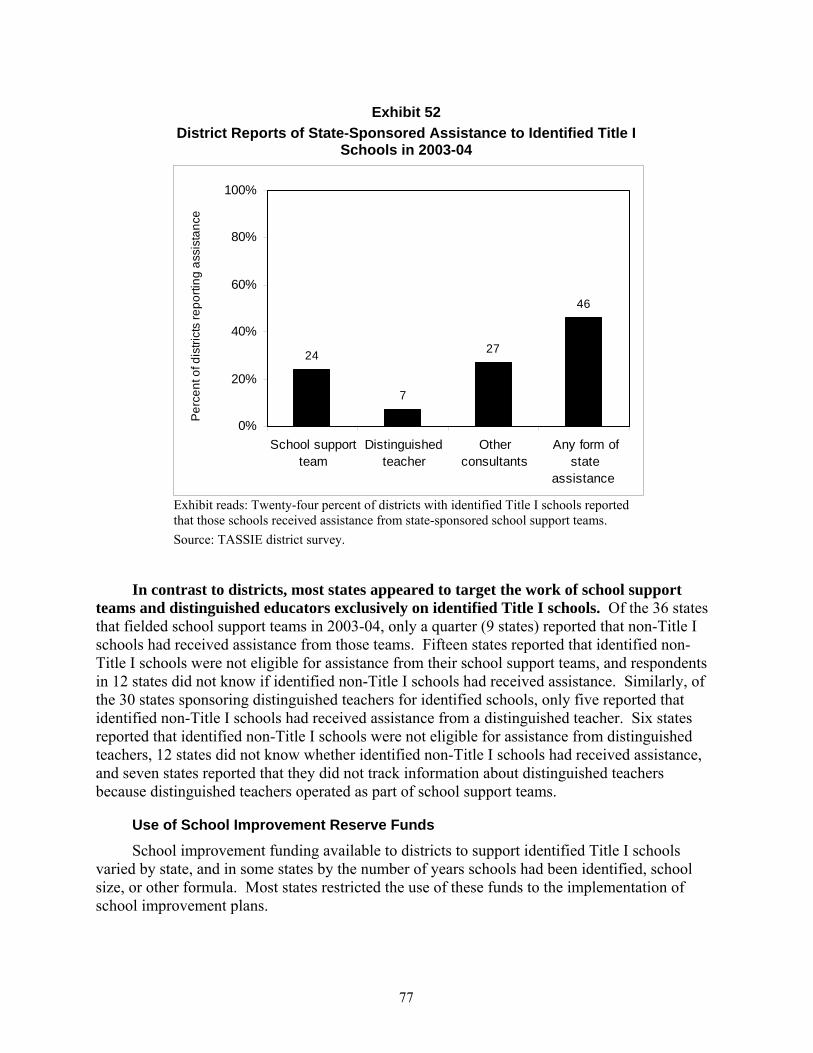
Exhibit 52 District Reports of State-Sponsored Assistance to Identified Title I
Schools in 2003-04
24
7
27
46
0%
20%
40%
60%
80%
100%
School supportteam
Distinguishedteacher
Otherconsultants
Any form ofstate
assistance
Per
cent
of d
istri
cts
repo
rting
ass
ista
nce
Exhibit reads: Twenty-four percent of districts with identified Title I schools reported that those schools received assistance from state-sponsored school support teams. Source: TASSIE district survey.
In contrast to districts, most states appeared to target the work of school support teams and distinguished educators exclusively on identified Title I schools. Of the 36 states that fielded school support teams in 2003-04, only a quarter (9 states) reported that non-Title I schools had received assistance from those teams. Fifteen states reported that identified non-Title I schools were not eligible for assistance from their school support teams, and respondents in 12 states did not know if identified non-Title I schools had received assistance. Similarly, of the 30 states sponsoring distinguished teachers for identified schools, only five reported that identified non-Title I schools had received assistance from a distinguished teacher. Six states reported that identified non-Title I schools were not eligible for assistance from distinguished teachers, 12 states did not know whether identified non-Title I schools had received assistance, and seven states reported that they did not track information about distinguished teachers because distinguished teachers operated as part of school support teams.
Use of School Improvement Reserve Funds
School improvement funding available to districts to support identified Title I schools varied by state, and in some states by the number of years schools had been identified, school size, or other formula. Most states restricted the use of these funds to the implementation of school improvement plans.
77

In 2003-04, school improvement reserve funds totaled $228 million across the 50 states (McClure 2005). Of those states reporting on their methods for allocating school improvement funds to districts with identified schools,23 10 reported that each district received the same allocation for each identified school, seven reported that districts with schools in later years of identification received more funding, four reported that districts with larger schools received greater allocations, and six reported that they used other formulas for allocating funds.
In 2003-04, 23 states imposed restrictions on the use of school improvement funds.24 Of
those states, 18 required that districts use them to support school activities described in the school improvement plan, six required that they be used to fund teacher professional development activities at the school, and three states required that school improvement funds be used to hire an external evaluator or to fund professional development activities at the school.
In 2003-04, seven of 36 states reported that they passed all of the school improvement
funds set aside by states directly through to districts to support school improvement activities. 25 Twenty-four of 36 states reported that they reserved the full 5 percent allowed under the law to support the state’s own school improvement activities. The remaining five states reserved between 1 and 2.5 percent to support the state’s own school improvement activities.
Factors Associated With Changes in Improvement Status On the surface, the finding that large districts were more likely to provide assistance to
identified schools than small districts (Exhibit 48) appears to conflict with the finding that schools in small districts were more likely to exit improvement status than schools in large districts in 2003-04 (Exhibit 4). The explanation appears to be that there is a strong relationship between school contextual factors and school improvement status, irrespective of district assistance or school improvement activities. Put another way, district size and school poverty were better predictors of whether a school would exit improvement status than any of the school improvement activities measured for this study. The one school improvement activity that contributed to schools exiting improvement status was the alignment of curriculum and standards supported by professional development in this area.
To better understand the relationship between school improvement strategies, demographic
context, and exiting improvement status, an analysis was conducted using data from 2002-03 to explain school improvement status in 2003-04. Focusing on elementary schools that were identified for improvement in 2002-03, school improvement strategies and demographics (school poverty, school size, district size, district urbanicity) were used to develop models for predicting
23 In 21 states, the respondent did not know or the appropriate respondent could not be reached. 24 In 13 states, the respondent did not know or the appropriate respondent could not be reached. Nine states reported
that the state had no role in directing the use of school improvement funds by schools, or in imposing restrictions on the use of those funds. Six states reported that they did not impose restrictions on the use of funds.
25 In 15 states, the respondent did not know or the appropriate respondent could not be reached.
78
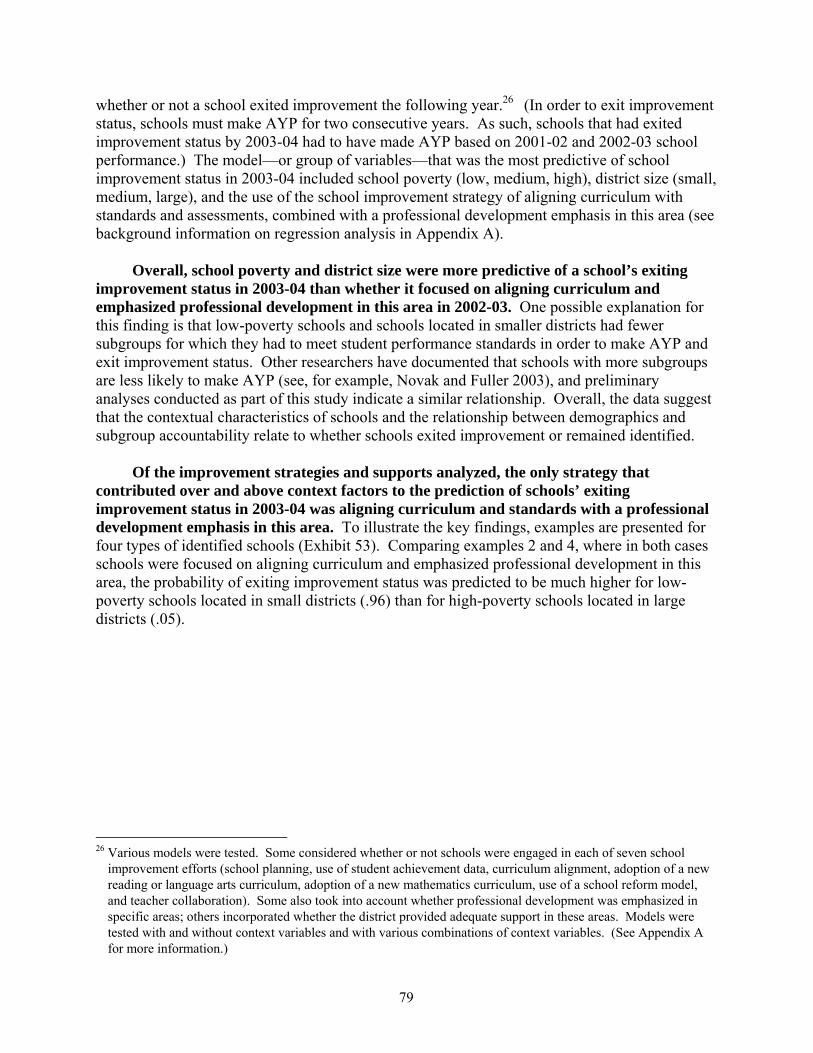
whether or not a school exited improvement the following year.26 (In order to exit improvement status, schools must make AYP for two consecutive years. As such, schools that had exited improvement status by 2003-04 had to have made AYP based on 2001-02 and 2002-03 school performance.) The model—or group of variables—that was the most predictive of school improvement status in 2003-04 included school poverty (low, medium, high), district size (small, medium, large), and the use of the school improvement strategy of aligning curriculum with standards and assessments, combined with a professional development emphasis in this area (see background information on regression analysis in Appendix A).
Overall, school poverty and district size were more predictive of a school’s exiting
improvement status in 2003-04 than whether it focused on aligning curriculum and emphasized professional development in this area in 2002-03. One possible explanation for this finding is that low-poverty schools and schools located in smaller districts had fewer subgroups for which they had to meet student performance standards in order to make AYP and exit improvement status. Other researchers have documented that schools with more subgroups are less likely to make AYP (see, for example, Novak and Fuller 2003), and preliminary analyses conducted as part of this study indicate a similar relationship. Overall, the data suggest that the contextual characteristics of schools and the relationship between demographics and subgroup accountability relate to whether schools exited improvement or remained identified.
Of the improvement strategies and supports analyzed, the only strategy that
contributed over and above context factors to the prediction of schools’ exiting improvement status in 2003-04 was aligning curriculum and standards with a professional development emphasis in this area. To illustrate the key findings, examples are presented for four types of identified schools (Exhibit 53). Comparing examples 2 and 4, where in both cases schools were focused on aligning curriculum and emphasized professional development in this area, the probability of exiting improvement status was predicted to be much higher for low-poverty schools located in small districts (.96) than for high-poverty schools located in large districts (.05).
26 Various models were tested. Some considered whether or not schools were engaged in each of seven school
improvement efforts (school planning, use of student achievement data, curriculum alignment, adoption of a new reading or language arts curriculum, adoption of a new mathematics curriculum, use of a school reform model, and teacher collaboration). Some also took into account whether professional development was emphasized in specific areas; others incorporated whether the district provided adequate support in these areas. Models were tested with and without context variables and with various combinations of context variables. (See Appendix A for more information.)
79
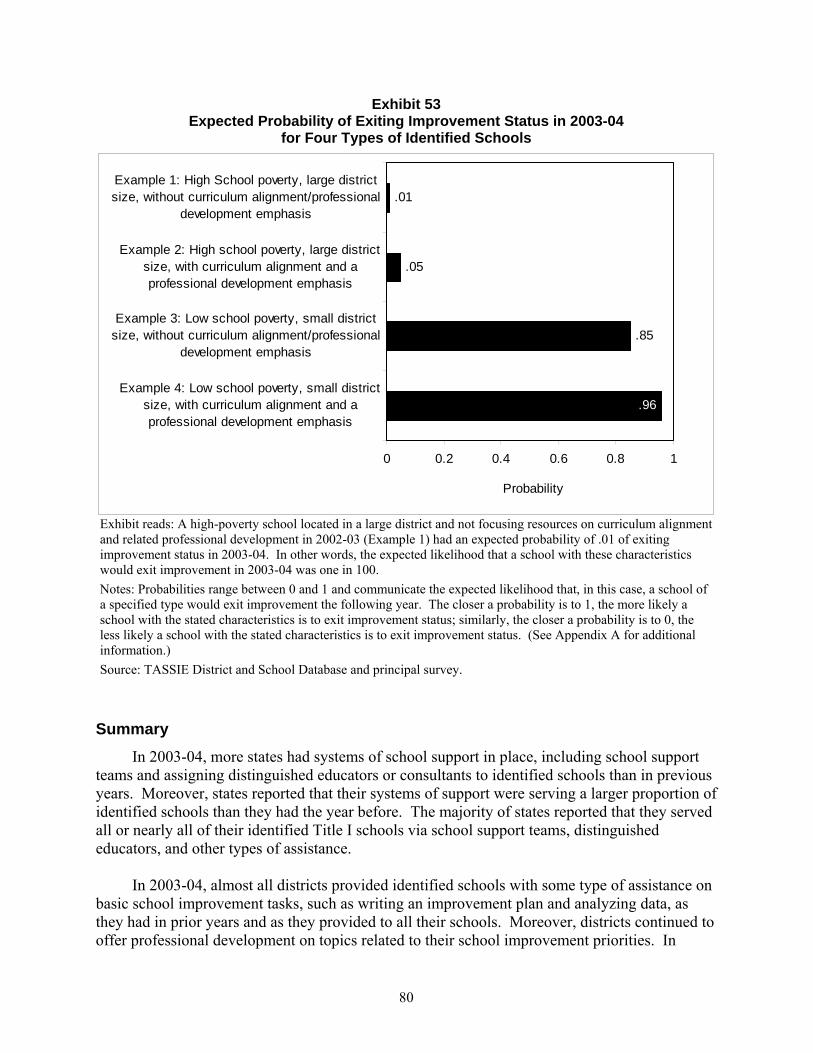
Exhibit 53 Expected Probability of Exiting Improvement Status in 2003-04
for Four Types of Identified Schools
.96
.85
.05
.01
0 0.2 0.4 0.6 0.8 1
Example 4: Low school poverty, small districtsize, with curriculum alignment and aprofessional development emphasis
Example 3: Low school poverty, small districtsize, without curriculum alignment/professional
development emphasis
Example 2: High school poverty, large districtsize, with curriculum alignment and aprofessional development emphasis
Example 1: High School poverty, large districtsize, without curriculum alignment/professional
development emphasis
Probability
Exhibit reads: A high-poverty school located in a large district and not focusing resources on curriculum alignment and related professional development in 2002-03 (Example 1) had an expected probability of .01 of exiting improvement status in 2003-04. In other words, the expected likelihood that a school with these characteristics would exit improvement in 2003-04 was one in 100. Notes: Probabilities range between 0 and 1 and communicate the expected likelihood that, in this case, a school of a specified type would exit improvement the following year. The closer a probability is to 1, the more likely a school with the stated characteristics is to exit improvement status; similarly, the closer a probability is to 0, the less likely a school with the stated characteristics is to exit improvement status. (See Appendix A for additional information.) Source: TASSIE District and School Database and principal survey.
Summary In 2003-04, more states had systems of school support in place, including school support
teams and assigning distinguished educators or consultants to identified schools than in previous years. Moreover, states reported that their systems of support were serving a larger proportion of identified schools than they had the year before. The majority of states reported that they served all or nearly all of their identified Title I schools via school support teams, distinguished educators, and other types of assistance.
In 2003-04, almost all districts provided identified schools with some type of assistance on
basic school improvement tasks, such as writing an improvement plan and analyzing data, as they had in prior years and as they provided to all their schools. Moreover, districts continued to offer professional development on topics related to their school improvement priorities. In
80

general, district activity in these areas had not changed since 2001-02, the year before NCLB went into effect.
To improve their students’ performance, many identified schools increased attention to
achievement results, adopted new curricula, used school reform models, or added new supplemental instructional programs. Continuously identified schools were more likely to engage in certain improvement strategies and types of professional development than schools no longer identified.
At the same time, many continuously identified schools—those identified for improvement
in 2001-02 that remained identified for improvement in 2003-04—still reported no access to state- or district-sponsored school support teams, or school-based staff developers, either because they were in districts and states that did not provide that assistance or because states or districts could not serve all of their identified schools. Principals of both continuously identified and no longer identified schools reported receiving very little support and assistance for themselves.
Schools identified for improvement in 2001-02 were more likely to have exited
improvement by 2003-04 if they were located in smaller districts (a corollary to the finding that in recent years Title I schools have been increasingly concentrated in large urban districts). School poverty and district size were strong predictors of whether a school would exit or remain identified for improvement. Once these demographic features were accounted for, the presence or absence of various school improvement activities in a school had little effect on the probability that a school would exit improvement. Of the seven improvement strategies and supports analyzed, only curriculum alignment—combined with an emphasis on professional development in this area—contributed to predicting whether a school would exit improvement, over and above demographic factors.
81


V. Corrective Actions and Restructuring
Planning and support are intermediate steps under NCLB that districts take with identified
schools, along with offering parents the options of public school choice and supplemental services for their children. If schools do not make AYP for four years or more and so are in their third year or more of being identified for improvement, districts are required to impose more severe interventions. The combination of support to identified schools and consequences for continued poor performance are key elements of NCLB accountability requirements intended to drive school improvement by creating incentives for educators to improve their practice.
With schools in their third year of Title I improvement status, NCLB requires that districts
take at least one of the following six corrective actions (consistent with state law): (1) implement a new research-based curriculum, (2) significantly decrease the management authority at the school level, (3) appoint an outside expert to advise the school, (4) extend the school day or year, (5) restructure the internal organization of the school, or (6) replace the school staff relevant to the failure to make AYP. With schools in their fifth or later year of improvement status, districts are expected to take one of the following restructuring efforts, as part of a restructuring plan for improving the school: (1) replace all or most of the school staff, (2) reopen the school as a public charter school, (3) contract with a private management company to operate the school, (4) turn operation of the school over to the state, or (5) implement any other major restructuring of the school’s governance arrangement that makes fundamental reforms. Some states also take responsibility for all or part of the imposition of corrective actions and restructuring efforts.
In 2003-04, only a few districts reported that they had schools for which they were
required to take corrective actions—approximately 700 districts or 6 percent of districts nationwide. This compares to approximately 400 districts or 4 percent of Title I districts nationwide reported in 2002-03. Similar to 2002-03, principals in Title I schools identified for three or more years reported that the most common corrective actions taken by states and districts with them was to require the implementation of a new research-based curriculum (79 percent of schools identified for three years, 76 percent of schools identified for four or more years). About 200 or the 700 districts reported having schools in their fourth year of improvement status and thus eligible for restructuring; and only a minority of districts actually imposed restructuring efforts.
These findings are presented in greater detail in this chapter. The first section describes the
actions districts were taking, followed by a section characterizing state-level interventions. The final section describes district and state-level actions from the school perspective.
District Actions Forty-three percent of districts with identified schools in 2003-04, around 700
districts, reported that they had schools in corrective action, accounting for an estimated 2,000 schools. More than two-thirds of these districts (69 percent) had only one school in
83
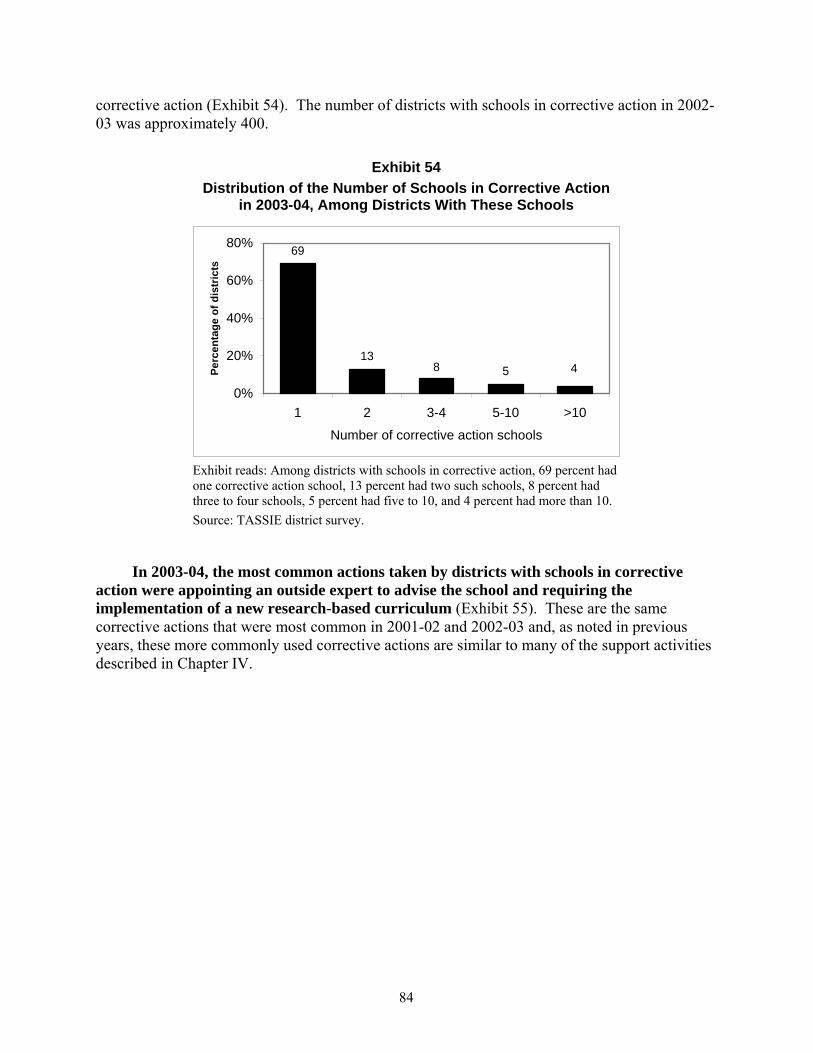
corrective action (Exhibit 54). The number of districts with schools in corrective action in 2002-03 was approximately 400.
Exhibit 54 Distribution of the Number of Schools in Corrective Action
in 2003-04, Among Districts With These Schools
8 4
69
135
0%
20%
40%
60%
80%
1 2 3-4 5-10 >10
Number of corrective action schools
Perc
enta
ge o
f dis
tric
ts
Exhibit reads: Among districts with schools in corrective action, 69 percent had one corrective action school, 13 percent had two such schools, 8 percent had three to four schools, 5 percent had five to 10, and 4 percent had more than 10. Source: TASSIE district survey.
In 2003-04, the most common actions taken by districts with schools in corrective action were appointing an outside expert to advise the school and requiring the implementation of a new research-based curriculum (Exhibit 55). These are the same corrective actions that were most common in 2001-02 and 2002-03 and, as noted in previous years, these more commonly used corrective actions are similar to many of the support activities described in Chapter IV.
84

Exhibit 55 Corrective Actions Taken in 2003-04,
Among Districts With Schools in Corrective Action
58
55
34
28
13
12
12
0 20 40 60 80 100
Replacing school staff relevant to failureto make AYP
Significantly decreasing managementauthority at the school
Reassigning or demoting the principal*
Restructuring internal organizationof the school
Extending school day or year
Requiring the implementation of newresearch-based curriculum
Appointing outside expert to advisethe school
Percentage of districts
%
Exhibit reads: Among districts with schools in corrective action, 58 percent appointed an outside expert to advise the schools. (See Appendix B for the complete list of actions taken with schools in corrective action and restructuring.) * Not a corrective action specified in NCLB. Source: TASSIE district survey.
Case study data also support the recurring finding that the most common district-level corrective actions taken with schools are viewed as supportive by school staff. For example, in a large urban case study district, the corrective action of implementing a new research-based curriculum was implemented in all schools regardless of their status. In another large urban case study district, implementing a new curriculum was also the focus (in terms of resource investment). Other corrective actions were put on hold until late spring, when the district received state improvement funds, which the district planned to spend on placing turnaround specialists in schools in corrective action. Another very large suburban case study district did not have schools in corrective action status in 2003-04 but began preparing for schools to reach this phase of accountability by taking several interventions (including instituting new reading and math curricula and a summer program for students, decreasing management authority of principals by dictating how the majority of Title I funds should be spent, and hiring a consultant to help schools use data to improve student performance). Because the state was requiring that the actions be taken in the year schools enter into corrective action, the district may have had to prescribe additional actions if schools in the district formally entered corrective action status the following year. Other case study districts took more substantial actions with schools in corrective action, such as changing principal leadership, reassigning staff, and reorganizing schools.
85

Few districts with schools in restructuring status in 2003-04 had undertaken the specific restructuring efforts outlined in NCLB but many continued to take NCLB corrective actions. Among the small group of districts (about 200) with schools that had been identified for improvement for four or five years, 9 percent had developed plans to carry out alternative governance arrangements for a school (the first step in the restructuring process), and 4 percent had replaced all or most of a school’s staff (Exhibit 56). Only 1 percent of these districts reported that the remaining three restructuring strategies specified in NCLB were employed.27 More districts reported taking corrective actions with schools in restructuring.
Exhibit 56
Restructuring Efforts Taken in 2003-04, Among Districts With Schools In Restructuring
9
4
1
1
1
0 2 4 6 8 10
State takeover
Contract with private managementcompany to operate the school
Developing plans for alternativegovernance arrangements for the school
Percentage of districts
%
Exhibit reads: Among districts with schools in restructuring, 9 percent required schools to begin development of plans for alternative governance arrangements. (See Appendix B for the complete list of actions taken with schools in corrective action and restructuring.) Source: TASSIE district survey.
Districts with schools in their third year (or more) of Title I improvement status were,
however, more likely to focus resources on the monitoring and oversight of schools compared with districts with schools that had less tenure in the accountability system. Fifty-two percent of districts with schools that had been identified for improvement for at least three years reported placing a “major” focus on increasing their monitoring and oversight of schools, compared with 26 percent of districts with Title I schools identified for improvement in their first or second year only and 24 percent of districts with schools that missed AYP but had no schools identified for improvement.
27 NCLB also specifies that districts may count as restructuring any other major restructuring of a school’s
governance arrangement that makes fundamental reforms.
86
State Actions School districts have primary responsibility for taking corrective actions, but if the state
determines that the district has not carried out its responsibilities, then the state takes the corrective actions deemed in compliance with state law. State law may also allow the state to take corrective actions with schools or undertake school restructuring irrespective of district actions (this occurred in several case study states). In addition, states may take corrective actions with any district that has been identified for improvement but must do so with any district that fails to make AYP for two years after being identified for improvement. The corrective actions specified for districts under NCLB are similar to those for identified schools (Section 1116(c)(10)(B)).
Of the states that had schools in corrective action in 2003-04 (29 of the 45 states for
which information was available),28 18 took at least one corrective action with schools in this phase of Title I improvement. Thirteen of these 18 states took two or more corrective actions, the most common ones being implementing a new research-based curriculum and appointing an outside expert to advise the school on its progress toward making AYP (Exhibit 57). Other actions taken included a prescriptive or negotiated school improvement plan, a district support team developed to work with the school, and an outside expert brought in to report on the state of the school.
Exhibit 57 Corrective Actions Taken by States With Title I Schools in Corrective Action in 2003-04
Corrective action Number of
states State does not take corrective actions with schools 11
Implemented a new research-based curriculum 12
Appointed an outside expert to advise the school on its progress toward making AYP in accordance with its school plan 12
Replaced school staff responsible for the continued failure to make AYP 7
Reorganized the school internally 7
Significantly decreased management authority at the school level 5
Extended the school day or year 5
Other interventions 7 Exhibit reads: In 2003-04, 12 states (out of the 18 that had taken one or more corrective actions with Title I schools) reported that they implemented a new research-based curriculum in these schools. Source: TASSIE state survey.
28 Sixteen of the 45 states reported that they had no Title I schools in corrective action; three state respondents
indicated that they did not know if the state had taken any actions, and three states provided no information.
87

Very few states indicated that they had any Title I schools identified for restructuring. Twelve states of the 47 states for which data were available reported having schools that required these efforts.29 Eight of these 12 states reported that they did not undertake restructuring activities with schools, while four reported that they did (Exhibit 58).30
Exhibit 58 Restructuring Efforts Taken by States With Title I Schools in Restructuring in 2003-04
Restructuring action Number of
states State does not take restructuring actions with schools 8
Replaced all/most of the staff, including the principal 2
Turned operation of a school over to the state education agency 1
Reopened a school as a public charter 1 Exhibit reads: In 2003-04, eight states with schools in restructuring reported not taking any restructuring actions with schools. Two states reported that they replaced all or most of the staff, including the principal. (In 2003-04, 12 states out of 47 reported that they had schools identified for restructuring; of these, four reported having undertaken restructuring efforts with Title I schools.) Source: TASSIE state survey.
Among the eight states (of the 47 from which data were available) that reported having districts identified for improvement, five took at least one corrective action with these districts. Case study data reflect this variation across states in the corrective actions and restructuring efforts taken with schools and districts (Exhibit 59).
29 Thirty-five of the 47 states reported that they had no Title I schools identified for restructuring; one state
respondent indicated that they did not know if the state had taken any restructuring actions, and three states provided no information.
30 Of the 47 states from which information was available in 2003-04, 13 took the same corrective actions with Title I and non-Title I schools, four took some of the same actions, and nine took a completely different set of actions.
88

Exhibit 59 Examples of Variation in State Interventions With Identified Schools and Districts
• LouAYthe200pla
• AriUnanyvisMeincassclaneeimp
• In WAsScTh
• In Mit isfun200leabe spe
Schools’Cont
identified Comparisowere beinglikely to beschool day(Exhibit 60principals’situation maccountabi
The m
that they ereported onreported thcorrective
isiana appoints an outside expert (distinguished educator) to advise schools that miss P for four or more years, and it applies the same set of corrective actions to all schools in state. In schools in the one Louisiana district that was identified for improvement in 3-04, the state conducts classroom observations and professional development on lesson
nning, along with ongoing support from regional staff. zona operates under a layered system of accountability, and not all schools labeled as derperforming under the state system are labeled as identified schools under Title I. For school in Arizona designated as Underperforming for three consecutive years, the state
its and reviews its plan for improvement; these schools may also be classified as Failing to et Academic Standards, in which case they are assigned a solutions team of three people, luding some combination of master teachers, fiscal analysts, and curriculum and essment experts. The team is trained to visit the school site and conduct interviews,
ssroom observations, and focus groups with the objective of identifying school-specific ds; findings are presented to school staff, accompanied by support to facilitate school rovement. ashington, some Title I schools in corrective action participate in the state’s Focused
sistance program, through which they receive a needs assessment and are provided a hool Improvement Facilitator to work with them for 78 days per school year for three years. e facilitator supports the development and implementation of an improvement plan.
ichigan, one of the first states to have schools enter the restructuring phase of NCLB, the responsibility of districts to provide support to identified schools; the state provides ding. The most common type of restructuring to occur has been staff replacement (CEP 4c). For schools in restructuring, the state places state-trained coaches in schools for at
st 100 days to oversee the restructuring process. The state also requires that restructuring an individualized process—that is, that each school’s plan be designed to target its cific weaknesses (CEP 2004).
Reports of District and State Actions inuously identified schools were more likely than schools that were no longer in 2003-04 to report that the state or district took corrective actions with them. ns between these two types of schools were made to assess the extent to which actions taken as a result of identification status. Continuously identified schools were more required to implement a new curriculum, to receive an outside expert, to extend the or year, to restructure the internal organization of the school, or to replace staff ). There were no significant differences between the two groups of schools in reports of restructuring activities taken with them by the state or district (though this ay change when more schools reach the restructuring phase of the NCLB lity system).
ajority (86 percent) of schools that reported they were in corrective action indicated xperienced at least one of the six corrective actions specified in NCLB (27 percent e corrective action, 37 percent reported two corrective actions, and 22 percent ree or more corrective actions had been taken). The most frequently reported actions taken with these schools were similar to those reported by continuously
89

identified schools not in corrective action: the requirement to implement a new research-based curriculum (75 percent) and the appointment of an outside expert to advise the school (25 percent).
Exhibit 60
Principals’ Reports of Corrective Actions Taken by the State or District, by School Identification Status in 2003-04
2
3
11
5
21
7
12
27
31
62
0 10 20 30 40 50 60 70
Replacing school staff relevant to failure tomake AYP
Restructuring internal organization of theschool
Extending school day or year
Appointing outside expert to advise theschool
Requiring the implementation of newresearch-based curriculum
Percentage of Title I schools
Schools identified in 2003-04 and 2001-02Schools not identified in 2003-04, were identified in 2001-02
%
Exhibit reads: Among Title I schools that were identified for improvement in 2003-04 and in 2001-02, 62 percent of principals responded that the state or district required the implementation of a new research-based curriculum; 21 percent of principals in Title I schools no longer identified did so. Notes: Differences significant at p < .05. (See Appendix B for the complete list of actions taken.) Source: TASSIE principal survey. Among the small group of schools that reported having been identified for
improvement for four or more years (i.e., likely candidates for restructuring), very few had experienced any interventions associated with restructuring.31 The most common restructuring effort reported by principals was replacement of all or most of the school staff by the state or district (12 percent). Two others interventions, planning for alternative governance
31 Schools reported on how many years they had been identified for improvement, rather than on their improvement
status. Schools that continue to miss AYP for three years after identification enter restructuring status; schools that remain identified but make AYP, may not enter restructuring status. As a result, schools in this study that were identified for four or more years were likely, but not necessarily, in restructuring status.
90

arrangements and reopening the school as a charter school, were cited by 8 percent of principals of schools identified for improvement for four or more years. Only one percent of this small group of principals indicated that their state or district had entered into a contract with a private management company to operate the school, and less than one percent of these principals reported that operation of their school had been turned over to the state.
Since 2001-02, there have been significant increases in the percentage of principals of identified schools who indicated that the state or district had taken specific corrective actions (Exhibit 60). These corrective actions included: requiring the implementation of a new research-based curriculum (62 percent in 2003-04 vs. to 21 percent in 2001-02), appointing an outside expert to advise the school (31 percent vs. 1 percent), and extending the school day or year (27 percent vs. 11 percent). These changes likely reflect the fact that this group of Title I schools had been identified for improvement since at least 2001-02 and thus may have been in corrective action by 2003-04. There have been no significant changes over the past three years in state- or district-led restructuring activities reported by principals of identified schools, perhaps reflecting the fact that relatively few schools were identified for restructuring.
Summary In 2003-04, only 6 percent of districts (about 700) had Title I schools in corrective action.
The majority of districts with identified schools (57 percent) did not serve any schools in corrective action. Of those that did, most were dealing with only one school in corrective action status. The most common actions taken by districts and states with schools in corrective action were: appointing an outside expert to advise the school and requiring the implementation of a new research-based curriculum—interventions which were seen as supportive by school principals in our case study sites.
Few districts and states indicated that they had any Title I schools identified for
restructuring. The most common restructuring intervention among districts (only 9 percent) was to make a plan for alternative governing arrangements at the school. For states, the most common action taken with schools was not to intervene with restructuring interventions. Among the small group of schools identified for four or more years (and so eligible for restructuring), very few had experienced any interventions associated with restructuring.
91


VI. Conclusions
The Evaluation of Title I Accountability Systems and School Improvement Efforts tracked
changes from 2001-02, the year during which No Child Left Behind became law, through its second full year of implementation in 2003-04. From 2001 to 2004 states and districts took steps to align their accountability systems with new federal requirements and to improve student achievement in Title I schools that did not meet required standards for performance. During this period, states and districts made progress in some areas and faced challenges from new requirements in others. Five themes capture the trends observed over the duration of the study. Each has implications for the future of NCLB and is elaborated on below. • Title I schools identified for improvement in small districts were more likely to exit
improvement status than those in large districts; thus, identified schools became more concentrated in large districts. If this trend continues, it will increase the demands on large urban districts to provide support and assistance.
The trend toward increasing concentration of identified schools in large districts is
consistent with the finding that schools with diverse student bodies were more likely to miss AYP (Novak and Fuller 2003). It is also consistent with the research that indicates many of the schools troubled with chronic low achievement and students with the greatest needs are found in large urban districts (see, for example, David and Shields 2001). Given the finding that some identified schools were receiving little or no assistance in 2003-04, large districts could find themselves stretched even further beyond their capacity to provide support and assistance to their schools.
• More students were eligible for choice and supplemental services in 2003-04 than in 2002-
03; however, the proportion of parents exercising Title I choice remained at 1 percent, compared with 19 percent participating in supplemental services in 2003-04, an increase over the 7 percent participating the previous year. Parents appear to have a preference for tutoring over changing schools.
The expansion of Title I choice faces two major challenges. First is the challenge of
having enough transfer options for those families wishing to transfer their children. Even with only 1 percent of eligible students exercising choice, districts were not always able to provide satisfactory options. If the trend of increasing concentration of identified schools in large districts continues, these districts will have an increasingly difficult time providing transfer options, especially at the middle and high school levels. Small rural districts were already having trouble finding options. The other challenge is the hesitancy of parents to move their children to a school outside the neighborhood. Some of the apparent reluctance may also be due to lack of information and understanding about the options they have and districts’ late or unclear notices. Several data sources also point to the preferences of parents to have their children nearby and the appeal of tutoring in their home school. Wider acceptance of choice will require more emphasis on creating viable alternatives for parents.
93
Supplemental services, especially when they were provided at the neighborhood school, were more attractive to parents. However, districts face three challenges if supplemental services are to reach more eligible students, beyond the 19 percent currently participating. First, small and rural districts need access to providers. Case study data indicate online providers were not a solution for many students because the students did not have access to the necessary technology. Second, states and districts need help in figuring out how to monitor and assess the effectiveness of providers. States indicated that having sample data collection instruments and criteria for judging effectiveness would benefit states in their oversight role. Third, districts need help in streamlining procedures for managing the provision of services and in communicating effectively with parents. If the number of parents requesting supplemental services increases substantially, large urban districts with thousands of eligible students will need help to be able to manage an effective system of providers.
• More states, but not all, were helping identified schools, and most districts were providing a
range of assistance in 2003-04 similar to what they provided in 2001-02 and 2002-03; however, many identified schools did not receive assistance specified in NCLB.
In spite of state and district efforts to help schools, many schools were not receiving the
kind of intensive assistance they needed to make progress. Fifty-seven percent of districts did not assign at least a half-time person to provide school-based professional development or instructional support. Forty-three percent of districts did not provide school support teams, principal mentors, distinguished teachers, or other consultants. Eleven percent of identified schools were in districts that provided no assistance with planning and data use as specified in NCLB.
The finding that districts made few changes in their provision of assistance and tended to
provide the same support to all schools suggests that districts were more able to carry out the kinds of things they have always done: assistance with planning and traditional professional development. To the extent that helping most or all schools serves as a strategy to keep schools from becoming identified, districts might be encouraged to continue this approach. Districts are less able to help schools with the core work of instructional improvement to raise student achievement through the efforts of school support teams, coaches, or other forms of intensive support. They will need help figuring out how to work more strategically and intensively with schools that continue to miss AYP. Similarly, state capacity to deliver assistance needs to be bolstered. Large districts are often delegated state tasks and need to carry out those as well as their direct responsibilities under NCLB.
• School improvement strategies remained similar across the three years, although schools
that were still identified in 2003-04 engaged in more improvement activities than schools no longer identified. The lack of change suggests that schools, like districts, were implementing the activities with which they are familiar: planning and assessment.
94
Compared to their counterparts who had exited improvement status as of the end of the 2002-03 school year, the finding that higher proportions of continuously identified schools were engaged in most of the improvement and support activities measured raises several issues. That they were conducting greater numbers of improvement activities and yet remained identified suggests three explanations. First, because continuously identified schools tend to be urban and poor, it is likely that they will still be identified in spite of all their activities because they are working with some of the most educationally disadvantaged populations: poor minority urban youths, many of whom are just learning English. The second possible explanation is the related finding that schools with more diverse populations are more likely to miss AYP (a finding supported by other research). The third, supported strongly by the case studies, is that schools are grabbing at solutions—programs and strategies they think will increase scores quickly. As a result, they are doing many activities but not taking the kinds of coherent and sustained approaches that have the potential for a long-term payoff. Leadership by principals could play a role here; very few reported receiving support or assistance for themselves.
• School poverty and district size better predicted exiting improvement status than the
improvement strategies undertaken by the schools. The finding that school poverty and district size better predicted exiting improvement
status than the improvement strategies undertaken by the schools is consistent with the historical relationship between family poverty and test scores (see Coleman et al. 1966; Jencks 1972; Jencks and Phillips 1998). Given the relative contribution of improvement activities to schools exiting improvement, it appears likely that the schools that continue to be identified will need much more intensive assistance and more time to implement improvement strategies than they have had thus far.
95


References
Casserly, M. (January 2004). “No Child Left Behind: A status report on choice and supplemental services in America’s great city schools.” Paper presented at Leaving No Child Behind? Options for Kids in Failing Schools, a meeting held in Washington, D.C., sponsored by the Thomas B. Fordham Foundation.
Center on Education Policy (CEP). (September 2004). My school didn’t make adequate yearly progress: So what does that mean? Test Talk Issue 3. Washington, D.C.: Author.
Center on Education Policy (CEP). (March 2005). From the capital to the classroom: Year 3 of the No Child Left Behind Act. Washington, D.C.: Author.
Coleman, J. S., Campbell, E. Q., Hobson, C. J., McPartland, J., Mood, A. M., Weinfield, F. D., and York, R. L. (1966). Equality of educational opportunity. Washington, D.C.: U.S. Department of Education.
David, J. L. and Shields, P. M. (August 2001). When theory hits reality: Standards-based reform in urban districts. Menlo Park, Calif.: SRI International. Report prepared for The Pew Charitable Trusts.
Education Commission of the States (ECS). (July 2004). ECS report to the nation: State implementation of the No Child Left Behind Act. Denver, Colo.: Author.
Education Week. (Dec. 8, 2004). AYP status. Education Week, 24(15).
Forte Fast, E. and Erpenhach, W. J. (2004). Revisiting statewide educational accountability under NCLB. Washington, D.C.: Council of Chief State School Officers.
Jencks, C. (1972). Inequality: A reassessment of the effect of family and schooling in America. New York, N.Y.: Basic Books.
Jencks, C. and Phillips, M. (eds.) (1998). The black-white test score gap. Washington, D.C.: Brookings Institution.
McClure, P. (March 2005). School improvement under No Child Left Behind. Washington, D.C.: Center for American Progress.
National Center for Education Statistics (NCES). (2003). Trends in the use of school choice 1993 to 1999: Statistical analysis report. Washington, D.C.: U.S. Department of Education.
Novak, J. R. and Fuller, B. (December 2003). Penalizing diverse schools? Policy Brief 03-4. Berkeley, Calif.: PACE Publications.
Olson, L. (Dec. 8, 2004). Taking root. Education Week, 24(15).
Policy and Program Studies Service (PPSS). (October 2003). Demographic characteristics of Title I schools in need of improvement. Unpublished data from the U.S. Department of Education.
Policy and Program Studies Service (PPSS). (2004). Summary of supplemental services providers lists on state Web sites April 5-7. Unpublished data from the U.S. Department of Education.
R-1
Rose, L. C. and Gallup, A. M. (September 2004). The 36th annual Phi Delta Kappa/Gallup poll of the public’s attitudes toward the public schools. Phi Delta Kappan, 41-56.
U.S. Department of Education. (August 2003a). Supplemental educational services: Non-regulatory guidance. Washington, D.C.: Author.
U.S. Department of Education. (2003b). Report cards, Title I, Part A: Non-regulatory guidance. Washington, D.C.: Author.
U.S. Department of Education. (2004a). Creating strong district school choice programs. Washington, D.C.: Office of Innovation and Improvement.
U.S. Department of Education. (2004b). Public school choice: Non-regulatory guidance. Washington, D.C.: Author.
U.S. Department of Education. (2005a). Case studies of supplemental educational services under the No Child Left Behind Act: Findings from 2003-04. Washington, D.C.: Policy and Program Studies Service.
U.S. Department of Education. (2005b). Evaluation of Title I accountability systems and school improvement efforts: 2002-03 findings. Washington, D.C.: Policy and Program Studies Service.
U.S. General Accountability Office. (Dec. 10, 2004). No Child Left Behind Act: Education needs to provide additional technical assistance and conduct implementation studies for school choice provision. (GAO-05-7). Washington, D.C.: Author.
R-2

Appendix A
Method Notes
A-1

Data Collection Methods The evaluation consists of five related, longitudinal components: • A survey of Title I administrators in a nationally representative sample of
approximately 1,300 districts that receive Title I funds. The universe of eligible districts was developed using information from the 1999 Common Core of Data (CCD) and the 2000 Quality Education Data (QED) database. Districts were stratified according to size (enrollment), degree of poverty (based on the percentage of children living in poverty within each district), and geographic region32 The stratification by geographic region was done to facilitate selection of an over sample from three states that were the focus of the analysis of school performance. Districts were selected using a simple random sample without replacement within each stratum. All very large districts were sampled; approximately equal numbers of districts were selected from the other size strata. Each poverty stratum includes approximately one-third of all children in the sampling frame. The key respondent is the district Title I director. Survey topics for the 2003-04 district survey included state and local accountability systems, school and district identification, district support for school improvement, public reporting, public school choice, supplemental services, and interventions taken with identified schools. The 2003-04 response rate was 91 percent of the eligible districts in the sample (N=1,179); in 2003-04, six districts were found to be no longer receiving Title I funds. The 2002-03 response rate was 89 percent of eligible districts (N=1,161); the 2001-02 response rate was 88 percent of eligible districts (N=1,298).
• A survey of principals in a national sample of 739 Title I schools identified as in need of improvement in 2001-02. The sampling frame for schools in need of improvement in 2001-02 was developed in a two-stage process. First, lists of the schools in each of the sampled districts were developed from the 1999 CCD and the 2000 QED databases. Schools eligible for the sample were classified as regular, but not charter, in the CCD and served a grade range that could be classified as elementary, middle, or high school. In the second stage, sampled districts were asked in fall 2001 to provide a list of Title I schools in need of improvement for 2001-02. In states where Title I schools in need of improvement were identified by the state education agency (SEA), the list of schools identified for 2001-02 (on the basis of 2000-01 assessment data) was requested. Only Title I schools identified for improvement for student achievement in reading, mathematics, or both subjects were included in the original sampling frame. The sampling frame of the resulting 4,054 Title I schools in need of improvement was stratified by district size, school level (elementary, middle, or high), poverty level, and geography. The sample was a nationally representative sample of Title I schools identified for improvement in 2001-02; over the three-year course of the study, portions of those schools remained identified, exited improvement status or stopped receiving Title I funds. Topics for the 2003-04 principal survey included accountability systems, public school choice supplemental educational services, school improvement activities, and interventions taken with the school.
32 See Appendix B for definitions of size and poverty strata.
A-3
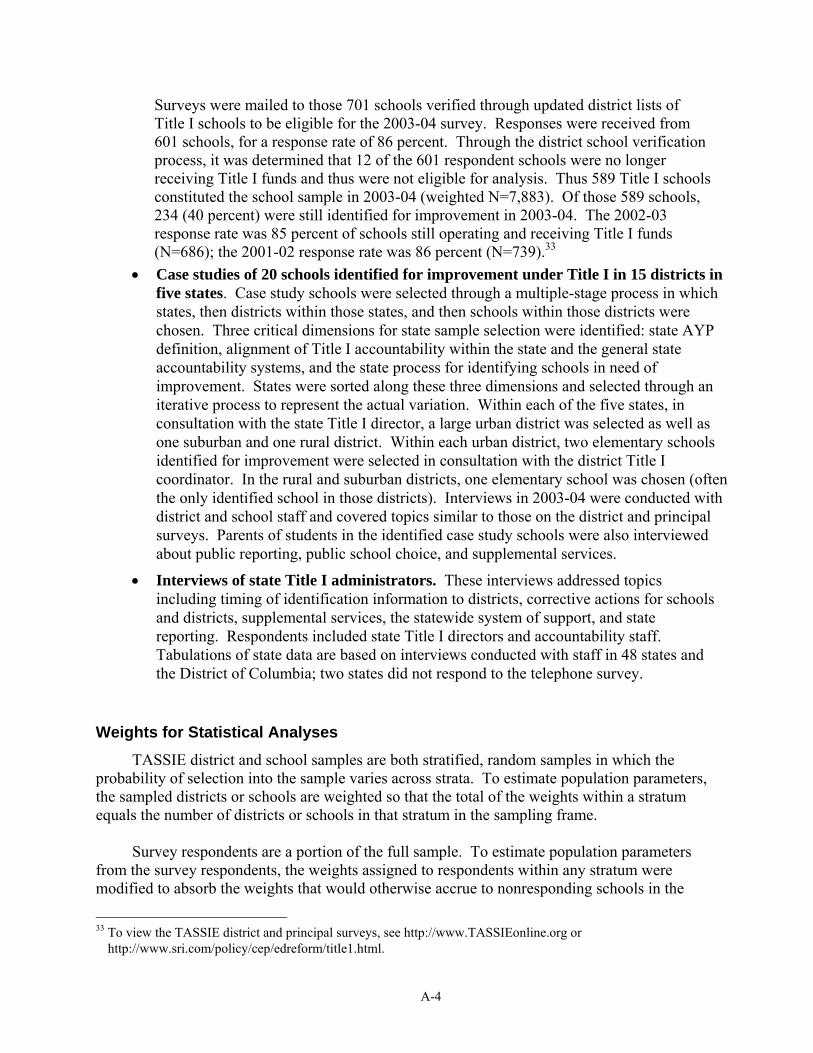
Surveys were mailed to those 701 schools verified through updated district lists of Title I schools to be eligible for the 2003-04 survey. Responses were received from 601 schools, for a response rate of 86 percent. Through the district school verification process, it was determined that 12 of the 601 respondent schools were no longer receiving Title I funds and thus were not eligible for analysis. Thus 589 Title I schools constituted the school sample in 2003-04 (weighted N=7,883). Of those 589 schools, 234 (40 percent) were still identified for improvement in 2003-04. The 2002-03 response rate was 85 percent of schools still operating and receiving Title I funds (N=686); the 2001-02 response rate was 86 percent (N=739).33
• Case studies of 20 schools identified for improvement under Title I in 15 districts in five states. Case study schools were selected through a multiple-stage process in which states, then districts within those states, and then schools within those districts were chosen. Three critical dimensions for state sample selection were identified: state AYP definition, alignment of Title I accountability within the state and the general state accountability systems, and the state process for identifying schools in need of improvement. States were sorted along these three dimensions and selected through an iterative process to represent the actual variation. Within each of the five states, in consultation with the state Title I director, a large urban district was selected as well as one suburban and one rural district. Within each urban district, two elementary schools identified for improvement were selected in consultation with the district Title I coordinator. In the rural and suburban districts, one elementary school was chosen (often the only identified school in those districts). Interviews in 2003-04 were conducted with district and school staff and covered topics similar to those on the district and principal surveys. Parents of students in the identified case study schools were also interviewed about public reporting, public school choice, and supplemental services.
• Interviews of state Title I administrators. These interviews addressed topics including timing of identification information to districts, corrective actions for schools and districts, supplemental services, the statewide system of support, and state reporting. Respondents included state Title I directors and accountability staff. Tabulations of state data are based on interviews conducted with staff in 48 states and the District of Columbia; two states did not respond to the telephone survey.
Weights for Statistical Analyses TASSIE district and school samples are both stratified, random samples in which the
probability of selection into the sample varies across strata. To estimate population parameters, the sampled districts or schools are weighted so that the total of the weights within a stratum equals the number of districts or schools in that stratum in the sampling frame.
Survey respondents are a portion of the full sample. To estimate population parameters
from the survey respondents, the weights assigned to respondents within any stratum were modified to absorb the weights that would otherwise accrue to nonresponding schools in the
33 To view the TASSIE district and principal surveys, see http://www.TASSIEonline.org or
http://www.sri.com/policy/cep/edreform/title1.html.
A-4

stratum. Thus respondents’ weights were adjusted to sum to the total number in the stratum. The analysis for 2003-04 required a new set of weights based on 2003-04 respondents. These weights were used to estimate parameters for the total population of districts and schools from respondents to the 2003-04 surveys. The longitudinal estimates presented in this report use the analysis weights assigned for the 2001-02, 2002-03, and 2003-04 respondent pools, respectively.
Reconciling Differences in Population Estimates From Different Data Sources National estimates for the total number of districts with identified schools, the total number
of identified schools, the demographic distribution of schools and districts have inherent variation based on the source of the estimate. The TASSIE study made use of several data sources, and in this report, text and exhibit notes are used to clarify the source for the estimate. For example, based on the TASSIE District and School Eligibility Database,34 the total number of Title I districts is 11,091. Estimates based on district survey data reported in the context of district assistance to schools sum to a slightly lower number of districts (11,060), as those estimates are based on respondents to the district survey. The estimate of identified Title I schools is also derived from the TASSIE District and School Eligibility Database. The school sample is not used in this report to estimate the number of identified schools.
Estimates of the Number of Students and Schools Regarding Title I Choice and Supplemental Services
Estimates below are based on the data from districts providing Title I choice or supplemental services for the 2002-03 school year.
2002-03
Estimate Standard
Error* Low
Estimate High
Estimate Title I choice
Number of students eligible for choice 1,535,426 295,588 932,426 2,138,426
Number of students requesting a transfer 27,788 5,261 17,056 38,520
Number of students that transferred 18,078 4,693 8,691 27,464 Number of students that received their first choice of schools when transferred 17,270 4,650 7,784 26,756
Supplemental services Number of students eligible for supplemental services 791,370 233,367 315,301 1,267,439
Number of students that received services 56,452 15,513 24,805 88,099 Number of schools with students eligible to receive supplemental services 1,314 174 959 1,669
* Estimates at the 95 percent confidence interval with 32 degrees of freedom +/- 2.04 x Standard Error based on responses to the TASSIE district survey.
34 The TASSIE District and School Eligibility Database provides a source of data about the full sample of districts
and the full sample of schools in the TASSIE study. When appropriately weighted in the analysis, this database provides national estimates of the status of the district and school populations.
A-5
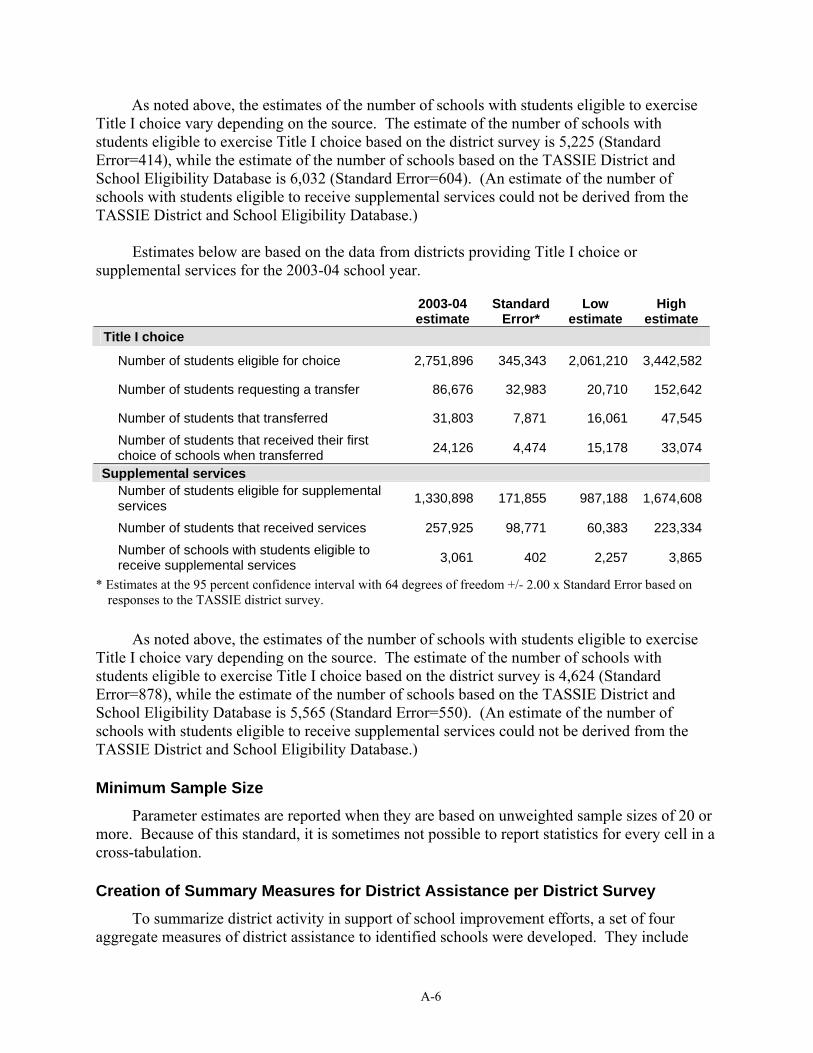
As noted above, the estimates of the number of schools with students eligible to exercise Title I choice vary depending on the source. The estimate of the number of schools with students eligible to exercise Title I choice based on the district survey is 5,225 (Standard Error=414), while the estimate of the number of schools based on the TASSIE District and School Eligibility Database is 6,032 (Standard Error=604). (An estimate of the number of schools with students eligible to receive supplemental services could not be derived from the TASSIE District and School Eligibility Database.)
Estimates below are based on the data from districts providing Title I choice or
supplemental services for the 2003-04 school year.
2003-04 estimate
Standard Error*
Low estimate
High estimate
Title I choice
Number of students eligible for choice 2,751,896 345,343 2,061,210 3,442,582
Number of students requesting a transfer 86,676 32,983 20,710 152,642
Number of students that transferred 31,803 7,871 16,061 47,545 Number of students that received their first choice of schools when transferred 24,126 4,474 15,178 33,074
Supplemental services Number of students eligible for supplemental services 1,330,898 171,855 987,188 1,674,608
Number of students that received services 257,925 98,771 60,383 223,334 Number of schools with students eligible to receive supplemental services 3,061 402 2,257 3,865
* Estimates at the 95 percent confidence interval with 64 degrees of freedom +/- 2.00 x Standard Error based on responses to the TASSIE district survey.
As noted above, the estimates of the number of schools with students eligible to exercise
Title I choice vary depending on the source. The estimate of the number of schools with students eligible to exercise Title I choice based on the district survey is 4,624 (Standard Error=878), while the estimate of the number of schools based on the TASSIE District and School Eligibility Database is 5,565 (Standard Error=550). (An estimate of the number of schools with students eligible to receive supplemental services could not be derived from the TASSIE District and School Eligibility Database.)
Minimum Sample Size Parameter estimates are reported when they are based on unweighted sample sizes of 20 or
more. Because of this standard, it is sometimes not possible to report statistics for every cell in a cross-tabulation.
Creation of Summary Measures for District Assistance per District Survey To summarize district activity in support of school improvement efforts, a set of four
aggregate measures of district assistance to identified schools were developed. They include
A-6

district support for planning and data use, professional development, curriculum alignment, and intensity of assistance.
Each measure is made up of dichotomous items, scored 1, 0, or missing. For items that
asked respondents to report activity for corrective action schools, identified schools, low-performing schools, and all other schools, a “1” was accepted in either of the first two columns (corrective action schools and identified schools) as a “1” for the purposes of developing the measure. A mean score for each district was computed by summing up the number of 1s across items and dividing by the number of items. The resulting scores ranged from 0 to 1.
Only districts that had identified schools and had answered all of the items included in the
measure were considered in this analysis. Thus, the largest possible N for each measure is 419 unweighted, 1,721 weighted. The descriptions that follow show the items included in each strand and descriptive statistics for district scores on the measure (the mean score, standard deviation, and quartiles). The descriptive statistics also include a measure of the internal consistency of the aggregates. Because the items that make up each scale are dichotomous, a Kuder-Richardson 20 coefficient was calculated as a measure of internal consistency, which is comparable to Cronbach’s alpha for continuous measures.
In addition, categories that were developed to report district scores on these aggregate
measures are presented. Districts that reported providing support on all of items included in the measure were characterized as providing an extensive range of assistance to identified schools. Districts that reported providing support on half or fewer of the items included in the measure were characterized as providing a limited range of support. Districts in the middle were characterized as providing a moderate range of support.
It is important to note that the category “extensive” means only that the district provides
many different types of assistance with many different purposes. It does not mean that the assistance is more intensive, or that the district reaches a larger number of schools. District Support for Planning and Data Use Items Included in 2003-04 D20. Does the district provide technical assistance with data analysis or planning to identified
schools? The district assigns staff to work directly with individual schools to… 1. Review data to be sure identification is valid (0,1) 2. Analyze student achievement data to identify specific academic problems that caused
the school to be identified (0,1) 3. Identify research-based improvement strategies (0,1) 4. Provide additional data analysis, e.g., additional disaggregation or analysis of
diagnostic assessments (0,1) 5. Analyze and revise the school's budget so that school resources are effectively
allocated (0,1) 6. Write or revise a school's improvement plan (0,1) 7. Monitor progress throughout the school year toward goals established in the school
improvement plan (0,1)
A-7
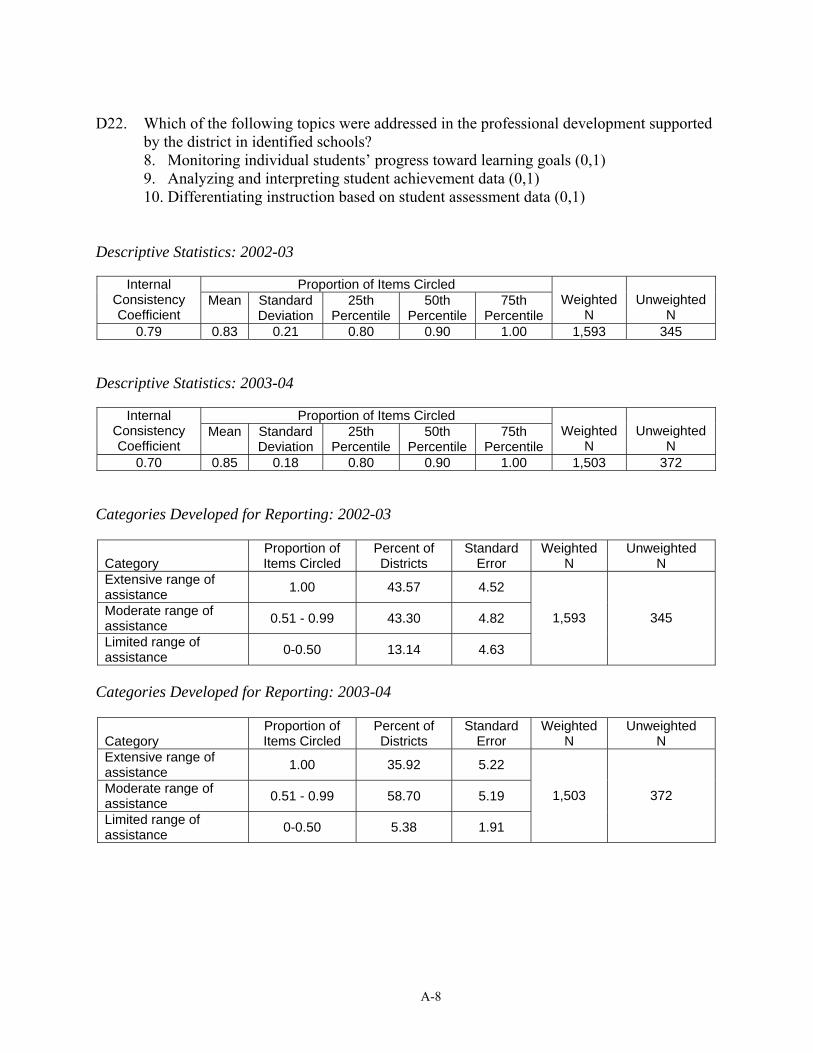
D22. Which of the following topics were addressed in the professional development supported
by the district in identified schools? 8. Monitoring individual students’ progress toward learning goals (0,1) 9. Analyzing and interpreting student achievement data (0,1) 10. Differentiating instruction based on student assessment data (0,1)
Descriptive Statistics: 2002-03
Proportion of Items Circled Internal Consistency Coefficient
Mean Standard Deviation
25th Percentile
50th Percentile
75th Percentile
Weighted N
Unweighted N
0.79 0.83 0.21 0.80 0.90 1.00 1,593 345 Descriptive Statistics: 2003-04
Proportion of Items Circled Internal Consistency Coefficient
Mean Standard Deviation
25th Percentile
50th Percentile
75th Percentile
Weighted N
Unweighted N
0.70 0.85 0.18 0.80 0.90 1.00 1,503 372 Categories Developed for Reporting: 2002-03
Category Proportion of Items Circled
Percent of Districts
Standard Error
Weighted N
Unweighted N
Extensive range of assistance 1.00 43.57 4.52
Moderate range of assistance 0.51 - 0.99 43.30 4.82
Limited range of assistance 0-0.50 13.14 4.63
1,593 345
Categories Developed for Reporting: 2003-04
Category Proportion of Items Circled
Percent of Districts
Standard Error
Weighted N
Unweighted N
Extensive range of assistance 1.00 35.92 5.22
Moderate range of assistance 0.51 - 0.99 58.70 5.19
Limited range of assistance 0-0.50 5.38 1.91
1,503 372
A-8
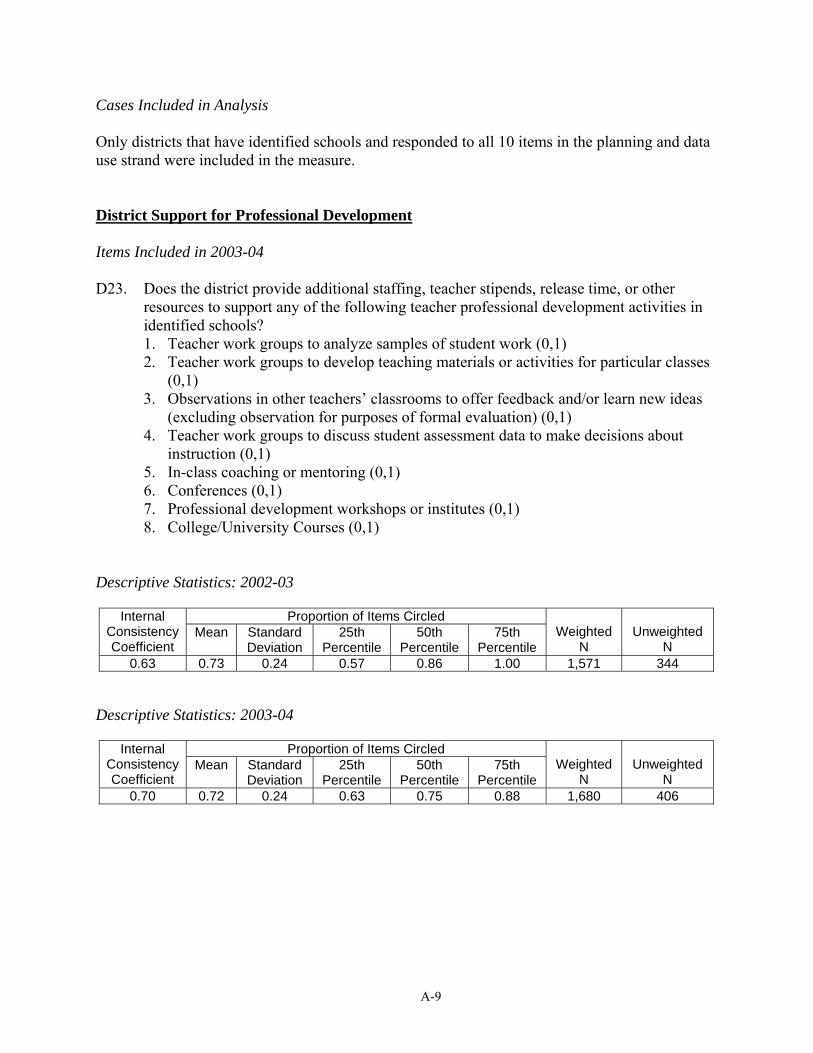
Cases Included in Analysis Only districts that have identified schools and responded to all 10 items in the planning and data use strand were included in the measure. District Support for Professional Development Items Included in 2003-04 D23. Does the district provide additional staffing, teacher stipends, release time, or other
resources to support any of the following teacher professional development activities in identified schools? 1. Teacher work groups to analyze samples of student work (0,1) 2. Teacher work groups to develop teaching materials or activities for particular classes
(0,1) 3. Observations in other teachers’ classrooms to offer feedback and/or learn new ideas
(excluding observation for purposes of formal evaluation) (0,1) 4. Teacher work groups to discuss student assessment data to make decisions about
instruction (0,1) 5. In-class coaching or mentoring (0,1) 6. Conferences (0,1) 7. Professional development workshops or institutes (0,1) 8. College/University Courses (0,1)
Descriptive Statistics: 2002-03
Proportion of Items Circled Internal Consistency Coefficient
Mean Standard Deviation
25th Percentile
50th Percentile
75th Percentile
Weighted N
Unweighted N
0.63 0.73 0.24 0.57 0.86 1.00 1,571 344 Descriptive Statistics: 2003-04
Proportion of Items Circled Internal Consistency Coefficient
Mean Standard Deviation
25th Percentile
50th Percentile
75th Percentile
Weighted N
Unweighted N
0.70 0.72 0.24 0.63 0.75 0.88 1,680 406
A-9
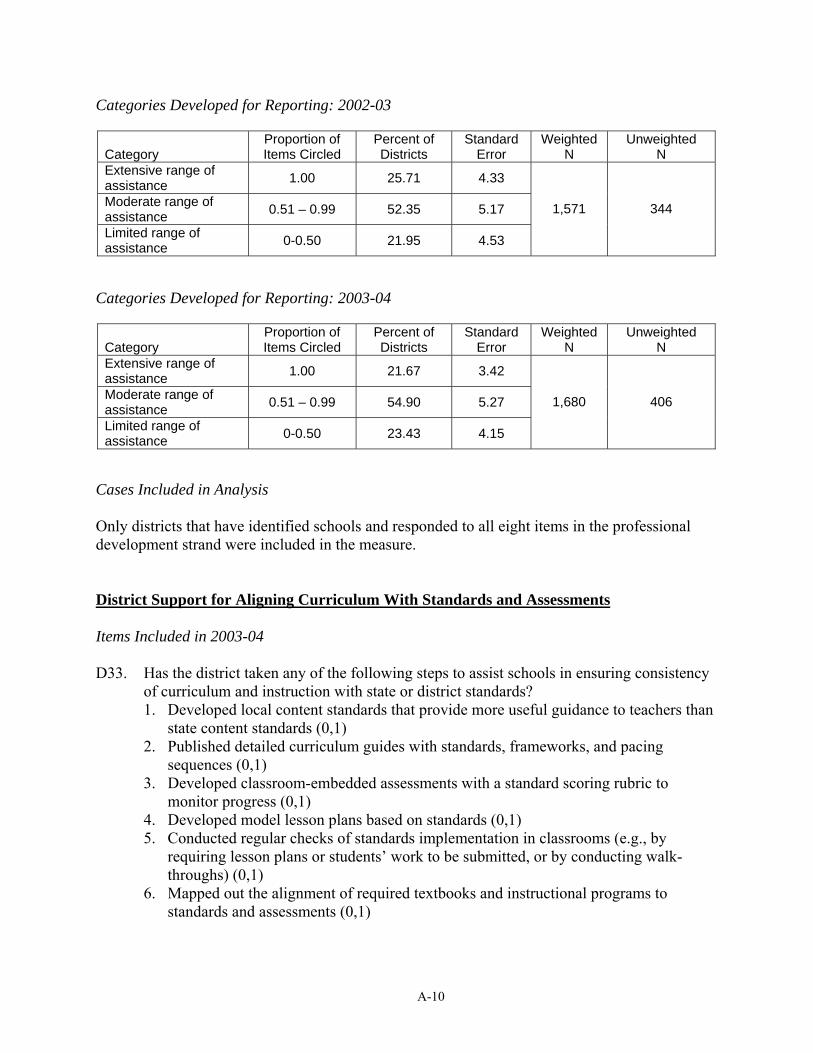
Categories Developed for Reporting: 2002-03
Category Proportion of Items Circled
Percent of Districts
Standard Error
Weighted N
Unweighted N
Extensive range of assistance 1.00 25.71 4.33
Moderate range of assistance 0.51 – 0.99 52.35 5.17
Limited range of assistance 0-0.50 21.95 4.53
1,571 344
Categories Developed for Reporting: 2003-04
Category Proportion of Items Circled
Percent of Districts
Standard Error
Weighted N
Unweighted N
Extensive range of assistance 1.00 21.67 3.42
Moderate range of assistance 0.51 – 0.99 54.90 5.27
Limited range of assistance 0-0.50 23.43 4.15
1,680 406
Cases Included in Analysis Only districts that have identified schools and responded to all eight items in the professional development strand were included in the measure. District Support for Aligning Curriculum With Standards and Assessments Items Included in 2003-04 D33. Has the district taken any of the following steps to assist schools in ensuring consistency
of curriculum and instruction with state or district standards? 1. Developed local content standards that provide more useful guidance to teachers than
state content standards (0,1) 2. Published detailed curriculum guides with standards, frameworks, and pacing
sequences (0,1) 3. Developed classroom-embedded assessments with a standard scoring rubric to
monitor progress (0,1) 4. Developed model lesson plans based on standards (0,1) 5. Conducted regular checks of standards implementation in classrooms (e.g., by
requiring lesson plans or students’ work to be submitted, or by conducting walk-throughs) (0,1)
6. Mapped out the alignment of required textbooks and instructional programs to standards and assessments (0,1)
A-10
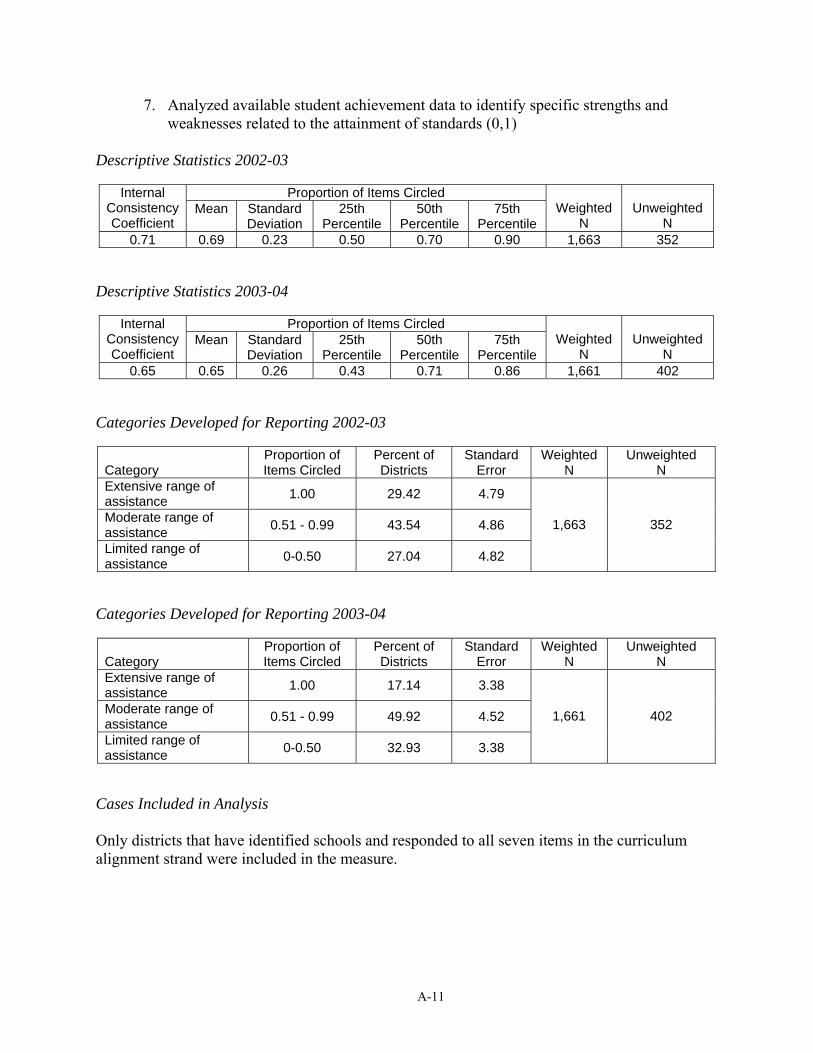
7. Analyzed available student achievement data to identify specific strengths and weaknesses related to the attainment of standards (0,1)
Descriptive Statistics 2002-03
Proportion of Items Circled Internal Consistency Coefficient
Mean Standard Deviation
25th Percentile
50th Percentile
75th Percentile
Weighted N
Unweighted N
0.71 0.69 0.23 0.50 0.70 0.90 1,663 352 Descriptive Statistics 2003-04
Proportion of Items Circled Internal Consistency Coefficient
Mean Standard Deviation
25th Percentile
50th Percentile
75th Percentile
Weighted N
Unweighted N
0.65 0.65 0.26 0.43 0.71 0.86 1,661 402 Categories Developed for Reporting 2002-03
Category Proportion of Items Circled
Percent of Districts
Standard Error
Weighted N
Unweighted N
Extensive range of assistance 1.00 29.42 4.79
Moderate range of assistance 0.51 - 0.99 43.54 4.86
Limited range of assistance 0-0.50 27.04 4.82
1,663 352
Categories Developed for Reporting 2003-04
Category Proportion of Items Circled
Percent of Districts
Standard Error
Weighted N
Unweighted N
Extensive range of assistance 1.00 17.14 3.38
Moderate range of assistance 0.51 - 0.99 49.92 4.52
Limited range of assistance 0-0.50 32.93 3.38
1,661 402
Cases Included in Analysis Only districts that have identified schools and responded to all seven items in the curriculum alignment strand were included in the measure.
A-11
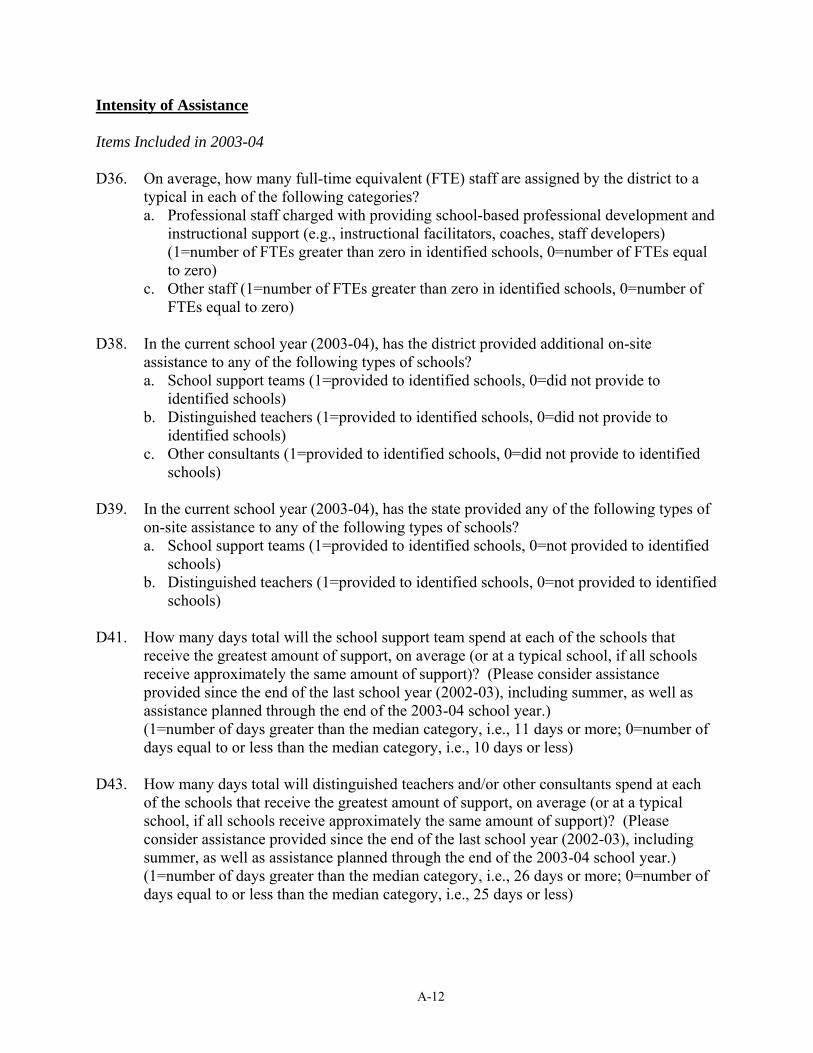
Intensity of Assistance Items Included in 2003-04 D36. On average, how many full-time equivalent (FTE) staff are assigned by the district to a
typical in each of the following categories? a. Professional staff charged with providing school-based professional development and
instructional support (e.g., instructional facilitators, coaches, staff developers) (1=number of FTEs greater than zero in identified schools, 0=number of FTEs equal to zero)
c. Other staff (1=number of FTEs greater than zero in identified schools, 0=number of FTEs equal to zero)
D38. In the current school year (2003-04), has the district provided additional on-site
assistance to any of the following types of schools? a. School support teams (1=provided to identified schools, 0=did not provide to
identified schools) b. Distinguished teachers (1=provided to identified schools, 0=did not provide to
identified schools) c. Other consultants (1=provided to identified schools, 0=did not provide to identified
schools) D39. In the current school year (2003-04), has the state provided any of the following types of
on-site assistance to any of the following types of schools? a. School support teams (1=provided to identified schools, 0=not provided to identified
schools) b. Distinguished teachers (1=provided to identified schools, 0=not provided to identified
schools) D41. How many days total will the school support team spend at each of the schools that
receive the greatest amount of support, on average (or at a typical school, if all schools receive approximately the same amount of support)? (Please consider assistance provided since the end of the last school year (2002-03), including summer, as well as assistance planned through the end of the 2003-04 school year.) (1=number of days greater than the median category, i.e., 11 days or more; 0=number of days equal to or less than the median category, i.e., 10 days or less)
D43. How many days total will distinguished teachers and/or other consultants spend at each
of the schools that receive the greatest amount of support, on average (or at a typical school, if all schools receive approximately the same amount of support)? (Please consider assistance provided since the end of the last school year (2002-03), including summer, as well as assistance planned through the end of the 2003-04 school year.) (1=number of days greater than the median category, i.e., 26 days or more; 0=number of days equal to or less than the median category, i.e., 25 days or less)
A-12

D44. Does the district provide any of the following types of support for principals in the following types of schools? a. Mentor or coach assigned to principal (1=provided to identified schools, 0=not
provided to identified schools) c. Special supervision or lines of reporting for principals of low-performing schools
(1=provided to identified schools, 0=not provided to identified schools)
Descriptive Statistics
Proportion of Items Circled Internal Consistency Coefficient
Mean Standard Deviation
25th Percentile
50th Percentile
75th Percentile
Weighted N
Unweighted N
.10 .29 .45 33rd
Percentile 67th
Percentile .70 .30 .23
.17 .40
1,365 354
Categories Developed for Reporting
Category Proportion of Items Circled
Percent of Districts
Standard Error
Weighted N
Unweighted N
Higher-intensity 0.40 - 1.00 28.04 4.65 Moderate intensity 0.17-0.40 36.33 4.07 Lower-intensity 0 - 0.17 35.63 5.67
1,365 354
Cases Included in Analysis All districts that responded to at least six of the 11 items in the intensity index were included in the measure.
Background Information on Regression Analysis To better understand the relationship between school improvement strategies, demographic
context, and exiting improvement status, the analyses presented below use data from 2002-03 to explain school improvement status in 2003-04. Focusing on elementary schools that were identified for improvement in 2002-03, school improvement strategies and demographics (school poverty, school size, district size, district urbanicity) were used to develop models for predicting whether or not a school exited improvement the following year. Various models were tested. Some considered whether or not schools were engaged in each of seven school improvement efforts: school planning, use of student achievement data, curriculum alignment, adoption of a new reading or language arts curriculum, adoption of a new mathematics curriculum, use of a school reform model, and teacher collaboration. Some also took into account whether
A-13

professional development was emphasized in specific areas; others incorporated whether the district provided adequate support in these areas. Models were tested with and without context variables and with various combinations of context variables.
The model was selected by using several criteria, including Akaike’s Information Criterion
(AIC) and Schwartz’s Criterion (SC), both of which take into account the number of parameters or variables in the model. In addition to these statistics, parsimony was considered in assessing models in this analysis. The model—or group of variables—that was the most predictive of school improvement status in 2003-04 included school poverty (low, medium, high),35 district size (small, medium, large),36 and the school improvement strategy of aligning curriculum with standards and assessment, combined with a professional development emphasis in this area.
Regression coefficients (labeled “b” in the table below) provide one way to examine the expected probability of schools’ exiting improvement status based on the model. To calculate the probability of a school exiting improvement status, the regression coefficients from this model define the following equation:
logit (out of improvement) = 1.44 (curr align) + 2.37 (low sch pov) + 1.26 (med sch pov) + 3.72 (small dist size) + 2.50 (med dist size) – 4.39; probability of getting out of improvement = elogit(out of improvement)/(1 + elogit(out of
improvement)). Thus, the probability presented in Example 1 of Exhibit 54 (for a school with high poverty, in a large district , without curriculum alignment) was calculated as follows:
logit (out of improvement) = 1.44(0) + 2.37(0) + 1.26(0) + 3.72(0) + 2.50(0) – 4.39 = -4.39; probability of getting out of improvement = e-4.39/(1 + e-4.39) = 0.01.
35 Categories of school poverty: low (0 to <35 percent of students), medium (35 to <75 percent), high (75+ percent). 36 Categories of district size: small (200 to 3,503 students), medium (3,504 to 37,740 students), large (>37,740
students).
A-14

Predictors of Exiting Title I Need of Improvement Status in 2003-04
Independent variable b* Standard
Errorb
Curriculum/standards alignment with professional development emphasis 1.44 0.70
School poverty—lowa 2.37 0.67
School poverty—mediuma 1.25 0.86
District size—smallc 3.72 1.10
District size—mediumc 2.50 0.99
Intercept -4.39 0.75 Weighted N = 2,743; Unweighted N = 292. *All regression coefficients were statistically significant except the medium level of school poverty. Standard Errorb = standard error of the coefficient. a High school poverty is the contrast level of the variable (i.e., it has a regression coefficient of 0). c Large district size is the contrast level of the variable (i.e., it has a regression coefficient of 0).
A-15


Appendix B
Additional Exhibits37
37 The exhibits in this section provide additional data for selected exhibits in the report. For the complete dataset
based on 2003-04 and longitudinal analyses, see Evaluation of Title I Accountability Systems and School Improvement Efforts (TASSIE): Third-Year Technical Appendix (SRI International 2005).
B-1

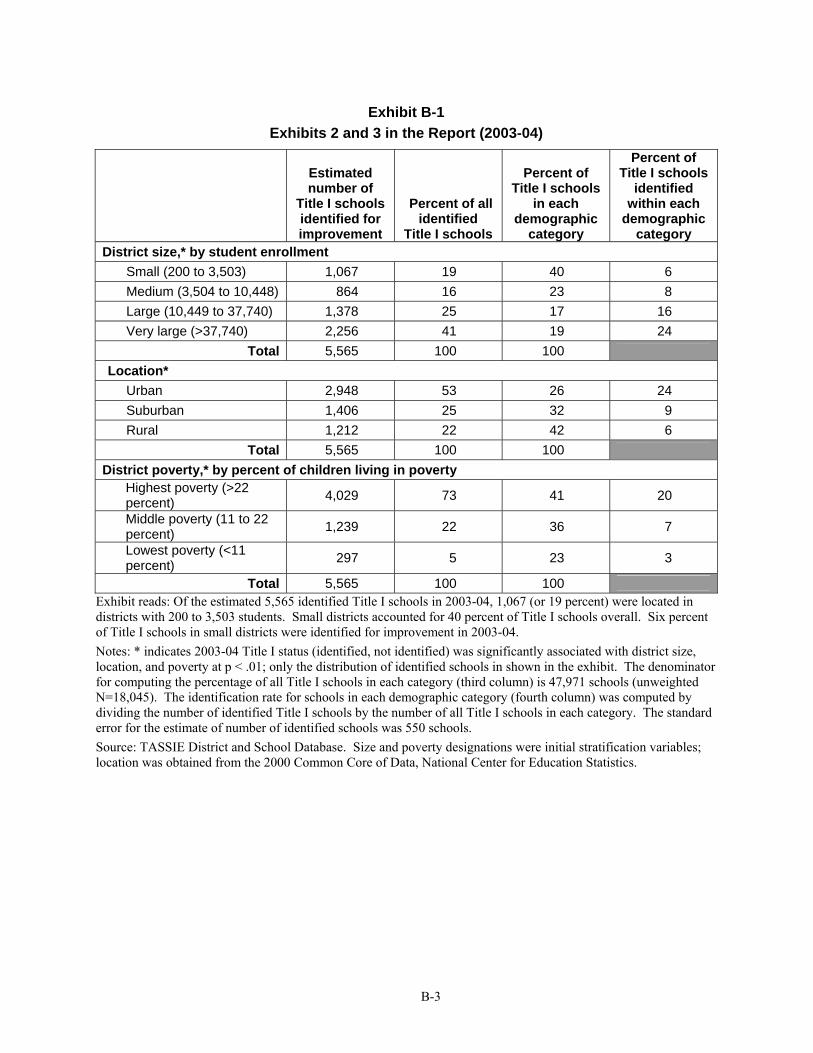
Exhibit B-1 Exhibits 2 and 3 in the Report (2003-04)
Estimated number of
Title I schools identified for improvement
Percent of all identified
Title I schools
Percent of Title I schools
in each demographic
category
Percent of Title I schools
identified within each
demographic category
District size,* by student enrollment Small (200 to 3,503) 1,067 19 40 6 Medium (3,504 to 10,448) 864 16 23 8 Large (10,449 to 37,740) 1,378 25 17 16 Very large (>37,740) 2,256 41 19 24
Total 5,565 100 100 Location*
Urban 2,948 53 26 24 Suburban 1,406 25 32 9 Rural 1,212 22 42 6
Total 5,565 100 100 District poverty,* by percent of children living in poverty
Highest poverty (>22 percent) 4,029 73 41 20
Middle poverty (11 to 22 percent) 1,239 22 36 7
Lowest poverty (<11 percent) 297 5 23 3
Total 5,565 100 100 Exhibit reads: Of the estimated 5,565 identified Title I schools in 2003-04, 1,067 (or 19 percent) were located in districts with 200 to 3,503 students. Small districts accounted for 40 percent of Title I schools overall. Six percent of Title I schools in small districts were identified for improvement in 2003-04. Notes: * indicates 2003-04 Title I status (identified, not identified) was significantly associated with district size, location, and poverty at p < .01; only the distribution of identified schools in shown in the exhibit. The denominator for computing the percentage of all Title I schools in each category (third column) is 47,971 schools (unweighted N=18,045). The identification rate for schools in each demographic category (fourth column) was computed by dividing the number of identified Title I schools by the number of all Title I schools in each category. The standard error for the estimate of number of identified schools was 550 schools. Source: TASSIE District and School Database. Size and poverty designations were initial stratification variables; location was obtained from the 2000 Common Core of Data, National Center for Education Statistics.
B-3

Exhibit B-2 Exhibit 4 in the Report
Characteristic
Percent of schools identified in 2001-02
Percent of schools still identified
in 2003-04
Percent of schools no longer identified
in 2003-04 District size/enrollment*
Small (200 to 3,503) 32 12 40 Medium (3,504 to 10,448) 20 14 23
Large (10,499 to 37,740) 21 25 19
Very large (>37,740) 27 49 19 Total 100 100 100
District location* Rural 34 16 41 Suburban 27 29 27 Urban 39 55 32 Total 100 100 100
School poverty* Low (<34.9%) 24 8 28 Medium (35 to 49.9%) 20 17 20 High (50 to 74.9%) 26 25 28 Very high (>75%) 31 50 24 Total 100 100 100
School enrollment* Small (<300) 26 15 29 Medium (300 to 499) 31 20 38 Large (500 to 749) 23 29 19 Very large (750 or more) 21 35 15
Total 100 100 100 Respondent N 577 234 355
Exhibit reads: Thirty-two percent of the identified Title I schools in the TASSIE survey sample that responded in 2001-02 were located in small districts; the percentage of Title I schools still identified that responded in 2003-04 and were located in small districts was 12 percent; 40 percent of schools identified in 2001-02 and that were no longer identified in 2003-04 were located in small districts. Note: * indicates 2003-04 Title I status (identified, not identified) was significantly associated with district size, district location, school poverty, and school enrollment at p < .01. Source: This exhibit depicts the demographic distribution of schools in the TASSIE school sample that responded to the school survey in both 2001-02 and 2003-04 or either year. District size was determined by number of students enrolled in the district. School poverty was defined by the percentage of students who were eligible for free or reduced-price lunches.
B-4
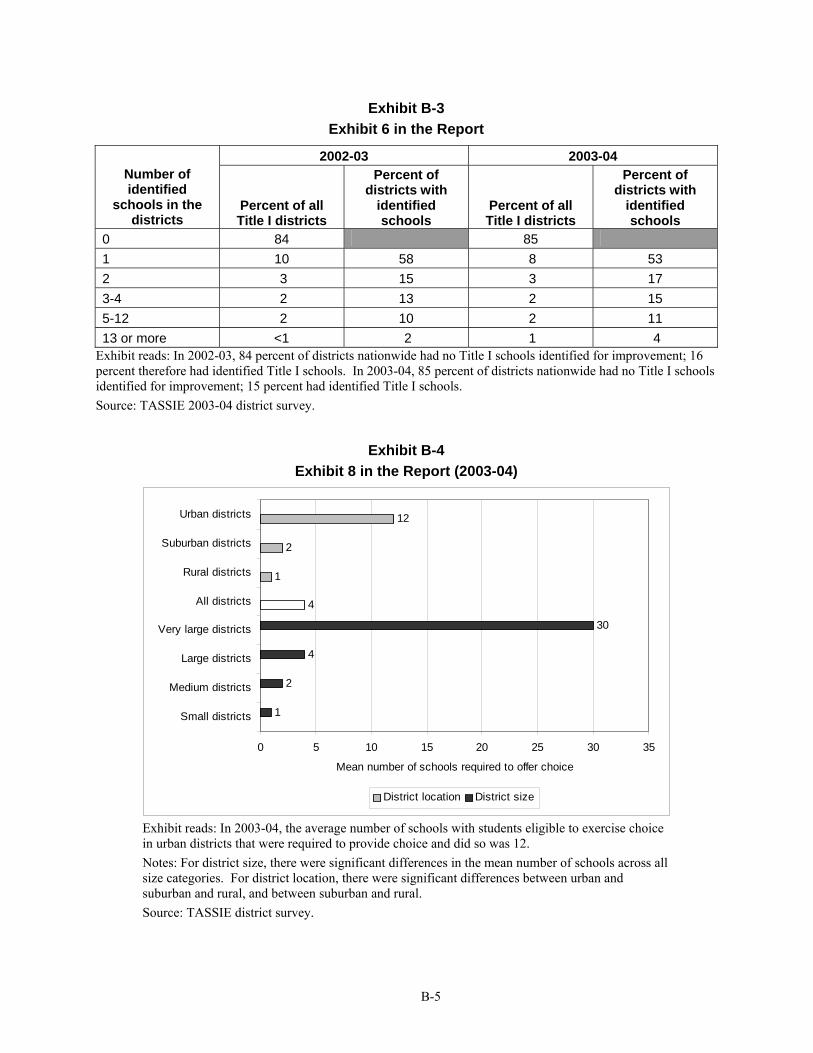
Exhibit B-3 Exhibit 6 in the Report
2002-03 2003-04 Number of identified
schools in the districts
Percent of all Title I districts
Percent of districts with
identified schools
Percent of all Title I districts
Percent of districts with
identified schools
0 84 85 1 10 58 8 53 2 3 15 3 17 3-4 2 13 2 15 5-12 2 10 2 11 13 or more <1 2 1 4
Exhibit reads: In 2002-03, 84 percent of districts nationwide had no Title I schools identified for improvement; 16 percent therefore had identified Title I schools. In 2003-04, 85 percent of districts nationwide had no Title I schools identified for improvement; 15 percent had identified Title I schools. Source: TASSIE 2003-04 district survey.
Exhibit B-4 Exhibit 8 in the Report (2003-04)
4
1
2
12
1
2
4
30
0 5 10 15 20 25 30 35
Small districts
Medium districts
Large districts
Very large districts
All districts
Rural districts
Suburban districts
Urban districts
Mean number of schools required to offer choice
District location District size
Exhibit reads: In 2003-04, the average number of schools with students eligible to exercise choice in urban districts that were required to provide choice and did so was 12. Notes: For district size, there were significant differences in the mean number of schools across all size categories. For district location, there were significant differences between urban and suburban and rural, and between suburban and rural. Source: TASSIE district survey.
B-5

Exhibit B-5 Exhibit 10 in the Report (2003-04)
Alternate schools for children in elementary
grades*
Alternate schools for children in middle
grades*
Alternate schools for children in high school
grades* All districts 5 2 1 District size
Small 2 -- -- Medium 4 2 1 Large 6 2 2 Very large 12 6 5
District location Rural 2 1 -- Suburban 5 2 1 Urban 10 4 3
Exhibit reads: Among districts that had identified schools and offered choice in 2003-04, the average number of alternate schools available to families in identified Title I elementary schools was five, two alternate schools in middle grades, and one alternate high school. Notes: * indicates there were statistically significant differences by district size and district location in the average number of alternate schools available to families at all grades (between p < .05 and p < .0001). -- indicates there were too few cases in the cell to generate a reliable estimate. Source: TASSIE district survey.
B-6
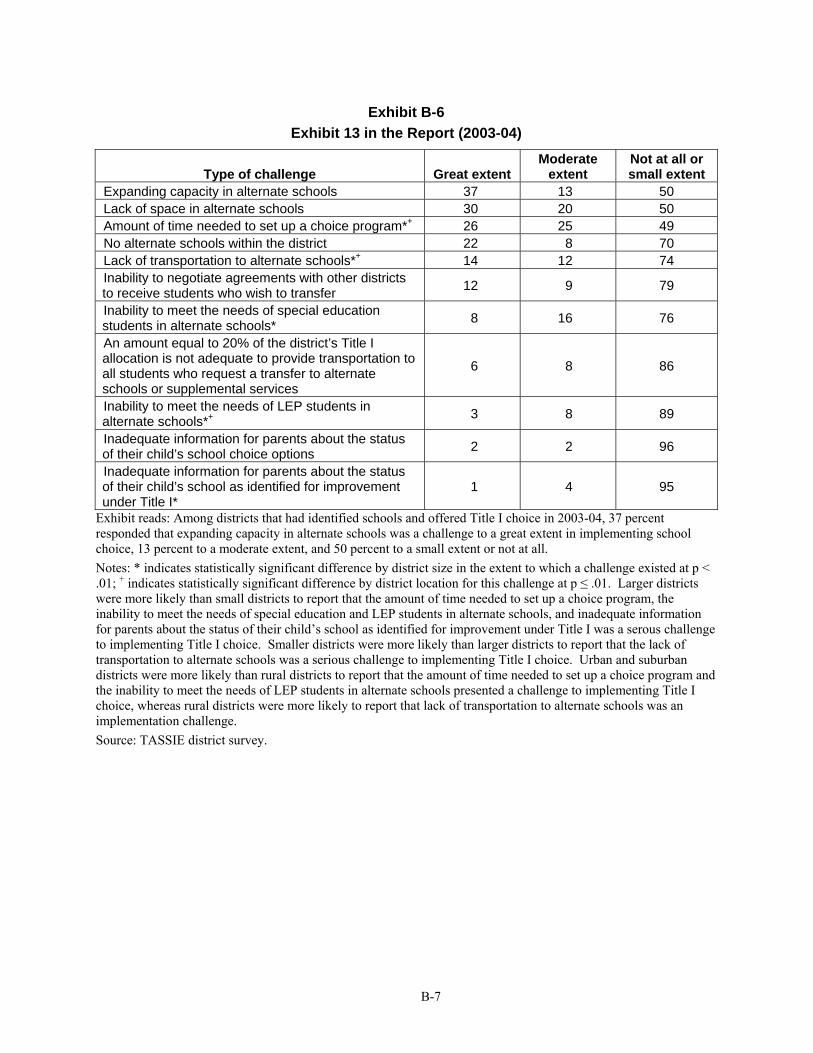
Exhibit B-6 Exhibit 13 in the Report (2003-04)
Type of challenge Great extent Moderate
extent Not at all or small extent
Expanding capacity in alternate schools 37 13 50 Lack of space in alternate schools 30 20 50 Amount of time needed to set up a choice program*+ 26 25 49 No alternate schools within the district 22 8 70 Lack of transportation to alternate schools*+ 14 12 74 Inability to negotiate agreements with other districts to receive students who wish to transfer 12 9 79
Inability to meet the needs of special education students in alternate schools* 8 16 76
An amount equal to 20% of the district’s Title I allocation is not adequate to provide transportation to all students who request a transfer to alternate schools or supplemental services
6 8 86
Inability to meet the needs of LEP students in alternate schools*+ 3 8 89
Inadequate information for parents about the status of their child’s school choice options 2 2 96
Inadequate information for parents about the status of their child’s school as identified for improvement under Title I*
1 4 95
Exhibit reads: Among districts that had identified schools and offered Title I choice in 2003-04, 37 percent responded that expanding capacity in alternate schools was a challenge to a great extent in implementing school choice, 13 percent to a moderate extent, and 50 percent to a small extent or not at all. Notes: * indicates statistically significant difference by district size in the extent to which a challenge existed at p < .01; + indicates statistically significant difference by district location for this challenge at p ≤ .01. Larger districts were more likely than small districts to report that the amount of time needed to set up a choice program, the inability to meet the needs of special education and LEP students in alternate schools, and inadequate information for parents about the status of their child’s school as identified for improvement under Title I was a serous challenge to implementing Title I choice. Smaller districts were more likely than larger districts to report that the lack of transportation to alternate schools was a serious challenge to implementing Title I choice. Urban and suburban districts were more likely than rural districts to report that the amount of time needed to set up a choice program and the inability to meet the needs of LEP students in alternate schools presented a challenge to implementing Title I choice, whereas rural districts were more likely to report that lack of transportation to alternate schools was an implementation challenge. Source: TASSIE district survey.
B-7

Exhibit B-7 Exhibit 20 in the Report
Number of states in 2003-04
Number of states in 2002-03
Standards and processes for monitoring the quality of providers 38 22 Analysis of achievement data from participating students, measure unspecified 5
Evidence of student progress toward proficiency on state assessments 7
Evidence of growth on achievement measures used by providers 7 Participation measures (e.g., number of students served, attendance rates, number of students dropping out, number of tutoring sessions) 5
Parent satisfaction survey (survey results or other forms of feedback) 6 School and/or district satisfaction (survey results or other forms of feedback) 5
State monitoring to ensure that providers are conforming to assurances and eligibility criteria in their applications 4
Districts have primary responsibility for monitoring quality and reporting to the state 7
Standards and processes for withdrawing approval from providers 25 20 Failure to comply with the terms of service contracts or failure to comply with the assurances in provider application (some states also require providers to reapply for approval each year)
13
Failure for two consecutive years to contribute increased academic proficiency for students receiving services 12
Results of district evaluation reports, district reports on student progress, or district feedback 8
Parent complaints or poor results from parent satisfaction surveys will trigger an investigation by the state and possible withdrawal 6
Majority of students (50 to 90 percent) make academic progress, as measured by supplemental services provider assessments 3
Analysis of state assessment results for students receiving services 2 Outside evaluation 1
Exhibit reads: Five states reported that they used analyses of achievement data on an unspecified measure to monitor the quality of the services offered by supplemental services provider. Notes: In 2003-04, for 29 out of 38 states that reported having standards and processes for monitoring provider quality the criteria used were available, nine states had no standards or processes in place and in 11 states the respondent did not know the information. In 2003-04, 25 states had criteria for withdrawing approval from providers, 19 states did not and in five states the respondent did not know the information. In 2002-03, 22 states had established monitoring standards and 20 states reported being in the process of developing monitoring standards. In 2002-03, 20 states had standards for withdrawing approval from providers and 23 states reported being in the process of developing criteria. Two states had no schools required to provide supplemental services in 2002-03 and 2003-04. Source: TASSIE state survey.
B-8

Exhibit B-8 Exhibit 23 in the Report (2003-04)
Type of challenge Great extent Moderate
extent Not at all or small extent
Lack of providers in the area*+ 30 31 39 Lack of approved providers offering services to meet the needs of specific student populations 17 23 60
Approved providers did not offer high-quality services*+ 16 17 67
Providers have not yet established a reputation with parents* 11 28 61
Competition from existing after-school programs 10 26 64 An amount equal to 20% of the district’s Title I allocation is not adequate to meet all requests for services or provide transportation for choice
8 3 89
Difficulty negotiating contracts with service providers*+ 6 19 75
Inadequate time for parents to learn about supplemental services 3 10 87
Inadequate information for parents about supplemental services*+ 1 6 93
State did not provide a list of supplemental services providers who operate in the area+ 1 2 97
Exhibit reads: Among districts that had identified schools and offered supplemental services in 2003-04, 30 percent responded that lack of providers in the area was a challenge to a great extent in implementing school choice, 31 percent to a moderate extent, and 39 percent to a small extent or not at all. Notes: * indicates statistically significant difference by district size in the extent to which a challenge existed (between p < .05 and p < .0001); + indicates statistically significant difference by district location (between p < .05 and p < .01) for this challenge. Small and medium districts were more likely than larger districts to report that lack of providers in the area presented a serious challenge to implementing supplemental services. Larger districts were more likely than smaller districts to report that approved providers did not offer high-quality services, providers had not yet established a reputation with parents, difficulty negotiating contracts with service providers, and inadequate information for parents about supplemental services were implementation challenges. Rural districts were more likely than urban and suburban districts to report that lack of providers in the area and inadequate information to parents about supplemental services was a serious challenge to implementing supplemental services. Urban and suburban districts were more likely than rural districts to report that approved providers did not offer high-quality services, and difficulty negotiating contracts with service providers were a serious implementation challenge. Source: TASSIE district survey.
B-9

Exhibit B-9 Exhibit 30 in the Report (2003-04)
82
82
93
31
41
48
72
95
83
100
40
53
60
79
82
89
27
35
41
68
76
0 20 40 60 80 100
Using student achievement data to inform schoolimprovement efforts*
Aligning curriculum to standards andassessments
Adoption of a new reading/language artscurriculum in the last three years
Adoption of a new mathematics curriculum in thelast three years
Using a school reform model
Having a written school plan*
Teacher collaboration
Percentage of Title I schoolsAll Identified Not Identified
%
Exhibit reads: In 2003-04, 82 percent of all Title I schools identified for improvement in 2001-02 engaged in teacher collaboration, compared with 82 percent of Title I schools no longer identified and 83 percent of continuously identified schools. Note: * indicates differences were statistically significant at p < .05. Continuously identified schools were more likely to engage in improvement strategies than schools no longer identified. Source: TASSIE principal survey.
B-10

Exhibit B-10 Exhibit 32 in the Report
Percent of Schools Year 3 – Year 2 Comparison
Source of Information
2003-04 2002-03 Difference T-statistic P-value
% 97.39 90.66 6.73 Overall student performance on state test
SE 1.16 2.40 2.81 2.40 0.02
% 90.80 85.40 5.40 Student performance on state test, disaggregated by grade level SE 1.95 3.57 3.56
1.52 0.13
% 70.35 67.95 2.40 Student performance on state test, disaggregated by classroom SE 2.91 4.12 4.21
0.57 0.57
% 82.71 70.90 11.81 Student performance on state test, disaggregated for special student populations (e.g., special education, LEP, and migrant students) SE 3.30 4.53 5.59
2.11 0.04
% 76.85 64.95 11.90 Student performance on state test, disaggregated by student demographic characteristics (e.g., poverty, race/ethnicity, and gender) SE 3.81 4.66 5.43
2.19 0.03
% 69.65 68.25 1.40 Subtest or item-cluster scores on state test
SE 3.39 3.36 3.66 0.38 0.70
% 60.93 59.29 1.64 Item-by-item review of state test results
SE 3.33 4.22 3.91 0.42 0.68
% 79.89 75.95 3.94 School reports showing trends over multiple years
SE 2.66 2.82 2.57 1.53 0.13
% 81.25 69.87 11.38 Student performance on district assessments
SE 2.87 3.48 3.98 2.86 0.01
% 80.93 73.64 7.29 Student performance on school-level assessments (e.g., common writing prompts, math tasks, or reading assessments) SE 2.51 3.39 3.75
1.94 0.06
% 45.56 35.69 9.86 Inventories of instructional practices
SE 3.30 4.59 4.62 2.13 0.04
Weighted N 6,805 7,013
Unweighted N 523 546
Exhibit reads: Among schools that had a written school plan, there is a statistically significant difference between 2003-04 and 2002-03 in the percentage that used overall student performance on the state test to inform the school planning process: 97.39 percent in 2003-04 and 90.66 percent in 2002-03. Note: SE = standard error. Source: Year 2 Principal Survey Item P26; Year 3 Principal Survey Item P18.
B-11

Exhibit B-11 Exhibit 46 in the Report (2003-04)
49
69
66
77
72
85
50
73
74
50
0
55
52
49
58
79
65
73
58
63
36
0
0% 20% 40% 60% 80% 100%
Observing/evaluating teacher performance
Curriculum mapping/alignment
Implementation of the school improvement plan
Improving instruction for specific student subgroups
Developing a school improvement plan
Identifying research-based interventions
Administering/analyzing diagnostic assessments
Mathematics instruction
Providing teacher professional development (e.g., coaching,workshops)
Analyzing and interpreting student achievement data
Reading/language arts instruction
Distinguished teachers and other consultants
School support teams
Percentage of districts with identified schools and school support teams/distinguished teachers
Exhibit reads: Nearly all districts (97 percent) reported that school-based coaches and instructional facilitators focused on improving reading or language arts instruction as part of their work, compared with 77 percent of districts that reported that reading or language arts instruction was a focus for school support teams and 79 percent of districts that reported it was a focus for distinguished teachers and other consultants. Source: TASSIE district survey.
B-12
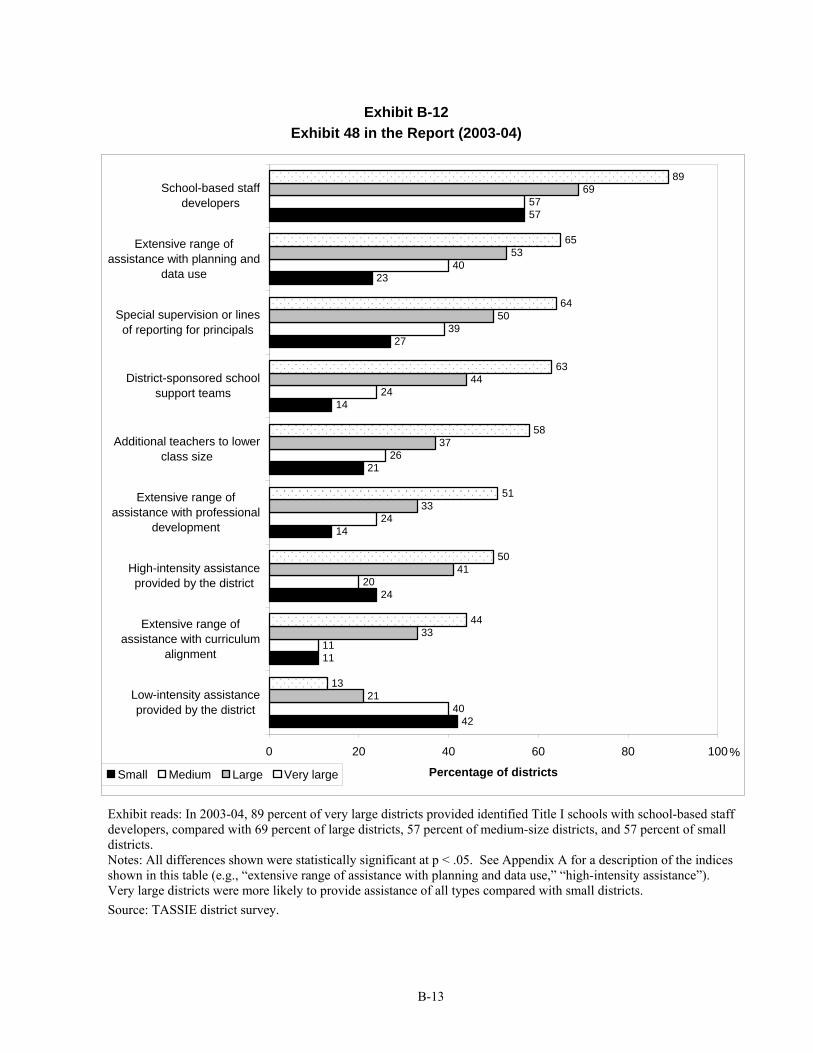
Exhibit B-12 Exhibit 48 in the Report (2003-04)
42
11
24
14
21
14
27
23
57
40
11
20
24
26
24
39
40
57
21
33
41
33
37
44
50
53
69
13
44
50
51
58
63
64
65
89
0 20 40 60 80 1
Low-intensity assistanceprovided by the district
Extensive range ofassistance with curriculum
alignment
High-intensity assistanceprovided by the district
Extensive range ofassistance with professional
development
Additional teachers to lowerclass size
District-sponsored schoolsupport teams
Special supervision or linesof reporting for principals
Extensive range ofassistance with planning and
data use
School-based staffdevelopers
Percentage of districts
00
Small Medium Large Very large
%
Exhibit reads: In 2003-04, 89 percent of very large districts provided identified Title I schools with school-based staff developers, compared with 69 percent of large districts, 57 percent of medium-size districts, and 57 percent of small districts. Notes: All differences shown were statistically significant at p < .05. See Appendix A for a description of the indices shown in this table (e.g., “extensive range of assistance with planning and data use,” “high-intensity assistance”). Very large districts were more likely to provide assistance of all types compared with small districts. Source: TASSIE district survey.
B-13
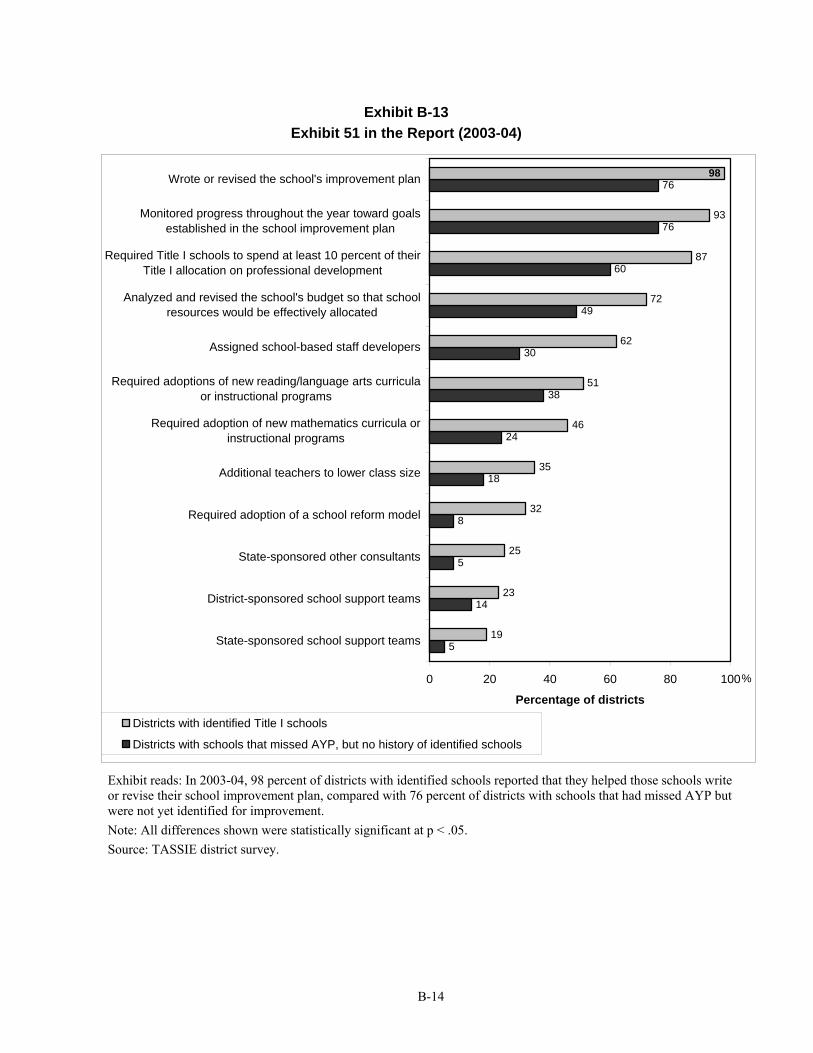
Exhibit B-13 Exhibit 51 in the Report (2003-04)
76
76
60
49
30
38
24
18
8
5
14
5
98
93
87
72
62
51
46
35
32
25
23
19
0 20 40 60 80 100
State-sponsored school support teams
District-sponsored school support teams
State-sponsored other consultants
Required adoption of a school reform model
Additional teachers to lower class size
Required adoption of new mathematics curricula orinstructional programs
Required adoptions of new reading/language arts curriculaor instructional programs
Assigned school-based staff developers
Analyzed and revised the school's budget so that schoolresources would be effectively allocated
Required Title I schools to spend at least 10 percent of theirTitle I allocation on professional development
Monitored progress throughout the year toward goalsestablished in the school improvement plan
Wrote or revised the school's improvement plan
Percentage of districts
Districts with identified Title I schools
Districts with schools that missed AYP, but no history of identified schools
%
Exhibit reads: In 2003-04, 98 percent of districts with identified schools reported that they helped those schools write or revise their school improvement plan, compared with 76 percent of districts with schools that had missed AYP but were not yet identified for improvement. Note: All differences shown were statistically significant at p < .05. Source: TASSIE district survey.
B-14

Exhibit B-14 Exhibits 55 and 56 in the Report (2003-04)
1
1
1
4
9
5
22
10
21
28
55
36
2
5
12
12
13
28
34
55
<1
<1
<1
58
0 20 40 60 80 100
Reopening school as public charter school
Contract with private management company to operate theschool
State takeover
Replacing all or most school staff
Developing plans for alternative governance arrangementsfor the school
Replacing school staff relevant to failure to make AYP
Significantly decreasing management authority at the school
Reassigning or demoting the principal
Restructuring internal organization of the school
Extending school day or year
Requiring the implementation of new research-basedcurriculum
Appointing outside expert to advise the school
Percentage of districts
Districts with schools in corrective action
Districts with schools in restructuring
Exhibit reads: Among districts with schools in corrective action in 2003-04, 58 percent appointed an outside expert to advise schools in corrective action, and among districts with schools in restructuring in 2003-04, 36 percent did so with schools in restructuring. Source: TASSIE district survey.
B-15

Exhibit B-15 Exhibit 60 in the Report (2003-04)
2
3
0
0
1
24
4
33
0
0
0
36
1
12
20
22
25
43
46
<1
8
54
<1
79
18
27
16
7
5
<1
8
8
76
0 20 40 60 8
State takeover
Contracting with privatemanagement company to
operate the school
Planning for alternativegovernance arrangement for
the school
Reopening school as publiccharter school
Replacing all or most schoolstaff
Significantly decreasingmanagement authority at the
school
Replacing school staffrelevant to failure to make
AYP
Extending school day or year
Restructuring internalorganization of the school
Appointing outside expert toadvise the school
Requiring the implementationof new research-based
curriculum
Percent of schools
0
Schools Identified for 4 or more years as of 2003-04
Schools identified for 3 years as of 2003-04
Schools identified for 1 to 2 years as of 2003-04
Exhibit reads: Among Title I schools that were identified for four or more years in 2003-04, 76 percent of principals responded that the state or district had required the implementation of a new research-based curriculum; 79 percent of principals in schools identified for three years and 54 percent of principals in schools identified for one to two years gave the same response. Source: TASSIE principal survey.
B-16