Embed Size (px)
DESCRIPTION
To Determine Lower of Cost or Market. First, Determine “Market”:. Identify Replacement Cost of the Item. This is the amount you would pay to replace the item. Identify the Net Realizable Value of the Item. - PowerPoint PPT Presentation
Citation preview
To Determine Lower of Cost or Market
First, Determine “Market”:
• Identify Replacement Cost of the Item
This is the amount you would pay to replace the item
• Identify the Net Realizable Value of the ItemThis is the amount you could reasonably sell the item for in course of business, minus completion and sales costs.
• Compute Net Realizable Value minus normal profit margin
This is a floor that is computed to prevent understatement of inventory.
“Market” is the middle of these three values.
To Determine Lower of Cost or Market
Next, Determine New Inventory Value:
Compare “market” to historical cost value
Select the lower value of these two
This can be done at the individual item level, the inventorycategory level, or at the total inventory level.

Lower of Cost or Market Example
Paterno Motors has the following in inventory:
1 Ford Explorer 1 Toyota Forerunner
1 Dodge Caravan 1 4x4 tire
1 4x4 foglight kit
They also have a 20% normal profit margin above historical cost.
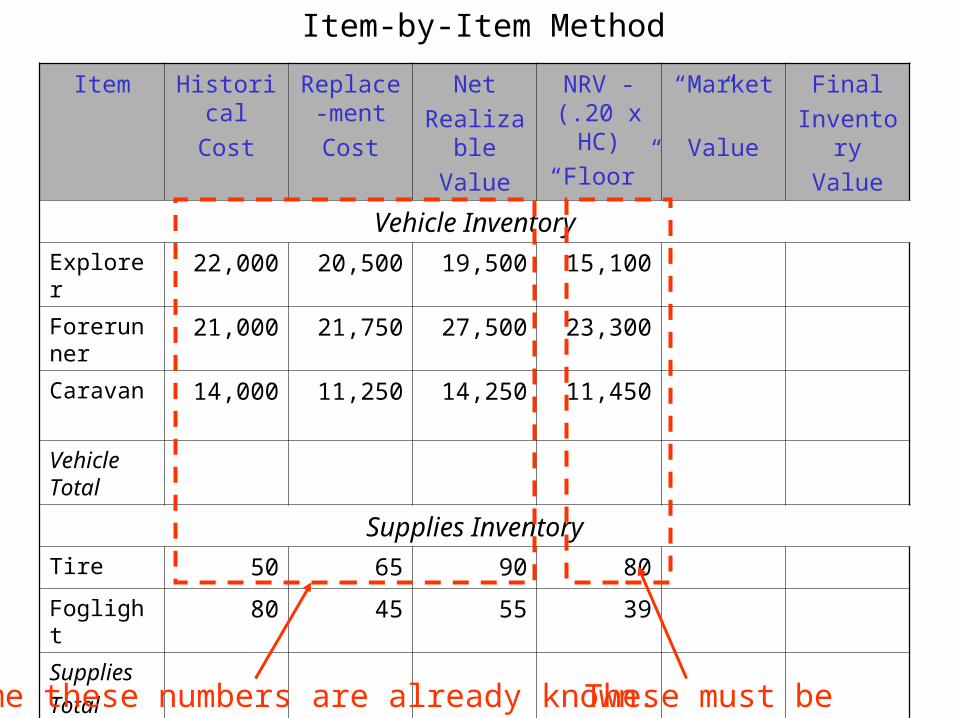
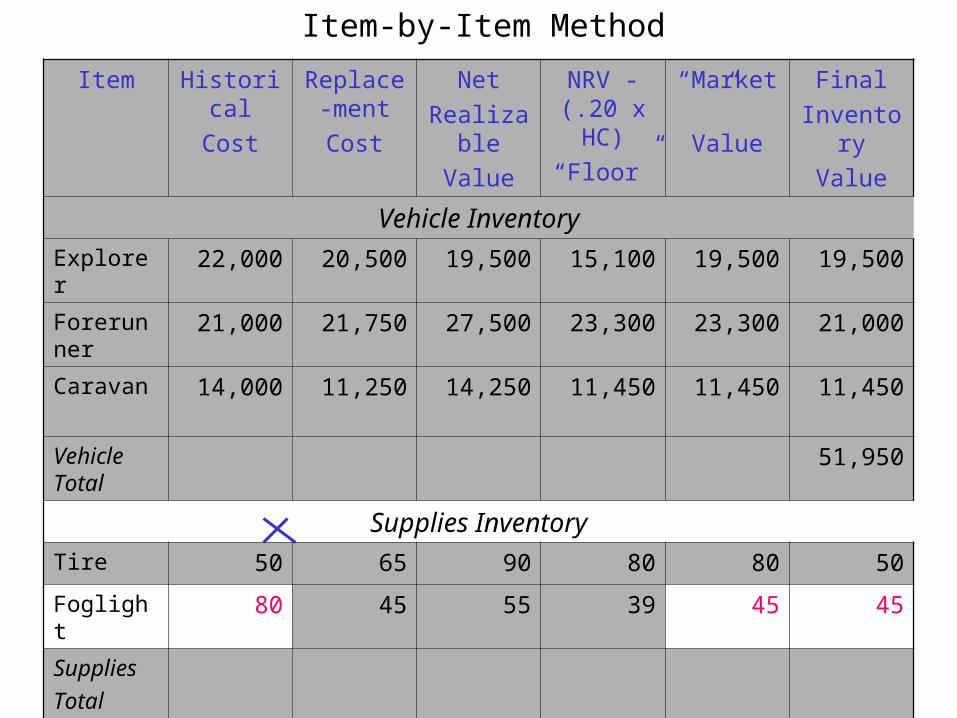
Item-by-Item Method
Item Historical
Cost
Replace-ment
Cost
Net
Realizable
Value
NRV - (.20 x HC)
“Floor”
“Market”
Value
Final
Inventory
Value
Vehicle Inventory
Explorer 22,000 20,500 19,500 15,100
Forerunner 21,000 21,750 27,500 23,300
Caravan 14,000 11,250 14,250 11,450
Vehicle Total
Supplies Inventory
Tire 50 65 90 80
Foglight 80 45 55 39
Supplies
Total
Totals
Assume these numbers are already known. These must be computed.
Item Historical
Cost
Replace-ment
Cost
Net
Realizable
Value
NRV - (.20 x HC)
“Floor”
“Market”
Value
Final
Inventory
Value
Vehicle Inventory
Explorer 22,000 20,500 19,500 15,100 19,500
Forerunner 21,000 21,750 27,500 23,300
Caravan 14,000 11,250 14,250 11,450
Vehicle Total
Supplies Inventory
Tire 50 65 90 80
Foglight 80 45 55 39
Supplies
Total
Totals
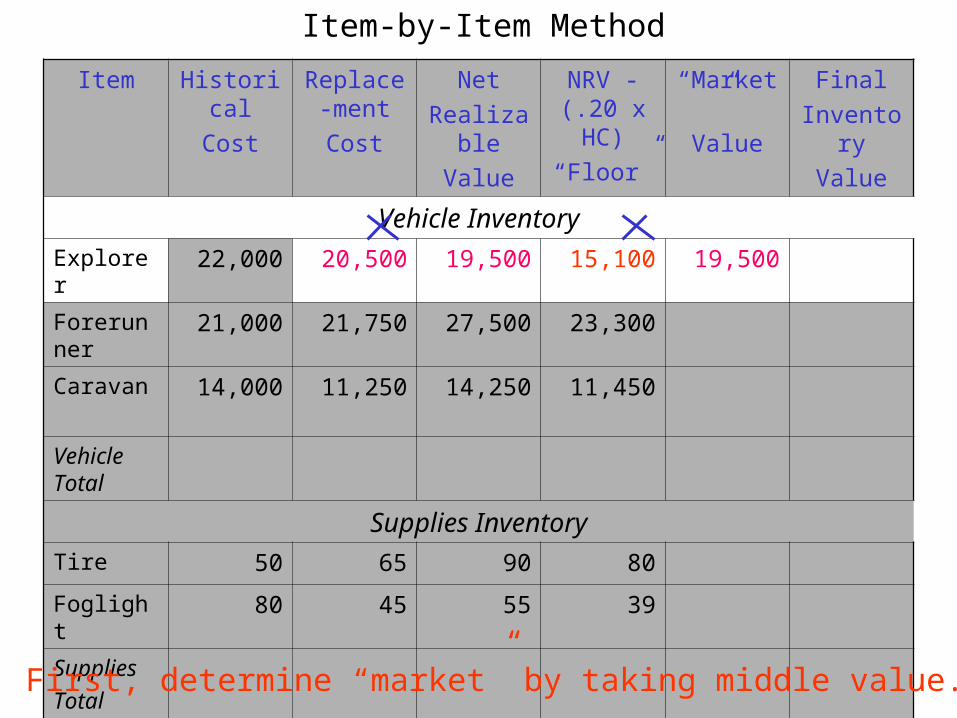
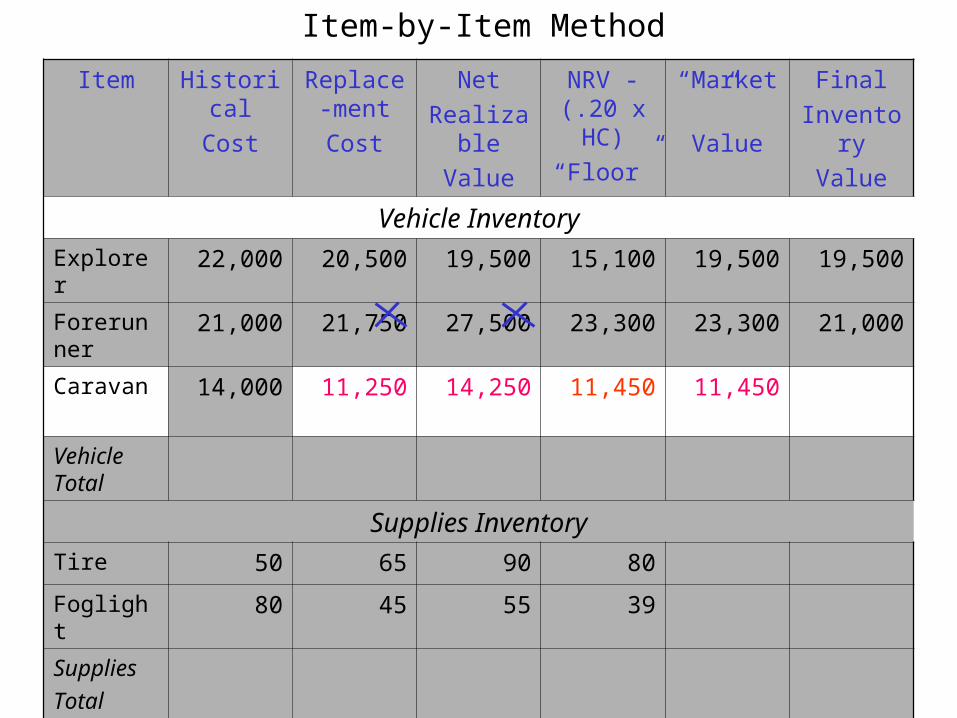
Item-by-Item Method
First, determine “market” by taking middle value.
Item Historical
Cost
Replace-ment
Cost
Net
Realizable
Value
NRV - (.20 x HC)
“Floor”
“Market”
Value
Final
Inventory
Value
Vehicle Inventory
Explorer 22,000 20,500 19,500 15,100 19,500 19,500
Forerunner 21,000 21,750 27,500 23,300
Caravan 14,000 11,250 14,250 11,450
Vehicle Total
Supplies Inventory
Tire 50 65 90 80
Foglight 80 45 55 39
Supplies
Total
Totals
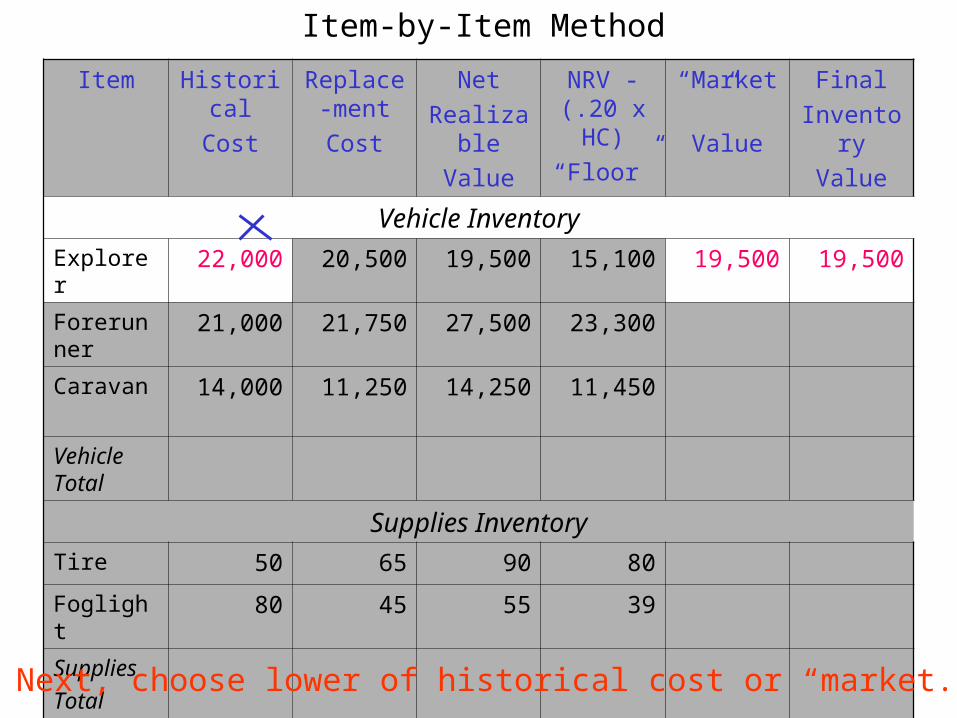
Item-by-Item Method
Next, choose lower of historical cost or “market.”

Item Historical
Cost
Replace-ment
Cost
Net
Realizable
Value
NRV - (.20 x HC)
“Floor”
“Market”
Value
Final
Inventory
Value
Vehicle Inventory
Explorer 22,000 20,500 19,500 15,100 19,500 19,500
Forerunner 21,000 21,750 27,500 23,300 23,300
Caravan 14,000 11,250 14,250 11,450
Vehicle Total
Supplies Inventory
Tire 50 65 90 80
Foglight 80 45 55 39
Supplies
Total
Totals
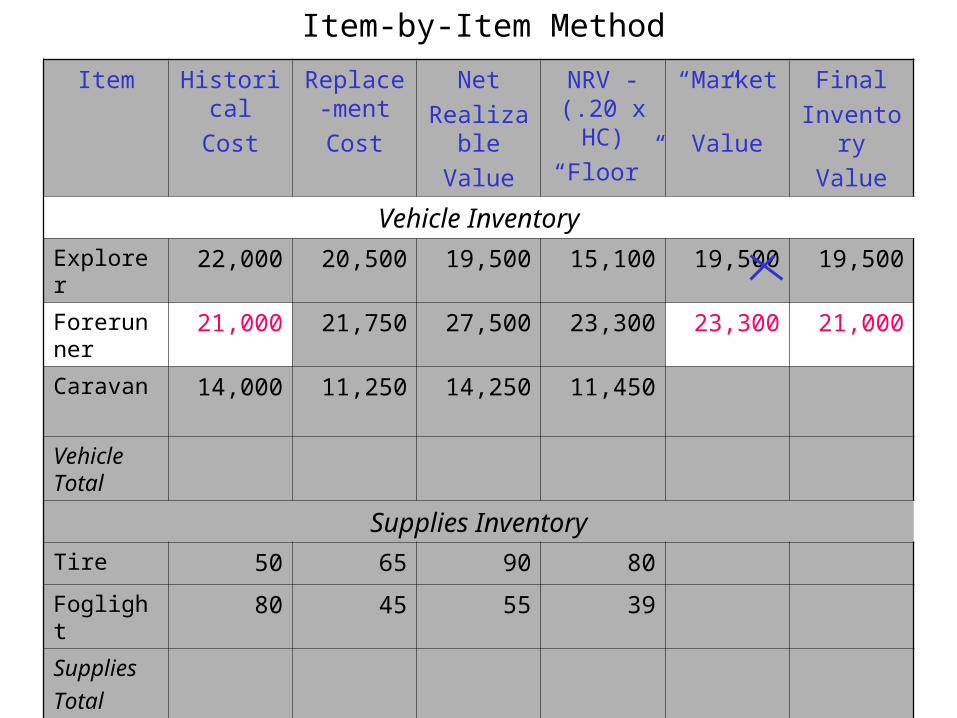
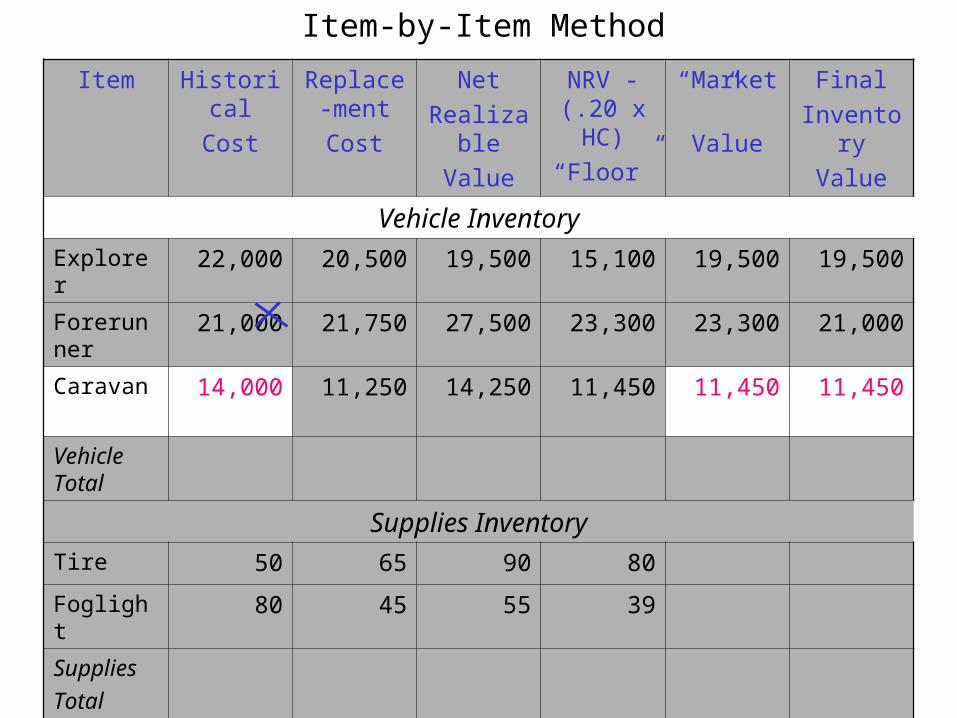
Item-by-Item Method
Do the same procedures, Item-by-Item.
Item Historical
Cost
Replace-ment
Cost
Net
Realizable
Value
NRV - (.20 x HC)
“Floor”
“Market”
Value
Final
Inventory
Value
Vehicle Inventory
Explorer 22,000 20,500 19,500 15,100 19,500 19,500
Forerunner 21,000 21,750 27,500 23,300 23,300 21,000
Caravan 14,000 11,250 14,250 11,450
Vehicle Total
Supplies Inventory
Tire 50 65 90 80
Foglight 80 45 55 39
Supplies
Total
Totals
Item-by-Item Method
Item Historical
Cost
Replace-ment
Cost
Net
Realizable
Value
NRV - (.20 x HC)
“Floor”
“Market”
Value
Final
Inventory
Value
Vehicle Inventory
Explorer 22,000 20,500 19,500 15,100 19,500 19,500
Forerunner 21,000 21,750 27,500 23,300 23,300 21,000
Caravan 14,000 11,250 14,250 11,450 11,450
Vehicle Total
Supplies Inventory
Tire 50 65 90 80
Foglight 80 45 55 39
Supplies
Total
Totals
Item-by-Item Method
Item Historical
Cost
Replace-ment
Cost
Net
Realizable
Value
NRV - (.20 x HC)
“Floor”
“Market”
Value
Final
Inventory
Value
Vehicle Inventory
Explorer 22,000 20,500 19,500 15,100 19,500 19,500
Forerunner 21,000 21,750 27,500 23,300 23,300 21,000
Caravan 14,000 11,250 14,250 11,450 11,450 11,450
Vehicle Total
Supplies Inventory
Tire 50 65 90 80
Foglight 80 45 55 39
Supplies
Total
Totals
Item-by-Item Method
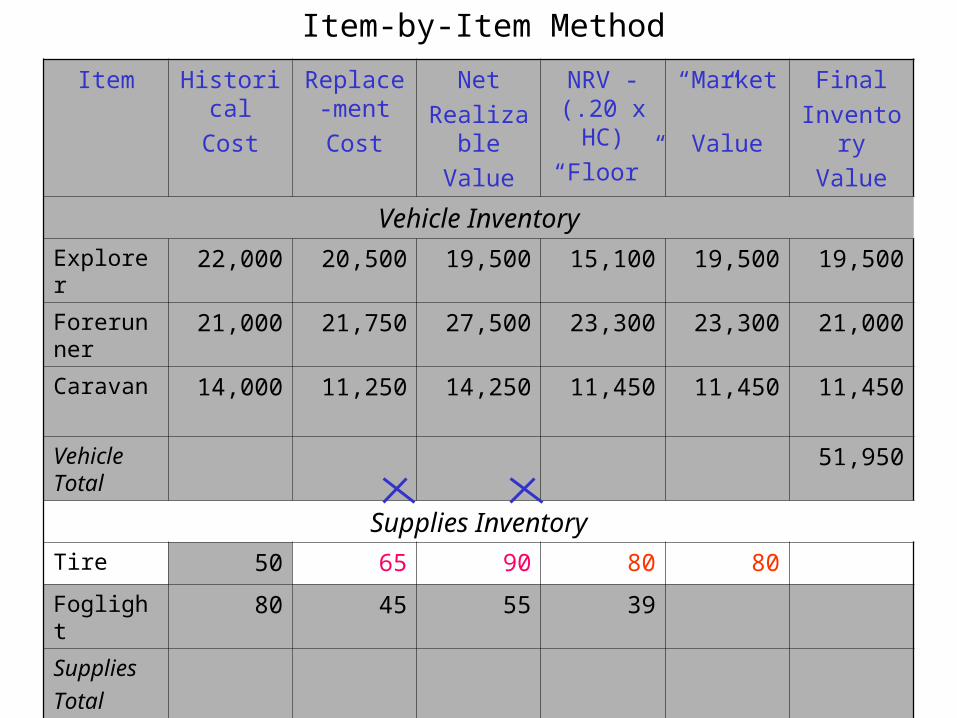
Item Historical
Cost
Replace-ment
Cost
Net
Realizable
Value
NRV - (.20 x HC)
“Floor”
“Market”
Value
Final
Inventory
Value
Vehicle Inventory
Explorer 22,000 20,500 19,500 15,100 19,500 19,500
Forerunner 21,000 21,750 27,500 23,300 23,300 21,000
Caravan 14,000 11,250 14,250 11,450 11,450 11,450
Vehicle Total
51,950
Supplies Inventory
Tire 50 65 90 80 80
Foglight 80 45 55 39
Supplies
Total
Totals
Item-by-Item Method

Item Historical
Cost
Replace-ment
Cost
Net
Realizable
Value
NRV - (.20 x HC)
“Floor”
“Market”
Value
Final
Inventory
Value
Vehicle Inventory
Explorer 22,000 20,500 19,500 15,100 19,500 19,500
Forerunner 21,000 21,750 27,500 23,300 23,300 21,000
Caravan 14,000 11,250 14,250 11,450 11,450 11,450
Vehicle Total
51,950
Supplies Inventory
Tire 50 65 90 80 80 50
Foglight 80 45 55 39
Supplies
Total
Totals
Item-by-Item Method
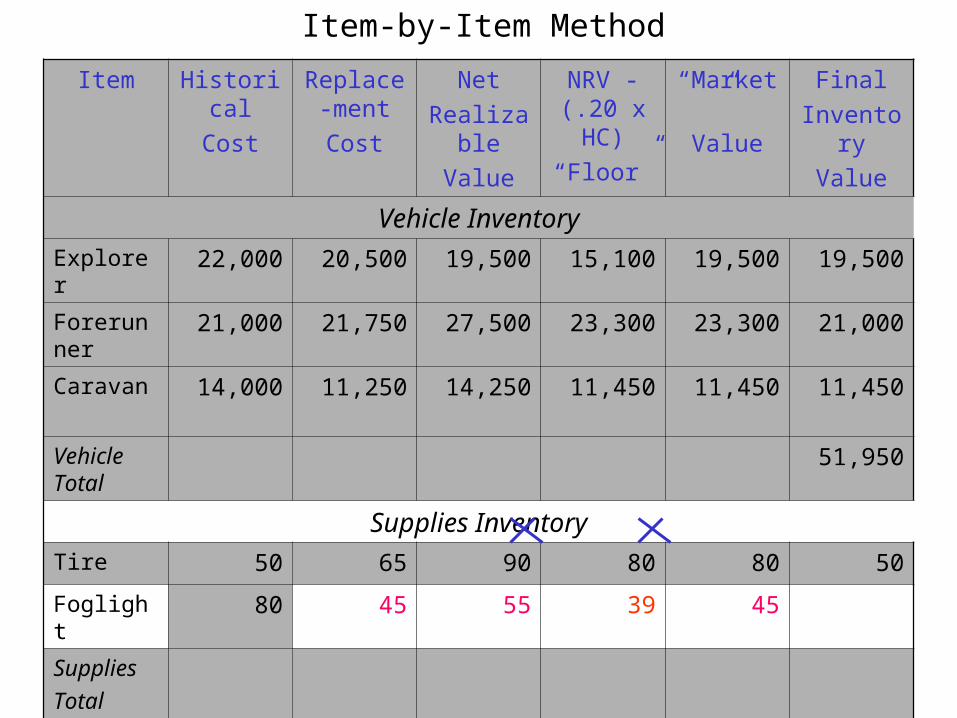
Item Historical
Cost
Replace-ment
Cost
Net
Realizable
Value
NRV - (.20 x HC)
“Floor”
“Market”
Value
Final
Inventory
Value
Vehicle Inventory
Explorer 22,000 20,500 19,500 15,100 19,500 19,500
Forerunner 21,000 21,750 27,500 23,300 23,300 21,000
Caravan 14,000 11,250 14,250 11,450 11,450 11,450
Vehicle Total
51,950
Supplies Inventory
Tire 50 65 90 80 80 50
Foglight 80 45 55 39 45
Supplies
Total
Totals
Item-by-Item Method
Item Historical
Cost
Replace-ment
Cost
Net
Realizable
Value
NRV - (.20 x HC)
“Floor”
“Market”
Value
Final
Inventory
Value
Vehicle Inventory
Explorer 22,000 20,500 19,500 15,100 19,500 19,500
Forerunner 21,000 21,750 27,500 23,300 23,300 21,000
Caravan 14,000 11,250 14,250 11,450 11,450 11,450
Vehicle Total
51,950
Supplies Inventory
Tire 50 65 90 80 80 50
Foglight 80 45 55 39 45 45
Supplies
Total
Totals
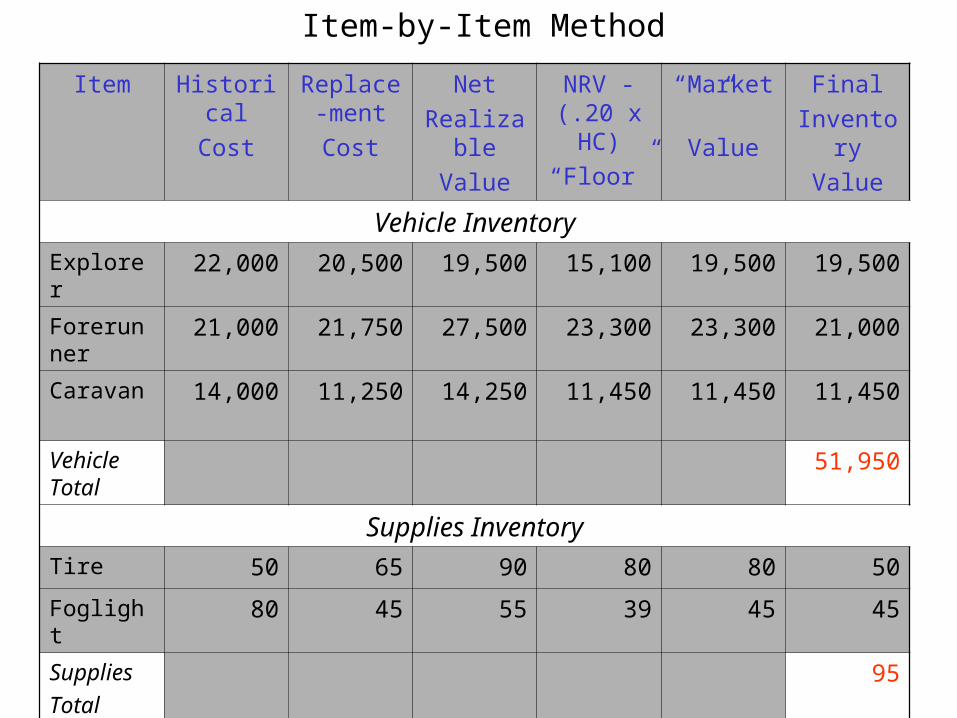
Item-by-Item Method
Item-by-Item Method
Item Historical
Cost
Replace-ment
Cost
Net
Realizable
Value
NRV - (.20 x HC)
“Floor”
“Market”
Value
Final
Inventory
Value
Vehicle Inventory
Explorer 22,000 20,500 19,500 15,100 19,500 19,500
Forerunner 21,000 21,750 27,500 23,300 23,300 21,000
Caravan 14,000 11,250 14,250 11,450 11,450 11,450
Vehicle Total
51,950
Supplies Inventory
Tire 50 65 90 80 80 50
Foglight 80 45 55 39 45 45
Supplies
Total
95
Totals 52,045
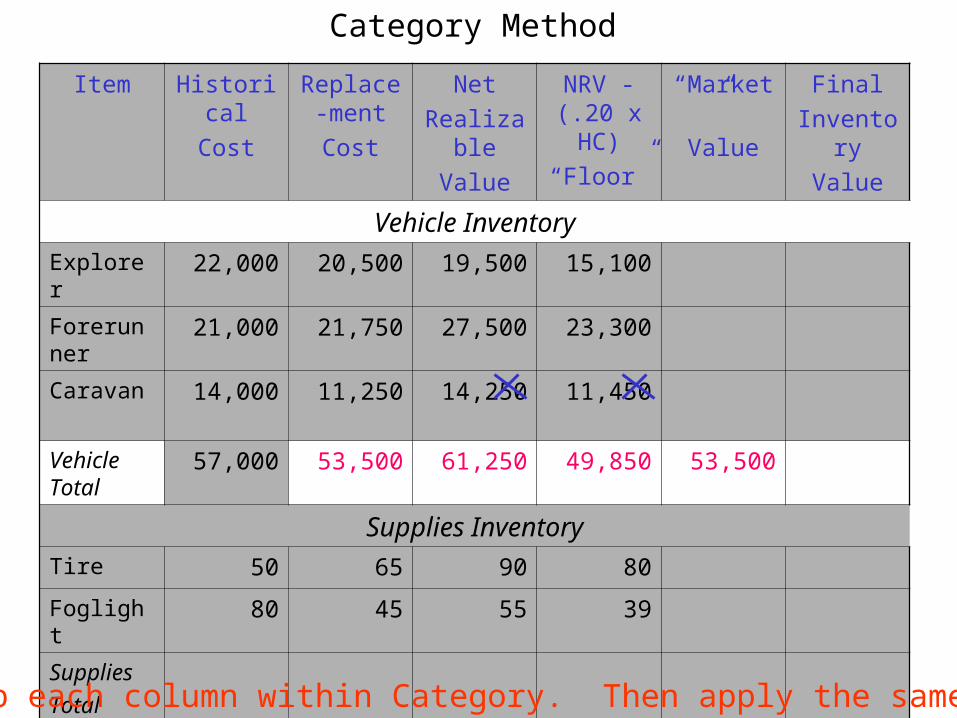
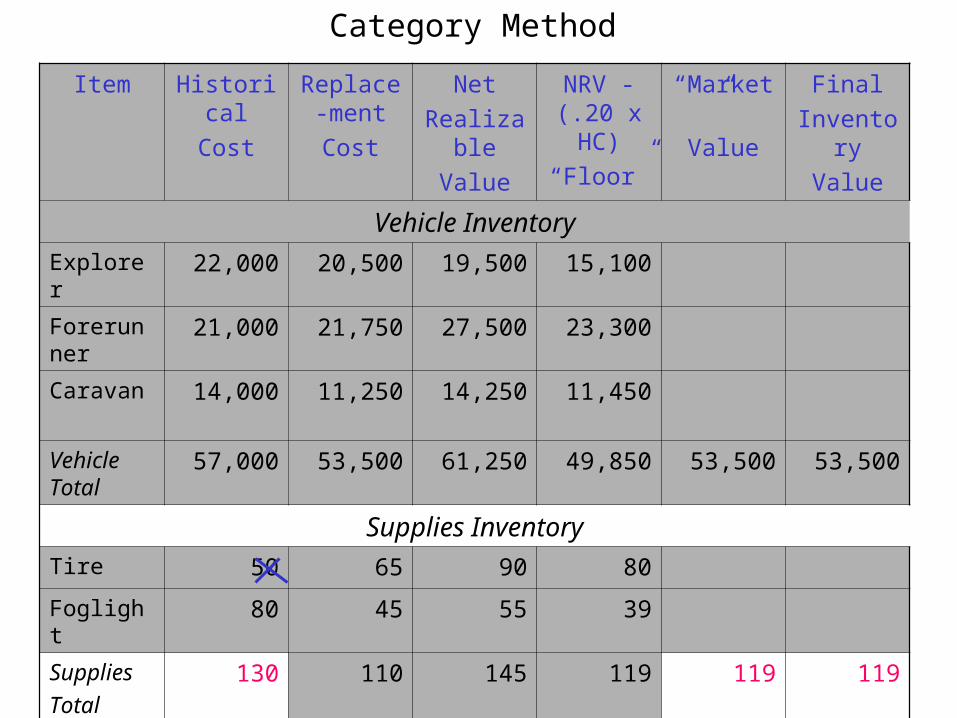
Category Method
Item Historical
Cost
Replace-ment
Cost
Net
Realizable
Value
NRV - (.20 x HC)
“Floor”
“Market”
Value
Final
Inventory
Value
Vehicle Inventory
Explorer 22,000 20,500 19,500 15,100
Forerunner 21,000 21,750 27,500 23,300
Caravan 14,000 11,250 14,250 11,450
Vehicle Total
57,000 53,500 61,250 49,850 53,500
Supplies Inventory
Tire 50 65 90 80
Foglight 80 45 55 39
Supplies
Total
Totals
Total up each column within Category. Then apply the same method.

Category Method
Item Historical
Cost
Replace-ment
Cost
Net
Realizable
Value
NRV - (.20 x HC)
“Floor”
“Market”
Value
Final
Inventory
Value
Vehicle Inventory
Explorer 22,000 20,500 19,500 15,100
Forerunner 21,000 21,750 27,500 23,300
Caravan 14,000 11,250 14,250 11,450
Vehicle Total
57,000 53,500 61,250 49,850 53,500 53,500
Supplies Inventory
Tire 50 65 90 80
Foglight 80 45 55 39
Supplies
Total
Totals
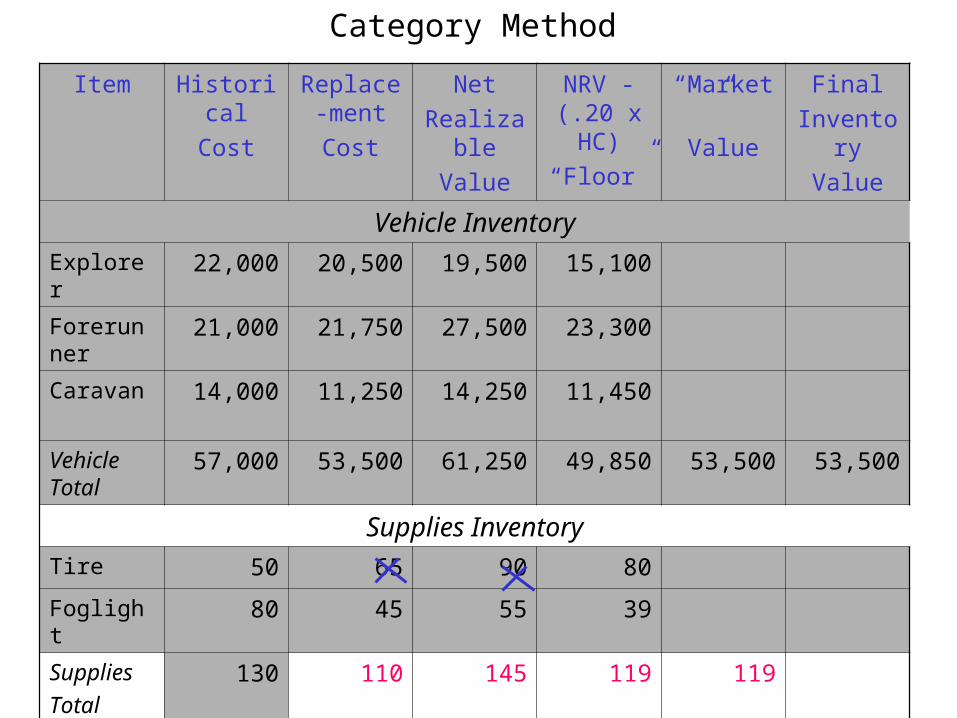
Category Method
Item Historical
Cost
Replace-ment
Cost
Net
Realizable
Value
NRV - (.20 x HC)
“Floor”
“Market”
Value
Final
Inventory
Value
Vehicle Inventory
Explorer 22,000 20,500 19,500 15,100
Forerunner 21,000 21,750 27,500 23,300
Caravan 14,000 11,250 14,250 11,450
Vehicle Total
57,000 53,500 61,250 49,850 53,500 53,500
Supplies Inventory
Tire 50 65 90 80
Foglight 80 45 55 39
Supplies
Total
130 110 145 119 119
Totals
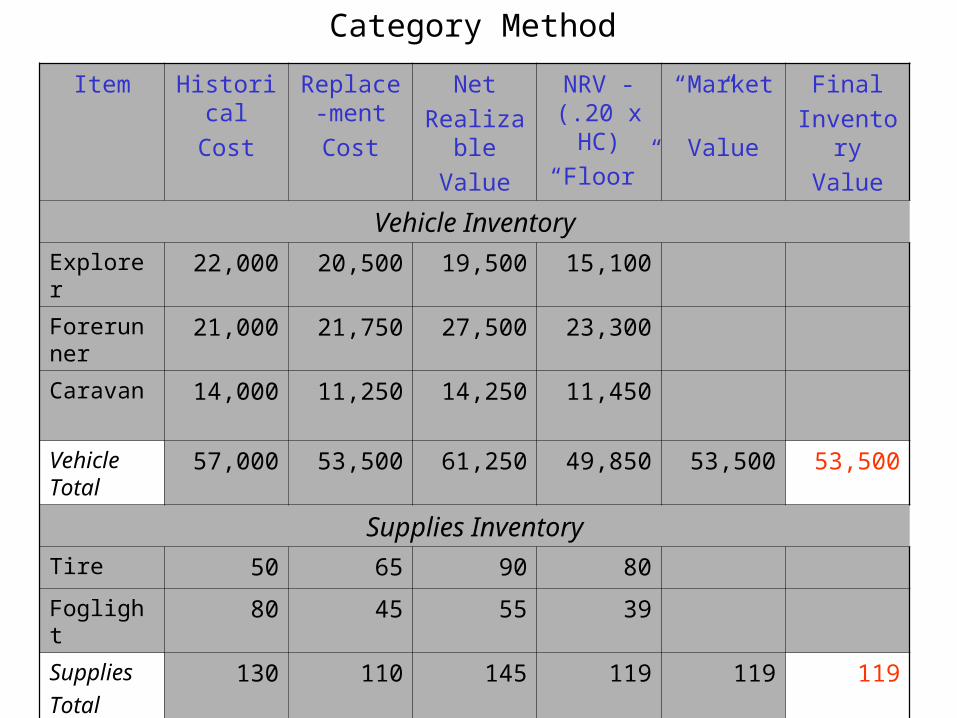
Category Method
Item Historical
Cost
Replace-ment
Cost
Net
Realizable
Value
NRV - (.20 x HC)
“Floor”
“Market”
Value
Final
Inventory
Value
Vehicle Inventory
Explorer 22,000 20,500 19,500 15,100
Forerunner 21,000 21,750 27,500 23,300
Caravan 14,000 11,250 14,250 11,450
Vehicle Total
57,000 53,500 61,250 49,850 53,500 53,500
Supplies Inventory
Tire 50 65 90 80
Foglight 80 45 55 39
Supplies
Total
130 110 145 119 119 119
Totals
Item Historical
Cost
Replace-ment
Cost
Net
Realizable
Value
NRV - (.20 x HC)
“Floor”
“Market”
Value
Final
Inventory
Value
Vehicle Inventory
Explorer 22,000 20,500 19,500 15,100
Forerunner 21,000 21,750 27,500 23,300
Caravan 14,000 11,250 14,250 11,450
Vehicle Total
57,000 53,500 61,250 49,850 53,500 53,500
Supplies Inventory
Tire 50 65 90 80
Foglight 80 45 55 39
Supplies
Total
130 110 145 119 119 119
Totals 53,619
Category Method
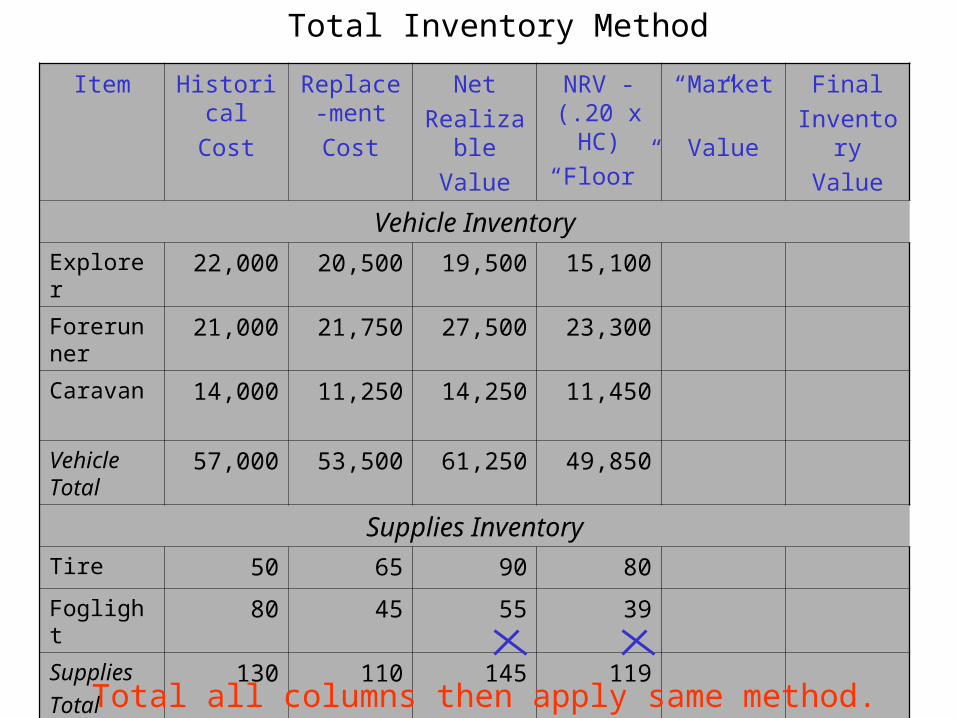
Total Inventory Method
Item Historical
Cost
Replace-ment
Cost
Net
Realizable
Value
NRV - (.20 x HC)
“Floor”
“Market”
Value
Final
Inventory
Value
Vehicle Inventory
Explorer 22,000 20,500 19,500 15,100
Forerunner 21,000 21,750 27,500 23,300
Caravan 14,000 11,250 14,250 11,450
Vehicle Total
57,000 53,500 61,250 49,850
Supplies Inventory
Tire 50 65 90 80
Foglight 80 45 55 39
Supplies
Total
130 110 145 119
Totals 57,130 53,610 61,395 49,969 53,610
Total all columns then apply same method.
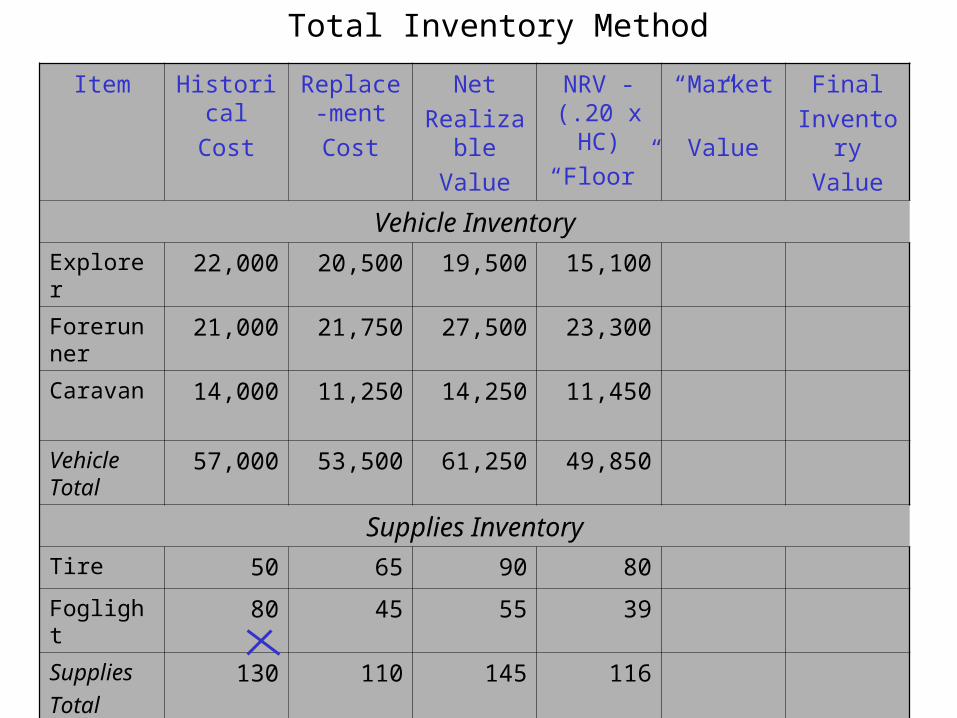
Total Inventory Method
Item Historical
Cost
Replace-ment
Cost
Net
Realizable
Value
NRV - (.20 x HC)
“Floor”
“Market”
Value
Final
Inventory
Value
Vehicle Inventory
Explorer 22,000 20,500 19,500 15,100
Forerunner 21,000 21,750 27,500 23,300
Caravan 14,000 11,250 14,250 11,450
Vehicle Total
57,000 53,500 61,250 49,850
Supplies Inventory
Tire 50 65 90 80
Foglight 80 45 55 39
Supplies
Total
130 110 145 116
Totals 57,130 53,610 61,395 49,969 53,610 53,610
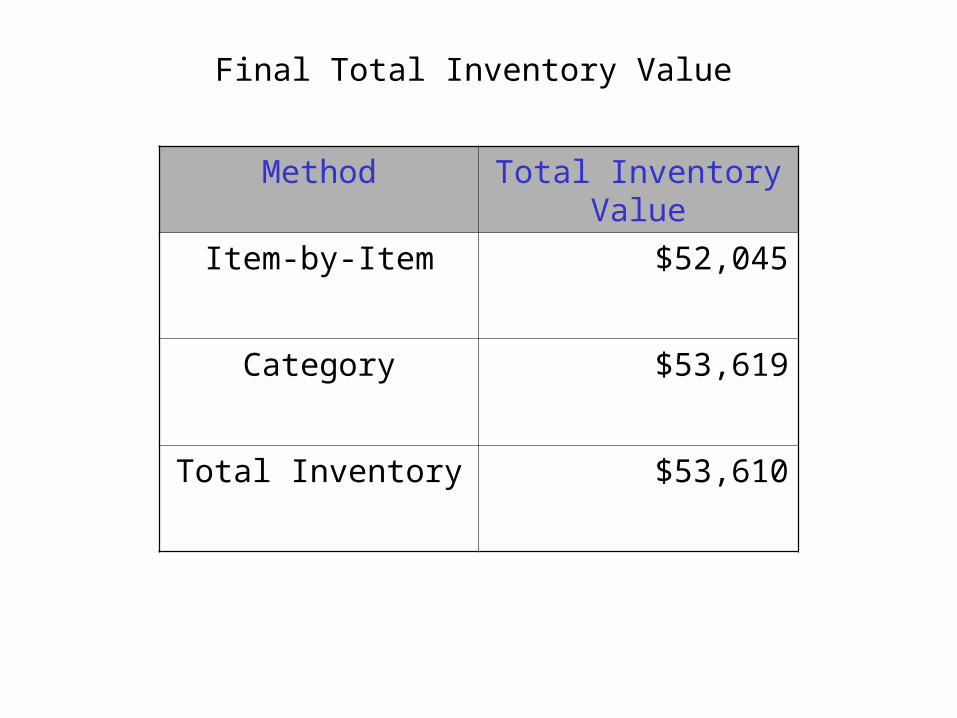
Final Total Inventory Value
Method Total Inventory Value
Item-by-Item $52,045
Category $53,619
Total Inventory $53,610
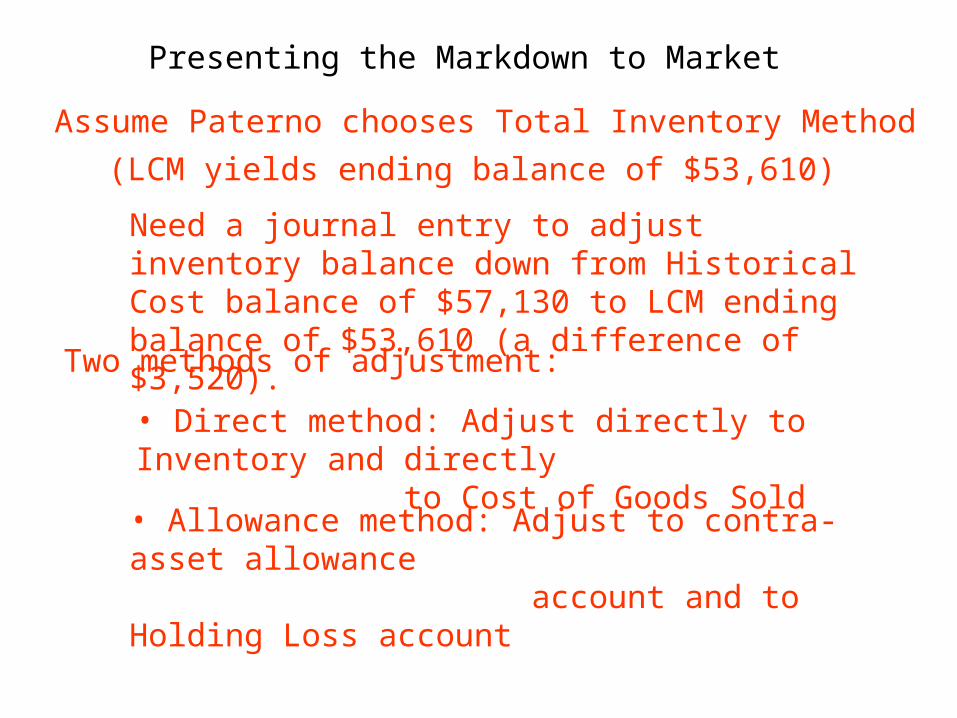
Presenting the Markdown to Market
Assume Paterno chooses Total Inventory Method
(LCM yields ending balance of $53,610)
Need a journal entry to adjust inventory balance down from Historical Cost balance of $57,130 to LCM ending balance of $53,610 (a difference of $3,520).
Two methods of adjustment:
• Direct method: Adjust directly to Inventory and directly to Cost of Goods Sold
• Allowance method: Adjust to contra-asset allowance account and to Holding Loss account

Presenting the Markdown to Market
• Direct Method:
Cost of Goods Sold 3,520 Inventory 3,520
• Allowance Method:
Inventory Holding Loss 3,520Inventory LCM Allowance 3,520
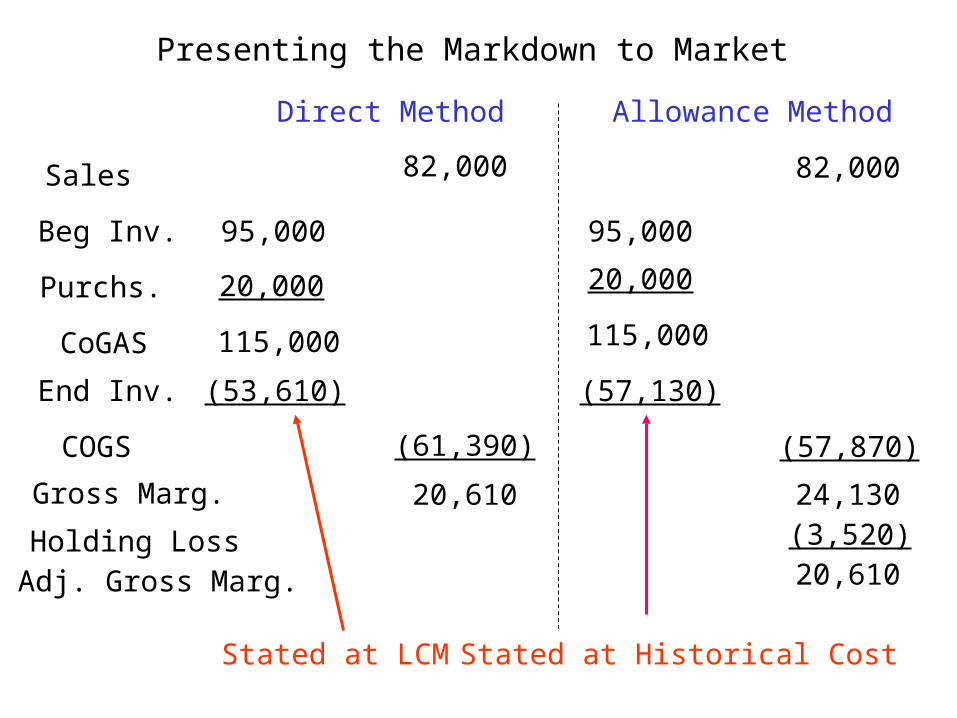
Presenting the Markdown to Market
Direct Method Allowance Method
82,000 82,000
95,000 95,000
20,000 20,000
115,000 115,000
(53,610) (57,130)
(61,390) (57,870)
Sales
Beg Inv.
Purchs.
End Inv.
CoGAS
COGS
Gross Marg. 20,610 24,130
Holding Loss (3,520)
Adj. Gross Marg. 20,610
Stated at LCM Stated at Historical Cost