Embed Size (px)
Citation preview
To: Gulf Coast Workforce Board Members
From: Mike Temple
David Baggerly
Michelle Ramirez
Brenda Williams
Date: November 28, 2017
Subj: Board Meeting Materials for Tuesday, December 5, 2017
The next meeting of the Gulf Coast Workforce Board is scheduled for 10:00 a.m., Tuesday,
December 5, 2017 in H-GAC’s second floor conference rooms A, B and C, 3555 Timmons
Lane, Houston.
We will have a light agenda for our December meeting.
Reports. Chair Guthrie will provide a report to members on items of interest.
Audit/Monitoring Committee Chair Joe Garcia will report on the committee’s November
meeting, and Education Committee Chair Birgit Kamps will discuss the committee’s recent
meeting.
Information. We will have more information on our service for individuals, businesses and
communities affected by Hurricane Harvey. We’ll also discuss briefly an outlook of what will
be coming to the Board during 2018. And as usual, we will report on our
performance/production and expenditures to-date.
We have some interesting information on the region’s employment outlook and what we can see
so far of Hurricane Harvey’s impact.
We hope that you had a safe and happy Thanksgiving holiday, and we’re looking forward to
seeing you next week.
As always, please call or email us if you have questions, or if we can be of assistance.
Tuesday, December 5, 2017 at 10:00 a.m. H-GAC Conference Room A/B/C
3555 Timmons Lane, Second Floor, Houston, Texas 77027
1. Call to Order and Determine Quorum 2. Adopt Agenda 3. Hear Public Comment 4. Review October 2017 meeting minutes 5. Declare Conflicts of Interest 6. Consider Reports
a. Chair’s Report. The Board Chair will discuss items of interest.
b. Audit/Monitoring. The Committee Chair will report on the committee’s November meeting.
c. Education. The Education Committee Chair will report on the committee’s November meeting.
7. Receive Information
a. Harvey. Update on activities related to recovery from Hurricane Harvey.
b. Performance and Production. Report on the system’s performance and production.
c. Budget and Expenditures. Report on the Board’s budget and expenditures.
8. Look at the Economy Report on current economic data and trends in the Houston-Gulf Coast region.
9. Take Up Other Business 10. Adjourn
Th
e G
ulf
Co
ast
Wo
rkfo
rce
Bo
ard
T
enta
tiv
e A
ge
nd
a
Th
e G
ulf
Co
ast
Wo
rkfo
rce
Bo
ard
T
enta
tiv
e A
ge
nd
a
A proud partner of the American Job Center network
Workforce Solutions is an equal opportunity employer/program. Auxiliary aids and services are available upon request to individuals with disabilities.
Please contact H-GAC at 713.627.3200 at least 48 hours in advance to request accommodations. Deaf, hard-of-hearing or speech-impaired customers may contact:
Relay Texas 1-800-735-2989 (TTY) or 1-800-735-2988 (Voice) or 711. Equal opportunity is the law.
Gulf Coast Workforce Board-Workforce Solutions
3555 Timmons Lane, Suite 120, Houston, Texas 77027 P.O. Box 22777 Houston, Texas 77227-2777
713.627.3200 1.888.469.5627 toll-free www.wrksolutions.com
MINUTES OF
THE GULF COAST WORKFORCE BOARD TUESDAY, OCTOBER 3, 2017
MEMBERS PRESENT:
Ray Aguilar Gerald Andrews Peter Beard Narayan Bhargava Carl Bowles Mary Helen Cavazos Joe Garcia Cheryl Guido Mark Guthrie
Bobbie Allen Henderson Alan Heskamp Eduardo Honold Guy Robert Jackson Sarah Janes John Josserand Birgit Kamps Doug Karr Jeff LaBroski
Steve Mechler Jerry Nevlud Dale Pillow Allene Schmitt Valerie Segovia Richard Shaw Gil Staley Evelyn Timmins Shunta Williams
H-GAC STAFF MEMBERS PRESENT
Mike Temple Traci Nolen David Baggerly Ron Borski Parker Harvey Mr. Mark Guthrie, Chairman, called the meeting to order at approximately 10:00 a.m., on Tuesday, October 3, 2017, in the 2nd floor, H-GAC Conference Rooms A/B/C, at 3555 Timmons Lane, Houston, Texas. Chair Guthrie determined a quorum was present.
Chair Guthrie first requested that members and guests in attendance observe a moment of silence, reflection and/or prayer for the victims of the tragedy this past weekend in Las Vegas. Next, he requested a moment of silence, reflection and/or prayer on behalf of the victims in our region affected by Hurricane Harvey. Prior to the adoption of the Agenda, Chair Guthrie welcomed new Board member Narayan Bhargava. Mr. Bhargava provided a brief introduction and was warmly welcomed by the Board.
ADOPTION OF AGENDA
Chair Guthrie asked for adoption of the agenda as presented. A motion was made and seconded to adopt the agenda. The motion carried and the agenda was adopted as presented.
Gulf Coast Workforce Board Minutes August 1, 2017 Page 2 of 12
PUBLIC COMMENT
No one signed up for public comment.
MINUTES FROM AUGUST 1, 2017 MEETING
Chair Guthrie asked for any additions or corrections to minutes for the August 1, 2017 Board meeting and if none, for approval of the minutes as presented. A motion was made and seconded to approve the minutes as presented. The motion carried.
DECLARE CONFLICTS OF INTEREST
Chair Guthrie asked for a declaration of any conflicts of interest with items on the agenda. No one declared a conflict of interest. Chair Guthrie reminded the members that they were welcome to declare conflicts with items as they are considered.
NATIONAL DISABILITY EMPLOYMENT AWARENESS
Jane Borochoff of the H.E.A.R.T. Program and Michelle Howard-Herbein of The Arc of Greater Houston spoke about efforts in the region to assist individuals with developmental disabilities into employment. Traci Nolen and Board Member Cheryl Guido provided the Board with an update on the Summer Earn and Learn initiative. This program delivered pre-employment training and paid work experience to 239 students with disabilities providing a total economic impact of almost $300,000 in subsidized wages.
CONSIDER REPORTS
Chair’s Report
Chair Guthrie reported on the state of the region following Hurricane Harvey. Current numbers indicate that 250,000 or more homes in our region suffered damage as a result of this storm. More than 500,000 vehicles were also damaged and will need to be repaired or replaced. From a private perspective, the region needs to focus on rebuilding housing and the private businesses that were damaged. He noted that many of our childcare providers operate out of their homes and were flooded and this gives rise to the needs of parents to find alternative childcare. From a public perspective, we need to focus on rebuilding our schools, colleges and public buildings that were damaged. This region has a lot of work to do. Chair Guthrie said that it would be remiss not to recognize and thank the leadership of our elected officials including Mayor Sylvester Turner and County Judge Ed Emmett as
Gulf Coast Workforce Board Minutes August 1, 2017 Page 3 of 12
well as the many other elected chief officials in our region who spent long hours on the issues created by the storm. Chair Guthrie next commended Mike Temple, Board staff and Workforce Solutions staff for their quick action in getting our Career Offices open and reaching out to those who needed assistance including putting staff in emergency shelters and visiting area community groups to educate them on Disaster Unemployment Assistance and other benefits. He noted that Board staff also established a very good webpage with much helpful information that has links not only for applying for Disaster Unemployment Assistance, but also to FEMA and other resources. Chair Guthrie also recognized contractor BakerRipley and Angela Blanchard for their leadership in quickly establishing a shelter for our residents. Chair Guthrie reported that shortly after the storm, County Judge Ed Emmett called on Ms. Blanchard and Baker Ripley to establish the shelter at NRG and Ms. Blanchard mobilized an army of thousands and worked day and night. Ms. Blanchard and the staff at BakerRipley comforted many people who would otherwise have had no place to go. Chair Guthrie also commended the leadership of Larry Temple, Executive Director of the Texas Workforce Commission and his staff. He said that Mr. Temple and his staff were on the phone with the Department of Labor immediately after the storm securing what has become a $30 million dollar payment from the Department of Labor to the State in Disaster Unemployment Assistance. He noted that staff in this meeting will report on how our share of that money will be used in our region. Chair Guthrie reported that Bob Harvey and the staff of The Greater Houston Partnership reached out to businesses immediately asking what their needs were, and said that he appreciated those efforts as well as those of Peter Beard and similar efforts by Gil Staley in Montgomery County. Chair Guthrie observed that most if not all of us have, in some way, been touched by Harvey. He said we have volunteered, donated money, had personal losses and/or had our lives disrupted and we all deserve a pat on the back for how we have responded. He noted that Texas is an example to the world of resilience and we will come back. Chair Guthrie reported that last week, he, Mike Temple and several Board Members attended a round table discussion of leaders (business, education, labor and community based organizations) convened by the Tri-Agency Commission about what the members of the Commission would do to respond to Hurricane Harvey. The Tri-Agency Commission is the joint the effort of the Texas Education Agency, Texas Higher Education Coordinating Board and the Workforce Commission. He reported that some good ideas came from that discussion and we are working together to implement strategies to put people back to work. Chair Guthrie reported that, on the national front, the federal government has approved a continuing resolution to fund the government through the end of the year. This will keep
Gulf Coast Workforce Board Minutes August 1, 2017 Page 4 of 12
our funding for programs in place at least through the end of the year. He said that we can also expect more funding for disaster relief. Chair Guthrie reported that later in the week, he will attend the quarterly Board Meeting of the National Association of Workforce Boards in Washington. He will provide a report of items of interest from that meeting at our next meeting. Chair Guthrie reminded the Board that the Red, White & You veterans’ job fair will take place on November 9th from 9:00am to 2:00 pm at Minute Maid Park. He also noted White Cane Day is scheduled for October 19th at City Hall and said that this is a great event focusing on people with visual disabilities. Doug Karr invited everyone to the Greater Houston Business Leadership Network’s quarterly symposium on Wednesday, November 1st at 8:00am at the Lone Star College System office at 5000 Research Forest Drive. Discussions at this free event will focus on the inclusion of veterans and those with disabilities within business organizations. Dr. Sarah Janes remarked that San Jacinto College was invited to participate in a Tri-Agency conference call which was led by the Higher Education Coordinating Board. She inquired whether there is a timeline for distributing a plan based on the roundtable discussions. Chair Guthrie replied that he has encouraged quick use of the state’s rainy day funds in the Tri-Agency roundtable discussions, but does not know of a specific timeline for a plan. Mike Temple commented that Workforce staff is committed to try to get together with all of the training providers in the region within the next 30 days to talk about what is available already in terms of accelerated training, what present needs are, and how individuals can access this training. Providers are already in place within the region. Chair Guthrie concluded his report and no action was taken.
Audit/Monitoring Committee Report
Committee Chair Joe Garcia reported that the Audit/Monitoring Committee met on Monday, September 25 to receive the following report covering activity across the region.
• Employer Service. The staff’s regional monitoring team recommended improvements to communication and sharing of information among Employer Service and the rest of the system. During review, the team also noted a potential conflict of interest with the contractor, Employment and Training Centers, Inc., also operating a private staffing business. ETC has agreed to ensure that (1) staff funded by the Board do not work on or support the private business, (2) staff funded by the Board are physically separated from the private business, (3) funds provided by the Board do not support in any way the operation of the private business, (4) overhead costs for ETC are appropriately and accurately allocated between the Employer Service contract and the private business. We will continue to check on this throughout the year. Financial monitoring disclosed concerns with cost allocation, expenditure disbursements and financial reporting,
Gulf Coast Workforce Board Minutes August 1, 2017 Page 5 of 12
as well as less than $2,500 in questioned costs. ETC has addressed our concerns and repaid questioned costs.
• Career Offices. The regional monitoring team found general improvement in office operations this past year. The team also identified opportunities to increase the number of direct hires and better achieve performance targets. The team noted a need to improve documentation for financial aid and complaints and recommended that the Wharton office expand its community presence and the Northeast, Southeast and Southwest offices improve customer service.
• Financial Aid. The regional monitoring team recommended the Payment Office move vendor records/files from paper to electronic files and improve the payment process to ensure vendors are paid within 30 days of invoice.
• Youth and young adults. In general, the regional monitoring team noted a need for the career offices to improve their efforts to attract and serve young people, and a need for the offices and the special project contractors to ensure employment plans were complete and updated regularly and to ensure follow-up was available to customers.
• Early Education. Our early education quality providers continue to provide a valuable service to providers and support them with training offerings, enrollment in education and equipment grants to support quality. Collaborative for Children is instrumental in our region’s ability to identify local matching resources that bring the maximum amount of federal dollars to our area for early education.
• Adult Education. Production for the adult education consortium has improved over the year. The regional monitoring team noted fewer errors in eligibility and assessment. Brazosport College is close to meeting all performance targets and Harris County Department of Education is rated as ‘Strong Performance’. Both Lone Star College and Wharton County Junior College showed improvement and Region 6 is embracing its role as lead for the consortium. Region 6’s financial review found two minor issues, both of which Region 6 addressed.
Chair Garcia concluded his report and no action was taken.
Government Relations Legislative Update
Committee Chair Guy Robert Jackson reported that the special session of the Texas Legislature ended on August 16, 2017. Of the bills we were tracking, there were none that directly impacted Workforce. Chair Jackson said that he will continue to monitor activities in the Texas Legislature and Congress. Chair Jackson concluded his report and no action was taken.

Gulf Coast Workforce Board Minutes August 1, 2017 Page 6 of 12
TAKE ACTION
a. Request approval of plan to integrate $10.531 million of workforce disaster
assistance funds in to Workforce Solutions operations.
Mike Temple provided the Board with an update on National Dislocated Worker Funds made available to Texas immediately following Hurricane Harvey’s landfall in late August. These dollars provide temporary jobs, financial aid, and limited training for individuals who lost jobs or were out of work because of the hurricane. The Board has previously used national workforce disaster recovery funds following Tropical Storm Allison in 2001 and Hurricane Ike in 2008.
Current Situation
The Texas Workforce Commission has made an initial allocation of $10,531,000 to our region. This represents about 30% of the $30 million total allotment to the state. We can request additional funds if demand warrants. To be eligible for assistance with these dollars, an individual must have lost a job because of the hurricane, or in some instances, be long-term unemployed. Temporary workers can be employed in clean-up and recovery jobs that include: (1) clean-up, demolition, repair, renovation and reconstruction of public structures, buildings, facilities and lands; (2) clean-up and repair of public roads; (3) any clean-up or repair work normally carried out by local government employees; and (4) in some instances, the direct delivery of humanitarian assistance to individuals affected by the hurricane. These funds cannot be used to fund temporary jobs involved in the clean-up or repair of private homes or businesses. Board staff proposes using funds as follows:
1. Contact local governments in the 13-county region to solicit need and identify projects for temporary workers.
2. Identify individuals interested in temporary jobs, determine them eligible, and refer them to projects through the Workforce Solutions career offices.
3. Employ temporary workers at project sites through staffing firms available on the list compiled by H-GAC’s Cooperative Purchasing program.
4. Provide OSHA-rated safety training for temporary workers involved in clean-up, repair, and rebuild activities prior to their beginning work.
5. Offer financial assistance and training as needed for individuals in temporary jobs and other dislocated workers as appropriate.
Board Member Richard Shaw inquired whether Board Staff can confirm that the staffing agency will ensure that funds provided will be passed through to the workers. Mike Temple confirmed that the staffing agency being proposed has been procured
Gulf Coast Workforce Board Minutes August 1, 2017 Page 7 of 12
through H-GAC’s cooperative purchasing program and that close monitoring will be in place. He also confirmed that the wages paid to workers in the temporary jobs will be prevailing wages. Board Member John Josserand asked whether the OSHA safety training provided to temporary workers would be a transferable skill. Mr. Temple confirmed that the training will be transferable and able to be built upon. Board Member Jeff LaBroski asked if the wages will be monitored and if certified payrolls will be requested. Mike Temple confirmed that Staff will monitor wages and request certified payrolls. Board Member Evelyn Timmons asked for confirmation that local workers will be targeted for these temporary positions. Mike Temple confirmed that these jobs are for local residents who have lost jobs because of the storm.
Action
Authorize Board staff to use national dislocated worker recovery assistance funds as described above. A motion was made and seconded to approve the plan as presented. The motion carried and no further action was taken.
RECEIVE INFORMATION
a. Harvey. Update on activities related to recovery from Hurricane Harvey.
Mike Temple provided a report on the status of Workforce Solutions offices post-Harvey. He informed the Board that Workforce Staff is trying to be aware and in as many places as possible to provide as much information and service as we possibly can. If any Board Member is aware of community events or a need for Workforce Solutions to be onsite or talk to people about Disaster Unemployment Assistance, jobs, access to FEMA or SBA assistance, please let us know.
b. Performance and Production. Report on the system’s performance and
production.
Mr. David Baggerly reviewed the Performance measures for October 2016 through August 2017. Board Measures for Workforce Solutions We provided services to 19,000 employers through August and about 50% of the employers we provided services to in the prior year have come back for additional services.
Gulf Coast Workforce Board Minutes August 1, 2017 Page 8 of 12
More and Better Jobs Approximately 2,500 new jobs were created as an average over a two year period and 77% of the customers to whom services were provided through September 2016 were employed by the quarter after exit. Higher Real Incomes Through March 2016 you will see a dip from the prior year. The timeframe we are looking at includes the year we were hit the hardest with the downturn in the oil economy. We were able put people to work, but not at jobs that were paying what we expected them to pay. A Better Educated Workforce Of the individuals that we were helping to get a certificate or a degree, 65% have done so through June of this year. Production We are meeting or exceeding the target for 15 of 18 state production measures. The 3 we are not meeting are:
• Number of Employers Receiving Workforce Assistance: The annual target for this measure is 26,235. We provided services to 19,124 employers from October 2016 through August 2017.
• Median Earnings Q2 Post Exit – Dislocated Worker: The target for this measure is $6,980. Our performance for customers who exited from July 2015 through June 2016 was $6,573.
• Credential Rate – Dislocated Worker: The target for this measure is 66.6%. Our performance for customers who exited from January 2015 through December 2015 was 61.9%.
We have done very well on adult education measures for the period July 2016 through June 2017. One area that we are working to improve is the “Integrated English Language and Civics Education” combination. Mr. Baggerly concluded his report and no action was taken.
c. Budget and Expenditures. Report on the Board’s budget and expenditures.
Mr. Mike Temple reviewed the Financial Status Report representing expenses for the eight months ending in August. We are running a little high on our financial aid expenses, but we will not spend more money than we have at the end of the year. We will work with Chair Alexander to schedule a Budget Committee meeting before the end of the year. This budget does not include the $10.5 million that was just approved. Mr. Temple concluded his report and no action was taken.
Gulf Coast Workforce Board Minutes August 1, 2017 Page 9 of 12
LOOK AT THE ECONOMY
Mr. Ron Borski presented a look at the current economy. We do not have any data that includes the effects due to Hurricane Harvey. The report included in the package is for the month of August. Both the State and our local unemployment went up in August and the national rate went down. On a positive note, there were approximately 17,000 people less who were unemployed this August compared to a year ago. Over the year job growth had been on the rise and peaked in June at 1.9% with July and August having settled out at 1.8% which is still higher than the nation. We may see it dip more as rates are affected by Hurricane Harvey in the near future. On an overall basis, we are at 14.8% above the prerecession high compared with 6% at the national level. We lost approximately 3,900 jobs in August. Typically, we add a few jobs but see declines in Government related to schools not being back in session. This August we had a few things that would indicate some additional slowing. Manufacturing had been on a strong roll but reported its first loss since last November. Retail Trade, which usually gains a few thousand jobs in August, lost a few jobs. The Professional and Business Services category reflects a decline due to a decline in Employment Services. This was the first loss for Employment Services since January. Leisure and Hospitality had a weak month and experienced their first decline for August in 3 years. Over the year our fastest rate of job growth is in Manufacturing. This is tied to Durable Goods Manufacturing. Next is Education and Health Services which is one of the areas driven by population growth in our region. Then we have Professional and Business Services with Employment Services jobs responsible for growth in that area. Some things that drive Manufacturing as well as Employment Services are Oil and Gas Exploration and Production. In July we peaked at a total rig count of 953. As of August, this number dropped to 947 and, as of last month, the average was 940. Board Member Doug Karr asked if there will be a way to track Workforce allocation funds and FEMA jobs which tend to pay a little more than average. Mr. Karr expressed that employers are concerned about current employees leaving for these jobs. Will we be able to track the funds that are available when we fill these jobs and will we be taking away from current jobs that area already filled? Chair Mark Guthrie responded that we are targeting people who became unemployed because of the storm for these jobs. Mike Temple added that, in order to be eligible for the temporary jobs, workers have to be unemployed. We will be watching the wage payments very carefully. Each week in the past couple of weeks we have had close to 1,500 openings available in our job bank for a variety of jobs. Our temporary jobs project is a drop in the bucket. Mr. Borski concluded his report and no action was taken.
Gulf Coast Workforce Board Minutes August 1, 2017 Page 10 of 12
Parker Harvey provided a Hurricane Harvey special report looking back at the impact of hurricane Ike on the Gulf Coast Labor Market. In the month since Hurricane Harvey hit the region one aspect of the storm that has not been fully analyzed is the job market. Due to Hurricane Harvey making landfall in late August 2017, any initial negative impacts on employment will remain unknown until September. Current Employment Statistics (CES) estimates are released in late October. Furthermore, any rebound will not become apparent until October’s data are released in November. Until then, it is instructive to examine labor market dynamics in the wake of the last major storm to hit the region: Hurricane Ike, which occurred in September 2008. Other relatively recent storms such as Tropical Storm Allison (2001) and Hurricane Rita (2005) displayed varying degrees of impact on the Gulf Coast labor market. However, by comparison the effects of Hurricane Ike were more clearly identifiable. Furthermore, the size of the Gulf Coast labor market in 2017 is more comparable to 2008 than either 2005 or 2001, and thus examination of trends due to Hurricane Ike are likely to provide the most useful insights into what we can expect from Hurricane Harvey. In September 2008, the Houston metropolitan area shed -21,900 jobs over the month. That is the only September that we have ever lost jobs in the history of the data series. Prior to that, the Houston area averaged a gain of 7,100 jobs each September, highlighting the disruption that Hurricane Ike had on local employment. Even national economic downturns impacting Houston in 1992 and 2009 did not result in over the month declines in employment though job growth was especially low with only 500 and 600 jobs added, respectively. All sectors except Government lost jobs in September 2008. This is the only instance where this has occurred in the month of September since records began in 1990. It is likely that the 15,400 jobs added to Government payrolls was the result of the school year having already begun roughly one to two weeks prior to Hurricane Ike making landfall on September 13th. Hurricane Harvey struck just prior to the start of the 2017/2018 school year and in some cases delayed the start of the academic year until the middle of September 2017. This could result in relatively muted job growth in Government employment for September. As for the sectors that saw declines in September 2008, job losses were concentrated among three of the largest service sectors in the region: Leisure and Hospitality, Trade Transportation and Utilities, and Professional and Business Services. At the time, these sectors combined accounted 44 percent of jobs in the region however they comprised two-thirds of losses indicating a disproportionate impact due to the storm. Several sectors that saw job losses in September 2008 typically experience seasonal declines each September. Therefore, one might question whether the losses that appear to coincide with Hurricane Ike were simply the result of normal seasonal trends. In short, the answer is no. Leisure and Hospitality shed -10,000 jobs that month compared to an average of -3,200; Trade, Transportation, and Utilities lost -7,500 jobs versus a more typical -1,100; and Professional and Business Services declined by -6,900 whereas the average loss prior to September 2008 was -400 jobs. For all three sectors, these declines
Gulf Coast Workforce Board Minutes August 1, 2017 Page 11 of 12
were also the largest on record for the month of September and in the case of Leisure and Hospitality, the single-largest decline of all time regardless of month. Lastly, given that Construction becomes an integral part of future recovery efforts after any natural disaster, it is worth noting that it too was impacted more than expected by the hurricane given its loss of -2,300 jobs. This remains Construction’s largest September decline on record compared to an average gain of 600 jobs in the month of September. As noted, Leisure and Hospitality, Trade Transportation and Utilities, and Professional and Business Services were disproportionately impacted by Hurricane Ike’s disruptive effects. In terms of compensation, these subsectors tend to provide below average hourly pay rather than annual salaries. In the third quarter of 2008, average hourly wages across all industries stood at $25.08. Accommodation and Food Services paid $7.90 an hour, while Retail Trade paid $12.88 an hour and Administrative and Waste Services provided the highest hourly rate of the three subsectors at $18.00 an hour. In other words, workers in industries with some of the lowest wages and variable work schedules were more likely to be laid-off due to the storm than workers in other industries. In contrast to the sector employment impacts observed in September 2008, the effects of Hurricane Ike on the unemployment rate did not manifest themselves until October. In October 2008, the not-seasonally-adjusted unemployment rose 0.1-percentage point over the month. Prior to that, the unemployment could be expected to decline on average by 0.3-percentage points. While overall employment rose in October 2008, three sectors continued to lose jobs, most notably Leisure and Hospitality. This sector experiences seasonal job losses each October in a continuation from September. In 2008 Leisure and Hospitality lost -1,200 over the month. The average decrease in October prior to that year was -2,600, which implies that losses were somewhat less than expected. The most notable rebounds in October 2008 were in Professional and Business Services and Construction. As part of post-Hurricane Ike recovery efforts, Construction rallied strongly in October 2008, up 5,000 jobs over the month and nearly double the number of jobs lost in September. At the time, this was the largest increase on record in the month of October compared to an average of 1,600 jobs. Domestic Net Migration in 2008 for the entire 13-County Gulf Coast Region was 36,377, which rose to 49,122 in 2009. Other large population counties in the region such Brazoria, Fort Bend, Montgomery also failed to show any net domestic out migration with the exception of Galveston, which in 2009 saw a net loss of -4,285 residents. As mentioned, the effect of the Gulf Coast’s most recent weather-related disaster, Hurricane Harvey, will not be known until September 2017 data are released in October, at the earliest. November data will likely provide further confirmation of trends while a definitive assessment will only be possible after annual benchmark revisions in 2018 and 2019. In the interim, a review of labor market impacts immediately following Hurricane Ike in 2008 may provide insights into what can be expected although the Great Recession
Gulf Coast Workforce Board Minutes August 1, 2017 Page 12 of 12
diminished comparability beyond the initial few months. It should be kept in mind however that overall employment in the region has grown significantly since 2008. Leisure and Hospitality alone is 43 percent larger in 2017 than in 2008. Professional and Business Services is 22 percent larger and Trade, Transportation, and Utilities is 13 percent larger. The growth in these sectors coupled with more extensive damage to infrastructure across the entire 13-county region has the potential to amplify the dislocation of workers. This could, in turn, lead to many of the employment and unemployment records set during Hurricane Ike being broken.
OTHER BUSINESS
Ray Aguilar shared concerns about purchase of new and used vehicles following Harvey. He advised buyers to purchase from a dealer who provides an extended warranty for 6 months to a year following purchase since flood related issues could take several months to appear. Board Member Richard Shaw expressed thanks to Mike Temple and the Workforce Staff for their support with Disaster Unemployment Assistance. There was no other business to be brought before the Board.
ADJOURN
Chair Guthrie adjourned the meeting at approximately 11:35 a.m.
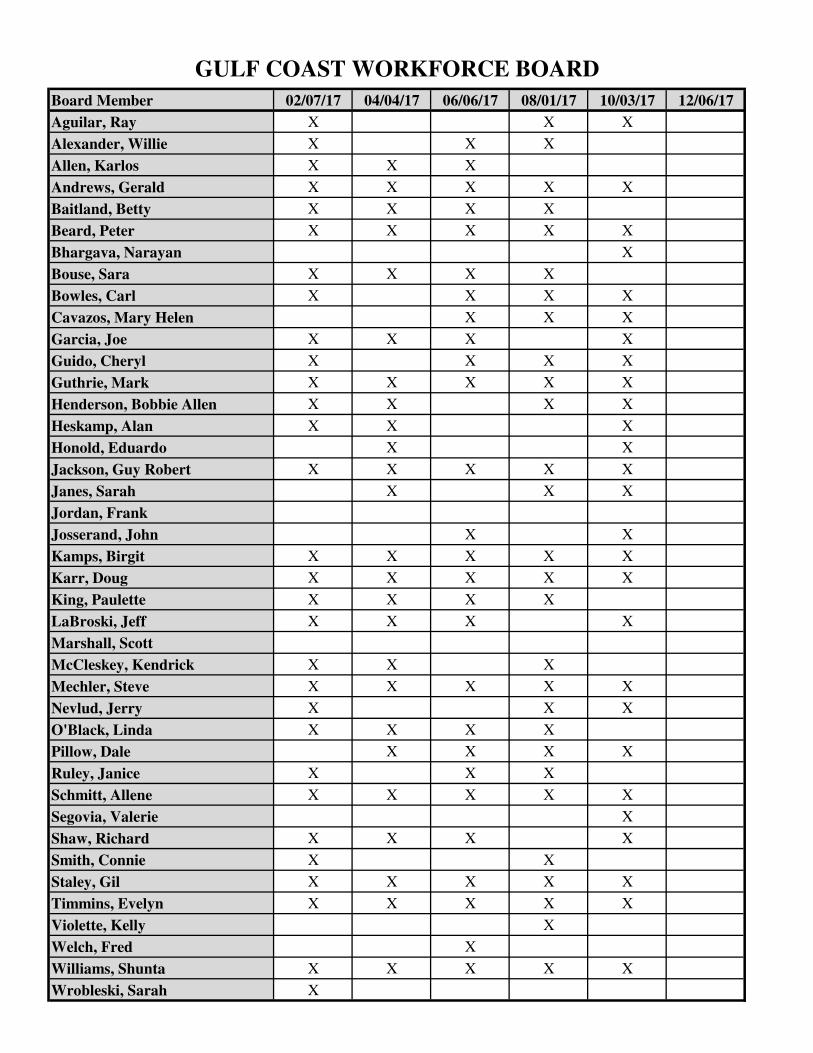
Board Member 02/07/17 04/04/17 06/06/17 08/01/17 10/03/17 12/06/17
Aguilar, Ray X X X
Alexander, Willie X X X
Allen, Karlos X X X
Andrews, Gerald X X X X X
Baitland, Betty X X X X
Beard, Peter X X X X X
Bhargava, Narayan X
Bouse, Sara X X X X
Bowles, Carl X X X X
Cavazos, Mary Helen X X X
Garcia, Joe X X X X
Guido, Cheryl X X X X
Guthrie, Mark X X X X X
Henderson, Bobbie Allen X X X X
Heskamp, Alan X X X
Honold, Eduardo X X
Jackson, Guy Robert X X X X X
Janes, Sarah X X X
Jordan, Frank
Josserand, John X X
Kamps, Birgit X X X X X
Karr, Doug X X X X X
King, Paulette X X X X
LaBroski, Jeff X X X X
Marshall, Scott
McCleskey, Kendrick X X X
Mechler, Steve X X X X X
Nevlud, Jerry X X X
O'Black, Linda X X X X
Pillow, Dale X X X X
Ruley, Janice X X X
Schmitt, Allene X X X X X
Segovia, Valerie X
Shaw, Richard X X X X
Smith, Connie X X
Staley, Gil X X X X X
Timmins, Evelyn X X X X X
Violette, Kelly X
Welch, Fred X
Williams, Shunta X X X X X
Wrobleski, Sarah X
GULF COAST WORKFORCE BOARD
Page 1 of 5
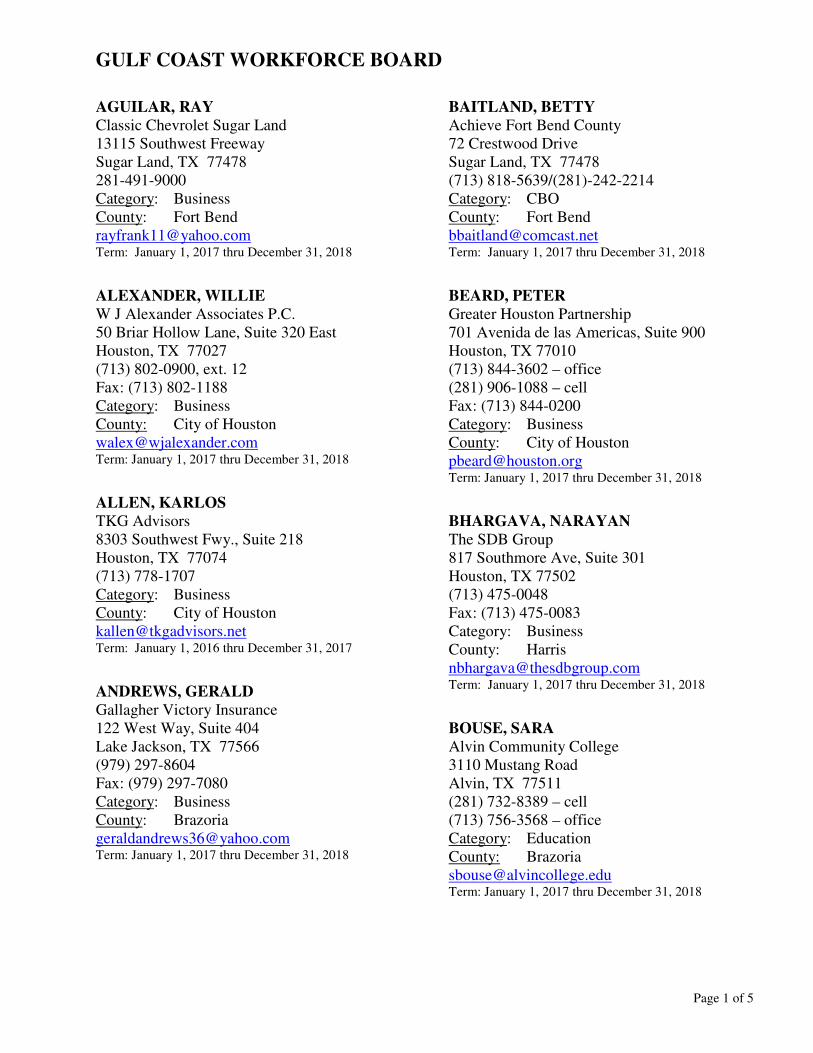
GULF COAST WORKFORCE BOARD
AGUILAR, RAY
Classic Chevrolet Sugar Land 13115 Southwest Freeway Sugar Land, TX 77478 281-491-9000 Category: Business County: Fort Bend [email protected] Term: January 1, 2017 thru December 31, 2018
ALEXANDER, WILLIE
W J Alexander Associates P.C. 50 Briar Hollow Lane, Suite 320 East Houston, TX 77027 (713) 802-0900, ext. 12 Fax: (713) 802-1188 Category: Business County: City of Houston [email protected] Term: January 1, 2017 thru December 31, 2018
ALLEN, KARLOS
TKG Advisors 8303 Southwest Fwy., Suite 218 Houston, TX 77074 (713) 778-1707 Category: Business County: City of Houston [email protected] Term: January 1, 2016 thru December 31, 2017
ANDREWS, GERALD
Gallagher Victory Insurance 122 West Way, Suite 404 Lake Jackson, TX 77566 (979) 297-8604 Fax: (979) 297-7080 Category: Business County: Brazoria [email protected] Term: January 1, 2017 thru December 31, 2018
BAITLAND, BETTY
Achieve Fort Bend County 72 Crestwood Drive Sugar Land, TX 77478 (713) 818-5639/(281)-242-2214 Category: CBO County: Fort Bend [email protected] Term: January 1, 2017 thru December 31, 2018
BEARD, PETER
Greater Houston Partnership 701 Avenida de las Americas, Suite 900 Houston, TX 77010 (713) 844-3602 – office (281) 906-1088 – cell Fax: (713) 844-0200 Category: Business County: City of Houston [email protected] Term: January 1, 2017 thru December 31, 2018
BHARGAVA, NARAYAN
The SDB Group 817 Southmore Ave, Suite 301 Houston, TX 77502 (713) 475-0048 Fax: (713) 475-0083 Category: Business County: Harris [email protected] Term: January 1, 2017 thru December 31, 2018
BOUSE, SARA
Alvin Community College 3110 Mustang Road Alvin, TX 77511 (281) 732-8389 – cell (713) 756-3568 – office Category: Education County: Brazoria [email protected] Term: January 1, 2017 thru December 31, 2018
Page 2 of 5
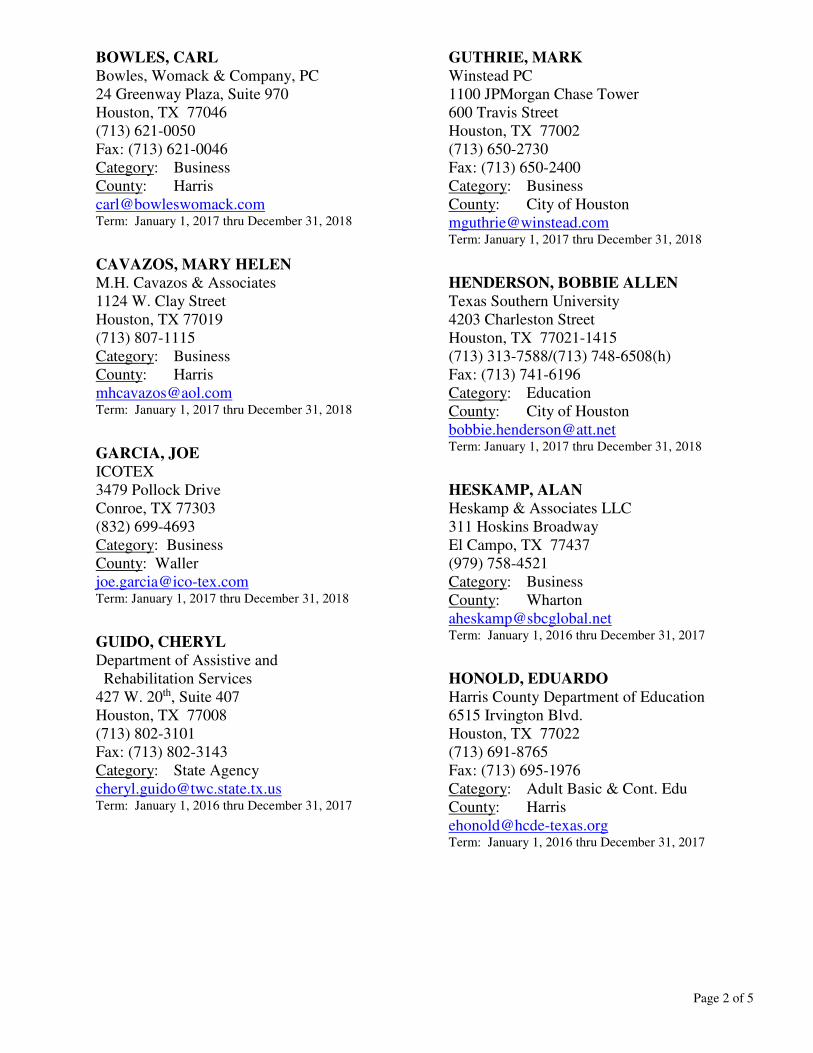
BOWLES, CARL
Bowles, Womack & Company, PC 24 Greenway Plaza, Suite 970 Houston, TX 77046 (713) 621-0050 Fax: (713) 621-0046 Category: Business County: Harris [email protected] Term: January 1, 2017 thru December 31, 2018
CAVAZOS, MARY HELEN
M.H. Cavazos & Associates 1124 W. Clay Street Houston, TX 77019 (713) 807-1115 Category: Business County: Harris [email protected] Term: January 1, 2017 thru December 31, 2018
GARCIA, JOE
ICOTEX 3479 Pollock Drive Conroe, TX 77303 (832) 699-4693 Category: Business County: Waller [email protected] Term: January 1, 2017 thru December 31, 2018
GUIDO, CHERYL
Department of Assistive and Rehabilitation Services 427 W. 20th, Suite 407 Houston, TX 77008 (713) 802-3101 Fax: (713) 802-3143 Category: State Agency [email protected] Term: January 1, 2016 thru December 31, 2017
GUTHRIE, MARK
Winstead PC 1100 JPMorgan Chase Tower 600 Travis Street Houston, TX 77002 (713) 650-2730 Fax: (713) 650-2400 Category: Business County: City of Houston [email protected] Term: January 1, 2017 thru December 31, 2018
HENDERSON, BOBBIE ALLEN
Texas Southern University 4203 Charleston Street Houston, TX 77021-1415 (713) 313-7588/(713) 748-6508(h) Fax: (713) 741-6196 Category: Education County: City of Houston [email protected] Term: January 1, 2017 thru December 31, 2018
HESKAMP, ALAN
Heskamp & Associates LLC 311 Hoskins Broadway El Campo, TX 77437 (979) 758-4521 Category: Business County: Wharton [email protected] Term: January 1, 2016 thru December 31, 2017
HONOLD, EDUARDO
Harris County Department of Education 6515 Irvington Blvd. Houston, TX 77022 (713) 691-8765 Fax: (713) 695-1976 Category: Adult Basic & Cont. Edu County: Harris [email protected] Term: January 1, 2016 thru December 31, 2017
Page 3 of 5
JACKSON, GUY ROBERT
Chambers County Abstract Co. Inc. P.O. Box 640 Anahuac, TX 77514 (409) 267-6262, ext. 35 Fax: (409) 267-6355 Category: Business County: Chambers [email protected] Term: January 1, 2017 thru December 31, 2018
JANES, SARAH
San Jacinto College 8060 Spencer Highway Pasadena, TX 77505 281-998-6100 Fax: (281) 479-8127 Category: Education County: Harris [email protected] Term: January 1, 2016 thru December 31, 2017
JORDAN, FRANK M.
Nutrition Supply Corporation 317 Industrial Circle Liberty, TX 77575 936-334-5778 Fax: (936) 334-0514 Category: Business County: Liberty [email protected] Term: July 31, 2017 thru December 31, 2018
JOSSERAND, JOHN
Turner Industries Group, LLC 3850 Pasadena Blvd. Pasadena, TX 77503 Category: Business County: Harris (713) 477-7440 Fax: (713) 477-4846 [email protected] Term: January 1, 2017 thru December 31, 2018
KAMPS, BIRGIT
Hire Universe 5517 Aspen Street Houston, TX 77081 713-822-7411 Category: Business County: Harris [email protected] Term: January 1, 2017 thru December 31, 2018
KARR, DOUG
Pro Staff/Atterro 27 Canoe Birch Place The Woodlands, TX 77382 832-967-7684 Category: Business County: Montgomery [email protected] Term: January 1, 2016 thru December 31, 2017
KING, PAULETTE
Health and Human Services 1332 E. 40th Street, Unit B1 Houston, TX 77022 (713) 696-8088 (direct) (713) 767-3192 (secondary number) Fax: (713) 695-4593 Category: Public Assistance [email protected] Term: January 1, 2017 thru December 31, 2018
LaBROSKI, JEFFREY
Plumbers Local Union No. 68 502 Link Road P.O. Box 8746 Houston, TX 77249 (713) 869-3592 Fax: (713) 869-3671 Category: Labor County: City of Houston [email protected] Term: January 1, 2017 thru December 31, 2018
Page 4 of 5
MARSHALL, SCOTT
Jacobs 5995 Rogerdale Road Houston, TX 77072 (832) 351-6655 Category: Business County: Harris [email protected] Term: January 1, 2017 thru December 31, 2018
McCLESKEY, KENDRICK
PricewaterhouseCoopers- 1903 Crockett St. Houston, TX 77007 (281) 788-6046 Category: Business County: City of Houston [email protected] Term: January 1, 2017 thru December 31, 2018
MECHLER, STEVE
Balfour Beatty Construction 4321 Directors Row, Suite 101 Houston, TX 77092 (713) 824-6266 Category: Business County: Harris [email protected] Term: January 1, 2016 thru December 31, 2017
NEVLUD, JERRY
AGC Houston 3825 Dacoma Street Houston, TX 77092 (713) 843-3700 Fax: (713) 843-3777 Category: Business County: Harris [email protected] Term: January 1, 2016 thru December 21, 2017
O’BLACK, LINDA
United Way of the Texas Gulf Coast 50 Waugh Drive Houston, TX 77007 (713) 685-2416 Fax: (713) 685-5555 Category: CBO County: City of Houston LO’[email protected] Term: January 1, 2016 thru December 31, 2017
PILLOW, DALE
Adult Reading Center, Inc. 2246 N. Washington Ave. Pearland, TX 77581 (281) 485-1000 Fax: (281) 485-3473 Category: Literacy County: Brazoria [email protected] Term: January 1, 2016 thru December 31, 2017
RULEY, JANICE
Houston Airport Systems 18600 Lee Road, Suite 130 Humble, TX 77338-4172 (281) 233-7853 Fax: (281)230-8020 Category: Labor County: City of Houston [email protected] Term: January 1, 2017 thru December 31, 2018
SCHMITT, ALLENE
Blinn College - Sealy 3701 Outlet Center Drive, #250 Sealy, TX 77474 (979) 865-8461 Category: Education County: Austin [email protected] Term: January 1, 2017 thru December 31, 2018
Page 5 of 5
SEGOVIA, VALERIE GARCIA
Director of Outreach and Development Nuclear Power Institute 101 Gateway Blvd, Suite A College Station, TX 77845 979-240-5005 Category: CBO County: Palacios [email protected] [email protected] Term: September 5, 2017 thru December 31, 2018
SHAW, RICHARD
Harris County Labor Assembly, AFL-CIO Council 1707 Prism Lane Houston, TX 77043-3344 (713) 240-2472 Category: Labor County: City of Houston [email protected] Term: January 1, 2017 thru December 31, 2018
SMITH, CONNIE
Greensmith Marketing, LLC 8618 Royal Cape Ct. Houston, TX 77095 (713) 681-9232 Fax: (713) 681-9242 Category: Business County: City of Houston [email protected] Term: January 1, 2016 thru December 31, 2017
STALEY, GIL
The Woodlands Area Economic Development Partnership 9320 Lakeside Blvd., Bldg. 2, Suite 200 The Woodlands, TX 77381 (281) 363-8130 Fax: (281) 298-6874 Category: Business County: Montgomery [email protected] Term: January 1, 2016 thru December 31, 2017
TIMMINS, EVELYN
Houston Mayor’s Committee for Employment of People with Disabilities 2120 Lundy Lane Friendswood, TX 77546 (281) 388-1967 Category: CBO County: City of Houston [email protected] Term: January 1, 2017 thru December 31, 2018
VIOLETTE, KELLY
Tomball Economic Development Corporation 29201 Quinn Road, Unit B Tomball, TX 77375 (281) 401-4086 Fax: (281) 351-7223 Category: Economic Development County: Harris County [email protected] Term: January 1, 2017 thru December 31, 2018
WILLIAMS, SHUNTA
Texas Workforce Commission 3555 Timmons Lane, Suite 120 Houston, TX 77027 (713) 993-2439 Fax: (832) 681-2534 Category: State Agency [email protected] Term: January 1, 2017 thru December 31, 2018
WORKFORCE BOARD KEY STAFF:
Mike Temple, Director David Baggerly, Program Manager Michelle Ramirez, Program Manager Brenda Williams, Quality Assurance Manager Deborah Duke, Administrative Coordinator Cally Graves, Employer Services Lucretia Hammond, Grants Management Houston-Galveston Area Council 3555 Timmons Lane, Suite 120 P.O. Box 22777 Houston, TX 77227-2777 (713) 627-3200 Fax: (713) 993-4578 http://www.wrksolutions.org
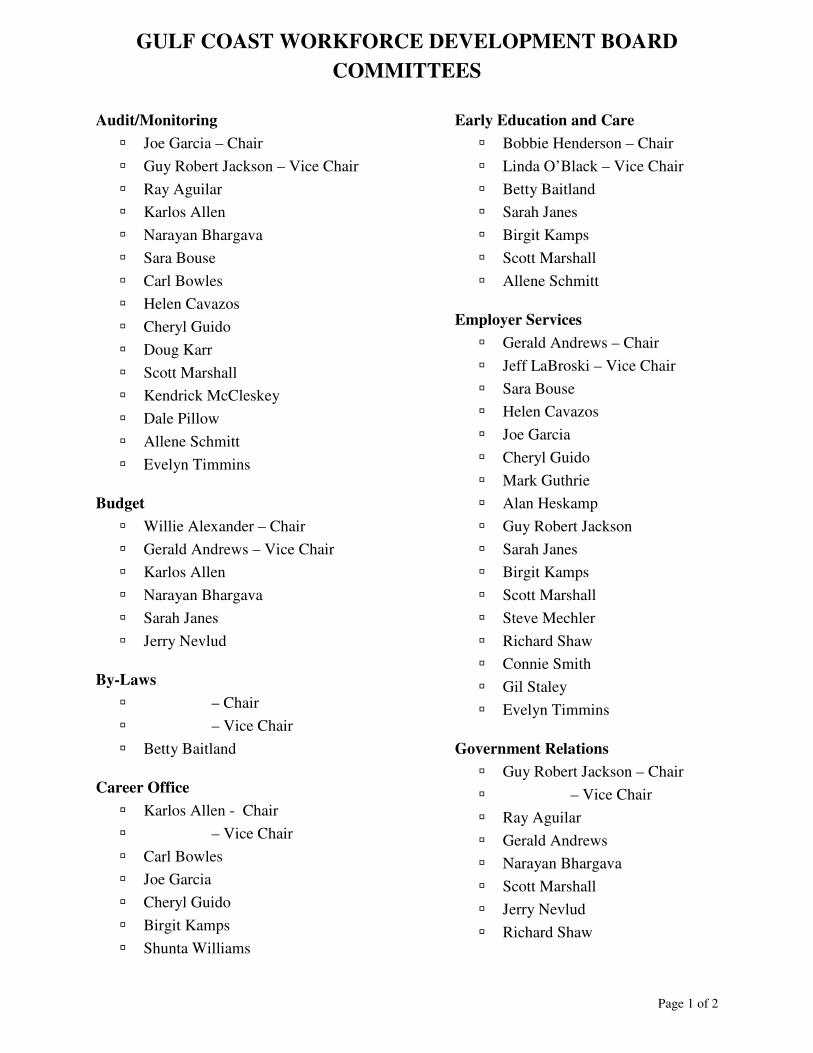
GULF COAST WORKFORCE DEVELOPMENT BOARD
COMMITTEES
Page 1 of 2
Audit/Monitoring
� Joe Garcia – Chair
� Guy Robert Jackson – Vice Chair
� Ray Aguilar
� Karlos Allen
� Narayan Bhargava
� Sara Bouse
� Carl Bowles
� Helen Cavazos
� Cheryl Guido
� Doug Karr
� Scott Marshall
� Kendrick McCleskey
� Dale Pillow
� Allene Schmitt
� Evelyn Timmins
Budget
� Willie Alexander – Chair
� Gerald Andrews – Vice Chair
� Karlos Allen
� Narayan Bhargava
� Sarah Janes
� Jerry Nevlud
By-Laws
� – Chair
� – Vice Chair
� Betty Baitland
Career Office
� Karlos Allen - Chair
� – Vice Chair
� Carl Bowles
� Joe Garcia
� Cheryl Guido
� Birgit Kamps
� Shunta Williams
Early Education and Care
� Bobbie Henderson – Chair
� Linda O’Black – Vice Chair
� Betty Baitland
� Sarah Janes
� Birgit Kamps
� Scott Marshall
� Allene Schmitt
Employer Services
� Gerald Andrews – Chair
� Jeff LaBroski – Vice Chair
� Sara Bouse
� Helen Cavazos
� Joe Garcia
� Cheryl Guido
� Mark Guthrie
� Alan Heskamp
� Guy Robert Jackson
� Sarah Janes
� Birgit Kamps
� Scott Marshall
� Steve Mechler
� Richard Shaw
� Connie Smith
� Gil Staley
� Evelyn Timmins
Government Relations
� Guy Robert Jackson – Chair
� – Vice Chair
� Ray Aguilar
� Gerald Andrews
� Narayan Bhargava
� Scott Marshall
� Jerry Nevlud
� Richard Shaw
GULF COAST WORKFORCE DEVELOPMENT BOARD
COMMITTEES
Page 2 of 2
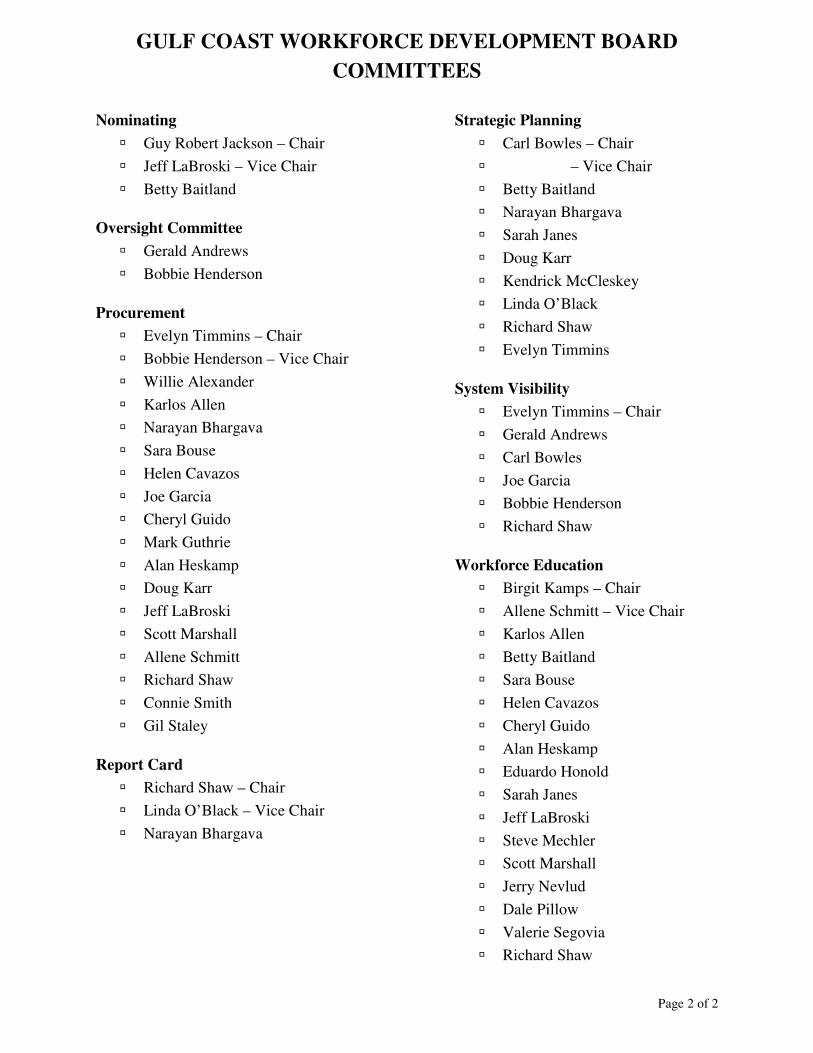
Nominating
� Guy Robert Jackson – Chair
� Jeff LaBroski – Vice Chair
� Betty Baitland
Oversight Committee
� Gerald Andrews
� Bobbie Henderson
Procurement
� Evelyn Timmins – Chair
� Bobbie Henderson – Vice Chair
� Willie Alexander
� Karlos Allen
� Narayan Bhargava
� Sara Bouse
� Helen Cavazos
� Joe Garcia
� Cheryl Guido
� Mark Guthrie
� Alan Heskamp
� Doug Karr
� Jeff LaBroski
� Scott Marshall
� Allene Schmitt
� Richard Shaw
� Connie Smith
� Gil Staley
Report Card
� Richard Shaw – Chair
� Linda O’Black – Vice Chair
� Narayan Bhargava
Strategic Planning
� Carl Bowles – Chair
� – Vice Chair
� Betty Baitland
� Narayan Bhargava
� Sarah Janes
� Doug Karr
� Kendrick McCleskey
� Linda O’Black
� Richard Shaw
� Evelyn Timmins
System Visibility
� Evelyn Timmins – Chair
� Gerald Andrews
� Carl Bowles
� Joe Garcia
� Bobbie Henderson
� Richard Shaw
Workforce Education
� Birgit Kamps – Chair
� Allene Schmitt – Vice Chair
� Karlos Allen
� Betty Baitland
� Sara Bouse
� Helen Cavazos
� Cheryl Guido
� Alan Heskamp
� Eduardo Honold
� Sarah Janes
� Jeff LaBroski
� Steve Mechler
� Scott Marshall
� Jerry Nevlud
� Dale Pillow
� Valerie Segovia
� Richard Shaw
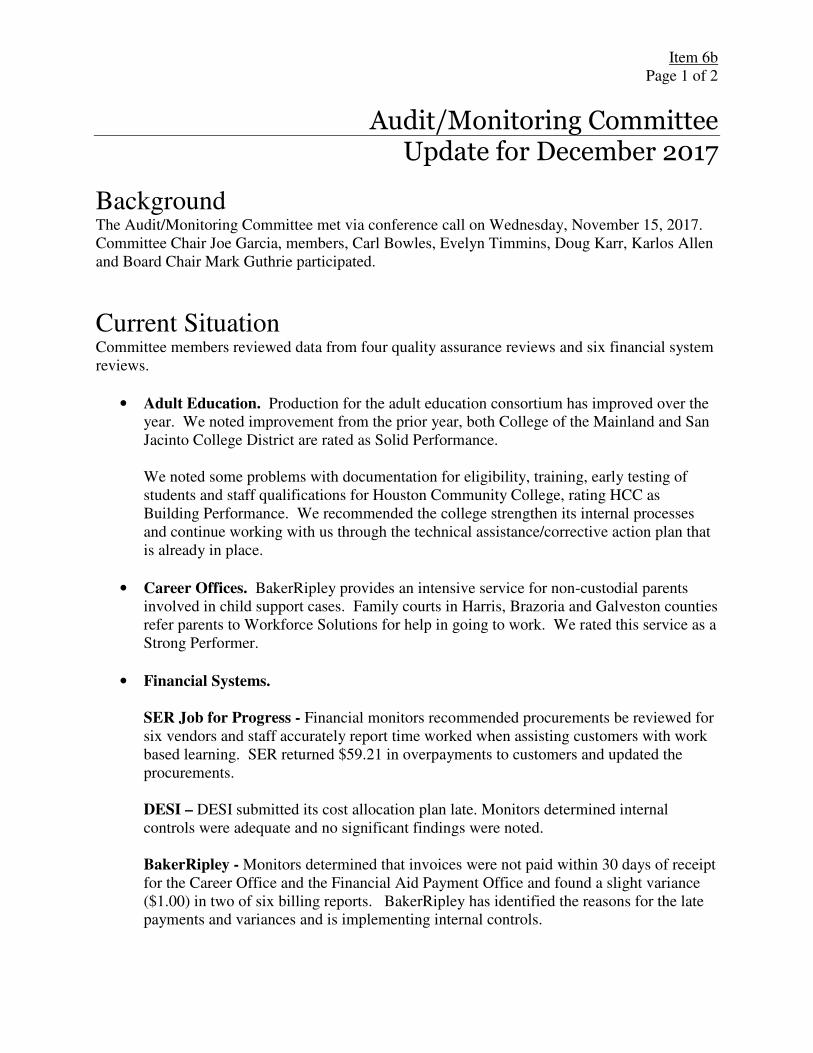
Item 6b Page 1 of 2
Audit/Monitoring Committee Update for December 2017
Background The Audit/Monitoring Committee met via conference call on Wednesday, November 15, 2017. Committee Chair Joe Garcia, members, Carl Bowles, Evelyn Timmins, Doug Karr, Karlos Allen and Board Chair Mark Guthrie participated.
Current Situation Committee members reviewed data from four quality assurance reviews and six financial system reviews.
• Adult Education. Production for the adult education consortium has improved over the year. We noted improvement from the prior year, both College of the Mainland and San Jacinto College District are rated as Solid Performance.
We noted some problems with documentation for eligibility, training, early testing of students and staff qualifications for Houston Community College, rating HCC as Building Performance. We recommended the college strengthen its internal processes and continue working with us through the technical assistance/corrective action plan that is already in place.
• Career Offices. BakerRipley provides an intensive service for non-custodial parents involved in child support cases. Family courts in Harris, Brazoria and Galveston counties refer parents to Workforce Solutions for help in going to work. We rated this service as a Strong Performer.
• Financial Systems.
SER Job for Progress - Financial monitors recommended procurements be reviewed for six vendors and staff accurately report time worked when assisting customers with work based learning. SER returned $59.21 in overpayments to customers and updated the procurements.
DESI – DESI submitted its cost allocation plan late. Monitors determined internal controls were adequate and no significant findings were noted.
BakerRipley - Monitors determined that invoices were not paid within 30 days of receipt for the Career Office and the Financial Aid Payment Office and found a slight variance ($1.00) in two of six billing reports. BakerRipley has identified the reasons for the late payments and variances and is implementing internal controls.
Item 6b Page 2 of 2
TAEYC – Financial monitors reviewed the Texas Association for Education of Young Children contract and found the cost allocation plan did not have the required elements and expenditure targets were not met. TAEYC has been a contractor with the Board for many years providing educational support for individuals in obtaining the Child Development Associate and the Associate of Applied Science in Child Care. We are not contracting with TAEYC this year. The financial monitors did not identify any significant findings for Wharton County
Junior College or Houston Community College.
Item 6c Page 1 of 7
Education Committee Integrating Education and the Workforce
On Thursday, October 26, 2017, the Workforce Education Committee met at H-GAC. Chair Birgit Kamps led the meeting. Other members in attendance included vice chair Allene Schmitt, Board Chair Mark Guthrie, Cheryl Guido, Eduardo Honold, Doug Karr, and Valerie Segovia. The Committee received updates on pilot projects to support the Texas Higher Education Coordinating Board’s 60x30 plan.
Background At the May meeting, the Education Committee adopted two strategies to support the Board’s result of an educated workforce and the state’s 60x30TX initiative:
• Focus outreach and service to the most economically disadvantaged independent school districts in the region; and
• Complete a gap analysis on demand/supply of candidates with Level 1 workforce certificates.
Current Situation
� Support the most economically disadvantaged districts Through the summer, staff connected with three districts and revised the schedule to include:
• Fall 2017 o Galveston ISD o Spring Branch ISD/Northbrook and Spring Woods High Schools o Damon ISD
• Spring 2018 o Aldine ISD o Liberty, Cleveland, Hull-Daisetta, Dayton, Devers, Hardin and Tarkington ISDs o Galena Park ISD
To generate awareness of the data and career readiness resources available from Workforce Solutions, our support includes:
• Training teachers, counselors and staff how to access and use labor market data and When I Grow Up curriculum
• Providing follow-up support to districts in using our resources as a foundation to expand career and technical education, internships or other district workforce readiness efforts.
Item 6c Page 2 of 7
We conducted in-service training with Galveston ISD teachers and counselors on August 23, 2017, also encouraging teachers to enlist the help of our Regional Facilitator team to connect students to work experience opportunities. 52 participants completed pre- and post-assessments from this training. In general, the teachers increased their knowledge and understanding about the region’s good jobs and how to find career information and significantly increased their awareness of work-based learning opportunities for their students and themselves. The third element of our support strategy is follow-up regarding expansion of the district’s existing workforce readiness efforts. After the in-service training with Galveston ISD, we met with district career/technical education and counseling leadership. Our next step is to solidify the integration of career readiness content with sustainable student activities throughout the school year. We will use a similar approach with the other districts.
� Gap analysis on demand and supply of candidates with level 1 workforce
certificates. Obtaining the survey responses has been more challenging than expected, and we continue to work with our community college contacts.
While we lack a complete survey response, we do have a snapshot from Lone Star College. Using both the survey response and clarifying conversations, we identified highlights as included below and illustrated on the following pages.
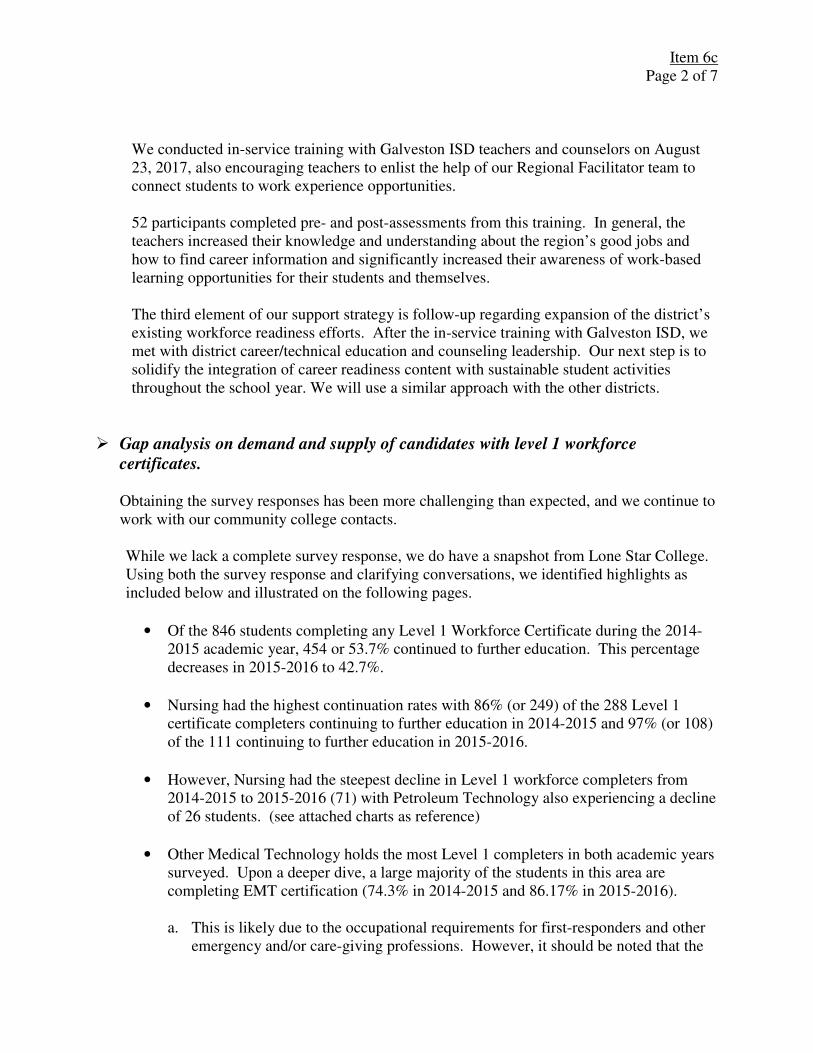
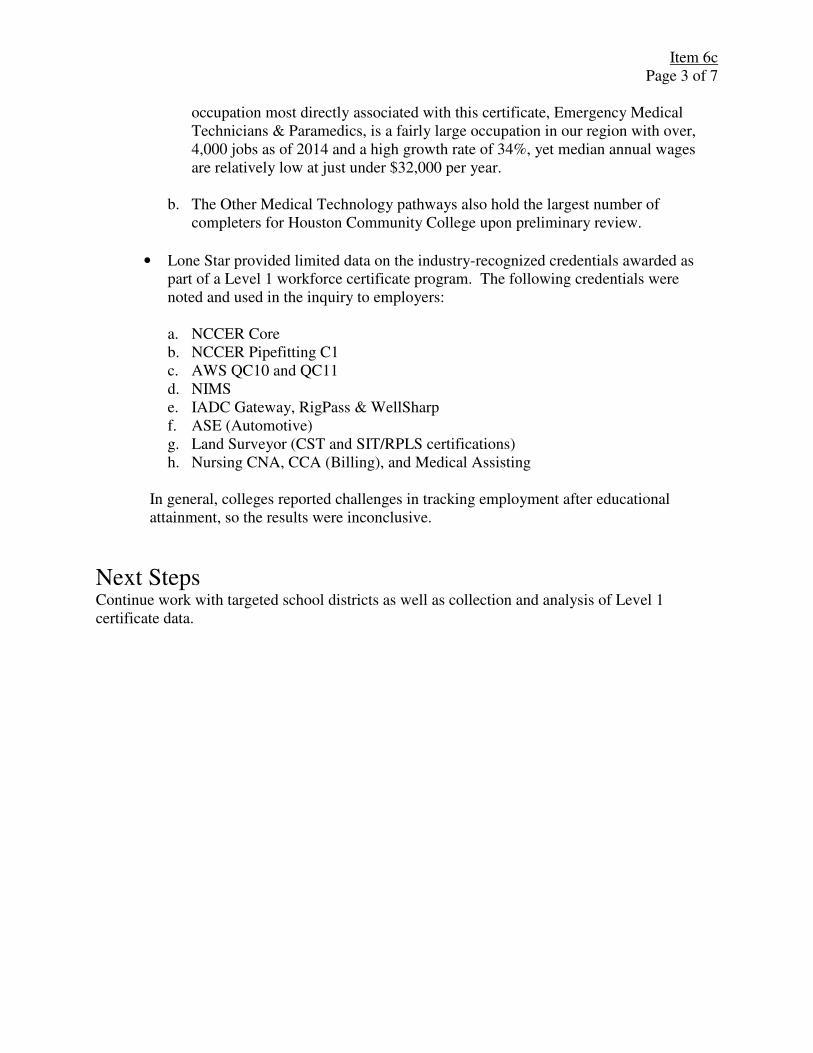
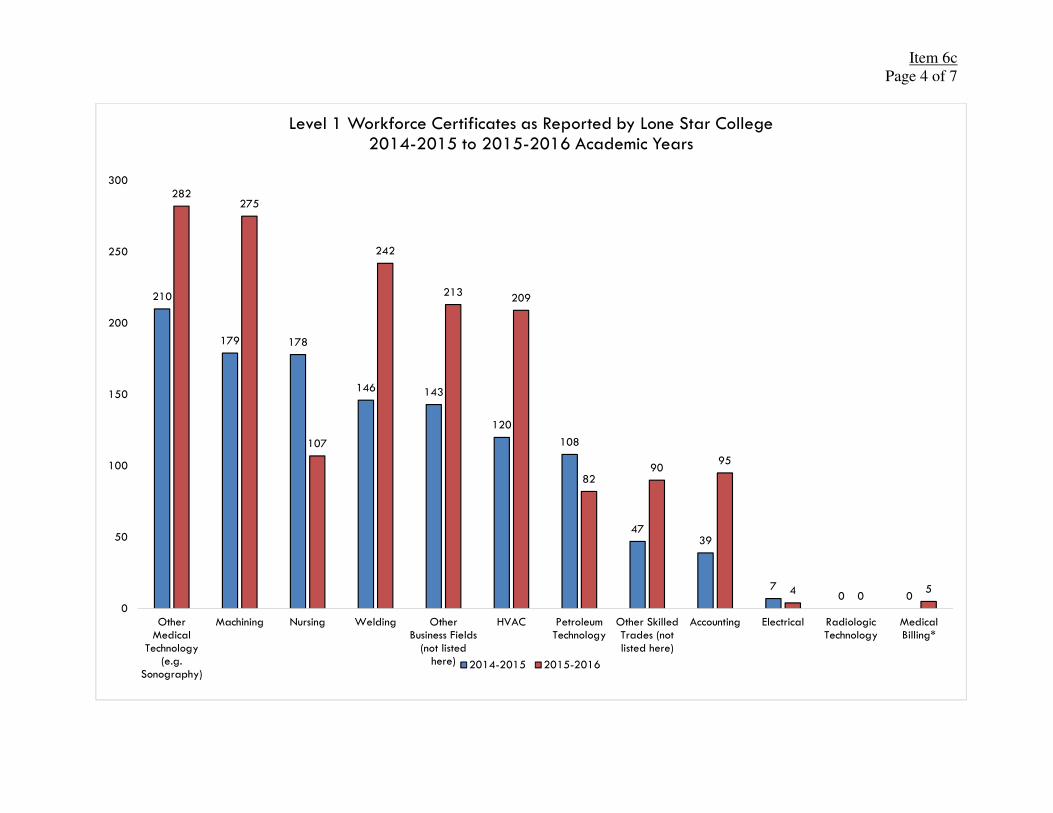
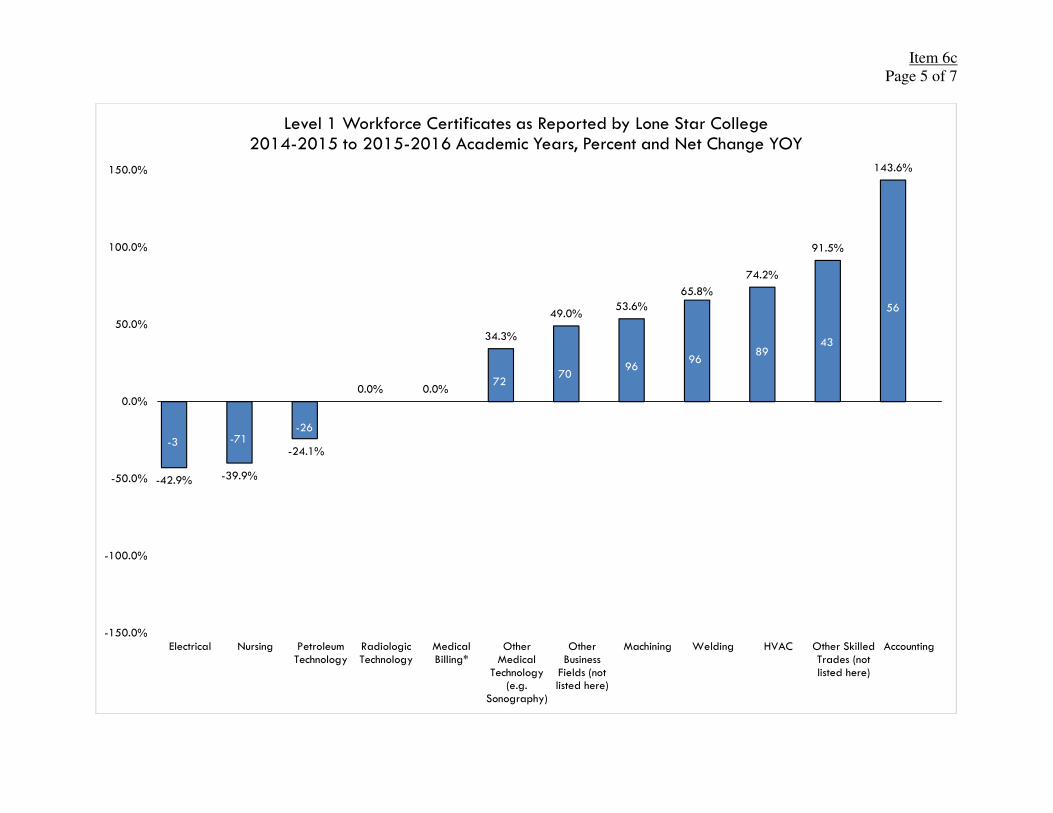
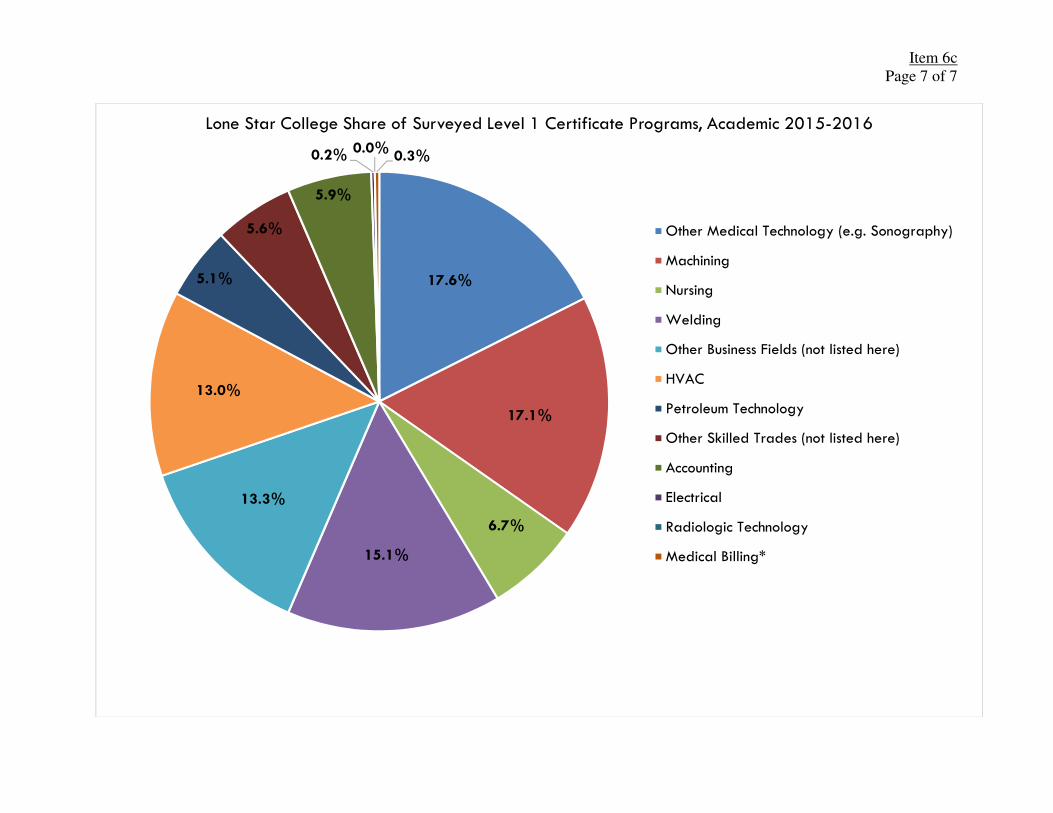
• Of the 846 students completing any Level 1 Workforce Certificate during the 2014-2015 academic year, 454 or 53.7% continued to further education. This percentage decreases in 2015-2016 to 42.7%.
• Nursing had the highest continuation rates with 86% (or 249) of the 288 Level 1 certificate completers continuing to further education in 2014-2015 and 97% (or 108) of the 111 continuing to further education in 2015-2016.
• However, Nursing had the steepest decline in Level 1 workforce completers from 2014-2015 to 2015-2016 (71) with Petroleum Technology also experiencing a decline of 26 students. (see attached charts as reference)
• Other Medical Technology holds the most Level 1 completers in both academic years surveyed. Upon a deeper dive, a large majority of the students in this area are completing EMT certification (74.3% in 2014-2015 and 86.17% in 2015-2016). a. This is likely due to the occupational requirements for first-responders and other
emergency and/or care-giving professions. However, it should be noted that the
Item 6c Page 3 of 7
occupation most directly associated with this certificate, Emergency Medical Technicians & Paramedics, is a fairly large occupation in our region with over, 4,000 jobs as of 2014 and a high growth rate of 34%, yet median annual wages are relatively low at just under $32,000 per year.
b. The Other Medical Technology pathways also hold the largest number of completers for Houston Community College upon preliminary review.
• Lone Star provided limited data on the industry-recognized credentials awarded as part of a Level 1 workforce certificate program. The following credentials were noted and used in the inquiry to employers: a. NCCER Core b. NCCER Pipefitting C1 c. AWS QC10 and QC11 d. NIMS e. IADC Gateway, RigPass & WellSharp f. ASE (Automotive) g. Land Surveyor (CST and SIT/RPLS certifications) h. Nursing CNA, CCA (Billing), and Medical Assisting
In general, colleges reported challenges in tracking employment after educational attainment, so the results were inconclusive.
Next Steps Continue work with targeted school districts as well as collection and analysis of Level 1 certificate data.
Item 6c Page 4 of 7
210
179 178
146 143
120
108
4739
70 0
282275
107
242
213209
8290
95
40
5
0
50
100
150
200
250
300
OtherMedical
Technology(e.g.
Sonography)
Machining Nursing Welding OtherBusiness Fields
(not listedhere)
HVAC PetroleumTechnology
Other SkilledTrades (notlisted here)
Accounting Electrical RadiologicTechnology
MedicalBilling*
Level 1 Workforce Certificates as Reported by Lone Star College2014-2015 to 2015-2016 Academic Years
2014-2015 2015-2016
Item 6c Page 5 of 7
-42.9% -39.9%
-24.1%
0.0% 0.0%
34.3%
49.0%53.6%
65.8%
74.2%
91.5%
143.6%
-3 -71-26
0
5
7270
9696
8943
56
-150.0%
-100.0%
-50.0%
0.0%
50.0%
100.0%
150.0%
Electrical Nursing PetroleumTechnology
RadiologicTechnology
MedicalBilling*
OtherMedical
Technology(e.g.
Sonography)
OtherBusiness
Fields (notlisted here)
Machining Welding HVAC Other SkilledTrades (notlisted here)
Accounting
Level 1 Workforce Certificates as Reported by Lone Star College2014-2015 to 2015-2016 Academic Years, Percent and Net Change YOY
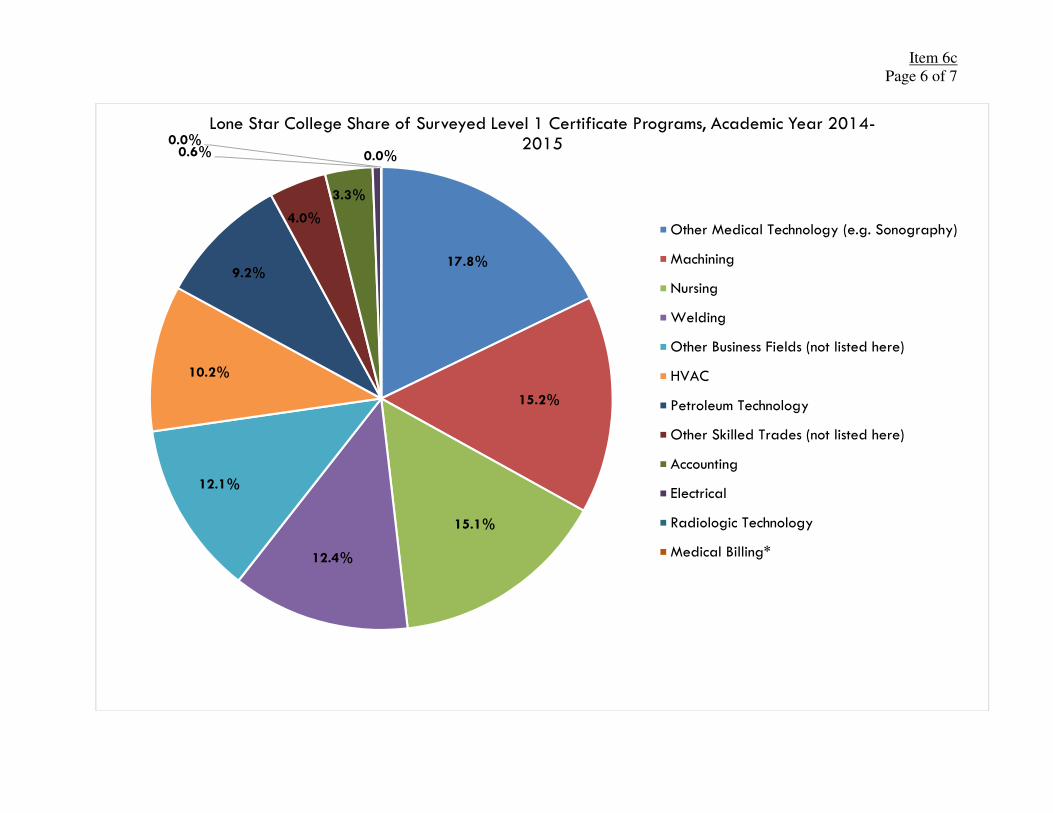
Item 6c Page 6 of 7
17.8%
15.2%
15.1%
12.4%
12.1%
10.2%
9.2%
4.0%
3.3%
0.6%0.0%
0.0%
Lone Star College Share of Surveyed Level 1 Certificate Programs, Academic Year 2014-2015
Other Medical Technology (e.g. Sonography)
Machining
Nursing
Welding
Other Business Fields (not listed here)
HVAC
Petroleum Technology
Other Skilled Trades (not listed here)
Accounting
Electrical
Radiologic Technology
Medical Billing*
Item 6c Page 7 of 7
17.6%
17.1%
6.7%
15.1%
13.3%
13.0%
5.1%
5.6%
5.9%
0.2%0.0%
0.3%
Lone Star College Share of Surveyed Level 1 Certificate Programs, Academic 2015-2016
Other Medical Technology (e.g. Sonography)
Machining
Nursing
Welding
Other Business Fields (not listed here)
HVAC
Petroleum Technology
Other Skilled Trades (not listed here)
Accounting
Electrical
Radiologic Technology
Medical Billing*
Item 7b Page 1 of 3
Gulf Coast Workforce Board System Performance
October 2016 to September 2017
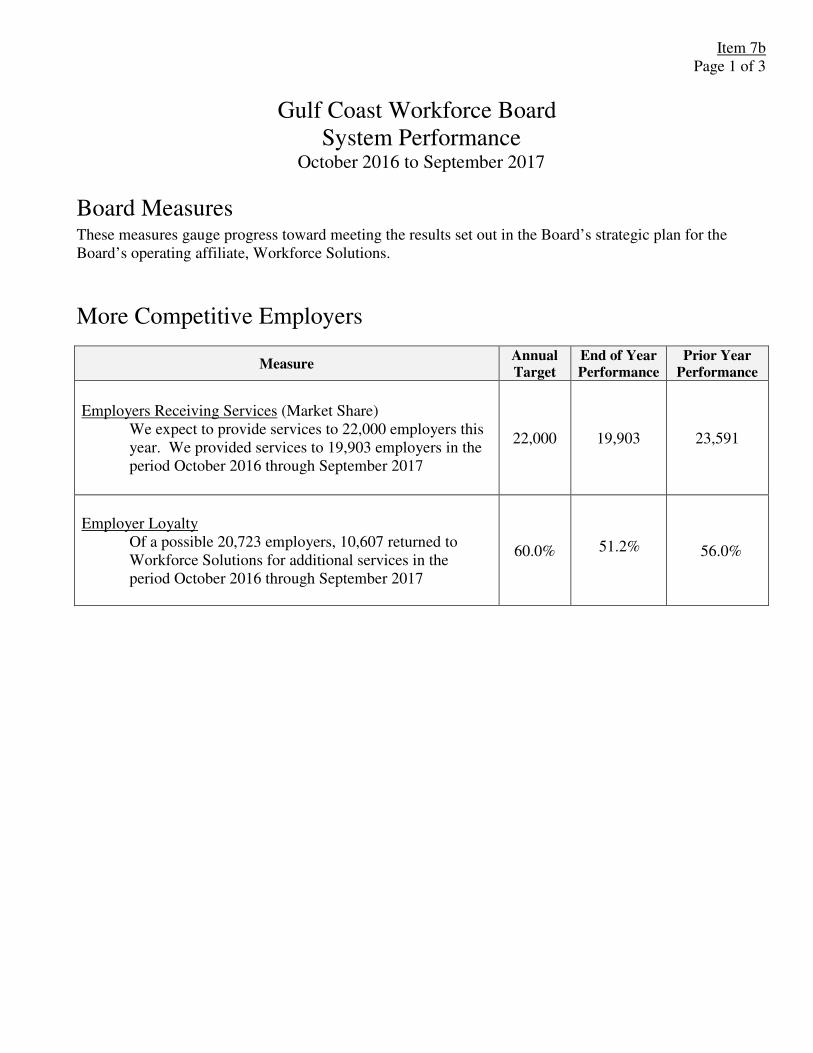
Board Measures These measures gauge progress toward meeting the results set out in the Board’s strategic plan for the Board’s operating affiliate, Workforce Solutions.
More Competitive Employers
Measure Annual
Target
End of Year
Performance
Prior Year
Performance
Employers Receiving Services (Market Share) We expect to provide services to 22,000 employers this year. We provided services to 19,903 employers in the period October 2016 through September 2017
22,000 19,903 23,591
Employer Loyalty
Of a possible 20,723 employers, 10,607 returned to Workforce Solutions for additional services in the period October 2016 through September 2017
60.0% 51.2% 56.0%
Item 7b Page 2 of 3
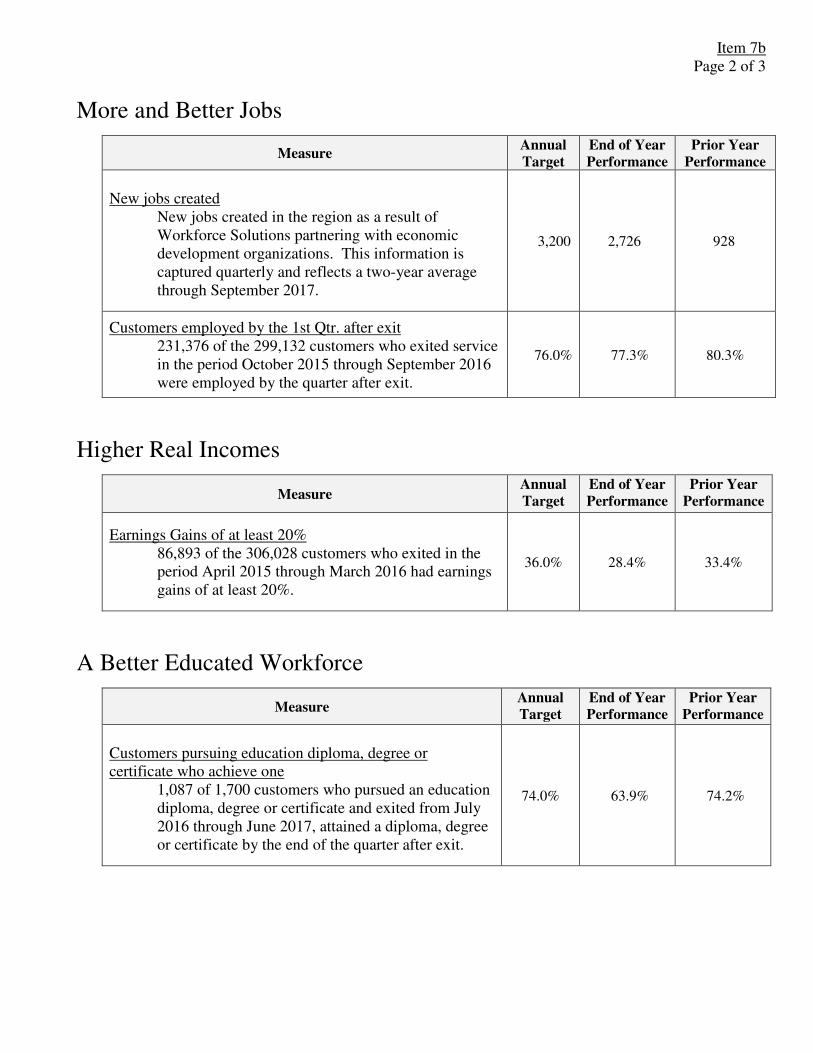
More and Better Jobs
Measure Annual
Target
End of Year
Performance
Prior Year
Performance
New jobs created
New jobs created in the region as a result of Workforce Solutions partnering with economic development organizations. This information is captured quarterly and reflects a two-year average through September 2017.
3,200 2,726 928
Customers employed by the 1st Qtr. after exit 231,376 of the 299,132 customers who exited service in the period October 2015 through September 2016 were employed by the quarter after exit.
76.0% 77.3% 80.3%
Higher Real Incomes
Measure Annual
Target
End of Year
Performance
Prior Year
Performance
Earnings Gains of at least 20% 86,893 of the 306,028 customers who exited in the period April 2015 through March 2016 had earnings gains of at least 20%.
36.0% 28.4% 33.4%
A Better Educated Workforce
Measure Annual
Target
End of Year
Performance
Prior Year
Performance
Customers pursuing education diploma, degree or certificate who achieve one
1,087 of 1,700 customers who pursued an education diploma, degree or certificate and exited from July 2016 through June 2017, attained a diploma, degree or certificate by the end of the quarter after exit.
74.0% 63.9% 74.2%
Item 7b Page 3 of 3
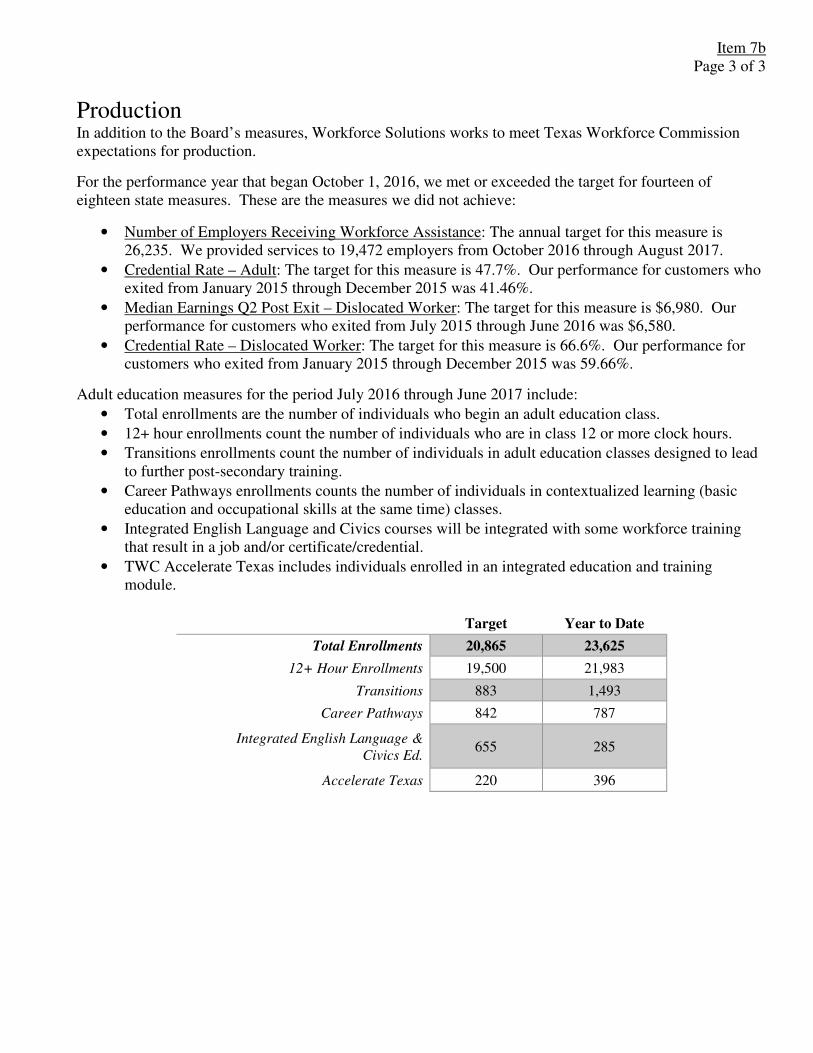
Production In addition to the Board’s measures, Workforce Solutions works to meet Texas Workforce Commission expectations for production.
For the performance year that began October 1, 2016, we met or exceeded the target for fourteen of eighteen state measures. These are the measures we did not achieve:
• Number of Employers Receiving Workforce Assistance: The annual target for this measure is 26,235. We provided services to 19,472 employers from October 2016 through August 2017.
• Credential Rate – Adult: The target for this measure is 47.7%. Our performance for customers who exited from January 2015 through December 2015 was 41.46%.
• Median Earnings Q2 Post Exit – Dislocated Worker: The target for this measure is $6,980. Our performance for customers who exited from July 2015 through June 2016 was $6,580.
• Credential Rate – Dislocated Worker: The target for this measure is 66.6%. Our performance for customers who exited from January 2015 through December 2015 was 59.66%.
Adult education measures for the period July 2016 through June 2017 include:
• Total enrollments are the number of individuals who begin an adult education class.
• 12+ hour enrollments count the number of individuals who are in class 12 or more clock hours.
• Transitions enrollments count the number of individuals in adult education classes designed to lead to further post-secondary training.
• Career Pathways enrollments counts the number of individuals in contextualized learning (basic education and occupational skills at the same time) classes.
• Integrated English Language and Civics courses will be integrated with some workforce training that result in a job and/or certificate/credential.
• TWC Accelerate Texas includes individuals enrolled in an integrated education and training module.
Target Year to Date
Total Enrollments 20,865 23,625
12+ Hour Enrollments 19,500 21,983
Transitions 883 1,493
Career Pathways 842 787
Integrated English Language &
Civics Ed. 655 285
Accelerate Texas 220 396
Item 7c
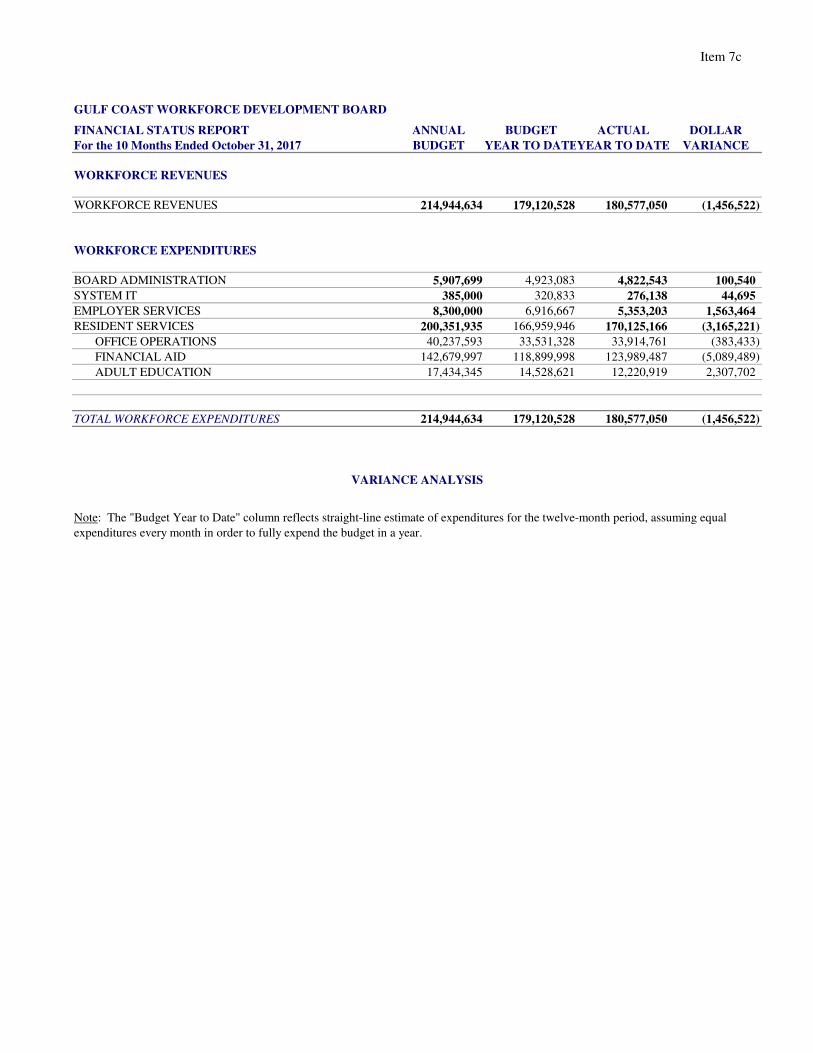
GULF COAST WORKFORCE DEVELOPMENT BOARD
FINANCIAL STATUS REPORT ANNUAL BUDGET ACTUAL DOLLAR
For the 10 Months Ended October 31, 2017 BUDGET YEAR TO DATEYEAR TO DATE VARIANCE
WORKFORCE REVENUES
WORKFORCE REVENUES 214,944,634 179,120,528 180,577,050 (1,456,522)
WORKFORCE EXPENDITURES
BOARD ADMINISTRATION 5,907,699 4,923,083 4,822,543 100,540
SYSTEM IT 385,000 320,833 276,138 44,695
EMPLOYER SERVICES 8,300,000 6,916,667 5,353,203 1,563,464
RESIDENT SERVICES 200,351,935 166,959,946 170,125,166 (3,165,221)
OFFICE OPERATIONS 40,237,593 33,531,328 33,914,761 (383,433)
FINANCIAL AID 142,679,997 118,899,998 123,989,487 (5,089,489)
ADULT EDUCATION 17,434,345 14,528,621 12,220,919 2,307,702
TOTAL WORKFORCE EXPENDITURES 214,944,634 179,120,528 180,577,050 (1,456,522)
VARIANCE ANALYSIS
Note: The "Budget Year to Date" column reflects straight-line estimate of expenditures for the twelve-month period, assuming equal
expenditures every month in order to fully expend the budget in a year.
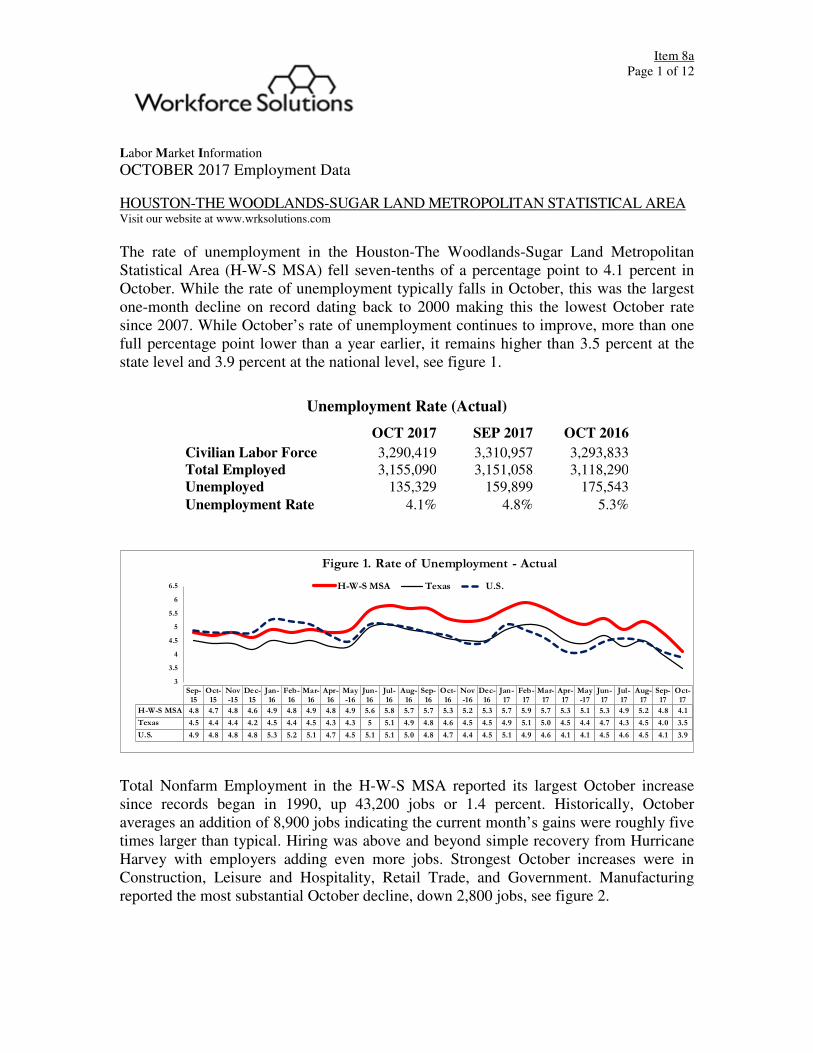
Item 8a Page 1 of 12
Labor Market Information
OCTOBER 2017 Employment Data
HOUSTON-THE WOODLANDS-SUGAR LAND METROPOLITAN STATISTICAL AREA Visit our website at www.wrksolutions.com
The rate of unemployment in the Houston-The Woodlands-Sugar Land Metropolitan Statistical Area (H-W-S MSA) fell seven-tenths of a percentage point to 4.1 percent in October. While the rate of unemployment typically falls in October, this was the largest one-month decline on record dating back to 2000 making this the lowest October rate since 2007. While October’s rate of unemployment continues to improve, more than one full percentage point lower than a year earlier, it remains higher than 3.5 percent at the state level and 3.9 percent at the national level, see figure 1.
Unemployment Rate (Actual)
OCT 2017 SEP 2017 OCT 2016
Civilian Labor Force 3,290,419 3,310,957 3,293,833 Total Employed 3,155,090 3,151,058 3,118,290 Unemployed 135,329 159,899 175,543
Unemployment Rate 4.1% 4.8% 5.3%
3
3.5
4
4.5
5
5.5
6
6.5
Sep-15
Oct-15
Nov-15
Dec-15
Jan-16
Feb-16
Mar-16
Apr-16
May-16
Jun-16
Jul-16
Aug-16
Sep-16
Oct-16
Nov-16
Dec-16
Jan-17
Feb-17
Mar-17
Apr-17
May-17
Jun-17
Jul-17
Aug-17
Sep-17
Oct-17
H-W-S MSA 4.8 4.7 4.8 4.6 4.9 4.8 4.9 4.8 4.9 5.6 5.8 5.7 5.7 5.3 5.2 5.3 5.7 5.9 5.7 5.3 5.1 5.3 4.9 5.2 4.8 4.1
Texas 4.5 4.4 4.4 4.2 4.5 4.4 4.5 4.3 4.3 5 5.1 4.9 4.8 4.6 4.5 4.5 4.9 5.1 5.0 4.5 4.4 4.7 4.3 4.5 4.0 3.5
U.S. 4.9 4.8 4.8 4.8 5.3 5.2 5.1 4.7 4.5 5.1 5.1 5.0 4.8 4.7 4.4 4.5 5.1 4.9 4.6 4.1 4.1 4.5 4.6 4.5 4.1 3.9
Figure 1. Rate of Unemployment - Actual
H-W-S MSA Texas U.S.
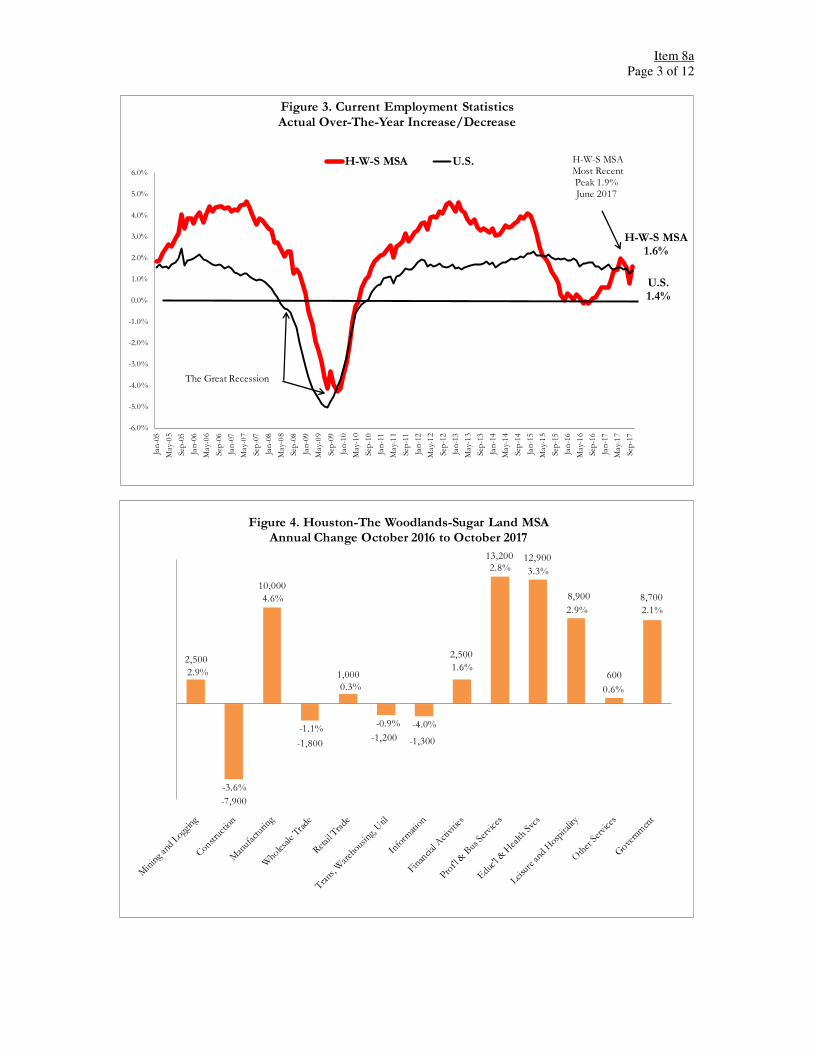
Total Nonfarm Employment in the H-W-S MSA reported its largest October increase since records began in 1990, up 43,200 jobs or 1.4 percent. Historically, October averages an addition of 8,900 jobs indicating the current month’s gains were roughly five times larger than typical. Hiring was above and beyond simple recovery from Hurricane Harvey with employers adding even more jobs. Strongest October increases were in Construction, Leisure and Hospitality, Retail Trade, and Government. Manufacturing reported the most substantial October decline, down 2,800 jobs, see figure 2.
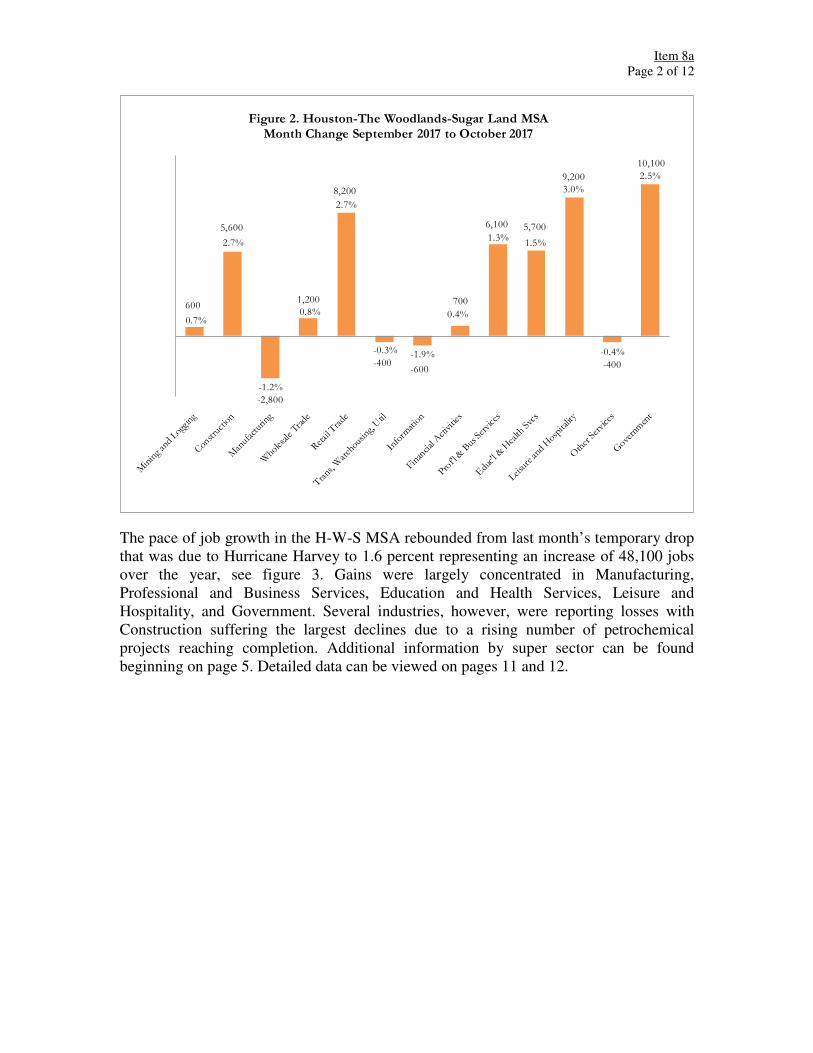
Item 8a Page 2 of 12
600
5,600
-2,800
1,200
8,200
-400-600
700
6,100 5,700
9,200
-400
10,100
0.7%
2.7%
-1.2%
0.8%
2.7%
-0.3% -1.9%
0.4%
1.3%1.5%
3.0%
-0.4%
2.5%
Figure 2. Houston-The Woodlands-Sugar Land MSAMonth Change September 2017 to October 2017
The pace of job growth in the H-W-S MSA rebounded from last month’s temporary drop that was due to Hurricane Harvey to 1.6 percent representing an increase of 48,100 jobs over the year, see figure 3. Gains were largely concentrated in Manufacturing, Professional and Business Services, Education and Health Services, Leisure and Hospitality, and Government. Several industries, however, were reporting losses with Construction suffering the largest declines due to a rising number of petrochemical projects reaching completion. Additional information by super sector can be found beginning on page 5. Detailed data can be viewed on pages 11 and 12.
Item 8a Page 3 of 12
-6.0%
-5.0%
-4.0%
-3.0%
-2.0%
-1.0%
0.0%
1.0%
2.0%
3.0%
4.0%
5.0%
6.0%
Jan
-05
May-
05
Sep
-05
Jan
-06
May-
06
Sep
-06
Jan
-07
May-
07
Sep
-07
Jan
-08
May-
08
Sep
-08
Jan
-09
May-
09
Sep
-09
Jan
-10
May-
10
Sep
-10
Jan
-11
May-
11
Sep
-11
Jan
-12
May-
12
Sep
-12
Jan
-13
May-
13
Sep
-13
Jan
-14
May-
14
Sep
-14
Jan
-15
May-
15
Sep
-15
Jan
-16
May-
16
Sep
-16
Jan
-17
May-
17
Sep
-17
Figure 3. Current Employment StatisticsActual Over-The-Year Increase/Decrease
H-W-S MSA U.S. H-W-S MSAMost Recent Peak 1.9%June 2017
The Great Recession
U.S.1.4%
H-W-S MSA1.6%
2,500
-7,900
10,000
-1,800
1,000
-1,200 -1,300
2,500
13,200 12,900
8,900
600
8,700
2.9%
-3.6%
4.6%
-1.1%
0.3%
-0.9% -4.0%
1.6%
2.8% 3.3%
2.9%
0.6%
2.1%
Figure 4. Houston-The Woodlands-Sugar Land MSAAnnual Change October 2016 to October 2017
Item 8a Page 4 of 12
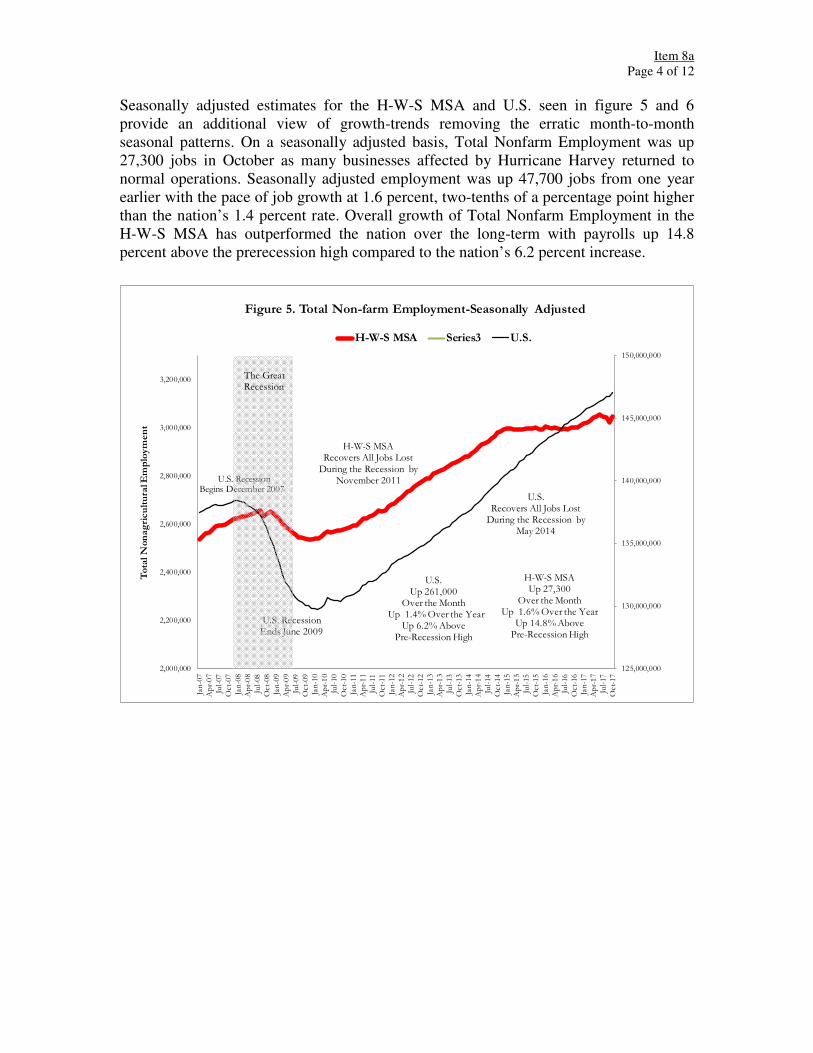
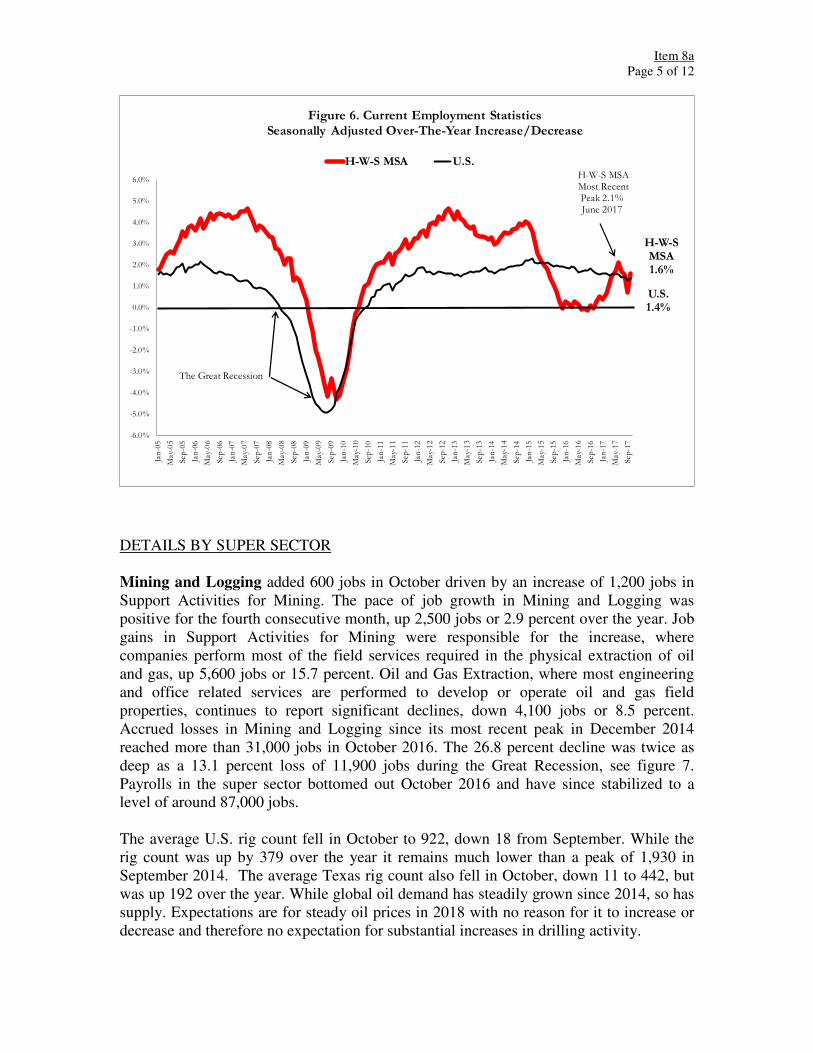
Seasonally adjusted estimates for the H-W-S MSA and U.S. seen in figure 5 and 6 provide an additional view of growth-trends removing the erratic month-to-month seasonal patterns. On a seasonally adjusted basis, Total Nonfarm Employment was up 27,300 jobs in October as many businesses affected by Hurricane Harvey returned to normal operations. Seasonally adjusted employment was up 47,700 jobs from one year earlier with the pace of job growth at 1.6 percent, two-tenths of a percentage point higher than the nation’s 1.4 percent rate. Overall growth of Total Nonfarm Employment in the H-W-S MSA has outperformed the nation over the long-term with payrolls up 14.8 percent above the prerecession high compared to the nation’s 6.2 percent increase.
125,000,000
130,000,000
135,000,000
140,000,000
145,000,000
150,000,000
2,000,000
2,200,000
2,400,000
2,600,000
2,800,000
3,000,000
3,200,000
Jan
-07
Ap
r-0
7
Jul-
07
Oct-
07
Jan
-08
Ap
r-0
8
Jul-
08
Oct-
08
Jan
-09
Ap
r-0
9
Jul-
09
Oct-
09
Jan
-10
Ap
r-1
0
Jul-
10
Oct-
10
Jan
-11
Ap
r-1
1
Jul-
11
Oct-
11
Jan
-12
Ap
r-1
2
Jul-
12
Oct-
12
Jan
-13
Ap
r-1
3
Jul-
13
Oct-
13
Jan
-14
Ap
r-1
4
Jul-
14
Oct-
14
Jan
-15
Ap
r-1
5
Jul-
15
Oct-
15
Jan
-16
Ap
r-1
6
Jul-
16
Oct-
16
Jan
-17
Ap
r-1
7
Jul-
17
Oct-
17
To
tal
Non
ag
ricu
ltu
ral E
mp
loym
en
t
Figure 5. Total Non-farm Employment-Seasonally Adjusted
H-W-S MSA Series3 U.S.
U.S. RecessionBegins December 2007
U.S. RecessionEnds June 2009
H-W-S MSARecovers All Jobs Lost
During the Recession by November 2011
H-W-S MSAUp 27,300
Over the MonthUp 1.6% Over the Year
Up 14.8% AbovePre-Recession High
U.S. Up 261,000
Over the MonthUp 1.4% Over the Year
Up 6.2% Above Pre-Recession High
The GreatRecession
U.S.Recovers All Jobs Lost
During the Recession by May 2014
Item 8a Page 5 of 12
U.S.1.4%
H-W-SMSA1.6%
-6.0%
-5.0%
-4.0%
-3.0%
-2.0%
-1.0%
0.0%
1.0%
2.0%
3.0%
4.0%
5.0%
6.0%
Jan
-05
May-
05
Sep
-05
Jan
-06
May-
06
Sep
-06
Jan
-07
May-
07
Sep
-07
Jan
-08
May-
08
Sep
-08
Jan
-09
May-
09
Sep
-09
Jan
-10
May-
10
Sep
-10
Jan
-11
May-
11
Sep
-11
Jan
-12
May-
12
Sep
-12
Jan
-13
May-
13
Sep
-13
Jan
-14
May-
14
Sep
-14
Jan
-15
May-
15
Sep
-15
Jan
-16
May-
16
Sep
-16
Jan
-17
May-
17
Sep
-17
Figure 6. Current Employment StatisticsSeasonally Adjusted Over-The-Year Increase/Decrease
H-W-S MSA U.S.H-W-S MSAMost Recent Peak 2.1%June 2017
The Great Recession
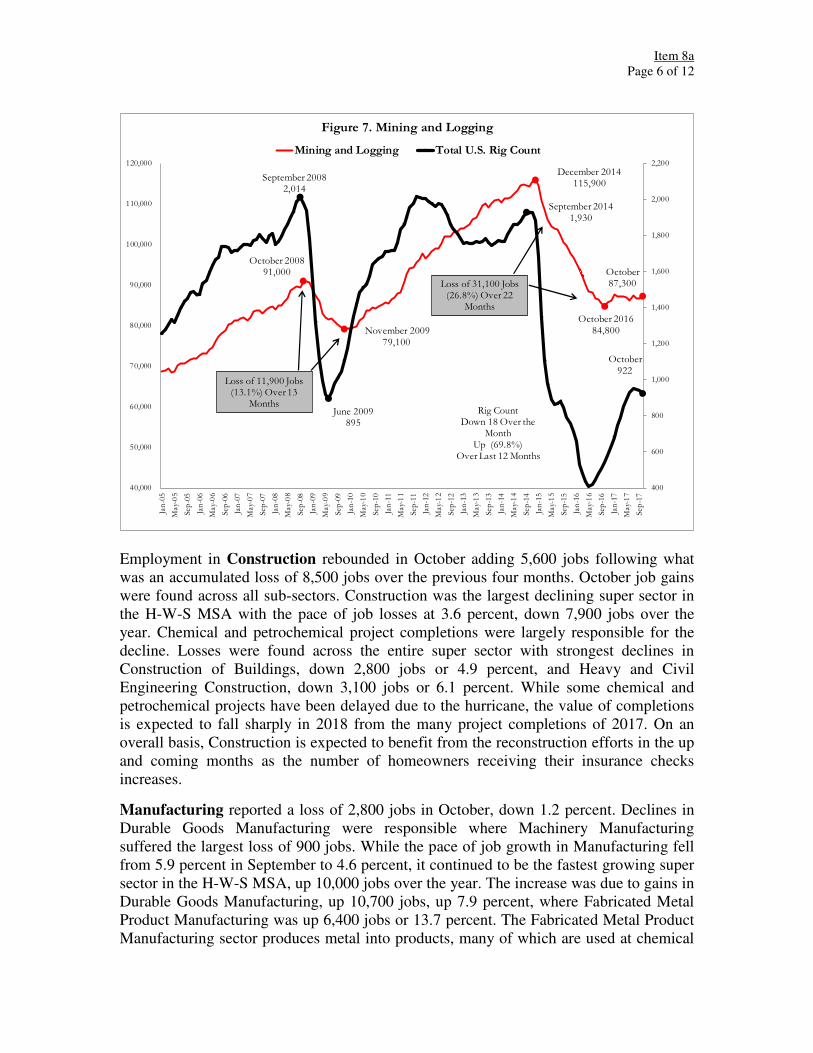
DETAILS BY SUPER SECTOR Mining and Logging added 600 jobs in October driven by an increase of 1,200 jobs in Support Activities for Mining. The pace of job growth in Mining and Logging was positive for the fourth consecutive month, up 2,500 jobs or 2.9 percent over the year. Job gains in Support Activities for Mining were responsible for the increase, where companies perform most of the field services required in the physical extraction of oil and gas, up 5,600 jobs or 15.7 percent. Oil and Gas Extraction, where most engineering and office related services are performed to develop or operate oil and gas field properties, continues to report significant declines, down 4,100 jobs or 8.5 percent. Accrued losses in Mining and Logging since its most recent peak in December 2014 reached more than 31,000 jobs in October 2016. The 26.8 percent decline was twice as deep as a 13.1 percent loss of 11,900 jobs during the Great Recession, see figure 7. Payrolls in the super sector bottomed out October 2016 and have since stabilized to a level of around 87,000 jobs. The average U.S. rig count fell in October to 922, down 18 from September. While the rig count was up by 379 over the year it remains much lower than a peak of 1,930 in September 2014. The average Texas rig count also fell in October, down 11 to 442, but was up 192 over the year. While global oil demand has steadily grown since 2014, so has supply. Expectations are for steady oil prices in 2018 with no reason for it to increase or decrease and therefore no expectation for substantial increases in drilling activity.
Item 8a Page 6 of 12
October 200891,000
November 200979,100
400
600
800
1,000
1,200
1,400
1,600
1,800
2,000
2,200
40,000
50,000
60,000
70,000
80,000
90,000
100,000
110,000
120,000Ja
n-0
5
May-
05
Sep
-05
Jan
-06
May-
06
Sep
-06
Jan
-07
May-
07
Sep
-07
Jan
-08
May-
08
Sep
-08
Jan
-09
May-
09
Sep
-09
Jan
-10
May-
10
Sep
-10
Jan
-11
May-
11
Sep
-11
Jan
-12
May-
12
Sep
-12
Jan
-13
May-
13
Sep
-13
Jan
-14
May-
14
Sep
-14
Jan
-15
May-
15
Sep
-15
Jan
-16
May-
16
Sep
-16
Jan
-17
May-
17
Sep
-17
Figure 7. Mining and Logging
Mining and Logging Total U.S. Rig Count
September 20082,014
June 2009895
December 2014115,900
October87,300
September 20141,930
Rig CountDown 18 Over the
Month Up (69.8%)
Over Last 12 Months
Loss of 11,900 Jobs(13.1%) Over 13
Months
Loss of 31,100 Jobs(26.8%) Over 22
Months
October 201684,800
October922
Employment in Construction rebounded in October adding 5,600 jobs following what was an accumulated loss of 8,500 jobs over the previous four months. October job gains were found across all sub-sectors. Construction was the largest declining super sector in the H-W-S MSA with the pace of job losses at 3.6 percent, down 7,900 jobs over the year. Chemical and petrochemical project completions were largely responsible for the decline. Losses were found across the entire super sector with strongest declines in Construction of Buildings, down 2,800 jobs or 4.9 percent, and Heavy and Civil Engineering Construction, down 3,100 jobs or 6.1 percent. While some chemical and petrochemical projects have been delayed due to the hurricane, the value of completions is expected to fall sharply in 2018 from the many project completions of 2017. On an overall basis, Construction is expected to benefit from the reconstruction efforts in the up and coming months as the number of homeowners receiving their insurance checks increases.
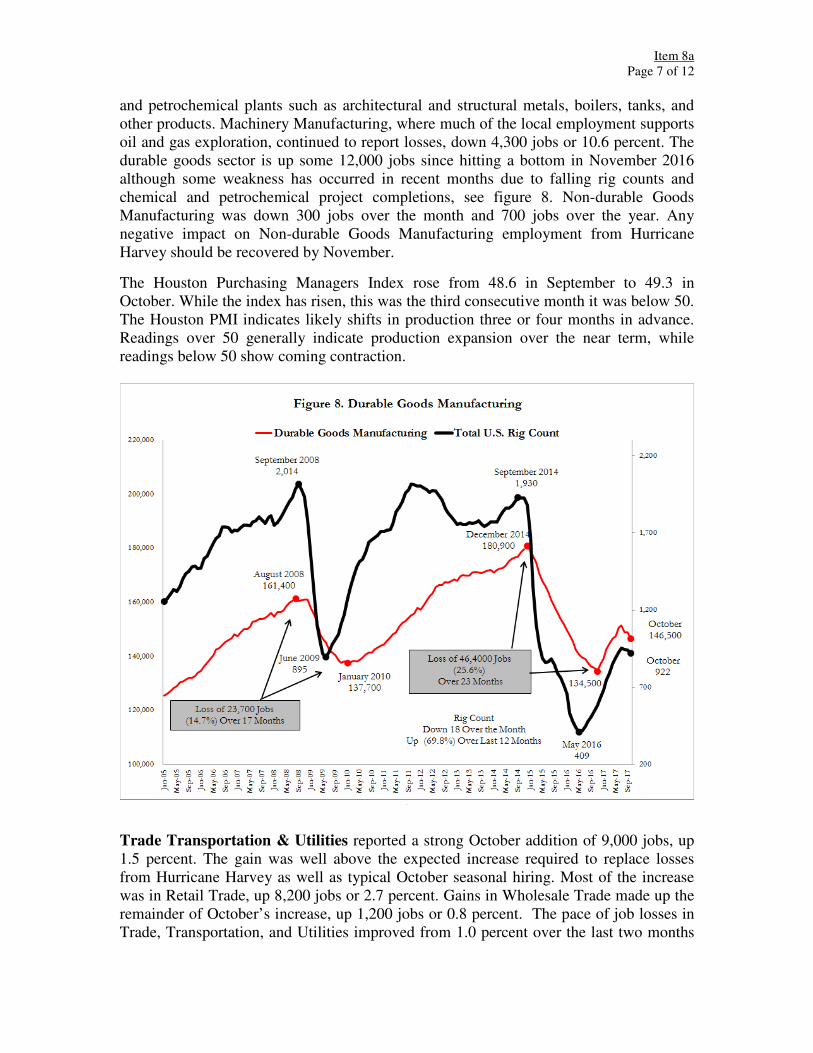
Manufacturing reported a loss of 2,800 jobs in October, down 1.2 percent. Declines in Durable Goods Manufacturing were responsible where Machinery Manufacturing suffered the largest loss of 900 jobs. While the pace of job growth in Manufacturing fell from 5.9 percent in September to 4.6 percent, it continued to be the fastest growing super sector in the H-W-S MSA, up 10,000 jobs over the year. The increase was due to gains in Durable Goods Manufacturing, up 10,700 jobs, up 7.9 percent, where Fabricated Metal Product Manufacturing was up 6,400 jobs or 13.7 percent. The Fabricated Metal Product Manufacturing sector produces metal into products, many of which are used at chemical
Item 8a Page 7 of 12
and petrochemical plants such as architectural and structural metals, boilers, tanks, and other products. Machinery Manufacturing, where much of the local employment supports oil and gas exploration, continued to report losses, down 4,300 jobs or 10.6 percent. The durable goods sector is up some 12,000 jobs since hitting a bottom in November 2016 although some weakness has occurred in recent months due to falling rig counts and chemical and petrochemical project completions, see figure 8. Non-durable Goods Manufacturing was down 300 jobs over the month and 700 jobs over the year. Any negative impact on Non-durable Goods Manufacturing employment from Hurricane Harvey should be recovered by November.
The Houston Purchasing Managers Index rose from 48.6 in September to 49.3 in October. While the index has risen, this was the third consecutive month it was below 50. The Houston PMI indicates likely shifts in production three or four months in advance. Readings over 50 generally indicate production expansion over the near term, while readings below 50 show coming contraction.
.
Trade Transportation & Utilities reported a strong October addition of 9,000 jobs, up 1.5 percent. The gain was well above the expected increase required to replace losses from Hurricane Harvey as well as typical October seasonal hiring. Most of the increase was in Retail Trade, up 8,200 jobs or 2.7 percent. Gains in Wholesale Trade made up the remainder of October’s increase, up 1,200 jobs or 0.8 percent. The pace of job losses in Trade, Transportation, and Utilities improved from 1.0 percent over the last two months

Item 8a Page 8 of 12
to 0.3 percent representing a loss of 2,000 jobs over the year. The improvement was made possible by Retail Trade, which had been reporting over-the-year declines, where payrolls were up 1,000 jobs or 0.3 percent over the year. Wholesale Trade was still reporting a loss but conditions improved, down 1,800 jobs or 1.1 percent over the year compared to September’s 2.2 percent decline. Transportation, Warehousing, and Utilities was down 1,200 jobs or 0.9 percent over the year.
Information was down 600 jobs in October with payrolls down 1,300 jobs or 4.0 percent over the year. About half of the MSA’s employment in information resides in telecommunications where payrolls were down 400 jobs or 2.9 percent over the year. The remainder of jobs in the industry sector are found in newspaper and periodical publishing, software publishing, motion picture and sound recording, and data processing hosting and related services.
Financial Activities experienced an increase for the fourth consecutive month in October adding another 700 jobs, up 0.4 percent. The increase was due to gains in Real Estate and Rental and Leasing, up 1,300 jobs or 2.3 percent. Credit Intermediation and Related Activities suffered a loss of 900 jobs over the month, down 2.0 percent. The super sector experienced a net gain of 2,500 jobs over the year with the pace of job growth at 1.6 percent. The increase was made possible by gains in Insurance Carriers and Related Activities, up 1,400 jobs or 3.9 percent, and Real Estate and Rental and Leasing, up 1,300 jobs or 2.3 percent. Depository Credit Intermediation suffered a substantial loss of 900 jobs over the year, down 3.1 percent.
Professional and Business Services reported an increase of 6,100 jobs in October as many returned to work following Hurricane Harvey and staffing agencies boosted hiring for recovery efforts. Professional and Business Services was the largest job-producing super sector in the H-W-S MSA adding 13,200 jobs over the year with the pace of job growth at 2.8 percent, up from a 2.1 percent increase in September. Employment Services was responsible for most of the growth with payrolls up 13,000 jobs or 16.1 percent over the year. While October gains in Employment Services are believed to be related to Hurricane Harvey, most of the growth over the last year is likely related to increased drilling activity, see figure 9. Architectural, Engineering, and Related Services reported its first substantial year-over-year increase in October since March 2015, up 1,200 jobs or 1.8 percent. Services to Buildings and Dwellings suffered the only substantial decline of 2,400 jobs or 4.5 percent over the year.
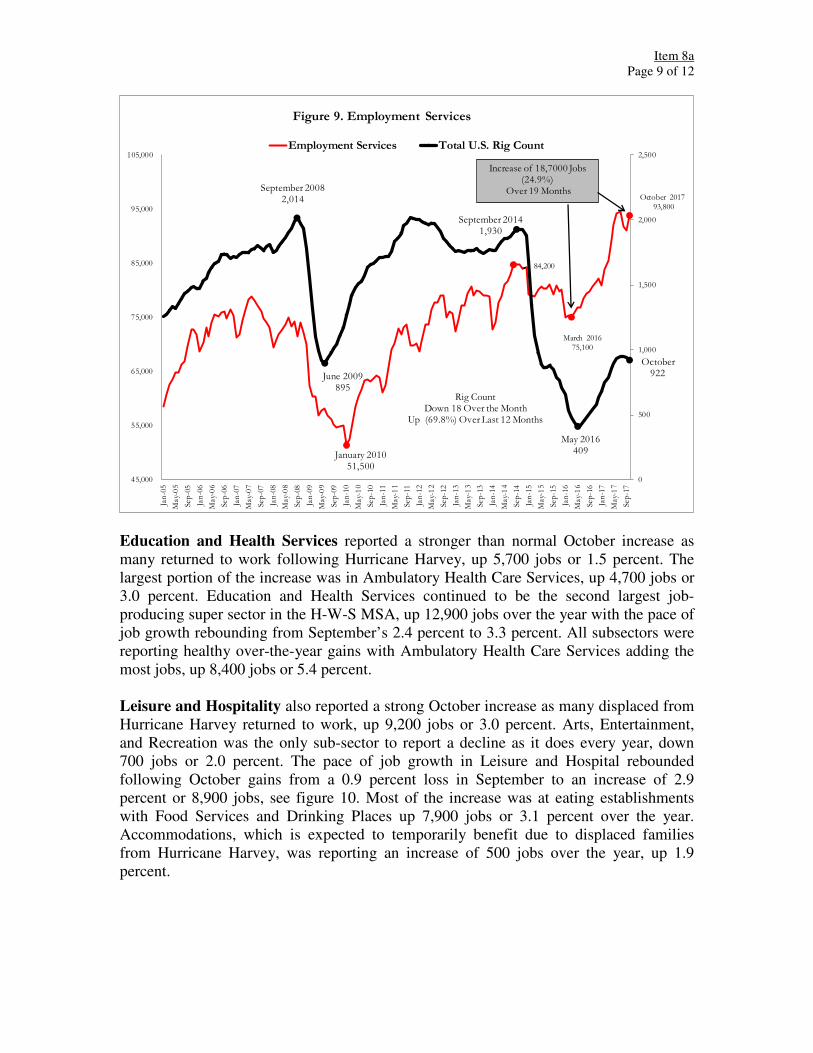
Item 8a Page 9 of 12
January 201051,500
84,200
March 2016
75,100
October 2017
93,800
Rig CountDown 18 Over the Month
Up (69.8%) Over Last 12 Months
May 2016409
October922
0
500
1,000
1,500
2,000
2,500
45,000
55,000
65,000
75,000
85,000
95,000
105,000Ja
n-0
5
May-
05
Sep
-05
Jan
-06
May-
06
Sep
-06
Jan
-07
May-
07
Sep
-07
Jan
-08
May-
08
Sep
-08
Jan
-09
May-
09
Sep
-09
Jan
-10
May-
10
Sep
-10
Jan
-11
May-
11
Sep
-11
Jan
-12
May-
12
Sep
-12
Jan
-13
May-
13
Sep
-13
Jan
-14
May-
14
Sep
-14
Jan
-15
May-
15
Sep
-15
Jan
-16
May-
16
Sep
-16
Jan
-17
May-
17
Sep
-17
Figure 9. Employment Services
Employment Services Total U.S. Rig Count
September 20082,014
June 2009895
September 20141,930
Increase of 18,7000 Jobs(24.9%)
Over 19 Months
Education and Health Services reported a stronger than normal October increase as many returned to work following Hurricane Harvey, up 5,700 jobs or 1.5 percent. The largest portion of the increase was in Ambulatory Health Care Services, up 4,700 jobs or 3.0 percent. Education and Health Services continued to be the second largest job-producing super sector in the H-W-S MSA, up 12,900 jobs over the year with the pace of job growth rebounding from September’s 2.4 percent to 3.3 percent. All subsectors were reporting healthy over-the-year gains with Ambulatory Health Care Services adding the most jobs, up 8,400 jobs or 5.4 percent. Leisure and Hospitality also reported a strong October increase as many displaced from Hurricane Harvey returned to work, up 9,200 jobs or 3.0 percent. Arts, Entertainment, and Recreation was the only sub-sector to report a decline as it does every year, down 700 jobs or 2.0 percent. The pace of job growth in Leisure and Hospital rebounded following October gains from a 0.9 percent loss in September to an increase of 2.9 percent or 8,900 jobs, see figure 10. Most of the increase was at eating establishments with Food Services and Drinking Places up 7,900 jobs or 3.1 percent over the year. Accommodations, which is expected to temporarily benefit due to displaced families from Hurricane Harvey, was reporting an increase of 500 jobs over the year, up 1.9 percent.
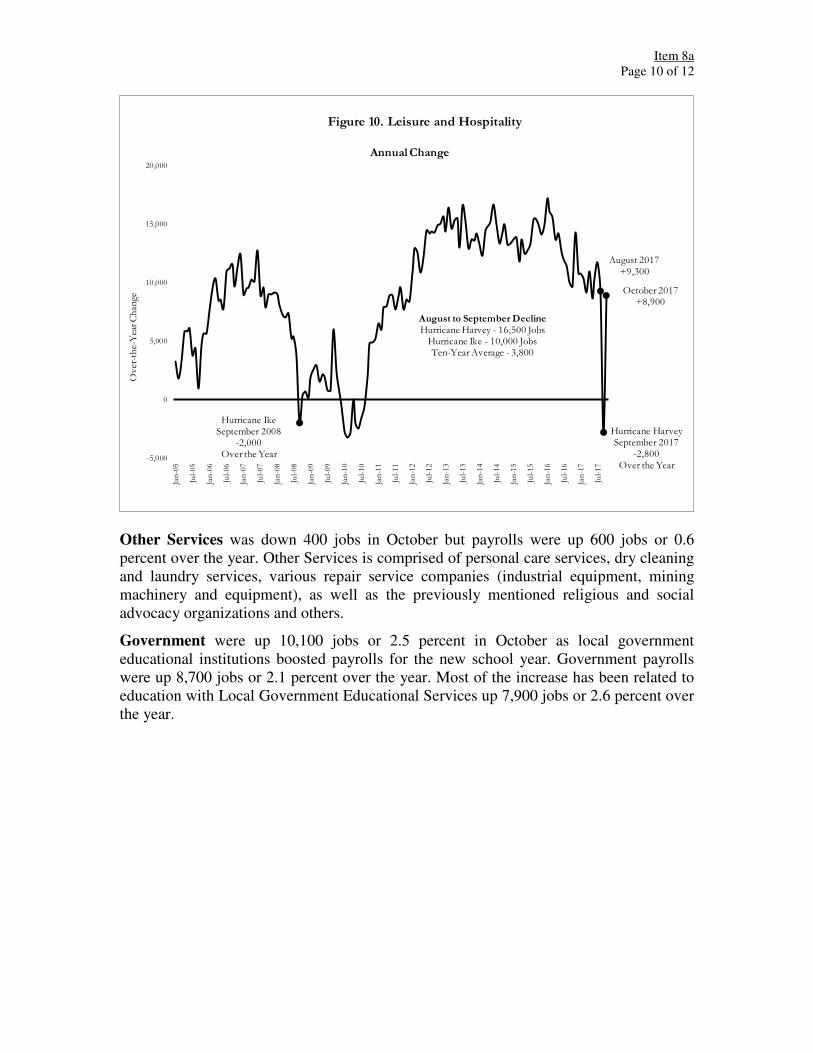
Item 8a Page 10 of 12
Hurricane IkeSeptember 2008
-2,000 Over the Year
August 2017+9,300
Hurricane HarveySeptember 2017
-2,800 Over the Year
October 2017+8,900
-5,000
0
5,000
10,000
15,000
20,000
Jan
-05
Jul-
05
Jan
-06
Jul-
06
Jan
-07
Jul-
07
Jan
-08
Jul-
08
Jan
-09
Jul-
09
Jan
-10
Jul-
10
Jan
-11
Jul-
11
Jan
-12
Jul-
12
Jan
-13
Jul-
13
Jan
-14
Jul-
14
Jan
-15
Jul-
15
Jan
-16
Jul-
16
Jan
-17
Jul-
17
Over
-th
e-Y
ear
Ch
ange
Figure 10. Leisure and Hospitality
August to September DeclineHurricane Harvey - 16,500 Jobs
Hurricane Ike - 10,000 JobsTen-Year Average - 3,800
Annual Change
Other Services was down 400 jobs in October but payrolls were up 600 jobs or 0.6 percent over the year. Other Services is comprised of personal care services, dry cleaning and laundry services, various repair service companies (industrial equipment, mining machinery and equipment), as well as the previously mentioned religious and social advocacy organizations and others.
Government were up 10,100 jobs or 2.5 percent in October as local government educational institutions boosted payrolls for the new school year. Government payrolls were up 8,700 jobs or 2.1 percent over the year. Most of the increase has been related to education with Local Government Educational Services up 7,900 jobs or 2.6 percent over the year.
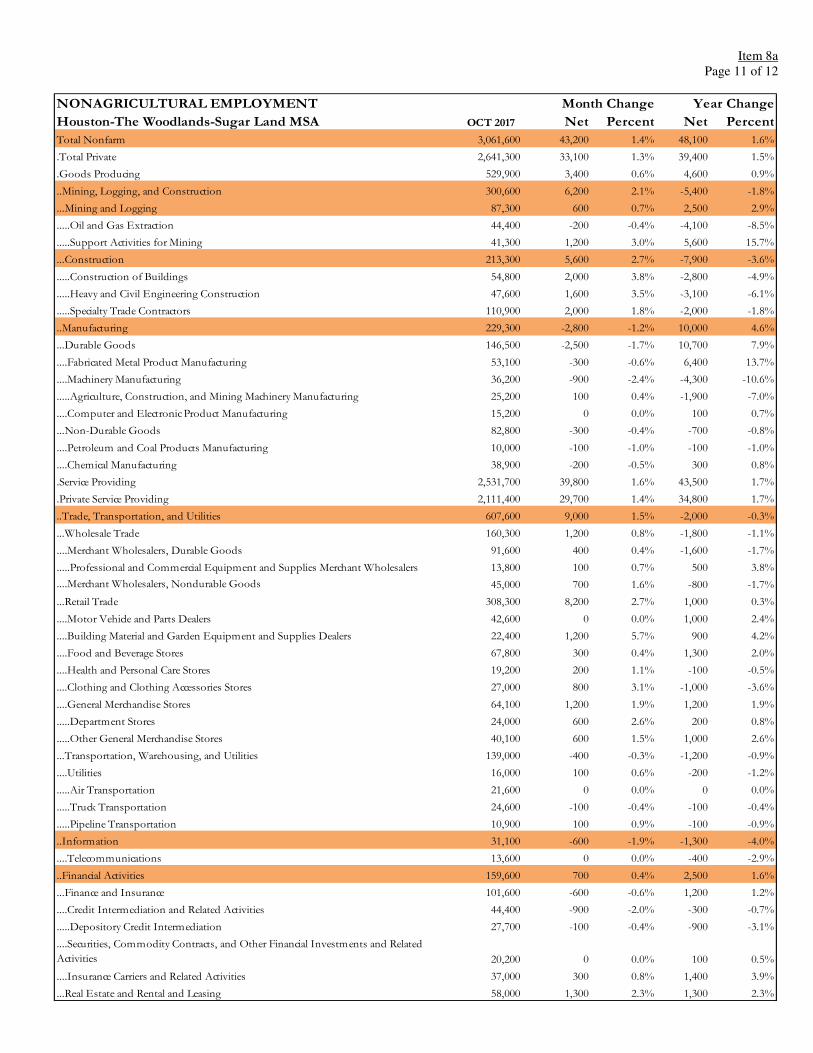
Item 8a Page 11 of 12
NONAGRICULTURAL EMPLOYMENT
Houston-The Woodlands-Sugar Land MSA OCT 2017 Net Percent Net Percent
Total Nonfarm 3,061,600 43,200 1.4% 48,100 1.6%
.Total Private 2,641,300 33,100 1.3% 39,400 1.5%
.Goods Producing 529,900 3,400 0.6% 4,600 0.9%
..Mining, Logging, and Construction 300,600 6,200 2.1% -5,400 -1.8%
...Mining and Logging 87,300 600 0.7% 2,500 2.9%
.....Oil and Gas Extraction 44,400 -200 -0.4% -4,100 -8.5%
.....Support Activities for Mining 41,300 1,200 3.0% 5,600 15.7%
...Construction 213,300 5,600 2.7% -7,900 -3.6%
.....Construction of Buildings 54,800 2,000 3.8% -2,800 -4.9%
.....Heavy and Civil Engineering Construction 47,600 1,600 3.5% -3,100 -6.1%
.....Specialty Trade Contractors 110,900 2,000 1.8% -2,000 -1.8%
..Manufacturing 229,300 -2,800 -1.2% 10,000 4.6%
...Durable Goods 146,500 -2,500 -1.7% 10,700 7.9%
....Fabricated Metal Product Manufacturing 53,100 -300 -0.6% 6,400 13.7%
....Machinery Manufacturing 36,200 -900 -2.4% -4,300 -10.6%
.....Agriculture, Construction, and Mining Machinery Manufacturing 25,200 100 0.4% -1,900 -7.0%
....Computer and Electronic Product Manufacturing 15,200 0 0.0% 100 0.7%
...Non-Durable Goods 82,800 -300 -0.4% -700 -0.8%
....Petroleum and Coal Products Manufacturing 10,000 -100 -1.0% -100 -1.0%
....Chemical Manufacturing 38,900 -200 -0.5% 300 0.8%
.Service Providing 2,531,700 39,800 1.6% 43,500 1.7%
.Private Service Providing 2,111,400 29,700 1.4% 34,800 1.7%
..Trade, Transportation, and Utilities 607,600 9,000 1.5% -2,000 -0.3%
...Wholesale Trade 160,300 1,200 0.8% -1,800 -1.1%
....Merchant Wholesalers, Durable Goods 91,600 400 0.4% -1,600 -1.7%
.....Professional and Commercial Equipment and Supplies Merchant Wholesalers 13,800 100 0.7% 500 3.8%
....Merchant Wholesalers, Nondurable Goods 45,000 700 1.6% -800 -1.7%
...Retail Trade 308,300 8,200 2.7% 1,000 0.3%
....Motor Vehicle and Parts Dealers 42,600 0 0.0% 1,000 2.4%
....Building Material and Garden Equipment and Supplies Dealers 22,400 1,200 5.7% 900 4.2%
....Food and Beverage Stores 67,800 300 0.4% 1,300 2.0%
....Health and Personal Care Stores 19,200 200 1.1% -100 -0.5%
....Clothing and Clothing Accessories Stores 27,000 800 3.1% -1,000 -3.6%
....General Merchandise Stores 64,100 1,200 1.9% 1,200 1.9%
.....Department Stores 24,000 600 2.6% 200 0.8%
.....Other General Merchandise Stores 40,100 600 1.5% 1,000 2.6%
...Transportation, Warehousing, and Utilities 139,000 -400 -0.3% -1,200 -0.9%
....Utilities 16,000 100 0.6% -200 -1.2%
.....Air Transportation 21,600 0 0.0% 0 0.0%
.....Truck Transportation 24,600 -100 -0.4% -100 -0.4%
.....Pipeline Transportation 10,900 100 0.9% -100 -0.9%
..Information 31,100 -600 -1.9% -1,300 -4.0%
....Telecommunications 13,600 0 0.0% -400 -2.9%
..Financial Activities 159,600 700 0.4% 2,500 1.6%
...Finance and Insurance 101,600 -600 -0.6% 1,200 1.2%
....Credit Intermediation and Related Activities 44,400 -900 -2.0% -300 -0.7%
.....Depository Credit Intermediation 27,700 -100 -0.4% -900 -3.1%
....Securities, Commodity Contracts, and Other Financial Investments and Related
Activities 20,200 0 0.0% 100 0.5%
....Insurance Carriers and Related Activities 37,000 300 0.8% 1,400 3.9%
...Real Estate and Rental and Leasing 58,000 1,300 2.3% 1,300 2.3%
Month Change Year Change
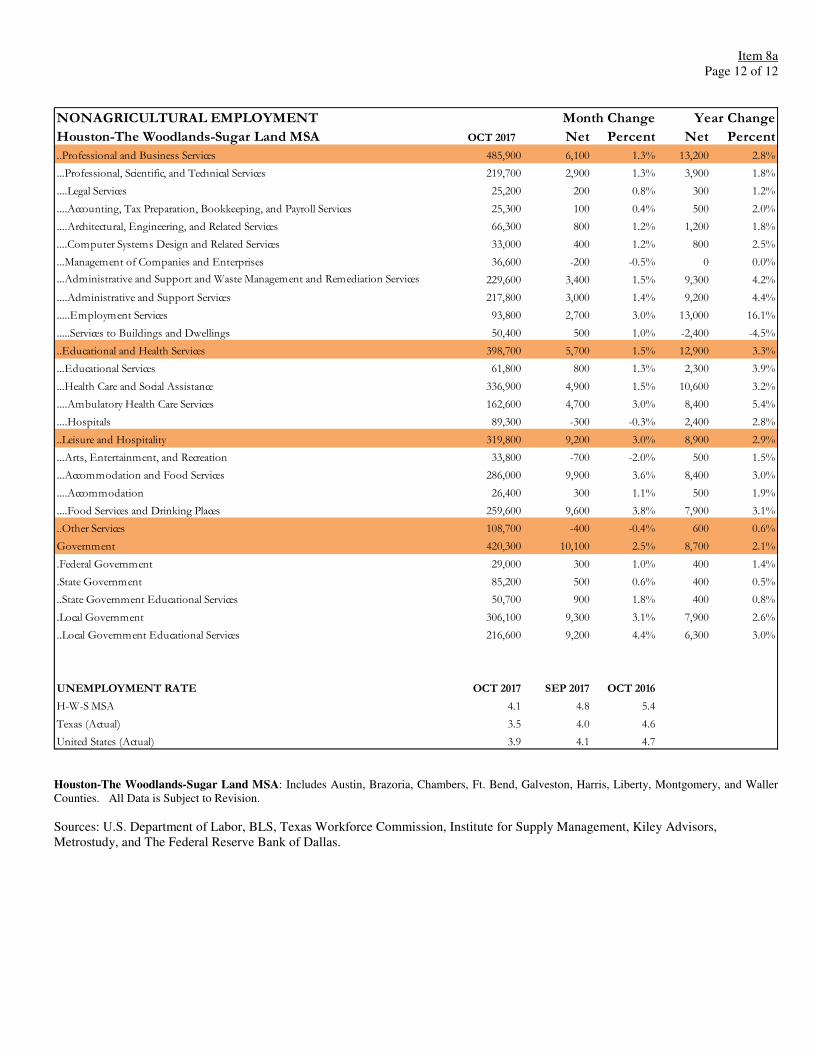
Item 8a Page 12 of 12
NONAGRICULTURAL EMPLOYMENT
Houston-The Woodlands-Sugar Land MSA OCT 2017 Net Percent Net Percent
..Professional and Business Services 485,900 6,100 1.3% 13,200 2.8%
...Professional, Scientific, and Technical Services 219,700 2,900 1.3% 3,900 1.8%
....Legal Services 25,200 200 0.8% 300 1.2%
....Accounting, Tax Preparation, Bookkeeping, and Payroll Services 25,300 100 0.4% 500 2.0%
....Architectural, Engineering, and Related Services 66,300 800 1.2% 1,200 1.8%
....Computer Systems Design and Related Services 33,000 400 1.2% 800 2.5%
...Management of Companies and Enterprises 36,600 -200 -0.5% 0 0.0%
...Administrative and Support and Waste Management and Remediation Services 229,600 3,400 1.5% 9,300 4.2%
....Administrative and Support Services 217,800 3,000 1.4% 9,200 4.4%
.....Employment Services 93,800 2,700 3.0% 13,000 16.1%
.....Services to Buildings and Dwellings 50,400 500 1.0% -2,400 -4.5%
..Educational and Health Services 398,700 5,700 1.5% 12,900 3.3%
...Educational Services 61,800 800 1.3% 2,300 3.9%
...Health Care and Social Assistance 336,900 4,900 1.5% 10,600 3.2%
....Ambulatory Health Care Services 162,600 4,700 3.0% 8,400 5.4%
....Hospitals 89,300 -300 -0.3% 2,400 2.8%
..Leisure and Hospitality 319,800 9,200 3.0% 8,900 2.9%
...Arts, Entertainment, and Recreation 33,800 -700 -2.0% 500 1.5%
...Accommodation and Food Services 286,000 9,900 3.6% 8,400 3.0%
....Accommodation 26,400 300 1.1% 500 1.9%
....Food Services and Drinking Places 259,600 9,600 3.8% 7,900 3.1%
..Other Services 108,700 -400 -0.4% 600 0.6%
Government 420,300 10,100 2.5% 8,700 2.1%
.Federal Government 29,000 300 1.0% 400 1.4%
.State Government 85,200 500 0.6% 400 0.5%
..State Government Educational Services 50,700 900 1.8% 400 0.8%
.Local Government 306,100 9,300 3.1% 7,900 2.6%
..Local Government Educational Services 216,600 9,200 4.4% 6,300 3.0%
UNEMPLOYMENT RATE OCT 2017 SEP 2017 OCT 2016
H-W-S MSA 4.1 4.8 5.4
Texas (Actual) 3.5 4.0 4.6
United States (Actual) 3.9 4.1 4.7
Month Change Year Change
Houston-The Woodlands-Sugar Land MSA: Includes Austin, Brazoria, Chambers, Ft. Bend, Galveston, Harris, Liberty, Montgomery, and Waller Counties. All Data is Subject to Revision.
Sources: U.S. Department of Labor, BLS, Texas Workforce Commission, Institute for Supply Management, Kiley Advisors, Metrostudy, and The Federal Reserve Bank of Dallas.