Embed Size (px)
Citation preview


To Ersin
PATTERNS OF FINANCIAL CAPITAL FLOWS AND ACCUMULATION IN THE POST-1990 TURKISH ECONOMY
The Institute of Economics and Social Sciences of
Bilkent University
by
F. GÜL BİÇER
In Partial Fulfilment of the Requirements for the Degree of MASTER OF ARTS IN ECONOMICS
in
THE DEPARTMENT OF ECONOMICS
BİLKENT UNIVERSITY ANKARA
July 2003
I certify that I have read this thesis and found that it is fully adequate, in scope and in quality, as a thesis for a degree of Master of Economics. ------------------------------------
Prof. Dr. Erinç Yeldan Supervisor
I certify that I have read this thesis and found that it is fully adequate, in scope and in quality, as a thesis for a degree of Master of Economics. ------------------------------------
Assistant Prof. Dr. Ümit Özlale Examining Committee Member
I certify that I have read this thesis and found that it is fully adequate, in scope and in quality, as a thesis for a degree of Master of Economics. ------------------------------------
Assistant Prof. Dr. A. M. Cem Somel Examining Committee Member
Approval of the Institute of Economics and Social Sciences ------------------------------------
Prof. Dr. Kürşat Aydoğan Director
ABSTRACT
PATTERNS OF FINANCIAL CAPITAL FLOWS AND ACCUMULATION IN THE POST-
1990 TURKISH ECONOMY
Biçer, F. Gül
M.A., Department of Economics
Supervisor: Erinç Yeldan
July 2003
Decreasing investment opportunities in the industrialized countries and arbitrage
seeking approach of the developed countries has caused to surge of capital inflows to the
developing countries in 1990s. After capital account liberalization in 1989, Turkey has also
exposed the capital flows and faced with the negative impacts due to the lack of capital
controls and the early timing of capital account liberalization before providing economic,
political and legal requirements.The thesis analyse the impacts of macroeconomic variables
with capital inflows and the behaviour of investment with macroeconomic prices and capital
inflows for Turkey using econometric techniques.
Keywords and phrases: Capital Inflows, Capital Account Liberalization, Developing
Countries, Arbitrage Seeking, Investment, Turkey.
iii
ÖZET
1990 SONRASI TÜRKİYE EKONOMİSİ’ NDE FİNANSAL SERMAYE HAREKETLERİ
Biçer, F. Gül
Yüksek Lisans, İktisat Bölümü
Tez Yöneticisi: Erinç Yeldan
Temmuz 2003
Doksanlı yıllarda endüstrileşmiş ülkelerdeki yatırım olanaklarının azalması ve
gelişmekte olan ülkelerdeki arbitraj fırsatları, kısa vadeli sermaye hareketlerinin gelişmiş
ülkelerden gelişmekte olan ülkelere yönelmesini sağlamıştır. 1989’da sermaye hareketlerinin
serbestleşmesi sonucu, Türkiye ekonomisi de diğer gelişmekte olan ülkeler gibi kısa vadeli
sermaye hareketlerinin sebep olduğu negatif etkilere maruz kalmıştır. Bunda sermaye
hareketlerinin girişinin kontrol edilmemesinin ve gerekli ekonomik, politik ve hukuki
düzenlemeler yapılmaksızın sermaye hareketlerinin serbestleştirilmesinin önemli bir etkisi
olmuştur. Bu tez sermaye girişlerinin makro değişkenlerle etkisini ve yatırım davranışlarının
makro fiyatlardan ve sermaye girişlerinden nasıl etkilendiğini Türkiye için ekonometrik
tekniklerle incelemektedir.
Anahtar Kelimeler: Sermaye Girişleri, Sermaye Hareketlerinin Liberalleştirilmesi, Arbitraj ,
Yatırım, Türkiye.
iv

ACKNOWLEDGMENTS
I wish to express my deepest gratitude to Professor Erinç Yeldan for his invaluable guidance
and his patience throughout the course of this study. I am truly grateful to Assistant Professor
Ümit Özlale, for helping me in the econometric methods. I am also indebted to Assistant
Professor Cem Somel for accepting to review this material and giving his special advices.
And my special thanks to Kıvılcım Metin for her very keen support. She was always there
when I need advice. I benefited greatly from her comments and suggestions.
I am thankful also to Pelin Pasin, Figen Özmen, Elif Ulusal, Hülya Gündoğan and Ersin Uslan
for their excellent friendship and support.
Finally, I wish to express my sincere thanks to my mother, my father, my brother and sister
for always loving me and believing in me.
v
TABLE OF CONTENTS
ABSTRACT .............................................................................................................. iii
ÖZET......................................................................................................................... . iv
ACKNOWLEDGMENTS......................................................................................... v
TABLE OF CONTENTS .......................................................................................... vi
CHAPTER I: INTRODUCTION .............................................................................. 1
CHAPTER II: HISTORICAL BACKGROUND OF THE TURKISH ECONOMY 5
CHAPTER III: CAPITAL ACCOUNT LIBERALIZATION: THEORY AND ...... 12
THE TURKISH EXPERIENCE
CHAPTER IV: IMPACTS OF THE CAPITAL FLOWS ON .................................. 19
MACROECONOMIC BALANCES
CHAPTER V: CONSEQUENCES OF THE CAPITAL INFLOWS........................ 30
vi
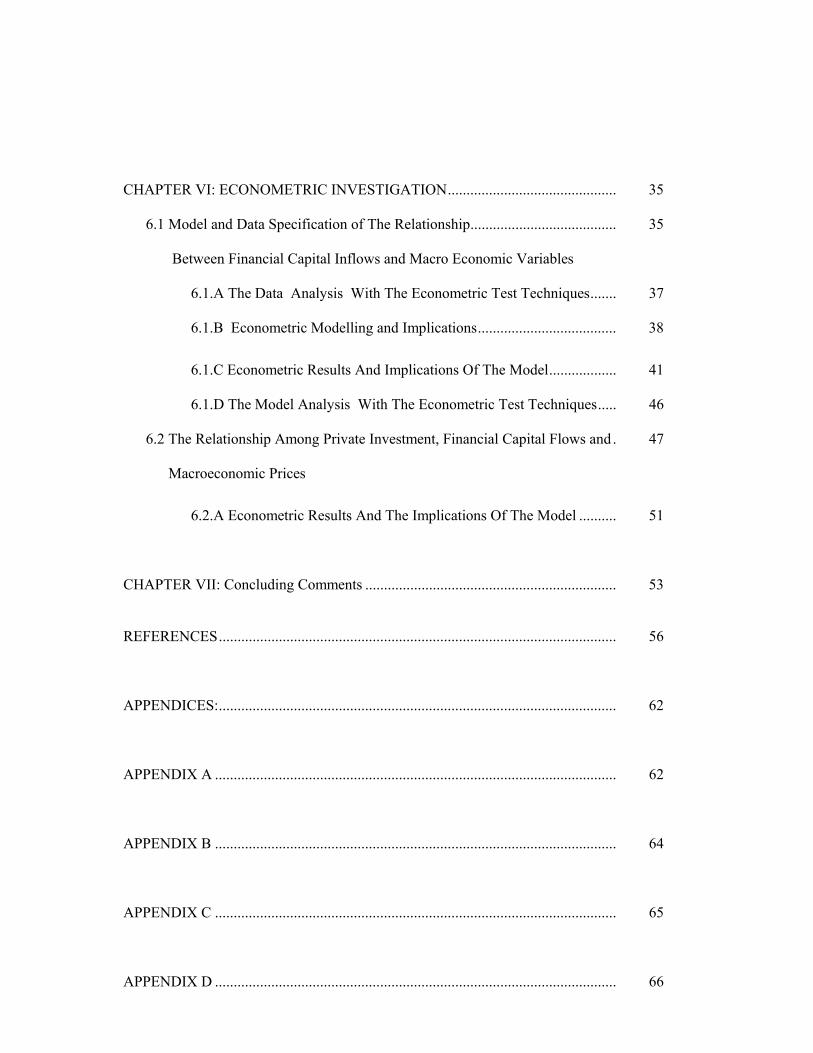
CHAPTER VI: ECONOMETRIC INVESTIGATION............................................. 35
6.1 Model and Data Specification of The Relationship....................................... 35
Between Financial Capital Inflows and Macro Economic Variables
6.1.A The Data Analysis With The Econometric Test Techniques....... 37
6.1.B Econometric Modelling and Implications..................................... 38
6.1.C Econometric Results And Implications Of The Model.................. 41
6.1.D The Model Analysis With The Econometric Test Techniques..... 46
6.2 The Relationship Among Private Investment, Financial Capital Flows and. 47
Macroeconomic Prices
6.2.A Econometric Results And The Implications Of The Model .......... 51
CHAPTER VII: Concluding Comments ................................................................... 53
REFERENCES.......................................................................................................... 56
APPENDICES:.......................................................................................................... 62
APPENDIX A ........................................................................................................... 62
APPENDIX B ........................................................................................................... 64
APPENDIX C ........................................................................................................... 65
APPENDIX D ........................................................................................................... 66
1
1 Introduction
The 1990s witnessed a surge in capital flows to the developing countries. As
measured by the surplus on the capital account, the developing countries of Latin
America and Asia alone have received a sum of $670 billion of foreign capital
from 1990 to 1994 (Calvo, et al., 1996). Net flows diminished significantly in 1995
in the aftermath of the Mexican crisis, but in most cases surged once again to reach
high levels by the end of the decade. Furthermore, a structural shift was observed
in the composition of the private flows, with portfolio and other short-term capital
flows gaining importance (UNCTAD, 1998).
The rise of foreign capital inflows has initially been a welcome development.
The foreign exchange constraint which seemed binding during the 1970s and 80s
seem to have been suddenly relaxed with positive effects on consumption and
investment. In fact, theory suggests that inflows of capital would complement
national savings and that financial liberalization would improve the allocation of
scarce funds both internationally and intertemporally. Accordingly, in a world of
freely mobile capital, investable funds would flow from high-saving to low-saving
countries. This process would tend to equalize interest rates across the global
2
financial markets, North and South, and as such, it would enable the indigenous
countries to escape the size constraints on their domestic asset markets.
This benign view of international capital mobility has been challenged by
the crisis episodes of the last two decades. Both the numerous empirical case
studies and the policy lessons of the Mexican, Turkish, Argentina, and more
recently East Asian experiences revealed that the expected beneficial effects of
capital inflows have been overshadowed by the adverse impacts of excessive stock
market volatility and the persistence of exchange rate risk against unforeseen
fluctuations in the exchange rates. Furthermore, in such a world of volatile
exchange rates, the traditional dictum regarding the global equalization of real
interest rates failed to take place. In such a world, it is clearly observed that the
free mobility of international capital flows does not suffice to equalize real interest
rates that are denominated in different currencies. The persistent diverging nature
of the real rates of return across countries have been studied and documented in
Frankel (1991, and 1993); Marston (1993); Halwood and MacDonald (1994);
Blecker (1998) and Eatwell (1996).
Finally it is also to be noted that while the post-financial liberalization
episodes are characterized by very large gross capital flows, they have generated
rather small net transfers. As is also remarked by Tobin (2000), net capital flows
from the developed to the underdeveloped economies had been only on the order
of $150 billions per annum during the 1990s. One can contrast this figure with the
daily volume of speculative foreign exchange transactions reaching to $1.5
3
trillions. It is now a well-known fact that the gross volume of international capital
flows across the national boundaries is far in excess of the financing needs of
commodity trade flows or investments on physical capital, and is mostly driven by
speculative considerations of risk hedging and currency speculation. For instance,
using data of thirty two emerging markets for 1988-98, Rodrik and Velasco (2000:
61) report that “… there does not appear to be any relationship between the volume
of international trade and the level of short term debt –suggesting that trade credit
has played little or no role in driving short-term capital flows during the 1990s”.
Thus, under this characterization of the post-financial liberalization episodes,
large capital inflows as witnessed in recent years have posed serious dilemmas and
created significant policy challenges. Indeed, the recent history of the financial
crises in the “successful emerging markets” have clearly disclosed the undesirable
macroeconomic effects of the large, uncontrolled capital inflows, such as
persistence of high real interest rates, inflationary pressures, limitation of the
power of the central banks to contain the pressures of monetary expansion and of
the threat of currency substitution, real exchange rate appreciation, and widening
current account deficits. Nevertheless, the type of capital inflows is important to
determine severity of results. While short-term capital flows (hot money) are more
volatile than long-term capital flows due to their high sensitivity to changes, they
also result with much more severe disturbances. The detailed study of capital flows
and their different impacts on economy is pursued in Chuhan, Perez-Quiros and
Popper (1996) and by Claessens, Dooley and Warner (1995).
4
This thesis attempts to address these issues and investigates the determinants
of short-term foreign capital inflows for Turkey following its capital account
liberalization in 1989. Turkey’s post-financial liberalization history of
macroeconomic and political developments remains as an enigmatic deepening of
its crisis-prone fragility with persistent price inflation, persistent and rapidly
expanding fiscal deficits, and increased volatility of its gross domestic product. In
this study, I will identify capital inflows exclusively with the portfolio investments
of residents and non-residents abroad, and, using time-series econometrics, I aim to
search for the macro economic variables that best explain the behavior of capital
inflows over 1992 to 2002. I will further investigate the changing nature of the
private investment function under post-capital account liberalization and deduce
hypotheses on its correlation with capital flows and the key macro economic
prices, such as the exchange rate, the real rate of interest, and real wages.
The plan of the thesis is as follows: in the next chapter I study the historical
background of the Turkish economy. The historical evoluation of Turkey’s capital
account liberalization is explained in chapter 3. In chapter 4, I focus on how the
macro economic balances for Turkey are affected by capital inflows. Observed
features of foreign (financial) capital inflows in Turkey during the 1990s take place
in chapter 5. The econometric methodology is introduced in section 6. Here I use
time series econometrics to study the behavior of financial capital flows and that of
private fixed investments against key macro economic indicators. I conclude the
thesis in chapter 7.
5
2 Historical Background of The Turkish Economy
Turkey has experienced serious current account deficits during 1960s and
1970s with a serious foreign exchange gap at the end of the 1970s. All of these
problems led the economic authorities to introduce a set of stabilization policies
that aimed to maintain an external balance. During 1970s, low level of the interest
rates to reduce the cost of borrowing led to the diversion of money in circulation
from the banking sector to unproductive foreign exchange hoarding, and also to the
unorganized financial market. Furthermore, the interest rates are reduced to
negative levels by the end of 1970s. The industrial policy of the period was import
substitution. At the same time, economic autorities implemented a public
investment program which aimed to expand the domestic production capacity in
heavy manufacturing and capital goods.
After a foreign exchange bottleneck in 1978-1979, Turkish economy has
been liberalized by the implementation of a structural change program on January
24, 1980. In the first stage of the program, interest rates on time deposits and
credits were set free to provide financial deepening and increased saving.However,
the financial liberalization between 1980 and 1982 was not successful because
there was a need for a supervision of the financial system after setting free interest
rates (Binay and Kunter, 1998). Another critical point of the early 1980s was the
6
financial scandal of 1982, when many money brokers collected deposits of the
savers by offering very high interest rates and than collapsed together with a
number of smaller banks. An unstable economic environment and inefficient
banking system led to the bankrupcy of five banks (İstanbul Bankası, Hisarbank,
Odibank, Bağbank and İşçi Kredi Bankası) and the intervention of the Turkish
Central Bank to regulate the interest rates.
In order to promote and develop the securities market, the Capital Market
Board (CMB) was established in 1982 and started its operations in 1983. Within
the framework of the secondary market regulations by a decree in 1983, the
Istanbul Stock Exchange was reopened in 1985 and started its operations in 1986
(Atiyas and Ersel, 1992). Furthermore, Turkish residents were allowed to open
foreign accounts in banks in 1984 to increase product variety and services in the
Turkish financial system (Denizer, 2000). Other targets of this reform were to
bring the foreign reserves of banks that were abroad and to stop capital outflow.
However, the underestimation of the inflationary environment during the
application of the policy led the substitution of TL with a more acceptable currency
(foreign exchange substitution). The best policy against the substitution could have
been to increase the return on TL assets.
Overall, the export-led growth model of the 1980-1988 signaled its
insufficiency by the 1989 elections revealing the poor performance of the
macroeconomic indicators. The next step of the liberalization act was the capital
account liberalization in 1989. The targets were the liberalization of the foreign
exchange system to ease the connection with the international markets, the
7
elimination of the obstacles of buying and selling activities of the stocks and bonds
the in domestic and foreign markets, and the provision of external credit for the
banking system (Binay and Kunter, 1998). However, capital account liberalization
caused increased inflows of hot money, which made the economy more vulnerable
to macroeconomic imbalances in the domestic economy and economic crisis. Most
importantly, Turkey was not ready to the capital account liberalization because its
political and financial reforms were not completed.
In the same year, the Central Bank also implemented a new monetary
program which aimed to prevent the public sector from easy access to the Central
Bank’s credit lines. However, the government did not follow the neccessary fiscal
measures and the Treasury continued to increase both external borrowing and
internal borrowing which, in turn, was the main reason of the high interest rates in
the 1989-1994 period.
At the end of 1993, the government reversed its policy and aimed to
decrease interest rates artificially. In this direction, a higher depreciation policy and
the cancellation of a set of Treasury auctions were the implemented actions to
reduce the interest rates as these policies led the banks to rearrange their foreign
currency denominated assets and liabilities. However, this adjustment caused a rise
in the demand for foreign currency and became one of the leading factors of the
1994 crisis. In April 5, a new stabilization program was implemented. In the short-
run, the program would reduce inflation and stabilize the financial markets. In the
medium term, it would solve the public deficit and the external deficit problems. In
the long-term, it was expected that it would provide a sustainable growth. During
8
the first three months of the year, the CB tried to control the money supply with
open market operations and tried to halt increases in the exchange rate by means of
direct sales of foreign currency. After three months, the CB aimed to actualize the
targets of the stabilization program and applied a tight monetary policy. The
program and high devaluation have created some positive results during the
remaining part of 1994 and 1995 such as improving the current account balance,
decreasing budget deficit, and creating a short -term decrease in hot money flows.
After the 1994 crisis, the government and the commercial banks turned again to
short -term borrowing from abroad and lending at home due to high profit margins
of the Treasury bills and the government bonds, i.e. they became arbitrage seekers
without considering market risk, exchange rate risk and proper management of the
their assets and liabilities. Therefore, Turkish economy became more vulnerable
even to small crises.
During 1995-1999, there was a no real improvement in the economy and
the economic and political disabilities that caused the 1994 crisis have not been
stabilized. In the first ten months of 1995, the CB followed the stabilization
program of the 1994 and exchange rates have been used in line with inflation. In
the same year, Turkey signed a stand-by agreement with IMF. However, the
economic instability increased due to the end of the implication of the stand-by
agreement, the changes of government, the early elections and the entrance to the
Custom Union.
9
In July 1998, Turkey initiated a new disinflation program with the
guidance of IMF. The Staff Monitored Program (SMF) targeted to improve the
fiscal balance and reduce price inflation. Although the program was successful in
improving the fiscal balances and reducing inflation slightly, it could not solve the
interest rate problem. The disinflation program has been broken down by the
effects of August 1998 Russian crisis, the general elections in April 1999, and two
highly destructive earthquakes in August and October 1999. Increasing
government expenditures deteriorated the fiscal balance and the pressures on the
financial market raised the real interest rates. The currency crisis caused the
reversal of capital flows in 1998 and the outcome of the crisis was the bankruptcy
of eight banks as they are taken over formally by the Saving Deposit Insurance
Fund (SDIS). All of these events worsened the fiscal balance and increased the
debt-GDP ratio so another IMF directed disinflation program was implemented in
December 1999. The requirements and the obligations of the program were
imposed by the first letter of intent signed in December 9, 1999. A new banking
law was part of this program and the so-called Banking Regulation and
Supervision Agency (BRSA) was established with this law.
The second letter of intent came with the disinflation program introduced in
December 18, which was based on exchange rate policies. The program would use
the nominal exchange rate as an anchor for disinflation purposes. Turkey’s
stabilization program with the exchange rates were based on a crawling peg against
a dollar-euro basket. Monetary authorities were to use international reserves as the
10
instrument to create the appropriate depreciation rate which is required for the
inflation targeting (Reyes, 2002). Therefore, an exchange rate band that serves as a
nominal anchor can be accepted as a supplement to the inflation targeting
framework. The second letter of intent stressed the importance of the policies and
the date of each acts of the program was also specified.
In November 2000, Turkey has experienced a severe financial crisis. The
Supplementary Reserve Facility granted with $7.5 billions in December 22 was
requested from the IMF to restore confidence. Furthermore, the monetary program
was revised and the continued implementation of the program reduced the tension
in the financial markets. Due to increased credibility which was a result of the
monetary help by the IMF, capital flows were reversed. Central Bank`s reserves
returned to their precrisis levels and the interest rates decreased by the beginning of
2001. The program achieved reducing inflation but it was not adequate to prevent
currency appreciation, the increase of fragility of banking system and the
vulnerability to external impacts. Additionally, the political dispute between the
Prime Minister and the President on February 19, 2001 triggered the reemergence
of the financial market crisis creating a reduction in the monetary base and a rise in
the interest rates (short-term interest rates jumped up to above 5000%). As a result,
Turkey experienced economic and currency crises simultaneously (twin crises) in
November 2000 and February 2001. The response of the government was to let
free float of exchange rates, let the Turkish lira to depreciate ferociously and a new
agreement with the IMF (a new letter of intent). Imposibility of an open capital

11
account, a pegged exchange rate and independent monetary policy together were
observed once more (Fischer, 2002).

12
3 Capital Account Liberalization: Theory and The Turkish
Experience
Financial liberalization has become one of the main economic concerns for
most of the countries for the last twenty years due to the fact that the constraints on
the financial resources were distracting the efficient distribution of the economic
resources and potential growth rates (McKinnon ,1973 and Shaw, 1973). Basic
targets of the financial liberalization are increasing the savings, attracting foreign
capital and increasing efficiency in the usage of financial resources. However, the
economic and political stability, efficiency in a well controled banking system and
the level of interest rates are the important factors to determine a good
liberalization policy (Binay and Kunter, 1998).
In fact, the implementation of positive interest rates, the new possibility of
foreign exchange accounts, the advance of financial deepening for the private
households have meant increased foreign exchange deposits with vigorous
currency substitution (Guncavdi and Bleaney, 1996a). Thus, it can be stated that
the "pioneers of financial deepening" in Turkey in the 1980's have been the public
sector securities and the forex deposits. Furthermore, Turkey's stabilization and
adjustment program of 1980 aimed to change the pattern of the development
strategy and the domestic resources to channel for investment through more
efficient intermediation in financial markets along with Mckinnon-Shaw

13
hypothesis (Guncavdi and Bleaney, 1996b). However, as Akyüz (1990) attests,
Turkish experience did not conform to the McKinnon-Shaw hypothesis of financial
deepening with a shift of portfolio selection from "unproductive" assets to those
favoring fixed capital formation.
During 1990`s, industrialized countries turned towards emerging markets for
investment and so capital flows leaked to the developing countries. The main
reasons behind this movement were the reduction of investment opportunities in
the industrialized countries and arbitrage seeking. However, the capital flows
carried significant risk factors together with their expended positive effects such as
providing additional finance and enhancing investment opportunities. On the other
hand, equity liabilities such as FDIs are less likely to cause any crisis, as oposed to
debt liabilities because they are not under the pressure of either currency or
maturity mismatches (Fernandez, and Hausmann, 2000). Additionally, the foreign
direct investments (FDI) bring new technology, better investment and management
opportunities and they cannot be revered easily. However, most of the capital
flows take the form of hot money and portfolio investments because capital
inflows from the developed countries search for a politically and economically safe
market for long-term investments. Yet, this is not the case for most of the
developing countries, and short-term capital flows destabilize the macroeconomic
balances and increases the fragility of the country against crisis.
FDI has low sensitivity to international interest rate differentials and the aim
of this type of investment is long-term profitability (Lopez-Mejia, 1999). On the
14
other hand, the short-term capital flows are more short-term oriented and have
greater volatility because reversing them is less costly than reversing FDIs.
Globalization of an economy spreads the effects of the economic outcomes
throughout the countries and these outcomes may bring positive or negative
externalities. Rising capital flows to the larger countries stimulates capital inflows
to the smaller countries in the same region. Therefore, a successful stabilization
program in one or more of the larger countries which increases capital inflows to
these countries may have positive externalities on the smaller countries in the
region (Calvo and Reinhart, 1996). Furthermore, the investors face with the
problem of imperfect information because the available time is very short to
transform the information for the investments that is made by short-term capital
flows. The imperfect information causes inflows of capital to the countries with the
same characteristics in the case of positive effects and causes outflows of capital
from the same type of countries in the case of negative effects such as crisis.
Tequila Crisis in 1995, the 1997 East Asian Crisis and the 1998 Russian Crisis are
the typical examples of negative externalities.
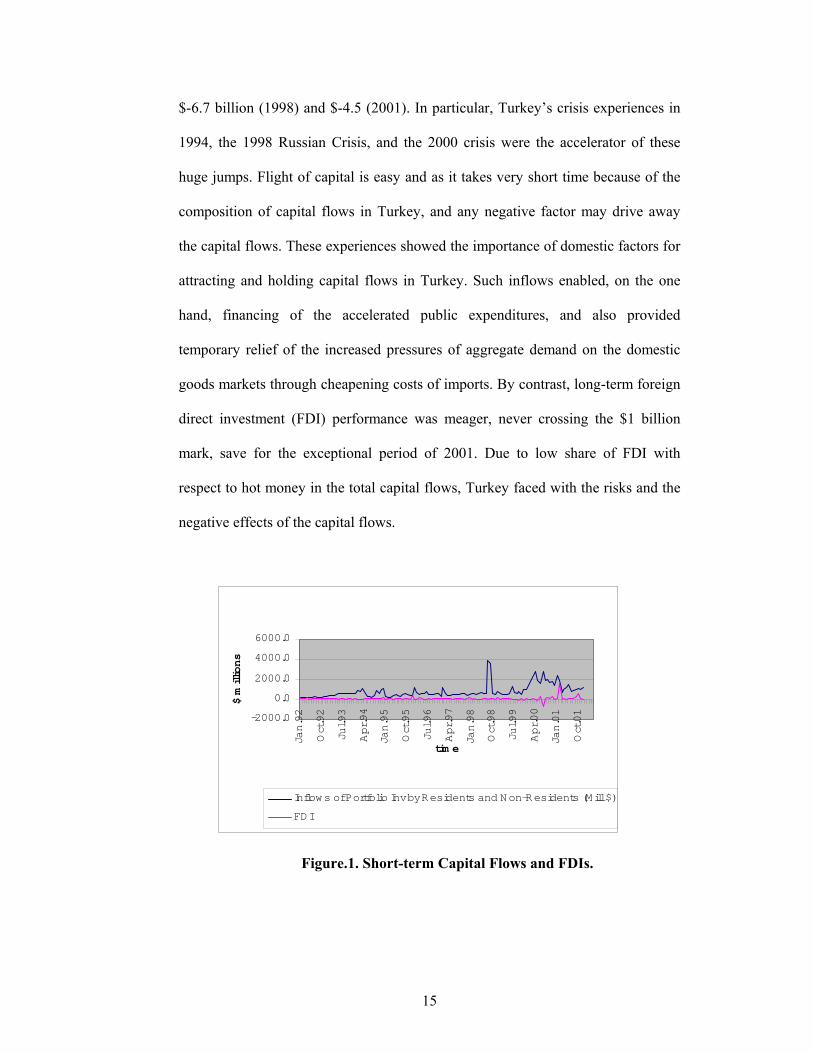
With its capital account liberalization in 1989, Turkish domestic market was
exposed to the volatile movements of the short- term capital flows (flows of “hot
money”). The observed volatility was due to high arbitrage opportunities in the
market and the insecure economic and political environment such as high inflation
rate, low growth rate and the continuum of early elections. Net portfolio
investments fluctuated abruptly through the 1990s between $3.9 billion (1993) and
15
$-6.7 billion (1998) and $-4.5 (2001). In particular, Turkey’s crisis experiences in
1994, the 1998 Russian Crisis, and the 2000 crisis were the accelerator of these
huge jumps. Flight of capital is easy and as it takes very short time because of the
composition of capital flows in Turkey, and any negative factor may drive away
the capital flows. These experiences showed the importance of domestic factors for
attracting and holding capital flows in Turkey. Such inflows enabled, on the one
hand, financing of the accelerated public expenditures, and also provided
temporary relief of the increased pressures of aggregate demand on the domestic
goods markets through cheapening costs of imports. By contrast, long-term foreign
direct investment (FDI) performance was meager, never crossing the $1 billion
mark, save for the exceptional period of 2001. Due to low share of FDI with
respect to hot money in the total capital flows, Turkey faced with the risks and the
negative effects of the capital flows.
-2000.0
0.0
2000.0
4000.0
6000.0
Jan.92
Oct.92
Jul.93
Apr.94
Jan.95
Oct.95
Jul.96
Apr.97
Jan.98
Oct.98
Jul.99
Apr.00
Jan.01
Oct.01
tim e
$ millions
Inflows of Portfolio Inv by Residents and Non-Residents (Mill $)
FDI
Figure.1. Short-term Capital Flows and FDIs.
16
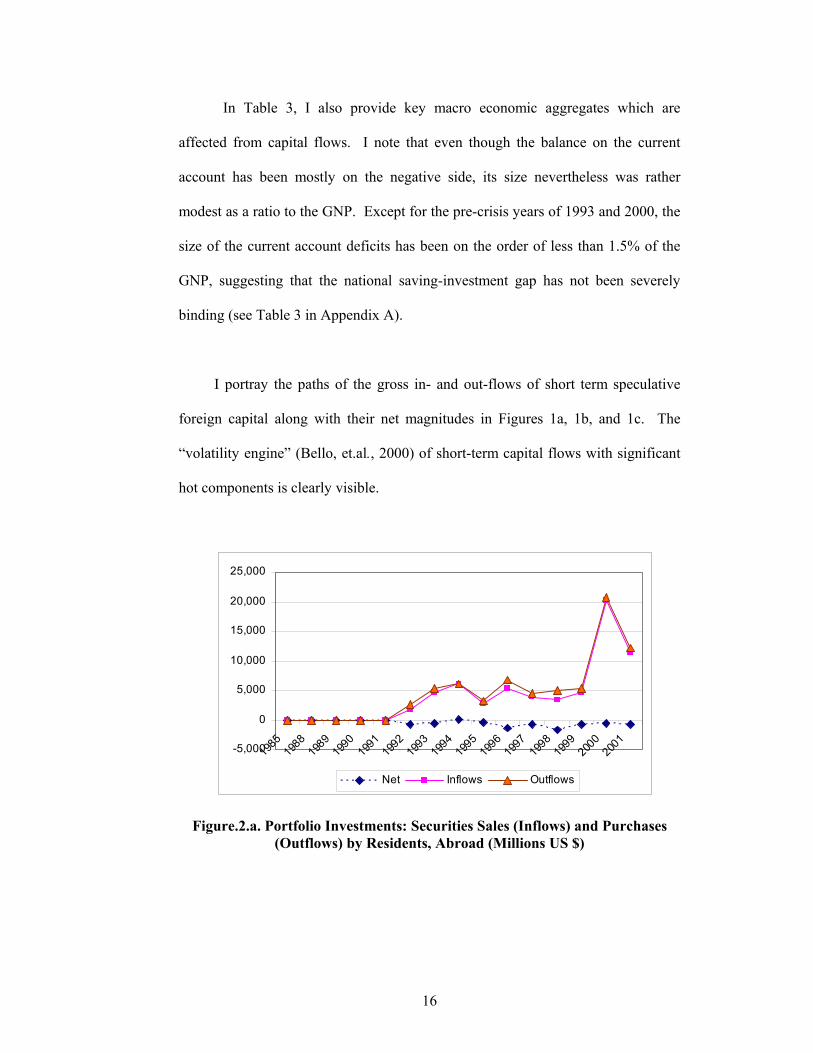
In Table 3, I also provide key macro economic aggregates which are
affected from capital flows. I note that even though the balance on the current
account has been mostly on the negative side, its size nevertheless was rather
modest as a ratio to the GNP. Except for the pre-crisis years of 1993 and 2000, the
size of the current account deficits has been on the order of less than 1.5% of the
GNP, suggesting that the national saving-investment gap has not been severely
binding (see Table 3 in Appendix A).
I portray the paths of the gross in- and out-flows of short term speculative
foreign capital along with their net magnitudes in Figures 1a, 1b, and 1c. The
“volatility engine” (Bello, et.al., 2000) of short-term capital flows with significant
hot components is clearly visible.
-5,000
0
5,000
10,000
15,000
20,000
25,000
1985
1988
1989
1990
1991
1992
1993
1994
1995
1996
1997
1998
1999
2000
2001
Net Inflows Outflows
Figure.2.a. Portfolio Investments: Securities Sales (Inflows) and Purchases (Outflows) by Residents, Abroad (Millions US $)
17
-10,000
-5,000
0
5,000
10,000
15,000
20,000
1985
1988
1989
1990
1991
1992
1993
1994
1995
1996
1997
1998
1999
2000
2001
Net Inflows Outflows
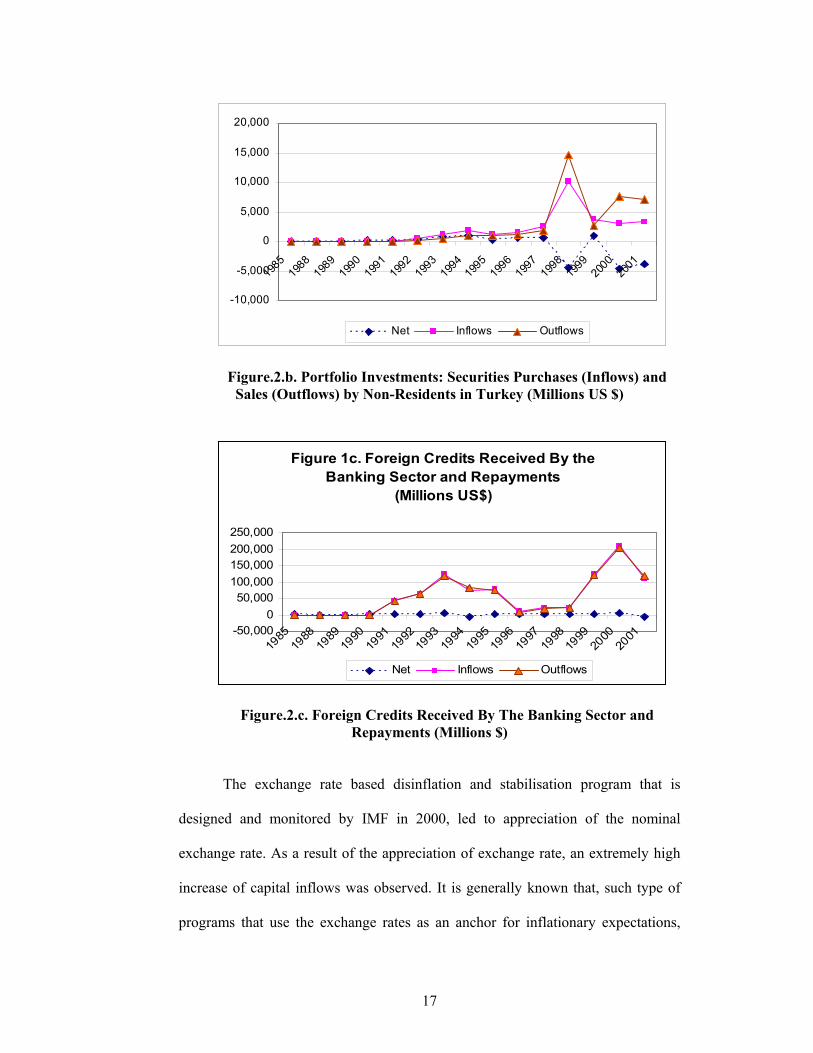
Figure.2.b. Portfolio Investments: Securities Purchases (Inflows) and Sales (Outflows) by Non-Residents in Turkey (Millions US $)
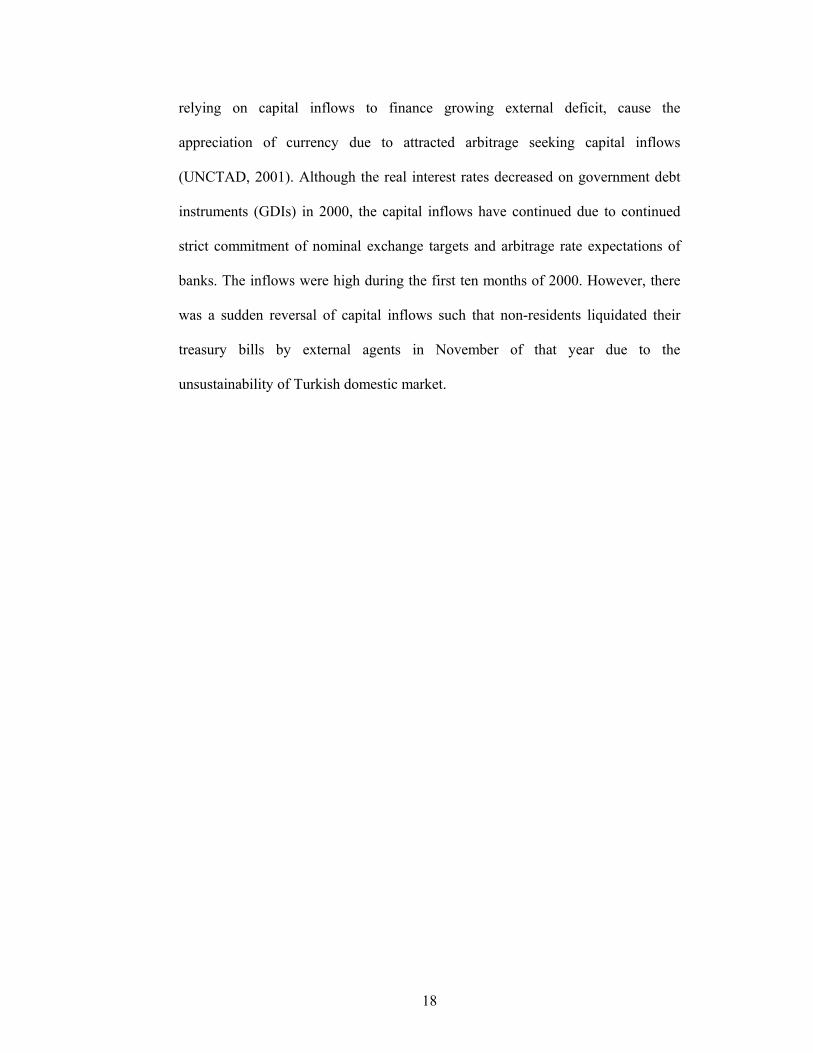
Figure 1c. Foreign Credits Received By the Banking Sector and Repayments
(Millions US$)
-50,0000
50,000100,000150,000200,000250,000
1985
1988
1989
1990
1991
1992
1993
1994
1995
1996
1997
1998
1999
2000
2001
Net Inflows Outflows
Figure.2.c. Foreign Credits Received By The Banking Sector and Repayments (Millions $)
The exchange rate based disinflation and stabilisation program that is
designed and monitored by IMF in 2000, led to appreciation of the nominal
exchange rate. As a result of the appreciation of exchange rate, an extremely high
increase of capital inflows was observed. It is generally known that, such type of
programs that use the exchange rates as an anchor for inflationary expectations,
18
relying on capital inflows to finance growing external deficit, cause the
appreciation of currency due to attracted arbitrage seeking capital inflows
(UNCTAD, 2001). Although the real interest rates decreased on government debt
instruments (GDIs) in 2000, the capital inflows have continued due to continued
strict commitment of nominal exchange targets and arbitrage rate expectations of
banks. The inflows were high during the first ten months of 2000. However, there
was a sudden reversal of capital inflows such that non-residents liquidated their
treasury bills by external agents in November of that year due to the
unsustainability of Turkish domestic market.
19
4 Impacts of The Capital Flows on Macroeconomic Balances
Capital account liberalization made the Turkish economy to be highly
dependent on capital flows and caused the emergence of financial cycles.
Substantial leakages from net inflows constituted a linkage between growth,
current account balance, and capital flows. The rising amount of hot money
inflows and outflows exacerbated external and domestic instability (Boratav and
Yeldan, 2001).
Turkey’s attempt for integration with the global markets was not timed well
due to the fact that its local market was not ready yet for such an act. Since the
countries in Latin America also made the same mistake, it became one of the most
important reasons that destroyed their economy and led them to economic crises.
Capital account liberalization requires some economic and legal adjustments in the
beginning such as improvement and regulation of the banking sector, transparency,
strong healthy fiscal and monetary policies, stable politics, and improvements of
macroeconomic balances (i.e. GDP growth, trade balance, moderate inflation, etc.).
On the other hand, creating requirements for capital account liberalization is not
easy. Therefore, making the reforms as much as possible, countries should also
apply capital controls, which Turkey failed to implement.
20
The recent studies imply the association of capital inflows with the
appreciation of exchange rates (Calvo, et al., 1996; Fernandez-Arias and Montiel,
1995). Choosing nominal exchange rate as an implicit anchor with no fiscal
adjustment and the persistent high inflation was the reason of this appreciation by
coupling with capital inflows (Celasun, et al., 1999). If the borrowing by the fiscal
sector follows a continuum path during the exchange rate based policies (ERBSP)
applied, the result becomes the higher appreciation of the exchange rates because
higher internal borrowing leads to higher interest rates causing an increase in the
capital inflows. Therefore, pursuing the existing ERBSP becomes impossible and
the result becomes deterioration of the macro economic balances such as GDP
growth and current account. Through the end of the ERBSP, a recession is
inevitable. The study by Celasun (2001) suggests two results for the ERBSP: a
sustained real exchange rate appreciation and a boom-recession cycle such that an
increase in the consumption and aggregate demand in early stages and a recession
later is expected. The studies by Rodriguez (1982) and Dornbusch (1982)
suggested the inflation stickiness as the reason for the boom and recession in
ERBSPs. Since Turkey had backward looking price settings especially in the non-
tradeable goods sector (Celasun, 2001), the stabilisation program based on ERBSP
which was started on December 1999 is abandoned by the February 2001.
Turkey’s macroeconomic policies were not adequate and efficient to support the
applied ERBSP.
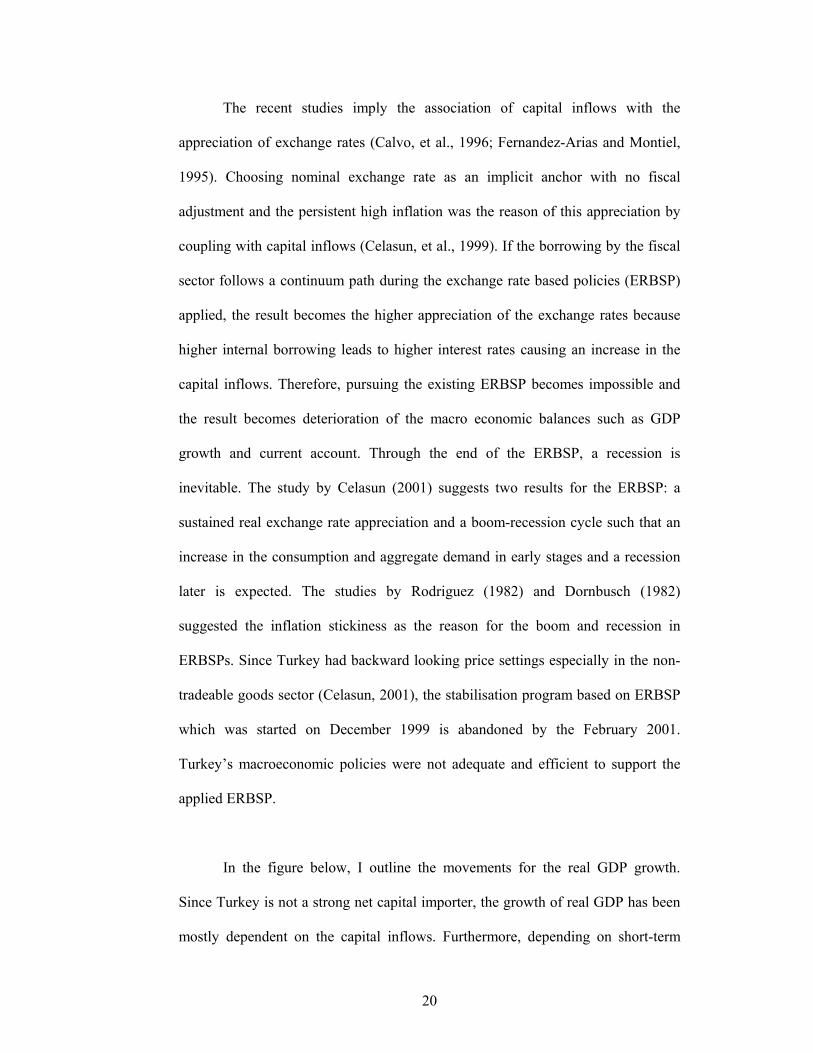
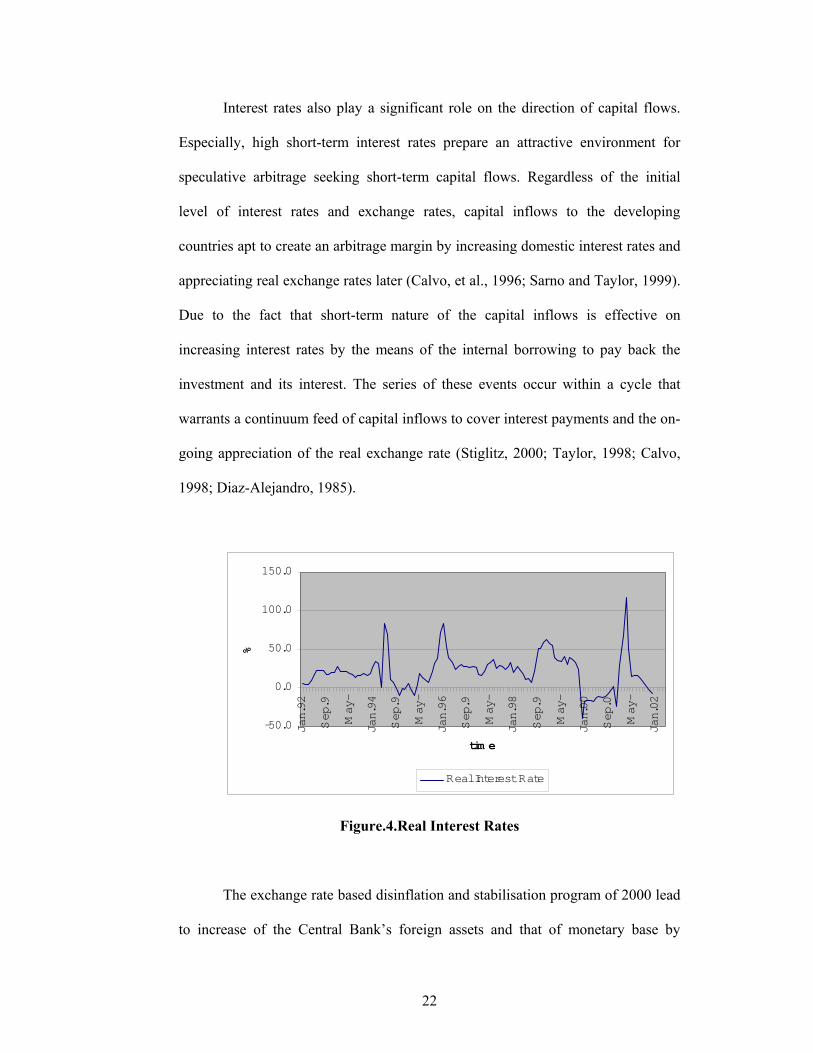
In the figure below, I outline the movements for the real GDP growth.
Since Turkey is not a strong net capital importer, the growth of real GDP has been
mostly dependent on the capital inflows. Furthermore, depending on short-term
21
capital inflows rather than FDIs. Turkey’s economic growth rate increases with the
capital inflows and decreases with the flight of capital inflows. However, the
observed impacts of the portfolio inflows, especially by residents abroad, are
stronger than the foreign credits by the banking sector due to the way followed by
the banking sector credits (see also Figure 1a, 1b and 1c). The high level of interest
rates in Turkey makes harder to invest with the banking credits and also produces a
high return with low risk for the banking sector by means of investing in Treasury
Bills. Therefore, the foreign credit by banking sector flows heavily on T-bills and
weak inclination for investment and consumption leads lower level of real GDP
growth. Econometric results in the next parts of the thesis also prove the
importance of the portfolio investments rather than the foreign credits by the
banking sector by finding significant results for the portfolio investments and
insignificant results for the other.
-150.0
-100.0
-50.0
0.0
50.0
100.0
Jan.92
Agu.9
Mar-
Oct.93
May-
Dec.9
Jul.95
Feb.9
Sep.9
Apr.9
Nov.9
Jun.98
Jan.99
Agu.9
Mar-
Oct.00
May-
Dec.0
real GDP grow th
%
real gdp growth(1987=100)
Figure.3. Real GDP Growth (1987=100)
22
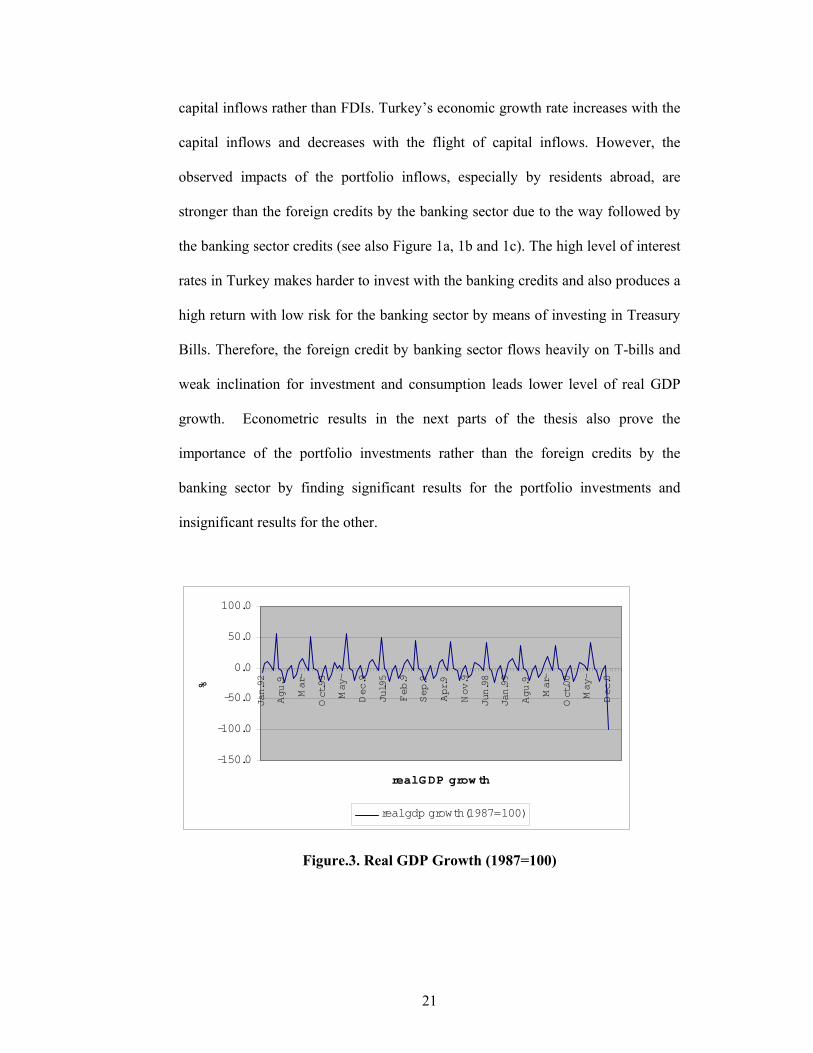
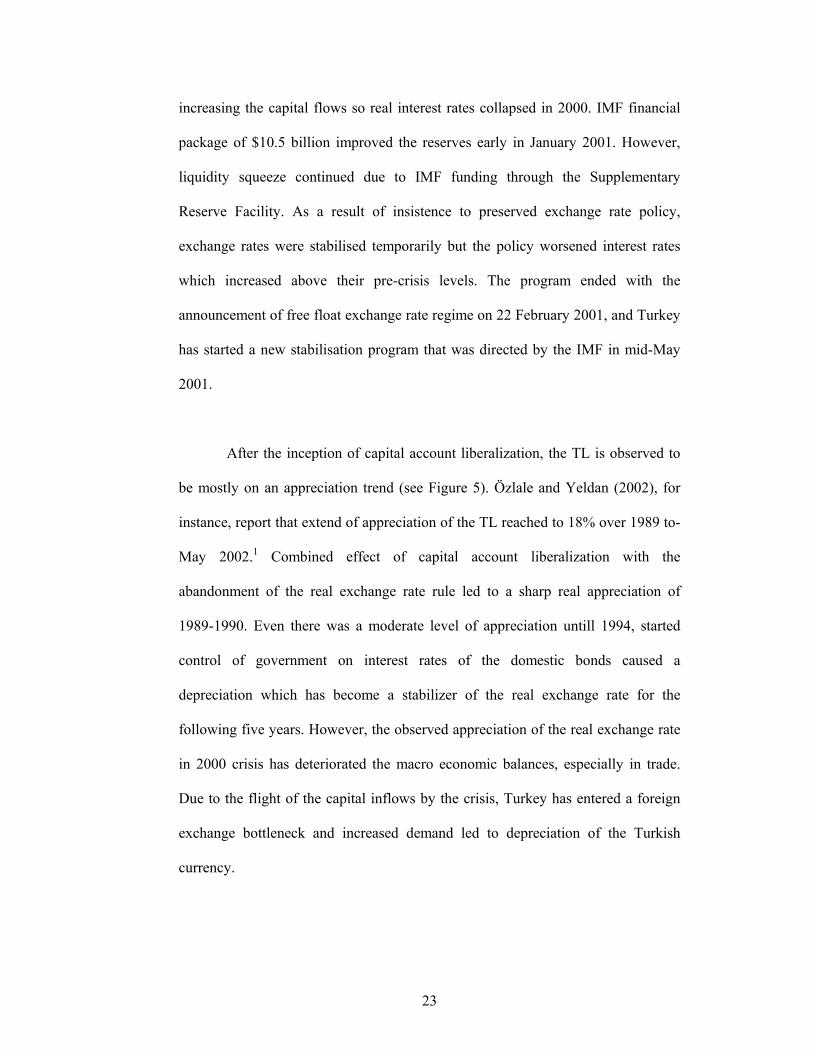
Interest rates also play a significant role on the direction of capital flows.
Especially, high short-term interest rates prepare an attractive environment for
speculative arbitrage seeking short-term capital flows. Regardless of the initial
level of interest rates and exchange rates, capital inflows to the developing
countries apt to create an arbitrage margin by increasing domestic interest rates and
appreciating real exchange rates later (Calvo, et al., 1996; Sarno and Taylor, 1999).
Due to the fact that short-term nature of the capital inflows is effective on
increasing interest rates by the means of the internal borrowing to pay back the
investment and its interest. The series of these events occur within a cycle that
warrants a continuum feed of capital inflows to cover interest payments and the on-
going appreciation of the real exchange rate (Stiglitz, 2000; Taylor, 1998; Calvo,
1998; Diaz-Alejandro, 1985).
-50.0
0.0
50.0
100.0
150.0
Jan.92
Sep.9
May-
Jan.94
Sep.9
May-
Jan.96
Sep.9
May-
Jan.98
Sep.9
May-
Jan.00
Sep.0
May-
Jan.02
tim e
%
Real Interest Rate
Figure.4.Real Interest Rates
The exchange rate based disinflation and stabilisation program of 2000 lead
to increase of the Central Bank’s foreign assets and that of monetary base by
23
increasing the capital flows so real interest rates collapsed in 2000. IMF financial
package of $10.5 billion improved the reserves early in January 2001. However,
liquidity squeeze continued due to IMF funding through the Supplementary
Reserve Facility. As a result of insistence to preserved exchange rate policy,
exchange rates were stabilised temporarily but the policy worsened interest rates
which increased above their pre-crisis levels. The program ended with the
announcement of free float exchange rate regime on 22 February 2001, and Turkey
has started a new stabilisation program that was directed by the IMF in mid-May
2001.
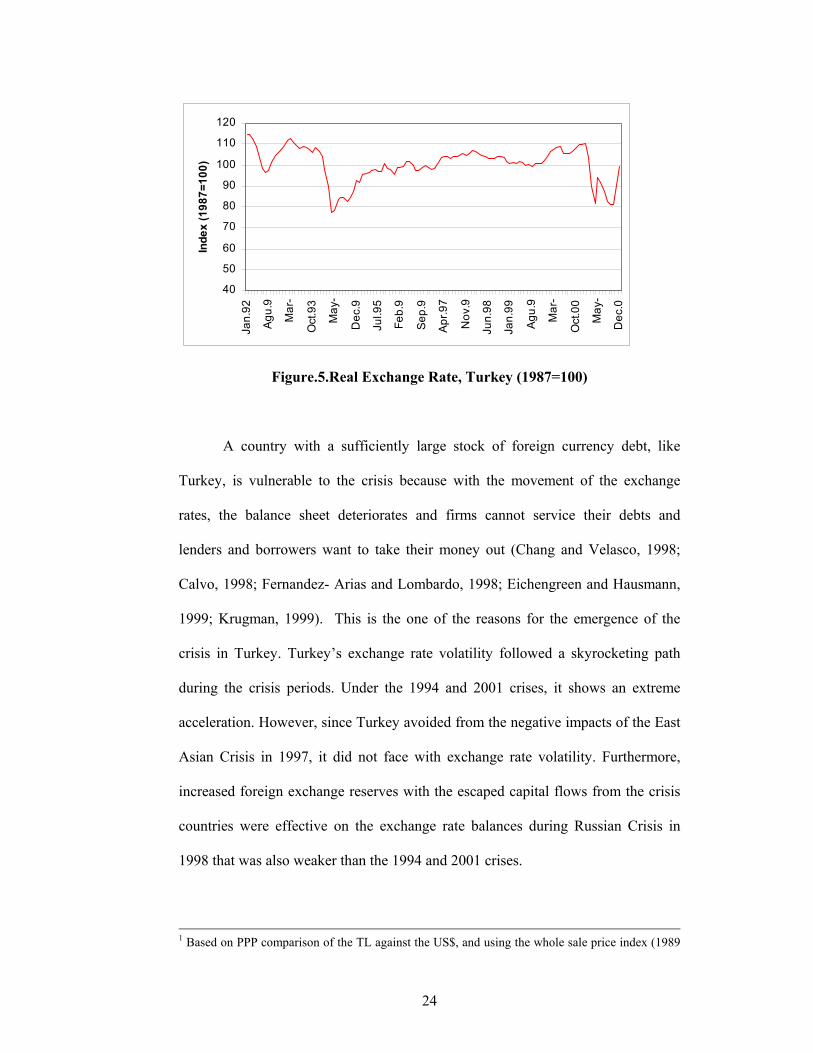
After the inception of capital account liberalization, the TL is observed to
be mostly on an appreciation trend (see Figure 5). Özlale and Yeldan (2002), for
instance, report that extend of appreciation of the TL reached to 18% over 1989 to-
May 2002.1 Combined effect of capital account liberalization with the
abandonment of the real exchange rate rule led to a sharp real appreciation of
1989-1990. Even there was a moderate level of appreciation untill 1994, started
control of government on interest rates of the domestic bonds caused a
depreciation which has become a stabilizer of the real exchange rate for the
following five years. However, the observed appreciation of the real exchange rate
in 2000 crisis has deteriorated the macro economic balances, especially in trade.
Due to the flight of the capital inflows by the crisis, Turkey has entered a foreign
exchange bottleneck and increased demand led to depreciation of the Turkish
currency.
24
40
50
60
70
80
90
100
110
120
Jan.
92
Agu.
9
Mar
-
Oct
.93
May
-
Dec
.9
Jul.9
5
Feb.
9
Sep.
9
Apr.9
7
Nov
.9
Jun.
98
Jan.
99
Agu.
9
Mar
-
Oct
.00
May
-
Dec
.0
Inde
x (1
987=
100)
Figure.5.Real Exchange Rate, Turkey (1987=100)
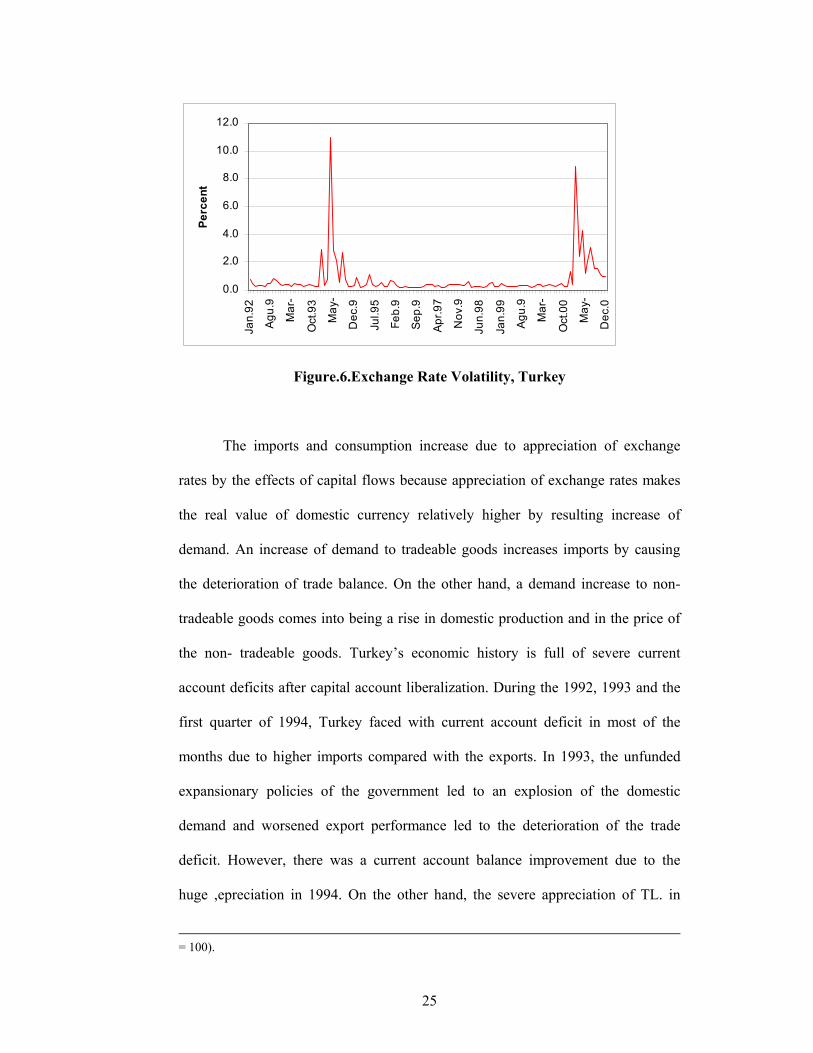
A country with a sufficiently large stock of foreign currency debt, like
Turkey, is vulnerable to the crisis because with the movement of the exchange
rates, the balance sheet deteriorates and firms cannot service their debts and
lenders and borrowers want to take their money out (Chang and Velasco, 1998;
Calvo, 1998; Fernandez- Arias and Lombardo, 1998; Eichengreen and Hausmann,
1999; Krugman, 1999). This is the one of the reasons for the emergence of the
crisis in Turkey. Turkey’s exchange rate volatility followed a skyrocketing path
during the crisis periods. Under the 1994 and 2001 crises, it shows an extreme
acceleration. However, since Turkey avoided from the negative impacts of the East
Asian Crisis in 1997, it did not face with exchange rate volatility. Furthermore,
increased foreign exchange reserves with the escaped capital flows from the crisis
countries were effective on the exchange rate balances during Russian Crisis in
1998 that was also weaker than the 1994 and 2001 crises.
1 Based on PPP comparison of the TL against the US$, and using the whole sale price index (1989
25
0.0
2.0
4.0
6.0
8.0
10.0
12.0
Jan.
92
Agu.
9
Mar
-
Oct
.93
May
-
Dec
.9
Jul.9
5
Feb.
9
Sep.
9
Apr.9
7
Nov
.9
Jun.
98
Jan.
99
Agu.
9
Mar
-
Oct
.00
May
-
Dec
.0
Perc
ent
Figure.6.Exchange Rate Volatility, Turkey
The imports and consumption increase due to appreciation of exchange
rates by the effects of capital flows because appreciation of exchange rates makes
the real value of domestic currency relatively higher by resulting increase of
demand. An increase of demand to tradeable goods increases imports by causing
the deterioration of trade balance. On the other hand, a demand increase to non-
tradeable goods comes into being a rise in domestic production and in the price of
the non- tradeable goods. Turkey’s economic history is full of severe current
account deficits after capital account liberalization. During the 1992, 1993 and the
first quarter of 1994, Turkey faced with current account deficit in most of the
months due to higher imports compared with the exports. In 1993, the unfunded
expansionary policies of the government led to an explosion of the domestic
demand and worsened export performance led to the deterioration of the trade
deficit. However, there was a current account balance improvement due to the
huge ,epreciation in 1994. On the other hand, the severe appreciation of TL. in
= 100).
26
2000 and the impact of Customs Union with EU caused to deterioration of trade
balance by causing to increase of imports.
-2000.0
-1500.0
-1000.0
-500.0
0.0
500.0
1000.0
1500.0
Jan.92
Oct.92
Jul.93
Apr.94
Jan.95
Oct.95
Jul.96
Apr.97
Jan.98
Oct.98
Jul.99
Apr.00
Jan.01
Oct.01
tim e
$ m
illions
Current Account Balance $ m illions
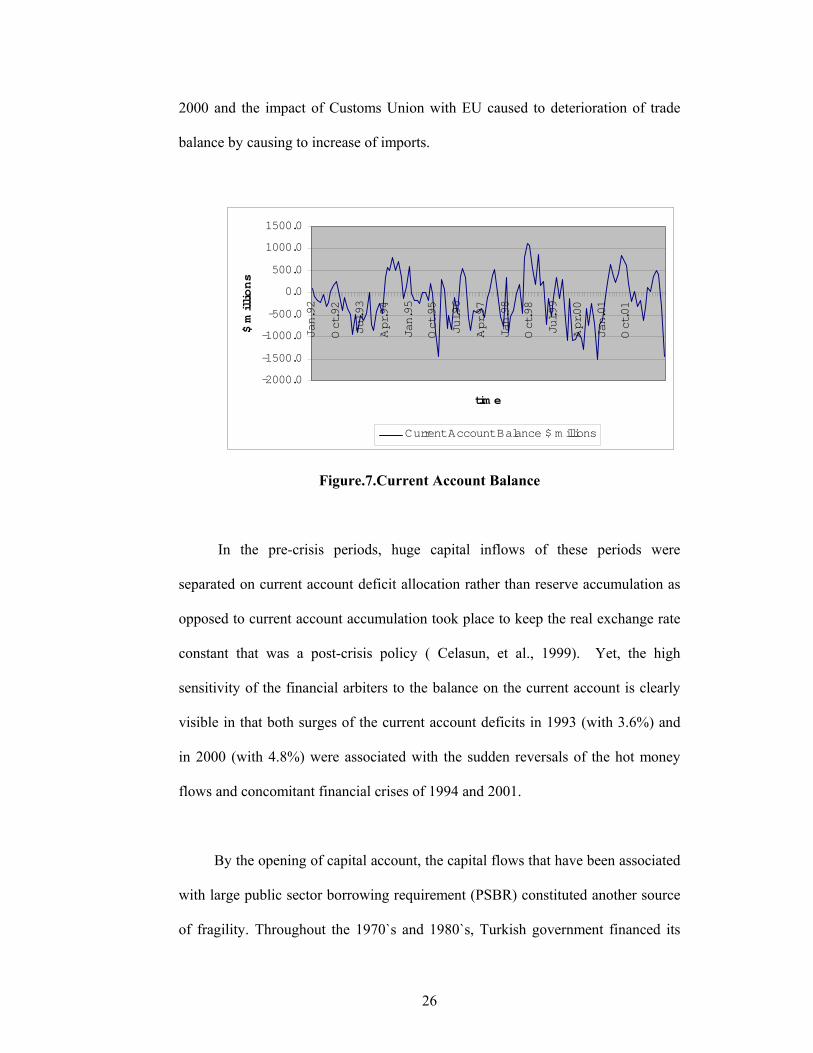
Figure.7.Current Account Balance
In the pre-crisis periods, huge capital inflows of these periods were
separated on current account deficit allocation rather than reserve accumulation as
opposed to current account accumulation took place to keep the real exchange rate
constant that was a post-crisis policy ( Celasun, et al., 1999). Yet, the high
sensitivity of the financial arbiters to the balance on the current account is clearly
visible in that both surges of the current account deficits in 1993 (with 3.6%) and
in 2000 (with 4.8%) were associated with the sudden reversals of the hot money
flows and concomitant financial crises of 1994 and 2001.
By the opening of capital account, the capital flows that have been associated
with large public sector borrowing requirement (PSBR) constituted another source
of fragility. Throughout the 1970`s and 1980`s, Turkish government financed its
27
deficit with Central Bank advances (monetisation) mostly. After the removal of the
interest ceilings and some other serial reforms, real interest rates started to show
positive values. Financial institutions and rentiers adapted to new interest rates and
due to the changing economic environment, the government passed to financing of
deficit with the government debt instruments (GDI). After the capital account
liberalization, the PSBR financing with the issue of GDI`s to the internal market
has been the major method. Therefore, the inevitable result of this method came
into being as rising domestic debt that was more than 50% of the stock of the
existing debt, which was trapped in a Ponzi-situation2, during 1990`s. (Boratav, et
al., 2002; Voyvoda and Yeldan, 2002).
High interest rates on GDI`s attracted capital flows. The resulting capital
flows have been directed to public sector financing rather than entering to the
financial system. However, the usage of capital flows in the deficit financing led to
the increase of short-term borrowing for the public sector due to the fact that the
composition of capital flows was short- term and mostly of the portfolio flows
type. Getting into debt with shot-term maturity deepened the debt financing
problems of Turkey because the government borrowed continuously to meet its
increasing interest payments and payment of debts. Increases in budget deficit
resulted with the increase of the public sectors’ borrowing requirement (PSBR)
during the long period of budget deficit of the last decade.
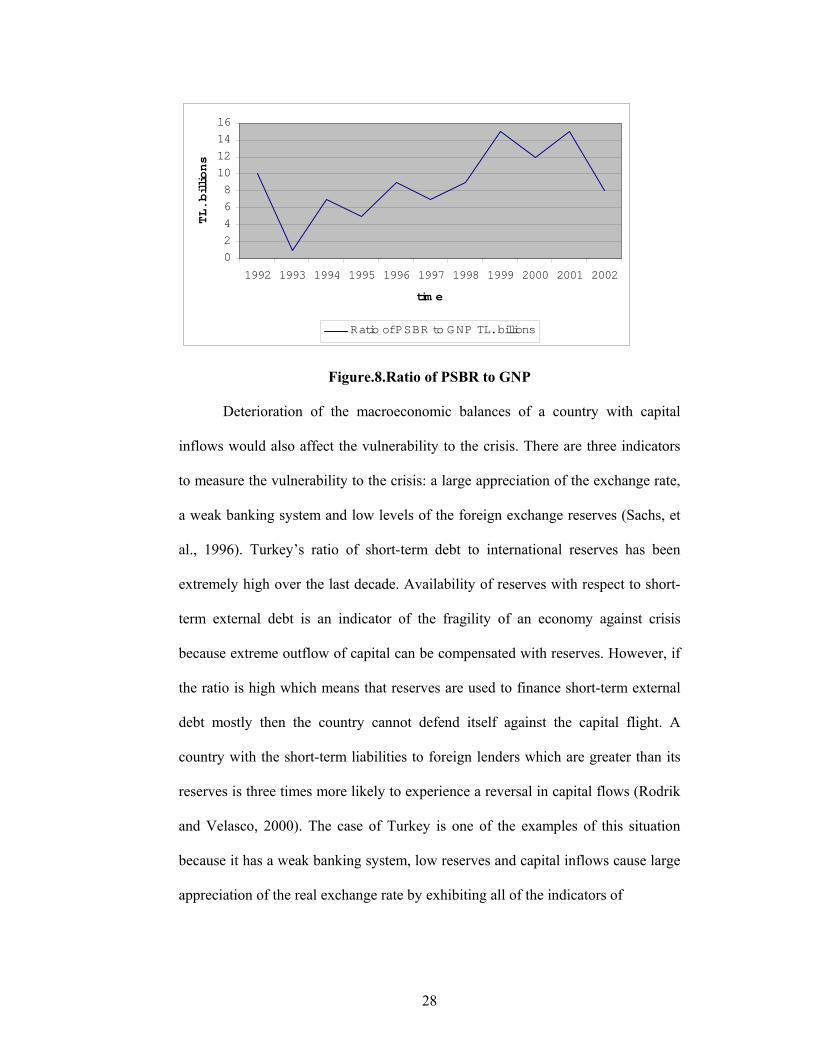
2 Ponzi-situation defines the storage case of the cash flows from assets in the near-term as compared with the cash payment commitments. In the “Ponzi Finance”, the financial authorities must increase the outstanding debt to meet the previous financial obligation.
28
0
2
4
6
8
10
12
14
16
1992 1993 1994 1995 1996 1997 1998 1999 2000 2001 2002
tim e
TL. billions
Ratio of PSBR to GNP TL. billions
Figure.8.Ratio of PSBR to GNP
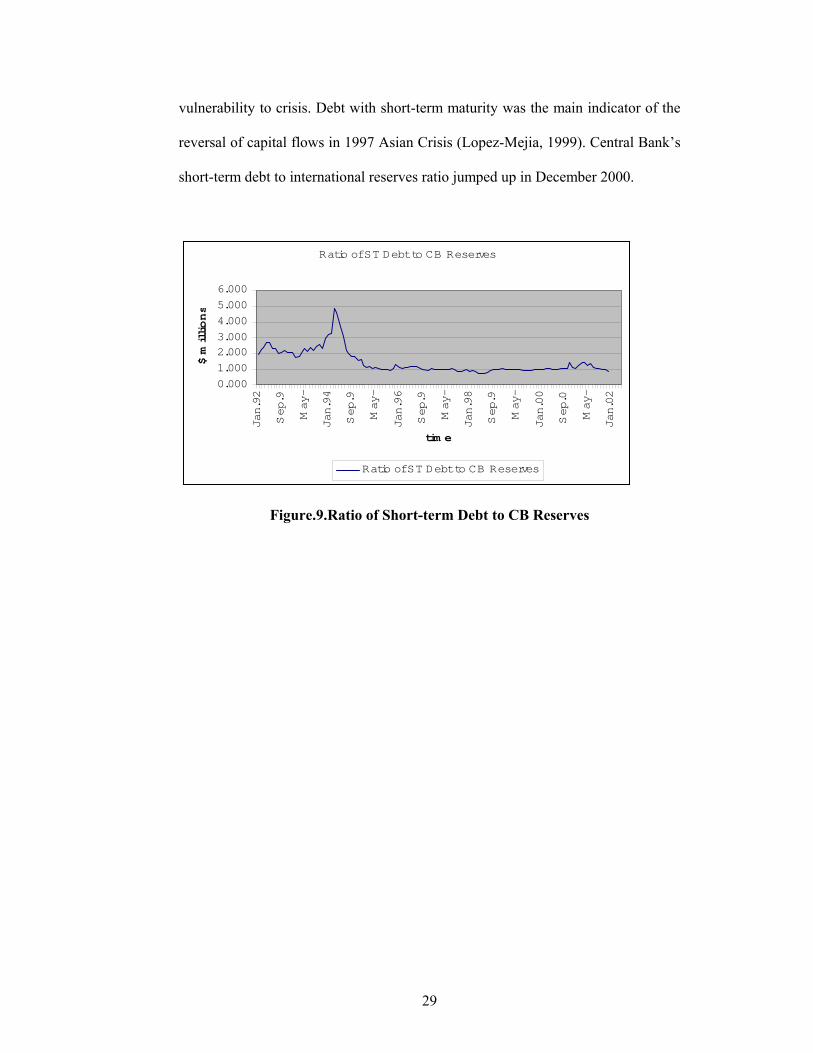
Deterioration of the macroeconomic balances of a country with capital
inflows would also affect the vulnerability to the crisis. There are three indicators
to measure the vulnerability to the crisis: a large appreciation of the exchange rate,
a weak banking system and low levels of the foreign exchange reserves (Sachs, et
al., 1996). Turkey’s ratio of short-term debt to international reserves has been
extremely high over the last decade. Availability of reserves with respect to short-
term external debt is an indicator of the fragility of an economy against crisis
because extreme outflow of capital can be compensated with reserves. However, if
the ratio is high which means that reserves are used to finance short-term external
debt mostly then the country cannot defend itself against the capital flight. A
country with the short-term liabilities to foreign lenders which are greater than its
reserves is three times more likely to experience a reversal in capital flows (Rodrik
and Velasco, 2000). The case of Turkey is one of the examples of this situation
because it has a weak banking system, low reserves and capital inflows cause large
appreciation of the real exchange rate by exhibiting all of the indicators of
29
vulnerability to crisis. Debt with short-term maturity was the main indicator of the
reversal of capital flows in 1997 Asian Crisis (Lopez-Mejia, 1999). Central Bank’s
short-term debt to international reserves ratio jumped up in December 2000.
Ratio of ST Debt to CB Reserves
0.000
1.000
2.0003.000
4.000
5.000
6.000
Jan.92
Sep.9
May-
Jan.94
Sep.9
May-
Jan.96
Sep.9
May-
Jan.98
Sep.9
May-
Jan.00
Sep.0
May-
Jan.02
tim e
$ m
illions
Ratio of ST Debt to CB Reserves
Figure.9.Ratio of Short-term Debt to CB Reserves
30
5 Consequences of The Capital Inflows
Turkey’s case was one of the first experiences for large reversal of capital
flows in the 1990s. A common reason for the countries that lived reversal of capital
flows has been the lack of confidence in domestic macroeconomic policies (Lopez-
Mejia, 1999). Exposition of Turkey to the portfolio flows rather than foreign direct
investment widens current account balance, leads rapid monetary growth, creates
inflationary pressures, causes real exchange rate appreciation so the reversal of the
capital flows is riskier for financial sector.
Although some positive association between growth and capital flows has
been investigated by recent studies, this is not a general case for all country
studies. The literature has identified sources of diversity such as democracy level
of the country, implemented economic policies, economic restrictions, and so on.
World Bank studies showed that capital inflows during 1990s had a boost effect on
growth, but in the longer time frame of 1970-1998, studies produced a significant
negative relationship (see, e.g., Oxfam America, 2002).
Financial flows boost growth in developing countries by affecting
consumption and investment. Capital inflows reduce the volatility of consumption
because they provide an opportunity for risk diversification and they also allow
international borrowing that prevents temporary declines in income. However,
31
excess expansion of the aggregate demand that is a result of capital inflows causes
negative impacts on the financial sector (Lopez-Mejia, 1999). Furthermore,
government guarantees on deposits encourage over lending and over borrowing in
terms of both lenders and borrowers and demolishe the discipline of the market.
Loss of balance in financial markets increases as capital inflows tend to rise,
especially guarantees provokes moral hazard where financial transfers with short-
term maturity by strengthening fragility of the shallow financial markets.
Capital inflows normally tend to increase the share of investment in GDP.
However, there are two ways in which capital inflows fail to pass through
investments: using resources that come with capital inflows in consumption rather
than investment and failure to increase import in excess of exports whether these
imports are used in consumption or investment (Oxfam America, 2002). If capital
inflows are consumed rather than invested, there will be no gain to pay back
foreign capital with interests. One reason for the occurrence of this case is the
Central Bank’s sterilisation that is the action of buying foreign exchange from the
domestic financial market. Sterilisation capital flows increase the domestic interest
rates due to the liquidity squeeze and therefore it may reduce investment.
In most of the countries, capital inflows were associated with current
account deficits. The enlargement of the current account deficit has occurred
because of both increase of investment and decrease of savings. Capital inflow
increase the share of consumption and investment in GDP and decreases the share
of saving in GDP so causes deterioration of current account balance.
32
According to standard open economy models, increase in consumption and
investment causes appreciation of the real exchange rates. If the capital flows leak
to the consumption rather than investment mostly, it makes real exchange rate
appreciation more likely. A real exchange rate appreciation during the capital
inflows shows a higher risk for domestic currency depreciation. Additionally,
appreciation of real exchange rate destroys trade balance and competitiveness by
increasing dependency on imports.
Lack of credibility in an exchange rate-based inflation stabilisation program
comes into being as a higher level in the current nominal interest rates than
expected level. Additionally, macroeconomic outcomes show the same reactions
with the case, which is observed during the temporary decline in the international
interest rates (Calvo and Vegh, 1993). This is the case that Turkey experienced
with 2000 exchange rate based inflation stabilisation program.
Appreciation of real exchange rate also increases aggregate demand
(Yenturk, 1996). If aggregate demand increases for non-tradeable goods, the only
way to compensate the demand is an increase in the domestic production and the
price of non-tradeable goods also increases due to increased demand. If aggregate
demand increases for tradeable goods, it is satisfied with imports. Excess increase
of aggregate demand indicates its effects as inflationary pressures, real exchange
rate appreciation and widening current account deficit. However, the resulting
effects on inflationary pressures and exchange rates will be largely determined
with the exchange rate regime and the amount of the reserve accumulation. Under
free float, positive shocks to the capital account creates no change on international
33
reserves and monetary aggregates but a real exchange rate appreciation that
stimulates a current account deficit is the forthcoming result. Under fixed exchange
rate regime, defending the parity requires the intervention of the monetary
authorities and the intervention leads to rise of reserves and money supply, lowers
the domestic interest rates and increases asset prices. Then the result is expansion
of aggregate demand with a rise in domestic inflation. Actually, under the fully
free movement of capital, setting the exchange rate fixed is not possible. The
country under these circumstances should follow a floating exchange rate regime
setting monetary policy free from controlling a fixed exchange rate or a narrow
band (UNCTAD, 2001).
Real interest rates play a significant role in directing capital flows.
Especially, high short-term real interest rates prepare an attractive environment for
short-term capital flows that are seeking arbitrage opportunities. Regardless of the
initial level of interest rates and exchange rates, capital inflows to the developing
countries apt to create an arbitrage margin by increasing domestic interest rates and
appreciating real exchange rates latter. The series of these events occur within a
cycle that needs to a continuum feed of capital inflows to cover interest payments
and an appreciation of the real exchange rate (Yenturk, 1996).
Speculative financial environment that is a result of the volatility of capital
inflows raises external debt, which is held by public sector. The increase of the
external debt, inturn, is the main factor behind the accumulation of the burden of
interest payments and that of the rising public sector borrowing requirement

34
(PSBR). Since increase in PSBR is financed with the government debt instruments
(GDIs), the domestic interest rate rises and attracts new capital inflows in Turkey.
35
6 Econometric Investigation
In this section I study econometrically three related issues: first, I use a time
series, multiple regression model to investigate the relationship between short-term
financial capital (hot money) inflows and the key macroeconomic variables. Next,
I use the same methodology to infer about the relationship between private fixed
investments and the hot money inflows, together with the key macro economic
prices.
6-1. Model And Data Specification Of The Relationship
Between Financial Capital Inflows And Macro Economic Variables
In modelling short-term capital flows, I used the least square regression as
the most common method of estimating the parameters of a multiple linear
regression model. Time-series analysis of data for Turkey includes the country-
specific (pull) factors and the monthly data covers a period of 1992:01 to 2001:12
(120 observations in all). All series are obtained from the Central Bank of Turkey
36
except the interest rates, which are obtained from Turkish SPO and the investment
data that is obtained from The Undersecreteriat Turkish Treasury.
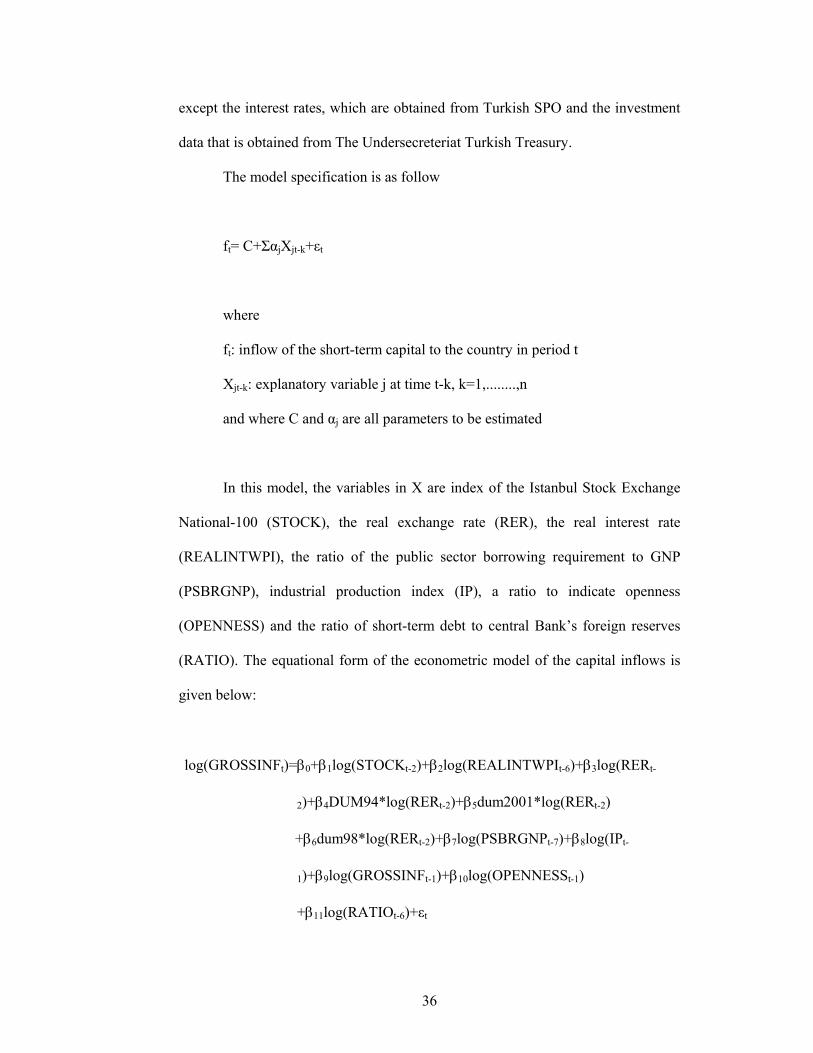
The model specification is as follow
ft= C+ΣαjXjt-k+εt
where
ft: inflow of the short-term capital to the country in period t
Xjt-k: explanatory variable j at time t-k, k=1,........,n
and where C and αj are all parameters to be estimated
In this model, the variables in X are index of the Istanbul Stock Exchange
National-100 (STOCK), the real exchange rate (RER), the real interest rate
(REALINTWPI), the ratio of the public sector borrowing requirement to GNP
(PSBRGNP), industrial production index (IP), a ratio to indicate openness
(OPENNESS) and the ratio of short-term debt to central Bank’s foreign reserves
(RATIO). The equational form of the econometric model of the capital inflows is
given below:
log(GROSSINFt)=β0+β1log(STOCKt-2)+β2log(REALINTWPIt-6)+β3log(RERt-
2)+β4DUM94*log(RERt-2)+β5dum2001*log(RERt-2)
+β6dum98*log(RERt-2)+β7log(PSBRGNPt-7)+β8log(IPt-
1)+β9log(GROSSINFt-1)+β10log(OPENNESSt-1)
+β11log(RATIOt-6)+εt
37
6-1-A The Data Analysis With The Econometric Test Techniques
First I have performed tests for normality, autocorrelation, order of
integration and cointegration.
Testing the normality of the series, the quantile-quantile method is used.
After ploting the quantiles of the chosen series against a theoretical distribution, in
most of the series, I have found that the QQ-plot is straight line, or approximately
close to a straight line, which implies normality of the series
Correlograms are used to check the autocorrelation procedure of the series.
For no serial correlation, the autocorrelations and the partial autocorrelations at all
lags (it is tested for the 12 lags for the data series of the model) should be nearly
zero which shows the stationarity of the series. Checking for the correlograms for
the data series, one can observe autocorrelation relation at least for the first lags of
the series, which implies the non-stationarity of the observations.
Although the properties of a sample correlogram are useful tools for
detecting the possible presence of unit roots, the method is nearly imprecise.
Therefore, Augmented Dickey Fuller (ADF) Unit Root Test was performed for the
series for 12 lags. For the hot money model, I found a set of I (1) variables. Since
such kind of sets produce I (0) disturbance term, I could regress the model without
considering any differentiation for the variables to eliminate problems related with
38
non-stationarity. Order of the integration and the test results are given in Table.2
(see.Table. 4 in APPENDIX B)
Checking the validity of the claim that the residuals are zero order for the
hot money model, I applied the Engle- Granger two-step method and found that the
residuals are I(0) for the model. Investigation suggests that the combination of the
non-stationary series may be stationary (Engle and Granger, 1987). The stationary
linear combination is called the cointegration equation and may be interpreted as a
lon-run equilibrium relation among the variables.
6-1-B. Econometric Modelling And Implications
The dependent variable of the model is the gross inflows of short-term
capital (GROSSINF). It is the sum of portfolio investments by residents and non-
residents. In the model, I used the gross inflows of short-term capital, and not the
net short-term capital flow (hot money) since the hot money is highly volatile in
Turkey, so the implication power of the net flows is not as high as that of the gross
inflows. Although the net short-term capital flows gave the expected signs for
parameters, the R2 and adjusted R2 of the model were very low and Akaike
information Criterion (AIC) and Schwarz Information Criterion (SIC) were very
high. Additionally, in choosing the appropriate lag levels for the models, I searched
for the lowest values of AIC and SIC.
39
Behaviour of stock prices is one of the most important regressors for short-
term capital flows. Thus, I used the lagged value of the index of the Istanbul Stock
Exchange National-100 directly as a key regressor. Real interest rate is estimated
from the three-month compounded nominal interest rates of T-bills by using rate of
increase of WPI. Three dummies are used for the periods of the crisis that are
affected Turkey mostly. In order: dum94 is used for the 1994 crisis, dum98 is used
for the Russian crisis in 1998, and finally dum2001 is used for the crisis that was
observed at the end of the 2000 and in the beginning of the 2001. To measure the
effectiveness of fiscal policy and the effects of fiscal balances, I used the lagged
value of the ratio of the public sector-borrowing requirement to GNP. Since the
original data was yearly, I used seasonal adjustment for this ratio. Although I tried
the model with budget balance, the results showed that the ratio of public sector
borrowing to reserves of Central Bank of Turkey (CB) was a better explanatory
variable than the budget balance. The lagged value of the industrial production
index is used to measure whether capital flows are used to increase production and
the index captures the total industry production. I used the lagged value of the
dependent variable because the accelerated capital flows create an effect on itself.
The ratio to measure the openness of the economy and its effect on capital inflows
is estimated as the ratio of the sum of the absolute values of export and import to
GDP. The lagged value of the ratio of the short-term external debt to Central
Bank’s foreign reserves is used to examine the effect of the indebtedness of the
country in case of the capital inflows. Although I structured a model with GDP that
was quarterly in original data and seasonally adjusted for the model, the estimation
40
for GDP was found insignificant and the industrial production index was already
capturing the explanations related with production more powerfully.
The usage of log values of the variables improved R- squared, adjusted R-
squared, Akaike Information Criterion (AIC) and Schwarz Information Criterion
(SIC). Furthermore, it eliminated the multicollinearity problem with the RATIO
and OPENNESS variables. In terms of the multicollinearity problem, the product
of dummy variables and real exchange rates were also important to solve this
problem.
I also tried another model, which was regression with net errors and
omissions (NEO) of the Balance of Payments. I designed the sum of capital
inflows and NEO as the dependent variable and run the model but the findings
were insignificant for the most of the variables.
41
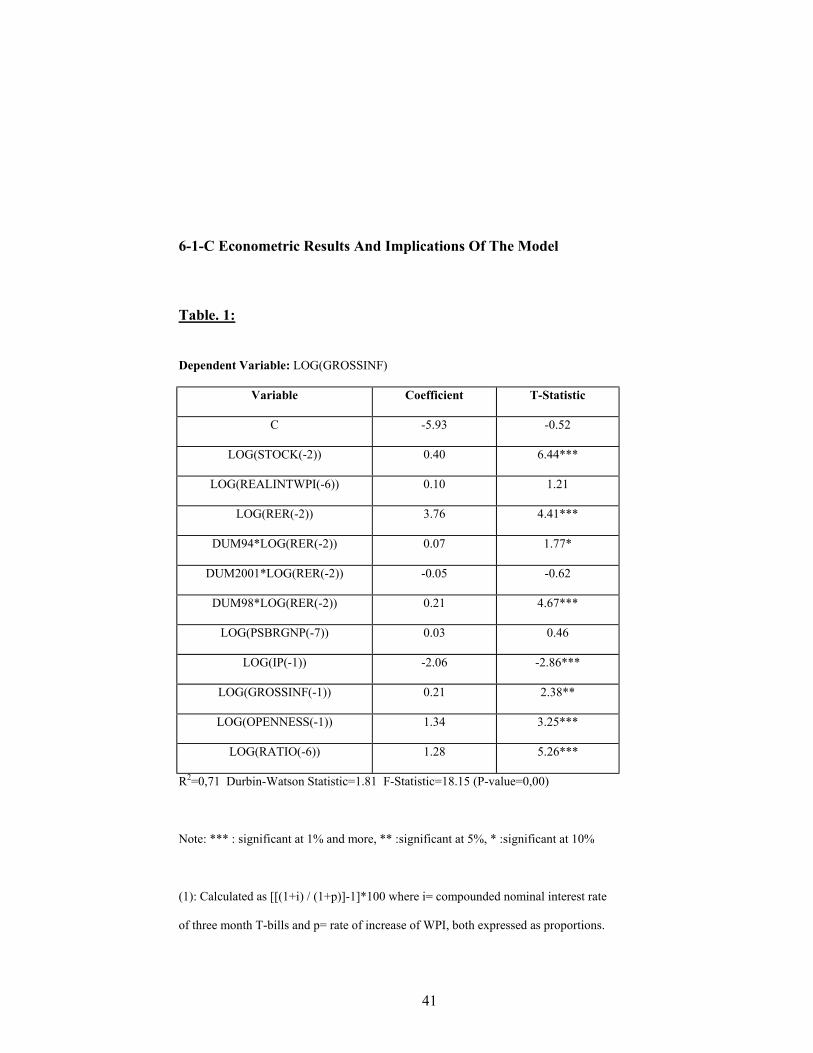
6-1-C Econometric Results And Implications Of The Model
Table. 1:
Dependent Variable: LOG(GROSSINF)
Variable Coefficient T-Statistic
C -5.93 -0.52
LOG(STOCK(-2)) 0.40 6.44***
LOG(REALINTWPI(-6)) 0.10 1.21
LOG(RER(-2)) 3.76 4.41***
DUM94*LOG(RER(-2)) 0.07 1.77*
DUM2001*LOG(RER(-2)) -0.05 -0.62
DUM98*LOG(RER(-2)) 0.21 4.67***
LOG(PSBRGNP(-7)) 0.03 0.46
LOG(IP(-1)) -2.06 -2.86***
LOG(GROSSINF(-1)) 0.21 2.38**
LOG(OPENNESS(-1)) 1.34 3.25***
LOG(RATIO(-6)) 1.28 5.26***
R2=0,71 Durbin-Watson Statistic=1.81 F-Statistic=18.15 (P-value=0,00)
Note: *** : significant at 1% and more, ** :significant at 5%, * :significant at 10%
(1): Calculated as [[(1+i) / (1+p)]-1]*100 where i= compounded nominal interest rate
of three month T-bills and p= rate of increase of WPI, both expressed as proportions.
42
As expected, the stock valuation and the real exchange rates are significant
and their coefficients have positive sign. A raise in the value of the stock market
index can be interpreted as the improvement in the economic and politic situation
of Turkey so increases capital inflows. Additionally, increasing public sector
borrowing requirement is financed with the issue of the government debt
instruments, so this finance method increases the domestic interest rates. Capital
inflows lead to exchange rate appreciation and compensation of the exchange rate
appreciation requires capital inflows by creating a circle of linkages.
Although the estimation result for real interest rates is found insignificant,
it has the expected positive sign. The intuition behind the insignificant finding for
the real interest rates can be that the model includes just the pull (domestic) factors.
Even though the international real interest rates may be considered as one of the
exogenous variables, Turkey’s high real interest rate significantly deviates from the
world real interest rate. Therefore, taking the difference between the domestic and
he international interest rate does not change the high value and also the movement
of the time series data of the domestic real interest rates. Actually, the high level of
the domestic real interest rates is the most important reason of facing with the
short-term capital inflows, which are arbitrage seeker, to Turkey. Furthermore, the
very high value of inflation in Turkey causes emergence of too many negative
valued real interest rates in the data to explain the effects of the real interest rates
properly so I can say that inflationary pressures eliminates the power of real
interest rates as a domestic factor.
43
Dummy of the 2001 crisis is not significant. Furthermore, except the
dummy for the 2001 crisis, all of the dummies have positive sign. Negative sign of
a dummy would suggest that the emergence of crisis constitutes a panic
environment and investors of the short-term capital and even holders of liquid
short-term liabilities convert their holdings to the foreign exchange and abandon
the country immediately. Positive sign of the dummy could explain the emergence
of the macro economic factors, which attract the capital inflows such as high
interest rates in the crisis period. Especially Turkey’s crisis history exhibits the
increased level of interest rates due to the liquidity bottleneck. However, the
observed results for direction of the capital flows are highly associated with the
political and the other economic factors during the high level of interest rates.
Although the ratio of the public sector-borrowing requirement to GNP is
insignificant, it has an expected positive sign.
The industrial production index is highly significant and model suggests a
negative sign for this independent variable. Although capital inflows should be
associated with the increase of the productivity of the industrial sector, the negative
sign of this coefficient may show a tendency of industrial sector in Turkey to be a
rentier rather than using the resources that is a result of capital inflows in
production. Studies on semi-industrialized countries such as Korea, Mexico and
Turkey investigated a relation between the financial liberalization and increase in
the rentier activities (see Epstein and Power, 2003). However, a decrease in the
rentier incomes is expected in the case of emergence of financial crisis. The graph
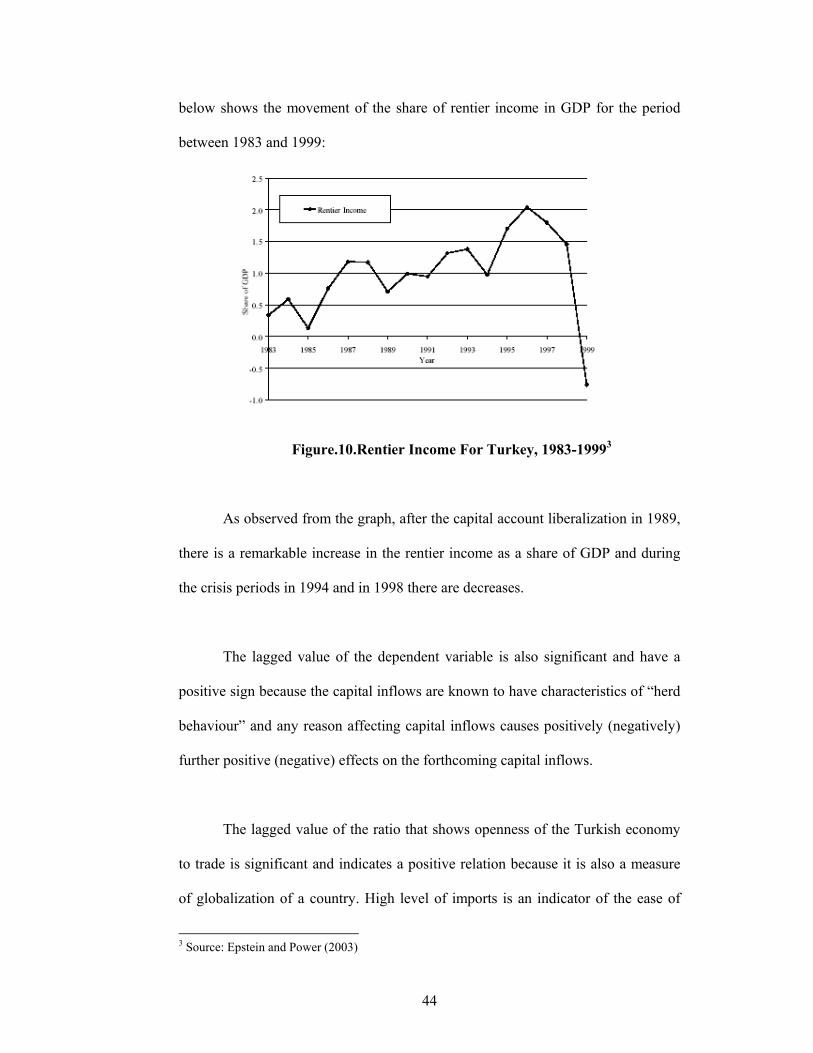
44
below shows the movement of the share of rentier income in GDP for the period
between 1983 and 1999:
Figure.10.Rentier Income For Turkey, 1983-19993
As observed from the graph, after the capital account liberalization in 1989,
there is a remarkable increase in the rentier income as a share of GDP and during
the crisis periods in 1994 and in 1998 there are decreases.
The lagged value of the dependent variable is also significant and have a
positive sign because the capital inflows are known to have characteristics of “herd
behaviour” and any reason affecting capital inflows causes positively (negatively)
further positive (negative) effects on the forthcoming capital inflows.
The lagged value of the ratio that shows openness of the Turkish economy
to trade is significant and indicates a positive relation because it is also a measure
of globalization of a country. High level of imports is an indicator of the ease of
3 Source: Epstein and Power (2003)
45
entrance to the country by the outside investors. Especially, in terms of financial
markets, the lack of capital controls is the indicator of the ease of capital
movements in Turkey. Additionally, the high level of the exports shows Turkey’s
ability in the international markets. Since increasing trend of globalization
integrated all of the economies, it is one of the most important factors for capital
flows throughout the world.
As a fragility indicator, the ratio of short-term debt to reserves of the CB is
expected to have a negative coefficient because the high value of a fragility
indicator means a reduction in the capital inflows. However, our model end up
with a positive coefficient that made me to check whether another fragility
indicator was efficient. Therefore, I restructured the model with a new fragility
indicator that was the ratio of M2y (an I (1) variable) to reserves of the CB (for
results, see Table.6 in Appendix D). Although the new model exhibited improved
value for the real interest rate, the new fragility indicator again could not explain
the expected relation due to positive sign of its coefficient. Furthermore, the model
failed to exhibit the expected positive sign of the ratio of public sector borrowing
requirement to GNP by making it negative but the finding also did not indicate a
high significance.
Due to these results, I can consider that capital inflows are not sensitive to
fragility indicators because investors put together the effects of fragility indicator
and the political movements that are captured by the ISE (Istanbul Stock
Exchange) market index as a proxy for the political index so they may observe the
movements of the politic trends rather than fragility indicators. The reasoning of
46
this tendency may be the very high levels of the fragility indicators in the past and
investors may follow political trends as the measure of the state of the economy.
6-1-D. The Model Analysis With The Econometric Test Techniques
The model test procedure includes the tests for heteroscedasticity,
autocorrelation and constancy of the model.
Choosing the best model and considering alternative models, one should
use the method of general-to-specific. In this method starting from a general
congruent model, standard testing procedures eliminate statistically insignificant
variables, with diagnostic tests checking the validity of reductions, reaching the
final congruent selection (Krolzig and Hendry, 2001).
In the step of checking validity of the model, I applied White
Heteroskedasticity Test, the correlogram method checking autocorrelation and
Chow Test for the constancy of the model are performed. With the aim of
examining whether the variance of error is affected by any of the regressors, their
squares or their cross products, I performed White Heteroskedasticity Test for the
OLS regression. The test for heteroskedasticity is resulted with homoskedasticity
of the equation for the hot money model with 0.05 significance level. Furthermore,
the autocorrelation test shows no autocorrelation due to the values of
autocorrelation and partial autocorrelation which are nearly zero so the model is
stationary. Testing whether there is a structural change in the relationship i.e.
47
constancy of the model, Chow’s Breakpoint Test has been performed dividing the
total period into two ( Chow, 1960). The break point is selected to be the 8th month
of 1998 when a serious earthquake lived and produced significant detrimental
effects on the macroeconomic balances. The year is also important in terms of
emerged Russian Crisis. Since the F-statistic exhibits the constancy of the model
with 0.51 probability ( about 5% significance level), the hypothesis that the
coefficient vectors are the same in the two periods will not be rejected so the model
is constant.
With high values of R2 and the adjusted R2 and the low values of standard
error of the regression and Akaike Information Criterion (AIC) and Schwarz
Information Criterion (SIC), the model seems reliable and highly explanatory for
the capital inflows. Furthermore, the close value of the Durbin-Watson statistic to
2 is also another indicator for the non-existence of the autocorrelation in the model.
6.2. The Relationship Among Private Investment, Financial Capital Flows
And Macroeconomic Prices
Capital inflows are expected to increase investment throughout two ways
by the increasing demand to non-tradeable goods and increasing demand to
tradeable goods. Increasing demand to non-tradeable goods provokes the domestic
production in this area and also raises the price of the non-tradeable goods. On the
other hand, demand for the import of the intermediate goods may increase.
48
On the other hand, increase in the capital inflow release the credit
constraints and provide funds for the investment. Importance of the borrowing
constraints is studied by Chhibber and van Wijnbergen (1992), Conway (1990),
Rittenberg (1991) and Uygur (1993). However, except the study by Rittenberg, the
other studies fail to consider the effects of the policy changes. Even tough the
capital inflows are important in terms of the availability of the funds for
investment; they may also cause fluctuations depending on whether they are
foreign direct investment or short-term capital inflows in the form of portfolio
investments and/or borrowing. Therefore, setting controls on the short-term capital
inflows is necessary to avoid economic instability in the home country and even to
prevent the possibility of financial crisis (Feldstein, 2002).
Capital flows do not lead to increased investments if they are used in
consumption or they increase the demand for the tradeable goods that are directly
consumable by raising imports for that type of goods. Furthermore, since capital
inflows to developing countries are mostly short term, innature, and they are highly
sensitive to the economic fundamentals, they just create a boom-bust cycle creating
an easy access of credit for the investment and excessively optimistic expectations.
Accumulation of physical capital is regarded in the empirical literature as
one of the important determinant of the economic growth (Levine and Renelt,
1992). Since accumulation of capital provides resources for investment even at a
lower cost, it also stimulates the increase of aggregate demand. Nevertheless,
observations for the developing countries show that the private investment is more
effective on growth than the public investment (Khan and Reinhart, 1990). On the
49
other hand, the stimulating effect of the real GDP growth on investment for
developing countries is an observed empirical result (Ghura and Goodwin, 2000).
Using the same econometric methodology with the previous model for
quarterly data of the period 1992:1 to 2001:4, I constructed the following model
for investment
ht = B + ΣγiZit-k+ηt
where
ht: investment of the private sector in time t
Zit-k: independent variable i at time t-k, k=1...n
and where B and γi are all parameters to be estimated.
In this model, the variables in Z are the current and lagged values of the
gross domestic product level of Turkey (GDP), the lagged value of the gross
inflows of the portfolio investments by the residents and non-residents
(GROSSINF)-i.e. short-term capital inflows-, the lagged value of real interest rates
(REINTWPI) given by the compounded nominal interest rate of three-month T
bills, deflated by WPI inflation, the lagged value of the real wages (WAGES).
Since the original data of short-term capital inflows and real interest rates are
monthly, I take the average of the months for each quarter. The equation for the
econometric modelling of the private investment is given below:
50
log(INVPRIt)=β0+β1log(GDPt-4)+β2log(REINTWPIt-1)+β3log(WAGESt-5)
+β4log(GROSSINFt-3) +εt
Analysing the data of the model, I applied quantile-quantile method to check
the normality of the series, used correlograms to check autocorrelation, ADF unit
root test to check the stationarity of the series and Engle-Granger two step method
to check the cointegration.
Since the quantile-quantile graphs exhibit approximately straight lines, I
can say that the quarterly data for the investment model consist of normal series.
Furthermore, autocorrelation analysis with the correlograms for 4 lags show no
autocorrelation, i.e. the autocorrelations and partial autocorrelations at all lags are
nearly zero. In the end of unit root test, I found an I (1) series of explanatory
variables (see Table. 5 in Appendix C). Since I had the set of I (1) variables that
are cointegrated, I regressed private investment on the other variables and the
result would produce residuals that are I (0). Since the results of Engle-Granger
two-step test produce I(0) residuals, I have a long-term relationship among the
variables.
Checking the validity of the private investment model, I performed White
Heteroskedasticity Test, correlogram method and Chow Test. The result of the
White Test was homoskedasticity of the model with the 0.01 significance level.
Correlograms show nearly zero autocorrelation and partial correlation for the all
lags. Choosing the 3rd quartile of 1998 for the break point of the model, I
investigated the constancy of the model with 0.049 probability.
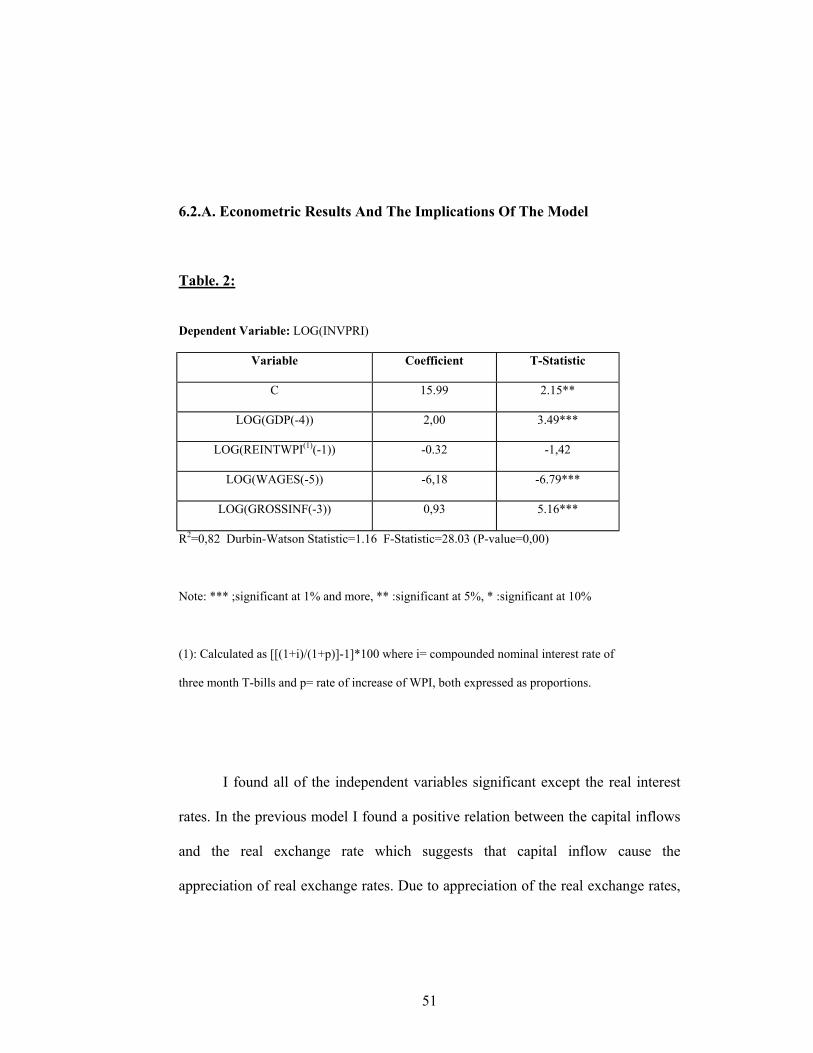
51
6.2.A. Econometric Results And The Implications Of The Model
Table. 2:
Dependent Variable: LOG(INVPRI)
Variable Coefficient T-Statistic
C 15.99 2.15**
LOG(GDP(-4)) 2,00 3.49***
LOG(REINTWPI(1)(-1)) -0.32 -1,42
LOG(WAGES(-5)) -6,18 -6.79***
LOG(GROSSINF(-3)) 0,93 5.16***
R2=0,82 Durbin-Watson Statistic=1.16 F-Statistic=28.03 (P-value=0,00)
Note: *** ;significant at 1% and more, ** :significant at 5%, * :significant at 10%
(1): Calculated as [[(1+i)/(1+p)]-1]*100 where i= compounded nominal interest rate of
three month T-bills and p= rate of increase of WPI, both expressed as proportions.
I found all of the independent variables significant except the real interest
rates. In the previous model I found a positive relation between the capital inflows
and the real exchange rate which suggests that capital inflow cause the
appreciation of real exchange rates. Due to appreciation of the real exchange rates,
52
the price of imports for the intermediate goods decreases so this raise in the
imports seem to cause to an increase of the private investment.
The coefficient of GDP exhibits a positive sign because the increase in the
level of GDP increases the capital sources for investment so it provokes
investment. On the other hand, I observed a negative sign for the real interest rates.
Yet, this relation fails to be significant.
Our findings show that there is a negative relation between wages and
investment and it has a very high coefficient for our model so it implies a high
impact on investment. Appreciation of the real exchange rate reduces the
competitiveness of Turkey so the reduction of cost by the decrease of wages is the
only remedy of the investors to keep their position in the international markets.
Since capital inflows in Turkey come through the banking sector and they
are mostly in the form of portfolio investments, efficient distribution of the funds
for investment requires an efficient banking system. However, besides its
weaknesses, Turkish banking system mostly focus on investing in government
securities rather than providing credit to the private sector investments because of
the safe and high returns of these securities. Therefore, the empirical estimation for
the investment model gives a positive but small coefficient, which shows the weak
positive effect of the capital inflows on the private investment and proves the
inefficiency of the credit distribution system for Turkey. Furthermore, I observed
that funds for investment leak mostly to the non-tradeable goods rather than

53
tradeable intermediate goods making the impact of the capital inflows to be weak
on the private investment.
54
7 Concluding Comments
The neo-liberal contemplation over financial liberalization is that an open and
unregulated capital account is growth-inducive, leading to increased availability of
loanable funds and enabling transfer of foreign technology. Accordingly, freed
from the strangulation of “financial repression”, financial intermediaries would be
able to work more efficiently, bringing savers and investors together at lower cost.
These expectations, however, have been challenged by the crisis episodes of
the last two decades. Both the numerous empirical case studies and the policy
lessons of the Mexican, Turkish, Argentinean, and more recently East Asian
experiences revealed that the expected beneficial effects of capital inflows have
been overshadowed by the adverse impacts of excessive stock market volatility and
the persistence of exchange rate risk against unforeseen fluctuations in the
exchange rates. In fact, large capital inflows as witnessed in recent years have
posed serious dilemmas and created significant policy challenges. The recent
history of the financial crises in the “successful emerging markets” have clearly
disclosed the undesirable macroeconomic effects of the large, uncontrolled capital
inflows, such as persistence of high real interest rates, inflationary pressures,
limitation of the power of the central banks to contain the pressures of monetary
55
expansion and of the threat of currency substitution, real exchange rate
appreciation, and widening current account deficits.
In this thesis, I attempted to address to these concerns within the realm of the
Turkish experience following its capital account liberalization in 1989. I identified
capital inflows exclusively with the portfolio investments of residents and non-
residents abroad, and using time-series econometrics, I searched for the macro
economic variables that best explain the behavior of capital inflows over 1992 to
2002. I further investigated the changing nature of the private investment function
under post-capital account liberalization and studied its correlation with capital
flows and the key macro economic prices, such as the exchange rate, the real rate
of interest, and real wages.
My results suggest that the financial capital inflows have a significant
negative correlation with the industrial production index, and are positively
correlated with real currency appreciation and trade openness. I also found that the
capital inflows have a positive relationship with the stock exchange index and with
the one-month lagged value of inflows themselves. The rate of interest and the
PSBR failed to display statistically significant results, even though their
coefficients were of the expected sign.
Fixed private investment was found to have a positive relationship with
financial capital inflows, but this was observed to be mostly due to an
accumulation pattern towards non-traded sectors via currency appreciation. The
dependence of investments over exchange rate appreciation via speculative
56
financial flows highlights the speculative-led growth path of the Turkish economy
over the 1990s.
Finally, real wage costs were observed to carry a significant negative
relationship with private investment. My interpretation of this result was that at a
time of currency appreciation, investors had to rely on declining wage costs in
order to keep their export competitiveness. Under the volatile and uncertain
conditions of speculation-driven investment patterns, the downward flexibility of
real wages has to be seen as a concomitant factor of the post-financial
liberalization episodes. This finding also led us to hypothesize that in order to
combat the detrimental consequences of the volatile patterns of aggregate demand,
financial globalization would directly warrant suppression of the remunerations of
wage-labor, since under conditions of currency appreciation and increasingly high
real rates of interest, the whole burden of adjustment would necessarily fall on the
downward flexibility of labor costs. The detailed pursuit of this theme across other
emerging market economies has to be seen as an agenda of future research.
57
REFERENCES
Akyüz, Y. 1990. "Financial System and Policies in Turkey in the 1980's." In Aricanli and Rodrik, eds., The Political Economy of Turkey. London and New York, Macmillan.
Atiyas, İ. and Ersel, H. 1992. “The Impact of Financial Reform: The Turkish Experience”, The World Bank, Industry and Enery Department Working
Paper, No.65.
Bello, W., et al. 2000 “Notes on the Ascendancy and Regulation of Speculative Capital.” In W. Bello, K. Malhotra, N. Bullard, eds., Global Finance, New Thinking on Regulating Speculative Capital Markets. London and New York: Zed Books.
Binay, Ş. and Kunter, K. 1998. “Mali Liberalleşmede Merkez Bankası’nın Rolü 1980- 1997,“ The Turkish Central Bank, Discussion Paper, No:9803.
Blecker, R. A. 1998. “International Capital Mobility, Macroeconomic Imbalances, and the Risk of Global Contraction,” Center for Policy Analysis, New School for Social Research, Working Paper Series III No 5, June.
Boratav, K. and Yeldan, E. 2001. “Turkey, 1980-2000: Financial Liberalization, Macroeconomic (In)- Stability, and Patterns of Distribution”.
Boratav, K., Yeldan, E and Köse, A. 2002. “Globalization, Distribution And Social Policy: Turkey: 1980-1998.” In L. Taylor, eds., External Liberalization and Social Policy. London and New York: Oxford University Press.
Calvo, G. 1998. “Capital Flows and Capital –Market Crisis: The Simple Economies of Sudden Stops,” Journal of Applied Economics 1(1): 35-54.
Calvo, G. and Vegh. 1993. “Exchange- Rate Based Stabilization under Imperfect Credibility.” In H. Frisch and A. Abrtgotter, eds., Open Economy Macroeconomics. New York: St. Martin Press.
58
Calvo, G., Leiderman, L. and Reinhart, C. 1996. “Inflows of Capital to Developing Countries in the 1990s,” The Journal of Economic Perspective, 10(2): 123-139.
Calvo, S. and Reinhart, C. 1996. “Capital Flows to Latin America: Is There Evidence of Contagion Effect?” Policy Research Working Paper, the World Bank and IMF.
Celasun, O. 2001. “Real Effects of Exchange Rate Based Stabilisation : The Role of Nominal Rigidities,” University of Maryland, Department of Economics.
Celasun, O., Denizer, C. and He, D. 1999. ”Capital Flows, Macroeconomic Management, and Financial System: The Turkish Case, 1989-1997,” mimeo.
Chang, R. and Velasco, A. 1998. “Financial Fragility and The Exchange Rate Regime,” RRn98-05. C.V. Starr Center for Applied Economics, New York University, New York.
Chhibber, A. and van Wijnbergen, S. 1992. “Public Policy and Private Investment in Turkey.” In A. Chhibber, M. Dailami, and N. Shafik, eds., Reviving Private Investment in Developing Countries. Amsterdam: North- Holland.
Chow, G. C. 1960. “Test of Equality Between sets of Coefficients in Two Linear regressions,” Econometrica 28(3): 591-605.
Chuhan, P., Perez-Quiros, G. and Popper, H. 1996. “International Capital Inflows: Do Short-Term Investment and Direct Investment Differ?” International Economics Department of the World Bank.
Claessens, S., Dooley, M. and Warner, A. 1995. “Portfolio Capital Flows: Hot or Cold?” World Bank Economic Review 9(1).
Conway, P. 1990. “Record on Private Investment in Turkey.” In T. Arıcanlı and D. Rodrik, eds., The Political Economy of Turkey: Debt, Adjustment and Sustainability. London: MacMillan Publication.
Denizer, C. 2000. “Foreign Entry in Turkey’s Banking Sector, 1980-97,” The World Bank, Policy Research Working Paper, No:2462.
59
Diaz-Alejandro, Carlos F. 1985. "Good-Bye Financial Repression, Hello Financial Crash," Journal of Development Economics 19:1-24.
Dornbusch, R. 1982. “Stabilization Policies in Developing Countries: What Have I Learned?”, World Development, 10: 701-708.
Eatwell, John. 1996. “International Capital Liberalisation: The Record,” Center for Policy Analysis, New School for Social Research, Working Paper Series I, No. 1, August.
Eichengreen, B. and Hausmann, R. 1999. “Exchange Rates and Financial Fragility,” NBER Working Paper No. 7418., Cambridge, MA.
Engle, Richard, F. and Granger, Clive W. J. 1987. “Co-Integration and Error Correction: Representation, Estimation and Testing,” Econometrica 55: 251-276.
Epstein, G. and Power, D. 2003. “Rentier Income and Financial Crises: An Empirical Examination of Trends and Cycles in Some OECD Countries,” University of Massachusetts, Department of Economics and Political Economy Institude (PERI), Amherst, MA.
Feldstein, M. 2002. “Economic and Financial Crises in Emerging Market Economies: Overview of Prevention and Management,” National Bureau of Economic Research, Working Paper, No: 8837.
Fernandez- Arias, E. And Lombardo, D. 1998. “Market Discipline and Exuberant Foreign Borrowing.” Second Annual Conference of the Central Bank of Chile, mimeo.
Fernandez-Arias, E. And Hausmann, R. 2000. “Is Foreign Direct Investment A Safer Form of Financing?” Emerging Markets Review 34(49).
Fernandez-Arias, E. and Montiel, P. 1995. “The Surge in Capital Inflows to Developing Countries- Prospect and Policy Response,” Policy Research Working Paper, The World Bank, No.1473.
60
Fischer, S. 2002. “Financial Crisis and Reform of The International Financial System,” National Bureau of Economic Research, Working Paper, No: 9297.
Frankel, Jeffrey. 1993. “International Financial Integration: Relations between Interest Rates and Exchange Rates.” In D. Das, eds., International Finance: Contemporary Issues., London: Routledge.
Frankel, Jeffrey A. 1991. “Quantifying International Capital Mobility in the 1980s.” In D. Bernheim and J. Shoven, eds., National saving and Economic Performance. Chicago: The University of Chicago Press.
Ghura, D. and Goodwin, B. 2000. “Determinants of Private Investment: A Cross-Regional Emprical Investigation,” Applied Economics 32: 1819-1829.
Guncavdi, Ö. and Bleaney, M. 1996a. “Private Investment and Structural Adjustment-A Case Study of Turkey,” University of Nottingham, U.K
Guncavdi, Ö. and Bleaney, M. 1996b. “Finacial Liberalisation and Private Investment: Evidence from Turkey,” University of Nottingham, U.K.
Halwood, C. Paul and Ronald MacDonals. 1994. International Money and Finance (2nd ed.) London: Blackwell.
Khan, Mohsin S. and Reinhart, Carmen M. 1990. “Private Investment and Economic Growth in Developing Countries,” World Development 18: 19-27.
Krolzig, H. and Hendry, D. 2001. Computer Automation of General-to-Specific Model Selection Procedures. University of Oxford, Department of Economics.
Krugman, P. 1999. “Balance Sheets, The Transfer Problem, and Financial Crises.” Paper presented at the Conference in Celebration of the Contributions of Robert Flood, IMF, Washington, DC.
Levine, Ross and Renelt, David. 1992. “A Sensitivity Ananlysis of Cross-Country Growth Regression,” American Economic Review 82: 942-963.
61
Lopez-Mejia, A. 1999. “Large Capital Flows: A survey of the Causes, Consequences, and Policy Responses,” IMF Working Paper 99/17.
Marston, R.C. 1993. “Interest Differentials under Bretton Woods and the post-Bretton Woods Float: The Effects of Capital Controls and Exchange Risk.” In M. Bordo and B. Eichengreen, eds., A Retrospective on the Bretton Woods System. Chicago: The University of Chicago Press.
McKinnon, R. I. 1973. Money and Capital in Economic Development. Washington: The Brookings Institution.
Oxfam America. 2002. “Global Finance Hurts the Poor.” An Oxfam America Report, Washington, D.C.
Özlale, U. and Yeldan, E. 2002. “Measuring Exchange Rate Misalignment in Turkey,” Bilkent University, Department of Economics, mimeo.
Reyes, J. 2002. “Inflation Targeting in Emerging Economies: Exchange Rate Presure,” Texas A&M University, Department of Economics.
Rittenberg, L. 1991. “Investment Spending and Interest Rate Policy: The case of Financial Liberalisation in Turkey”.
Rodriguez, C. A. 1982. “The Argentina Stabilization Plan of December 20th,” World Development, 10: 801-811.
Rodrik, D. and Velasco, A. 2000. “Short-Term Capital Flows,” Annual World Bank Confference on Development Economics, 1999, December: 59-90.
Sachs, J., Tornell, A. and Velasco, A. 1996. “Financial Crisis in Emerging Markets: The Lesson from 1995,” Brooking Papers on Economic Activity, pp. 147-198.
Sarno, L. and Taylor, M. 1999. “Hot money, accounting labels and the permanence of capital flows to developing countries: an empirical investigation,” Journal of Development Economics 59: 337-364.
Shaw, E. S. 1973. Financial Deepening in Economic Development. New York:
62
Oxford University Press.
Stiglitz, J. 2000. “Capital Market Liberalization, Economic Growth, and Instability,” World Development 28(6): 1075-1086.
Taylor, Lance. July, 1998. “Lax Public Sector, Destabilizing Private Sector: Origins of Capital Market Crises,” Center for Policy Analysis, New School for Social Research, Working Paper Series III, No. 6.
Tobin, J. 2000. “Financial Globalization,” World Development. 28: 1101-1104.
UNCTAD. 1998. “Trade and Development Report, 2001.” United Nations Conference on Trade and Development, Geneva.
UNCTAD. 2001. “Trade and Development Report, 2001.” United Nations Conference on Trade and Development, Geneva.
Uygur, E. 1993. “ Financial Liberalisation and Economic Performance in Turkey,” Ankara, Turkey: Central Bank.
Voyvoda, E. and Yeldan, E. 2002. “Beyond Crisis Adjustment: Investigation of Fiscal Policy Alternatives in an OLG Model of Endogenous Growth for Turkey.” Paper to be presented at the VI Annual METU Conference on Economics, Sept 10-15, 2002, Ankara. Available on line at: (www.bilkent.edu.tr/~yeldane/ ).
Yenturk, N. 1996. “Short-Term Capital Inflows and Their Impact on Macroeconomic Order: A Comparison Between Turkey and Mexico,” Bogazici Journal, University of Bogazici.
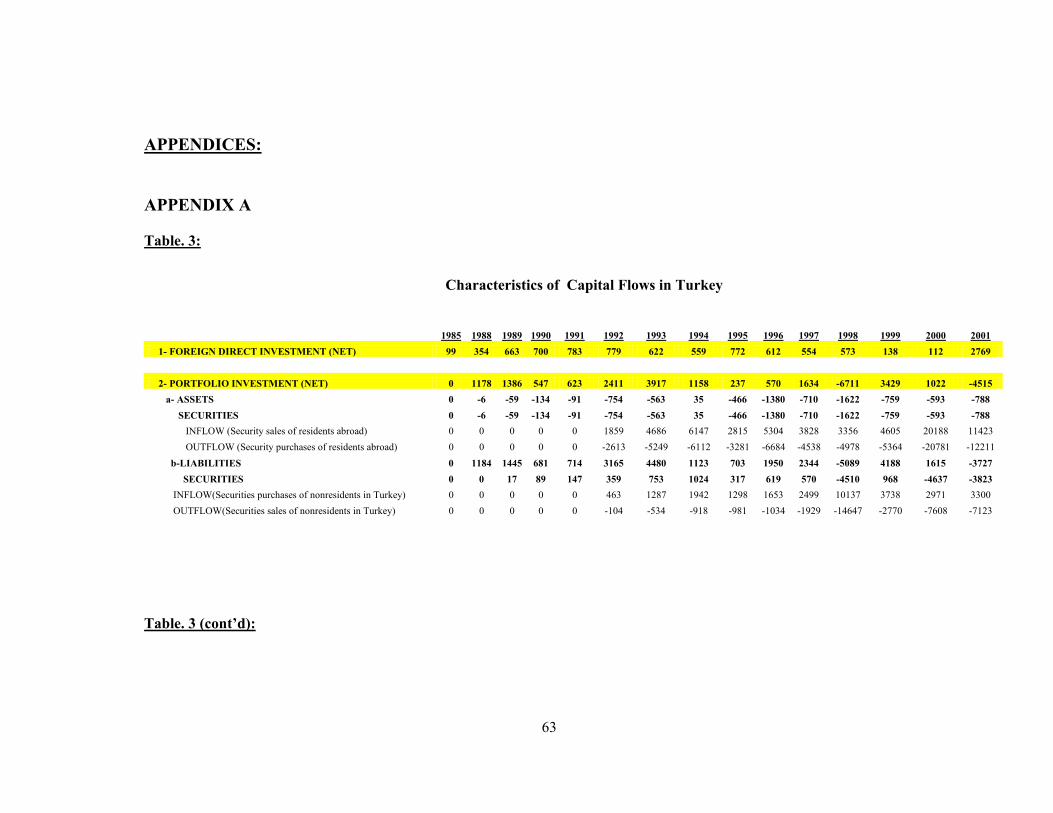
63
APPENDICES: APPENDIX A Table. 3:
Characteristics of Capital Flows in Turkey 1985 1988 1989 1990 1991 1992 1993 1994 1995 1996 1997 1998 1999 2000 2001 1- FOREIGN DIRECT INVESTMENT (NET) 99 354 663 700 783 779 622 559 772 612 554 573 138 112 2769
2- PORTFOLIO INVESTMENT (NET) 0 1178 1386 547 623 2411 3917 1158 237 570 1634 -6711 3429 1022 -4515 a- ASSETS 0 -6 -59 -134 -91 -754 -563 35 -466 -1380 -710 -1622 -759 -593 -788 SECURITIES 0 -6 -59 -134 -91 -754 -563 35 -466 -1380 -710 -1622 -759 -593 -788 INFLOW (Security sales of residents abroad) 0 0 0 0 0 1859 4686 6147 2815 5304 3828 3356 4605 20188 11423 OUTFLOW (Security purchases of residents abroad) 0 0 0 0 0 -2613 -5249 -6112 -3281 -6684 -4538 -4978 -5364 -20781 -12211 b-LIABILITIES 0 1184 1445 681 714 3165 4480 1123 703 1950 2344 -5089 4188 1615 -3727 SECURITIES 0 0 17 89 147 359 753 1024 317 619 570 -4510 968 -4637 -3823 INFLOW(Securities purchases of nonresidents in Turkey) 0 0 0 0 0 463 1287 1942 1298 1653 2499 10137 3738 2971 3300 OUTFLOW(Securities sales of nonresidents in Turkey) 0 0 0 0 0 -104 -534 -918 -981 -1034 -1929 -14647 -2770 -7608 -7123
Table. 3 (cont’d):
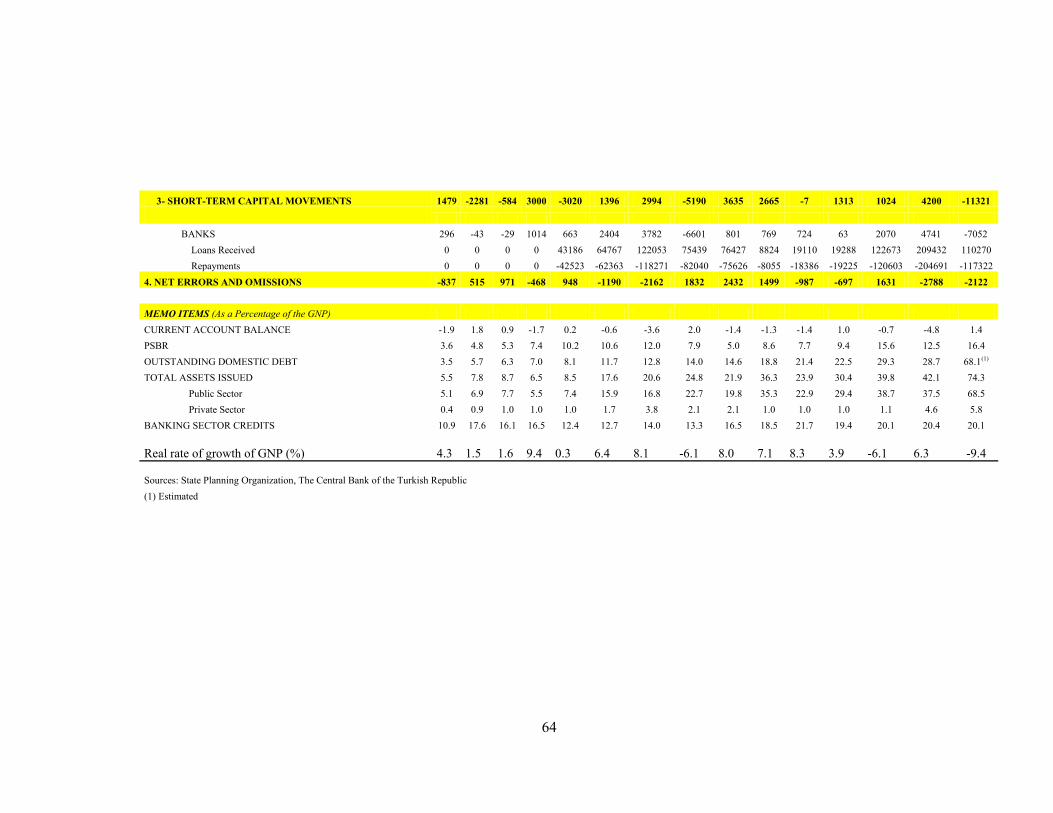
64
3- SHORT-TERM CAPITAL MOVEMENTS 1479 -2281 -584 3000 -3020 1396 2994 -5190 3635 2665 -7 1313 1024 4200 -11321 BANKS 296 -43 -29 1014 663 2404 3782 -6601 801 769 724 63 2070 4741 -7052 Loans Received 0 0 0 0 43186 64767 122053 75439 76427 8824 19110 19288 122673 209432 110270 Repayments 0 0 0 0 -42523 -62363 -118271 -82040 -75626 -8055 -18386 -19225 -120603 -204691 -117322 4. NET ERRORS AND OMISSIONS -837 515 971 -468 948 -1190 -2162 1832 2432 1499 -987 -697 1631 -2788 -2122 MEMO ITEMS (As a Percentage of the GNP) CURRENT ACCOUNT BALANCE -1.9 1.8 0.9 -1.7 0.2 -0.6 -3.6 2.0 -1.4 -1.3 -1.4 1.0 -0.7 -4.8 1.4 PSBR 3.6 4.8 5.3 7.4 10.2 10.6 12.0 7.9 5.0 8.6 7.7 9.4 15.6 12.5 16.4 OUTSTANDING DOMESTIC DEBT 3.5 5.7 6.3 7.0 8.1 11.7 12.8 14.0 14.6 18.8 21.4 22.5 29.3 28.7 68.1(1) TOTAL ASSETS ISSUED 5.5 7.8 8.7 6.5 8.5 17.6 20.6 24.8 21.9 36.3 23.9 30.4 39.8 42.1 74.3 Public Sector 5.1 6.9 7.7 5.5 7.4 15.9 16.8 22.7 19.8 35.3 22.9 29.4 38.7 37.5 68.5 Private Sector 0.4 0.9 1.0 1.0 1.0 1.7 3.8 2.1 2.1 1.0 1.0 1.0 1.1 4.6 5.8 BANKING SECTOR CREDITS 10.9 17.6 16.1 16.5 12.4 12.7 14.0 13.3 16.5 18.5 21.7 19.4 20.1 20.4 20.1
Real rate of growth of GNP (%) 4.3 1.5 1.6 9.4 0.3 6.4 8.1 -6.1 8.0 7.1 8.3 3.9 -6.1 6.3 -9.4
Sources: State Planning Organization, The Central Bank of the Turkish Republic
(1) Estimated
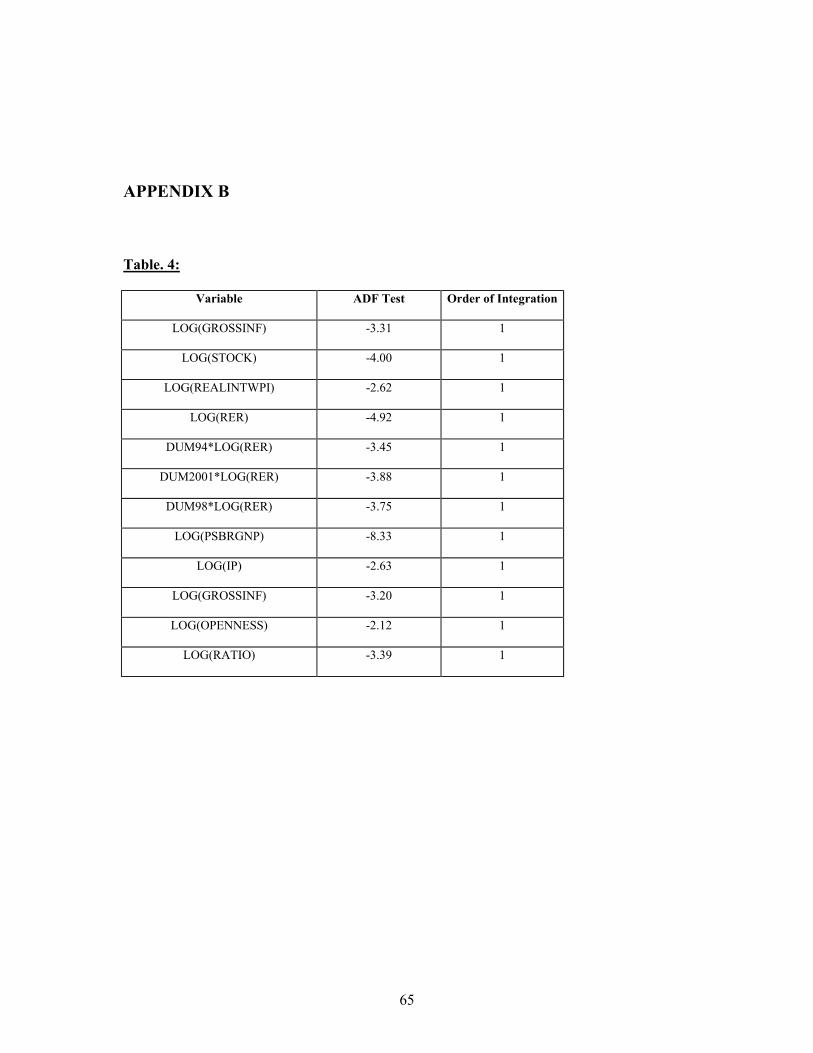
65
APPENDIX B
Table. 4:
Variable ADF Test Order of Integration
LOG(GROSSINF) -3.31 1
LOG(STOCK) -4.00 1
LOG(REALINTWPI) -2.62 1
LOG(RER) -4.92 1
DUM94*LOG(RER) -3.45 1
DUM2001*LOG(RER) -3.88 1
DUM98*LOG(RER) -3.75 1
LOG(PSBRGNP) -8.33 1
LOG(IP) -2.63 1
LOG(GROSSINF) -3.20 1
LOG(OPENNESS) -2.12 1
LOG(RATIO) -3.39 1
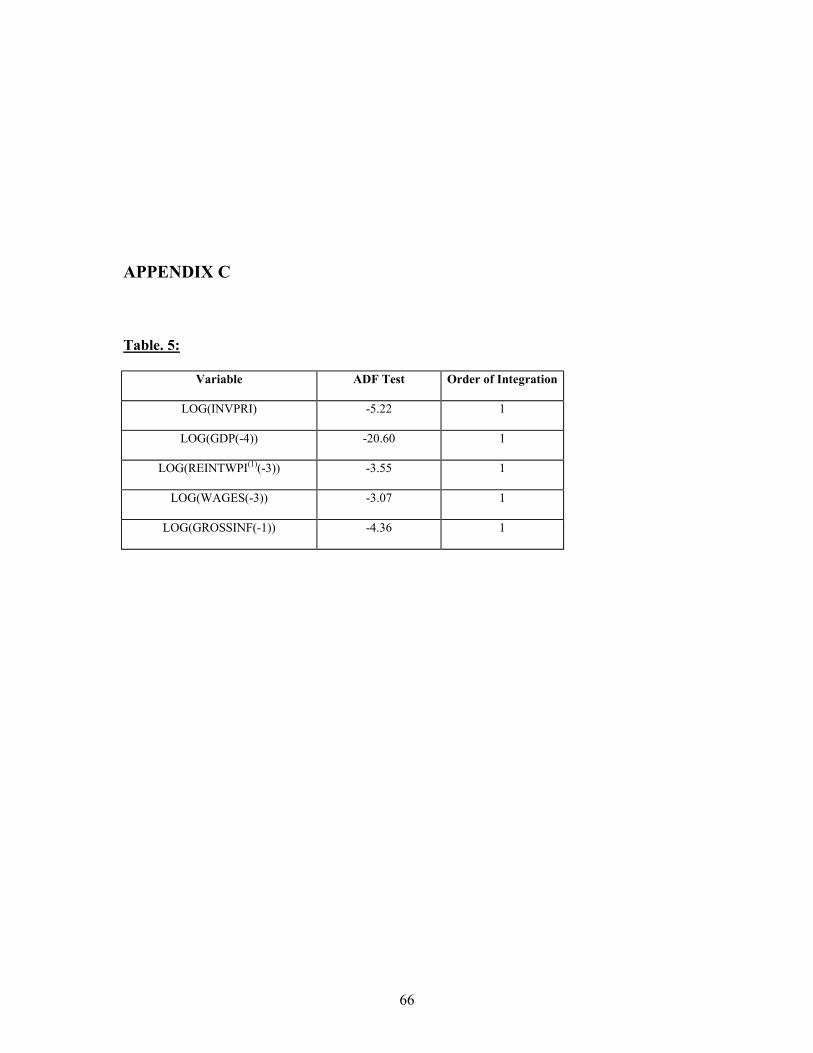
66
APPENDIX C
Table. 5:
Variable ADF Test Order of Integration
LOG(INVPRI) -5.22 1
LOG(GDP(-4)) -20.60 1
LOG(REINTWPI(1)(-3)) -3.55 1
LOG(WAGES(-3)) -3.07 1
LOG(GROSSINF(-1)) -4.36 1
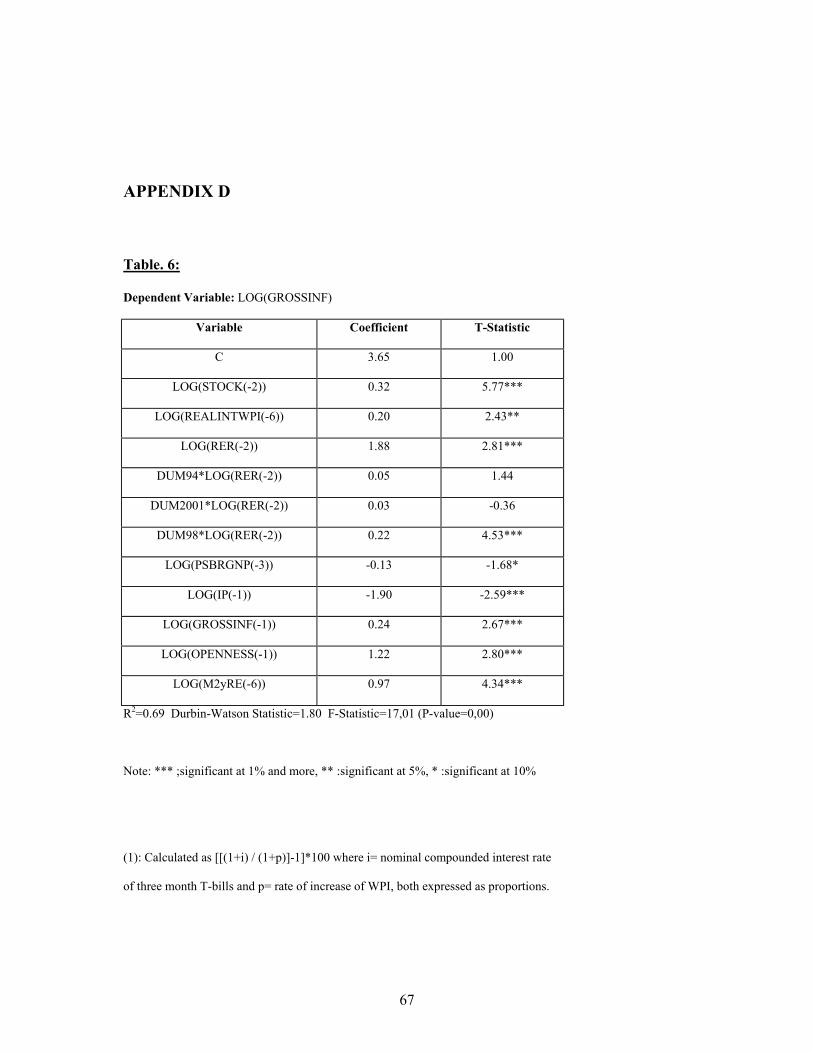
67
APPENDIX D
Table. 6:
Dependent Variable: LOG(GROSSINF)
Variable Coefficient T-Statistic
C 3.65 1.00
LOG(STOCK(-2)) 0.32 5.77***
LOG(REALINTWPI(-6)) 0.20 2.43**
LOG(RER(-2)) 1.88 2.81***
DUM94*LOG(RER(-2)) 0.05 1.44
DUM2001*LOG(RER(-2)) 0.03 -0.36
DUM98*LOG(RER(-2)) 0.22 4.53***
LOG(PSBRGNP(-3)) -0.13 -1.68*
LOG(IP(-1)) -1.90 -2.59***
LOG(GROSSINF(-1)) 0.24 2.67***
LOG(OPENNESS(-1)) 1.22 2.80***
LOG(M2yRE(-6)) 0.97 4.34***
R2=0.69 Durbin-Watson Statistic=1.80 F-Statistic=17,01 (P-value=0,00)
Note: *** ;significant at 1% and more, ** :significant at 5%, * :significant at 10%
(1): Calculated as [[(1+i) / (1+p)]-1]*100 where i= nominal compounded interest rate
of three month T-bills and p= rate of increase of WPI, both expressed as proportions.