Embed Size (px)
Citation preview

Medicine for Global Health
Banks et al. BMC Medicine (2015) 13:38 DOI 10.1186/s12916-015-0281-z
RESEARCH ARTICLE Open Access
Tobacco smoking and all-cause mortality in alarge Australian cohort study: findings from amature epidemic with current low smokingprevalenceEmily Banks1,2*, Grace Joshy1, Marianne F Weber3,4, Bette Liu2,5, Robert Grenfell6, Sam Egger3, Ellie Paige1,Alan D Lopez7, Freddy Sitas3,4,5 and Valerie Beral8
Abstract
Background: The smoking epidemic in Australia is characterised by historic levels of prolonged smoking, heavysmoking, very high levels of long-term cessation, and low current smoking prevalence, with 13% of adults reportingthat they smoked daily in 2013. Large-scale quantitative evidence on the relationship of tobacco smoking tomortality in Australia is not available despite the potential to provide independent international evidence about thecontemporary risks of smoking.
Methods: This is a prospective study of 204,953 individuals aged ≥45 years sampled from the general populationof New South Wales, Australia, who joined the 45 and Up Study from 2006–2009, with linked questionnaire,hospitalisation, and mortality data to mid-2012 and with no history of cancer (other than melanoma andnon-melanoma skin cancer), heart disease, stroke, or thrombosis. Hazard ratios (described here as relative risks, RRs)for all-cause mortality among current and past smokers compared to never-smokers were estimated, adjusting forage, education, income, region of residence, alcohol, and body mass index.
Results: Overall, 5,593 deaths accrued during follow-up (874,120 person-years; mean: 4.26 years); 7.7% ofparticipants were current smokers and 34.1% past smokers at baseline. Compared to never-smokers, the adjustedRR (95% CI) of mortality was 2.96 (2.69–3.25) in current smokers and was similar in men (2.82 (2.49–3.19)) andwomen (3.08 (2.63–3.60)) and according to birth cohort. Mortality RRs increased with increasing smoking intensity,with around two- and four-fold increases in mortality in current smokers of ≤14 (mean 10/day) and ≥25cigarettes/day, respectively, compared to never-smokers. Among past smokers, mortality diminished gradually withincreasing time since cessation and did not differ significantly from never-smokers in those quitting prior to age 45.Current smokers are estimated to die an average of 10 years earlier than non-smokers.
Conclusions: In Australia, up to two-thirds of deaths in current smokers can be attributed to smoking. Cessationreduces mortality compared with continuing to smoke, with cessation earlier in life resulting in greater reductions.
Keywords: Cohort, Mortality, Smoking
* Correspondence: [email protected] Centre for Epidemiology and Population Health, Australian NationalUniversity, 62 Mills Road, Acton ACT 2601, Australia2The Sax Institute, PO Box K617, Haymarket, Sydney, NSW 1240, AustraliaFull list of author information is available at the end of the article
© 2015 Banks et al.; licensee BioMed Central. This is an Open Access article distributed under the terms of the CreativeCommons Attribution License (http://creativecommons.org/licenses/by/4.0), which permits unrestricted use, distribution, andreproduction in any medium, provided the original work is properly credited. The Creative Commons Public DomainDedication waiver (http://creativecommons.org/publicdomain/zero/1.0/) applies to the data made available in this article,unless otherwise stated.
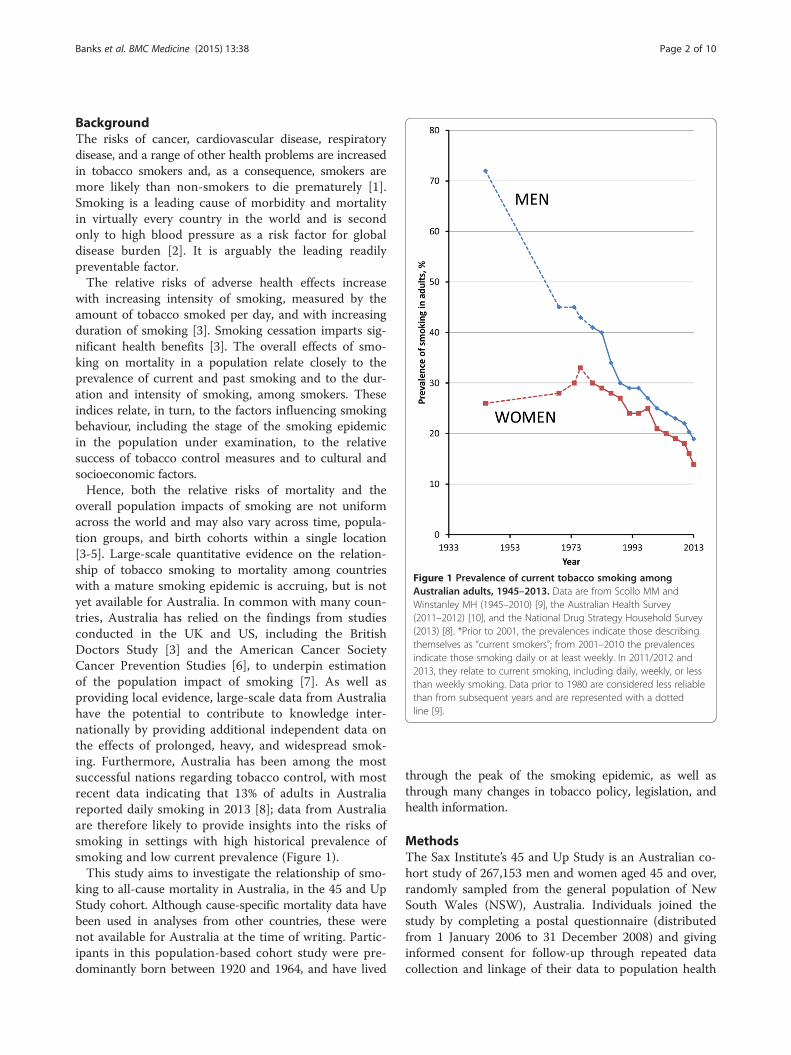
Figure 1 Prevalence of current tobacco smoking amongAustralian adults, 1945–2013. Data are from Scollo MM andWinstanley MH (1945–2010) [9], the Australian Health Survey(2011–2012) [10], and the National Drug Strategy Household Survey(2013) [8]. *Prior to 2001, the prevalences indicate those describingthemselves as “current smokers”; from 2001–2010 the prevalencesindicate those smoking daily or at least weekly. In 2011/2012 and2013, they relate to current smoking, including daily, weekly, or lessthan weekly smoking. Data prior to 1980 are considered less reliablethan from subsequent years and are represented with a dottedline [9].
Banks et al. BMC Medicine (2015) 13:38 Page 2 of 10
BackgroundThe risks of cancer, cardiovascular disease, respiratorydisease, and a range of other health problems are increasedin tobacco smokers and, as a consequence, smokers aremore likely than non-smokers to die prematurely [1].Smoking is a leading cause of morbidity and mortalityin virtually every country in the world and is secondonly to high blood pressure as a risk factor for globaldisease burden [2]. It is arguably the leading readilypreventable factor.The relative risks of adverse health effects increase
with increasing intensity of smoking, measured by theamount of tobacco smoked per day, and with increasingduration of smoking [3]. Smoking cessation imparts sig-nificant health benefits [3]. The overall effects of smo-king on mortality in a population relate closely to theprevalence of current and past smoking and to the dur-ation and intensity of smoking, among smokers. Theseindices relate, in turn, to the factors influencing smokingbehaviour, including the stage of the smoking epidemicin the population under examination, to the relativesuccess of tobacco control measures and to cultural andsocioeconomic factors.Hence, both the relative risks of mortality and the
overall population impacts of smoking are not uniformacross the world and may also vary across time, popula-tion groups, and birth cohorts within a single location[3-5]. Large-scale quantitative evidence on the relation-ship of tobacco smoking to mortality among countrieswith a mature smoking epidemic is accruing, but is notyet available for Australia. In common with many coun-tries, Australia has relied on the findings from studiesconducted in the UK and US, including the BritishDoctors Study [3] and the American Cancer SocietyCancer Prevention Studies [6], to underpin estimationof the population impact of smoking [7]. As well asproviding local evidence, large-scale data from Australiahave the potential to contribute to knowledge inter-nationally by providing additional independent data onthe effects of prolonged, heavy, and widespread smok-ing. Furthermore, Australia has been among the mostsuccessful nations regarding tobacco control, with mostrecent data indicating that 13% of adults in Australiareported daily smoking in 2013 [8]; data from Australiaare therefore likely to provide insights into the risks ofsmoking in settings with high historical prevalence ofsmoking and low current prevalence (Figure 1).This study aims to investigate the relationship of smo-
king to all-cause mortality in Australia, in the 45 and UpStudy cohort. Although cause-specific mortality data havebeen used in analyses from other countries, these werenot available for Australia at the time of writing. Partic-ipants in this population-based cohort study were pre-dominantly born between 1920 and 1964, and have lived
through the peak of the smoking epidemic, as well asthrough many changes in tobacco policy, legislation, andhealth information.
MethodsThe Sax Institute’s 45 and Up Study is an Australian co-hort study of 267,153 men and women aged 45 and over,randomly sampled from the general population of NewSouth Wales (NSW), Australia. Individuals joined thestudy by completing a postal questionnaire (distributedfrom 1 January 2006 to 31 December 2008) and givinginformed consent for follow-up through repeated datacollection and linkage of their data to population health
Banks et al. BMC Medicine (2015) 13:38 Page 3 of 10
databases. The study methods are described in detailelsewhere [11].Baseline questionnaire data included information on
socio-demographic factors, health behaviours, heightand body weight, medical and surgical history, functionalcapacity, and physical activity. The study questionnaireis available online [12]. To provide data to allow correc-tion for regression dilution, repeat data on smoking sta-tus were taken from a resurvey of a sample of 60,404participants a mean of 3.3 years after recruitment.Questionnaire data from study participants were linked
probabilistically to data from the NSW Register of Births,Deaths and Marriages up to 30 June 2012 to provide dataon fact and date of death. This probabilistic matching isknown to be highly accurate (false-positive and false-negative rates <0.4%) [13]. Death registrations capture alldeaths in NSW. Cause of death information was not avail-able at the time of analysis. In order to conduct sensitivityanalyses, questionnaire data were also linked probabilistic-ally to data from the NSW Admitted Patient Data Collec-tion, which is a complete census of all public and privatehospital admissions in NSW. The linked data that wereused contained details of admissions in participants fromthe year 2000 up to the point of recruitment, includingthe primary reason for admission using the InternationalClassification of Diseases 10th revision – Australian Modi-fication (ICD-10-AM) [14] and up to 54 additional clinicaldiagnoses.
Statistical methodsThere were 266,777 participants with valid data on ageand date of recruitment. Participants with data linkageerrors (n = 20, 0.01%), age below 45 years at baseline(n = 3, 0.001%), and missing or invalid data on smokingstatus (n = 860, 3%) were excluded. To minimise thepotential impact of changes in smoking behaviour andhigher mortality in those with baseline illness (alsoknown as reverse causality or the “sick quitter” effect),participants with a self-reported history of doctor-diagnosed cancer other than melanoma and/or non-melanoma skin cancer (n = 30,393, 11%) and those witha history of cardiovascular disease at baseline, defined asself-reported doctor-diagnosed heart disease, stroke, orblood clot on the baseline questionnaire (n = 30,548,11%) were excluded from this study. It was not possibleto exclude all individuals with respiratory illness be-cause this information was not available in an appropri-ate form from the baseline questionnaire. However,sensitivity analyses were conducted to investigate theimpact on the main results of additional exclusion ofindividuals with a history of admission to hospital withchronic obstructive pulmonary disease or other respira-tory illnesses (defined as an admission to hospital withICD-10-AM diagnosis codes J40 to J44 and J47 in any
of the 55 diagnostic fields) in the 6 years prior to com-pleting the baseline 45 and Up Study questionnaire.Smoking status was classified according to the re-
sponses to the following series of items on the baselinequestionnaire: “Have you ever been a regular smoker? If“Yes”, how old were you when you started smokingregularly? Are you a smoker now? If not, how old wereyou when you stopped smoking regularly? About howmuch do you/did you smoke on average each day?”Never-smokers were participants who answered “No” tothe question, “Have you ever been a regular smoker?”;current smokers were those who answered “Yes” to thisquestion and “Yes” to being a smoker now; and pastsmokers were those who indicated that they had everbeen a regular smoker but who indicated that they werenot a smoker now. The age at ceasing smoking, amongpast smokers, was taken as the age they indicated theystopped smoking regularly and was categorised as <25,25–34, 35–44, 45–54, and ≥55 years. Among currentand past smokers, the number of cigarettes smoked perday was taken from the answer to the question abouthow much they smoked on average each day and wascategorised as ≤14, 15–24, and ≥25 cigarettes/day.Mortality rates since baseline and 95% confidence in-
tervals (CIs) were calculated for participants who report-ed being current, past, and never-smokers at baseline;these were indirectly standardised for age to the person-year distribution of the whole cohort population [15],and were presented separately for men and women. Haz-ard ratios (which are equivalent to, and described hereas relative risks [RRs]) for mortality in men and womenwere estimated separately for men and women and ac-cording to birth cohorts with sufficient amounts of data,using Cox regression modelling, in which the underlyingtime variable was age. Estimates are shown initially ac-counting for age only (automatically adjusted for as theunderlying time variable). Models are then presentedadjusted for additional covariates derived from baselinequestionnaire and participant location data, includingeducation (<secondary school, secondary school graduation,trade/apprenticeship/certificate/diploma, university gradu-ate); annual pre-tax household income (AUD<$20,000,$20,000–$39,999, $40,000–$69,999, ≥$70,000); region ofresidence (major cities, inner regional areas, outer re-gional/remote areas); alcohol consumption (0, 1–14,≥15 alcoholic drinks/week), and body mass index (BMI)(<20, 20–24.99, 25–29.99, ≥30 kg/m2). Missing valuesfor covariates other than smoking status were includedin the models as separate categories. Hypertension anddyslipidaemia were considered likely to be part of thecausal pathway between smoking and mortality andwere not adjusted for. Sensitivity analyses were con-ducted: i) adjusting additionally for physical activity;and ii) categorising current smokers as those who

Banks et al. BMC Medicine (2015) 13:38 Page 4 of 10
reported being current smokers at baseline and pastsmokers who had ceased smoking 3 or fewer years priorto baseline.Among current and never-smokers at recruitment,
mortality rates and RRs by amount smoked were calcu-lated according to categories of consumption reported atrecruitment (≤14, 15–24, and ≥25 cigarettes/day). Mor-tality rates were then plotted against the mean numberof cigarettes within each category reported at the 3-yearresurvey among those who reported being current smokersat resurvey, as this was considered the best estimate oflong-term mean consumption among all in that category,before the study started (Additional file 1: Table S1). Ratesin never-smokers were plotted against the “0” on the x-axis.The RR of dying during the follow-up period was thenquantified among past versus never-smokers, in thoseceasing smoking at ages <25, 25–34, 35–44, and 45–54years. Sensitivity analyses were conducted restricting thedata to individuals aged ≥55 years, ensuring that all partic-ipants had the opportunity to quit at these ages.The proportionality assumption of the Cox regression
models was verified by plotting the Schoenfeld residualsagainst the time variable in each model, with a stratifiedform or time-dependent form of the model used wherecovariates displayed non-proportionality of hazards. Noviolations of the proportionality assumption were detectedfor the main exposure. Minor violations were observed incovariates for certain models and a stratified Cox modelwas fitted, as follows: overall analyses of current and pastversus never-smokers – model stratified by education;analyses relating to birth decade – model stratified by al-cohol, education, and income; analyses relating to numberof cigarettes smoked per day – model stratified by income;analyses relating to age at smoking cessation – modelstratified by alcohol and education.Separately for males and females, absolute mortality
rates for Australian smokers and non-smokers for agegroup i (45–54, 55–64, and 65–74 years) were esti-mated by Mi/(1 + (RR − 1)Pi) for non-smokers and RRtimes this for smokers [16] (where Mi and Pi represent2010/2011 Australian population mortality rates andsmoking prevalence estimated from other sources, re-spectively [17,18], and RR represents all-cause currentsmoker versus never-smoker RRs estimated in thecurrent study). From these rates, cumulative risks ofdeath for non-smokers and smokers at age x (55, 65,
or 75 years) from age 45 were estimated by 1− exp
−10Xx
i¼ 45−54ð ÞMRi
��(where MRi is either the smoker
or non-smoker mortality rate for age group i) [19].All statistical tests were two-sided, using a significance
level of 5%. Analyses were carried out using SAS® ver-sion 9.3 [20] and Stata® versions 11 and 13.
Ethical approval for the 45 and Up Study as awhole was provided by the University of New SouthWales Human Research Ethics Committee and spe-cifically for this study by the NSW Population andHealth Services Research Ethics Committee and theAustralian National University Human Research EthicsCommittee.
Role of funding sourcesThe sponsors of this study had no role in study design,data collection, data analysis, data interpretation, or thewriting of the report. All authors had full access to thedata in the study and had final responsibility for thedecision to submit for publication.
ResultsAt baseline, 7.7% of the 204,953 study participants re-ported being current smokers and 34.1% were pastsmokers. Of the 84,312 participants with relevant data,81,179 (96%) smoked only cigarettes, 1,572 (2%) smokedonly pipes/cigars, and 1,561 (2%) reported smoking both.The prevalence of smoking was similar in men andwomen. Compared to never-smokers, current smokerswere, on average, younger, less likely to be urban resi-dents, of lower income and education level, and lesslikely to hold private health insurance; they were morelikely to report consuming ≥15 alcoholic drinks/weekand to have a BMI <20 kg/m2 (Table 1).The mean age at commencing smoking was similar for
male study participants born in the decades from 1920–1929 to 1960–1969 (Additional file 2: Table S2). Forwomen, the average age at commencing smoking de-creased from 24 years in those born in 1920–1929 to17 years among those born in 1960–1969, similar tomales born in this decade (Additional file 2: Table S2).The average duration of smoking in current smokerswas 38.5 years (SD, 9.4 years), with the majority havingsmoked for 35 or more years and reporting consuming15 or more cigarettes per day (Table 2). Because of thenarrow age range of commencing smoking, duration ofsmoking among current smokers was strongly corre-lated with current age (r = 0.8). Data from the 3-yearresurvey indicated consistency of reporting of never-smoker and ex-smoker status, with little misclassifica-tion and very few indicating that they had taken upsmoking between surveys (Additional file 1: Table S1).Among current smokers at baseline who completedthe 3-year resurvey, around one-third indicated thatthey were no longer smoking at resurvey, with thosesmoking fewer cigarettes per day being more likely to quit(Additional file 1: Table S1).Over a mean follow-up time of 4.26 years, 874,120
person-years accrued and 5,593 deaths occurred. The RR(95% CI) of dying during the follow-up period, adjusting

Table 1 Characteristics of participants in the study according to smoking status
Smoking status Total
Current Past Never
Total 15,768 69,900 119,285 204,953
Men 7,625 (48%) 37,335 (53%) 45,251 (38%) 90,211 (44%)
Age
45–64 years 12,951 (82%) 45,107 (65%) 79,667 (67%) 137,725 (67%)
65–79 years 2,443 (15%) 19,378 (28%) 29,913 (25%) 51,734 (25%)
≥80 years 374 (2%) 5,415 (8%) 9,705 (8%) 15,494 (8%)
Residing in Major Cities 6,428 (41%) 30,103 (43%) 55,300 (46%) 91,831 (45%)
University degree 2,209 (14%) 15,300 (22%) 32,721 (27%) 50,230 (25%)
Household income≥ $70,000 2,789 (18%) 18,218 (26%) 33,195 (28%) 54,202 (26%)
Private health insurance 6,714 (43%) 45,066 (64%) 84,007 (70%) 135,787 (66%)
≥15 alcoholic drinks/week 3,762 (24%) 15,685 (22%) 9,699 (8%) 29,146 (14%)
Highest physical activity tertile 5,278 (33%) 25,475 (36%) 39,044 (33%) 69,797 (34%)
Born in Australia 11,714 (74%) 50,845 (73%) 90,477 (76%) 153,036 (75%)
Body mass index
<20 kg/m2 1,011 (6%) 1,848 (3%) 4,711 (4%) 7,570 (4%)
≥30 kg/m2 3,084 (20%) 16,160 (23%) 22,618 (19%) 41,862 (20%)
Banks et al. BMC Medicine (2015) 13:38 Page 5 of 10
for age, socioeconomic factors, alcohol intake, and BMI,was 2.96 (2.69–3.25) in current versus never-smokersoverall, and 2.82 (2.49–3.19) and 3.08 (2.63–3.60) in menand women, respectively (Figure 2). The adjusted RRs inpast versus never-smokers were 1.43 (1.35–1.52) overalland 1.34 (1.24–1.45) and 1.54 (1.40–1.70) in men andwomen, respectively (Figure 2). Although the absoluterates of death were higher for men than for women, theRRs relating to current and past smoking did not differsubstantively between the sexes; nor did they vary materi-ally according to birth cohort, from 1920–1959 (Figure 2).The results remained similar following exclusion of indi-viduals with a history of admission to hospital with a diag-nosis of chronic obstructive pulmonary disease and otherrespiratory illness; compared to never-smokers, RRs ofmortality were 2.76 (2.42–3.14) and 2.95 (2.50–3.49) inmale and female current smokers, respectively, with cor-responding RRs in past smokers of 1.27 (1.17–1.37) and1.39 (1.25–1.55). RRs did not change materially when fur-ther adjusted for physical activity and when data amongpast smokers were restricted to individuals aged 55 andover who had the opportunity to cease smoking from age45–54 (data not shown). Nor did the RRs for mortality incurrent and former versus never-smokers change substan-tially when current smokers were defined as individualsreporting current smoking at baseline or within 3 yearsprior to baseline (for men RR (95% CI) using the newdefinitions of current/recent versus never-smokers: 2.65(2.36–2.96) and former versus never-smokers: 1.34 (1.24–1.44); the corresponding figures for women were 3.26(2.84–3.75) and 1.47 (1.33–1.62)).
Among current smokers, the mortality rate during thefollow-up period increased markedly with increasingnumber of cigarettes smoked per day, with around atwo-fold increase in mortality in the groups smoking 14or fewer cigarettes per day (10 cigarettes per day, onaverage) and around a four-fold increase in the groupsof current smokers who smoke ≥25 cigarettes per day,compared to never-smokers (Figure 3 and Additional file 3:Figure S1). While there was evidence that the increasein mortality with increasing numbers of cigarettessmoked was significantly greater for women than formen (P(interaction) = 0.0002), the confidence intervals wererelatively wide and the absolute mortality rates were con-siderably higher for men than for women.The RR of dying during the follow-up period was 1.42
(1.29–1.58) among individuals ceasing smoking at age45–54, compared to never-smokers (Figure 4); corre-sponding results were 1.36 (1.20–1.53) among men and1.52 (1.27–1.82) among women (Additional file 4: FigureS2). Mortality diminished progressively with increasingtime since cessation of smoking (data not shown) anddid not differ significantly from that in never-smokers inindividuals ceasing use prior to age 45 (Figure 4).In Australia, male and female smokers were esti-
mated to have the same risks of death 9.6 and 10.1years earlier than 75-year-old non-smokers, respect-ively (Figure 5). Starting from age 45, 44.6% of malesmokers in Australia would be estimated to die by age 75,compared to 18.9% of male non-smokers. Correspondingfigures for females were 33.0% for smokers and 12.2% fornon-smokers.

Table 2 Smoking habits among current and formersmokers, by sex
Men Women
Never-smoker 45,251 (50%) 74,034 (65%)
Current smoker 7,625 (8%) 8,143 (7%)
Smoking duration (years)
Mean ± SD 39.9 ± 9.8 37.1 ± 8.8
<20 124 (1.6%) 205 (2.5%)
20–34 2,143 (28%) 3,085 (38%)
35–49 3,869 (51%) 3,814 (47%)
≥50 1,063 (14%) 541 (7%)
Cigarettes/day
Mean ± SD 18.9 ± 10.4 16.6 ± 8.6
≤14 2,308 (30%) 3,016 (37%)
15–24 2,931 (38%) 3,324 (41%)
≥25 2,222 (29%) 1,632 (20%)
Age at starting smoking (years)
Mean ± SD 17.6 ± 5.2 18.7 ± 6.1
<13 525 (7%) 222 (3%)
13–17 3,741 (49%) 3,736 (46%)
18–25 2,408 (32%) 2,863 (35%)
≥25 526 (7%) 824 (10%)
Past smoker 37,335 (41%) 32,565 (28%)
Smoking duration (years)
Mean ± SD 22.6 ± 12.7 19.8 ± 12.2
<20 15,669 (42%) 16,305 (50%)
20–34 12,707 (34%) 10,126 (31%)
35–49 5,767 (15%) 3,796 (12%)
≥50 888 (2%) 351 (1%)
Cigarettes/day
Mean ± SD 20.1 ± 13.8 15.2 ± 10.4
≤14 12,083 (32%) 16,121 (50%)
15–24 15,004 (40%) 11,036 (34%)
≥25 9,725 (26%) 4,910 (15%)
Age at starting smoking (years)
Mean ± SD 17.5 ± 3.8 18.5 ± 4.7
<13 1,439 (4%) 469 (1%)
13–17 18,316 (49%) 13,624 (42%)
18–25 14,238 (38%) 14,363 (44%)
≥25 1,621 (4%) 2,600 (8%)
Age at ceasing smoking (years)
Mean ± SD 40.1 ± 12.6 38.4 ± 12.5
<25 3,421 (9%) 4,109 (13%)
25–34 9,616 (26%) 9,207 (28%)
35–44 9,548 (26%) 7,461 (23%)
45–54 7,627 (20%) 6,354 (20%)
≥55 5,259 (14%) 3,776 (12%)
Numbers may not add up to total due to missing data.
Banks et al. BMC Medicine (2015) 13:38 Page 6 of 10
DiscussionIn this large-scale, population-based Australian study,death rates in current smokers were around three-foldthose of people who had never smoked, in both menand women. On average, smokers died around 10 yearsearlier than non-smokers, over the ages examined. Mor-tality rates increased substantially with increasing inten-sity of smoking, with rates approximately doubling inthose smoking around 10 cigarettes per day and four- tofive-fold those of never-smokers in current smokers of25 or more cigarettes per day. Cessation of smokingconferred large mortality benefits compared with con-tinuing to smoke. These findings were adjusted for a rangeof potential confounding factors, including socioeconomicstatus, alcohol intake, and BMI.These findings are virtually identical to those on the
contemporary risks of smoking from the UK and US,where the RR of all-cause mortality in current versusnever-smokers has been consistently reported at 2.8 to3.0 [3,21-23] and similar to a recent report from Japan[24]. The finding of similar RRs among smokers acrosssuccessive birth cohorts in this study indicates that, incommon with these countries, it is likely that the fullmortality impacts of smoking are being realised amongsmokers in Australia. The evolution of increasing smoking-attributable mortality over time is well documented, withRRs of all-cause mortality in current versus never-smokersof around 1.4 to 1.8 in the 1960s to 2.1 to 2.3 in the1980s [3,6], corresponding to up to around one-thirdand one-half of the deaths in smokers being attribut-able to smoking, respectively. The findings from thisand contemporary estimates from the US and UK indi-cate that up to two-thirds of deaths in smokers in the21st century in these settings are likely to have beencaused by smoking [3,6,23]. The progressive increase inRRs has been attributed to the earlier commencementof smoking and greater intensity of smoking amongsuccessive birth cohorts, along with reductions in mor-tality among never-smokers [3,6,23]. In keeping withthis, the smoking-related RRs in countries where wide-spread heavy and prolonged smoking from an early agebegan more recently are somewhat lower than thoseobserved here [25].The study provides the first large-scale direct evidence
on the relationship of smoking to mortality in Australia.The population examined displays quantitatively manyof the characteristics of a mature epidemic of smokingin the Western context, namely a relatively low preva-lence of current smoking; similar prevalence of currentsmoking in men and women; long durations and stableintensities of smoking among current smokers; youngand stable age at commencing smoking; a high prevalenceof past smoking; and stable RRs of smoking-relatedmortality in successive birth cohorts [26]. Consistent RRs

Figure 2 Relative risks and absolute rates of all-cause mortality in the 45 and Up Study in current and past smokers relative tonever-smokers, overall and by decade of birth. Rate/1,000 person-years, indirectly standardised for age using the whole cohort distribution. *RRadjusted for age only (underlying time variable). #RR adjusted for age, region of residence (major cities, inner regional areas, remote areas), alcoholconsumption (0, 1–14, ≥15 drinks/week), annual pre-tax household income (AUD <$20,000, $20,000-$39,999, $40,000-$69,999, ≥$70,000), education(<secondary school, secondary school graduation, certificate or diploma, university graduate), and BMI (<20, 20–24.9, 25–29.9, ≥30). RRs are plotted ona log-scale and are represented with squares with areas inversely proportional to the variance of the logarithm of the RR, providing an indication ofthe amount of statistical information available; 95% CIs are indicated by horizontal lines.
Figure 3 Age standardised rates of all-cause mortality incurrent smokers and never-smokers, by smoking intensity.Categories of smoking intensity (0 (never smokers), ≤14, 15–24, ≥25cigarettes/day) are based on smoking behaviour reported atbaseline. Rates are plotted against the mean number of cigaretteswithin each pre-defined category, based on smoking intensityreported at the 3-year resurvey among current smokers at resurvey,to minimise regression dilution bias. Vertical lines represent 95%confidence intervals; the intervals around the rates for never-smokersare small and contained within the squares that indicate the rates[Men 6.8 (6.4–7.2), Women 4.0 (3.8–4.2)].
Figure 4 Relative risk of all-cause mortality in past smokersrelative to never-smokers in the 45 and Up Study, by age atsmoking cessation. RRs adjusted for age, sex, region of residence(major cities, inner regional areas, remote areas), alcohol consumption(0, 1–14, ≥15 drinks/week), annual pre-tax household income(AUD <$20,000, $20,000–$39,999, $40,000–$69,999, ≥$70,000),education (<secondary school, secondary school graduation,certificate or diploma, university graduate), and BMI (<20, 20–24.9,25–29.9, ≥30). RRs plotted on log-scale against median valuefor age at stopping smoking categories <25, 25–34, 35–44, and45–54 years.
Banks et al. BMC Medicine (2015) 13:38 Page 7 of 10

Figure 5 Estimated cumulative risks of death from age 45 to 75 years in the Australian population in smokers and non-smokers formales and females.
Banks et al. BMC Medicine (2015) 13:38 Page 8 of 10
among successive birth cohorts were observed althoughthe tar content in cigarettes in Australia has fallen overthe last four decades [9]. The findings also demonstratethe continuing harms of smoking, despite highly success-ful tobacco control measures, and the need for continuingattention and control. The introduction of “plain pack-aging” for cigarettes in Australia in 2012 is an example ofthe continuing efforts required.This study has the strength of being large and population-
based, with independent and virtually complete data onthe outcome of all-cause mortality. The study ascer-tained smoking status from questionnaire items thatare based on those used in the Million Women Study,allowing direct international comparison of results [23].Repeat data collection on smoking status allowed cor-rection for regression dilution, such that the findingsrelating to smoking intensity are likely to reflect long-term habits. In keeping with the continuing decline insmoking prevalence in Australia, the data indicate thata substantial minority of current smokers at baselineceased smoking during the follow-up period. This sug-gests that the estimated hazard ratios for mortalityamong current smokers at baseline are likely to be con-servative. Although we do not have direct data on useof smokeless tobacco products among participants, im-portation and supply of these products has been illegalin Australia since 1991 and use has been negligible sincethen [27].
The study provides evidence on the effects of heavyand prolonged smoking in a setting where the preva-lence of smoking is now low. Around 12% of individualsaged 45 and over in NSW were estimated to be currentsmokers at the time when the 45 and Up Study com-menced [28] and, following exclusions, current smokersmade up around 8% of the cohort. It should be notedthat although the 45 and Up Study is, like the vast ma-jority of cohort studies, not strictly representative of thegeneral population, the results presented here are basedon internal comparisons within the cohort and are likelyto be reliable [28]. Moreover, as the British Doctors Studyillustrates, cohort studies do not need to be representativeto produce effect estimates that are generalizable. Follow-up time was relatively short, which has the advantage ofmeaning that smoking status measured at baseline is likelyto broadly represent smoking status during the follow-upperiod. NSW is the most populous state in Australia,comprising around one-third of the total population.Smoking prevalence and cause-specific death rates formajor causes of death in NSW are similar to those ob-served nationally [17,18].To ensure that the study focussed on the likely causal
effect of smoking on mortality, participants who had hadcancer or cardiovascular disease at baseline were exclu-ded. Although it was not possible to exclude individualswith chronic respiratory disease, sensitivity analyses in-dicated that the results did not change materially when
Banks et al. BMC Medicine (2015) 13:38 Page 9 of 10
individuals with a previous hospital admission includinga diagnosis of respiratory illness were excluded. Becauseof the tendency for smokers, particularly older smokers,to quit due to ill-health, it was not possible to reliablyestimate the mortality risks in those ceasing smoking atolder ages (i.e., 55 years or older), although they repre-sented the minority of past smokers. It should be notedthat the findings here are contingent on surviving to age45; however, few deaths attributable to smoking are likelyto have occurred below this age.The evidence presented here relates to death from any
cause. Data on cause of death were not available at thetime this study was conducted. International evidenceshows that the vast majority of excess deaths in smokersare caused by smoking and are due to conditions suchas cardiovascular disease, cancer, and chronic lung dis-ease. However, it should be borne in mind that a minor-ity of deaths, such as those related to suicide, may beincreased in smokers but may not be wholly caused bysmoking. Hence, although we are not able to exclude therelatively small number of deaths that are less likely tobe causally related to smoking, the large majority of theobserved excess mortality in smokers observed herewould have been caused by smoking [3].
ConclusionsThe national prevalence of smoking in Australia hasfallen rapidly and is now among the lowest in the world,with an estimated 13% of adults smoking daily. A num-ber of countries are moving towards tobacco “eradication”.These data indicate that, in a low prevalence setting, therisks of continuing to smoke and the benefits of cessationremain high.
Additional files
Additional file 1: Table S1, Smoking patterns at re-survey, bysmoking status reported at baseline.
Additional file 2: Table S2, Smoking habits among current andformer smokers by sex and birth decade.
Additional file 3: Figure S1, Relative risk (RR) of all-cause mortality incurrent and past smokers relative to never smokers, by smoking intensity,separately for men and women. Rate/1,000 person-years, indirectlystandardised for age using the whole cohort distribution. *RR adjustedfor age only (underlying time variable). #RR adjusted for age (underlyingtime variable), region of residence (major cities, inner regional areas,remote areas), alcohol consumption (0 , 1–14, ≥15 drinks/week), annualpre-tax household income (AUD <$20,000, $20,000–$39,999, $40,000–$69,999, ≥$70,000), education (<secondary school, secondary schoolgraduation, certificate or diploma, university graduate), and BMI (<20,20–25, 25–30, ≥30). RRs are plotted on a log-scale and are representedwith squares with areas inversely proportional to the variance of thelogarithm of the RR, providing an indication of the amount of statisticalinformation available; 95% CIs are indicated by horizontal lines.
Additional file 4: Figure S2, Relative risk (RR) of all-cause mortalityin past smokers relative to never-smokers in the 45 and Up Study,by age at smoking cessation, separately for men and women. Rate/1,000 person-years, indirectly standardised for age using the whole cohort
distribution. *RR adjusted for age only (underlying time variable). #RR adjustedfor age (underlying time variable), region of residence (major cities, innerregional areas, remote areas), alcohol consumption (0, 1–14, ≥15 drinks/week),annual pre-tax household income (AUD<$20,000, $20,000–$39,999, $40,000–$69,999, ≥$70,000), education (<secondary school, secondary school graduation,certificate or diploma, university graduate), and BMI (<20, 20–25, 25–30, ≥30). RRsare plotted on a log-scale and are represented with squares with areas inverselyproportional to the variance of the logarithm of the RR, providing an indicationof the amount of statistical information available; 95% CIs are indicated byhorizontal lines. Mean (±SD) number of cigarettes/day for the above age atsmoking cessation groups (<25, 25–35, 35–44, 45–54 years) were: 15.4 ±10.5, 18.7 ± 12.5, 21 ± 14.5, and 21.8 ± 14.6, respectively, among men, and11.7 ± 8.4, 13.8 ± 9.2, 16.1 ± 10.8, and 17.2 ± 11.3, respectively, amongwomen.
AbbreviationsAUD: Australian dollars; BMI: Body mass index; CIs: Confidence intervals;ICD-10-AM: International Classification of Diseases 10th revision – AustralianModification; NSW: New South Wales; RR: Hazard ratios (described here asrelative risks).
Competing interestsThe authors declare that they have no competing interests.
Authors’ contributionsEB and VB conceived of the original idea for the paper. GJ, SE, and EPconducted the data analyses. EB produced the initial draft of the paper.All authors were involved in the interpretation of the analyses and writing ofthe paper. All authors approved the final version of the paper and takeresponsibility for its content.
AcknowledgementsThis research was completed using data collected through the 45 and UpStudy (www.saxinstitute.org.au). The 45 and Up Study is managed by theSax Institute in collaboration with major partner Cancer Council NSW, andpartners the National Heart Foundation of Australia (NSW Division), NSWMinistry of Health, beyondblue, NSW Government Family & CommunityServices – Carers, Ageing and Disability Inclusion, and the Australian RedCross Blood Service. We thank the many thousands of people participatingin the 45 and Up Study.This specific project was supported by a Cardiovascular Disease NetworkDevelopment Grant from the Heart Foundation of Australia, with supportfrom the Study of Economic and Environmental Factors in Health project,funded by the National Health and Medical Research Council of Australia(grant reference: 402810). EB and BL are supported by the National Healthand Medical Research Council of Australia.
Author details1National Centre for Epidemiology and Population Health, Australian NationalUniversity, 62 Mills Road, Acton ACT 2601, Australia. 2The Sax Institute, POBox K617, Haymarket, Sydney, NSW 1240, Australia. 3Cancer Council NSW, POBox 572, Kings Cross, Sydney, NSW 1340, Australia. 4School of PopulationHealth, Edward Ford Building, University of Sydney, Sydney, NSW 2006,Australia. 5School of Public Health and Community Medicine, UNSW, Sydney,NSW 2052, Australia. 6National Heart Foundation of Australia, Level 12/500Collins Street, Melbourne, VIC 3000, Australia. 7Melbourne School ofPopulation and Global Health, University of Melbourne, Level 4, 207 BouverieStreet, Melbourne, VIC 3010, Australia. 8Cancer Epidemiology Unit, Universityof Oxford, Richard Doll Building, Roosevelt Drive, Oxford OX3 7LF, UK.
Received: 5 November 2014 Accepted: 20 January 2015
References1. US Department of Health and Human Services. The health consequences of
smoking—50 years of progress: a report of the surgeon general. Atlanta,GA; 2014. http://www.surgeongeneral.gov/library/reports/50-years-of-progress/.
2. Lim SS, Vos T, Flaxman A, Danaei G, Shibuya K, Adair-Rohani H, et al. Acomparative risk assessment of burden of disease and injury attributable

Banks et al. BMC Medicine (2015) 13:38 Page 10 of 10
to 67 risk factors and risk factor clusters in 21 regions, 1990–2010: asystematic analysis for the Global Burden of Disease Study 2010. Lancet.2012;380:2224–60.
3. Doll R, Peto R, Boreham J, Sutherland I. Mortality in relation to smoking:50 years’ observations on male British doctors. Br Med J. 2004;328:1519–28.
4. Carter KN, Blakely T, Soeberg M. Trends in survival and life expectancy byethnicity, income and smoking in New Zealand: 1980s to 2000s. N Z Med J.2010;123:13–24.
5. Sitas F, Egger S, Bradshaw D, Groenewald P, Laubscher R, Kielkowski D, et al.Differences among the coloured, white, black, and other South Africanpopulations in smoking-attributed mortality at ages 35–74 years: acase–control study of 481,640 deaths. Lancet. 2013;382:685–93.
6. Thun M, Carter B, Feskanich D, Freedman N, Prentice R, Lopez A, et al.50-year trends in smoking-related mortality in the United States. N Eng JMed. 2013;368:351–64.
7. Begg S, Vos T, Barker B, Stevenson C, Stanley L, Lopez A. The burden ofdisease and injury in Australia 2003. PHE 82. Canberra: AIHW; 2007.
8. National Drug Strategy Household Survey 2013: data and references.http://www.aihw.gov.au/alcohol-and-other-drugs/ndshs/2013/data-and-references/. Accessed 5 September 2014.
9. Scollo MM, Winstanley MH. Tobacco in Australia: facts and issues. 4th ed.Melbourne: Cancer Council Victoria; 2012. www.tobaccoinaustralia.org.au.
10. Australian Bureau of Statistics. Australian Health Survey: first results, 2011–12(Cat no: 4364.0.55.001). Canberra. 2012. http://www.abs.gov.au/AUSSTATS/[email protected]/Lookup/4364.0.55.001Main+Features12011-12?OpenDocument.Accessed 30 April 2014.
11. Banks E, Redman S, Jorm L, Armstrong B, Bauman A, Beard J, et al. Cohortprofile: the 45 and Up Study. Int J Epidemiol. 2008;37:941–7.
12. Sax Institute. Questionnaires: the baseline questionnaire. https://www.saxinstitute.org.au/our-work/45-up-study/questionnaires/.
13. Centre for Health Record Linkage. CHeReL quality assurance. http://www.cherel.org.au/quality-assurance. Accessed 21 Jan 2014.
14. National Centre for Classification in Health. International StatisticalClassification of Diseases and Related Health Problems, 10th Revision,Australian Modification (ICD-10-AM). Fifthth ed. Sydney: National Centre forClassification in Health; 2006.
15. Kahn HA, Sempos CT. Statistical methods in epidemiology. New York:Oxford University Press; 1989.
16. Liu BQ, Peto R, Chen Z-M, Boreham J, Wu Y-P, Li J-Y, et al. Emergingtobacco hazards in China: 1. Retrospective proportional mortality study ofone million deaths. Brit Med J. 1998;317:1411–22.
17. Australian Bureau of Statistics: Deaths, Australia, 2010. http://www.abs.gov.au/AUSSTATS/[email protected]/DetailsPage/3302.02010?OpenDocument.Accessed 22nd October 2013.
18. Australian Bureau of Statistics: Australian Health Survey. Updated Results,2011–12. http://www.abs.gov.au/AUSSTATS/subscriber.nsf/log?openagent&43640do007_20112012.xls&4364.0.55.001&DataCubes&18DEF104A278854DCA257B820017A5DB&0&2011-12&07.06.2013&Latest. Accessed December 2014.
19. Schouten LJ, Straatman H, Kiemeney LA, Verbeek AL. Cancer incidence:life table risk versus cumulative risk. J Epidemiol Community Health.1994;48:596–600.
20. Institute SAS. SAS version 9.3 [computer program]. North Carolina, USA:SAS Institute; 2011.
21. Jha P, Ramasundarahettige C, Landsman V, Rostron B, Thun M, AndersonRN, et al. 21st-century hazards of smoking and benefits of cessation in theUnited States. N Engl J Med. 2013;368:341–50.
22. Thun MJ, Lopez AD, Hartge P. Smoking-related mortality in the UnitedStates. N Engl J Med. 2013;368:1753.
23. Pirie K, Peto R, Reeves GK, Green J, Beral V, Million Women StudyCollaborators. The 21st century hazards of smoking and benefits ofstopping: a prospective study of one million women in the UK. Lancet.2013;381:133–41.
24. Sakata R, McGale P, Grant EJ, Ozasa K, Peto R, Darby SC. Impact of smokingon mortality and life expectancy in Japanese smokers: a prospective cohortstudy. BMJ. 2012;345:e7093.
25. Zheng W, McLerran DF, Rolland BA, Fu Z, Boffetta P, He J, et al. Burden oftotal and cause-specific mortality related to tobacco smoking among adultsaged >/=45 years in Asia: a pooled analysis of 21 cohorts. PLoS Med.2014;11:e1001631.
26. Thun M, Peto R, Boreham J, Lopez A. Stages of the cigarette epidemic onentering its second century. Tob Control. 2012;21:96–101.
27. Gartner C, Hall W. Smokeless tobacco use in Australia. Drug Alcohol Rev.2009;28:284–91.
28. Mealing N, Banks E, Jorm L, Steel D, Clements M, Rogers K. Investigation ofrelative risk estimates from studies of the same population with contrastingresponse rates and designs. BMC Res Methodology. 2010;10:26.
Submit your next manuscript to BioMed Centraland take full advantage of:
• Convenient online submission
• Thorough peer review
• No space constraints or color figure charges
• Immediate publication on acceptance
• Inclusion in PubMed, CAS, Scopus and Google Scholar
• Research which is freely available for redistribution
Submit your manuscript at www.biomedcentral.com/submit