Embed Size (px)
Citation preview
Toca-1 is suppressed by p53 to limit breastcancer cell invasion and tumor metastasisChander et al.
Chander et al. Breast Cancer Research (2014) 16:3413 DOI 10.1186/s13058-014-0503-x
Chander et al. Breast Cancer Research (2014) 16:3413 DOI 10.1186/s13058-014-0503-x
RESEARCH ARTICLE Open Access
Toca-1 is suppressed by p53 to limit breastcancer cell invasion and tumor metastasisHarish Chander1,2*, Colin D Brien1, Peter Truesdell1, Kathleen Watt1, Jalna Meens1, Colleen Schick1, Doris Germain3
and Andrew WB Craig1*
Abstract
Introduction: Transducer of Cdc42-dependent actin assembly-1 (Toca-1) recruits actin regulatory proteins toinvadopodia, and promotes breast tumor metastasis. Since metastatic breast tumors frequently harbor mutations inthe tumor suppressor p53, we tested whether p53 regulates Toca-1 expression.
Methods: Normal mammary epithelial cells (HBL-100, MCF10A) and breast cancer cell lines expressing wild-type(WT) p53 (DU4475, MTLn3) were treated with camptothecin or Nutlin-3 to stabilize p53 to test effects on Toca-1mRNA and protein levels. Chromatin immunoprecipitation (ChIP) assays were performed to identify p53 binding sitein Toca-1 gene. Stable silencing of p53 and Toca-1 were performed in MTLn3 cells to test effects on invadopodiaand cell invasion in vitro, and tumor metastasis in vivo.
Results: We observed that breast cancer cell lines with mutant p53 have high levels of Toca-1 compared to thosewith WT p53. Stabilization of WT p53 led to further reduction in Toca-1 mRNA and protein levels in normal breastepithelial cells and breast cancer cells. ChIP assays revealed p53 binding within intron 2 of toca1, and reduced histoneacetylation within its promoter region upon p53 upregulation or activation. Stable silencing of WT p53 in MTLn3 cellsled to increased extracellular matrix degradation and cell invasion compared to control cells. Interestingly, the combinedsilencing of p53 and Toca-1 led to a partial rescue of these effects of p53 silencing in vitro and reduced lungmetastases in mice. In human breast tumors, Toca-1 levels were high in subtypes with frequent p53 mutations, andhigh Toca-1 transcript levels correlated with increased risk of relapse.
Conclusions: Based on these findings, we conclude that loss of p53 tumor suppressor function in breast cancers leadsto upregulation of Toca-1, and results in enhanced risk of developing metastatic disease.
IntroductionMetastasis is a complex process in which tumor cells ac-quire the ability to spread to other tissues via lymphaticsor blood vessels. Invading cancer cells form filamentousactin (F-actin)-based membrane protrusions called inva-dopodia, whose extracellular matrix (ECM) degradingactivity allows them to invade through basement mem-branes and migrate toward blood vessels [1]. Silencing ofkey components of invadopodia such as N-WASP orcortactin, leads to impaired tumor vascularization and
* Correspondence: [email protected]; [email protected] of Biomedical and Molecular Sciences, Queen’s University,Division of Cancer Biology and Genetics, Queen’s Cancer Research Institute,10 Stuart Street, Kingston, Ontario K7L 3N6, Canada2Centre for Genetic Diseases and Molecular Medicine, Central University ofPunjab, Mansa Road, Bathinda 151001, IndiaFull list of author information is available at the end of the article
© 2015 Chander et al.; licensee BioMed CentraCommons Attribution License (http://creativecreproduction in any medium, provided the orDedication waiver (http://creativecommons.orunless otherwise stated.
reduced metastasis in breast cancer models [2,3]. Inva-dopodia formation is driven by epidermal growth factorreceptor (EGFR) and Src kinase activation that inducerecruitment of actin regulatory proteins (Cdc42/Toca-1/N-WASP, cortactin) required for F-actin branching[4,5]. Transducer of Cdc42-dependent actin assembly-1(Toca-1, also known as FNBP1L) was first identified as anessential adaptor protein to allow Cdc42 to release N-WASP from an autoinhibited state and recruit Arp2/3complex [6]. Toca-1 is a member of the Cdc42-interactingprotein-4 (CIP4) subfamily of Fer/CIP4 homology-Bin/Amphiphysin/RVS (F-BAR) proteins. The N-terminalF-BAR domain of Toca-1 forms a crescent-shaped dimerthat targets Toca-1 to areas of membrane curvature [7,8].The central PKN homology region-1 (HR1) domainbinds Cdc42GTP, and the C-terminal SH3 domain bindsseveral actin regulatory proteins, including N-WASP [6],
l. This is an Open Access article distributed under the terms of the Creativeommons.org/licenses/by/4.0), which permits unrestricted use, distribution, andiginal work is properly credited. The Creative Commons Public Domaing/publicdomain/zero/1.0/) applies to the data made available in this article,
Chander et al. Breast Cancer Research (2014) 16:3413 Page 2 of 15
dynamin [7], diaphanous-related formins [9], Abi1 [10],and cortactin [11].Several recent studies have identified functions of
Toca-1 in regulating filopodia formation and vesiculartrafficking in neuroblastoma cells [12], EGFR traffickingto lysosomes [13], and EGFR-driven cell motility and in-vasion [14]. We recently identified Toca-1 as a compo-nent of invadopodia in breast cancer cells, and thatsilencing of Toca-1 led to reduced incidence of metasta-sis to the lung in mammary orthotopic xenograft models[11]. In this study, we also reported that Toca-1 expres-sion levels are high in triple-negative breast cancer(TNBC) cell lines, which lack expression of estrogen re-ceptor (ER)/progesterone receptor (PR)/human epider-mal growth factor receptor 2 (HER2) receptors.TNBC frequently harbor mutations in the tumor sup-
pressor p53, resulting in both loss-of-function and gain-of-function effects on p53 pathways [15,16]. In additionto loss of an appropriate DNA damage response, thesecancers are also more invasive due to upregulation ofproteins involved in epithelial-mesenchymal transition(EMT) and cell invasion [17]. In smooth muscle cells, p53limits podosome formation and cell invasion via expressionof microRNAs (miRNAs) that silence key podosome in-ducers [18], and upregulation of caldesmon, a negativeregulator of actin polymerization [19]. Although similarpathways may control invadopodia in cancer cells, the roleof p53 in regulating invadopodia has not been reported.In this study, we show that Toca-1 upregulation in
TNBCs is due, at least in part, to loss of repression bywild-type (WT) p53. We further demonstrate that p53suppresses invadopodia, cell invasion and tumor metas-tasis in breast cancers with WT p53. Silencing of Toca-1can partially rescue the effects of p53 silencing in thesesystems, consistent with its role in promoting breast cancercell invasion and tumor metastasis. Profiling of Toca-1levels in human breast tumors revealed high Toca-1 levelsin HER2 and TNBC that frequently harbor p53 mutations,and high Toca-1 transcript levels were associated with in-creased risk of relapse in patients with TNBC.
MethodsCell lines and cell cultureAll of the cell lines used in this study were acquiredfrom American Type Culture Collection (ATCC, Rockville,MD, USA), and were grown in their recommended media.Briefly, Dulbecco’s modified Eagle’s medium (DMEM)supplemented with 10% fetal bovine serum (FBS) wasused for BT-20, MCF-7, SKBR3, MDA-MB 435, MDA-MB 468 and BT474 cells. RPMI 1640 supplementedwith 10% FBS was used for HBL-100, ZR75-1, T47D andHCC-1500 cells. RPMI 1640 supplemented with 10% FBS,1% 1 M HEPES, 1% sodium pyruvate, 1% D-glucose, 1%glutamine and 1% penicillin/streptomycin was used for
DU4475, HCC-1187 and HCC-38 cells. MCF10A cellswere grown in DMEM Nutrient Mixture F-12 HAM.HCC-2157 were grown in DMEM-F12 media plus supple-ments (10% FBS, 0.01 mg/mL transferrin, 0.02 mg/mL in-sulin, 25 nM sodium selenite, 50 nM hydrocortisone,1 ng/mL EGF, 0.01 mM ethanolamine, 0.01 mM phosphor-ylethanolamine, 0.5% (w/v) bovine serum albumin (BSA),0.5 mM sodium pyruvate, and 50 pM triiodothyronine).
TransfectionsAll plasmid transfections were done using Xtreme GeneHP DNA (Roche, Basel, Switzerland) in serum-freemedia followed by replacement with complete media.Small interfering RNA (siRNA) against human p53was from Santa Cruz Biotechnology (Dallas, TX, USA)(sc-29435). Hiperfect transfection reagent (Qiagen, Venlo,The Netherlands) was used to transfect siRNA.
Induction of p53MCF-10A and DU4475 cells were plated 24 hours beforetreatment with either Nutlin-3 (Sigma-Aldrich, St Louis,MO, USA) or camptothecin (CPT, Sigma-Aldrich, Oakville,ON, Canada) for 0 to 48 hours at doses indicated in figurelegends. Cells were then harvested, pelleted, lysed inNonidet-P40 (NP-40) lysis buffer (1% NP-40, 137 mMNaCl, 20 mM Tris HCl pH 8, 10% glycerol and 2 mMEDTA) and protein extract was collected. Immunoblotanalysis was then performed using Toca-1, p21, p53 andβ-actin antibodies.
RNA isolation and quantitative reversetranscription-polymerase chain reaction (qRT-PCR)Total RNA extraction was done using the RNeasy Plus MiniKit (Qiagen) according to the manufacturer’s instructions.cDNA synthesis was performed with random hexamerprimers and Superscript II reverse transcriptase (Invitrogen,Waltham, MA, USA). qRT-PCR was performed on cDNAusing human Toca-1 primers (for 5′ CAAACCAGGAAGTCCGTGGGCC 3′; Rev 5′ ATGTCACACATGGCACAAAGGTGC 3′) and GAPDH primers (for 5′ GCCTTCCGTGTCCCCACTGC 3′; Rev 5′ CAATGCCAGCCCCAGCGTCA3′) and SYBR Green JumpStart Taq ReadyMix kit (Sigma-Aldrich; 58°C annealing, 40 cycles, BioRad iCycler (BioRadLaboratories, Hercules, CA, USA). Transcript levels wereanalyzed using the 2-ΔΔCT method [20]. Toca-1 mRNA levelswere normalized to glyceraldehyde-3-phosphate dehydrogen-ase (GAPDH) mRNA levels.
Immunoblot analysis and antibodiesNon-commercial antibody mouse anti-Toca-1 was kindlyprovided by Giorgio Scita (IFOM, Italy) as previouslydescribed [13]. Commercial sources of antibodies in-cluded anti-p53 (DO-1; human-specific; sc-126), anti-p21(sc-56335), anti-β-Actin (sc-47778), and immunoglobulin
Chander et al. Breast Cancer Research (2014) 16:3413 Page 3 of 15
G (IgG) controls (sc-2762, sc-2763) were all from SantaCruz Biotechnology. For MTLn3 cell studies, mouseanti-rat p53 antibody was used (1C12; Cell SignalingTechnology, Beverly, MA. USA). Secondary antibodiesincluded horseradish peroxidase (HRP)-conjugated anti-mouse or anti-rabbit IgGs (GE Healthcare, Little Chalfont,UK). Immunoblot analyses were performed as describedpreviously [11].
Chromatin immunoprecipitation (ChIP) assaysHBL-100 and DU4475 cells were treated with or withoutCPT (10 μM) for 24 hours prior to harvesting. For assayswith ectopic WT p53 expression, HCC1806 cells weretransfected with WT p53 for 24 to 48 h prior to harvesting.ChIP assays were performed as described previously [21].Briefly, cells were crosslinked with 1% formaldehyde(Sigma-Aldrich) followed by lysis of cells in RIPA buffer(50 mM Tris pH 8.0, 5 mM EDTA, 150 mM NaCl, 1% NP-40, 0.5% DOC, 0.1% SDS) and sonication (10 sec on/offcycle, 20 pulses performed four times; Thermo FisherScientific (Waltham, MA, USA, Sonic DismembratorModel 500). DNA-protein complexes were immunoprecipi-tated using antibody (DO-1) against p53, acetylated histoneH3 (H3K14ac) antibody (#06-599, EMD Millipore, Billerica,MA, USA), or a control IgG (Santa Cruz Biotechnology).After reversal of crosslinks and purification (Qia-quick PCRPurification Kit, Qiagen), DNA was subjected to PCR usingthe primers from the predicted binding sites of p53 withinintron 2 of toca1 (SA Biosciences, Frederick, MD, USA(GPH1006475 (-) (01A)), or p21 promoter primers. Theacetyl-histone H3 (H3K14Ac) precipitates were subjectedto qPCR using primers from proximal promoter region ofToca-1. PCR reactions were performed using 5 μL of theDNA from the immunoprecipitations or the 2 μL of DNAfrom the input as template. PCR cycling conditions were asfollows: 94°C for 3 min; then 35 cycles of 94°C for 45 s,58°C for 45 s, and 72°C for 45 s; followed by 10 min at72°C as final extension.
Stable silencing of p53 and Toca-1For silencing of rat p53 in MTLn3 cells, an LMP retroviralvector expressing a p53 short hairpin RNA (shRNA) waspreviously described [19]. The system for lentiviral deliv-ery of Toca-1 shRNA was also described previously [11].Briefly, MTLn3 cells were incubated with retroviral or len-tiviral particles individually or combined prior to selectionwith puromycin (2 μg/ml) and cell pools were passagedseveral times prior to testing for p53 and Toca-1 silencing.To test for effects of p53 and Toca-1 silencing on cell via-bility, cells (5,000) were seeded in 96-well plates in tripli-cate for 18 hours, and analyzed following addition ofAlamarBlue™ for 5 hours using a plate-reading spectro-photometer to measure absorbance at 570 nm. Cellgrowth assays were conducted by plating 50,000 cells
from each group in 60 mm plates on day 0, followedby total viable (trypan blue-negative) cell counts on days 2and 3 using a hemocytometer.
Extracellular matrix degradation assaysMTLn3 control, sh-p53 and sh-p53/sh-Toca-1 cells wereseeded on gelatin-coated glass coverslips (15,000 cells)containing a layer of thin gelatin, prepared as describedpreviously [4]. After incubation for 16 h, cells were fixed,permeabilized and stained with Alexa Fluor-488 Phal-loidin (Life Technologies Inc., Burlington, ON, Canada).Epifluorescence microscopy was performed and theareas of ECM digestion beneath the cells that werestained with Phalloidin were quantified as digestion areaper cell using Image Pro Plus software (Media Cyber-netics, Bethesda, MD, USA). At least 100 cells werequantified for each condition and cell line.
Transwell invasion assaysInvasion assays were performed as described previously[11]. Briefly, transwell inserts (8 μm pore) were coatedwith 100 μl of ice-cold Matrigel (1:5 dilution in DMEMwith 0.5% FBS) for invasion, or coated with 0.1% (w/v)gelatin for migration assays, and incubated at 37°C for30 min. A total of 50,000 cells were added in the upperchamber, which was placed in a 24-well plate containingserum as a chemoattractant. After overnight incubation,the filters were fixed in 4% paraformaldehyde, cells andMatrigel on the top of the filter were removed and thecells attached to the underside of the filter were stainedwith DAPI. Epifluorescence microscopy was performedto detect nuclei of cells that migrated to the undersideof the filters. Scoring of invading cells from four separatefields was performed for triplicate filters using the ImagePro Plus software (Media Cybernetics).
Mammary orthotopic tumor xenograft assaysAll tumor xenograft assays were performed usingRag2−/−:IL-2Rγc−/− mice (BALB/c background) as previ-ously described [11,22]. Animals were housed in a specificpathogen-free facility (Queen’s University Animal CareServices), with ventilated cages and sterilized food andwater supply. All procedures with mice were approved bythe Queen’s University Animal Care Committee. MTLn3control, sh-p53 and sh-p53/sh-Toca-1 cells were grown to70 to 85% confluence before trypsinization and counting.For xenograft assays, 0.5 × 10⁶ cells were injected into theright thoracic mammary fat pads in a volume of 50 μl of50% Matrigel using a hypodermic syringe. At end pointsof 4 weeks mice were sacrificed and primary tumor massrecorded. Several tissues were removed for detection ofmetastases, which were primarily observed in the lungs.The primary tumors and lungs from each mouse were usedfor histological analysis. Samples were fixed in formalin
Chander et al. Breast Cancer Research (2014) 16:3413 Page 4 of 15
and embedded in paraffin, and 5 μm sections were stainedwith hematoxylin and eosin (H&E). H&E-stained sectionswere scanned using the Aperio CS digital slide scanner(Queen’s Laboratory for Molecular Pathology) and ana-lyzed with ImageScope software (Aperio Technologies,Vista, CA, USA). The number of metastases and overalllung area were measured in a blinded fashion.
Immunohistochemistry (IHC)Human breast cancer tissue microarrays (T086b, BR10010a,BR963 and BR953, US Biomax, Inc., Rockville, MD, USA)were stained using the Discovery XT Staining System(Ventana Medical Systems, Inc. Tucson, AZ, USA).Antigens were retrieved with an EDTA pH 8.0 solutionand incubated with rabbit anti-p53 (DO-1) and Toca-1antibody as used previously [11,23]. Staining was visualizedwith DAB treatment and a hematoxylin counterstain. Mi-croarrays were scanned using the Aperio CS digital slidescanner (Queen’s Laboratory for Molecular Pathology) andanalyzed with ImageScope software (Aperio). Tumor-specific H-scores were calculated based on positivepixel intensity according to the formula: (% weak positiveX 1) + (% positive X 2) + (% strong positive X 3). The p53IHC scoring was grouped according to the extreme posi-tive (EP), extreme negative (EN), and non-extreme (NE)categories that were recently shown to best relate to p53mutation status and outcomes [24]. Toca-1 H-scores werereported according to p53 EP/EN or NE groups, and ana-lyzed by Student’s t test.
ResultsToca-1 levels correlate with p53 status in breast cancercell linesWe previously showed that Toca-1 levels were high inTNBC cell lines and a subset of invasive ductal carcin-omas [11]. Since TNBCs have a high frequency of p53mutations [15], we tested Toca-1 levels relative to p53status in a panel of cell lines. This included two immor-talized breast epithelial, normal-like cell lines (HBL-100and MCF-10A), and a panel of human breast cancerswith either WT p53 (BT-20, ZR75-1, MCF-7, DU4475),or mutant p53 (BT-474, T47D, SK-BR3, MDA-MB-435, HCC2157, MDA-MB-468, HCC-1500, HCC-1187,HCC-38). Lysates were subjected to immunoblot (IB)with Toca-1 and p53 antibodies. This analysis revealedhigh levels of Toca-1 in the vast majority of mutant p53cell lines compared to WT p53 (Figure 1A). Similar re-sults were observed for p53, with high levels of mutantp53 accumulating in these cells compared to WT p53(Figure 1A; actin served as a loading control). In the caseof HBL-100 cells, the high levels of WT p53 are likelydue to presence of SV40 viral antigens [25] that causep53 stabilization [26]. Using densitometry, the averagelevels of Toca-1 relative to β-actin was significantly
higher in mutant p53 cell lines compared to WT p53cell lines (Figure 1B). To test whether a similar correl-ation between p53 status and Toca-1 expression existsat the level of gene expression, we profiled Toca-1mRNA levels across the same panel of cell lines by qRT-PCR. Toca-1 transcript levels were normalized to humanGAPDH, and were found to be considerably higherin mutant p53 compared to WT p53 cancer cell lines(Figure S1 in Additional file 1). It is worth noting thatthe lowest levels of Toca-1 transcripts were observed innormal-like breast epithelial cell lines (Figure S1 inAdditional file 1). Together, these results suggest thatp53 status may dictate the levels of Toca-1 in normal cellsand cancer cell lines.Since mutant p53 confers both loss of WT p53 func-
tion, and gain-of-function effects on a large number oftarget genes [23,27,28], we asked whether Toca-1 ex-pression was induced or dependent on mutant p53 ex-pression. To test this, endogenous Toca-1 levels wereanalyzed upon ectopic expression of two frequently ob-served p53 mutants (p53-Ala143 and p53-Trp248) inp53-null HCC1806 cells. Surprisingly, the overexpressionof either p53 mutant had no effect on Toca-1 levels(Figure 1C). To reinforce these results, siRNA-mediatedknockdown (KD) of mutant p53 expression in HCC38(TNBC) and SKBR3 (HER2) was performed. Althoughthe levels of mutant p53 were greatly reduced in both celllines, the levels of Toca-1 were unchanged (Figure 1D).These results suggest that overexpression of mutant p53and gain-of-function effects are unlikely to explain the up-regulation of Toca-1 in these breast cancer cell lines.
WT p53 suppresses Toca-1 expressionWe next tested whether Toca-1 expression could berepressed by physiological induction of endogenousp53 using camptothecin (CPT), a DNA-damaging agentthat causes rapid stabilization of p53 [29]. Normal-likeMCF10A cells were treated with increasing doses ofCPT for 24 h (2 to 20 μM; DMSO served as vehicle con-trol) prior to IB analysis of Toca-1, p53 and p21WAF1,which served as a positive control for p53 activation. Asexpected, CPT treatment led to increased p53 and p21protein levels, and this coincided with reduced levels ofToca-1 at both the protein and mRNA levels (Figure S2in Additional file 2). In DU4475 cells expressing lowlevels of WT p53, CPT treatment (1 to 8 μM) also led toa significant reduction in Toca-1 protein and mRNAlevels along with the expected stabilization of p53 andupregulation of p21 (Figure 2A,B). We next analyzed thekinetics of p53 effects on Toca-1 expression by treatingDU4475 cells with CPT (4 μM) for 0 to 24 h. We ob-served maximal levels of p53 and p21 proteins within12 hours of CPT treatment, and a corresponding de-crease in Toca-1 protein and mRNA levels at 18 and
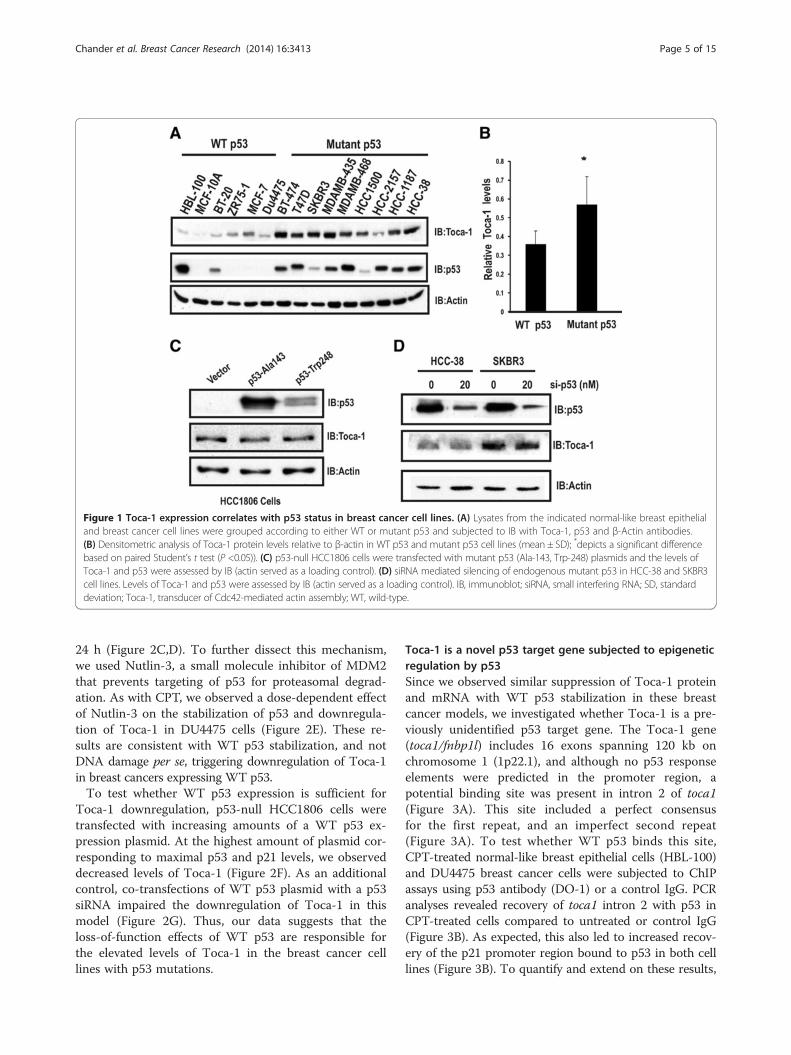
Figure 1 Toca-1 expression correlates with p53 status in breast cancer cell lines. (A) Lysates from the indicated normal-like breast epithelialand breast cancer cell lines were grouped according to either WT or mutant p53 and subjected to IB with Toca-1, p53 and β-Actin antibodies.(B) Densitometric analysis of Toca-1 protein levels relative to β-actin in WT p53 and mutant p53 cell lines (mean ± SD); *depicts a significant differencebased on paired Student’s t test (P <0.05)). (C) p53-null HCC1806 cells were transfected with mutant p53 (Ala-143, Trp-248) plasmids and the levels ofToca-1 and p53 were assessed by IB (actin served as a loading control). (D) siRNA mediated silencing of endogenous mutant p53 in HCC-38 and SKBR3cell lines. Levels of Toca-1 and p53 were assessed by IB (actin served as a loading control). IB, immunoblot; siRNA, small interfering RNA; SD, standarddeviation; Toca-1, transducer of Cdc42-mediated actin assembly; WT, wild-type.
Chander et al. Breast Cancer Research (2014) 16:3413 Page 5 of 15
24 h (Figure 2C,D). To further dissect this mechanism,we used Nutlin-3, a small molecule inhibitor of MDM2that prevents targeting of p53 for proteasomal degrad-ation. As with CPT, we observed a dose-dependent effectof Nutlin-3 on the stabilization of p53 and downregula-tion of Toca-1 in DU4475 cells (Figure 2E). These re-sults are consistent with WT p53 stabilization, and notDNA damage per se, triggering downregulation of Toca-1in breast cancers expressing WT p53.To test whether WT p53 expression is sufficient for
Toca-1 downregulation, p53-null HCC1806 cells weretransfected with increasing amounts of a WT p53 ex-pression plasmid. At the highest amount of plasmid cor-responding to maximal p53 and p21 levels, we observeddecreased levels of Toca-1 (Figure 2F). As an additionalcontrol, co-transfections of WT p53 plasmid with a p53siRNA impaired the downregulation of Toca-1 in thismodel (Figure 2G). Thus, our data suggests that theloss-of-function effects of WT p53 are responsible forthe elevated levels of Toca-1 in the breast cancer celllines with p53 mutations.
Toca-1 is a novel p53 target gene subjected to epigeneticregulation by p53Since we observed similar suppression of Toca-1 proteinand mRNA with WT p53 stabilization in these breastcancer models, we investigated whether Toca-1 is a pre-viously unidentified p53 target gene. The Toca-1 gene(toca1/fnbp1l) includes 16 exons spanning 120 kb onchromosome 1 (1p22.1), and although no p53 responseelements were predicted in the promoter region, apotential binding site was present in intron 2 of toca1(Figure 3A). This site included a perfect consensusfor the first repeat, and an imperfect second repeat(Figure 3A). To test whether WT p53 binds this site,CPT-treated normal-like breast epithelial cells (HBL-100)and DU4475 breast cancer cells were subjected to ChIPassays using p53 antibody (DO-1) or a control IgG. PCRanalyses revealed recovery of toca1 intron 2 with p53 inCPT-treated cells compared to untreated or control IgG(Figure 3B). As expected, this also led to increased recov-ery of the p21 promoter region bound to p53 in both celllines (Figure 3B). To quantify and extend on these results,
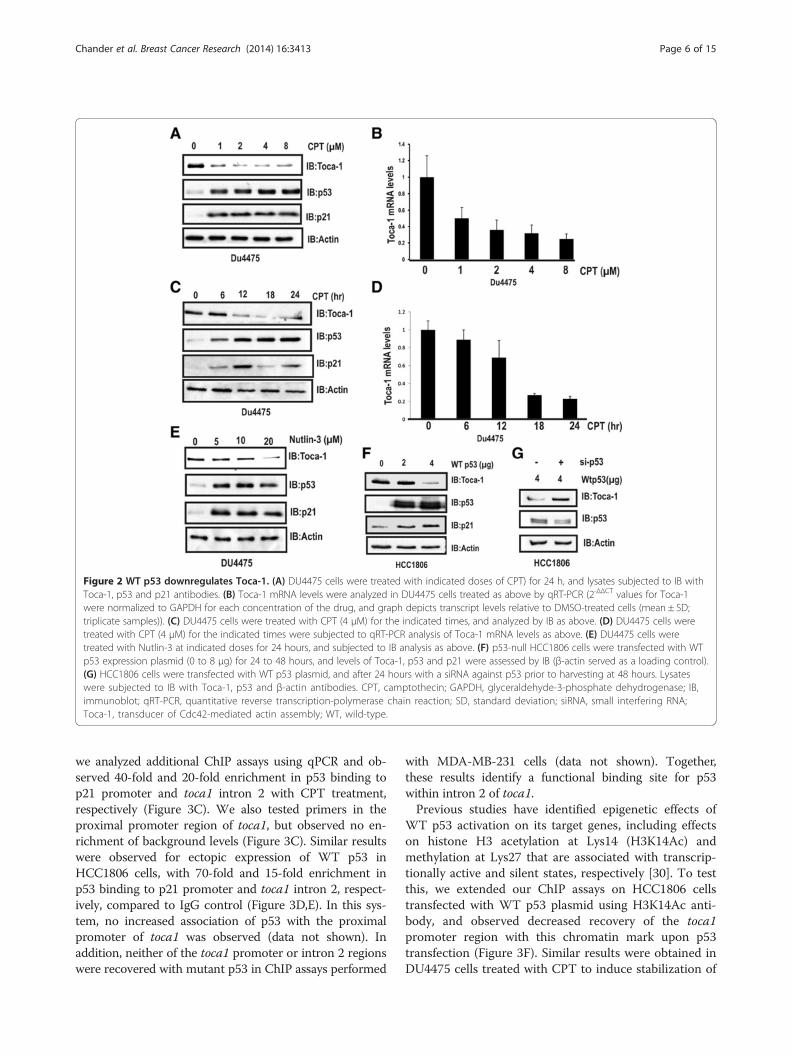
Figure 2 WT p53 downregulates Toca-1. (A) DU4475 cells were treated with indicated doses of CPT) for 24 h, and lysates subjected to IB withToca-1, p53 and p21 antibodies. (B) Toca-1 mRNA levels were analyzed in DU4475 cells treated as above by qRT-PCR (2-ΔΔCT values for Toca-1were normalized to GAPDH for each concentration of the drug, and graph depicts transcript levels relative to DMSO-treated cells (mean ± SD;triplicate samples)). (C) DU4475 cells were treated with CPT (4 μM) for the indicated times, and analyzed by IB as above. (D) DU4475 cells weretreated with CPT (4 μM) for the indicated times were subjected to qRT-PCR analysis of Toca-1 mRNA levels as above. (E) DU4475 cells weretreated with Nutlin-3 at indicated doses for 24 hours, and subjected to IB analysis as above. (F) p53-null HCC1806 cells were transfected with WTp53 expression plasmid (0 to 8 μg) for 24 to 48 hours, and levels of Toca-1, p53 and p21 were assessed by IB (β-actin served as a loading control).(G) HCC1806 cells were transfected with WT p53 plasmid, and after 24 hours with a siRNA against p53 prior to harvesting at 48 hours. Lysateswere subjected to IB with Toca-1, p53 and β-actin antibodies. CPT, camptothecin; GAPDH, glyceraldehyde-3-phosphate dehydrogenase; IB,immunoblot; qRT-PCR, quantitative reverse transcription-polymerase chain reaction; SD, standard deviation; siRNA, small interfering RNA;Toca-1, transducer of Cdc42-mediated actin assembly; WT, wild-type.
Chander et al. Breast Cancer Research (2014) 16:3413 Page 6 of 15
we analyzed additional ChIP assays using qPCR and ob-served 40-fold and 20-fold enrichment in p53 binding top21 promoter and toca1 intron 2 with CPT treatment,respectively (Figure 3C). We also tested primers in theproximal promoter region of toca1, but observed no en-richment of background levels (Figure 3C). Similar resultswere observed for ectopic expression of WT p53 inHCC1806 cells, with 70-fold and 15-fold enrichment inp53 binding to p21 promoter and toca1 intron 2, respect-ively, compared to IgG control (Figure 3D,E). In this sys-tem, no increased association of p53 with the proximalpromoter of toca1 was observed (data not shown). Inaddition, neither of the toca1 promoter or intron 2 regionswere recovered with mutant p53 in ChIP assays performed
with MDA-MB-231 cells (data not shown). Together,these results identify a functional binding site for p53within intron 2 of toca1.Previous studies have identified epigenetic effects of
WT p53 activation on its target genes, including effectson histone H3 acetylation at Lys14 (H3K14Ac) andmethylation at Lys27 that are associated with transcrip-tionally active and silent states, respectively [30]. To testthis, we extended our ChIP assays on HCC1806 cellstransfected with WT p53 plasmid using H3K14Ac anti-body, and observed decreased recovery of the toca1promoter region with this chromatin mark upon p53transfection (Figure 3F). Similar results were obtained inDU4475 cells treated with CPT to induce stabilization of
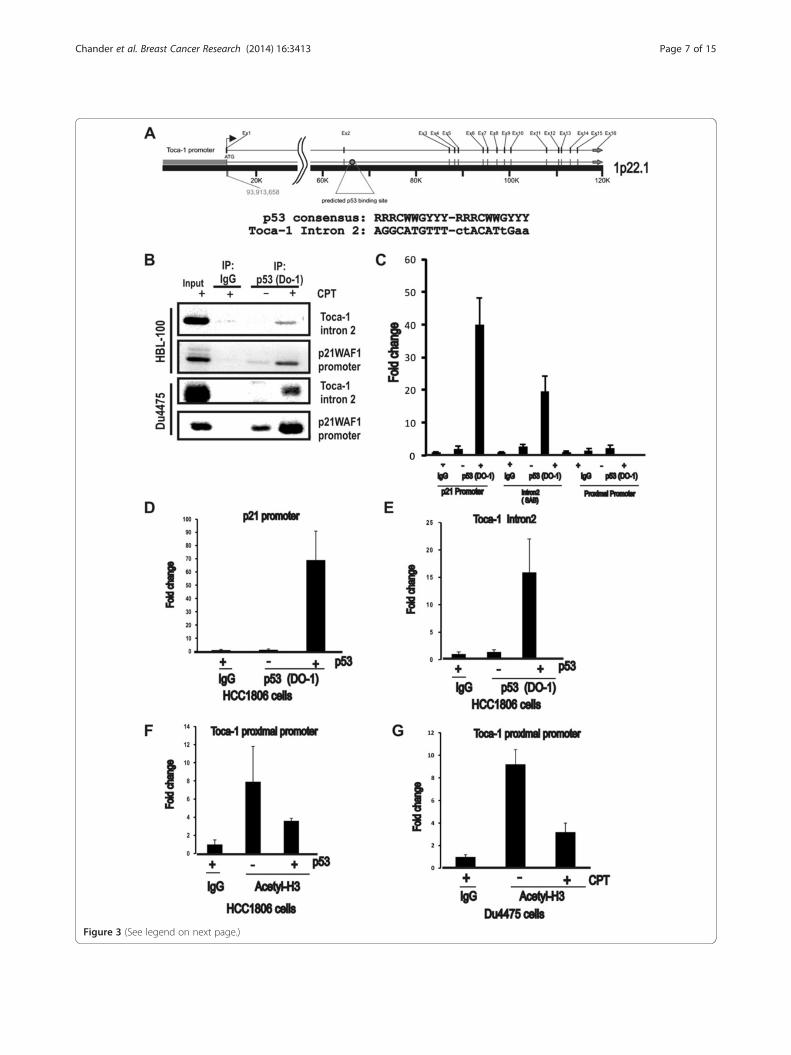
Figure 3 (See legend on next page.)
Chander et al. Breast Cancer Research (2014) 16:3413 Page 7 of 15
(See figure on previous page.)Figure 3 p53 binding and altered chromatin marks at the toca1 gene. (A) toca1 gene organization and a predicted p53 binding site withinintron 2 is shown. Below, the consensus sequence for p53 binding is shown (R = A/G, W = A/T, and Y = C/T) relative to the predicted site, withlowercase letters denoting deviations from the consensus. (B) HBL-100 and DU4475 cells were treated with or without CPT (8 μM) to stabilizeendogenous WT p53, and ChIP assays performed using control IgG or p53 antibody. Input material and ChIP assays were analyzed by PCR forintron 2 of toca1 and p21 promoter region as a positive control. Inverted images of representative ethidium bromide gels are shown. (C) DU4475cells treated as above were subjected to ChIP assays and analyzed by qPCR. Graph depicts the fold change in p53 binding to the p21 promoter(positive control), or toca1 intron 2, or toca1 proximal promoter (mean ± SD; triplicate samples). (D and E) HCC1806 cells were transfected with orwithout WT p53 plasmid and ChIP assays performed with control IgG or p53 (DO-1) antibodies. qPCR analyses for the p53 binding site within p21promoter region (D) and intron 2 of toca1 (E) are shown (2-ΔΔCT values for p53 antibody were normalized to IgG; graph depicts the fold changein recovery with p53; mean ± SD; triplicate samples). (F and G) ChIP assays for acetylated histone H3 (H3K14Ac) were analyzed by qPCR for theproximal promoter region of Toca-1 in HCC1806 cells transfected with WT p53 (F) and CPT-treated DU4475 cells (G; 2-ΔΔCT values for p53 antibodywere normalized to IgG; graph depicts the fold change in recovery with acetylated histone H3; mean ± SD; triplicate samples). ChIP, chromatinimmunoprecipitation; CPT, camptothecin; IgG, immunoglobulin G; qPCR, quantitative polymerase chain reaction; SD, standard deviation; Toca-1,transducer of Cdc42-mediated actin assembly; WT, wild-type.
Chander et al. Breast Cancer Research (2014) 16:3413 Page 8 of 15
endogenous p53, and this resulted in reduced recoveryof the toca1 promoter region with the H3K14Ac mark(Figure 3G). These results are consistent with active tran-scription of toca1 under conditions of p53 degradation viaMDM2 (murine double minute-2), and the loss of thisopen chromatin mark upon p53 activation and bindingwithin intron 2 of the toca1 gene. This may be due toincreased recruitment of histone deacetylase complexes(HDACs) that are known to associate with activated p53and cause repression of some target genes [31-34].
p53 suppresses invadopodia formation and invasion ofMTLn3 cells in a Toca-1-dependent mannerTo further relate the p53/Toca-1 axis in the context ofbreast cancer progression and metastasis, we used ratmammary adenocarcinoma MTLn3 cells that expressWT p53 and have been used extensively to model breastcancer metastasis [3,35,36]. Further, we recently usedthis cell model in our study that identified Toca-1 inpromoting breast cancer cell invasion and tumor metas-tasis [11]. First, we confirmed that WT p53 also downre-gulates rat Toca-1 levels in MTLn3 cells upon treatmentwith CPT. We observed maximal p53 stabilization at24 hours, and reduced levels of Toca-1 (Figure 4A). To-gether with our results in human breast cell lines, thisprovides further support for a WT p53 pathway thatsuppresses Toca-1 expression. To test whether p53 regu-lates the invasive potential of MTLn3 cells, we usedretroviral or lentiviral delivery of shRNAs against p53and Toca-1, respectively, to achieve stable silencing ofp53 and Toca-1. We observed efficient depletion of p53in sh-p53 cells, and this correlated with increased levelsof Toca-1 compared to sh-control or parental MTLn3cells (Figure 4B). These results are consistent with ourfindings linking WT p53 to Toca-1 levels in human breastcancer cells. In sh-p53/sh-Toca-1 cells, we observed acomplete depletion of both Toca-1 and p53 (Figure 4B).Since p53 was recently shown to repress podosome
formation and invasiveness of smooth muscle cells and
fibroblasts [18,19], we tested the effects of p53 silencingon invadopodia formation in MTLn3 cells. MTLn3 con-trol and sh-p53 cells were plated on coverslips coatedwith fluorescent ECM (thin gelatin) for 16 hours priorto staining of F-actin. Epifluorescence micrographs wereobtained to visualize ECM degradation spots relative toF-actin dots that mark invadopodia. As expected, controlMTLn3 cells degraded ECM, but the amount of degrad-ation spots and F-actin dots was enhanced with p53 silen-cing (Figure 4C). Quantification of these results revealed a2.5-fold increase in ECM digestion area per cell with p53silencing compared to control MTLn3 cells (Figure 4D). Aparallel analysis of p53/Toca-1 double KD cells revealed apartial rescue of the effects of p53 silencing (Figure 4C,D).These results are consistent with Toca-1 acting as a posi-tive regulator of invadopodia [11], and provide evidencethat p53 mutation status likely contributes to the ability ofcancer cells to form invadopodia through altered expres-sion of invadopodia regulatory proteins.To test whether p53 also regulates the ability of
MTLn3 cells to invade through ECM, MTLn3 control,sh-p53 and sh-p53/sh-Toca-1 cells were plated in trans-well chambers overlayed with Matrigel, and invasion to-ward the lower chamber was measured after 24 hours.We found that silencing of p53 significantly increased thenumber of invading cells compared to control MTLn3cells (Figure 4E). However, dual silencing of Toca-1 andp53 led to a significant reduction in cell invasion com-pared to sh-p53 cells, which returned to near baselinelevels in control MTLn3 cells (Figure 4E). Taken together,these results provide novel evidence for p53 suppressionof invadopodia in cancer cells, and identify Toca-1 as akey participant in ECM degradation and cell invasionupon loss of p53.
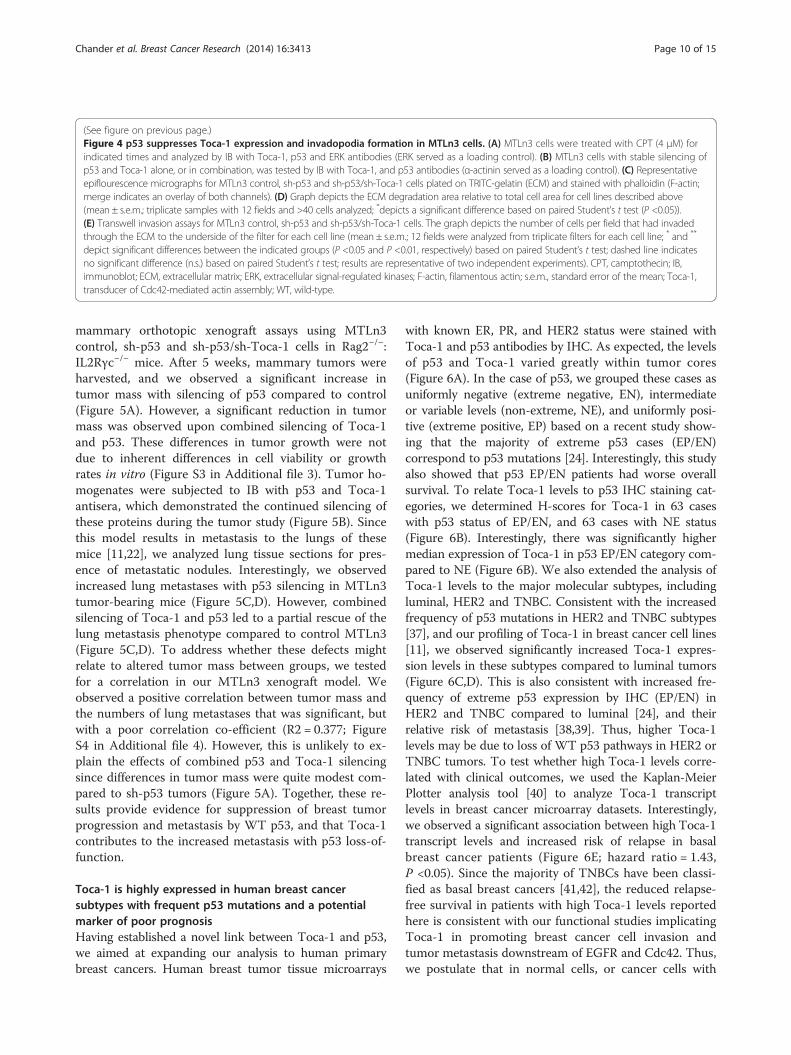
Silencing p53 enhances MTLn3 tumor growth andmetastasis and is partially dependent on Toca-1To investigate contributions of the p53/Toca-1 axis tobreast cancer progression and mestastasis, we performed
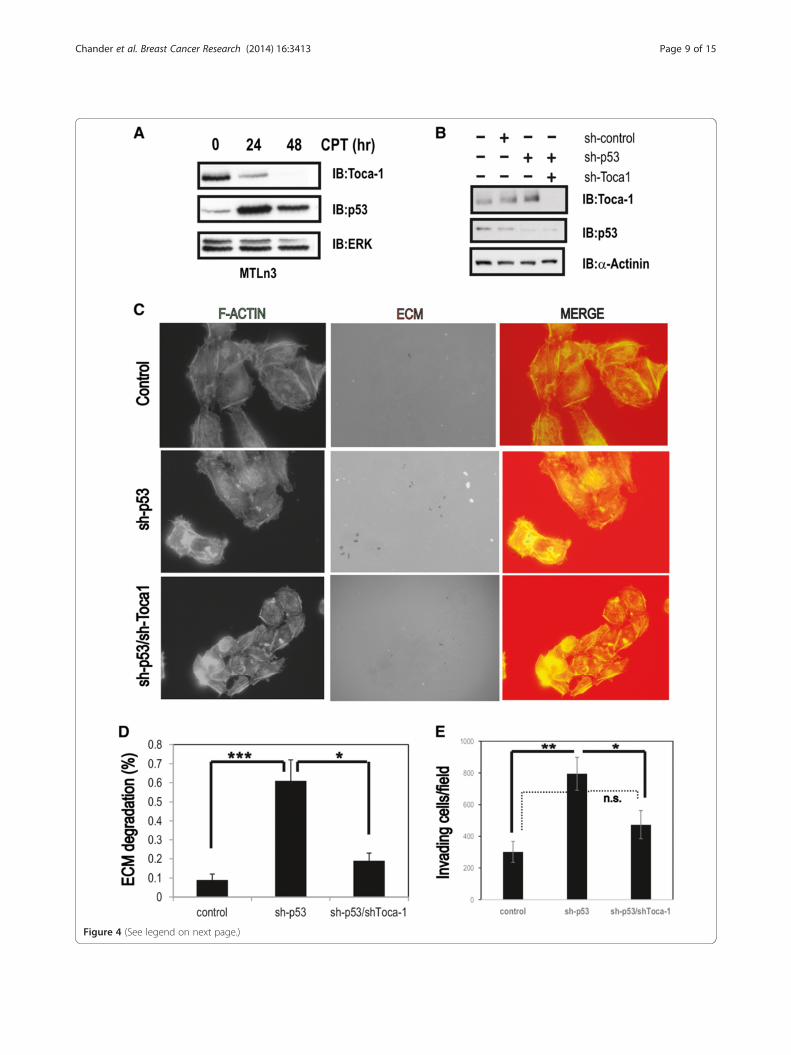
Figure 4 (See legend on next page.)
Chander et al. Breast Cancer Research (2014) 16:3413 Page 9 of 15
(See figure on previous page.)Figure 4 p53 suppresses Toca-1 expression and invadopodia formation in MTLn3 cells. (A) MTLn3 cells were treated with CPT (4 μM) forindicated times and analyzed by IB with Toca-1, p53 and ERK antibodies (ERK served as a loading control). (B) MTLn3 cells with stable silencing ofp53 and Toca-1 alone, or in combination, was tested by IB with Toca-1, and p53 antibodies (α-actinin served as a loading control). (C) Representativeepiflourescence micrographs for MTLn3 control, sh-p53 and sh-p53/sh-Toca-1 cells plated on TRITC-gelatin (ECM) and stained with phalloidin (F-actin;merge indicates an overlay of both channels). (D) Graph depicts the ECM degradation area relative to total cell area for cell lines described above(mean ± s.e.m.; triplicate samples with 12 fields and >40 cells analyzed; *depicts a significant difference based on paired Student’s t test (P <0.05)).(E) Transwell invasion assays for MTLn3 control, sh-p53 and sh-p53/sh-Toca-1 cells. The graph depicts the number of cells per field that had invadedthrough the ECM to the underside of the filter for each cell line (mean ± s.e.m.; 12 fields were analyzed from triplicate filters for each cell line; * and **
depict significant differences between the indicated groups (P <0.05 and P <0.01, respectively) based on paired Student’s t test; dashed line indicatesno significant difference (n.s.) based on paired Student’s t test; results are representative of two independent experiments). CPT, camptothecin; IB,immunoblot; ECM, extracellular matrix; ERK, extracellular signal-regulated kinases; F-actin, filamentous actin; s.e.m., standard error of the mean; Toca-1,transducer of Cdc42-mediated actin assembly; WT, wild-type.
Chander et al. Breast Cancer Research (2014) 16:3413 Page 10 of 15
mammary orthotopic xenograft assays using MTLn3control, sh-p53 and sh-p53/sh-Toca-1 cells in Rag2−/−:IL2Rγc−/− mice. After 5 weeks, mammary tumors wereharvested, and we observed a significant increase intumor mass with silencing of p53 compared to control(Figure 5A). However, a significant reduction in tumormass was observed upon combined silencing of Toca-1and p53. These differences in tumor growth were notdue to inherent differences in cell viability or growthrates in vitro (Figure S3 in Additional file 3). Tumor ho-mogenates were subjected to IB with p53 and Toca-1antisera, which demonstrated the continued silencing ofthese proteins during the tumor study (Figure 5B). Sincethis model results in metastasis to the lungs of thesemice [11,22], we analyzed lung tissue sections for pres-ence of metastatic nodules. Interestingly, we observedincreased lung metastases with p53 silencing in MTLn3tumor-bearing mice (Figure 5C,D). However, combinedsilencing of Toca-1 and p53 led to a partial rescue of thelung metastasis phenotype compared to control MTLn3(Figure 5C,D). To address whether these defects mightrelate to altered tumor mass between groups, we testedfor a correlation in our MTLn3 xenograft model. Weobserved a positive correlation between tumor mass andthe numbers of lung metastases that was significant, butwith a poor correlation co-efficient (R2 = 0.377; FigureS4 in Additional file 4). However, this is unlikely to ex-plain the effects of combined p53 and Toca-1 silencingsince differences in tumor mass were quite modest com-pared to sh-p53 tumors (Figure 5A). Together, these re-sults provide evidence for suppression of breast tumorprogression and metastasis by WT p53, and that Toca-1contributes to the increased metastasis with p53 loss-of-function.
Toca-1 is highly expressed in human breast cancersubtypes with frequent p53 mutations and a potentialmarker of poor prognosisHaving established a novel link between Toca-1 and p53,we aimed at expanding our analysis to human primarybreast cancers. Human breast tumor tissue microarrays
with known ER, PR, and HER2 status were stained withToca-1 and p53 antibodies by IHC. As expected, the levelsof p53 and Toca-1 varied greatly within tumor cores(Figure 6A). In the case of p53, we grouped these cases asuniformly negative (extreme negative, EN), intermediateor variable levels (non-extreme, NE), and uniformly posi-tive (extreme positive, EP) based on a recent study show-ing that the majority of extreme p53 cases (EP/EN)correspond to p53 mutations [24]. Interestingly, this studyalso showed that p53 EP/EN patients had worse overallsurvival. To relate Toca-1 levels to p53 IHC staining cat-egories, we determined H-scores for Toca-1 in 63 caseswith p53 status of EP/EN, and 63 cases with NE status(Figure 6B). Interestingly, there was significantly highermedian expression of Toca-1 in p53 EP/EN category com-pared to NE (Figure 6B). We also extended the analysis ofToca-1 levels to the major molecular subtypes, includingluminal, HER2 and TNBC. Consistent with the increasedfrequency of p53 mutations in HER2 and TNBC subtypes[37], and our profiling of Toca-1 in breast cancer cell lines[11], we observed significantly increased Toca-1 expres-sion levels in these subtypes compared to luminal tumors(Figure 6C,D). This is also consistent with increased fre-quency of extreme p53 expression by IHC (EP/EN) inHER2 and TNBC compared to luminal [24], and theirrelative risk of metastasis [38,39]. Thus, higher Toca-1levels may be due to loss of WT p53 pathways in HER2 orTNBC tumors. To test whether high Toca-1 levels corre-lated with clinical outcomes, we used the Kaplan-MeierPlotter analysis tool [40] to analyze Toca-1 transcriptlevels in breast cancer microarray datasets. Interestingly,we observed a significant association between high Toca-1transcript levels and increased risk of relapse in basalbreast cancer patients (Figure 6E; hazard ratio = 1.43,P <0.05). Since the majority of TNBCs have been classi-fied as basal breast cancers [41,42], the reduced relapse-free survival in patients with high Toca-1 levels reportedhere is consistent with our functional studies implicatingToca-1 in promoting breast cancer cell invasion andtumor metastasis downstream of EGFR and Cdc42. Thus,we postulate that in normal cells, or cancer cells with
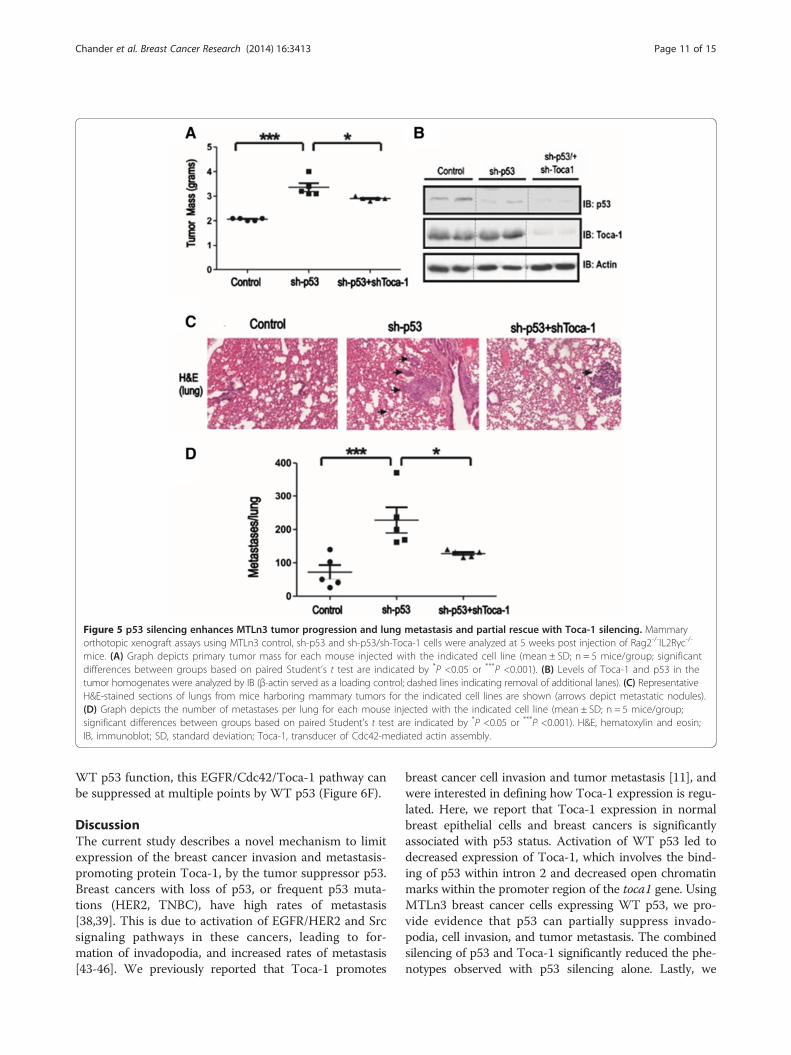
Figure 5 p53 silencing enhances MTLn3 tumor progression and lung metastasis and partial rescue with Toca-1 silencing. Mammaryorthotopic xenograft assays using MTLn3 control, sh-p53 and sh-p53/sh-Toca-1 cells were analyzed at 5 weeks post injection of Rag2-/-IL2Rγc-/-
mice. (A) Graph depicts primary tumor mass for each mouse injected with the indicated cell line (mean ± SD; n = 5 mice/group; significantdifferences between groups based on paired Student’s t test are indicated by *P <0.05 or ***P <0.001). (B) Levels of Toca-1 and p53 in thetumor homogenates were analyzed by IB (β-actin served as a loading control; dashed lines indicating removal of additional lanes). (C) RepresentativeH&E-stained sections of lungs from mice harboring mammary tumors for the indicated cell lines are shown (arrows depict metastatic nodules).(D) Graph depicts the number of metastases per lung for each mouse injected with the indicated cell line (mean ± SD; n = 5 mice/group;significant differences between groups based on paired Student’s t test are indicated by *P <0.05 or ***P <0.001). H&E, hematoxylin and eosin;IB, immunoblot; SD, standard deviation; Toca-1, transducer of Cdc42-mediated actin assembly.
Chander et al. Breast Cancer Research (2014) 16:3413 Page 11 of 15
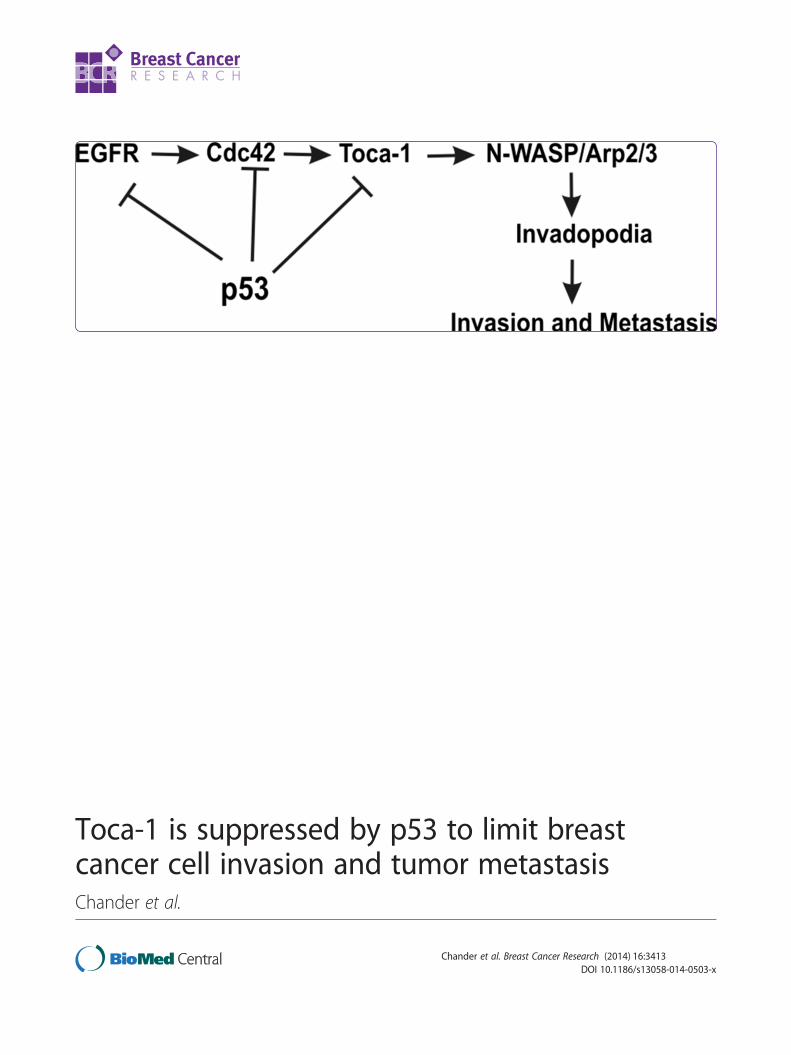
WT p53 function, this EGFR/Cdc42/Toca-1 pathway canbe suppressed at multiple points by WT p53 (Figure 6F).
DiscussionThe current study describes a novel mechanism to limitexpression of the breast cancer invasion and metastasis-promoting protein Toca-1, by the tumor suppressor p53.Breast cancers with loss of p53, or frequent p53 muta-tions (HER2, TNBC), have high rates of metastasis[38,39]. This is due to activation of EGFR/HER2 and Srcsignaling pathways in these cancers, leading to for-mation of invadopodia, and increased rates of metastasis[43-46]. We previously reported that Toca-1 promotes
breast cancer cell invasion and tumor metastasis [11], andwere interested in defining how Toca-1 expression is regu-lated. Here, we report that Toca-1 expression in normalbreast epithelial cells and breast cancers is significantlyassociated with p53 status. Activation of WT p53 led todecreased expression of Toca-1, which involves the bind-ing of p53 within intron 2 and decreased open chromatinmarks within the promoter region of the toca1 gene. UsingMTLn3 breast cancer cells expressing WT p53, we pro-vide evidence that p53 can partially suppress invado-podia, cell invasion, and tumor metastasis. The combinedsilencing of p53 and Toca-1 significantly reduced the phe-notypes observed with p53 silencing alone. Lastly, we
Figure 6 (See legend on next page.)
Chander et al. Breast Cancer Research (2014) 16:3413 Page 12 of 15
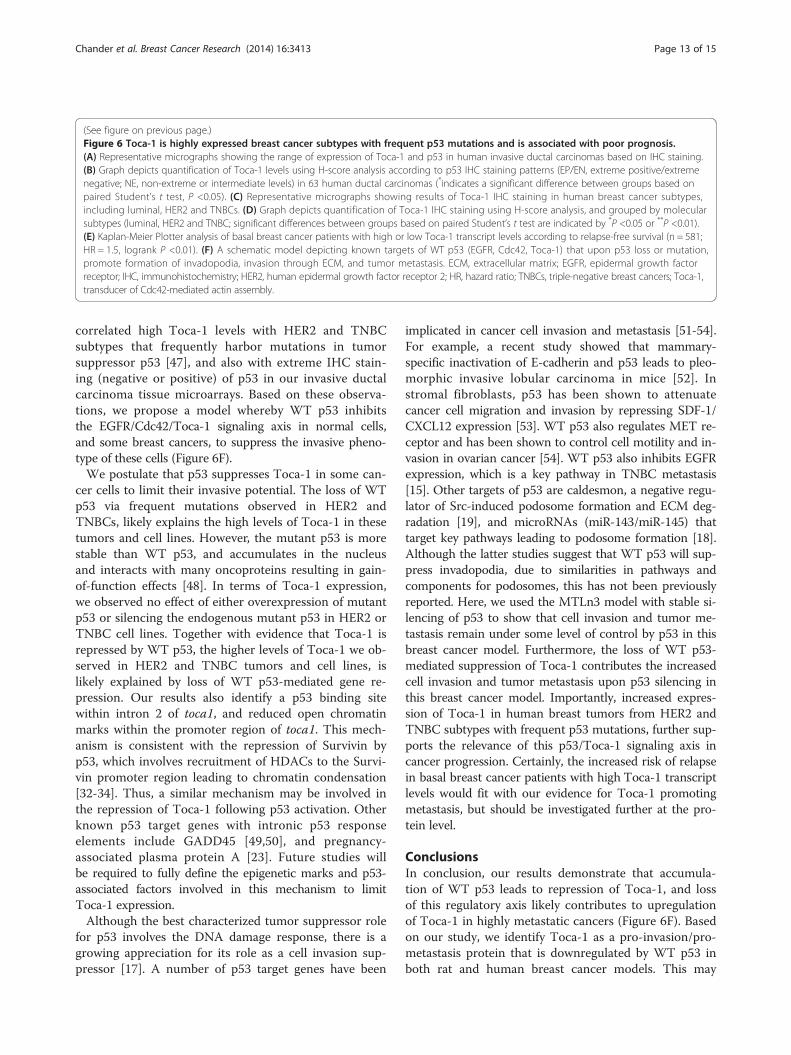
(See figure on previous page.)Figure 6 Toca-1 is highly expressed breast cancer subtypes with frequent p53 mutations and is associated with poor prognosis.(A) Representative micrographs showing the range of expression of Toca-1 and p53 in human invasive ductal carcinomas based on IHC staining.(B) Graph depicts quantification of Toca-1 levels using H-score analysis according to p53 IHC staining patterns (EP/EN, extreme positive/extremenegative; NE, non-extreme or intermediate levels) in 63 human ductal carcinomas (*indicates a significant difference between groups based onpaired Student’s t test, P <0.05). (C) Representative micrographs showing results of Toca-1 IHC staining in human breast cancer subtypes,including luminal, HER2 and TNBCs. (D) Graph depicts quantification of Toca-1 IHC staining using H-score analysis, and grouped by molecularsubtypes (luminal, HER2 and TNBC; significant differences between groups based on paired Student’s t test are indicated by *P <0.05 or **P <0.01).(E) Kaplan-Meier Plotter analysis of basal breast cancer patients with high or low Toca-1 transcript levels according to relapse-free survival (n = 581;HR = 1.5, logrank P <0.01). (F) A schematic model depicting known targets of WT p53 (EGFR, Cdc42, Toca-1) that upon p53 loss or mutation,promote formation of invadopodia, invasion through ECM, and tumor metastasis. ECM, extracellular matrix; EGFR, epidermal growth factorreceptor; IHC, immunohistochemistry; HER2, human epidermal growth factor receptor 2; HR, hazard ratio; TNBCs, triple-negative breast cancers; Toca-1,transducer of Cdc42-mediated actin assembly.
Chander et al. Breast Cancer Research (2014) 16:3413 Page 13 of 15
correlated high Toca-1 levels with HER2 and TNBCsubtypes that frequently harbor mutations in tumorsuppressor p53 [47], and also with extreme IHC stain-ing (negative or positive) of p53 in our invasive ductalcarcinoma tissue microarrays. Based on these observa-tions, we propose a model whereby WT p53 inhibitsthe EGFR/Cdc42/Toca-1 signaling axis in normal cells,and some breast cancers, to suppress the invasive pheno-type of these cells (Figure 6F).We postulate that p53 suppresses Toca-1 in some can-
cer cells to limit their invasive potential. The loss of WTp53 via frequent mutations observed in HER2 andTNBCs, likely explains the high levels of Toca-1 in thesetumors and cell lines. However, the mutant p53 is morestable than WT p53, and accumulates in the nucleusand interacts with many oncoproteins resulting in gain-of-function effects [48]. In terms of Toca-1 expression,we observed no effect of either overexpression of mutantp53 or silencing the endogenous mutant p53 in HER2 orTNBC cell lines. Together with evidence that Toca-1 isrepressed by WT p53, the higher levels of Toca-1 we ob-served in HER2 and TNBC tumors and cell lines, islikely explained by loss of WT p53-mediated gene re-pression. Our results also identify a p53 binding sitewithin intron 2 of toca1, and reduced open chromatinmarks within the promoter region of toca1. This mech-anism is consistent with the repression of Survivin byp53, which involves recruitment of HDACs to the Survi-vin promoter region leading to chromatin condensation[32-34]. Thus, a similar mechanism may be involved inthe repression of Toca-1 following p53 activation. Otherknown p53 target genes with intronic p53 responseelements include GADD45 [49,50], and pregnancy-associated plasma protein A [23]. Future studies willbe required to fully define the epigenetic marks and p53-associated factors involved in this mechanism to limitToca-1 expression.Although the best characterized tumor suppressor role
for p53 involves the DNA damage response, there is agrowing appreciation for its role as a cell invasion sup-pressor [17]. A number of p53 target genes have been
implicated in cancer cell invasion and metastasis [51-54].For example, a recent study showed that mammary-specific inactivation of E-cadherin and p53 leads to pleo-morphic invasive lobular carcinoma in mice [52]. Instromal fibroblasts, p53 has been shown to attenuatecancer cell migration and invasion by repressing SDF-1/CXCL12 expression [53]. WT p53 also regulates MET re-ceptor and has been shown to control cell motility and in-vasion in ovarian cancer [54]. WT p53 also inhibits EGFRexpression, which is a key pathway in TNBC metastasis[15]. Other targets of p53 are caldesmon, a negative regu-lator of Src-induced podosome formation and ECM deg-radation [19], and microRNAs (miR-143/miR-145) thattarget key pathways leading to podosome formation [18].Although the latter studies suggest that WT p53 will sup-press invadopodia, due to similarities in pathways andcomponents for podosomes, this has not been previouslyreported. Here, we used the MTLn3 model with stable si-lencing of p53 to show that cell invasion and tumor me-tastasis remain under some level of control by p53 in thisbreast cancer model. Furthermore, the loss of WT p53-mediated suppression of Toca-1 contributes the increasedcell invasion and tumor metastasis upon p53 silencing inthis breast cancer model. Importantly, increased expres-sion of Toca-1 in human breast tumors from HER2 andTNBC subtypes with frequent p53 mutations, further sup-ports the relevance of this p53/Toca-1 signaling axis incancer progression. Certainly, the increased risk of relapsein basal breast cancer patients with high Toca-1 transcriptlevels would fit with our evidence for Toca-1 promotingmetastasis, but should be investigated further at the pro-tein level.
ConclusionsIn conclusion, our results demonstrate that accumula-tion of WT p53 leads to repression of Toca-1, and lossof this regulatory axis likely contributes to upregulationof Toca-1 in highly metastatic cancers (Figure 6F). Basedon our study, we identify Toca-1 as a pro-invasion/pro-metastasis protein that is downregulated by WT p53 inboth rat and human breast cancer models. This may
Chander et al. Breast Cancer Research (2014) 16:3413 Page 14 of 15
reflect the fact that Toca-1 is capable of scaffolding andactivating numerous regulators of actin assembly at cellprotrusions that facilitate motility and invasion. Thus,limiting Toca-1 levels could reduce a number of path-ways that attempt to activate these actin-regulatory pro-teins in normal cell and cancer cells.
Additional files
Additional file 1: Figure S1. Toca-1 transcript level profiling in breastcancer cell lines according to p53 mutation status.
Additional file 2: Figure S2. Toca-1 downregulation by p53 in MCF10Abreast epithelial cells.
Additional file 3: Figure S3. Silencing of p53 and Toca-1 does notaffect viability or growth of MTLn3 cells.
Additional file 4: Figure S4. Correlation between lung metastases andprimary tumor mass in mammary orthotopic MTLn3 xenograft assays.
AbbreviationsBSA: bovine serum albumin; ChIP: chromatin immunoprecipitation;CIP4: Cdc42-interacting protein-4; CPT: camptothecin; DMEM: Dulbecco’smodified Eagle’s medium; ECM: extracellular matrix; EGFR: epidermal growthfactor receptor; EMT: epithelial-mesenchymal transition; EN: extremenegative; EP: extreme positive; ER: estrogen receptor; F-actin: filamentousactin; F-BAR: Fer/CIP4 homology-Bin/Amphiphysin/Rvs; FBS: fetal bovineserum; GAPDH: glyceraldehyde-3-phosphate dehydrogenase; H&E: hematoxylinand eosin; H3K14Ac: histone H3 K14 acetylated; HDACs: histone deacetylasecomplexes; HER2: human epidermal growth factor receptor 2; HR1: PKNhomology region 1; HRP: horseradish peroxidase; IB: immunoblot;IgG: immunoglobulin G; IHC: immunohistochemistry; KN: knockdown;miRNAs: microRNAs; NE: non-extreme; PR: progesterone receptor;qPCR: quantitative polymerase chain reaction; RT: reverse transcription;shRNA: short hairpin RNA; siRNA: small interfering RNA; TNBC: triple-negativebreast cancer; Toca-1: transducer of Cdc42-mediated actin assembly;WT: wild-type.
Competing interestsThe authors declare that they have no competing interests.
Authors’ contributionsHC performed all p53 and Toca-1 profiling, effects of p53 stabilization ortransfection on Toca-1 levels. HC generated MTLn3 sh-p53 and sh-p53/sh-Toca-1 cell lines and performed invasion assays. CDB and PT performed IHCstaining and tissue microarray analyses of Toca-1. KW performed and analyzedthe ECM degradation and cell viability assays. CS performed the cell growthassays, analyzed the results, and validated the stable silencing of p53 andToca-1 in MTLn3 cell models. JM performed and helped analyze mammaryorthotopic xenograft assays. DG provided p53 expression plasmids and celllines, and helped with editing of the manuscript. HC and AWBC conceivedthe study and wrote the manuscript. All authors have read and approvedthe final version of the manuscript.
Authors’ informationHC is a breast cancer biologist that trained as a post-doctoral fellow withboth DG (2006 to 2010) and AWBC (2010 to 2014). HC is now an AssistantProfessor in the Centre for Genetic Diseases and Molecular Medicine, CentralUniversity of Punjab, Bathinda, India. AWBC is a cancer biologist specializingin molecular mechanisms of cancer metastasis, and an Associate Professor atQueen’s University (2002 to 14). AWBC received the Canadian Cancer SocietyYoung Investigator Award (2011), and the Canadian Institutes for HealthResearch New Investigator Award (2004 to 2009).
AcknowledgementsThis work was supported by grants from Canadian Breast Cancer Foundation,Canadian Institutes for Health Research (MOP119562), and Cancer ResearchSociety to AWBC. The authors thank Alan Mak (Queen's University forproviding p53 shRNA vectors.
Author details1Department of Biomedical and Molecular Sciences, Queen’s University,Division of Cancer Biology and Genetics, Queen’s Cancer Research Institute,10 Stuart Street, Kingston, Ontario K7L 3N6, Canada. 2Centre for GeneticDiseases and Molecular Medicine, Central University of Punjab, Mansa Road,Bathinda 151001, India. 3Department of Medicine, Division of Hematologyand Oncology, Tisch Cancer Institute, Mount Sinai School of Medicine, 11905th Avenue, New York 10029, USA.
Received: 6 March 2014 Accepted: 11 December 2014
References1. Buccione R, Caldieri G, Ayala I. Invadopodia: specialized tumor cell structures
for the focal degradation of the extracellular matrix. Cancer Met Rev.2009;28:137–49.
2. Clark ES, Weaver AM. A new role for cortactin in invadopodia: regulation ofprotease secretion. Eur J Cell Biol. 2008;87:581–90.
3. Gligorijevic B, Wyckoff J, Yamaguchi H, Wang Y, Roussos ET, Condeelis J.N-WASP-mediated invadopodium formation is involved in intravasation andlung metastasis of mammary tumors. J Cell Sci. 2012;125:724–34.
4. Oser M, Yamaguchi H, Mader CC, Bravo-Cordero JJ, Arias M, Chen X, et al.Cortactin regulates cofilin and N-WASp activities to control the stages ofinvadopodium assembly and maturation. J Cell Biol. 2009;186:571–87.
5. Stylli SS, Kaye AH, Lock P. Invadopodia: at the cutting edge of tumourinvasion. J Clin Neurosci. 2008;15:725–37.
6. Ho HY, Rohatgi R, Lebensohn AM, Le M, Li J, Gygi SP, et al. Toca-1 mediatesCdc42-dependent actin nucleation by activating the N-WASP-WIP complex.Cell. 2004;118:203–16.
7. Itoh T, Erdmann KS, Roux A, Habermann B, Werner H, De Camilli P. Dynaminand the actin cytoskeleton cooperatively regulate plasma membraneinvagination by BAR and F-BAR proteins. Dev Cell. 2005;9:791–804.
8. Takano K, Toyooka K, Suetsugu S. EFC/F-BAR proteins and the N-WASP-WIPcomplex induce membrane curvature-dependent actin polymerization.EMBO J. 2008;27:2817–28.
9. Aspenstrom P, Fransson A, Richnau N. Pombe Cdc15 homology proteins:regulators of membrane dynamics and the actin cytoskeleton. TrendsBiochem Sci. 2006;31:670–9.
10. Giuliani C, Troglio F, Bai Z, Patel FB, Zucconi A, Malabarba MG, et al.Requirements for F-BAR proteins TOCA-1 and TOCA-2 in actin dynamicsand membrane trafficking during Caenorhabditis elegans oocyte growthand embryonic epidermal morphogenesis. PLoS Genet. 2009;5:e1000675.
11. Chander H, Truesdell P, Meens J, Craig AW. Transducer of Cdc42-dependentactin assembly promotes breast cancer invasion and metastasis. Oncogene.2013;32:3080–90.
12. Bu W, Chou AM, Lim KB, Sudhaharan T, Ahmed S. The Toca-1-N-WASPcomplex links filopodial formation to endocytosis. J Biol Chem.2009;284:11622–36.
13. Hu J, Troglio F, Mukhopadhyay A, Everingham S, Kwok E, Scita G, et al.F-BAR-containing adaptor CIP4 localizes to early endosomes and regulatesepidermal growth factor receptor trafficking and downregulation. CellSignal. 2009;21:1686–97.
14. Hu J, Mukhopadhyay A, Craig AW. Transducer of Cdc42-dependent actinassembly promotes epidermal growth factor-induced cell motility andinvasiveness. J Biol Chem. 2011;286:2261–72.
15. Kobayashi S. Basal-like subtype of breast cancer: a review of its uniquecharacteristics and their clinical significance. Breast Cancer. 2008;15:153–8.
16. Rakha EA, El-Sayed ME, Reis-Filho J, Ellis IO. Patho-biological aspects ofbasal-like breast cancer. Breast Cancer Res Treat. 2009;113:411–22.
17. Muller PA, Vousden KH, Norman JC. p53 and its mutants in tumor cellmigration and invasion. J Cell Biol. 2011;192:209–18.
18. Quintavalle M, Elia L, Condorelli G, Courtneidge SA. MicroRNA control ofpodosome formation in vascular smooth muscle cells in vivo and in vitro.J Cell Biol. 2010;189:13–22.
19. Mukhopadhyay UK, Eves R, Jia L, Mooney P, Mak AS. p53 suppressesSrc-induced podosome and rosette formation and cellular invasivenessthrough the upregulation of caldesmon. Mol Cell Biol. 2009;29:3088–98.
20. Livak KJ, Schmittgen TD. Analysis of relative gene expression data usingreal-time quantitative PCR and the 2(-Delta Delta C(T)) method. Methods.2001;25:402–8.
Chander et al. Breast Cancer Research (2014) 16:3413 Page 15 of 15
21. Espinosa JM, Emerson BM. Transcriptional regulation by p53 throughintrinsic DNA/chromatin binding and site-directed cofactor recruitment.Mol Cell. 2001;8:57–69.
22. Le Devedec SE, van Roosmalen W, Maria N, Grimbergen M, Pont C, Lalai R,et al. An improved model to study tumor cell autonomous metastasisprograms using MTLn3 cells and the Rag2(-/-) gammac (-/-) mouse. Clin ExpMet. 2009;26:673–84.
23. Chander H, Halpern M, Resnick-Silverman L, Manfredi JJ, Germain D. Skp2Boverexpression alters a prohibitin-p53 axis and the transcription of PAPP-A,the protease of insulin-like growth factor binding protein 4. PLoS One.2011;6:e22456.
24. Boyle DP, McArt DG, Irwin G, Wilhelm-Benartzi CS, Lioe TF, Sebastian E,et al. The prognostic significance of the aberrant extremes of p53immunophenotypes in breast cancer. Histopathol. 2014;65:340–52.
25. Saint-Ruf C, Nardeux P, Cebrian J, Lacasa M, Lavialle C, Cassingena R.Molecular cloning and characterization of endogenous SV40 DNA fromhuman HBL-100 cells. Intl J Cancer. 1989;44:367–72.
26. Michalovitz D, Eliyahu D, Oren M. Overproduction of protein p53contributes to simian virus 40-mediated transformation. Mol Cell Biol.1986;6:3531–6.
27. Strano S, Dell’Orso S, Di Agostino S, Fontemaggi G, Sacchi A, Blandino G.Mutant p53: an oncogenic transcription factor. Oncogene. 2007;26:2212–9.
28. Werner H, Karnieli E, Rauscher FJ, LeRoith D. Wild-type and mutant p53differentially regulate transcription of the insulin-like growth factor Ireceptor gene. Proc Natl Acad Sci U S A. 1996;93:8318–23.
29. Ashcroft M, Taya Y, Vousden KH. Stress signals utilize multiple pathways tostabilize p53. Mol Cell Biol. 2000;20:3224–33.
30. Allison SJ, Milner J. Loss of p53 has site-specific effects on histone H3modification, including serine 10 phosphorylation important for maintenanceof ploidy. Cancer Res. 2003;63:6674–9.
31. Sengupta S, Shimamoto A, Koshiji M, Pedeux R, Rusin M, Spillare EA, et al.Tumor suppressor p53 represses transcription of RECQ4 helicase. Oncogene.2005;24:1738–48.
32. Menendez D, Inga A, Resnick MA. The expanding universe of p53 targets.Nat Rev Cancer. 2009;9:724–37.
33. Murphy DA, Courtneidge SA. The ‘ins’ and ‘outs’ of podosomes andinvadopodia: characteristics, formation and function. Nat Rev Mol Cell Biol.2011;12:413–26.
34. Riley T, Sontag E, Chen P, Levine A. Transcriptional control of humanp53-regulated genes. Nat Rev Mol Cell Biol. 2008;9:402–12.
35. Wang W, Wyckoff JB, Goswami S, Wang Y, Sidani M, Segall JE, et al.Coordinated regulation of pathways for enhanced cell motility andchemotaxis is conserved in rat and mouse mammary tumors. Cancer Res.2007;67:3505–11.
36. Yamaguchi H, Lorenz M, Kempiak S, Sarmiento C, Coniglio S, Symons M,et al. Molecular mechanisms of invadopodium formation: the role ofthe N-WASP-Arp2/3 complex pathway and cofilin. J Cell Biol.2005;168:441–52.
37. Koboldt DC, Fulton RS, McLellan MD, Schmidt H, Kalicki-Veizer J, McMichael JF,et al. Comprehensive molecular portraits of human breast tumours. Nature.2012;490:61–70.
38. Chacon RD, Costanzo MV. Triple-negative breast cancer. Breast Cancer Res.2010;Suppl 2:S3.
39. Cleator S, Heller W, Coombes RC. Triple-negative breast cancer: therapeuticoptions. Lancet Oncol. 2007;8:235–44.
40. Gyorffy B, Lanczky A, Eklund AC, Denkert C, Budczies J, Li Q, et al. An onlinesurvival analysis tool to rapidly assess the effect of 22,277 genes on breastcancer prognosis using microarray data of 1,809 patients. Breast Cancer ResTreat. 2010;123:725–31.
41. Lehmann BD, Bauer JA, Chen X, Sanders ME, Chakravarthy AB, Shyr Y, et al.Identification of human triple-negative breast cancer subtypes andpreclinical models for selection of targeted therapies. J Clin Invest.2011;121:2750–67.
42. Rakha EA, Reis-Filho JS, Ellis IO. Basal-like breast cancer: a critical review.J Clin Oncol. 2008;26:2568–81.
43. Ueno NT, Zhang D. Targeting EGFR in triple negative breast cancer.J Cancer. 2011;2:324–8.
44. Yamashita H, Nishio M, Toyama T, Sugiura H, Zhang Z, Kobayashi S, et al.Coexistence of HER2 over-expression and p53 protein accumulation is astrong prognostic molecular marker in breast cancer. Breast Cancer Res.2004;6:R24–30.
45. Ferraro DA, Gaborit N, Maron R, Cohen-Dvashi H, Porat Z, Pareja F, et al.Inhibition of triple-negative breast cancer models by combinations ofantibodies to EGFR. Proc Natl Acad Sci U S A. 2013;110:1815–20.
46. Tryfonopoulos D, Walsh S, Collins DM, Flanagan L, Quinn C, Corkery B, et al.Src: a potential target for the treatment of triple-negative breast cancer.Ann Oncol. 2011;22:2234–40.
47. Criscitiello C, Azim Jr HA, Schouten PC, Linn SC, Sotiriou C. Understanding thebiology of triple-negative breast cancer. Ann Oncol. 2012;Suppl 6:vi13–vi18.
48. Freed-Pastor WA, Prives C. Mutant p53: one name, many proteins. GenesDev. 2012;26:1268–86.
49. Chin PL, Momand J, Pfeifer GP. In vivo evidence for binding of p53 toconsensus binding sites in the p21 and GADD45 genes in response toionizing radiation. Oncogene. 1997;15:87–99.
50. Graunke DM, Fornace Jr AJ, Pieper RO. Presetting of chromatin structureand transcription factor binding poise the human GADD45 gene for rapidtranscriptional up-regulation. Nucleic Acids Res. 1999;27:3881–90.
51. Roger L, Gadea G, Roux P. Control of cell migration: a tumour suppressorfunction for p53? Biol Cell. 2006;98:141–52.
52. Derksen PW, Braumuller TM, van der Burg E, Hornsveld M, Mesman E,Wesseling J, et al. Mammary-specific inactivation of E-cadherin and p53impairs functional gland development and leads to pleomorphic invasivelobular carcinoma in mice. Dis Model Mech. 2011;4:347–58.
53. Moskovits N, Kalinkovich A, Bar J, Lapidot T, Oren M. p53 Attenuates cancercell migration and invasion through repression of SDF-1/CXCL12 expressionin stromal fibroblasts. Cancer Res. 2006;66:10671–6.
54. Hwang CI, Matoso A, Corney DC, Flesken-Nikitin A, Korner S, Wang W, et al.Wild-type p53 controls cell motility and invasion by dual regulation of METexpression. Proc Natl Acad Sci U S A. 2011;108:14240–5.
Submit your next manuscript to BioMed Centraland take full advantage of:
• Convenient online submission
• Thorough peer review
• No space constraints or color figure charges
• Immediate publication on acceptance
• Inclusion in PubMed, CAS, Scopus and Google Scholar
• Research which is freely available for redistribution
Submit your manuscript at www.biomedcentral.com/submit