Embed Size (px)
Citation preview

Too Interconnected To Fail: Financial Contagion and Systemic Risk in Network
Model of CDS and Other Credit Enhancement Obligations of US Banks
Prof. Sheri Markose [email protected] with Simone Giansante, Mateusz Gatkowski and Ali Rais Shaghaghi
Economics Department Centre for Computational Finance and Economic Agents
IMF Workshop Operationalizing Systemic Risk Monitoring:May 26-28 2010

Roadmap: Opus Reticulatum (Networks) • Overview
• Financial Crisis 07-08 and Credit Derivatives • Financial Contagion and Systemic Risk • Synthetic Securitization and Basel II – Regulatory and
Market Failure • Post Crisis Intercontinental Exchange (ICE) CDS Central
Clearing : New Player in CDS Network ( Taken approx. 30% of US CDS Market Share since March 2009)
• Model of Structural Contagion v Statistical Models of Contagion • Fine Grained Data-base driven Multi Agent Based Models of
Financial Sector : Model Verite New Office of Financial Research in the US Treasury to put an end to regulators flying blind
• Network Approach • Stress Test • Results (Simulator on acefinmod.com website)
• Conclusions
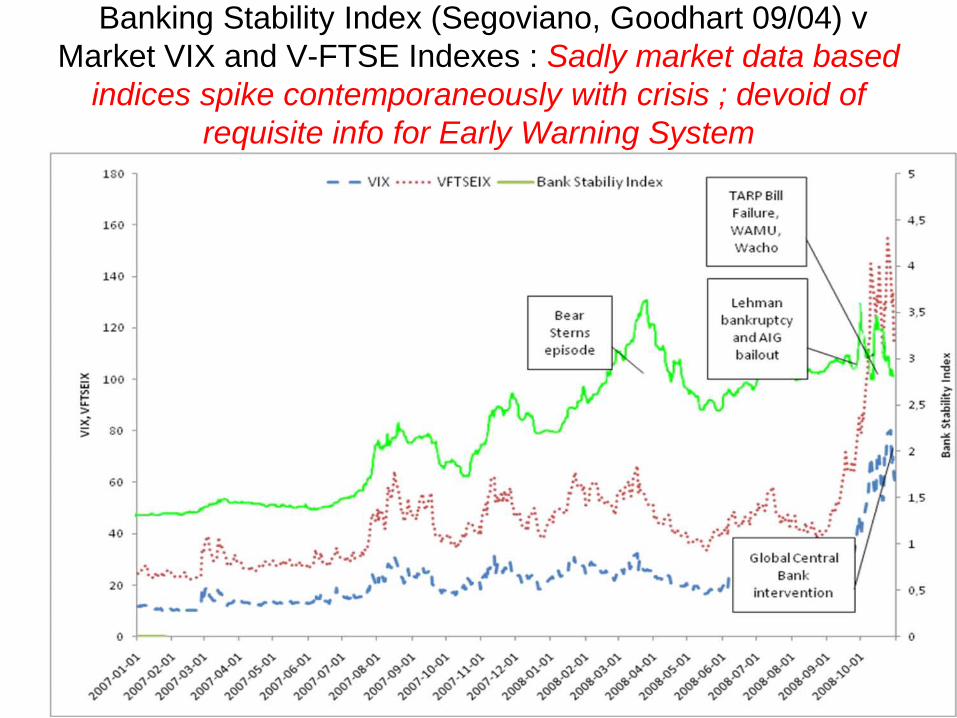
Banking Stability Index (Segoviano, Goodhart 09/04) v Market VIX and V-FTSE Indexes : Sadly market data based
indices spike contemporaneously with crisis ; devoid of requisite info for Early Warning System

Financial Contagion and Systemic Risk: Multi Agent Model of US Financial Sector (For TWO decades regulators, central bankers and academics had no incentive to study and build large scale integrative
financial sector models (Gary Gorton) Why ?)
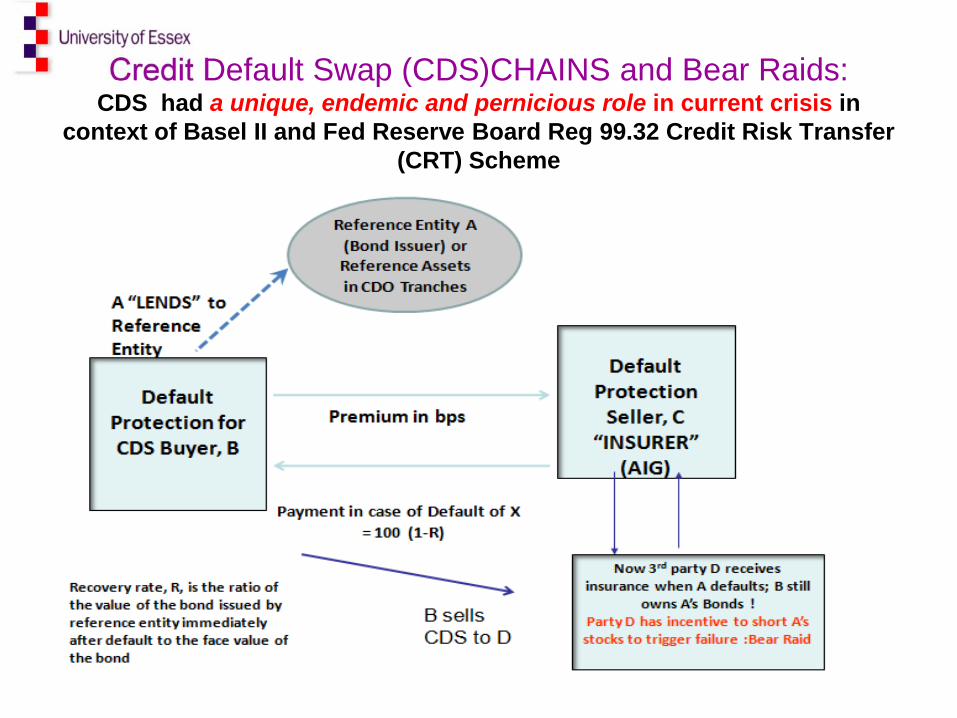
Credit Default Swap (CDS)CHAINS and Bear Raids: CDS had a unique, endemic and pernicious role in current crisis in
context of Basel II and Fed Reserve Board Reg 99.32 Credit Risk Transfer (CRT) Scheme

Overview 1 •Few/No empirical studies of financial network interconnections among banks and between banks and non-banks as CDS protection buyers and protection sellers (Cont et. al. 2009 calibrate CDS network using network statistics and exposures of Austrian and Brazilian interbank market; concentration risk for banks much higher in CDS market than interbank one). • Technical insolvency of US banks not just from legacy/toxic RMBS assets but also due to credit risk exposures from the SPV vehicles and the CDS markets • Dominance of few big players in chains of insurance and reinsurance for credit default risk :idea of “too interconnected to fail” (Eg AIG) Tax payer bailout to maintain fiction of non-failure to avert credit event that can bring down the CDS pyramid and financial system. • Methodological issues: Complex system Agent-based Computational Economics (ACE) for financial network modeling for systemic risk proposed: ‘Wind Tunneling Tests’
Our crusade is for full digital network mapping of many key financial sectors with live data feeds ; Combine with institutional micro-structure and behavioural rules for agents to create computational agent based test beds

Overview 2 • Empirical reconstruction of the US CDS network (FDIC 08 Q 4 data;
also DTCC Data) for stress tests to investigate implications of fact that top 5 US banks account for 98% of $16 tn of the $37 tn gross notional value of CDS reported by the BIS and DTCC for the end of 2008
• ARE WE OUT OF THE CDS WOODS ? Empirically based CDS network for 26 US banks (2008 Q 4) data fundamentally unstable by May-Wigner criteria; does not have enough bank capital to prevent system collapse due to failure of a large CDS seller
• Above better than an equivalent random graph which leads to worse consequences
• Implications of ICE CDS Central Clearing : Network Stability updates after March 2009
• New concepts such as ‘super-spreader’ fund based on centrality in terms of connectivity of a financial entity in financial system
• Systemic Risk Ratio: measures the liquidity loss impact in terms of aggregate bank core capital loss due to failure of a major bank or non-bank player from its activities in CDS and credit enhancement
• Super-spreader funds: financial entities have to contribute proportional to their systemic risk impact. Over turns current practice where ‘big’ banks have lenient collateral requirements
• Eigenvalue Centrality statistics for superspreaders. Can this proxy for systemic risk losses of core capital for the CDS participants ?

Structural vs Statistical Contagion
• DEFINITION: Economic and financial contagion refers to the spreading of a negative shock on the solvency conditions of an economic or financial entity in a physical supply chain or in terms of generic credit/debt and liquidity obligations governing interbank, payment and settlement systems and/or claims on other financial markets
• Structural model based on default causality of chain reactions governed by the network connections of the financial entities
• In contrast, models made popular by Kaminsky and Reinhart (2000) view financial contagion as the downward co-movement of asset prices across different markets and for different asset classes. This is based on statistical or econometric methods which measure (amongst other ways) the increased correlations of asset prices
• Above models complimentary to the causal default models that use financial network simulations, especially in the use of contagion models based on CDS price co-movements (Jorge Chan-Lau et al., 2009)

Collateralized Debt Obligation,CDO ($155bn at peak 2007) Synthetic CDO combines CDO Tranches with
CDS
Tranche structure at time t0; at time t1, pool’s losses (shaded in black) absorbed by Equity tranche; Mezzanine Jr., Mezzanine, Senior and Super-Senior tranches are not yet affected by pool losses.

Drastic Compression post Lehman especially in tranche CDS
57,9 57,3
20,1 18,1 15,9 14,3 12,8 13,0 9,9 10,0 10,3
17,116,4
16,5 16,2 15,2 15,215,2 14,9 14,6
37,234,5
32,4 30,528 28
25 25 25
0
10
20
30
40
50
60
70
80
Dec-07 Jun-08 Oct-08 Nov-08 Dec-08 Mar-09 Apr-09 May-09 Mar-10 Apr-10 May-10
US$
Tri
llion
s
Credit Default Swaps Outstanding – Gross Notional
Single Name
Indices and tranches
Source: BIS Dec 07, Jun 08 ; DTCC other dates
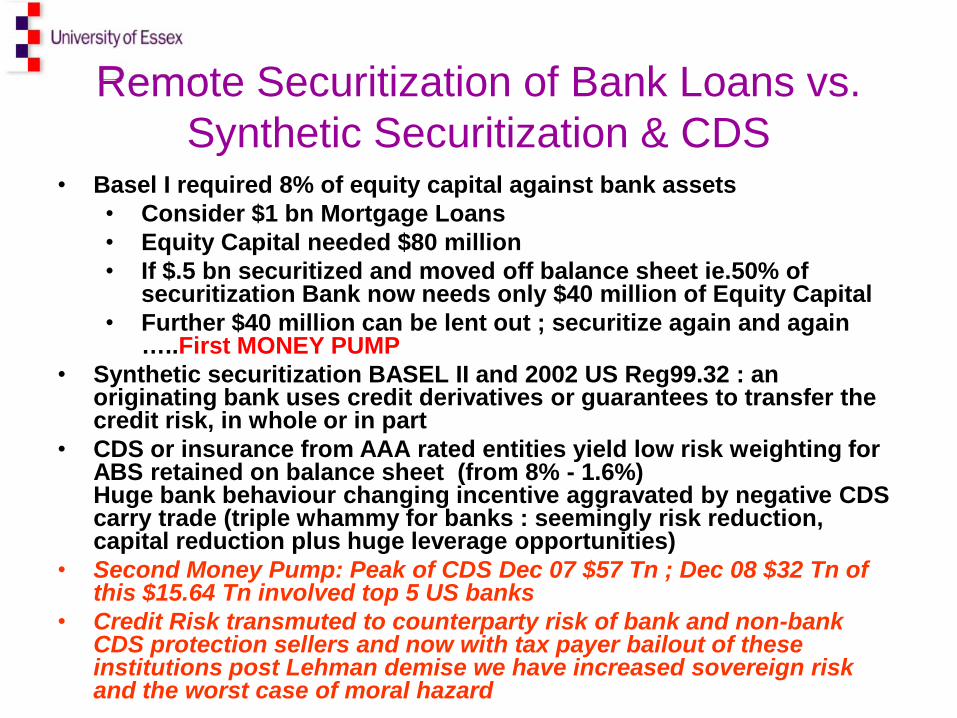
Remote Securitization of Bank Loans vs. Synthetic Securitization & CDS
• Basel I required 8% of equity capital against bank assets • Consider $1 bn Mortgage Loans • Equity Capital needed $80 million • If $.5 bn securitized and moved off balance sheet ie.50% of
securitization Bank now needs only $40 million of Equity Capital • Further $40 million can be lent out ; securitize again and again
…..First MONEY PUMP • Synthetic securitization BASEL II and 2002 US Reg99.32 : an
originating bank uses credit derivatives or guarantees to transfer the credit risk, in whole or in part
• CDS or insurance from AAA rated entities yield low risk weighting for ABS retained on balance sheet (from 8% - 1.6%) Huge bank behaviour changing incentive aggravated by negative CDS carry trade (triple whammy for banks : seemingly risk reduction, capital reduction plus huge leverage opportunities)
• Second Money Pump: Peak of CDS Dec 07 $57 Tn ; Dec 08 $32 Tn of this $15.64 Tn involved top 5 US banks
• Credit Risk transmuted to counterparty risk of bank and non-bank CDS protection sellers and now with tax payer bailout of these institutions post Lehman demise we have increased sovereign risk and the worst case of moral hazard

CDS Network Structures Private Incentives and Concentration Risk: Gross v Net
• Synthetic Securitization Regulation yields greatest capital relief with CDS cover from AAA rated entities like AIG and top banks- these are few in number
• Offsetting by Broker dealers; bilateral offsets to minimize liquidity and rich club structures
• B buys a CDS from C with a certain annual "premium", say 3% (See Figure on CDS Chain)
• Condition of reference entity worsens, CDS premium rises, so B sells CDS to company D with a premium of say, 6%, and benefits from 3% difference. Note, in case of no insolvency of counterparty C, B has zero economic obligations due to offset. Otherwise, B has to settle gross.
• Closed /Circular CDS Chains are ex ante efficient in liquidity but with counterparty insolvency truncated chains require more than net notional to settle
• Closed CDS chains evolve which minimize settlement obligations through offset and maximize returns from CDS premia (lengthening chains) calling to question whether the CDS market can provide sufficient hedge for the reference assets
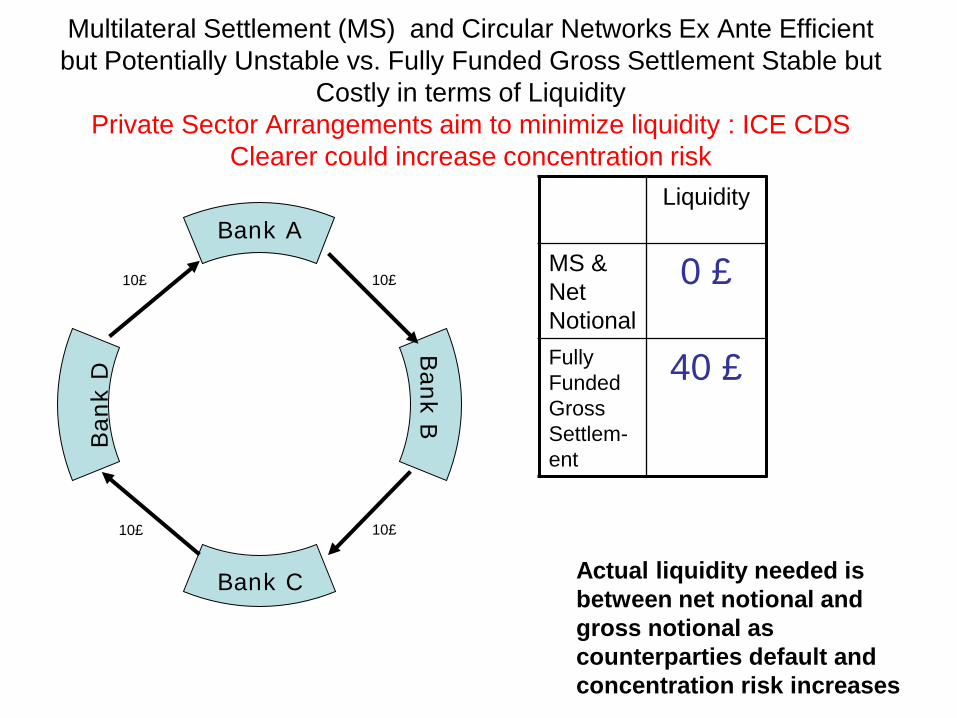
Multilateral Settlement (MS) and Circular Networks Ex Ante Efficient but Potentially Unstable vs. Fully Funded Gross Settlement Stable but
Costly in terms of Liquidity Private Sector Arrangements aim to minimize liquidity : ICE CDS
Clearer could increase concentration risk
10£ 10£
10£ 10£
Bank C
Bank B
Bank A Liquidity
MS & Net Notional
0 £
Fully Funded Gross Settlem-ent
40 £
Ban
k D
Actual liquidity needed is between net notional and gross notional as counterparties default and concentration risk increases

Q4 2006 : Counterparties for CDS: Buying CDS Insurance from a passenger on Titanic The Role of the
Monolines and Non-Regulated Bank Sector Credit Risk Converted to Counterparty Risk and now to Sovereign Risk

CDS Spreads: Default Risk Transmuted to Counterparty Risk and the Sovereign Risk (Source Datastream)
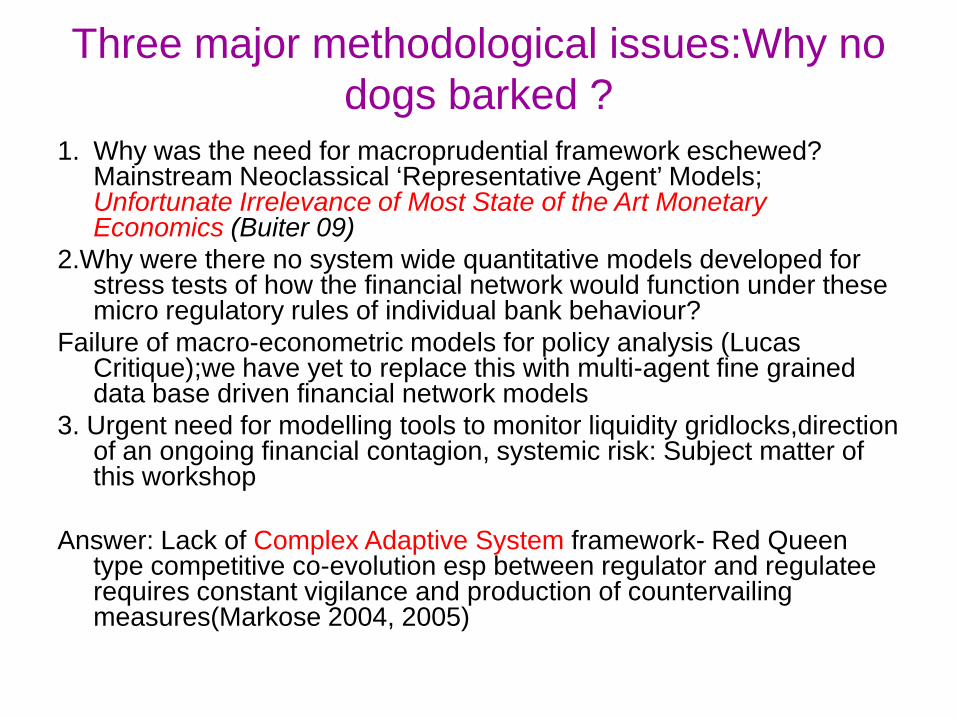
Three major methodological issues:Why no dogs barked ?
1. Why was the need for macroprudential framework eschewed? Mainstream Neoclassical ‘Representative Agent’ Models; Unfortunate Irrelevance of Most State of the Art Monetary Economics (Buiter 09)
2.Why were there no system wide quantitative models developed for stress tests of how the financial network would function under these micro regulatory rules of individual bank behaviour?
Failure of macro-econometric models for policy analysis (Lucas Critique);we have yet to replace this with multi-agent fine grained data base driven financial network models
3. Urgent need for modelling tools to monitor liquidity gridlocks,direction of an ongoing financial contagion, systemic risk: Subject matter of this workshop
Answer: Lack of Complex Adaptive System framework- Red Queen
type competitive co-evolution esp between regulator and regulatee requires constant vigilance and production of countervailing measures(Markose 2004, 2005)

Namefull CDS Buy CDS Sell Core Capital Mortgage Backed Securities
SPV Enhancement
JPMorgan Chase Bank 4,166.76 4,199.10 100.61 130.33 3.53
Citibank 1,397.55 1,290.31 70.98 54.47 0.11
Bank of America 1,028.65 1,004.74 88.50 212.68 0.16
Goldman Sachs Bank USA 651.35 614.40 13.19 0.00 0.00
HSBC Bank USA 457.09 473.63 10.81 20.92 0.01
Wachovia Bank 150.75 141.96 32.71 32.83 2.44
Morgan Stanley Bank 22.06 0.00 5.80 0.00 0.00
Merrill Lynch Bank USA 8.90 0.00 4.09 3.00 0.00
Keybank 3.88 3.31 8.00 8.09 0.00
PNC Bank 2.00 1.05 8.34 24.98 0.00
National City Bank 1.29 0.94 12.05 11.95 0.71
The Bank of New York Mellon 1.18 0.00 11.15 29.29 0.00
Wells Fargo Bank 1.04 0.49 33.07 60.15 0.59
SunTrust Bank 0.59 0.20 12.56 14.85 0.00
The Northern Trust Company 0.24 0.00 4.39 1.37 0.00
State Street Bank and Trust Company 0.15 0.00 13.42 23.03 0.00
Deutsche Bank Trust Company Americas 0.10 0.00 7.87 0.00 0.00
Regions Bank 0.08 0.41 9.64 14.30 0.21
U.S. Bank 0.06 0.00 14.56 29.34 0.42
RBS Citizens 0.00 0.06 8.47 19.75 0.01
Note: FDIC Data; All figures in $bn
US Banks With CDS Positions($bns):2008 Q4 FDIC Data

US FDIC Banks in CDS Market Tier 1 Capital and Credit Exposure (LHS): 2006 marks technical insolvency of US Banks as CDS (Sell) plus SPV
Enhancement obligations of US banks in CDS exceeds assets; Marked improvement in 08 Q4 (LHS);However RHS 08Q4 With ICE

Trends in CDS Market for Some US Banks (Source FDIC) NB Bank of America has increased market share while others like JP Morgan have
reduced drastically by Q409
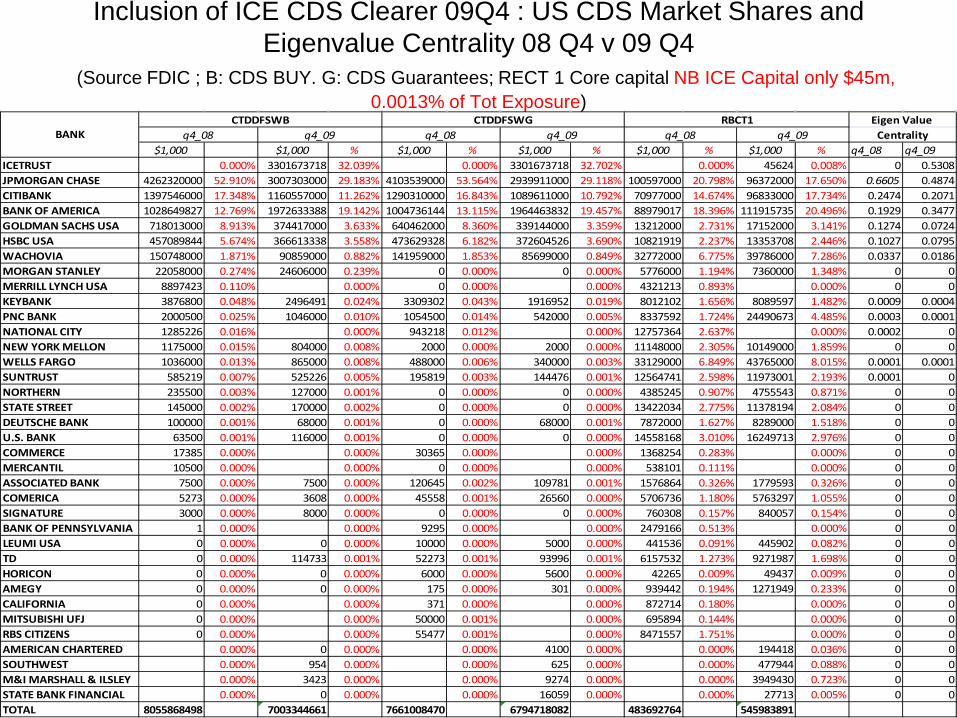
Inclusion of ICE CDS Clearer 09Q4 : US CDS Market Shares and Eigenvalue Centrality 08 Q4 v 09 Q4
(Source FDIC ; B: CDS BUY. G: CDS Guarantees; RECT 1 Core capital NB ICE Capital only $45m, 0.0013% of Tot Exposure)
$1,000 $1,000 % $1,000 % $1,000 % $1,000 % $1,000 % q4_08 q4_09ICETRUST 0.000% 3301673718 32.039% 0.000% 3301673718 32.702% 0.000% 45624 0.008% 0 0.5308JPMORGAN CHASE 4262320000 52.910% 3007303000 29.183% 4103539000 53.564% 2939911000 29.118% 100597000 20.798% 96372000 17.650% 0.6605 0.4874CITIBANK 1397546000 17.348% 1160557000 11.262% 1290310000 16.843% 1089611000 10.792% 70977000 14.674% 96833000 17.734% 0.2474 0.2071BANK OF AMERICA 1028649827 12.769% 1972633388 19.142% 1004736144 13.115% 1964463832 19.457% 88979017 18.396% 111915735 20.496% 0.1929 0.3477GOLDMAN SACHS USA 718013000 8.913% 374417000 3.633% 640462000 8.360% 339144000 3.359% 13212000 2.731% 17152000 3.141% 0.1274 0.0724HSBC USA 457089844 5.674% 366613338 3.558% 473629328 6.182% 372604526 3.690% 10821919 2.237% 13353708 2.446% 0.1027 0.0795WACHOVIA 150748000 1.871% 90859000 0.882% 141959000 1.853% 85699000 0.849% 32772000 6.775% 39786000 7.286% 0.0337 0.0186MORGAN STANLEY 22058000 0.274% 24606000 0.239% 0 0.000% 0 0.000% 5776000 1.194% 7360000 1.348% 0 0MERRILL LYNCH USA 8897423 0.110% 0.000% 0 0.000% 0.000% 4321213 0.893% 0.000% 0 0KEYBANK 3876800 0.048% 2496491 0.024% 3309302 0.043% 1916952 0.019% 8012102 1.656% 8089597 1.482% 0.0009 0.0004PNC BANK 2000500 0.025% 1046000 0.010% 1054500 0.014% 542000 0.005% 8337592 1.724% 24490673 4.485% 0.0003 0.0001NATIONAL CITY 1285226 0.016% 0.000% 943218 0.012% 0.000% 12757364 2.637% 0.000% 0.0002 0NEW YORK MELLON 1175000 0.015% 804000 0.008% 2000 0.000% 2000 0.000% 11148000 2.305% 10149000 1.859% 0 0WELLS FARGO 1036000 0.013% 865000 0.008% 488000 0.006% 340000 0.003% 33129000 6.849% 43765000 8.015% 0.0001 0.0001SUNTRUST 585219 0.007% 525226 0.005% 195819 0.003% 144476 0.001% 12564741 2.598% 11973001 2.193% 0.0001 0NORTHERN 235500 0.003% 127000 0.001% 0 0.000% 0 0.000% 4385245 0.907% 4755543 0.871% 0 0STATE STREET 145000 0.002% 170000 0.002% 0 0.000% 0 0.000% 13422034 2.775% 11378194 2.084% 0 0DEUTSCHE BANK 100000 0.001% 68000 0.001% 0 0.000% 68000 0.001% 7872000 1.627% 8289000 1.518% 0 0U.S. BANK 63500 0.001% 116000 0.001% 0 0.000% 0 0.000% 14558168 3.010% 16249713 2.976% 0 0COMMERCE 17385 0.000% 0.000% 30365 0.000% 0.000% 1368254 0.283% 0.000% 0 0MERCANTIL 10500 0.000% 0.000% 0 0.000% 0.000% 538101 0.111% 0.000% 0 0ASSOCIATED BANK 7500 0.000% 7500 0.000% 120645 0.002% 109781 0.001% 1576864 0.326% 1779593 0.326% 0 0COMERICA 5273 0.000% 3608 0.000% 45558 0.001% 26560 0.000% 5706736 1.180% 5763297 1.055% 0 0SIGNATURE 3000 0.000% 8000 0.000% 0 0.000% 0 0.000% 760308 0.157% 840057 0.154% 0 0BANK OF PENNSYLVANIA 1 0.000% 0.000% 9295 0.000% 0.000% 2479166 0.513% 0.000% 0 0LEUMI USA 0 0.000% 0 0.000% 10000 0.000% 5000 0.000% 441536 0.091% 445902 0.082% 0 0TD 0 0.000% 114733 0.001% 52273 0.001% 93996 0.001% 6157532 1.273% 9271987 1.698% 0 0HORICON 0 0.000% 0 0.000% 6000 0.000% 5600 0.000% 42265 0.009% 49437 0.009% 0 0AMEGY 0 0.000% 0 0.000% 175 0.000% 301 0.000% 939442 0.194% 1271949 0.233% 0 0CALIFORNIA 0 0.000% 0.000% 371 0.000% 0.000% 872714 0.180% 0.000% 0 0MITSUBISHI UFJ 0 0.000% 0.000% 50000 0.001% 0.000% 695894 0.144% 0.000% 0 0RBS CITIZENS 0 0.000% 0.000% 55477 0.001% 0.000% 8471557 1.751% 0.000% 0 0AMERICAN CHARTERED 0.000% 0 0.000% 0.000% 4100 0.000% 0.000% 194418 0.036% 0 0SOUTHWEST 0.000% 954 0.000% 0.000% 625 0.000% 0.000% 477944 0.088% 0 0M&I MARSHALL & ILSLEY 0.000% 3423 0.000% 0.000% 9274 0.000% 0.000% 3949430 0.723% 0 0STATE BANK FINANCIAL 0.000% 0 0.000% 0.000% 16059 0.000% 0.000% 27713 0.005% 0 0TOTAL 8055868498 7003344661 7661008470 6794718082 483692764 545983891
Eigen Value CentralityBANK
CTDDFSWB CTDDFSWG RBCT1q4_08 q4_09 q4_08 q4_09 q4_08 q4_09

Some Network Concepts:A graphical representation of random graph (left) and small world graph with hubs, Markose et. al. 2004

Properties of Networks Diagonal Elements Characterize Small World Networks
Watts and Strogatz (1998), Watts (2002) See Markose et. al. (2004) Properties Networks
Clustering Coefficient
Average Path Length
Degree Distribution
Regular
High
High
Equal and fixed In-degrees to each node
Random
Low
Low
Exponential/ Poisson
Scale Free/Power Law
Low
Variable
Fat Tail Distribution

Financial Networks for the US CDS Obligations: High Clustering from broker dealer behaviour and Barabasi et. al. Preferential attachment
model • Our algorithm assigns in and out degrees for a bank in
terms of its respective market shares (siB/G) for CDS
purchases(B) and sales (G), resp.
+
=otherwise
NssGx
Gi
Bj
i
ij 0
tiescounterpar s)'(1largest for the

Source: ACE Stress Testing
Seller
Net Seller
Buyer
Net Buyer
Failed Bank
Legend:
Initial CDS Financial Network for 26 US Banks (2008 Q4): Note Majority of Interconnections are among top 4 banks
and Monolines & Hedge Funds( 30%Triangle)

Random Graph with Same Connectivity and Gross CDS Buy/Sell
Seller
Net Seller
Buyer
Net Buyer
Failed Bank
Legend:

• Sinha ( 2005) and Sinha and Sinha (2006) found that the transition point between stability and instability with respect to the given parameters (N:No. of Nodes, C:Connectivity and sigma) does not differ between random and small world networks.
• However, they found that the speed and manner in which these different network systems transited into instability differed.
• An unstable clustered network system will disintegrate in a less pervasive way than an unstable random network system.
.1<σNC
May-Wigner Stability Criteria for Networks
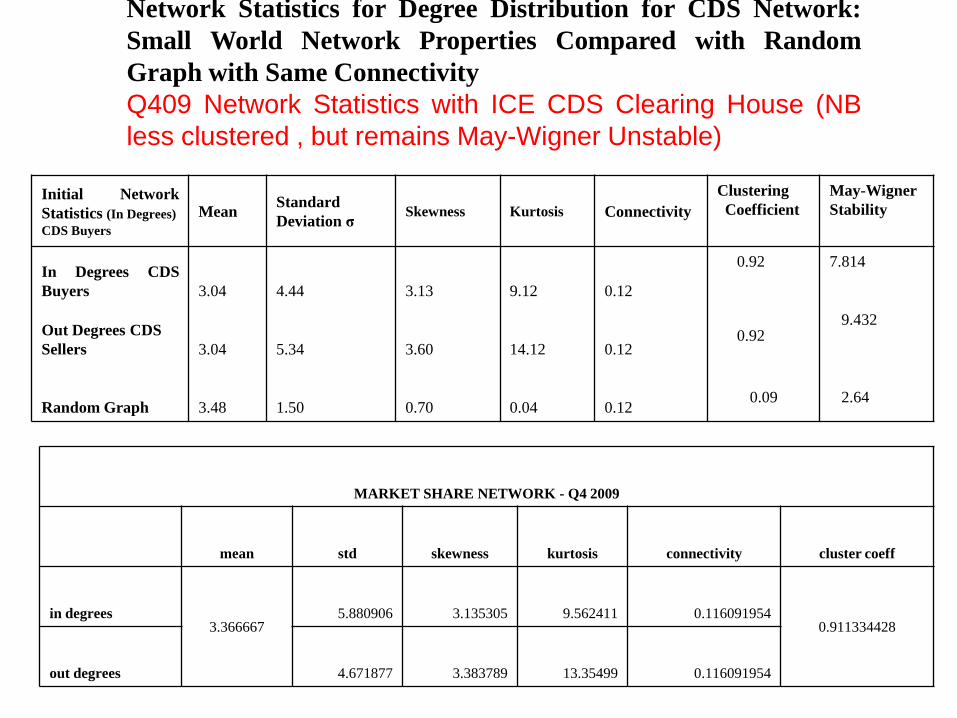
Network Statistics for Degree Distribution for CDS Network: Small World Network Properties Compared with Random Graph with Same Connectivity Q409 Network Statistics with ICE CDS Clearing House (NB less clustered , but remains May-Wigner Unstable)
Initial Network Statistics (In Degrees) CDS Buyers
Mean Standard Deviation σ Skewness Kurtosis Connectivity
Clustering Coefficient
May-Wigner Stability
In Degrees CDS Buyers 3.04 4.44 3.13 9.12 0.12
0.92
7.814
Out Degrees CDS Sellers 3.04 5.34 3.60 14.12 0.12
0.92
9.432
Random Graph 3.48 1.50 0.70 0.04 0.12
0.09
2.64
MARKET SHARE NETWORK - Q4 2009
mean std skewness kurtosis connectivity cluster coeff
in degrees 3.366667
5.880906 3.135305 9.562411 0.116091954 0.911334428
out degrees 4.671877 3.383789 13.35499 0.116091954
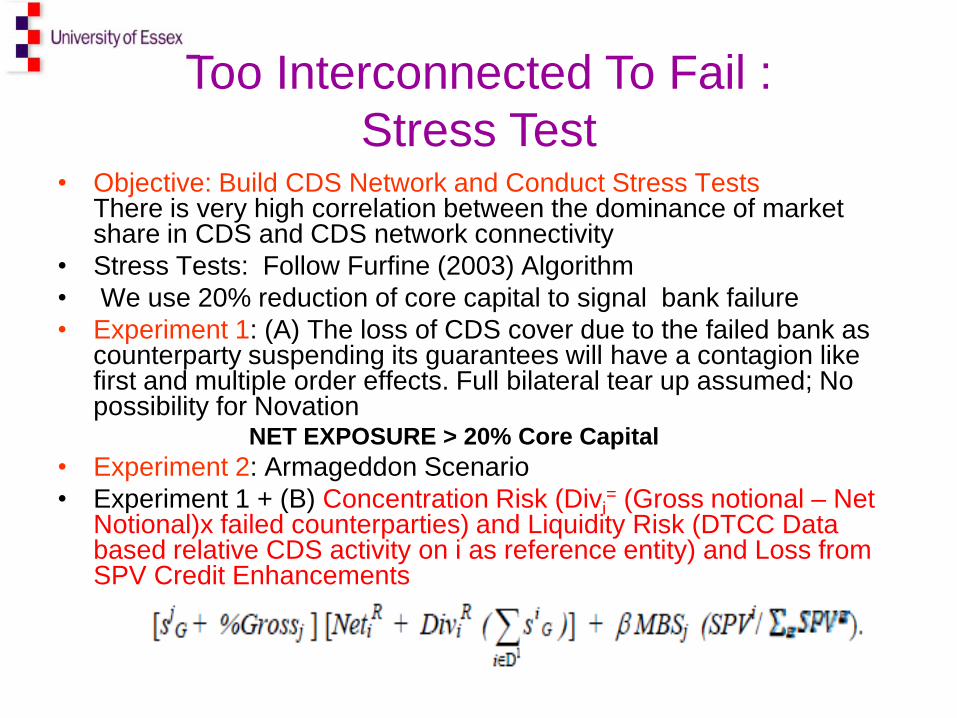
• Objective: Build CDS Network and Conduct Stress Tests There is very high correlation between the dominance of market share in CDS and CDS network connectivity
• Stress Tests: Follow Furfine (2003) Algorithm • We use 20% reduction of core capital to signal bank failure • Experiment 1: (A) The loss of CDS cover due to the failed bank as
counterparty suspending its guarantees will have a contagion like first and multiple order effects. Full bilateral tear up assumed; No possibility for Novation
NET EXPOSURE > 20% Core Capital • Experiment 2: Armageddon Scenario • Experiment 1 + (B) Concentration Risk (Divi
= (Gross notional – Net Notional)x failed counterparties) and Liquidity Risk (DTCC Data based relative CDS activity on i as reference entity) and Loss from SPV Credit Enhancements
Too Interconnected To Fail : Stress Test

Contagion table – exp 1
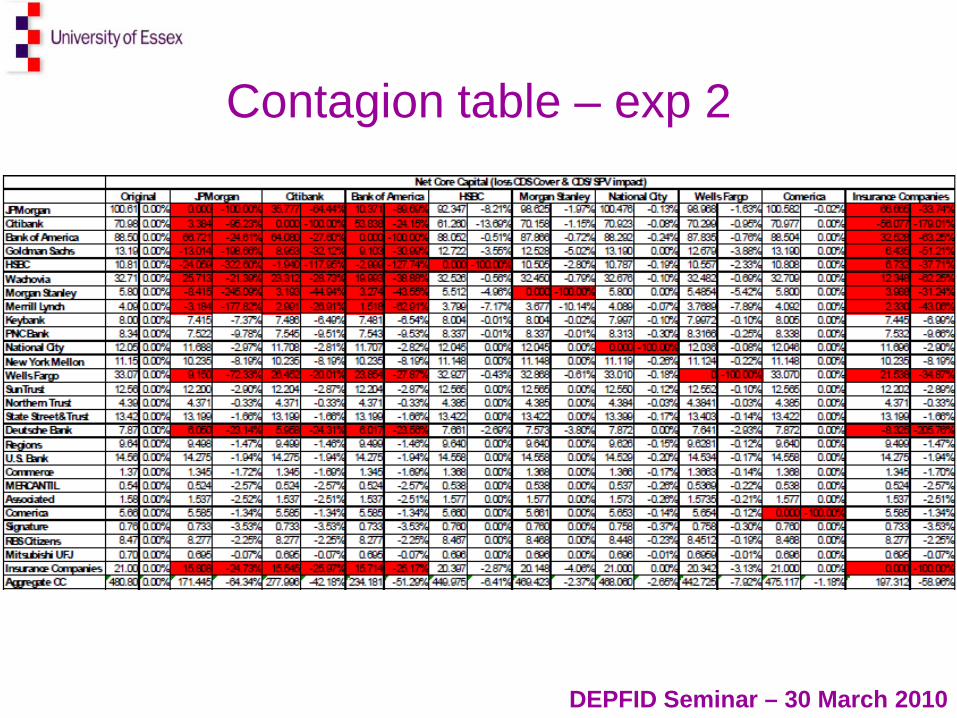
Contagion table – exp 2
DEPFID Seminar – 30 March 2010

Contagion when JP Morgan Demises in Clustered CDS Network ( Left 4 banks fail in first step and crisis contained) v
In Random Graph (Right 22 banks fail !! Over many steps) Innoculate some key players v Innoculate all ( Data Q4 08)

Contagion Rounds JPMORGAN DEFAULTS: Non calibrated Small World Empirical CDS Network
JPMORGAN DEFAULTS: Random Network
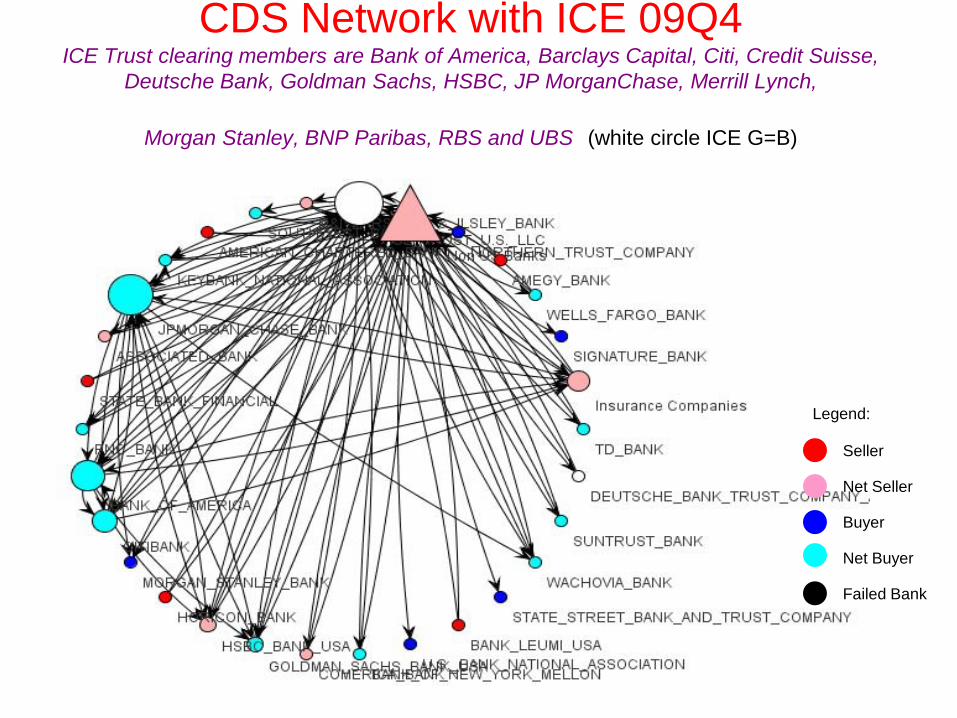
CDS Network with ICE 09Q4 ICE Trust clearing members are Bank of America, Barclays Capital, Citi, Credit Suisse,
Deutsche Bank, Goldman Sachs, HSBC, JP MorganChase, Merrill Lynch,
Morgan Stanley, BNP Paribas, RBS and UBS (white circle ICE G=B)
Seller
Net Seller
Buyer
Net Buyer
Failed Bank
Legend:

09 Q4 Contagion from ICE as Trigger (LHS) and JP Morgan (RHS) (Note JP Morgan now a much
less potent super-spreader)

Section on CDS Spreads Correlation Calibration : To be
covered if time permitted

Financial Networks for US CDS Obligations – Calibration with CDS Spread Correlations
• Our algorithm assigns in and out degrees for a bank in terms of its respective market shares for CDS purchases and sales
≥
=othetwise
corrifsGx ij
Bj
i
ij 0
0ˆ ( )( )∑
=
+
+= N
jij
Bj
ijBjB
j
deviations
deviationss
11
1ˆ

Matrix of bilateral CDS Spreads Correlations Deviations
JPM
org
an
Cit
iba
nk
Ba
nk
of
Am
eri
ca
Go
ldm
an
HS
BC
Wa
ch
ov
ia
Mo
rga
n
Sta
nle
y
Me
rril
l Ly
nch
Ke
yb
an
k
PN
C
Na
tio
na
l C
ity
Me
llo
n
We
lls
Fa
rgo
Su
nT
rust
No
rth
ern
T
rust
Sta
te
Str
ee
t
De
uts
ch
e
Ba
nk
Re
gio
ns
U.S
. B
an
k
Co
mm
erc
e ME
RC
AN
TIL A
sso
cia
ted C
om
eri
ca
Sig
na
ture
RB
S
Mit
su
bis
hi
Insu
ran
ce
C
om
pa
nie
s
JPMorgan 0 0.195702 0.213203 0.05597 -0.41879 0.289233 0.165155 0.174441 0 0 0 0 0.300984 0 0 0 -0.43109 0 0 0 0 0 0 0 0 -0.29769 -0.24712Citibank 0.277298 0 0.078767 0.274468 -0.31164 0.108442 0.324461 0.026995 0 0 0 0 0.119198 0 0 0 -0.23238 0 0 0 0 0 0 0 0 -0.3584 -0.30721Bank of America 0.244542 0.02851 0 0.021391 -0.3027 0.302803 0.125423 0.078894 0 0 0 0 0.293388 0 0 0 -0.34921 0 0 0 0 0 0 0 0 -0.22218 -0.22087Goldman 0.115813 0.252714 0.049895 0 -0.22097 -0.02719 0.384968 0.08198 0 0 0 0 -0.01836 0 0 0 -0.14491 0 0 0 0 0 0 0 0 -0.20911 -0.26483HSBC -0.08681 -0.06125 -0.00206 0.051171 0 -0.11063 0.04495 -0.23027 0 0 0 0 -0.13054 0 0 0 0.353576 0 0 0 0 0 0 0 0 0.052142 0.119721Wachovia 0.344743 0.082356 0.326975 -0.03153 -0.3871 0 0.059234 0.146311 0 0 0 0 0.374169 0 0 0 -0.40404 0 0 0 0 0 0 0 0 -0.30465 -0.20647Morgan Stanley 0.164396 0.242105 0.093324 0.324366 -0.28779 0.002965 0 0.085578 0 0 0 0 0.079495 0 0 0 -0.19386 0 0 0 0 0 0 0 0 -0.23336 -0.27722Merrill Lynch 0.291118 0.062076 0.164232 0.138814 -0.44558 0.207477 0.203015 0 0 0 0 0 0.243663 0 0 0 -0.48188 0 0 0 0 0 0 0 0 -0.16496 -0.21798Keybank 0 0 0 0 0 0 0 0 0 0 0 0 0 0 0 0 0 0 0 0 0 0 0 0 0 0 0PNC 0 0 0 0 0 0 0 0 0 0 0 0 0 0 0 0 0 0 0 0 0 0 0 0 0 0 0National City 0 0 0 0 0 0 0 0 0 0 0 0 0 0 0 0 0 0 0 0 0 0 0 0 0 0 0Mellon 0 0 0 0 0 0 0 0 0 0 0 0 0 0 0 0 0 0 0 0 0 0 0 0 0 0 0Wells Fargo 0.33775 0.074367 0.298815 -0.04143 -0.42575 0.355424 0.117019 0.163751 0 0 0 0 0 0 0 0 -0.39098 0 0 0 0 0 0 0 0 -0.20675 -0.28221SunTrust 0 0 0 0 0 0 0 0 0 0 0 0 0 0 0 0 0 0 0 0 0 0 0 0 0 0 0Northern Trust 0 0 0 0 0 0 0 0 0 0 0 0 0 0 0 0 0 0 0 0 0 0 0 0 0 0 0State Street 0 0 0 0 0 0 0 0 0 0 0 0 0 0 0 0 0 0 0 0 0 0 0 0 0 0 0Deutsche Bank -0.11468 0.002433 -0.06413 0.111656 0.338009 -0.14313 0.123314 -0.28214 0 0 0 0 -0.11133 0 0 0 0 0 0 0 0 0 0 0 0 0.12945 0.010554Regions 0 0 0 0 0 0 0 0 0 0 0 0 0 0 0 0 0 0 0 0 0 0 0 0 0 0 0U.S. Bank 0 0 0 0 0 0 0 0 0 0 0 0 0 0 0 0 0 0 0 0 0 0 0 0 0 0 0Commerce 0 0 0 0 0 0 0 0 0 0 0 0 0 0 0 0 0 0 0 0 0 0 0 0 0 0 0MERCANTIL 0 0 0 0 0 0 0 0 0 0 0 0 0 0 0 0 0 0 0 0 0 0 0 0 0 0 0Associated 0 0 0 0 0 0 0 0 0 0 0 0 0 0 0 0 0 0 0 0 0 0 0 0 0 0 0Comerica 0 0 0 0 0 0 0 0 0 0 0 0 0 0 0 0 0 0 0 0 0 0 0 0 0 0 0Signature 0 0 0 0 0 0 0 0 0 0 0 0 0 0 0 0 0 0 0 0 0 0 0 0 0 0 0RBS 0 0 0 0 0 0 0 0 0 0 0 0 0 0 0 0 0 0 0 0 0 0 0 0 0 0 0Mitsubishi -0.01024 -0.15254 0.033937 0.018499 0.007613 -0.07271 0.054851 0.005818 0 0 0 0 0.043937 0 0 0 0.100488 0 0 0 0 0 0 0 0 0 -0.02966Insurance Companies 0.047437 -0.09425 0.042349 -0.03012 0.082295 0.032573 0.018097 -0.0401 0 0 0 0 -0.02442 0 0 0 -0.0113 0 0 0 0 0 0 0 0 -0.02255 0

Initial matrix of bilateral CDS buys (B) sell (G) obligations of US Banks ($bns) –
Calibrated 08 Q4
JPM
orga
n
Citi
bank
Bank
of
Am
eric
a
Gol
dman
HSB
C
Wac
hovi
a
Mor
gan
Stan
ley
Mer
rill
Lync
h
Keyb
ank
PNC
Nat
iona
l Cit
y
Mel
lon
Wel
ls F
argo
SunT
rust
Nor
ther
n Tr
ust
Stat
e St
reet
Deu
tsch
e Ba
nk
Regi
ons
U.S
. Ban
k
Com
mer
ce
MER
CAN
TIL
Ass
ocia
ted
Com
eric
a
Sign
atur
e
RBS
Mit
subi
shi
Insu
ranc
e Co
mpa
nies
Non
US
Bank
s
Tota
l G
JPMorgan 0 783.2338 561.7071 318.8864 183.146 88.94549 11.26937 5.040377 0 0 0 0 0.60809 0 0 0 0.038845 0 0 0 0 0 0 0 0 0 413.83554 1832.393 4199.104
Citibank 662.1212 0 140.6024 108.4377 57.02533 21.68394 3.641171 1.255846 0 0 0 0 0.14792 0 0 0 0.013322 0 0 0 0 0 0 0 0 0 108.39009 186.9911 1290.31
Bank of America 512.23811 152.7687 0 69.2944 46.22183 20.27005 2.443744 1.04965 0 0 0 0 0.13635 0 0 0 0.009483 0 0 0 0 0 0 0 0 0 95.108791 105.195 1004.736144
Goldman 286.58867 116.0124 68.43357 0 31.29571 3.5097 1.902759 0.601182 0 0 0 0 0.04207 0 0 0 0.007241 0 0 0 0 0 0 0 0 0 56.884783 49.12389 614.402
HSBC 186.10215 73.92698 55.11945 38.99294 0 0 0.623321 0 0 0 0 0 0 0 0 0 0.010282 0 0 0 0 0 0 0 0 0 74.891208 43.96299 473.629328
Wachovia 73.145511 21.09295 18.24755 8.627723 5.535293 0 0 0 0 0 0 0 0 0 0 0 0.001167 0 0 0 0 0 0 0 0 0 12.660353 2.648447 141.959
Morgan Stanley 0 0 0 0 0 0 0 0 0 0 0 0 0 0 0 0 0 0 0 0 0 0 0 0 0 0 0 0 0
Merrill Lynch 0 0 0 0 0 0 0 0 0 0 0 0 0 0 0 0 0 0 0 0 0 0 0 0 0 0 0 0 0
Keybank 0 0 0 0 0 0 0 0 0 0 0 0 0 0 0 0 0 0 0 0 0 0 0 0 0 0 0 3.309302 3.309302
PNC 0 0 0 0 0 0 0 0 0 0 0 0 0 0 0 0 0 0 0 0 0 0 0 0 0 0 0 1.0545 1.0545
National City 0 0 0 0 0 0 0 0 0 0 0 0 0 0 0 0 0 0 0 0 0 0 0 0 0 0 0 0.943218 0.943218
Mellon 0 0 0 0 0 0 0 0 0 0 0 0 0 0 0 0 0 0 0 0 0 0 0 0 0 0 0 0.002 0.002
Wells Fargo 0.2523412 0.07281 0.061932 0.029763 0.0185 0 0 0 0 0 0 0 0 0 0 0 4.14E-06 0 0 0 0 0 0 0 0 0 0.040893 0.011756 0.488
SunTrust 0 0 0 0 0 0 0 0 0 0 0 0 0 0 0 0 0 0 0 0 0 0 0 0 0 0 0 0.195819 0.195819
Northern Trust 0 0 0 0 0 0 0 0 0 0 0 0 0 0 0 0 0 0 0 0 0 0 0 0 0 0 0 0 0
State Street 0 0 0 0 0 0 0 0 0 0 0 0 0 0 0 0 0 0 0 0 0 0 0 0 0 0 0 0 0
Deutsche Bank 0 0 0 0 0 0 0 0 0 0 0 0 0 0 0 0 0 0 0 0 0 0 0 0 0 0 0 0 0
Regions 0 0 0 0 0 0 0 0 0 0 0 0 0 0 0 0 0 0 0 0 0 0 0 0 0 0 0 0.407026 0.407026
U.S. Bank 0 0 0 0 0 0 0 0 0 0 0 0 0 0 0 0 0 0 0 0 0 0 0 0 0 0 0 0 0
Commerce 0 0 0 0 0 0 0 0 0 0 0 0 0 0 0 0 0 0 0 0 0 0 0 0 0 0 0 0.030365 0.030365
MERCANTIL 0 0 0 0 0 0 0 0 0 0 0 0 0 0 0 0 0 0 0 0 0 0 0 0 0 0 0 0 0
Associated 0 0 0 0 0 0 0 0 0 0 0 0 0 0 0 0 0 0 0 0 0 0 0 0 0 0 0 0.120645 0.120645
Comerica 0 0 0 0 0 0 0 0 0 0 0 0 0 0 0 0 0 0 0 0 0 0 0 0 0 0 0 0.045558 0.045558
Signature 0 0 0 0 0 0 0 0 0 0 0 0 0 0 0 0 0 0 0 0 0 0 0 0 0 0 0 0 0
RBS 0 0 0 0 0 0 0 0 0 0 0 0 0 0 0 0 0 0 0 0 0 0 0 0 0 0 0 0.055477 0.055477
Mitsubishi 0.0220393 0.006753 0.006026 0.00388 0.003622 7.89E-04 1.27E-04 5.60E-05 0 0 0 0 6.19E-06 0 0 0 8.51E-07 0 0 0 0 0 0 0 0 0 0.0066288 7.14E-05 0.05Insurance Companies 428.46048 132.2366 109.4624 65.40128 69.90323 16.33803 2.177507 0.950313 0 0 0 0 0.10156 0 0 0 0.013802 0 0 0 0 0 0 0 0 0 0 124.2808 949.326
Non US Banks 2017.8245 118.195 75.00936 41.67195 63.94029 0 0 0 3.8768 2.0005 1.2852 1.175 0 0.5852 0.2355 0.145 0.005853 0.077 0.0635 0.0174 0.0105 0.0075 0.0053 0.003 0 0 138.64672 0 2464.780611Total B 4166.755 1397.546 1028.6498 651.346 457.08984 150.748 22.058 8.897423 3.8768 2.0005 1.28523 1.175 1.036 0.58522 0.2355 0.145 0.1 0.0765 0.0635 0.01739 0.0105 0.0075 0.00527 0.003 0 0 900.465 2350.7709 11144.94899

Contagion table – exp 1 (calibrated) 08 Q4
JPMorgan 100.61 0.00% 0.000 -100% 100.606 0% 100.606 0% 97.650 -3% 100.606 0% 100.606 0% 100.606 0% 100.606 0% 85.981 -15%Citibank 70.98 0.00% -50.136 -171% 0.000 -100% 58.811 -17% 54.075 -24% 70.977 0% 70.977 0% 70.977 0% 70.977 0% 47.131 -34%Bank of America 88.50 0.00% 39.035 -56% 88.504 0% 0.000 -100% 78.280 -12% 88.504 0% 88.504 0% 88.504 0% 88.504 0% 74.150 -16%Goldman Sachs 13.19 0.00% -19.108 -245% 13.190 0% 12.329 -7% 5.493 -58% 13.190 0% 13.190 0% 13.190 0% 13.190 0% 4.674 -65%HSBC 10.81 0.00% 10.808 0% 10.808 0% 10.808 0% 0.000 -100% 10.808 0% 10.808 0% 10.790 0% 10.808 0% 10.808 0%Wachovia 32.71 0.00% 16.909 -48% 32.118 -2% 30.687 -6% 32.709 0% 32.709 0% 32.709 0% 32.709 0% 32.709 0% 29.031 -11%Morgan Stanley 5.80 0.00% -5.469 -194% 2.159 -63% 3.356 -42% -2.545 -144% 0.000 -100% 5.800 0% 5.800 0% 5.800 0% 3.622 -38%Merrill Lynch 4.09 0.00% -0.948 -123% 2.836 -31% 3.042 -26% 1.285 -69% 4.092 0% 4.092 0% 4.092 0% 4.092 0% 3.142 -23%Keybank 8.00 0.00% 8.005 0% 8.005 0% 8.005 0% 8.005 0% 8.005 0% 8.005 0% 8.005 0% 8.005 0% 8.005 0%PNC Bank 8.34 0.00% 8.338 0% 8.338 0% 8.338 0% 8.338 0% 8.338 0% 8.338 0% 8.338 0% 8.338 0% 8.338 0%National City 12.05 0.00% 12.046 0% 12.046 0% 12.046 0% 12.046 0% 12.046 0% 0.000 -100% 12.046 0% 12.046 0% 12.046 0%New York Mellon 11.15 0.00% 11.148 0% 11.148 0% 11.148 0% 11.148 0% 11.148 0% 11.148 0% 11.148 0% 11.148 0% 11.148 0%Wells Fargo 33.07 0.00% 32.552 -2% 32.995 0% 32.996 0% 32.922 0% 33.070 0% 33.070 0% 0.000 -100% 33.070 0% 32.922 0%SunTrust 12.56 0.00% 12.565 0% 12.565 0% 12.565 0% 12.565 0% 12.565 0% 12.565 0% 12.565 0% 12.565 0% 12.565 0%Northern Trust 4.39 0.00% 4.385 0% 4.385 0% 4.385 0% 4.385 0% 4.385 0% 4.385 0% 4.385 0% 4.385 0% 4.385 0%State Street&Trust 13.42 0.00% 13.422 0% 13.422 0% 13.422 0% 13.422 0% 13.422 0% 13.422 0% 13.422 0% 13.422 0% 13.422 0%Deutsche Bank 7.87 0.00% 7.802 -1% 7.859 0% 7.863 0% 7.827 -1% 7.872 0% 7.872 0% 7.872 0% 7.872 0% 7.838 0%Regions 9.64 0.00% 9.640 0% 9.640 0% 9.640 0% 9.640 0% 9.640 0% 9.640 0% 9.640 0% 9.640 0% 9.640 0%U.S. Bank 14.56 0.00% 14.558 0% 14.558 0% 14.558 0% 14.558 0% 14.558 0% 14.558 0% 14.558 0% 14.558 0% 14.558 0%Commerce 1.37 0.00% 1.368 0% 1.368 0% 1.368 0% 1.368 0% 1.368 0% 1.368 0% 1.368 0% 1.368 0% 1.368 0%MERCANTIL 0.54 0.00% 0.538 0% 0.538 0% 0.538 0% 0.538 0% 0.538 0% 0.538 0% 0.538 0% 0.538 0% 0.538 0%Associated 1.58 0.00% 1.577 0% 1.577 0% 1.577 0% 1.577 0% 1.577 0% 1.577 0% 1.577 0% 1.577 0% 1.577 0%Comerica 5.66 0.00% 5.661 0% 5.661 0% 5.661 0% 5.661 0% 5.661 0% 5.661 0% 5.661 0% 0.000 -100% 5.661 0%Signature 0.76 0.00% 0.760 0% 0.760 0% 0.760 0% 0.760 0% 0.760 0% 0.760 0% 0.760 0% 0.760 0% 0.760 0%RBS Citizens 8.47 0.00% 8.468 0% 8.468 0% 8.468 0% 8.468 0% 8.468 0% 8.468 0% 8.468 0% 8.468 0% 8.468 0%Mitsubishi UFJ 0.70 0.00% 0.696 0% 0.696 0% 0.696 0% 0.696 0% 0.696 0% 0.696 0% 0.696 0% 0.696 0% 0.696 0%Insurance Companies 21.00 0.00% 21.000 0% 21.000 0% 21.000 0% 16.012 -24% 21.000 0% 21.000 0% 21.000 0% 21.000 0% 0.000 -100%Aggregate CC 480.80 0.00% 144.619 -70% 404.249 -16% 373.671 -22% 420.870 -12% 475.002 -1% 468.756 -3% 447.713 -7% 475.141 -1% 412.473 -14%
Comerica Insurance CompaniesNet Core Capital (loss CDS Cover - EXP 1)
Original JPMorgan Citibank Bank of America HSBC Morgan Stanley National City Wells Fargo

Contagion when JP Morgan Demises (6 banks fail in first step and crisis spreads to the second step hitting
Wells Fargo and Deutsche Bank)
Financial Contagion – CDS Spreads Correlation calibrated
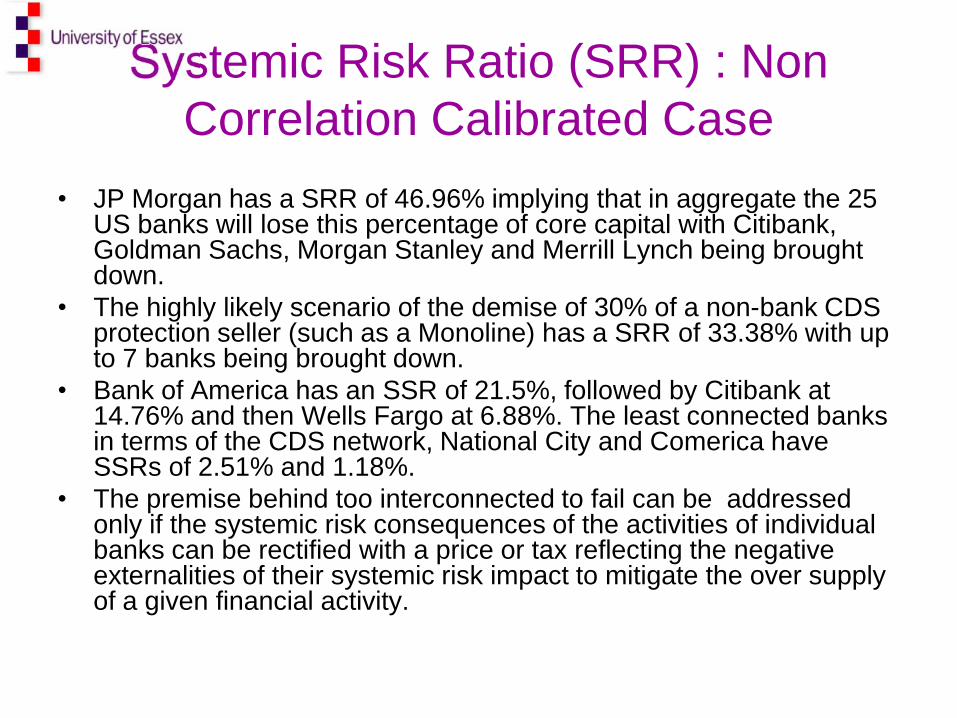
• JP Morgan has a SRR of 46.96% implying that in aggregate the 25 US banks will lose this percentage of core capital with Citibank, Goldman Sachs, Morgan Stanley and Merrill Lynch being brought down.
• The highly likely scenario of the demise of 30% of a non-bank CDS protection seller (such as a Monoline) has a SRR of 33.38% with up to 7 banks being brought down.
• Bank of America has an SSR of 21.5%, followed by Citibank at 14.76% and then Wells Fargo at 6.88%. The least connected banks in terms of the CDS network, National City and Comerica have SSRs of 2.51% and 1.18%.
• The premise behind too interconnected to fail can be addressed only if the systemic risk consequences of the activities of individual banks can be rectified with a price or tax reflecting the negative externalities of their systemic risk impact to mitigate the over supply of a given financial activity.
Systemic Risk Ratio (SRR) : Non Correlation Calibrated Case

• Behavioural change – test carry trade strategies and capital structure arbitrage
• What if questions in 2006 : if Basel II capital relief incentives were disallowed
• Worst case of regulatory failure : concerted effort via VaR and copius micro bank level stress testing led to undercapitalization of banks
• Basel II use of AAA CDS sellers increased leverage by a factor of 65
• Our work finds no evidence that CDS market can deliver AAA cover for bank assets; immediate repeal of Basel II re unfunded CDS cover leading to capital relief
• Super spreader tax and fund recommended over ad hoc breakup of banks
• Further stress tests for robustness of ICE to see if .0013% capital is sufficient
• Can eigenvalue centrality be a good systemic risk proxy for % loss of core capital for the CDS participants from trigger bank?
Ongoing tests and Concluding Remarks

University of Essex, Econ Dept WP Feb 2010 No. 683 Financial Contagion and Systemic Risk in Network Model of CDS and Other Credit Enhancement Obligations of US Banks (pdf version) [Abstract] Simulator link CDS Network Simulator http://www.acefinmod.com/CDS1.html
• David Jones, 2000, Emerging problems with Basel Capital Accord: Regulatory Capital, Journal of Money and Banking.
• Andrew Haldane, 2009, Rethinking Financial Networks, BoE Speech • Adrian, T. and M. Brunnermeier, 2008, “ Co-Var”, Staff Reports no. 348 (New York: Federal Reserve Bank). • Aiken, D, P. Alessandri, B. Eklund, P. Gai, S. Kapdia, E. Martin, N. Mora, G. Sterne and M. Willison, Forthcoming, ”
Funding Liquidity Risk in a Quantitative Model of Systemic Stability ” in Financial Stability, Monetary Policy and Central Banking, Central Bank of Chile Series on Central Banking Analysis and Economic Policies, Vol 14.
• Allen F. and E Carletti (2005) “Credit Risk Transfer and Contagion” Financial Institutions Center Working Papers No. 05-29
• Allen, F. and D Gale (2005) “Systemic Risk and Regulation” Financial Institutions Center Working Papers No. 05-25 • Alentorn, A., Markose S. , Millard S. and Yang J., 2005, “Designing large value payment systems: An agent-based
approach”, Centre For Computational Finance and Economic Agents, Univ. Essex, Mimeo. • Markose, Alentorn, Krause,2004, “Dynamic Networks, Herding and Gurus”, Working Paper, Econ Dept University of
Essex • Nier, E. , J. Yang, T. Yorulmazer and A.. Alentorn, 2007, “Network Models and Financial Stability” , Journal of
Economics Dynamics and Control, Vol 31, No. 6, pp. 2033-60. • Marquiz-Diez-Canedo, J. and S. Martinez-Jaramillo[1], 2007, “Systemic Risk: Stress Testing the Banking System”
Paper presented at the International Conference on Computing in Economics and Finance Second Expert Forum on Advanced Techniques on Stress Testing : Applications for Supervisors, Amsterdam, October 23-24.
• Amadeo Alentorn and Serafin Martinez have a Phd from the Centre for Computational Finance and Economic Agents (CCFEA), University of Essex.
Some References