Embed Size (px)
Citation preview
IntroductionIn the life cycle of a geologic mapping project, a geolo-
gist is likely to use five or more different software packages, such as borehole logging programs (WellCAD, LogPlot), database programs (Microsoft Access, Oracle), GIS programs (ArcGIS), specialized modeling software (RockWorks, Surfer, gOcad, GSI3D), and Web-based tools (Google Maps/Earth, Microsoft Virtual Earth). In addition to these programs, graphics programs, such as Adobe Illustrator, Photoshop, and InDesign, are used for cartographic and production work.
Although there is some overlap in functionality among software packages, there is currently no one-stop solution for geologic mapping. For a given task in the mapping process, one program might be better suited than others. The choice of software is often a matter of personal preference and convenience as well as functionality.
This paper, based on a poster presented at the 2011 DMT Workshop, focuses on the functionality of Esri’s ArcScene for 3D mapping. I discuss techniques for creating and editing 3D boreholes and cross sections using custom tools as well as out-of-the-box functionality in ArcScene 10. Examples from mapping projects at the Illinois State Geological Survey (ISGS) illustrate how these are used in the mapping workflow. The customization of ArcScene with Visual Basic for Applications (VBA) has played a key role in making ArcScene efficient and practical for geologic mapping.
Advantages of ArcScene
• The interactive 3D environment that ArcScene pro-vides is useful for helping us visualize and understand geologic relations in the subsurface.
• The 3D navigation tools are relatively intuitive and easy to use.
• With ArcScene, users can take advantage of existing data storage formats and workflows already developed for ArcGIS without having to convert data.
• Data in a stand-alone Access database can be read or imported with minimal processing.
• Multiple options exist for customizing and automating tasks: Geoprocessor scripting with Python, Add-ins with ArcObjects, and Model Builder.
• Help and information about customization techniques are well documented by Esri and an active user com-munity.
Limitations of ArcScene
• Texture mapping of vertical surfaces, for example drap-ing an image of a cross section on a vertical wall, is problematic. ArcScene still seems to have trouble with vertical surfaces in general.
• When dealing with the large volumes of data often required by geologic mapping, memory can get used up quickly, causing slow performance and hang-ups. The workaround has been to divide data into smaller geographic areas.
• In ArcScene 10, new 3D geoprocessing tools might work for simple multipatches representing buildings, but they tend to crash when 3D geologic volumes are input.
Tools and Techniques for 3D Geologic Mapping in ArcScene: Boreholes, Cross Sections, and Block Diagrams
By Jennifer Carrell
Illinois State Geological Survey Prairie Research Institute
615 E. Peabody Drive Champaign, IL 61801
Telephone: (217) 244-2764 email: [email protected]
From “Digital Mapping Techniques ‘11–12—Workshop Proceedings”U.S. Geological Survey Open-File Report 2014–1167http://pubs.usgs.gov/of/2014/1167/
20 Digital Mapping Techniques ‘11–12
• Anything beyond simple layer-cake modeling requires some level of customization to make the multistep workflows manageable.
• Custom tools developed over the past 4 years with VBA now need to be rewritten because VBA will be not be supported in future releases of ArcGIS.
• There is still no labeling functionality in ArcScene.
• The new out-of-the-box 3D geometry-editing capabili-ties touted by Esri are still limited and do not always work, especially with the vertical surfaces of boreholes and cross sections. Digitizing in 3D space requires you to snap new features to existing data layers; however, you cannot snap to the face of a vertical areal feature such as a cross section wall.
• The geometry of complex multipatches, such as those generated by extruded surfaces, cannot be edited.
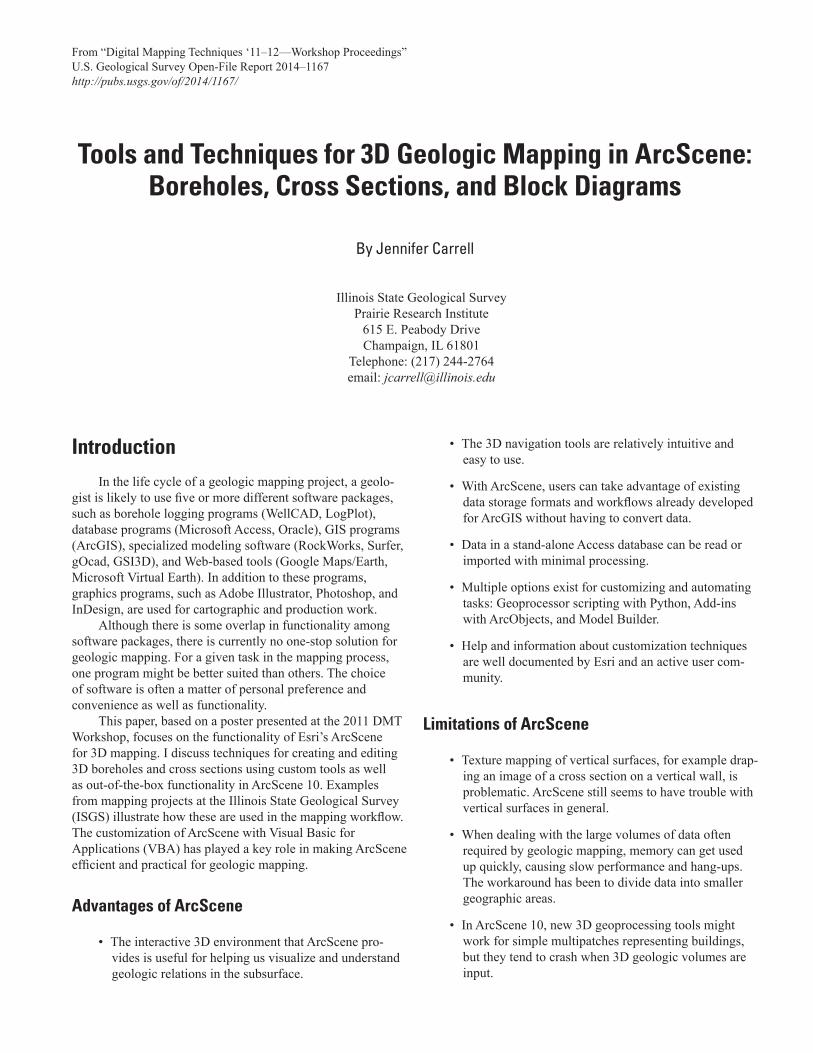
Xacto Section ToolsVisual Basic for Applications (VBA) was used to develop
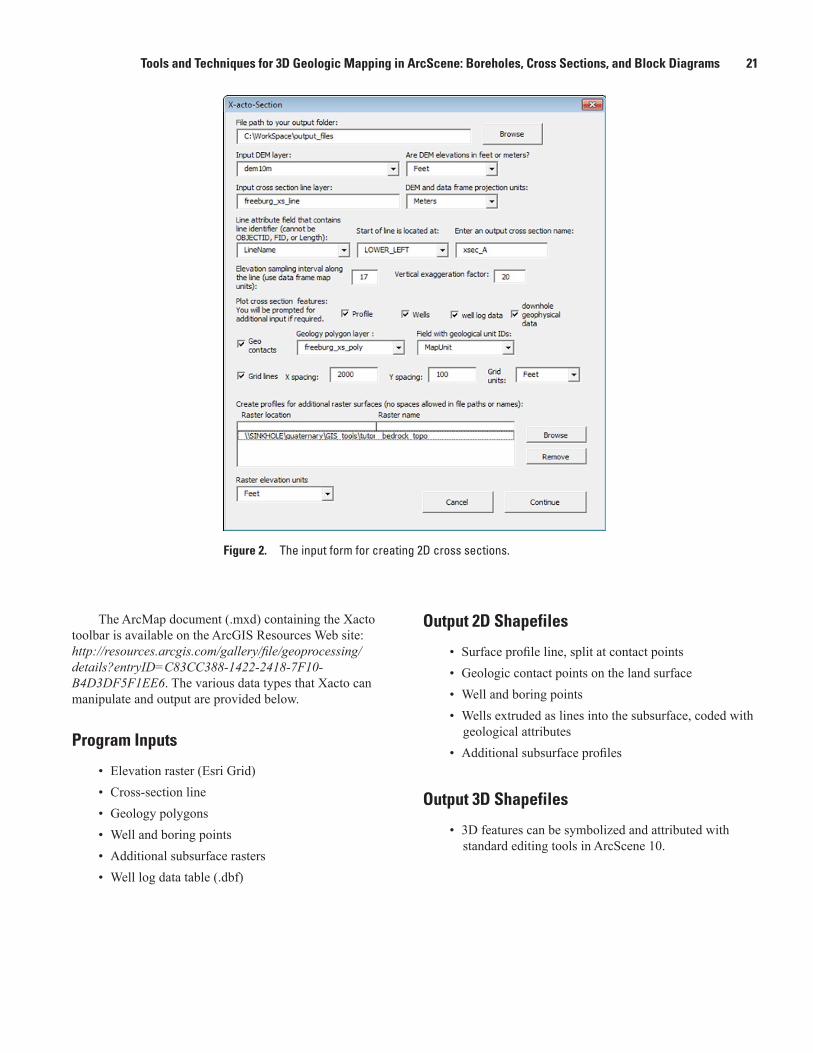
a cross section tool called Xacto Section within ArcMap (figs. 1 and 2). The tool generates a 2D cross-section profile as a collection of polyline and point shapefiles. The shapefiles can be digitally edited in ArcMap and (or) exported to Adobe Illustrator for finishing. Completed cross sections also can be exported as true 3D vector features for viewing and editing in ArcScene (fig. 3). One of the advantages of this program is that the output features have a spatial reference, meaning that, when the map document is set to the desired map scale, the cross-section measurements will always be correct.
In addition to creating cross sections from scratch, the tool can be used in combination with the MaPublisher plug-in for Illustrator to convert legacy cross-section vector graphics into 3D georeferenced shapefiles (fig. 4). In this way simple “spaghetti” graphics can be restored to valuable quantitative geologic data.
Figure 1. The Xacto Section toolbar in an example ArcMap document. The blue line represents a cross section drawn with this tool.
Tools and Techniques for 3D Geologic Mapping in ArcScene: Boreholes, Cross Sections, and Block Diagrams 21
The ArcMap document (.mxd) containing the Xacto toolbar is available on the ArcGIS Resources Web site: http://resources.arcgis.com/gallery/file/geoprocessing/details?entryID=C83CC388-1422-2418-7F10-B4D3DF5F1EE6. The various data types that Xacto can manipulate and output are provided below.
Program Inputs
• Elevation raster (Esri Grid)• Cross-section line• Geology polygons• Well and boring points• Additional subsurface rasters• Well log data table (.dbf)
Output 2D Shapefiles
• Surface profile line, split at contact points• Geologic contact points on the land surface• Well and boring points • Wells extruded as lines into the subsurface, coded with
geological attributes• Additional subsurface profiles
Output 3D Shapefiles
• 3D features can be symbolized and attributed with standard editing tools in ArcScene 10.
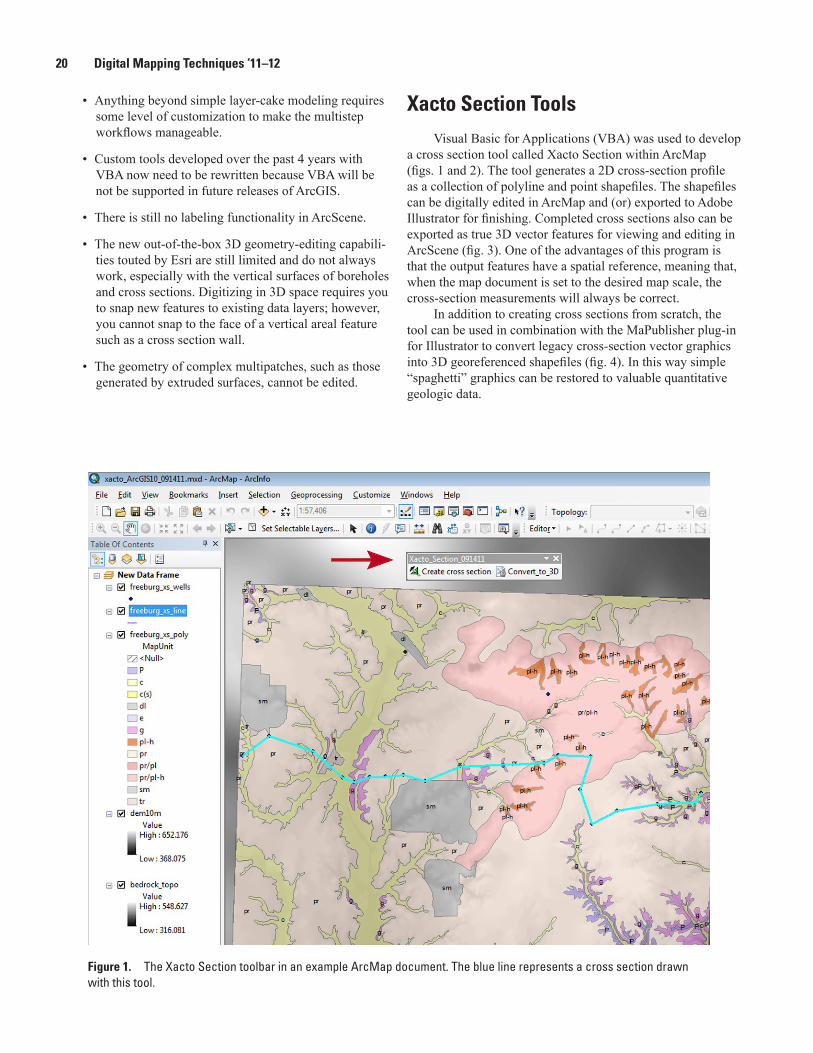
Figure 2. The input form for creating 2D cross sections.
22 Digital Mapping Techniques ‘11–12
Figure 3. The output 2D cross-section profile can be edited in ArcMap and converted into a 3D shapefile for displaying in ArcScene.
Tools and Techniques for 3D Geologic Mapping in ArcScene: Boreholes, Cross Sections, and Block Diagrams 23
3D Borehole ToolsThe ability to view, zoom, rotate, and fly through
borehole data in three dimensions is vital to understanding geological relations in the subsurface. ArcScene provides a relatively easy and familiar interface for these tasks. A limitation, however, has been that prior to ArcGIS 10, editing tools were not available in ArcScene. VBA was used to develop a custom tool bar in ArcScene, called 3D Borehole Tools (fig. 5). The tool bar contains 14 tools that allow the user
to create 3D borehole features from tabular log data, edit the geometry and attributes of those features, and quickly create surfaces from queried borehole intervals (fig. 6). Geophysical log data as .LAS-formatted text files can also be plotted as graphs along corresponding boreholes. The tools are available for download at http://resources.arcgis.com/gallery/file/geoprocessing/details?entryID=3CB0669C-1422-2418-7F29-072DB9AA0AE3. Some of the highlights of the 3D Borehole Tools include the following:
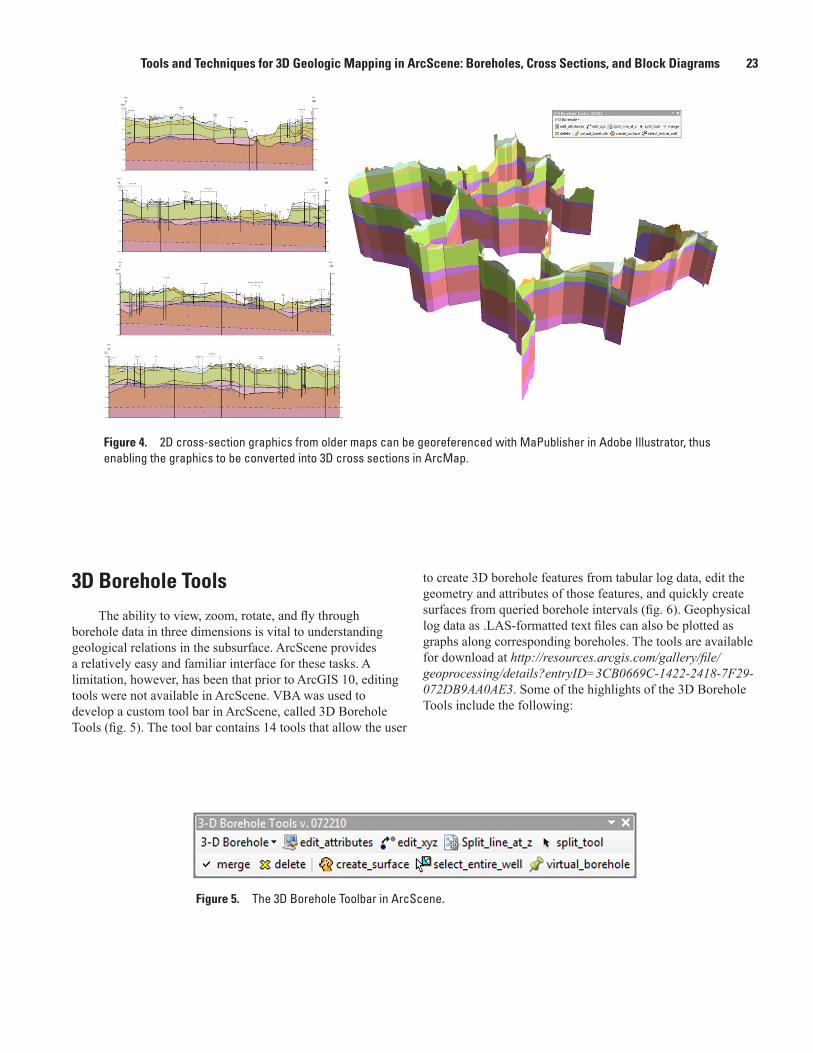
Figure 4. 2D cross-section graphics from older maps can be georeferenced with MaPublisher in Adobe Illustrator, thus enabling the graphics to be converted into 3D cross sections in ArcMap.
Figure 5. The 3D Borehole Toolbar in ArcScene.
24 Digital Mapping Techniques ‘11–12
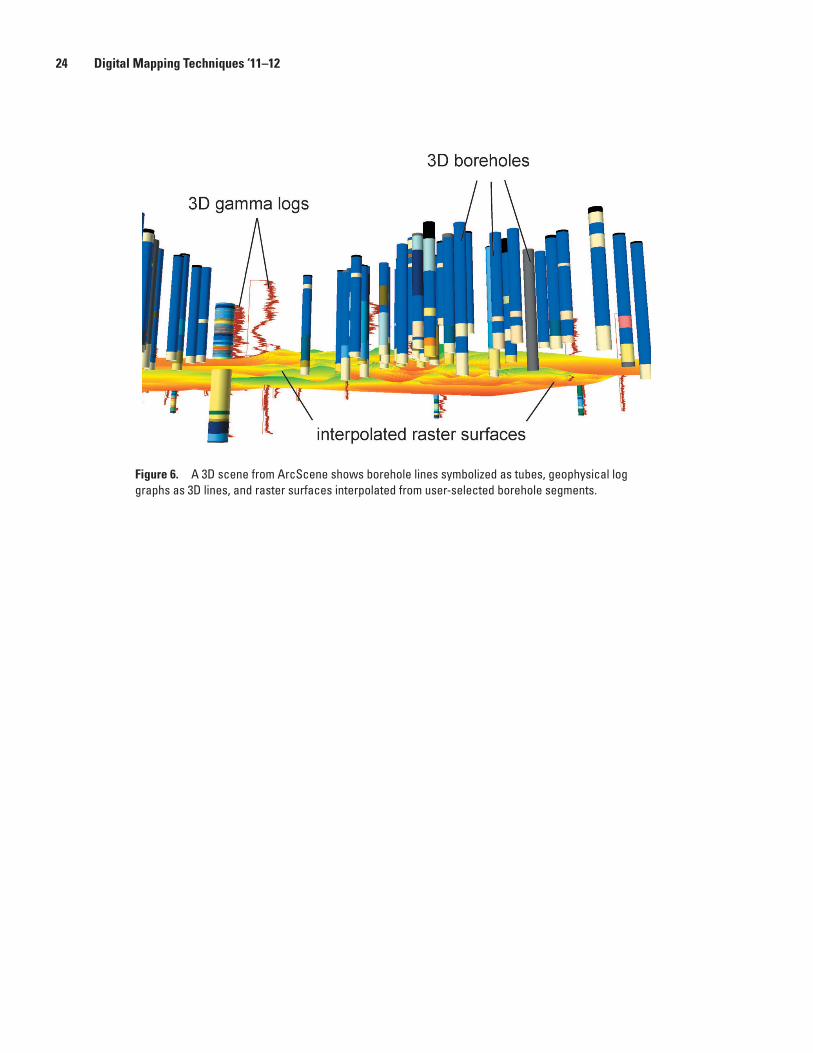
Figure 6. A 3D scene from ArcScene shows borehole lines symbolized as tubes, geophysical log graphs as 3D lines, and raster surfaces interpolated from user-selected borehole segments.
Tools and Techniques for 3D Geologic Mapping in ArcScene: Boreholes, Cross Sections, and Block Diagrams 25
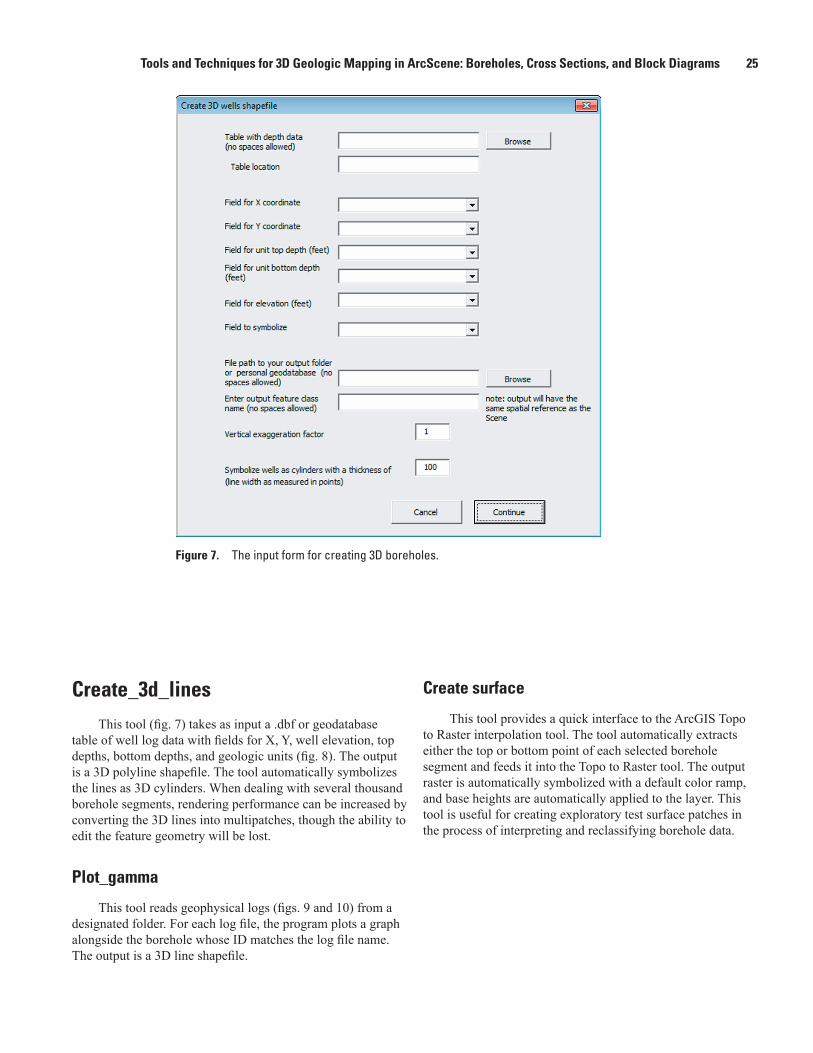
Figure 7. The input form for creating 3D boreholes.
Create_3d_lines This tool (fig. 7) takes as input a .dbf or geodatabase
table of well log data with fields for X, Y, well elevation, top depths, bottom depths, and geologic units (fig. 8). The output is a 3D polyline shapefile. The tool automatically symbolizes the lines as 3D cylinders. When dealing with several thousand borehole segments, rendering performance can be increased by converting the 3D lines into multipatches, though the ability to edit the feature geometry will be lost.
Plot_gamma
This tool reads geophysical logs (figs. 9 and 10) from a designated folder. For each log file, the program plots a graph alongside the borehole whose ID matches the log file name. The output is a 3D line shapefile.
Create surface
This tool provides a quick interface to the ArcGIS Topo to Raster interpolation tool. The tool automatically extracts either the top or bottom point of each selected borehole segment and feeds it into the Topo to Raster tool. The output raster is automatically symbolized with a default color ramp, and base heights are automatically applied to the layer. This tool is useful for creating exploratory test surface patches in the process of interpreting and reclassifying borehole data.
26 Digital Mapping Techniques ‘11–12
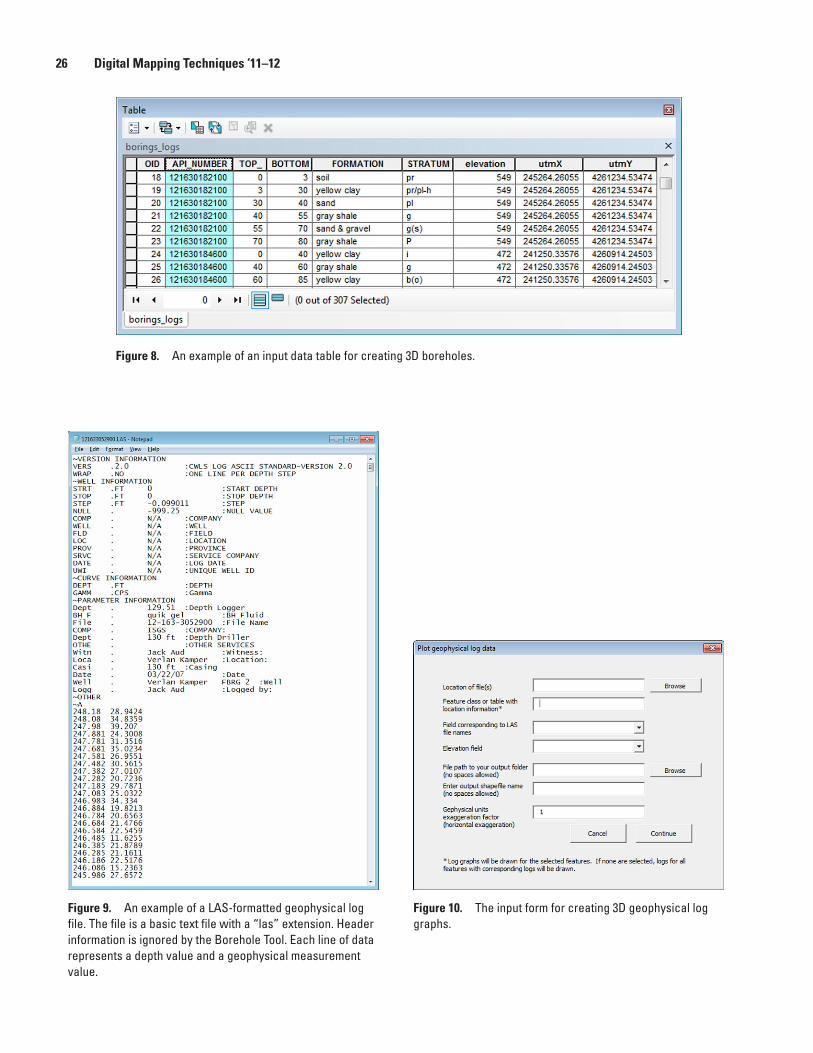
Figure 9. An example of a LAS-formatted geophysical log file. The file is a basic text file with a “las” extension. Header information is ignored by the Borehole Tool. Each line of data represents a depth value and a geophysical measurement value.
Figure 10. The input form for creating 3D geophysical log graphs.
Figure 8. An example of an input data table for creating 3D boreholes.
Tools and Techniques for 3D Geologic Mapping in ArcScene: Boreholes, Cross Sections, and Block Diagrams 27
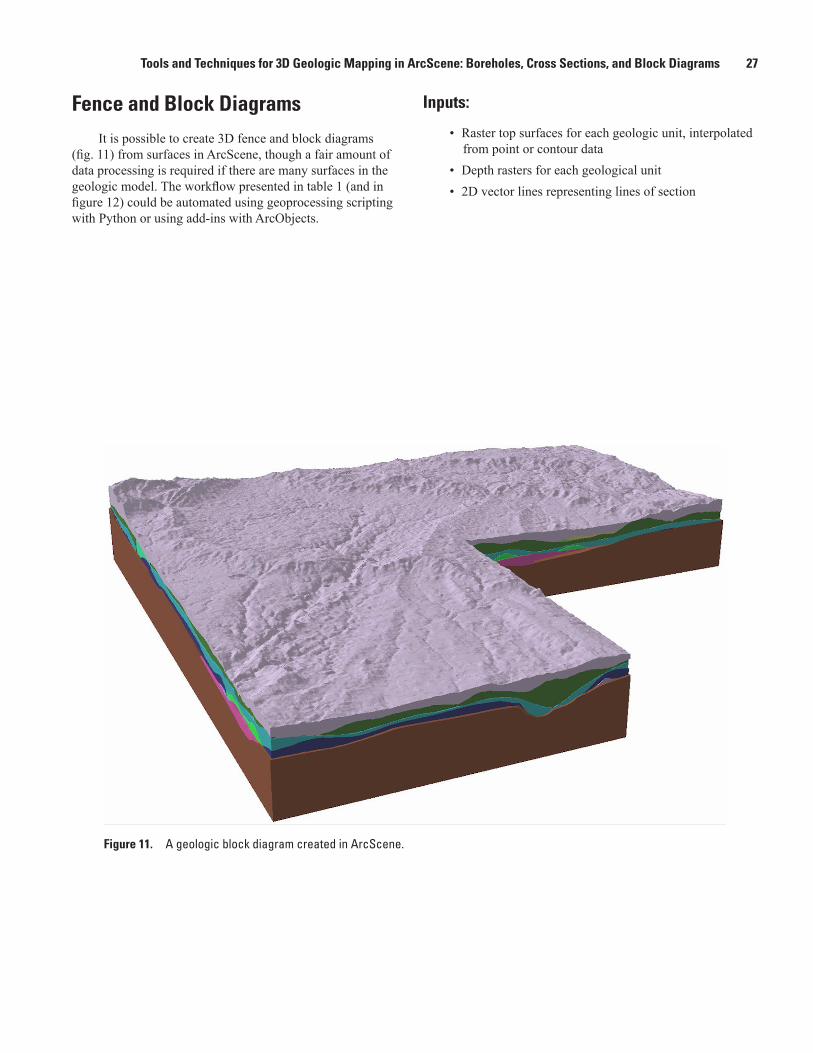
Fence and Block DiagramsIt is possible to create 3D fence and block diagrams
(fig. 11) from surfaces in ArcScene, though a fair amount of data processing is required if there are many surfaces in the geologic model. The workflow presented in table 1 (and in figure 12) could be automated using geoprocessing scripting with Python or using add-ins with ArcObjects.
Inputs:
• Raster top surfaces for each geologic unit, interpolated from point or contour data
• Depth rasters for each geological unit• 2D vector lines representing lines of section
Figure 11. A geologic block diagram created in ArcScene.
28 Digital Mapping Techniques ‘11–12
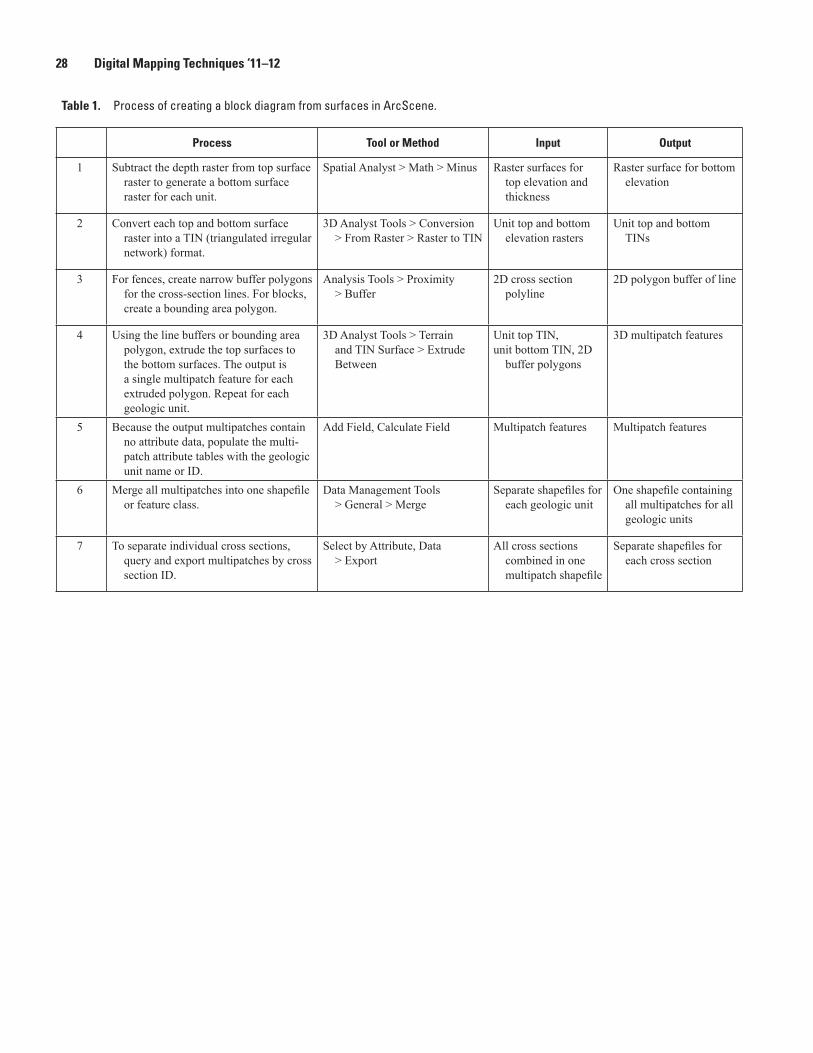
Table 1. Process of creating a block diagram from surfaces in ArcScene.
Process Tool or Method Input Output
1 Subtract the depth raster from top surface raster to generate a bottom surface raster for each unit.
Spatial Analyst > Math > Minus Raster surfaces for top elevation and thickness
Raster surface for bottom elevation
2 Convert each top and bottom surface raster into a TIN (triangulated irregular network) format.
3D Analyst Tools > Conversion > From Raster > Raster to TIN
Unit top and bottom elevation rasters
Unit top and bottom TINs
3 For fences, create narrow buffer polygons for the cross-section lines. For blocks, create a bounding area polygon.
Analysis Tools > Proximity > Buffer
2D cross section polyline
2D polygon buffer of line
4 Using the line buffers or bounding area polygon, extrude the top surfaces to the bottom surfaces. The output is a single multipatch feature for each extruded polygon. Repeat for each geologic unit.
3D Analyst Tools > Terrain and TIN Surface > Extrude Between
Unit top TIN,unit bottom TIN, 2D
buffer polygons
3D multipatch features
5 Because the output multipatches contain no attribute data, populate the multi-patch attribute tables with the geologic unit name or ID.
Add Field, Calculate Field Multipatch features Multipatch features
6 Merge all multipatches into one shapefile or feature class.
Data Management Tools > General > Merge
Separate shapefiles for each geologic unit
One shapefile containing all multipatches for all geologic units
7 To separate individual cross sections, query and export multipatches by cross section ID.
Select by Attribute, Data > Export
All cross sections combined in one multipatch shapefile
Separate shapefiles for each cross section
Tools and Techniques for 3D Geologic Mapping in ArcScene: Boreholes, Cross Sections, and Block Diagrams 29
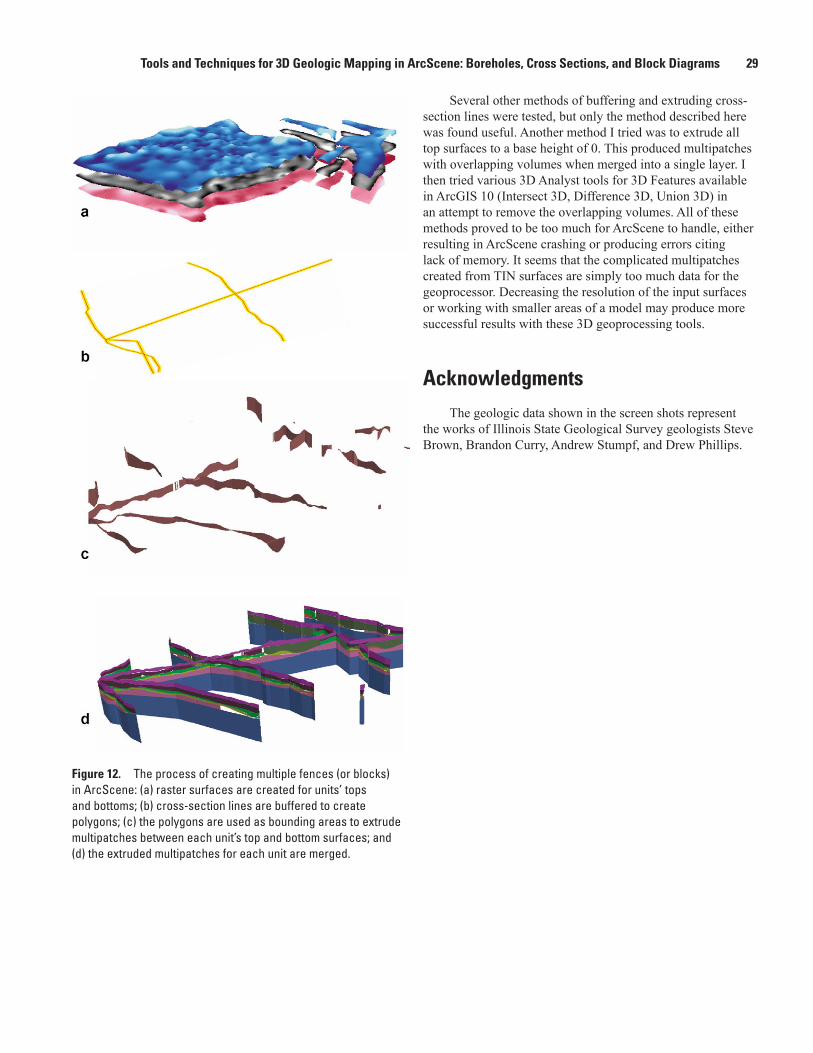
Figure 12. The process of creating multiple fences (or blocks) in ArcScene: (a) raster surfaces are created for units’ tops and bottoms; (b) cross-section lines are buffered to create polygons; (c) the polygons are used as bounding areas to extrude multipatches between each unit’s top and bottom surfaces; and (d) the extruded multipatches for each unit are merged.
Several other methods of buffering and extruding cross-section lines were tested, but only the method described here was found useful. Another method I tried was to extrude all top surfaces to a base height of 0. This produced multipatches with overlapping volumes when merged into a single layer. I then tried various 3D Analyst tools for 3D Features available in ArcGIS 10 (Intersect 3D, Difference 3D, Union 3D) in an attempt to remove the overlapping volumes. All of these methods proved to be too much for ArcScene to handle, either resulting in ArcScene crashing or producing errors citing lack of memory. It seems that the complicated multipatches created from TIN surfaces are simply too much data for the geoprocessor. Decreasing the resolution of the input surfaces or working with smaller areas of a model may produce more successful results with these 3D geoprocessing tools.
AcknowledgmentsThe geologic data shown in the screen shots represent
the works of Illinois State Geological Survey geologists Steve Brown, Brandon Curry, Andrew Stumpf, and Drew Phillips.