Embed Size (px)
Citation preview

Top 50 DRGswith the highest number of discharges in 1998:
Patient, Provider, and Clinical profiles
ST-3 1998
Utah Department of HealthOffice of Health Care Statistics
Box 144004Salt Lake City, Utah 84114-4004
Phone 801.538.7048Fax 801.538.9916


Preface...........................................................................................................................................I
About This Report.....................................................................................................................................II
Acknowledgements........................................................................................................................III
DRG Profile
DRG 391 Normal newborn.............................................................................................................1
DRG 373 Vaginal delivery w/o complicating diagnoses....................................................................................... . 2
DRG 430 Psychoses.......................................................................................................................................3
DRG 390 Neonate with other significant problems......................................................................................4
DRG 371 Cesarean section without complications, comorbidities...........................................5
DRG 209 Major joint & limb reattachment procedures.................................................................................6
DRG 372 Vaginal delivery with complicating diagnoses....................................................................7
DRG 359 Uterine & adnexa procedure for non-malignancy without complications, comorbidities.................8
DRG 89 Simple pneumonia & pleurisy age >17 with complications, comorbidities................................9
DRG 116 Perm cardiac pacemaker implant w/o AMI, heart failure or shock ...................................................... 1 0
DRG 389 Full term neonate with major problems..........................................................................................11
DRG 127 Heart failure & shock........................................................................................................................12
DRG 14 Specific cerebrovascular disorders except transient ischemic attack....................................13
DRG 98 Bronchitis & asthma age 0-17...............................................................................................................14
DRG 143 Chest pain........................................................................................................................................................15
DRG 174 Gastrointestinal hemorrhage w cc ........................................................................................................ 1 6
DRG 374 Vaginal delivery with steril ization &/or dilation & curettage.......................................17
DRG 500 Back and Neck Procs w/o cc................................................................................................................................18
DRG 462 Rehabilitation...............................................................................................................19
DRG 91 Simple pneumonia & pleurisy age 0-17...................................................................................................20
DRG 370 Cesarean section with complications, comorbidities................................................21
DRG 182 Esophagitis, gastroenteritis, & misc digestive disorders age >17 w/c & c.........................22
DRG 167 Appendectomy without complicated principal diagnosis without c & c..............................23
DRG 148 Major small & large bowel procedures with complications, comorbidities......................24
DRG 358 Uterine & adnexa procedure for non-malignancy with complications, comorbidities...............25
DRG 498 Spinal fusion w/o cc ........................................................................................................................ 2 6
DRG 388 Prematurity without major problems.............................................................................27
DRG 435 Alcohol/drug abuse or dependence, detox or other treatment without c & c.................................. ..... ...28
DRG 124 Circulatory disorders except AMI, w/ cardiac catheter & complex diagnoses..................................29
DRG 88 Chronic obstructive pulmonary disease................................................................................................30
DRG 296 Nutritional & miscellaneous metabolic disorders age >17 with c & c...............................31
DRG 383 Other antepartum diagnoses with medical complications..............................................32
DRG 138 Cardiac arrhythmia & conduction disorders with complications, comorbidities..................33
DRG 416 Septicemia age >17.............................................................................................................34
DRG 183 Esophagitis, gastroenteritis, & misc digestive disorders age >17 w/o c & c.....................35
TABLE OF CONTENTS
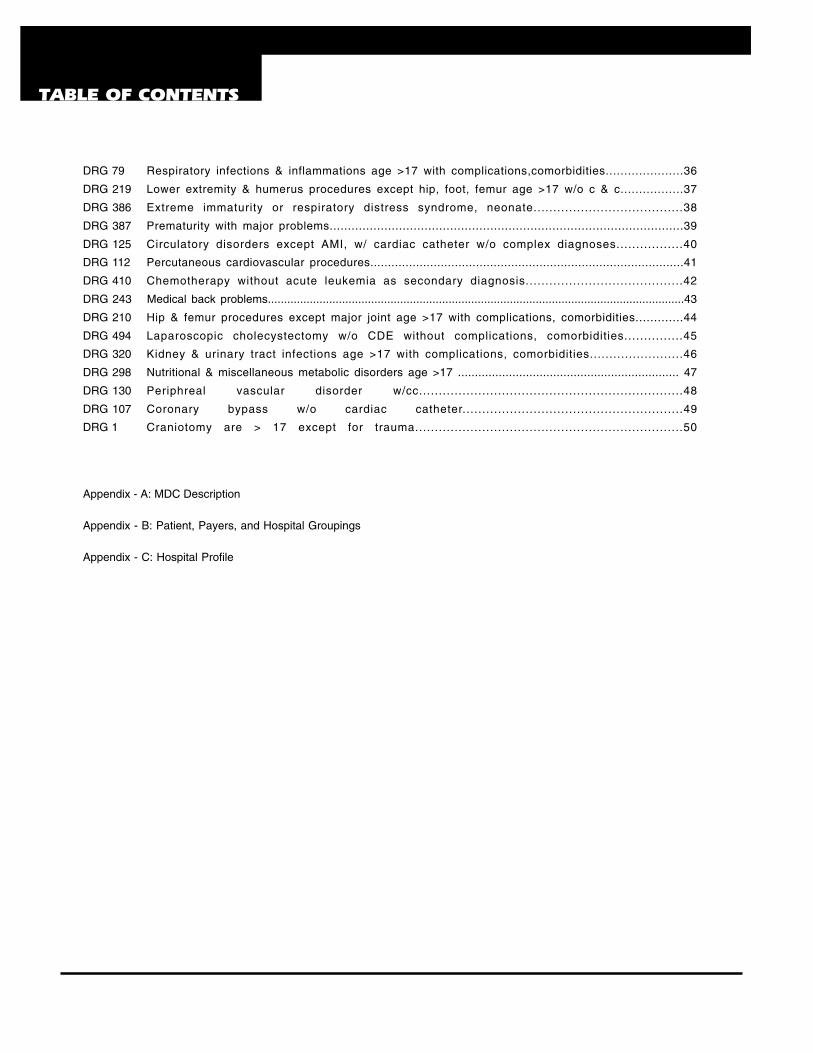
TABLE OF CONTENTS
DRG 79 Respiratory infections & inflammations age >17 with complications,comorbidities.....................36
DRG 219 Lower extremity & humerus procedures except hip, foot, femur age >17 w/o c & c.................37
DRG 386 Extreme immaturity or respiratory distress syndrome, neonate......................................38
DRG 387 Prematurity with major problems.................................................................................................39
DRG 125 Circulatory disorders except AMI, w/ cardiac catheter w/o complex diagnoses.................40
DRG 112 Percutaneous cardiovascular procedures.........................................................................................41
DRG 410 Chemotherapy without acute leukemia as secondary diagnosis........................................42
DRG 243 Medical back problems.................................................................................................................................43
DRG 210 Hip & femur procedures except major joint age >17 with complications, comorbidities.............44
DRG 494 Laparoscopic cholecystectomy w/o CDE without complications, comorbidities...............45
DRG 320 Kidney & urinary tract infections age >17 with complications, comorbidities........................46
DRG 298 Nutritional & miscellaneous metabolic disorders age >17 ................................................................. 47
DRG 130 Periphreal vascular disorder w/cc...................................................................48
DRG 107 Coronary bypass w/o cardiac catheter........................................................49
DRG 1 Craniotomy are > 17 except for trauma....................................................................50
Appendix - A: MDC Description
Appendix - B: Patient, Payers, and Hospital Groupings
Appendix - C: Hospital Profile

PREFACE
This report provides a summary and profile of inpatient hospital use in Utah. These nationally standard-ized categories (Diagnosis Related Groups or DRGs) selected for this profile were those with thehighest patient volume in 1998. DRGs reflect the types of patients hospitals treat and the use of servicesthese patients received. DRGs were developed for reimbursement purposes and have limitations, butthey are a useful means of generally grouping and analyzing hospital utilization.
Hospital use varies by hospital, payer, and patient demographics, influenced by patient, clinical, eco-nomic, and societal factors. Reducing variance caused by system inefficiencies starts with measurementand surveillance of statewide health care use patterns. Such information is useful to those craftingreimbursement, delivery, and program policies of public and private sector health organizations.
The report is derived from the 1998 hospital discharge data base from patient records reported quar-terly to the Office of Health Data Analysis by Utah’s licensed hospitals. The hospital data base is animportant population-based source of morbidity (illness) information and comparative hospital statisticsin Utah. This report and other data products, including interactive data bases, are available on theInternet at www.health data.state.ut.us.
The Utah hospital discharge data base is the only source of all-payer inpatient data. The data basesupports a diverse range of uses, including standard reports such as this one.
I

This report, calculated from the 1998 data, is designed to be a tool for analysis of health care issues. Itprovides the number of discharges of selected DRGs by demographic and geographic characteristics ofpatients, payers, and providers. The objective of this report is based upon the fact that health carereform policies rely heavily on the use of independent, comparable information to drive decision-makingby all parties. The top 50 DRGs presented in this report were selected based on the volume of dis-charges in 1998.
Diagnosis Related Group (DRG) ProfileThe DRGs were developed for the Health Care Financing Administration as a patient classificationscheme which provides a means of relating the types of patients a hospital treats (i.e., its case mix) to thecosts incurred by the hospital. Each discharge in the Hospital Discharge Database was assigned into aDRG based on the principal diagnosis, secondary diagnoses, surgical procedures, age, sex, and dis-charge status of the patient. The tables presented in this report display the information of the top 50DRGs which cover the majority of all discharges occurred in the state of Utah in 1998.
DRG GroupingThe top 50 DRGs included in this report are further assorted into the Major Diagnosis Categories(MDC). The MDC grouping is defined by the body’s major organ system as well as some demo-graphic characteristics and clinical data. The list of MDC descriptions can be found in Appendix A ofthis report.
Analyzing VariablesEach DRG profile displays the volume, costs, and length of stay by patient-, payer-, hospital-relatedcategories. These categories include patient age groups, patient gender, local health district by thepatient’s residence, ICD-9 diagnosis and procedure codes, hospital ownership, hospital affiliation,capacity (the number of beds in service) and location of hospitals, and major health care payers. Fur-ther explanations for these groupings are presented in Appendix B of this report. Information on eachhospital’s ownership, affiliation, bed size, and location is provided in Appendix C.
ABOUT THIS REPORT
II

This report was prepared by the Office of Health Care Statistics under the direction of the Utah Health DataCommittee.
Health Data CommitteeAndrew Bowler, Small BusinessPenny S. Brooke, NursingClark Hinkley, BusinessOrrin T. Colby, Jr., BusinessJ. Michael Dean, PhysicianLori Reichard, ConsumerWen H. Kuo, Public InterestRobert Huefner, Public HealthSandra L. Peck, Consumer AdvocacyGreg Poulsen, Hospital RepresentativeKeith Peterson, HMO RepresentativeMichael J. Stapley, Third Party PayerDennis Tolley, Academic Public Health
ACKNOWLEDGMENTS
III
Health Care Statistics StaffLuis Paita, DirectorRyley Fogg, Programmer Analyst IJohn Morgan, Information Analyst SupervisorChung-Won Lee, Information Analyst IIBill Stinner, Research AnalystJanet Scarlet, Executive SecretaryGulzar Shah, Research ConsultantGreg Stoddard, App Programmer Analyst III
Office of Health Care StatisticsUtah Department of Health288 N 1460 WP.O. Box 144004Salt Lake City, UT 84114-4004Voice: (801) 538-7048Fax: (801) 538-9916Email: [email protected]

MAJOR DIAGNOSTIC CATEGORIES
MDC DESCRIPTIONS
1 Nervous System2 Eye3 Ear, Nose, Mouth & Throat4 Respiratory System5 Circulatory System6 Digestive System7 Hepatobiliary System and Pancreas8 Musculoskeletal System & Connective Tissue9 Skin, Subcutaneous Tissue & Breast10 Endocrine, Nutritional & Metabolic System11 Kidney & Urinary Tract12 Male Reproductive System13 Female Reproductive System14 Pregnancy, Childbirth & the Puerperium15 Newborn & Other Neonates (Perinatal Period)16 Blood and Blood-forming Disorders17 Myeloproliferative DDs (Diff Neoplasms)18 Infectious and Parasitic DDS19 Mental Diseases and Disorders20 Alcohol/Drug Use or Induced Mental Disorders21 Injuries, Poisoning and Toxic Effect of Drugs22 Burn23 Factor Influencing Health Status24 Multiple significant trauma25 Human Immunodeficiency Virus Infection
APPENDIX A

PATIENTS, PAYERS, AND HOSPITALS GROUPINGS
AGE GROUP:0-17, 18-34, 35-44, 45-54, 55-64, 65+. Some DRGs are applicable only to certain agegroups (e.g., DRG 91: simple pneumonia & pleurisy age 0-17). Age groups that are notapplicable to the reported DRG are intentionally left as missing values ( . ).
SEX:Male and Female. This patient-related category is not applicable to some DRGs, such asmaternity services and reproductive system-related diagnosis and procedures.
LOCAL HEALTH DISTRICT:There are twelve local health districts in the state of Utah providing public health services tothe residents in their geographic area. Those public services cover environmental healthservices, child health services, and adult health services. The boundary of each local healthdistrict department is shown in the state map below (the map is taken from the Utah localhealth department’s Internet site). The Aother@ category represents patients from outside Utahand patients who did not provide their residential information.
ICD-9 DIAGNOSIS:Refer to AInternational Classification of Disease (9th Revision): Clinical Modification@ fordescription.
ICD-9 PROCEDURE:Refer to AInternational Classification of Disease (9th Revision): Clinical Modification@ fordescription.
LENGTH OF STAY:Total days stayed in the hospital from the date of admission to the date discharged. If patientwas admitted and discharged in the same day, one-day of stay was assigned to the record.
TOTAL CHARGE:Total dollars amount charged for the discharge (rounded to the nearest dollar).
OWNERSHIP:Government-owned, Not-for-profit, and Investor-owned. A list of hospital profile byownership, affiliation, and location is provided in the Appendix -C: Hospital Profile.
AFFILIATION:Intermountain Health Care, Columbia/HCA, Paracelsus, University of Utah, and Others.
APPENDIX B

BED SIZE:Less than 25, 25-49, 50-99, 100+ (based on the number of beds in service reported by eachhospital).
LOCATION:Urban area includes hospitals located in Weber, Davis, Salt Lake, and Utah counties.Rural area includes hospitals located in the state of Utah but outside the urban counties statedabove, including: Box Elder, Cache, Rich, Morgan, Summit, Tooele, Wasatch, Daggett,Duchesne, Unitah, Juab, Millard, Sanpete, Piute, Wayne, Carbon, Emery, Grand, San Juan,Beaver, Garfield, Iron, Kane, and Washington counties.
PAYERS:Medicare, Medicaid, Other government, Blue Cross/Blue Shield, Other commercial, Managedcare, and Others, including self-pay.
APPENDIX B cont’d

APPENDIX CHOSPITAL PEER GROUPS
*U=Urban, R=Rural**G= Government, I=Investor, N=Not for profitPeer grouping is based on location and case-mix
Peer Hospital Name Case-mix U/R* Owner** Beds
1 LDS Hospital 1.4169 U N 5201 University of Utah Hospital & Clinics 1.5294 U G 4252 Salt Lake Regional Medical 0.9463 U I 2002 St. Mark’s Hospital 1.0589 U I 2762 McKay-Dee Hospital Center 1.0852 U N 4282 Utah Valley Regional Medical Center 1.1267 U N 3953 Davis Hospital 0.678 U I 1263 Cottonwood Hospital Medical Center 0.7132 U N 2133 Mountain View Hospital 0.779 U I 1263 Lakeview Hospital 0.8783 U I 1283 Ogden Regional Medical Center 0.8807 U I 2273 Pioneer Valley Hospital 0.8668 U I 1394 Orem Community Hospital 0.3375 U N 204 Jordan Valley Hospital 0.4899 U I 504 American Fork Hospital 0.4994 U N 724 Alta View Hospital 0.5837 U N 704 Timpanogos Regional Medical Center 0.6225 U I 475 Valley View Medical Center 0.6294 R N 485 Logan Regional Hospital 0.6415 R N 1485 Ashley Valley Medical Center 0.7225 R I 395 Brigham City Community Hospital 0.649 R I 495 Dixie Medical Center 0.8908 R N 1375 Castleview Hospital 0.9002 R I 746 San Juan County Hospital 0.4809 R G 366 Wasatch County Hospital 0.493 R N 406 Fillmore Community Medical Center 0.6006 R N 206 Delta Community Medical Center 0.5286 R N 206 Sanpete Valley Hospital 0.5702 R N 206 Gunnison Valley Hospital 0.4946 R G 216 Milford Valley Memorial Hospital 0.6112 R G 346 Beaver Valley Hospital 0.598 R G 366 Garfield Memorial Hospital 0.6034 R N 446 Central Valley Medical Center 0.5989 R N 316 Kane County Hospital 0.6547 R G 336 Allen Memorial Hospital 0.6801 R G 386 Bear River Valley Hospital 0.5961 R N 206 Uintah Basin Medical Center 0.5633 R G 426 Sevier Valley Hospital 0.7476 R N 426 Tooele Valley Regional Medical Center 0.8519 R G 38N Primary Children’s Medical Center 1.8823 U N 232

Number % of Total0 - 17 32961 100 Mean18 -34 4 0 Standard Deviation35 - 44 . . Median45 - 54 . . Max55 - 64 . . Min65 + 1 0Unknown 3 0 Mean
Number % of Total Standard DeviationMale 16539 50.2 MedianFemale 16427 49.8 75th Percentile
Number % of Total 25th PercentileBear River 2385 7.2Weber-Morgan 3014 9.1 Number % of TotalDavis County 3307 10 Government 2222 6.7Salt Lake County 11719 35.5 Non-for-profit 20094 60.9Summit County 295 0.9 Investor-owned 10006 30.3Tooele County 527 1.6 Number % of TotalUtah County 7216 21.9 IHC 20008 60.7Wasatch County 209 0.6 Columbia 6198 18.8TriCounty (Uinta Basin) 587 1.8 Paracelsus 3808 11.6Central Utah 858 2.6 University of Utah 1189 3.6Southeastern Utah 424 1.3 Other 1766 5.4Southwest Utah 1734 5.3 Number % of TotalOther 694 2.1 Less than 25 1638 5
25 - 49 1904 5.8Number % of Total 50 - 99 4950 15
V3000 28424 86.2 100 + 23830 72.3V3001 4041 12.3 Number % of TotalV3100 193 0.6 Urban 26067 79.17746 133 0.4 Rural 6255 19V3101 127 0.4
V301 34 0.1 Number % of TotalV3900 4 0 Medicare . .76409 2 0 Medicaid 4417 13.47671 2 0 Other Government 1177 3.6
V3600 2 0Blue Cross/Blue Shield 2687 8.2
Other 7 0 Other Commercial 5697 17.3Number % of Total Managed Care 16847 51.1
16013 48.6 Other 2144 6.5640 11110 33.79955 5561 16.99983 96 0.340 47 0.1Other 24 0.1
Note: DRG 391 is under MDC 15 Newborn & Other Neonates (Perin Period)
1998, Utah Hospital Discharge DatabaseUtah Office of Health Care Statistics
Affiliation
Bed Size
Location
Payer Distribution
1,037611
Patient Distribution by HospitalOwnership
Total Charge ($)926
13837
Clinical ProfileTop 10 ICD-9 Diagnosis Code
Top 5 ICD-9 Procedure Code
Charges and Length of StayLength of Stay (Days)
1.7029
-9
Patient ProfileAge
Sex
Local Health District
ST3 1998 Table for DRG 391
DRG 391 : normal newborn Total number of discharges: 32969

Number % of Total0 - 17 1082 3.5 Mean18 -34 27514 88.9 Standard Deviation35 - 44 2333 7.5 Median45 - 54 21 0.1 Max55 - 64 . . Min65 + 2 0Unknown 1 0 Mean
Number % of Total Standard DeviationMale . . MedianFemale 30953 100 75th Percentile
Number % of Total 25th PercentileBear River 2059 6.7Weber-Morgan 2777 9 Number % of TotalDavis County 3119 10.1 Government 2561 8.3Salt Lake County 11256 36.4 Non-for-profit 18561 60Summit County 257 0.8 Investor-owned 9256 29.9Tooele County 479 1.5 Number % of TotalUtah County 6753 21.8 IHC 18496 59.8Wasatch County 161 0.5 Columbia 5685 18.4TriCounty (Uinta Basin) 460 1.5 Paracelsus 3571 11.5Central Utah 729 2.4 University of Utah 1837 5.9Southeastern Utah 492 1.6 Other 1364 4.4Southwest Utah 1692 5.5 Number % of TotalOther 719 2.3 Less than 25 1457 4.7
25 - 49 1607 5.2Number % of Total 50 - 99 4836 15.6
650 6877 22.2 100 + 22478 72.666401 3385 10.9 Number % of Total66331 3034 9.8 Urban 24813 80.266411 2595 8.4 Rural 5565 1866951 1456 4.7
65631 958 3.1 Number % of Total65981 939 3 Medicare 22 0.165421 910 2.9 Medicaid 4127 13.364421 839 2.7 Other Government 1139 3.7
66311 692 2.2Blue Cross/Blue Shield 2568 8.3
Other 9268 29.9 Other Commercial 5399 17.4Number % of Total Managed Care 15816 51.1
736 8131 26.3 Other 1882 6.17569 5976 19.37359 5283 17.17309 2265 7.3734 2217 7.2Other 1961 6.3
Note: DRG 373 is under MDC 14 Pregnancy, Childbirth & Puerperium
1998, Utah Hospital Discharge DatabaseUtah Office of Health Care Statistics
Affiliation
Bed Size
Location
Payer Distribution
3,1972,150
Patient Distribution by HospitalOwnership
Total Charge ($)2,754
92,663
Clinical ProfileTop 10 ICD-9 Diagnosis Code
Top 5 ICD-9 Procedure Code
Charges and Length of StayLength of Stay (Days)
1.702
360
Patient ProfileAge
Sex
Local Health District
ST3 1998 Table for DRG 373
DRG 373 : vaginal delivery w/o complicating diagnoses Total number of discharges: 30953

Number % of Total0 - 17 950 15.8 Mean18 -34 1889 31.4 Standard Deviation35 - 44 1451 24.1 Median45 - 54 881 14.6 Max55 - 64 376 6.2 Min65 + 476 7.9
Number % of Total MeanMale 2673 44.4 Standard DeviationFemale 3350 55.6 Median
Number % of Total 75th PercentileBear River 259 4.3 25th PercentileWeber-Morgan 470 7.8Davis County 435 7.2 Number % of TotalSalt Lake County 2765 45.9 Government 2017 33.5Summit County 29 0.5 Non-for-profit 2565 42.6Tooele County 81 1.3 Investor-owned 1439 23.9Utah County 848 14.1 Number % of TotalWasatch County 31 0.5 IHC 2564 42.6TriCounty (Uinta Basin) 123 2 Columbia 457 7.6Central Utah 147 2.4 Paracelsus 61 1Southeastern Utah 136 2.3 University of Utah 325 5.4Southwest Utah 229 3.8 Other 2616 43.4Other 470 7.8 Number % of Total
Less than 25 1 0Number % of Total 25 - 49 8 0.1
29633 1423 23.6 50 - 99 1941 32.229632 418 6.9 100 + 4071 67.629623 406 6.7 Number % of Total29620 331 5.5 Urban 5562 92.329634 326 5.4 Rural 459 7.62989 267 4.4
29534 240 4 Number % of Total29630 212 3.5 Medicare 961 1629660 204 3.4 Medicaid 497 8.329570 168 2.8 Other Government 889 14.8
Other 2028 33.7Blue Cross/Blue Shield 392 6.5
Number % of Total Other Commercial 1088 18.14085 67.8 Managed Care 1389 23.1
9411 1057 17.5 Other 807 13.49423 167 2.89425 139 2.39427 136 2.3Other 216 3.6
Note: DRG 430 is under MDC 19 Mental Diseases and Disorders1998, Utah Hospital Discharge Database
Utah Office of Health Care Statistics
Affiliation
Bed Size
Location
Payer Distribution
10,3733,493
Patient Distribution by HospitalOwnership
Total Charge ($)8,786
1865,873
Clinical ProfileTop 10 ICD-9 Diagnosis Code
Top 5 ICD-9 Procedure Code
Charges and Length of StayLength of Stay (Days)
9.20.2
6882
0
Patient ProfileAge
Sex
Local Health District
ST3 1998 Table for DRG 430
DRG 430 : psychoses Total number of discharges: 6023

Number % of Total0 - 17 5830 99.9 Mean18 -34 2 0 Standard Deviation35 - 44 1 0 Median45 - 54 . . Max55 - 64 . . Min65 + . .
Number % of Total MeanMale 3061 52.5 Standard DeviationFemale 2771 47.5 Median
Number % of Total 75th PercentileBear River 217 3.7 25th PercentileWeber-Morgan 487 8.3Davis County 575 9.9 Number % of TotalSalt Lake County 2571 44.1 Government 968 16.6Summit County 43 0.7 Non-for-profit 3165 54.3Tooele County 89 1.5 Investor-owned 1650 28.3Utah County 867 14.9 Number % of TotalWasatch County 14 0.2 IHC 3151 54TriCounty (Uinta Basin) 47 0.8 Columbia 950 16.3Central Utah 136 2.3 Paracelsus 700 12Southeastern Utah 197 3.4 University of Utah 881 15.1Southwest Utah 435 7.5 Other 151 2.6Other 155 2.7 Number % of Total
Less than 25 231 4Number % of Total 25 - 49 330 5.7
V3000 4592 78.7 50 - 99 850 14.6V3001 1017 17.4 100 + 4372 757784 62 1.1 Number % of TotalV3100 39 0.7 Urban 4749 81.4V3101 32 0.5 Rural 1034 17.77746 22 0.4
7742 11 0.2 Number % of Total7793 9 0.2 Medicare . .V301 9 0.2 Medicaid 1176 20.27706 5 0.1 Other Government 208 3.6
Other 35 0.6Blue Cross/Blue Shield 428 7.3
Number % of Total Other Commercial 926 15.93233 55.4 Managed Care 2680 45.9
640 1654 28.4 Other 415 7.19955 590 10.1331 93 1.69396 33 0.6Other 143 2.5
Note: DRG 390 is under MDC 15 Newborn & Other Neonates (Perin Period)
1998, Utah Hospital Discharge DatabaseUtah Office of Health Care Statistics
Affiliation
Bed Size
Location
Payer Distribution
1,354679
Patient Distribution by HospitalOwnership
Total Charge ($)1,321
29957
Clinical ProfileTop 10 ICD-9 Diagnosis Code
Top 5 ICD-9 Procedure Code
Charges and Length of StayLength of Stay (Days)
202
340
Patient ProfileAge
Sex
Local Health District
DRG 390 : neonate w other significant problems Total number of discharges: 5833
ST3 1998 Table for DRG 390

Number % of Total0 - 17 97 1.8 Mean18 -34 4639 84.6 Standard Deviation35 - 44 732 13.3 Median45 - 54 15 0.3 Max55 - 64 . . Min65 + . .Unknown 1 0 Mean
Number % of Total Standard DeviationMale . . MedianFemale 5484 100 75th Percentile
Number % of Total 25th PercentileBear River 316 5.8Weber-Morgan 552 10.1 Number % of TotalDavis County 623 11.4 Government 518 9.4Salt Lake County 1936 35.3 Non-for-profit 3130 57.1Summit County 50 0.9 Investor-owned 1750 31.9Tooele County 82 1.5 Number % of TotalUtah County 1031 18.8 IHC 3109 56.7Wasatch County 34 0.6 Columbia 1172 21.4TriCounty (Uinta Basin) 101 1.8 Paracelsus 578 10.5Central Utah 183 3.3 University of Utah 339 6.2Southeastern Utah 86 1.6 Other 286 5.2Southwest Utah 325 5.9 Number % of TotalOther 165 3 Less than 25 286 5.2
25 - 49 296 5.4Number % of Total 50 - 99 722 13.2
65421 1767 32.2 100 + 4094 74.765221 563 10.3 Number % of Total65631 303 5.5 Urban 4375 79.866011 300 5.5 Rural 1023 18.766001 284 5.2
65341 246 4.5 Number % of Total66111 180 3.3 Medicare 5 0.166101 164 3 Medicaid 736 13.464421 112 2 Other Government 215 3.9
65261 78 1.4Blue Cross/Blue Shield 486 8.9
Other 1487 27.1 Other Commercial 968 17.7Number % of Total Managed Care 2796 51
741 5407 98.6 Other 278 5.1740 49 0.9734 11 0.27499 8 0.1744 5 0.1
0 0
Note: DRG 371 is under MDC 14 Pregnancy, Childbirth & Puerperium
1998, Utah Hospital Discharge DatabaseUtah Office of Health Care Statistics
Affiliation
Bed Size
Location
Payer Distribution
5,8154,332
Patient Distribution by HospitalOwnership
Total Charge ($)5,317
374,986
Clinical ProfileTop 10 ICD-9 Diagnosis Code
Top 5 ICD-9 Procedure Code
Charges and Length of StayLength of Stay (Days)
3.303
540
Patient ProfileAge
Sex
Local Health District
DRG 371 : cesarean section w/o cc Total number of discharges: 5484
ST3 1998 Table for DRG 371

Number % of Total0 - 17 13 0.3 Mean18 -34 41 0.9 Standard Deviation35 - 44 133 2.9 Median45 - 54 408 9 Max55 - 64 888 19.7 Min65 + 3032 67.2
Number % of Total MeanMale 1745 38.6 Standard DeviationFemale 2770 61.4 Median
Number % of Total 75th PercentileBear River 250 5.5 25th PercentileWeber-Morgan 476 10.5Davis County 390 8.6 Number % of TotalSalt Lake County 1594 35.3 Government 538 11.9Summit County 30 0.7 Non-for-profit 2109 46.7Tooele County 67 1.5 Investor-owned 1801 39.9Utah County 503 11.1 Number % of TotalWasatch County 38 0.8 IHC 2109 46.7TriCounty (Uinta Basin) 59 1.3 Columbia 1237 27.4Central Utah 192 4.3 Paracelsus 216 4.8Southeastern Utah 119 2.6 University of Utah 407 9Southwest Utah 321 7.1 Other 546 12.1Other 476 10.5 Number % of Total
Less than 25 336 7.4Number % of Total 25 - 49 104 2.3
71536 1023 22.7 50 - 99 320 7.171535 560 12.4 100 + 3688 81.771516 524 11.6 Number % of Total9964 479 10.6 Urban 3804 84.371596 386 8.5 Rural 644 14.371515 302 6.7
82009 264 5.8 Number % of Total71595 192 4.3 Medicare 2621 58.18208 141 3.1 Medicaid 62 1.473342 68 1.5 Other Government 231 5.1
Other 576 12.8Blue Cross/Blue Shield 238 5.3
Number % of Total Other Commercial 433 9.68154 2090 46.3 Managed Care 644 14.38151 1328 29.4 Other 286 6.38152 467 10.38153 368 8.28155 260 5.8
0 0
Note: DRG 209 is under MDC 8 Musculoskeletal System & Conn tissue
1998, Utah Hospital Discharge DatabaseUtah Office of Health Care Statistics
Affiliation
Bed Size
Location
Payer Distribution
19,64814,819
Patient Distribution by HospitalOwnership
Total Charge ($)17,819
9617,007
Clinical ProfileTop 10 ICD-9 Diagnosis Code
Top 5 ICD-9 Procedure Code
Charges and Length of StayLength of Stay (Days)
4.504
350
Patient ProfileAge
Sex
Local Health District
ST3 1998 Table for DRG 209
DRG 209 : major joint & limb reattachment procs Total number of discharges: 4515

Number % of Total0 - 17 44 1 Mean18 -34 1049 25 Standard Deviation35 - 44 1658 39.4 Median45 - 54 954 22.7 Max55 - 64 283 6.7 Min65 + 216 5.1
Number % of Total MeanMale . . Standard DeviationFemale 4204 100 Median
Number % of Total 75th PercentileBear River 258 6.1 25th PercentileWeber-Morgan 482 11.5Davis County 646 15.4 Number % of TotalSalt Lake County 1549 36.8 Government 208 4.9Summit County 40 1 Non-for-profit 2196 52.2Tooele County 88 2.1 Investor-owned 1741 41.4Utah County 409 9.7 Number % of TotalWasatch County 19 0.5 IHC 2185 52TriCounty (Uinta Basin) 96 2.3 Columbia 1158 27.5Central Utah 98 2.3 Paracelsus 583 13.9Southeastern Utah 92 2.2 University of Utah 78 1.9Southwest Utah 259 6.2 Other 200 4.8Other 168 4 Number % of Total
Less than 25 61 1.5Number % of Total 25 - 49 231 5.5
6262 605 14.4 50 - 99 531 12.66170 397 9.4 100 + 3322 792181 263 6.3 Number % of Total6182 259 6.2 Urban 3382 80.42189 216 5.1 Rural 763 18.16183 169 4
220 164 3.9 Number % of Total6202 124 2.9 Medicare 213 5.16253 122 2.9 Medicaid 133 3.26181 118 2.8 Other Government 209 5
Other 1767 42Blue Cross/Blue Shield 496 11.8
Number % of Total Other Commercial 822 19.6684 1706 40.6 Managed Care 2079 49.56859 1402 33.3 Other 252 66851 374 8.96549 137 3.36561 121 2.9Other 242 5.8
Note: DRG 359 is under MDC 13 Female Reproductive System1998, Utah Hospital Discharge Database
Utah Office of Health Care Statistics
Affiliation
Bed Size
Location
Payer Distribution
6,5664,475
Patient Distribution by HospitalOwnership
Total Charge ($)5,730
435,404
Clinical ProfileTop 10 ICD-9 Diagnosis Code
Top 5 ICD-9 Procedure Code
Charges and Length of StayLength of Stay (Days)
2.502
140
Patient ProfileAge
Sex
Local Health District
DRG 359 : uterine & adnexa proc for non-malignancy w/o cc Total number of discharges: 4204
ST3 1998 Table for DRG 359

Number % of Total0 - 17 183 4.4 Mean18 -34 3640 87.2 Standard Deviation35 - 44 347 8.3 Median45 - 54 2 0 Max55 - 64 1 0 Min65 + . .
Number % of Total MeanMale . . Standard DeviationFemale 4173 100 Median
Number % of Total 75th PercentileBear River 298 7.1 25th PercentileWeber-Morgan 289 6.9Davis County 354 8.5 Number % of TotalSalt Lake County 1771 42.4 Government 532 12.7Summit County 47 1.1 Non-for-profit 2432 58.3Tooele County 58 1.4 Investor-owned 1163 27.9Utah County 719 17.2 Number % of TotalWasatch County 27 0.6 IHC 2422 58TriCounty (Uinta Basin) 67 1.6 Columbia 595 14.3Central Utah 98 2.3 Paracelsus 568 13.6Southeastern Utah 87 2.1 University of Utah 434 10.4Southwest Utah 236 5.7 Other 154 3.7Other 122 2.9 Number % of Total
Less than 25 148 3.5Number % of Total 25 - 49 213 5.1
64241 357 8.6 50 - 99 566 13.665921 320 7.7 100 + 3200 76.766331 242 5.8 Number % of Total64291 234 5.6 Urban 3340 8064121 203 4.9 Rural 787 18.966411 195 4.7
66401 185 4.4 Number % of Total64421 173 4.1 Medicare 5 0.165631 138 3.3 Medicaid 708 1766612 138 3.3 Other Government 147 3.5
Other 1988 47.6Blue Cross/Blue Shield 313 7.5
Number % of Total Other Commercial 702 16.8736 862 20.7 Managed Care 2019 48.47569 676 16.2 Other 279 6.77359 600 14.4734 412 9.9721 372 8.9Other 402 9.6
Note: DRG 372 is under MDC 14 Pregnancy, Childbirth & Puerperium
1998, Utah Hospital Discharge DatabaseUtah Office of Health Care Statistics
Affiliation
Bed Size
Location
Payer Distribution
4,0962,541
Patient Distribution by HospitalOwnership
Total Charge ($)3,681
463,238
Clinical ProfileTop 10 ICD-9 Diagnosis Code
Top 5 ICD-9 Procedure Code
Charges and Length of StayLength of Stay (Days)
2.102
420
Patient ProfileAge
Sex
Local Health District
DRG 372 : vaginal delivery w complicating diagnoses Total number of discharges: 4173
ST3 1998 Table for DRG 372

Number % of Total0 - 17 . . Mean18 -34 164 5 Standard Deviation35 - 44 177 5.4 Median45 - 54 267 8.1 Max55 - 64 342 10.4 Min65 + 2327 71
Number % of Total MeanMale 1627 49.6 Standard DeviationFemale 1650 50.4 Median
Number % of Total 75th PercentileBear River 151 4.6 25th PercentileWeber-Morgan 281 8.6Davis County 258 7.9 Number % of TotalSalt Lake County 1240 37.8 Government 451 13.8Summit County 18 0.5 Non-for-profit 1573 48Tooele County 60 1.8 Investor-owned 1219 37.2Utah County 418 12.8 Number % of TotalWasatch County 12 0.4 IHC 1535 46.8TriCounty (Uinta Basin) 119 3.6 Columbia 775 23.6Central Utah 181 5.5 Paracelsus 444 13.5Southeastern Utah 152 4.6 University of Utah 127 3.9Southwest Utah 246 7.5 Other 396 12.1Other 141 4.3 Number % of Total
Less than 25 130 4Number % of Total 25 - 49 382 11.7
486 2593 79.1 50 - 99 384 11.7481 215 6.6 100 + 2347 71.64829 167 5.1 Number % of Total485 76 2.3 Urban 2318 70.74809 63 1.9 Rural 925 28.24822 46 1.4
48239 29 0.9 Number % of Total48231 18 0.5 Medicare 2119 64.75110 18 0.5 Medicaid 114 3.548230 16 0.5 Other Government 188 5.7
Other 36 1.1Blue Cross/Blue Shield 99 3
Number % of Total Other Commercial 221 6.72432 74.2 Managed Care 356 10.9
9921 82 2.5 Other 180 5.59396 69 2.18872 60 1.89394 60 1.8Other 347 10.6
Note: DRG 89 is under MDC 4 Respiratory System1998, Utah Hospital Discharge Database
Utah Office of Health Care Statistics
Affiliation
Bed Size
Location
Payer Distribution
9,0324,034
Patient Distribution by HospitalOwnership
Total Charge ($)7,466
1045,979
Clinical ProfileTop 10 ICD-9 Diagnosis Code
Top 5 ICD-9 Procedure Code
Charges and Length of StayLength of Stay (Days)
4.80.1
445
0
Patient ProfileAge
Sex
Local Health District
DRG 89 : simple pneumonia & pleurisy age >17 w cc Total number of discharges: 3277
ST3 1998 Table for DRG 89

Number % of Total0 - 17 17 0.5 Mean18 -34 27 0.8 Standard Deviation35 - 44 144 4.5 Median45 - 54 475 14.8 Max55 - 64 790 24.6 Min65 + 1756 54.7
Number % of Total MeanMale 2239 69.8 Standard DeviationFemale 970 30.2 Median
Number % of Total 75th PercentileBear River 123 3.8 25th PercentileWeber-Morgan 238 7.4Davis County 211 6.6 Number % of TotalSalt Lake County 1071 33.4 Government 296 9.2Summit County 14 0.4 Non-for-profit 2015 62.8Tooele County 33 1 Investor-owned 898 28Utah County 566 17.6 Number % of TotalWasatch County 33 1 IHC 2015 62.8TriCounty (Uinta Basin) 45 1.4 Columbia 661 20.6Central Utah 159 5 Paracelsus 237 7.4Southeastern Utah 80 2.5 University of Utah 169 5.3Southwest Utah 208 6.5 Other 127 4Other 428 13.3 Number % of Total
Less than 25 . .Number % of Total 25 - 49 . .
41401 1422 44.3 50 - 99 4 0.141041 299 9.3 100 + 3205 99.942781 257 8 Number % of Total41071 244 7.6 Urban 3124 97.441011 207 6.5 Rural 85 2.64260 122 3.8
41402 77 2.4 Number % of Total42731 73 2.3 Medicare 1533 47.842789 57 1.8 Medicaid 50 1.641400 39 1.2 Other Government 206 6.4
Other 412 12.8Blue Cross/Blue Shield 222 6.9
Number % of Total Other Commercial 347 10.83601 1886 58.8 Managed Care 641 203605 534 16.6 Other 210 6.53772 500 15.63602 100 3.13781 46 1.4Other 26 0.8
Note: DRG 116 is under MDC 5 Circulatory System1998, Utah Hospital Discharge Database
Utah Office of Health Care Statistics
Affiliation
Bed Size
Location
Payer Distribution
23,58714,990
Patient Distribution by HospitalOwnership
Total Charge ($)20,428
16718,661
Clinical ProfileTop 10 ICD-9 Diagnosis Code
Top 5 ICD-9 Procedure Code
Charges and Length of StayLength of Stay (Days)
2.902
280
Patient ProfileAge
Sex
Local Health District
DRG 116 : perm cardiac pacemaker implant w/o AMI, heart failure or shock Total number of discharges: 3209
ST3 1998 Table for DRG 116

Number % of Total0 - 17 2861 99.9 Mean18 -34 1 0 Standard Deviation35 - 44 . . Median45 - 54 . . Max55 - 64 1 0 Min65 + . .
Number % of Total MeanMale 1582 55.3 Standard DeviationFemale 1281 44.7 Median
Number % of Total 75th PercentileBear River 104 3.6 25th PercentileWeber-Morgan 234 8.2Davis County 316 11 Number % of TotalSalt Lake County 1167 40.8 Government 322 11.2Summit County 26 0.9 Non-for-profit 1581 55.2Tooele County 55 1.9 Investor-owned 927 32.4Utah County 448 15.6 Number % of TotalWasatch County 8 0.3 IHC 1574 55TriCounty (Uinta Basin) 37 1.3 Columbia 475 16.6Central Utah 68 2.4 Paracelsus 452 15.8Southeastern Utah 148 5.2 University of Utah 263 9.2Southwest Utah 157 5.5 Other 99 3.5Other 95 3.3 Number % of Total
Less than 25 84 2.9Number % of Total 25 - 49 115 4
V3000 1790 62.5 50 - 99 405 14.1V3001 557 19.5 100 + 2226 77.87718 114 4 Number % of Total7708 105 3.7 Urban 2365 82.67746 43 1.5 Rural 465 16.2V3101 26 0.9
7700 20 0.7 Number % of Total7701 17 0.6 Medicare . .7790 17 0.6 Medicaid 575 20.1V3100 17 0.6 Other Government 94 3.3
Other 157 5.5Blue Cross/Blue Shield 229 8
Number % of Total Other Commercial 462 16.11355 47.3 Managed Care 1346 47
640 563 19.7 Other 157 5.5331 218 7.69955 175 6.19604 126 4.4Other 191 6.7
Note: DRG 389 is under MDC 15 Newborn & Other Neonates (Perin Period)
1998, Utah Hospital Discharge DatabaseUtah Office of Health Care Statistics
Affiliation
Bed Size
Location
Payer Distribution
4,9641,102
Patient Distribution by HospitalOwnership
Total Charge ($)4,757
1842,297
Clinical ProfileTop 10 ICD-9 Diagnosis Code
Top 5 ICD-9 Procedure Code
Charges and Length of StayLength of Stay (Days)
3.60.1
3100
0
Patient ProfileAge
Sex
Local Health District
DRG 389 : full term neonate w major problems Total number of discharges: 2863
ST3 1998 Table for DRG 389

Number % of Total0 - 17 19 0.7 Mean18 -34 22 0.8 Standard Deviation35 - 44 54 2 Median45 - 54 101 3.8 Max55 - 64 265 9.9 Min65 + 2221 82.8
Number % of Total MeanMale 1271 47.4 Standard DeviationFemale 1411 52.6 Median
Number % of Total 75th PercentileBear River 125 4.7 25th PercentileWeber-Morgan 303 11.3Davis County 219 8.2 Number % of TotalSalt Lake County 961 35.8 Government 428 16Summit County 6 0.2 Non-for-profit 1312 48.9Tooele County 52 1.9 Investor-owned 920 34.3Utah County 324 12.1 Number % of TotalWasatch County 15 0.6 IHC 1297 48.4TriCounty (Uinta Basin) 76 2.8 Columbia 617 23Central Utah 143 5.3 Paracelsus 301 11.2Southeastern Utah 77 2.9 University of Utah 117 4.4Southwest Utah 232 8.7 Other 350 13Other 149 5.6 Number % of Total
Less than 25 67 2.5Number % of Total 25 - 49 310 11.6
4280 2394 89.3 50 - 99 266 9.939891 108 4 100 + 2017 75.240211 69 2.6 Number % of Total40291 64 2.4 Urban 1980 73.840493 18 0.7 Rural 680 25.44281 8 0.3
40201 6 0.2 Number % of Total40413 5 0.2 Medicare 1980 73.840491 3 0.1 Medicaid 77 2.940411 2 0.1 Other Government 159 5.9
Other 5 0.2Blue Cross/Blue Shield 52 1.9
Number % of Total Other Commercial 137 5.11823 68 Managed Care 163 6.1
8872 178 6.6 Other 114 4.33491 72 2.79904 58 2.29396 46 1.7Other 365 13.6
Note: DRG 127 is under MDC 5 Circulatory System1998, Utah Hospital Discharge Database
Utah Office of Health Care Statistics
Affiliation
Bed Size
Location
Payer Distribution
8,4473,575
Patient Distribution by HospitalOwnership
Total Charge ($)6,920
1105,450
Clinical ProfileTop 10 ICD-9 Diagnosis Code
Top 5 ICD-9 Procedure Code
Charges and Length of StayLength of Stay (Days)
4.60.13.5
2740
Patient ProfileAge
Sex
Local Health District
DRG 127 : heart failure & shock Total number of discharges: 2682
ST3 1998 Table for DRG 127

Number % of Total0 - 17 7 0.3 Mean18 -34 36 1.6 Standard Deviation35 - 44 45 2 Median45 - 54 124 5.4 Max55 - 64 252 11 Min65 + 1817 79.6Unknown 1 0 Mean
Number % of Total Standard DeviationMale 1007 44.1 MedianFemale 1275 55.9 75th Percentile
Number % of Total 25th PercentileBear River 105 4.6Weber-Morgan 236 10.3 Number % of TotalDavis County 215 9.4 Government 261 11.4Salt Lake County 924 40.5 Non-for-profit 1128 49.4Summit County 14 0.6 Investor-owned 876 38.4Tooele County 30 1.3 Number % of TotalUtah County 259 11.3 IHC 1118 49Wasatch County 12 0.5 Columbia 571 25TriCounty (Uinta Basin) 33 1.4 Paracelsus 204 8.9Central Utah 89 3.9 University of Utah 132 5.8Southeastern Utah 50 2.2 Other 257 11.3Southwest Utah 146 6.4 Number % of TotalOther 169 7.4 Less than 25 43 1.9
25 - 49 126 5.5Number % of Total 50 - 99 298 13.1
43491 877 38.4 100 + 1798 78.8436 634 27.8 Number % of Total431 225 9.9 Urban 1840 80.643411 208 9.1 Rural 425 18.643401 75 3.3
43311 62 2.7 Number % of Total4321 55 2.4 Medicare 1566 68.6430 46 2 Medicaid 55 2.443331 24 1.1 Other Government 81 3.5
4329 19 0.8Blue Cross/Blue Shield 64 2.8
Other 57 2.5 Other Commercial 170 7.4Number % of Total Managed Care 207 9.1
1352 59.2 Other 139 6.18703 248 10.98872 121 5.38891 90 3.98841 83 3.6Other 227 9.9
Note: DRG 14 is under MDC 1 Nervous System1998, Utah Hospital Discharge Database
Utah Office of Health Care Statistics
Affiliation
Bed Size
Location
Payer Distribution
10,5444,527
Patient Distribution by HospitalOwnership
Total Charge ($)8,885
1676,785
Clinical ProfileTop 10 ICD-9 Diagnosis Code
Top 5 ICD-9 Procedure Code
Charges and Length of StayLength of Stay (Days)
5.40.1
465
0
Patient ProfileAge
Sex
Local Health District
DRG 14 : specific cerebrovascular disorders except TIA Total number of discharges: 2282
ST3 1998 Table for DRG 14

Number % of Total0 - 17 2132 100 Mean18 -34 . . Standard Deviation35 - 44 . . Median45 - 54 . . Max55 - 64 . . Min65 + . .
Number % of Total MeanMale 1222 57.3 Standard DeviationFemale 910 42.7 Median
Number % of Total 75th PercentileBear River 160 7.5 25th PercentileWeber-Morgan 241 11.3Davis County 186 8.7 Number % of TotalSalt Lake County 741 34.8 Government 106 5Summit County 21 1 Non-for-profit 1697 79.6Tooele County 22 1 Investor-owned 312 14.6Utah County 380 17.8 Number % of TotalWasatch County 13 0.6 IHC 1663 78TriCounty (Uinta Basin) 47 2.2 Columbia 180 8.4Central Utah 95 4.5 Paracelsus 132 6.2Southeastern Utah 56 2.6 University of Utah 2 0.1Southwest Utah 99 4.6 Other 155 7.3Other 71 3.3 Number % of Total
Less than 25 44 2.1Number % of Total 25 - 49 200 9.4
46611 960 45 50 - 99 139 6.546619 422 19.8 100 + 1732 81.249391 410 19.2 Number % of Total49390 180 8.4 Urban 1641 774660 65 3 Rural 474 22.2339 41 1.9
49301 21 1 Number % of Total330 11 0.5 Medicare . .49300 7 0.3 Medicaid 526 24.75191 7 0.3 Other Government 69 3.2
Other 8 0.4Blue Cross/Blue Shield 182 8.5
Number % of Total Other Commercial 344 16.11900 89.1 Managed Care 908 42.6
9394 109 5.1 Other 103 4.8331 68 3.29396 27 1.33142 3 0.1Other 14 0.7
Note: DRG 98 is under MDC 4 Respiratory System1998, Utah Hospital Discharge Database
Utah Office of Health Care Statistics
Affiliation
Bed Size
Location
Payer Distribution
4,8772,167
Patient Distribution by HospitalOwnership
Total Charge ($)3,979
663,251
Clinical ProfileTop 10 ICD-9 Diagnosis Code
Top 5 ICD-9 Procedure Code
Charges and Length of StayLength of Stay (Days)
302
250
Patient ProfileAge
Sex
Local Health District
ST3 1998 Table for DRG 98
DRG 98 : bronchitis & asthma age 0-17 Total number of discharges: 2132

Number % of Total0 - 17 1 0.1 Mean18 -34 56 3 Standard Deviation35 - 44 217 11.4 Median45 - 54 403 21.2 Max55 - 64 392 20.7 Min65 + 828 43.6Unknown 1 0.1 Mean
Number % of Total Standard DeviationMale 929 48.9 MedianFemale 969 51.1 75th Percentile
Number % of Total 25th PercentileBear River 89 4.7Weber-Morgan 132 7 Number % of TotalDavis County 159 8.4 Government 240 12.6Salt Lake County 815 42.9 Non-for-profit 952 50.2Summit County 14 0.7 Investor-owned 662 34.9Tooele County 34 1.8 Number % of TotalUtah County 248 13.1 IHC 945 49.8Wasatch County 6 0.3 Columbia 497 26.2TriCounty (Uinta Basin) 49 2.6 Paracelsus 165 8.7Central Utah 79 4.2 University of Utah 65 3.4Southeastern Utah 31 1.6 Other 226 11.9Southwest Utah 125 6.6 Number % of TotalOther 117 6.2 Less than 25 30 1.6
25 - 49 127 6.7Number % of Total 50 - 99 193 10.2
78650 1103 58.1 100 + 1504 79.278659 671 35.4 Number % of Total78651 97 5.1 Urban 1471 77.5V717 27 1.4 Rural 383 20.2
. .
. . Number % of Total
. . Medicare 699 36.8
. . Medicaid 63 3.3
. . Other Government 154 8.1
. .Blue Cross/Blue Shield 108 5.7
0 0 Other Commercial 272 14.3Number % of Total Managed Care 420 22.1
1304 68.7 Other 182 9.68944 201 10.68941 106 5.69205 60 3.28872 46 2.4Other 65 3.4
Note: DRG 143 is under MDC 5 Circulatory System1998, Utah Hospital Discharge Database
Utah Office of Health Care Statistics
Affiliation
Bed Size
Location
Payer Distribution
4,7802,554
Patient Distribution by HospitalOwnership
Total Charge ($)3,950
523,531
Clinical ProfileTop 10 ICD-9 Diagnosis Code
Top 5 ICD-9 Procedure Code
Charges and Length of StayLength of Stay (Days)
1.401
110
Patient ProfileAge
Sex
Local Health District
DRG 143 : chest pain Total number of discharges: 1898
ST3 1998 Table for DRG 143

Number % of Total0 - 17 17 0.9 Mean18 -34 65 3.5 Standard Deviation35 - 44 137 7.4 Median45 - 54 189 10.2 Max55 - 64 204 11 Min65 + 1247 67.1
Number % of Total MeanMale 1019 54.8 Standard DeviationFemale 840 45.2 Median
Number % of Total 75th PercentileBear River 94 5.1 25th PercentileWeber-Morgan 178 9.6Davis County 149 8 Number % of TotalSalt Lake County 755 40.6 Government 250 13.4Summit County 10 0.5 Non-for-profit 935 50.3Tooele County 38 2 Investor-owned 666 35.8Utah County 173 9.3 Number % of TotalWasatch County 10 0.5 IHC 930 50TriCounty (Uinta Basin) 52 2.8 Columbia 457 24.6Central Utah 78 4.2 Paracelsus 209 11.2Southeastern Utah 58 3.1 University of Utah 87 4.7Southwest Utah 156 8.4 Other 176 9.5Other 108 5.8 Number % of Total
Less than 25 23 1.2Number % of Total 25 - 49 144 7.7
5789 365 19.6 50 - 99 179 9.653100 237 12.7 100 + 1505 8153140 197 10.6 Number % of Total53200 193 10.4 Urban 1411 75.953240 143 7.7 Rural 440 23.756212 133 7.2
5781 112 6 Number % of Total5307 88 4.7 Medicare 1120 60.253541 46 2.5 Medicaid 67 3.656985 44 2.4 Other Government 132 7.1
Other 301 16.2Blue Cross/Blue Shield 73 3.9
Number % of Total Other Commercial 136 7.34513 360 19.4 Managed Care 196 10.54516 343 18.5 Other 135 7.34443 338 18.29904 233 12.5
213 11.5Other 163 8.8
Note: DRG 174 is under MDC 6 Digestive System1998, Utah Hospital Discharge Database
Utah Office of Health Care Statistics
Affiliation
Bed Size
Location
Payer Distribution
8,2723,640
Patient Distribution by HospitalOwnership
Total Charge ($)7,141
1725,326
Clinical ProfileTop 10 ICD-9 Diagnosis Code
Top 5 ICD-9 Procedure Code
Charges and Length of StayLength of Stay (Days)
3.70.1
362
0
Patient ProfileAge
Sex
Local Health District
ST3 1998 Table for DRG 174
DRG 174 : gastrointestinal hemorrhage w cc Total number of discharges: 1859

Number % of Total0 - 17 6 0.3 Mean18 -34 1336 74.6 Standard Deviation35 - 44 449 25.1 Median45 - 54 1 0.1 Max55 - 64 . . Min65 + . .
Number % of Total MeanMale . . Standard DeviationFemale 1792 100 Median
Number % of Total 75th PercentileBear River 124 6.9 25th PercentileWeber-Morgan 234 13.1Davis County 206 11.5 Number % of TotalSalt Lake County 672 37.5 Government 180 10Summit County 11 0.6 Non-for-profit 1014 56.6Tooele County 46 2.6 Investor-owned 568 31.7Utah County 238 13.3 Number % of TotalWasatch County 11 0.6 IHC 1009 56.3TriCounty (Uinta Basin) 36 2 Columbia 293 16.4Central Utah 47 2.6 Paracelsus 275 15.3Southeastern Utah 17 0.9 University of Utah 122 6.8Southwest Utah 84 4.7 Other 93 5.2Other 66 3.7 Number % of Total
Less than 25 73 4.1Number % of Total 25 - 49 93 5.2
650 354 19.8 50 - 99 257 14.366331 172 9.6 100 + 1339 74.766401 167 9.3 Number % of Total65421 85 4.7 Urban 1423 79.466411 85 4.7 Rural 339 18.966951 63 3.5
64421 55 3.1 Number % of Total65631 50 2.8 Medicare 1 0.165981 46 2.6 Medicaid 266 14.866131 42 2.3 Other Government 57 3.2
Other 673 37.6Blue Cross/Blue Shield 160 8.9
Number % of Total Other Commercial 309 17.26632 1072 59.8 Managed Care 917 51.26639 377 21 Other 82 4.66902 91 5.16629 63 3.56952 41 2.3Other 43 2.4
Note: DRG 374 is under MDC 14 Pregnancy, Childbirth & Puerperium
1998, Utah Hospital Discharge DatabaseUtah Office of Health Care Statistics
Affiliation
Bed Size
Location
Payer Distribution
4,2993,091
Patient Distribution by HospitalOwnership
Total Charge ($)3,943
623,632
Clinical ProfileTop 10 ICD-9 Diagnosis Code
Top 5 ICD-9 Procedure Code
Charges and Length of StayLength of Stay (Days)
20.1
263
0
Patient ProfileAge
Sex
Local Health District
DRG 374 : vaginal delivery w sterilization &/or D&C Total number of discharges: 1792
ST3 1998 Table for DRG 374

Number % of Total0 - 17 6 0.4 Mean18 -34 302 18 Standard Deviation35 - 44 402 23.9 Median45 - 54 320 19 Max55 - 64 256 15.2 Min65 + 395 23.5
Number % of Total MeanMale 982 58.4 Standard DeviationFemale 698 41.5 Median
Number % of Total 75th PercentileBear River 58 3.5 25th PercentileWeber-Morgan 131 7.8Davis County 140 8.3 Number % of TotalSalt Lake County 585 34.8 Government 145 8.6Summit County 22 1.3 Non-for-profit 1092 65Tooele County 29 1.7 Investor-owned 407 24.2Utah County 301 17.9 Number % of TotalWasatch County 9 0.5 IHC 1092 65TriCounty (Uinta Basin) 18 1.1 Columbia 345 20.5Central Utah 83 4.9 Paracelsus 54 3.2Southeastern Utah 48 2.9 University of Utah 122 7.3Southwest Utah 119 7.1 Other 68 4Other 138 8.2 Number % of Total
Less than 25 13 0.8Number % of Total 25 - 49 18 1.1
72210 1154 68.6 50 - 99 26 1.572402 276 16.4 100 + 1587 94.472273 32 1.9 Number % of Total7213 28 1.7 Urban 1587 94.47220 21 1.2 Rural 57 3.472252 21 1.2
72740 13 0.8 Number % of Total72211 12 0.7 Medicare 340 20.272293 12 0.7 Medicaid 38 2.37210 11 0.7 Other Government 73 4.3
Other 101 6Blue Cross/Blue Shield 179 10.6
Number % of Total Other Commercial 257 15.38051 1266 75.3 Managed Care 537 31.9309 373 22.2 Other 257 15.3353 12 0.7393 9 0.58050 9 0.5
0 0
Note: DRG 500 is under MDC 8 Musculoskeletal System & Conn tissue
1998, Utah Hospital Discharge DatabaseUtah Office of Health Care Statistics
Affiliation
Bed Size
Location
Payer Distribution
7,5304,371
Patient Distribution by HospitalOwnership
Total Charge ($)6,395
765,618
Clinical ProfileTop 10 ICD-9 Diagnosis Code
Top 5 ICD-9 Procedure Code
Charges and Length of StayLength of Stay (Days)
2.302
100
Patient ProfileAge
Sex
Local Health District
DRG 500 : back & neck procs w/o cc Total number of discharges: 1681
ST3 1998 Table for DRG 500

Number % of Total0 - 17 113 6.8 Mean18 -34 205 12.4 Standard Deviation35 - 44 104 6.3 Median45 - 54 148 8.9 Max55 - 64 169 10.2 Min65 + 919 55.4
Number % of Total MeanMale 879 53 Standard DeviationFemale 779 47 Median
Number % of Total 75th PercentileBear River 61 3.7 25th PercentileWeber-Morgan 178 10.7Davis County 95 5.7 Number % of TotalSalt Lake County 576 34.7 Government 434 26.2Summit County 14 0.8 Non-for-profit 782 47.2Tooele County 37 2.2 Investor-owned 442 26.7Utah County 226 13.6 Number % of TotalWasatch County 8 0.5 IHC 782 47.2TriCounty (Uinta Basin) 28 1.7 Columbia 185 11.2Central Utah 67 4 Paracelsus 255 15.4Southeastern Utah 126 7.6 University of Utah 386 23.3Southwest Utah 37 2.2 Other 50 3Other 205 12.4 Number % of Total
Less than 25 9 0.5Number % of Total 25 - 49 7 0.4
V5789 1480 89.3 50 - 99 115 6.9V571 165 10 100 + 1527 92.1V579 11 0.7 Number % of TotalV5721 2 0.1 Urban 1529 92.2
. . Rural 129 7.8
. .
. . Number % of Total
. . Medicare 838 50.5
. . Medicaid 69 4.2
. . Other Government 62 3.7
0 0Blue Cross/Blue Shield 75 4.5
Number % of Total Other Commercial 275 16.6904 54.5 Managed Care 254 15.3
9339 213 12.8 Other 85 5.19383 172 10.49338 83 59312 23 1.4Other 177 10.7
Note: DRG 462 is under MDC 23 Factors Influencing Health Status1998, Utah Hospital Discharge Database
Utah Office of Health Care Statistics
Affiliation
Bed Size
Location
Payer Distribution
27,8206,640
Patient Distribution by HospitalOwnership
Total Charge ($)22,211
67913,364
Clinical ProfileTop 10 ICD-9 Diagnosis Code
Top 5 ICD-9 Procedure Code
Charges and Length of StayLength of Stay (Days)
15.60.411
1540
Patient ProfileAge
Sex
Local Health District
DRG 462 : rehabilitation Total number of discharges: 1658
ST3 1998 Table for DRG 462

Number % of Total0 - 17 545 34.4 Mean18 -34 753 47.5 Standard Deviation35 - 44 159 10 Median45 - 54 81 5.1 Max55 - 64 24 1.5 Min65 + 24 1.5
Number % of Total MeanMale 881 55.5 Standard DeviationFemale 705 44.5 Median
Number % of Total 75th PercentileBear River 162 10.2 25th PercentileWeber-Morgan 76 4.8Davis County 112 7.1 Number % of TotalSalt Lake County 600 37.8 Government 120 7.6Summit County 23 1.5 Non-for-profit 1104 69.6Tooele County 29 1.8 Investor-owned 338 21.3Utah County 302 19 Number % of TotalWasatch County 11 0.7 IHC 1095 69TriCounty (Uinta Basin) 39 2.5 Columbia 229 14.4Central Utah 62 3.9 Paracelsus 109 6.9Southeastern Utah 11 0.7 University of Utah 51 3.2Southwest Utah 80 5 Other 102 6.4Other 79 5 Number % of Total
Less than 25 72 4.5Number % of Total 25 - 49 118 7.4
5409 1301 82 50 - 99 213 13.478903 70 4.4 100 + 1159 73.1541 47 3 Number % of Total5430 40 2.5 Urban 1155 72.82892 37 2.3 Rural 407 25.75439 23 1.5
542 21 1.3 Number % of Total78900 7 0.4 Medicare 20 1.378909 7 0.4 Medicaid 79 55589 5 0.3 Other Government 72 4.5
Other 28 1.8Blue Cross/Blue Shield 201 12.7
Number % of Total Other Commercial 314 19.84709 1177 74.2 Managed Care 691 43.64701 406 25.6 Other 209 13.24541 1 0.14799 1 0.1544 1 0.1
0 0
Note: DRG 167 is under MDC 6 Digestive System1998, Utah Hospital Discharge Database
Utah Office of Health Care Statistics
Affiliation
Bed Size
Location
Payer Distribution
5,2122,929
Patient Distribution by HospitalOwnership
Total Charge ($)4,346
513,937
Clinical ProfileTop 10 ICD-9 Diagnosis Code
Top 5 ICD-9 Procedure Code
Charges and Length of StayLength of Stay (Days)
1.501
120
Patient ProfileAge
Sex
Local Health District
DRG 167 : appendectomy w/o complicated principal diagnosis w/o cc Total number of discharges: 1586
ST3 1998 Table for DRG 167

Number % of Total0 - 17 47 3 Mean18 -34 1276 80.5 Standard Deviation35 - 44 260 16.4 Median45 - 54 3 0.2 Max55 - 64 . . Min65 + . .
Number % of Total MeanMale . . Standard DeviationFemale 1586 100 Median
Number % of Total 75th PercentileBear River 53 3.3 25th PercentileWeber-Morgan 104 6.6Davis County 142 9 Number % of TotalSalt Lake County 693 43.7 Government 262 16.5Summit County 20 1.3 Non-for-profit 916 57.8Tooele County 25 1.6 Investor-owned 402 25.3Utah County 211 13.3 Number % of TotalWasatch County 19 1.2 IHC 912 57.5TriCounty (Uinta Basin) 28 1.8 Columbia 207 13.1Central Utah 53 3.3 Paracelsus 195 12.3Southeastern Utah 30 1.9 University of Utah 217 13.7Southwest Utah 139 8.8 Other 55 3.5Other 69 4.4 Number % of Total
Less than 25 73 4.6Number % of Total 25 - 49 91 5.7
65421 336 21.2 50 - 99 131 8.365221 103 6.5 100 + 1285 8165631 99 6.2 Number % of Total64421 93 5.9 Urban 1276 80.566011 88 5.5 Rural 304 19.266001 73 4.6
65341 67 4.2 Number % of Total66111 64 4 Medicare 5 0.364121 53 3.3 Medicaid 339 21.464251 47 3 Other Government 72 4.5
Other 563 35.5Blue Cross/Blue Shield 109 6.9
Number % of Total Other Commercial 255 16.1741 1531 96.5 Managed Care 715 45.1740 35 2.2 Other 91 5.7744 13 0.87499 4 0.37301 1 0.1
0 0
Note: DRG 370 is under MDC 14 Pregnancy, Childbirth & Puerperium
1998, Utah Hospital Discharge DatabaseUtah Office of Health Care Statistics
Affiliation
Bed Size
Location
Payer Distribution
7,6934,715
Patient Distribution by HospitalOwnership
Total Charge ($)7,361
1515,762
Clinical ProfileTop 10 ICD-9 Diagnosis Code
Top 5 ICD-9 Procedure Code
Charges and Length of StayLength of Stay (Days)
4.40.1
356
0
Patient ProfileAge
Sex
Local Health District
DRG 370 : cesarean section w cc Total number of discharges: 1586
ST3 1998 Table for DRG 370

Number % of Total0 - 17 1563 99.9 Mean18 -34 1 0.1 Standard Deviation35 - 44 . . Median45 - 54 . . Max55 - 64 . . Min65 + . .
Number % of Total MeanMale 847 54.2 Standard DeviationFemale 717 45.8 Median
Number % of Total 75th PercentileBear River 119 7.6 25th PercentileWeber-Morgan 174 11.1Davis County 84 5.4 Number % of TotalSalt Lake County 341 21.8 Government 177 11.3Summit County 10 0.6 Non-for-profit 1059 67.7Tooele County 17 1.1 Investor-owned 308 19.7Utah County 338 21.6 Number % of TotalWasatch County 6 0.4 IHC 1030 65.9TriCounty (Uinta Basin) 100 6.4 Columbia 213 13.6Central Utah 118 7.5 Paracelsus 95 6.1Southeastern Utah 88 5.6 University of Utah 4 0.3Southwest Utah 93 5.9 Other 222 14.2Other 76 4.9 Number % of Total
Less than 25 84 5.4Number % of Total 25 - 49 265 16.9
486 829 53 50 - 99 153 9.84801 282 18 100 + 1042 66.64809 230 14.7 Number % of Total4829 72 4.6 Urban 974 62.3485 54 3.5 Rural 570 36.4481 42 2.7
4830 16 1 Number % of Total4870 10 0.6 Medicare 1 0.148239 5 0.3 Medicaid 391 254831 5 0.3 Other Government 66 4.2
Other 19 1.2Blue Cross/Blue Shield 153 9.8
Number % of Total Other Commercial 273 17.51367 87.4 Managed Care 609 38.9
9394 52 3.3 Other 71 4.59396 38 2.4331 36 2.33491 9 0.6Other 29 1.9
Note: DRG 91 is under MDC 4 Respiratory System1998, Utah Hospital Discharge Database
Utah Office of Health Care Statistics
Affiliation
Bed Size
Location
Payer Distribution
5,1982,337
Patient Distribution by HospitalOwnership
Total Charge ($)4,506
1253,455
Clinical ProfileTop 10 ICD-9 Diagnosis Code
Top 5 ICD-9 Procedure Code
Charges and Length of StayLength of Stay (Days)
3.10.1
346
0
Patient ProfileAge
Sex
Local Health District
DRG 91 : simple pneumonia & pleurisy age 0-17 Total number of discharges: 1564
ST3 1998 Table for DRG 91

Number % of Total0 - 17 . . Mean18 -34 190 12.3 Standard Deviation35 - 44 191 12.4 Median45 - 54 212 13.8 Max55 - 64 191 12.4 Min65 + 757 49.1
Number % of Total MeanMale 563 36.5 Standard DeviationFemale 978 63.5 Median
Number % of Total 75th PercentileBear River 106 6.9 25th PercentileWeber-Morgan 127 8.2Davis County 118 7.7 Number % of TotalSalt Lake County 579 37.6 Government 274 17.8Summit County 12 0.8 Non-for-profit 796 51.7Tooele County 28 1.8 Investor-owned 456 29.6Utah County 148 9.6 Number % of TotalWasatch County 3 0.2 IHC 775 50.3TriCounty (Uinta Basin) 48 3.1 Columbia 331 21.5Central Utah 88 5.7 Paracelsus 124 8Southeastern Utah 52 3.4 University of Utah 94 6.1Southwest Utah 135 8.8 Other 217 14.1Other 97 6.3 Number % of Total
Less than 25 68 4.4Number % of Total 25 - 49 184 11.9
56211 203 13.2 50 - 99 133 8.65589 138 9 100 + 1141 7488 100 6.5 Number % of Total845 93 6 Urban 1058 68.778701 86 5.6 Rural 468 30.478909 65 4.2
5640 62 4 Number % of Total53081 56 3.6 Medicare 721 46.853019 48 3.1 Medicaid 74 4.878900 43 2.8 Other Government 96 6.2
Other 647 42Blue Cross/Blue Shield 102 6.6
Number % of Total Other Commercial 143 9.3938 60.9 Managed Care 285 18.5
4516 111 7.2 Other 120 7.84513 65 4.24525 58 3.84523 30 1.9Other 233 15.1
Note: DRG 182 is under MDC 6 Digestive System1998, Utah Hospital Discharge Database
Utah Office of Health Care Statistics
Affiliation
Bed Size
Location
Payer Distribution
6,3302,507
Patient Distribution by HospitalOwnership
Total Charge ($)5,332
1574,146
Clinical ProfileTop 10 ICD-9 Diagnosis Code
Top 5 ICD-9 Procedure Code
Charges and Length of StayLength of Stay (Days)
3.40.1
353
0
Patient ProfileAge
Sex
Local Health District
DRG 182 : esophagitis, gastroent, & misc digestive disorders age >17 w cc Total number of discharges: 1541
ST3 1998 Table for DRG 182

Number % of Total0 - 17 80 5.2 Mean18 -34 98 6.4 Standard Deviation35 - 44 131 8.6 Median45 - 54 204 13.3 Max55 - 64 239 15.6 Min65 + 778 50.8
Number % of Total MeanMale 712 46.5 Standard DeviationFemale 818 53.5 Median
Number % of Total 75th PercentileBear River 111 7.3 25th PercentileWeber-Morgan 169 11Davis County 134 8.8 Number % of TotalSalt Lake County 536 35 Government 227 14.8Summit County 12 0.8 Non-for-profit 839 54.8Tooele County 30 2 Investor-owned 450 29.4Utah County 162 10.6 Number % of TotalWasatch County 9 0.6 IHC 839 54.8TriCounty (Uinta Basin) 34 2.2 Columbia 321 21Central Utah 50 3.3 Paracelsus 129 8.4Southeastern Utah 37 2.4 University of Utah 171 11.2Southwest Utah 92 6 Other 70 4.6Other 154 10.1 Number % of Total
Less than 25 9 0.6Number % of Total 25 - 49 66 4.3
56211 146 9.5 50 - 99 108 7.156081 92 6 100 + 1333 87.11533 85 5.6 Number % of Total1534 78 5.1 Urban 1232 80.55570 64 4.2 Rural 284 18.61536 61 4
V553 46 3 Number % of Total56983 42 2.7 Medicare 685 44.85602 39 2.5 Medicaid 50 3.356210 34 2.2 Other Government 74 4.8
Other 843 55.1Blue Cross/Blue Shield 124 8.1
Number % of Total Other Commercial 193 12.64573 307 20.1 Managed Care 329 21.54576 298 19.5 Other 75 4.94562 265 17.34575 122 84579 77 5Other 244 15.9
Note: DRG 148 is under MDC 6 Digestive System1998, Utah Hospital Discharge Database
Utah Office of Health Care Statistics
Affiliation
Bed Size
Location
Payer Distribution
25,56611,900
Patient Distribution by HospitalOwnership
Total Charge ($)22,966
57716,790
Clinical ProfileTop 10 ICD-9 Diagnosis Code
Top 5 ICD-9 Procedure Code
Charges and Length of StayLength of Stay (Days)
10.20.2
886
0
Patient ProfileAge
Sex
Local Health District
DRG 148 : major small & large bowel procs w cc Total number of discharges: 1530
ST3 1998 Table for DRG 148

Number % of Total0 - 17 19 1.3 Mean18 -34 283 18.9 Standard Deviation35 - 44 557 37.2 Median45 - 54 445 29.7 Max55 - 64 83 5.5 Min65 + 109 7.3
Number % of Total MeanMale . . Standard DeviationFemale 1496 100 Median
Number % of Total 75th PercentileBear River 77 5.1 25th PercentileWeber-Morgan 152 10.2Davis County 200 13.4 Number % of TotalSalt Lake County 607 40.6 Government 122 8.2Summit County 14 0.9 Non-for-profit 926 61.9Tooele County 19 1.3 Investor-owned 438 29.3Utah County 139 9.3 Number % of TotalWasatch County 7 0.5 IHC 922 61.6TriCounty (Uinta Basin) 27 1.8 Columbia 265 17.7Central Utah 22 1.5 Paracelsus 173 11.6Southeastern Utah 36 2.4 University of Utah 92 6.1Southwest Utah 119 8 Other 44 2.9Other 77 5.1 Number % of Total
Less than 25 20 1.3Number % of Total 25 - 49 48 3.2
6262 314 21 50 - 99 151 10.16170 125 8.4 100 + 1267 84.72181 115 7.7 Number % of Total2189 91 6.1 Urban 1215 81.26182 80 5.3 Rural 271 18.1220 63 4.2
6183 59 3.9 Number % of Total2180 44 2.9 Medicare 116 7.86202 42 2.8 Medicaid 61 4.12182 38 2.5 Other Government 69 4.6
Other 525 35.1Blue Cross/Blue Shield 164 11
Number % of Total Other Commercial 309 20.7684 757 50.6 Managed Care 688 466859 382 25.5 Other 89 5.96851 122 8.26549 46 3.16561 39 2.6Other 67 4.5
Note: DRG 358 is under MDC 13 Female Reproductive System1998, Utah Hospital Discharge Database
Utah Office of Health Care Statistics
Affiliation
Bed Size
Location
Payer Distribution
8,2085,137
Patient Distribution by HospitalOwnership
Total Charge ($)7,194
956,398
Clinical ProfileTop 10 ICD-9 Diagnosis Code
Top 5 ICD-9 Procedure Code
Charges and Length of StayLength of Stay (Days)
3.303
250
Patient ProfileAge
Sex
Local Health District
DRG 358 : uterine & adnexa proc for non-malignancy w cc Total number of discharges: 1496
ST3 1998 Table for DRG 358

Number % of Total0 - 17 52 3.6 Mean18 -34 176 12.3 Standard Deviation35 - 44 403 28.2 Median45 - 54 386 27 Max55 - 64 238 16.7 Min65 + 174 12.2
Number % of Total MeanMale 707 49.5 Standard DeviationFemale 722 50.5 Median
Number % of Total 75th PercentileBear River 56 3.9 25th PercentileWeber-Morgan 99 6.9Davis County 106 7.4 Number % of TotalSalt Lake County 401 28.1 Government 130 9.1Summit County 14 1 Non-for-profit 986 69Tooele County 8 0.6 Investor-owned 270 18.9Utah County 354 24.8 Number % of TotalWasatch County 16 1.1 IHC 986 69TriCounty (Uinta Basin) 13 0.9 Columbia 251 17.6Central Utah 90 6.3 Paracelsus 18 1.3Southeastern Utah 69 4.8 University of Utah 117 8.2Southwest Utah 70 4.9 Other 57 4Other 133 9.3 Number % of Total
Less than 25 1 0.1Number % of Total 25 - 49 . .
7220 506 35.4 50 - 99 4 0.372210 236 16.5 100 + 1381 96.67210 90 6.3 Number % of Total72252 74 5.2 Urban 1376 96.372402 54 3.8 Rural 10 0.772271 48 3.4
7384 47 3.3 Number % of Total7213 44 3.1 Medicare 191 13.475612 34 2.4 Medicaid 35 2.473730 33 2.3 Other Government 71 5
Other 263 18.4Blue Cross/Blue Shield 147 10.3
Number % of Total Other Commercial 297 20.88102 735 51.4 Managed Care 486 348108 243 17 Other 202 14.18107 181 12.78106 104 7.38109 55 3.8Other 5 0.3
Note: DRG 498 is under MDC 8 Musculoskeletal System & Conn tissue
1998, Utah Hospital Discharge DatabaseUtah Office of Health Care Statistics
Affiliation
Bed Size
Location
Payer Distribution
16,9127,612
Patient Distribution by HospitalOwnership
Total Charge ($)13,285
19012,000
Clinical ProfileTop 10 ICD-9 Diagnosis Code
Top 5 ICD-9 Procedure Code
Charges and Length of StayLength of Stay (Days)
2.602
140
Patient ProfileAge
Sex
Local Health District
DRG 498 : 498 Total number of discharges: 1429
ST3 1998 Table for DRG 498

Number % of Total0 - 17 1417 100 Mean18 -34 . . Standard Deviation35 - 44 . . Median45 - 54 . . Max55 - 64 . . Min65 + . .
Number % of Total MeanMale 721 50.9 Standard DeviationFemale 696 49.1 Median
Number % of Total 75th PercentileBear River 89 6.3 25th PercentileWeber-Morgan 68 4.8Davis County 113 8 Number % of TotalSalt Lake County 583 41.1 Government 190 13.4Summit County 15 1.1 Non-for-profit 931 65.7Tooele County 18 1.3 Investor-owned 282 19.9Utah County 292 20.6 Number % of TotalWasatch County 7 0.5 IHC 929 65.6TriCounty (Uinta Basin) 11 0.8 Columbia 184 13Central Utah 32 2.3 Paracelsus 98 6.9Southeastern Utah 15 1.1 University of Utah 178 12.6Southwest Utah 115 8.1 Other 28 2Other 59 4.2 Number % of Total
Less than 25 29 2Number % of Total 25 - 49 47 3.3
V3000 885 62.5 50 - 99 213 15V3001 228 16.1 100 + 1114 78.6V3101 136 9.6 Number % of TotalV3100 106 7.5 Urban 1147 80.976518 10 0.7 Rural 256 18.1V3401 10 0.7
76517 9 0.6 Number % of Total76516 7 0.5 Medicare . .7793 6 0.4 Medicaid 255 1876519 5 0.4 Other Government 59 4.2
Other 15 1.1Blue Cross/Blue Shield 112 7.9
Number % of Total Other Commercial 232 16.4786 55.5 Managed Care 668 47.1
640 293 20.7 Other 91 6.49955 228 16.19983 41 2.9331 10 0.7Other 29 2
Note: DRG 388 is under MDC 15 Newborn & Other Neonates (Perin Period)
1998, Utah Hospital Discharge DatabaseUtah Office of Health Care Statistics
Affiliation
Bed Size
Location
Payer Distribution
2,605910
Patient Distribution by HospitalOwnership
Total Charge ($)3,460
1591,263
Clinical ProfileTop 10 ICD-9 Diagnosis Code
Top 5 ICD-9 Procedure Code
Charges and Length of StayLength of Stay (Days)
40.1
236
0
Patient ProfileAge
Sex
Local Health District
DRG 388 : prematurity w/o major problems Total number of discharges: 1417
ST3 1998 Table for DRG 388

Number % of Total0 - 17 85 6 Mean18 -34 439 31.1 Standard Deviation35 - 44 523 37 Median45 - 54 227 16.1 Max55 - 64 86 6.1 Min65 + 52 3.7
Number % of Total MeanMale 945 66.9 Standard DeviationFemale 467 33.1 Median
Number % of Total 75th PercentileBear River 44 3.1 25th PercentileWeber-Morgan 201 14.2Davis County 126 8.9 Number % of TotalSalt Lake County 652 46.2 Government 367 26Summit County 14 1 Non-for-profit 456 32.3Tooele County 28 2 Investor-owned 588 41.6Utah County 155 11 Number % of TotalWasatch County 13 0.9 IHC 454 32.2TriCounty (Uinta Basin) 17 1.2 Columbia 243 17.2Central Utah 18 1.3 Paracelsus 11 0.8Southeastern Utah 14 1 University of Utah 11 0.8Southwest Utah 26 1.8 Other 693 49.1Other 104 7.4 Number % of Total
Less than 25 3 0.2Number % of Total 25 - 49 79 5.6
30391 218 15.4 50 - 99 428 30.329181 163 11.5 100 + 901 63.830390 156 11 Number % of Total30401 93 6.6 Urban 1336 94.62920 88 6.2 Rural 75 5.330301 64 4.5
30400 50 3.5 Number % of Total30421 38 2.7 Medicare 107 7.630480 38 2.7 Medicaid 63 4.530500 35 2.5 Other Government 182 12.9
Other 469 33.2Blue Cross/Blue Shield 69 4.9
Number % of Total Other Commercial 312 22.1578 40.9 Managed Care 314 22.2
9462 348 24.6 Other 365 25.89465 232 16.49411 119 8.49468 82 5.8Other 24 1.7
Note: DRG 435 is under MDC 20 Alcohol/Drug Use or Induced Mental Dis
1998, Utah Hospital Discharge DatabaseUtah Office of Health Care Statistics
Affiliation
Bed Size
Location
Payer Distribution
5,7052,136
Patient Distribution by HospitalOwnership
Total Charge ($)4,780
1203,400
Clinical ProfileTop 10 ICD-9 Diagnosis Code
Top 5 ICD-9 Procedure Code
Charges and Length of StayLength of Stay (Days)
5.40.3
3245
0
Patient ProfileAge
Sex
Local Health District
DRG 435 : alc/drug abuse or dependence, detox or other sympt treat w/o cc Total number of discharges: 1412
ST3 1998 Table for DRG 435

Number % of Total0 - 17 7 0.6 Mean18 -34 29 2.3 Standard Deviation35 - 44 53 4.3 Median45 - 54 188 15.1 Max55 - 64 277 22.3 Min65 + 688 55.4
Number % of Total MeanMale 788 63.4 Standard DeviationFemale 454 36.6 Median
Number % of Total 75th PercentileBear River 77 6.2 25th PercentileWeber-Morgan 96 7.7Davis County 114 9.2 Number % of TotalSalt Lake County 465 37.4 Government 244 19.6Summit County 8 0.6 Non-for-profit 584 47Tooele County 17 1.4 Investor-owned 414 33.3Utah County 84 6.8 Number % of TotalWasatch County 3 0.2 IHC 584 47TriCounty (Uinta Basin) 17 1.4 Columbia 225 18.1Central Utah 23 1.9 Paracelsus 189 15.2Southeastern Utah 23 1.9 University of Utah 133 10.7Southwest Utah 113 9.1 Other 111 8.9Other 202 16.3 Number % of Total
Less than 25 . .Number % of Total 25 - 49 . .
41401 591 47.6 50 - 99 . .4280 219 17.6 100 + 1242 1004111 52 4.2 Number % of Total41400 46 3.7 Urban 1055 84.941402 33 2.7 Rural 187 15.14254 31 2.5
4271 19 1.5 Number % of Total4148 18 1.4 Medicare 608 494241 15 1.2 Medicaid 28 2.342731 15 1.2 Other Government 144 11.6
Other 203 16.3Blue Cross/Blue Shield 70 5.6
Number % of Total Other Commercial 110 8.93722 700 56.4 Managed Care 210 16.93723 396 31.9 Other 72 5.83721 90 7.28856 34 2.7601 6 0.5Other 4 0.3
Note: DRG 124 is under MDC 5 Circulatory System1998, Utah Hospital Discharge Database
Utah Office of Health Care Statistics
Affiliation
Bed Size
Location
Payer Distribution
12,7036,937
Patient Distribution by HospitalOwnership
Total Charge ($)11,567
4638,876
Clinical ProfileTop 10 ICD-9 Diagnosis Code
Top 5 ICD-9 Procedure Code
Charges and Length of StayLength of Stay (Days)
4.10.2
3188
0
Patient ProfileAge
Sex
Local Health District
DRG 124 : circulatory disorders except AMI, w card cath & complex diag Total number of discharges: 1242
ST3 1998 Table for DRG 124

Number % of Total0 - 17 6 0.5 Mean18 -34 11 0.9 Standard Deviation35 - 44 30 2.4 Median45 - 54 127 10.3 Max55 - 64 288 23.3 Min65 + 773 62.6
Number % of Total MeanMale 671 54.3 Standard DeviationFemale 564 45.7 Median
Number % of Total 75th PercentileBear River 50 4 25th PercentileWeber-Morgan 127 10.3Davis County 85 6.9 Number % of TotalSalt Lake County 511 41.4 Government 241 19.5Summit County 2 0.2 Non-for-profit 532 43.1Tooele County 14 1.1 Investor-owned 454 36.8Utah County 124 10 Number % of TotalWasatch County 6 0.5 IHC 515 41.7TriCounty (Uinta Basin) 45 3.6 Columbia 280 22.7Central Utah 54 4.4 Paracelsus 171 13.8Southeastern Utah 47 3.8 University of Utah 51 4.1Southwest Utah 89 7.2 Other 218 17.7Other 81 6.6 Number % of Total
Less than 25 21 1.7Number % of Total 25 - 49 136 11
49121 902 73 50 - 99 99 8496 113 9.1 100 + 971 78.649320 79 6.4 Number % of Total4928 58 4.7 Urban 929 75.249321 40 3.2 Rural 298 24.149120 19 1.5
494 14 1.1 Number % of Total4920 5 0.4 Medicare 675 54.74918 3 0.2 Medicaid 67 5.44911 2 0.2 Other Government 134 10.9
0 0Blue Cross/Blue Shield 46 3.7
Number % of Total Other Commercial 97 7.9899 72.8 Managed Care 141 11.4
9394 88 7.1 Other 75 6.19396 34 2.89923 24 1.99215 14 1.1Other 125 10.1
Note: DRG 88 is under MDC 4 Respiratory System1998, Utah Hospital Discharge Database
Utah Office of Health Care Statistics
Affiliation
Bed Size
Location
Payer Distribution
8,2593,481
Patient Distribution by HospitalOwnership
Total Charge ($)6,691
1625,194
Clinical ProfileTop 10 ICD-9 Diagnosis Code
Top 5 ICD-9 Procedure Code
Charges and Length of StayLength of Stay (Days)
4.50.3
3367
0
Patient ProfileAge
Sex
Local Health District
DRG 88 : chronic obstructive pulmonary disease Total number of discharges: 1235
ST3 1998 Table for DRG 88

Number % of Total0 - 17 . . Mean18 -34 90 7.6 Standard Deviation35 - 44 104 8.8 Median45 - 54 120 10.1 Max55 - 64 140 11.8 Min65 + 734 61.8
Number % of Total MeanMale 448 37.7 Standard DeviationFemale 740 62.3 Median
Number % of Total 75th PercentileBear River 78 6.6 25th PercentileWeber-Morgan 116 9.8Davis County 102 8.6 Number % of TotalSalt Lake County 431 36.3 Government 195 16.4Summit County 10 0.8 Non-for-profit 579 48.7Tooele County 18 1.5 Investor-owned 402 33.8Utah County 138 11.6 Number % of TotalWasatch County 8 0.7 IHC 562 47.3TriCounty (Uinta Basin) 22 1.9 Columbia 282 23.7Central Utah 75 6.3 Paracelsus 120 10.1Southeastern Utah 38 3.2 University of Utah 80 6.7Southwest Utah 100 8.4 Other 144 12.1Other 52 4.4 Number % of Total
Less than 25 45 3.8Number % of Total 25 - 49 112 9.4
2765 748 63 50 - 99 109 9.22761 152 12.8 100 + 910 76.62768 67 5.6 Number % of Total2767 33 2.8 Urban 843 7127542 26 2.2 Rural 333 282760 26 2.2
2638 17 1.4 Number % of Total27700 16 1.3 Medicare 711 59.82762 13 1.1 Medicaid 62 5.22639 10 0.8 Other Government 80 6.7
Other 80 6.7Blue Cross/Blue Shield 55 4.6
Number % of Total Other Commercial 74 6.2870 73.2 Managed Care 148 12.5
3893 34 2.9 Other 58 4.94516 31 2.69904 22 1.94513 19 1.6Other 147 12.4
Note: DRG 296 is under MDC 10 Endocrine, Nutritional & Meta System
1998, Utah Hospital Discharge DatabaseUtah Office of Health Care Statistics
Affiliation
Bed Size
Location
Payer Distribution
6,6992,775
Patient Distribution by HospitalOwnership
Total Charge ($)5,936
1814,209
Clinical ProfileTop 10 ICD-9 Diagnosis Code
Top 5 ICD-9 Procedure Code
Charges and Length of StayLength of Stay (Days)
4.30.3
3367
0
Patient ProfileAge
Sex
Local Health District
DRG 296 : nutritional & miscellaneous metabolic disorders age >17 w cc Total number of discharges: 1188
ST3 1998 Table for DRG 296

Number % of Total0 - 17 88 7.5 Mean18 -34 1004 85.3 Standard Deviation35 - 44 84 7.1 Median45 - 54 1 0.1 Max55 - 64 . . Min65 + . .
Number % of Total MeanMale . . Standard DeviationFemale 1177 100 Median
Number % of Total 75th PercentileBear River 49 4.2 25th PercentileWeber-Morgan 76 6.5Davis County 87 7.4 Number % of TotalSalt Lake County 507 43.1 Government 306 26Summit County 5 0.4 Non-for-profit 566 48.1Tooele County 10 0.8 Investor-owned 294 25Utah County 165 14 Number % of TotalWasatch County 8 0.7 IHC 558 47.4TriCounty (Uinta Basin) 45 3.8 Columbia 192 16.3Central Utah 78 6.6 Paracelsus 102 8.7Southeastern Utah 24 2 University of Utah 229 19.5Southwest Utah 74 6.3 Other 96 8.2Other 49 4.2 Number % of Total
Less than 25 78 6.6Number % of Total 25 - 49 71 6
64893 266 22.6 50 - 99 98 8.364663 250 21.2 100 + 919 78.164313 149 12.7 Number % of Total64683 72 6.1 Urban 902 76.664243 47 4 Rural 264 22.464303 46 3.9
64623 41 3.5 Number % of Total64803 31 2.6 Medicare 5 0.464293 24 2 Medicaid 298 25.364323 23 2 Other Government 41 3.5
Other 228 19.4Blue Cross/Blue Shield 95 8.1
Number % of Total Other Commercial 188 16861 73.2 Managed Care 438 37.2
3893 31 2.6 Other 112 9.55123 25 2.1751 25 2.14709 17 1.4Other 160 13.6
Note: DRG 383 is under MDC 14 Pregnancy, Childbirth & Puerperium
1998, Utah Hospital Discharge DatabaseUtah Office of Health Care Statistics
Affiliation
Bed Size
Location
Payer Distribution
4,8911,647
Patient Distribution by HospitalOwnership
Total Charge ($)4,198
1662,682
Clinical ProfileTop 10 ICD-9 Diagnosis Code
Top 5 ICD-9 Procedure Code
Charges and Length of StayLength of Stay (Days)
2.90.1
237
0
Patient ProfileAge
Sex
Local Health District
DRG 383 : other antepartum diagnoses w medical complications Total number of discharges: 1177
ST3 1998 Table for DRG 383

Number % of Total0 - 17 35 3.2 Mean18 -34 24 2.2 Standard Deviation35 - 44 21 1.9 Median45 - 54 62 5.6 Max55 - 64 142 12.8 Min65 + 827 74.4
Number % of Total MeanMale 556 50 Standard DeviationFemale 555 50 Median
Number % of Total 75th PercentileBear River 57 5.1 25th PercentileWeber-Morgan 95 8.6Davis County 81 7.3 Number % of TotalSalt Lake County 426 38.3 Government 268 24.1Summit County 11 1 Non-for-profit 525 47.3Tooele County 24 2.2 Investor-owned 304 27.4Utah County 131 11.8 Number % of TotalWasatch County 3 0.3 IHC 518 46.6TriCounty (Uinta Basin) 32 2.9 Columbia 205 18.5Central Utah 46 4.1 Paracelsus 99 8.9Southeastern Utah 27 2.4 University of Utah 111 10Southwest Utah 75 6.8 Other 178 16Other 103 9.3 Number % of Total
Less than 25 12 1.1Number % of Total 25 - 49 83 7.5
42731 545 49.1 50 - 99 86 7.742789 124 11.2 100 + 916 82.442732 108 9.7 Number % of Total4271 79 7.1 Urban 868 78.14270 68 6.1 Rural 229 20.642781 61 5.5
42741 28 2.5 Number % of Total4260 24 2.2 Medicare 667 6042769 15 1.4 Medicaid 15 1.44279 11 1 Other Government 131 11.8
Other 48 4.3Blue Cross/Blue Shield 33 3
Number % of Total Other Commercial 85 7.7642 57.8 Managed Care 126 11.3
9962 95 8.6 Other 54 4.98872 89 89961 78 78944 21 1.9Other 120 10.8
Note: DRG 138 is under MDC 5 Circulatory System1998, Utah Hospital Discharge Database
Utah Office of Health Care Statistics
Affiliation
Bed Size
Location
Payer Distribution
7,0102,837
Patient Distribution by HospitalOwnership
Total Charge ($)5,988
1864,371
Clinical ProfileTop 10 ICD-9 Diagnosis Code
Top 5 ICD-9 Procedure Code
Charges and Length of StayLength of Stay (Days)
3.10.1
223
0
Patient ProfileAge
Sex
Local Health District
DRG 138 : cardiac arrhythmia & conduction disorders w cc Total number of discharges: 1111
ST3 1998 Table for DRG 138

Number % of Total0 - 17 . . Mean18 -34 64 5.8 Standard Deviation35 - 44 74 6.7 Median45 - 54 94 8.6 Max55 - 64 153 13.9 Min65 + 713 64.9
Number % of Total MeanMale 535 48.7 Standard DeviationFemale 563 51.3 Median
Number % of Total 75th PercentileBear River 68 6.2 25th PercentileWeber-Morgan 94 8.6Davis County 87 7.9 Number % of TotalSalt Lake County 377 34.3 Government 156 14.2Summit County 4 0.4 Non-for-profit 584 53.2Tooele County 14 1.3 Investor-owned 349 31.8Utah County 193 17.6 Number % of TotalWasatch County 6 0.5 IHC 581 52.9TriCounty (Uinta Basin) 29 2.6 Columbia 283 25.8Central Utah 51 4.6 Paracelsus 66 6Southeastern Utah 41 3.7 University of Utah 78 7.1Southwest Utah 84 7.7 Other 90 8.2Other 50 4.6 Number % of Total
Less than 25 27 2.5Number % of Total 25 - 49 60 5.5
389 312 28.4 50 - 99 109 9.93842 216 19.7 100 + 893 81.3380 97 8.8 Number % of Total3849 88 8 Urban 835 763811 87 7.9 Rural 254 23.13819 57 5.2
382 53 4.8 Number % of Total7907 51 4.6 Medicare 689 62.8388 35 3.2 Medicaid 46 4.23843 30 2.7 Other Government 64 5.8
Other 72 6.6Blue Cross/Blue Shield 45 4.1
Number % of Total Other Commercial 77 7570 51.9 Managed Care 120 10.9
3893 58 5.3 Other 57 5.29904 50 4.69921 33 38872 26 2.4Other 272 24.8
Note: DRG 416 is under MDC 18 Infectious and Parasitic DDs1998, Utah Hospital Discharge Database
Utah Office of Health Care Statistics
Affiliation
Bed Size
Location
Payer Distribution
13,2844,853
Patient Distribution by HospitalOwnership
Total Charge ($)11,645
4367,838
Clinical ProfileTop 10 ICD-9 Diagnosis Code
Top 5 ICD-9 Procedure Code
Charges and Length of StayLength of Stay (Days)
5.80.1
538
0
Patient ProfileAge
Sex
Local Health District
DRG 416 : septicemia age >17 Total number of discharges: 1098
ST3 1998 Table for DRG 416

Number % of Total0 - 17 . . Mean18 -34 329 30.7 Standard Deviation35 - 44 196 18.3 Median45 - 54 228 21.3 Max55 - 64 150 14 Min65 + 167 15.6
Number % of Total MeanMale 530 49.5 Standard DeviationFemale 540 50.5 Median
Number % of Total 75th PercentileBear River 48 4.5 25th PercentileWeber-Morgan 85 7.9Davis County 60 5.6 Number % of TotalSalt Lake County 430 40.2 Government 153 14.3Summit County 17 1.6 Non-for-profit 613 57.3Tooele County 16 1.5 Investor-owned 297 27.8Utah County 130 12.1 Number % of TotalWasatch County 3 0.3 IHC 613 57.3TriCounty (Uinta Basin) 14 1.3 Columbia 210 19.6Central Utah 31 2.9 Paracelsus 53 5Southeastern Utah 22 2.1 University of Utah 132 12.3Southwest Utah 71 6.6 Other 62 5.8Other 143 13.4 Number % of Total
Less than 25 36 3.4Number % of Total 25 - 49 56 5.2
8244 153 14.3 50 - 99 87 8.18246 136 12.7 100 + 884 82.68248 86 8 Number % of Total82300 73 6.8 Urban 871 81.473382 57 5.3 Rural 192 17.982322 51 4.8
8242 47 4.4 Number % of Total8240 36 3.4 Medicare 132 12.38220 28 2.6 Medicaid 41 3.882332 22 2.1 Other Government 51 4.8
Other 381 35.6Blue Cross/Blue Shield 93 8.7
Number % of Total Other Commercial 270 25.27936 671 62.7 Managed Care 281 26.37931 104 9.7 Other 202 18.98111 53 57916 35 3.38112 29 2.7Other 94 8.8
Note: DRG 219 is under MDC 8 Musculoskeletal System & Conn tissue
1998, Utah Hospital Discharge DatabaseUtah Office of Health Care Statistics
Affiliation
Bed Size
Location
Payer Distribution
8,5234,745
Patient Distribution by HospitalOwnership
Total Charge ($)7,055
1136,327
Clinical ProfileTop 10 ICD-9 Diagnosis Code
Top 5 ICD-9 Procedure Code
Charges and Length of StayLength of Stay (Days)
2.402
210
Patient ProfileAge
Sex
Local Health District
DRG 219 : lower extrem & humer procs except hip, foot, femur age >17 w/o cc Total number of discharges: 1070
ST3 1998 Table for DRG 219

Number % of Total0 - 17 . . Mean18 -34 232 21.8 Standard Deviation35 - 44 189 17.7 Median45 - 54 207 19.4 Max55 - 64 153 14.4 Min65 + 285 26.7
Number % of Total MeanMale 396 37.1 Standard DeviationFemale 670 62.9 Median
Number % of Total 75th PercentileBear River 83 7.8 25th PercentileWeber-Morgan 67 6.3Davis County 85 8 Number % of TotalSalt Lake County 388 36.4 Government 192 18Summit County 9 0.8 Non-for-profit 529 49.6Tooele County 17 1.6 Investor-owned 322 30.2Utah County 127 11.9 Number % of TotalWasatch County . . IHC 527 49.4TriCounty (Uinta Basin) 34 3.2 Columbia 204 19.1Central Utah 49 4.6 Paracelsus 118 11.1Southeastern Utah 38 3.6 University of Utah 57 5.3Southwest Utah 105 9.8 Other 160 15Other 64 6 Number % of Total
Less than 25 54 5.1Number % of Total 25 - 49 119 11.2
56211 194 18.2 50 - 99 118 11.153081 83 7.8 100 + 752 70.55589 75 7 Number % of Total78909 60 5.6 Urban 722 67.778903 55 5.2 Rural 321 30.178900 54 5.1
78906 51 4.8 Number % of Total78901 37 3.5 Medicare 270 25.388 35 3.3 Medicaid 50 4.75368 35 3.3 Other Government 70 6.6
Other 387 36.3Blue Cross/Blue Shield 88 8.3
Number % of Total Other Commercial 153 14.4705 66.1 Managed Care 331 31.1
4516 58 5.4 Other 104 9.84513 45 4.23722 40 3.88801 33 3.1Other 107 10
Note: DRG 183 is under MDC 6 Digestive System1998, Utah Hospital Discharge Database
Utah Office of Health Care Statistics
Affiliation
Bed Size
Location
Payer Distribution
4,7142,214
Patient Distribution by HospitalOwnership
Total Charge ($)3,765
763,340
Clinical ProfileTop 10 ICD-9 Diagnosis Code
Top 5 ICD-9 Procedure Code
Charges and Length of StayLength of Stay (Days)
2.102
120
Patient ProfileAge
Sex
Local Health District
DRG 183 : esophagitis, gastroent, & misc digestive disorders age >17 w/o cc Total number of discharges: 1066
ST3 1998 Table for DRG 183
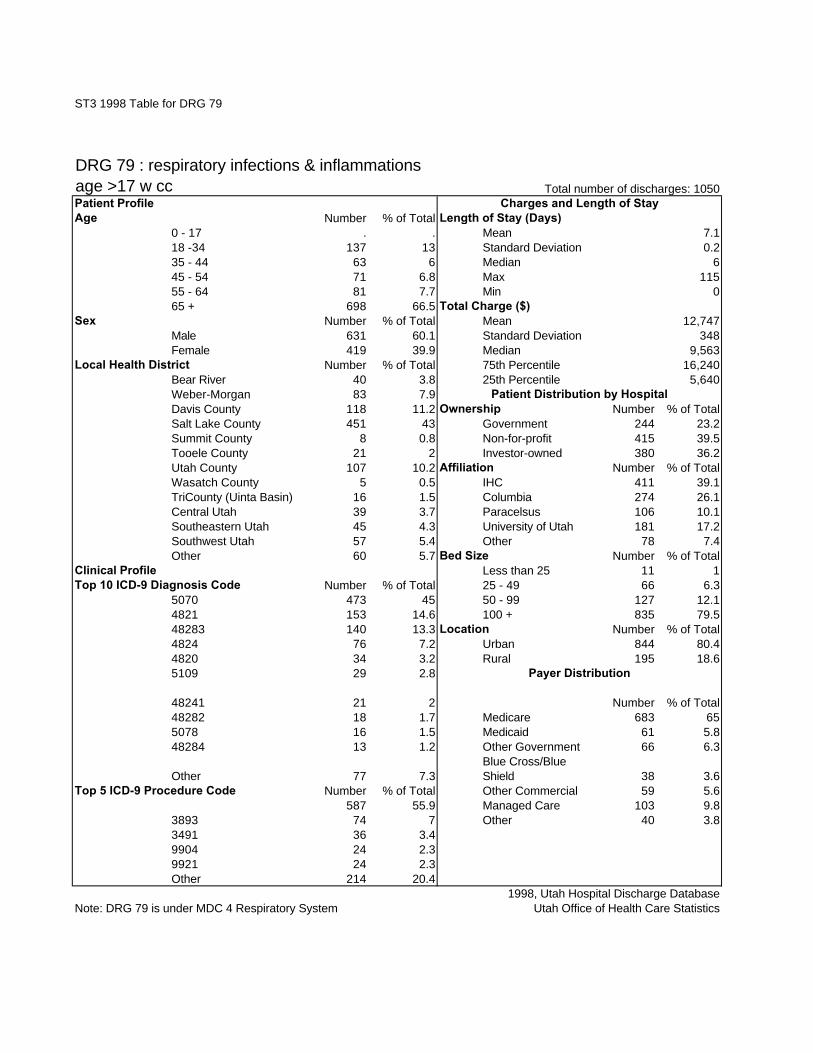
Number % of Total0 - 17 . . Mean18 -34 137 13 Standard Deviation35 - 44 63 6 Median45 - 54 71 6.8 Max55 - 64 81 7.7 Min65 + 698 66.5
Number % of Total MeanMale 631 60.1 Standard DeviationFemale 419 39.9 Median
Number % of Total 75th PercentileBear River 40 3.8 25th PercentileWeber-Morgan 83 7.9Davis County 118 11.2 Number % of TotalSalt Lake County 451 43 Government 244 23.2Summit County 8 0.8 Non-for-profit 415 39.5Tooele County 21 2 Investor-owned 380 36.2Utah County 107 10.2 Number % of TotalWasatch County 5 0.5 IHC 411 39.1TriCounty (Uinta Basin) 16 1.5 Columbia 274 26.1Central Utah 39 3.7 Paracelsus 106 10.1Southeastern Utah 45 4.3 University of Utah 181 17.2Southwest Utah 57 5.4 Other 78 7.4Other 60 5.7 Number % of Total
Less than 25 11 1Number % of Total 25 - 49 66 6.3
5070 473 45 50 - 99 127 12.14821 153 14.6 100 + 835 79.548283 140 13.3 Number % of Total4824 76 7.2 Urban 844 80.44820 34 3.2 Rural 195 18.65109 29 2.8
48241 21 2 Number % of Total48282 18 1.7 Medicare 683 655078 16 1.5 Medicaid 61 5.848284 13 1.2 Other Government 66 6.3
Other 77 7.3Blue Cross/Blue Shield 38 3.6
Number % of Total Other Commercial 59 5.6587 55.9 Managed Care 103 9.8
3893 74 7 Other 40 3.83491 36 3.49904 24 2.39921 24 2.3Other 214 20.4
Note: DRG 79 is under MDC 4 Respiratory System1998, Utah Hospital Discharge Database
Utah Office of Health Care Statistics
Affiliation
Bed Size
Location
Payer Distribution
16,2405,640
Patient Distribution by HospitalOwnership
Total Charge ($)12,747
3489,563
Clinical ProfileTop 10 ICD-9 Diagnosis Code
Top 5 ICD-9 Procedure Code
Charges and Length of StayLength of Stay (Days)
7.10.2
6115
0
Patient ProfileAge
Sex
Local Health District
DRG 79 : respiratory infections & inflammations age >17 w cc Total number of discharges: 1050
ST3 1998 Table for DRG 79

Number % of Total0 - 17 1030 100 Mean18 -34 . . Standard Deviation35 - 44 . . Median45 - 54 . . Max55 - 64 . . Min65 + . .
Number % of Total MeanMale 600 58.3 Standard DeviationFemale 430 41.7 Median
Number % of Total 75th PercentileBear River 62 6 25th PercentileWeber-Morgan 104 10.1Davis County 102 9.9 Number % of TotalSalt Lake County 327 31.7 Government 181 17.6Summit County 13 1.3 Non-for-profit 693 67.3Tooele County 15 1.5 Investor-owned 154 15Utah County 212 20.6 Number % of TotalWasatch County 9 0.9 IHC 693 67.3TriCounty (Uinta Basin) 9 0.9 Columbia 107 10.4Central Utah 27 2.6 Paracelsus 47 4.6Southeastern Utah 15 1.5 University of Utah 179 17.4Southwest Utah 42 4.1 Other 4 0.4Other 93 9 Number % of Total
Less than 25 9 0.9Number % of Total 25 - 49 6 0.6
V3000 338 32.8 50 - 99 12 1.2V3001 251 24.4 100 + 1001 97.2769 185 18 Number % of TotalV3101 63 6.1 Urban 954 92.6V3100 38 3.7 Rural 74 7.2V3401 35 3.4
76519 15 1.5 Number % of Total76515 14 1.4 Medicare . .76518 13 1.3 Medicaid 206 2076503 9 0.9 Other Government 28 2.7
Other 69 6.7Blue Cross/Blue Shield 109 10.6
Number % of Total Other Commercial 184 17.99604 406 39.4 Managed Care 464 45
113 11 Other 39 3.89671 77 7.59672 76 7.43891 60 5.8Other 155 15
Note: DRG 386 is under MDC 15 Newborn & Other Neonates (Perin Period)
1998, Utah Hospital Discharge DatabaseUtah Office of Health Care Statistics
Affiliation
Bed Size
Location
Payer Distribution
72,58015,998
Patient Distribution by HospitalOwnership
Total Charge ($)65,522
2,65933,122
Clinical ProfileTop 10 ICD-9 Diagnosis Code
Top 5 ICD-9 Procedure Code
Charges and Length of StayLength of Stay (Days)
28.90.917
1800
Patient ProfileAge
Sex
Local Health District
DRG 386 : extreme immaturity or respiratory distress syndrome, neonate Total number of discharges: 1030
ST3 1998 Table for DRG 386

Number % of Total0 - 17 1026 100 Mean18 -34 . . Standard Deviation35 - 44 . . Median45 - 54 . . Max55 - 64 . . Min65 + . .
Number % of Total MeanMale 586 57.1 Standard DeviationFemale 440 42.9 Median
Number % of Total 75th PercentileBear River 45 4.4 25th PercentileWeber-Morgan 122 11.9Davis County 132 12.9 Number % of TotalSalt Lake County 398 38.8 Government 194 18.9Summit County 14 1.4 Non-for-profit 553 53.9Tooele County 20 1.9 Investor-owned 278 27.1Utah County 126 12.3 Number % of TotalWasatch County 3 0.3 IHC 553 53.9TriCounty (Uinta Basin) 11 1.1 Columbia 184 17.9Central Utah 18 1.8 Paracelsus 94 9.2Southeastern Utah 15 1.5 University of Utah 187 18.2Southwest Utah 61 5.9 Other 8 0.8Other 61 5.9 Number % of Total
Less than 25 8 0.8Number % of Total 25 - 49 15 1.5
V3000 442 43.1 50 - 99 66 6.4V3001 214 20.9 100 + 936 91.2V3101 131 12.8 Number % of TotalV3100 54 5.3 Urban 926 90.37708 35 3.4 Rural 99 9.676518 18 1.8
V3401 18 1.8 Number % of Total76516 11 1.1 Medicare . .76519 11 1.1 Medicaid 225 21.97718 9 0.9 Other Government 29 2.8
Other 83 8.1Blue Cross/Blue Shield 94 9.2
Number % of Total Other Commercial 155 15.1435 42.4 Managed Care 468 45.6
640 91 8.9 Other 55 5.49604 82 89983 61 5.9331 46 4.5Other 150 14.6
Note: DRG 387 is under MDC 15 Newborn & Other Neonates (Perin Period)
1998, Utah Hospital Discharge DatabaseUtah Office of Health Care Statistics
Affiliation
Bed Size
Location
Payer Distribution
26,7954,093
Patient Distribution by HospitalOwnership
Total Charge ($)21,358
90511,733
Clinical ProfileTop 10 ICD-9 Diagnosis Code
Top 5 ICD-9 Procedure Code
Charges and Length of StayLength of Stay (Days)
13.90.5
896
0
Patient ProfileAge
Sex
Local Health District
DRG 387 : prematurity w major problems Total number of discharges: 1026
ST3 1998 Table for DRG 387

Number % of Total0 - 17 20 2 Mean18 -34 26 2.6 Standard Deviation35 - 44 86 8.7 Median45 - 54 259 26.3 Max55 - 64 231 23.5 Min65 + 363 36.9
Number % of Total MeanMale 573 58.2 Standard DeviationFemale 412 41.8 Median
Number % of Total 75th PercentileBear River 70 7.1 25th PercentileWeber-Morgan 64 6.5Davis County 89 9 Number % of TotalSalt Lake County 376 38.2 Government 158 16Summit County 13 1.3 Non-for-profit 516 52.4Tooele County 13 1.3 Investor-owned 311 31.6Utah County 82 8.3 Number % of TotalWasatch County 3 0.3 IHC 516 52.4TriCounty (Uinta Basin) 10 1 Columbia 173 17.6Central Utah 21 2.1 Paracelsus 138 14Southeastern Utah 21 2.1 University of Utah 110 11.2Southwest Utah 76 7.7 Other 48 4.9Other 147 14.9 Number % of Total
Less than 25 . .Number % of Total 25 - 49 . .
78650 274 27.8 50 - 99 . .78659 245 24.9 100 + 985 10041401 174 17.7 Number % of Total41400 26 2.6 Urban 856 86.942731 23 2.3 Rural 129 13.14139 22 2.2
V717 21 2.1 Number % of Total78651 19 1.9 Medicare 327 33.24241 14 1.4 Medicaid 30 37802 12 1.2 Other Government 79 8
Other 155 15.7Blue Cross/Blue Shield 81 8.2
Number % of Total Other Commercial 128 133722 723 73.4 Managed Care 257 26.13723 202 20.5 Other 83 8.48856 21 2.13721 19 1.9722 10 1
0 0
Note: DRG 125 is under MDC 5 Circulatory System1998, Utah Hospital Discharge Database
Utah Office of Health Care Statistics
Affiliation
Bed Size
Location
Payer Distribution
9,4675,831
Patient Distribution by HospitalOwnership
Total Charge ($)8,471
2837,299
Clinical ProfileTop 10 ICD-9 Diagnosis Code
Top 5 ICD-9 Procedure Code
Charges and Length of StayLength of Stay (Days)
20.1
226
0
Patient ProfileAge
Sex
Local Health District
DRG 125 : circulatory disorders except AMI, w card cath w/o complex diag Total number of discharges: 985
ST3 1998 Table for DRG 125

Number % of Total0 - 17 21 2.2 Mean18 -34 311 32.3 Standard Deviation35 - 44 177 18.4 Median45 - 54 159 16.5 Max55 - 64 126 13.1 Min65 + 169 17.5
Number % of Total MeanMale 249 25.9 Standard DeviationFemale 714 74.1 Median
Number % of Total 75th PercentileBear River 100 10.4 25th PercentileWeber-Morgan 46 4.8Davis County 66 6.9 Number % of TotalSalt Lake County 332 34.5 Government 130 13.5Summit County 7 0.7 Non-for-profit 594 61.7Tooele County 23 2.4 Investor-owned 231 24Utah County 133 13.8 Number % of TotalWasatch County 9 0.9 IHC 592 61.5TriCounty (Uinta Basin) 53 5.5 Columbia 147 15.3Central Utah 29 3 Paracelsus 84 8.7Southeastern Utah 25 2.6 University of Utah 36 3.7Southwest Utah 88 9.1 Other 104 10.8Other 52 5.4 Number % of Total
Less than 25 17 1.8Number % of Total 25 - 49 111 11.5
57400 324 33.6 50 - 99 101 10.557410 291 30.2 100 + 726 75.457511 113 11.7 Number % of Total57512 38 3.9 Urban 620 64.45750 30 3.1 Rural 335 34.857470 28 2.9
57471 19 2 Number % of Total57401 18 1.9 Medicare 168 17.457480 16 1.7 Medicaid 69 7.257481 15 1.6 Other Government 37 3.8
Other 71 7.4Blue Cross/Blue Shield 82 8.5
Number % of Total Other Commercial 151 15.75123 960 99.7 Managed Care 380 39.55124 3 0.3 Other 76 7.9
. .
. .
. .0 0
Note: DRG 494 is under MDC 7 Hepatobiliary System & Pancreas1998, Utah Hospital Discharge Database
Utah Office of Health Care Statistics
Affiliation
Bed Size
Location
Payer Distribution
7,7644,500
Patient Distribution by HospitalOwnership
Total Charge ($)6,549
936,041
Clinical ProfileTop 10 ICD-9 Diagnosis Code
Top 5 ICD-9 Procedure Code
Charges and Length of StayLength of Stay (Days)
1.902
110
Patient ProfileAge
Sex
Local Health District
DRG 494 : laparoscopic cholecystectomy w/o cde w/o cc Total number of discharges: 963
ST3 1998 Table for DRG 494

Number % of Total0 - 17 27 2.9 Mean18 -34 41 4.3 Standard Deviation35 - 44 57 6 Median45 - 54 137 14.5 Max55 - 64 220 23.3 Min65 + 461 48.8Unknown 1 0.1 Mean
Number % of Total Standard DeviationMale 639 67.7 MedianFemale 305 32.3 75th Percentile
Number % of Total 25th PercentileBear River 45 4.8Weber-Morgan 97 10.3 Number % of TotalDavis County 73 7.7 Government 233 24.7Salt Lake County 244 25.8 Non-for-profit 476 50.4Summit County 4 0.4 Investor-owned 235 24.9Tooele County 8 0.8 Number % of TotalUtah County 162 17.2 IHC 476 50.4Wasatch County 5 0.5 Columbia 176 18.6TriCounty (Uinta Basin) 16 1.7 Paracelsus 59 6.3Central Utah 32 3.4 University of Utah 134 14.2Southeastern Utah 13 1.4 Other 99 10.5Southwest Utah 38 4 Number % of TotalOther 207 21.9 Less than 25 . .
25 - 49 . .Number % of Total 50 - 99 . .
41401 316 33.5 100 + 944 1004270 72 7.6 Number % of Total41071 62 6.6 Urban 944 1004271 58 6.1 Rural . .41041 46 4.9
41011 44 4.7 Number % of Total42732 44 4.7 Medicare 382 40.542731 35 3.7 Medicaid 26 2.841400 27 2.9 Other Government 120 12.7
4267 19 2Blue Cross/Blue Shield 69 7.3
Other 221 23.4 Other Commercial 121 12.8Number % of Total Managed Care 182 19.3
3601 488 51.7 Other 44 4.73726 210 22.23605 98 10.43734 81 8.63602 40 4.2Other 1 0.1
Note: DRG 112 is under MDC 5 Circulatory System1998, Utah Hospital Discharge Database
Utah Office of Health Care Statistics
Affiliation
Bed Size
Location
Payer Distribution
18,3469,840
Patient Distribution by HospitalOwnership
Total Charge ($)15,311
39513,691
Clinical ProfileTop 10 ICD-9 Diagnosis Code
Top 5 ICD-9 Procedure Code
Charges and Length of StayLength of Stay (Days)
30.1
262
0
Patient ProfileAge
Sex
Local Health District
DRG 112 : percutaneous cardiovascular procs Total number of discharges: 944
ST3 1998 Table for DRG 112

Number % of Total0 - 17 286 30.6 Mean18 -34 157 16.8 Standard Deviation35 - 44 90 9.6 Median45 - 54 142 15.2 Max55 - 64 129 13.8 Min65 + 131 14
Number % of Total MeanMale 490 52.4 Standard DeviationFemale 445 47.6 Median
Number % of Total 75th PercentileBear River 55 5.9 25th PercentileWeber-Morgan 115 12.3Davis County 71 7.6 Number % of TotalSalt Lake County 366 39.1 Government 330 35.3Summit County 10 1.1 Non-for-profit 508 54.3Tooele County 7 0.7 Investor-owned 97 10.4Utah County 74 7.9 Number % of TotalWasatch County . . IHC 508 54.3TriCounty (Uinta Basin) 12 1.3 Columbia 88 9.4Central Utah 10 1.1 Paracelsus 9 1Southeastern Utah 4 0.4 University of Utah 290 31Southwest Utah 55 5.9 Other 40 4.3Other 156 16.7 Number % of Total
Less than 25 . .Number % of Total 25 - 49 . .
V581 935 100 50 - 99 . .. . 100 + 935 100. . Number % of Total. . Urban 905 96.8. . Rural 30 3.2. .
. . Number % of Total
. . Medicare 116 12.4
. . Medicaid 69 7.4
. . Other Government 96 10.3
0 0Blue Cross/Blue Shield 132 14.1
Number % of Total Other Commercial 182 19.59925 808 86.4 Managed Care 276 29.53893 65 7 Other 64 6.88607 16 1.7
14 1.59929 7 0.7Other 9 1
Note: DRG 410 is under MDC 17 Myeloproliferative DDs (Diff Neoplasms)
1998, Utah Hospital Discharge DatabaseUtah Office of Health Care Statistics
Affiliation
Bed Size
Location
Payer Distribution
10,5004,501
Patient Distribution by HospitalOwnership
Total Charge ($)8,382
2286,788
Clinical ProfileTop 10 ICD-9 Diagnosis Code
Top 5 ICD-9 Procedure Code
Charges and Length of StayLength of Stay (Days)
3.20.1
324
0
Patient ProfileAge
Sex
Local Health District
ST3 1998 Table for DRG 410
DRG 410 : chemotherapy w/o acute leukemia as secondary diagnosis Total number of discharges: 935

Number % of Total0 - 17 37 4.1 Mean18 -34 119 13 Standard Deviation35 - 44 121 13.3 Median45 - 54 105 11.5 Max55 - 64 89 9.8 Min65 + 441 48.4
Number % of Total MeanMale 412 45.2 Standard DeviationFemale 500 54.8 Median
Number % of Total 75th PercentileBear River 46 5 25th PercentileWeber-Morgan 85 9.3Davis County 59 6.5 Number % of TotalSalt Lake County 309 33.9 Government 171 18.8Summit County 8 0.9 Non-for-profit 458 50.2Tooele County 15 1.6 Investor-owned 275 30.2Utah County 142 15.6 Number % of TotalWasatch County 3 0.3 IHC 455 49.9TriCounty (Uinta Basin) 29 3.2 Columbia 207 22.7Central Utah 42 4.6 Paracelsus 58 6.4Southeastern Utah 23 2.5 University of Utah 73 8Southwest Utah 68 7.5 Other 119 13Other 83 9.1 Number % of Total
Less than 25 26 2.9Number % of Total 25 - 49 79 8.7
8054 170 18.6 50 - 99 79 8.78052 121 13.3 100 + 720 78.972210 87 9.5 Number % of Total7242 85 9.3 Urban 712 78.172402 51 5.6 Rural 192 21.172252 42 4.6
8472 39 4.3 Number % of Total7213 25 2.7 Medicare 407 44.672293 23 2.5 Medicaid 20 2.27245 22 2.4 Other Government 71 7.8
Other 247 27.1Blue Cross/Blue Shield 42 4.6
Number % of Total Other Commercial 153 16.8660 72.4 Managed Care 133 14.6
8893 39 4.3 Other 86 9.4392 27 38838 23 2.58659 17 1.9Other 101 11.1
Note: DRG 243 is under MDC 8 Musculoskeletal System & Conn tissue
1998, Utah Hospital Discharge DatabaseUtah Office of Health Care Statistics
Affiliation
Bed Size
Location
Payer Distribution
6,3522,763
Patient Distribution by HospitalOwnership
Total Charge ($)5,228
1564,160
Clinical ProfileTop 10 ICD-9 Diagnosis Code
Top 5 ICD-9 Procedure Code
Charges and Length of StayLength of Stay (Days)
3.70.1
333
0
Patient ProfileAge
Sex
Local Health District
DRG 243 : medical back problems Total number of discharges: 912
ST3 1998 Table for DRG 243

Number % of Total0 - 17 . . Mean18 -34 50 5.5 Standard Deviation35 - 44 42 4.6 Median45 - 54 47 5.2 Max55 - 64 47 5.2 Min65 + 723 79.5
Number % of Total MeanMale 318 35 Standard DeviationFemale 591 65 Median
Number % of Total 75th PercentileBear River 46 5.1 25th PercentileWeber-Morgan 82 9Davis County 53 5.8 Number % of TotalSalt Lake County 342 37.6 Government 117 12.9Summit County 2 0.2 Non-for-profit 500 55Tooele County 13 1.4 Investor-owned 283 31.1Utah County 121 13.3 Number % of TotalWasatch County 8 0.9 IHC 500 55TriCounty (Uinta Basin) 11 1.2 Columbia 203 22.3Central Utah 49 5.4 Paracelsus 74 8.1Southeastern Utah 24 2.6 University of Utah 87 9.6Southwest Utah 78 8.6 Other 45 5Other 80 8.8 Number % of Total
Less than 25 7 0.8Number % of Total 25 - 49 44 4.8
82021 462 50.8 50 - 99 98 10.882009 82 9 100 + 751 82.682022 56 6.2 Number % of Total82101 41 4.5 Urban 725 79.882123 37 4.1 Rural 175 19.39964 31 3.4
82003 27 3 Number % of Total8208 27 3 Medicare 642 70.673382 20 2.2 Medicaid 28 3.173315 12 1.3 Other Government 35 3.9
Other 114 12.5Blue Cross/Blue Shield 22 2.4
Number % of Total Other Commercial 72 7.97935 680 74.8 Managed Care 50 5.57915 86 9.5 Other 60 6.67855 72 7.98005 11 1.27785 10 1.1Other 13 1.4
Note: DRG 210 is under MDC 8 Musculoskeletal System & Conn tissue
1998, Utah Hospital Discharge DatabaseUtah Office of Health Care Statistics
Affiliation
Bed Size
Location
Payer Distribution
16,1619,212
Patient Distribution by HospitalOwnership
Total Charge ($)14,311
34211,842
Clinical ProfileTop 10 ICD-9 Diagnosis Code
Top 5 ICD-9 Procedure Code
Charges and Length of StayLength of Stay (Days)
5.80.1
544
0
Patient ProfileAge
Sex
Local Health District
DRG 210 : hip & femur procs except major joint age >17 w cc Total number of discharges: 909
ST3 1998 Table for DRG 210
Number % of Total0 - 17 . . Mean18 -34 92 10.4 Standard Deviation35 - 44 74 8.3 Median45 - 54 62 7 Max55 - 64 72 8.1 Min65 + 588 66.2
Number % of Total MeanMale 286 32.2 Standard DeviationFemale 602 67.8 Median
Number % of Total 75th PercentileBear River 31 3.5 25th PercentileWeber-Morgan 89 10Davis County 56 6.3 Number % of TotalSalt Lake County 378 42.6 Government 154 17.3Summit County 6 0.7 Non-for-profit 443 49.9Tooele County 25 2.8 Investor-owned 280 31.5Utah County 102 11.5 Number % of TotalWasatch County 4 0.5 IHC 435 49TriCounty (Uinta Basin) 33 3.7 Columbia 179 20.2Central Utah 39 4.4 Paracelsus 100 11.3Southeastern Utah 22 2.5 University of Utah 44 5Southwest Utah 72 8.1 Other 130 14.6Other 31 3.5 Number % of Total
Less than 25 27 3Number % of Total 25 - 49 131 14.8
5990 530 59.7 50 - 99 83 9.359010 286 32.2 100 + 636 71.659080 35 3.9 Number % of Total5950 8 0.9 Urban 656 73.95902 7 0.8 Rural 221 24.959000 5 0.6
5933 5 0.6 Number % of Total5959 5 0.6 Medicare 536 60.45952 3 0.3 Medicaid 31 3.59954 1 0.1 Other Government 58 6.5
Other 3 0.3Blue Cross/Blue Shield 37 4.2
Number % of Total Other Commercial 63 7.1678 76.4 Managed Care 118 13.3
9921 27 3 Other 45 5.13893 17 1.99904 15 1.7331 10 1.1Other 95 10.7
Note: DRG 320 is under MDC 11 Kidney & Urinary Tract1998, Utah Hospital Discharge Database
Utah Office of Health Care Statistics
Affiliation
Bed Size
Location
Payer Distribution
6,7103,017
Patient Distribution by HospitalOwnership
Total Charge ($)5,562
1474,636
Clinical ProfileTop 10 ICD-9 Diagnosis Code
Top 5 ICD-9 Procedure Code
Charges and Length of StayLength of Stay (Days)
3.70.1
318
0
Patient ProfileAge
Sex
Local Health District
DRG 320 : kidney & urinary tract infections age >17 w cc Total number of discharges: 888
ST3 1998 Table for DRG 320

Number % of Total0 - 17 887 100 Mean18 -34 . . Standard Deviation35 - 44 . . Median45 - 54 . . Max55 - 64 . . Min65 + . .
Number % of Total MeanMale 439 49.5 Standard DeviationFemale 448 50.5 Median
Number % of Total 75th PercentileBear River 65 7.3 25th PercentileWeber-Morgan 110 12.4Davis County 100 11.3 Number % of TotalSalt Lake County 255 28.7 Government 73 8.2Summit County 3 0.3 Non-for-profit 661 74.5Tooele County 22 2.5 Investor-owned 142 16Utah County 163 18.4 Number % of TotalWasatch County 4 0.5 IHC 660 74.4TriCounty (Uinta Basin) 40 4.5 Columbia 79 8.9Central Utah 21 2.4 Paracelsus 63 7.1Southeastern Utah 18 2 University of Utah 11 1.2Southwest Utah 35 3.9 Other 74 8.3Other 51 5.7 Number % of Total
Less than 25 16 1.8Number % of Total 25 - 49 72 8.1
2765 642 72.4 50 - 99 34 3.827700 100 11.3 100 + 754 857834 54 6.1 Number % of Total2760 34 3.8 Urban 711 80.22761 10 1.1 Rural 165 18.62638 9 1
7833 8 0.9 Number % of Total262 5 0.6 Medicare 1 0.12639 5 0.6 Medicaid 151 172762 5 0.6 Other Government 42 4.7
Other 15 1.7Blue Cross/Blue Shield 98 11
Number % of Total Other Commercial 158 17.8767 86.5 Managed Care 400 45.1
3893 48 5.4 Other 37 4.2331 17 1.94311 6 0.79915 5 0.6Other 27 3
Note: DRG 298 is under MDC 10 Endocrine, Nutritional & Meta System
1998, Utah Hospital Discharge DatabaseUtah Office of Health Care Statistics
Affiliation
Bed Size
Location
Payer Distribution
4,0861,446
Patient Distribution by HospitalOwnership
Total Charge ($)5,016
2762,273
Clinical ProfileTop 10 ICD-9 Diagnosis Code
Top 5 ICD-9 Procedure Code
Charges and Length of StayLength of Stay (Days)
3.50.1
232
0
Patient ProfileAge
Sex
Local Health District
DRG 298 : nutritional & miscellaneous metabolic disorders age 0-17 Total number of discharges: 887
ST3 1998 Table for DRG 298

Number % of Total0 - 17 11 1.3 Mean18 -34 131 15.2 Standard Deviation35 - 44 108 12.5 Median45 - 54 111 12.8 Max55 - 64 138 16 Min65 + 365 42.2
Number % of Total MeanMale 294 34 Standard DeviationFemale 570 66 Median
Number % of Total 75th PercentileBear River 56 6.5 25th PercentileWeber-Morgan 75 8.7Davis County 55 6.4 Number % of TotalSalt Lake County 266 30.8 Government 75 8.7Summit County 3 0.3 Non-for-profit 557 64.5Tooele County 21 2.4 Investor-owned 222 25.7Utah County 126 14.6 Number % of TotalWasatch County 3 0.3 IHC 552 63.9TriCounty (Uinta Basin) 20 2.3 Columbia 153 17.7Central Utah 40 4.6 Paracelsus 69 8Southeastern Utah 38 4.4 University of Utah 27 3.1Southwest Utah 109 12.6 Other 63 7.3Other 52 6 Number % of Total
Less than 25 14 1.6Number % of Total 25 - 49 62 7.2
57410 242 28 50 - 99 105 12.257400 233 27 100 + 673 77.95770 138 16 Number % of Total57511 57 6.6 Urban 562 655750 24 2.8 Rural 292 33.857512 22 2.5
57481 21 2.4 Number % of Total57470 18 2.1 Medicare 339 39.257480 13 1.5 Medicaid 47 5.457401 12 1.4 Other Government 42 4.9
Other 84 9.7Blue Cross/Blue Shield 54 6.3
Number % of Total Other Commercial 104 125123 860 99.5 Managed Care 209 24.25124 4 0.5 Other 69 8
. .
. .
. .0 0
Note: DRG 493 is under MDC 7 Hepatobiliary System & Pancreas1998, Utah Hospital Discharge Database
Utah Office of Health Care Statistics
Affiliation
Bed Size
Location
Payer Distribution
11,6626,376
Patient Distribution by HospitalOwnership
Total Charge ($)10,481
3188,350
Clinical ProfileTop 10 ICD-9 Diagnosis Code
Top 5 ICD-9 Procedure Code
Charges and Length of StayLength of Stay (Days)
40.1
379
0
Patient ProfileAge
Sex
Local Health District
DRG 493 : laparoscopic cholecystectomy w/o cde w cc Total number of discharges: 864
ST3 1998 Table for DRG 493
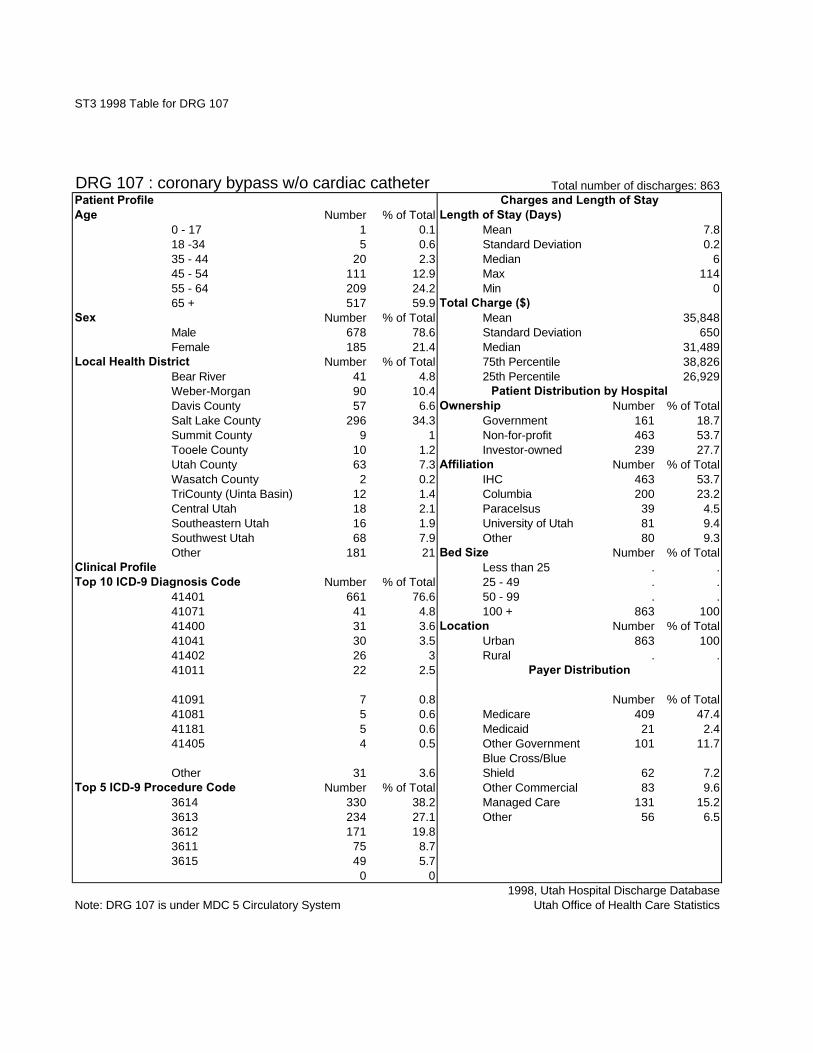
Number % of Total0 - 17 1 0.1 Mean18 -34 5 0.6 Standard Deviation35 - 44 20 2.3 Median45 - 54 111 12.9 Max55 - 64 209 24.2 Min65 + 517 59.9
Number % of Total MeanMale 678 78.6 Standard DeviationFemale 185 21.4 Median
Number % of Total 75th PercentileBear River 41 4.8 25th PercentileWeber-Morgan 90 10.4Davis County 57 6.6 Number % of TotalSalt Lake County 296 34.3 Government 161 18.7Summit County 9 1 Non-for-profit 463 53.7Tooele County 10 1.2 Investor-owned 239 27.7Utah County 63 7.3 Number % of TotalWasatch County 2 0.2 IHC 463 53.7TriCounty (Uinta Basin) 12 1.4 Columbia 200 23.2Central Utah 18 2.1 Paracelsus 39 4.5Southeastern Utah 16 1.9 University of Utah 81 9.4Southwest Utah 68 7.9 Other 80 9.3Other 181 21 Number % of Total
Less than 25 . .Number % of Total 25 - 49 . .
41401 661 76.6 50 - 99 . .41071 41 4.8 100 + 863 10041400 31 3.6 Number % of Total41041 30 3.5 Urban 863 10041402 26 3 Rural . .41011 22 2.5
41091 7 0.8 Number % of Total41081 5 0.6 Medicare 409 47.441181 5 0.6 Medicaid 21 2.441405 4 0.5 Other Government 101 11.7
Other 31 3.6Blue Cross/Blue Shield 62 7.2
Number % of Total Other Commercial 83 9.63614 330 38.2 Managed Care 131 15.23613 234 27.1 Other 56 6.53612 171 19.83611 75 8.73615 49 5.7
0 0
Note: DRG 107 is under MDC 5 Circulatory System1998, Utah Hospital Discharge Database
Utah Office of Health Care Statistics
Affiliation
Bed Size
Location
Payer Distribution
38,82626,929
Patient Distribution by HospitalOwnership
Total Charge ($)35,848
65031,489
Clinical ProfileTop 10 ICD-9 Diagnosis Code
Top 5 ICD-9 Procedure Code
Charges and Length of StayLength of Stay (Days)
7.80.2
6114
0
Patient ProfileAge
Sex
Local Health District
DRG 107 : coronary bypass w/o cardiac catheter Total number of discharges: 863
ST3 1998 Table for DRG 107

Number % of Total0 - 17 . . Mean18 -34 176 20.5 Standard Deviation35 - 44 131 15.3 Median45 - 54 152 17.7 Max55 - 64 128 14.9 Min65 + 271 31.6
Number % of Total MeanMale 414 48.3 Standard DeviationFemale 444 51.7 Median
Number % of Total 75th PercentileBear River 39 4.5 25th PercentileWeber-Morgan 92 10.7Davis County 81 9.4 Number % of TotalSalt Lake County 273 31.8 Government 386 45Summit County 8 0.9 Non-for-profit 406 47.3Tooele County 14 1.6 Investor-owned 64 7.5Utah County 89 10.4 Number % of TotalWasatch County 2 0.2 IHC 406 47.3TriCounty (Uinta Basin) 13 1.5 Columbia 55 6.4Central Utah 27 3.1 Paracelsus 8 0.9Southeastern Utah 14 1.6 University of Utah 356 41.5Southwest Utah 46 5.4 Other 33 3.8Other 160 18.6 Number % of Total
Less than 25 . .Number % of Total 25 - 49 . .
2252 103 12 50 - 99 1 0.14321 87 10.1 100 + 855 99.7430 78 9.1 Number % of Total9962 54 6.3 Urban 856 99.81911 44 5.1 Rural . .2251 42 4.9
431 38 4.4 Number % of Total1912 36 4.2 Medicare 250 29.13314 36 4.2 Medicaid 70 8.21983 29 3.4 Other Government 56 6.5
Other 311 36.2Blue Cross/Blue Shield 99 11.5
Number % of Total Other Commercial 133 15.5159 184 21.4 Managed Care 215 25.1151 103 12 Other 35 4.1131 101 11.83951 67 7.8242 57 6.6Other 155 18.1
1
Note: DRG 1 is under MDC 1 Nervous System1998, Utah Hospital Discharge Database
Utah Office of Health Care StatisticsST3 1998
Affiliation
Bed Size
Location
Payer Distribution
28,4699,900
Patient Distribution by HospitalOwnership
Total Charge ($)24,915
92816,748
Clinical ProfileTop 10 ICD-9 Diagnosis Code
Top 5 ICD-9 Procedure Code
Charges and Length of StayLength of Stay (Days)
6.90.3
4145
0
Patient ProfileAge
Sex
Local Health District
DRG 1 : craniotomy age >17 except for trauma Total number of discharges: 858
ST3 1998 Table for DRG 1