Embed Size (px)
Citation preview
TOPIC MODELS AS A NOVEL APPROACH TO IDENTIFY THEMES IN CONTENT
ANALYSIS: THE EXAMPLE OF ORGANIZATIONAL RESEARCH METHODS
ABSTRACT
In this paper, we demonstrate the usage of topic modeling as a computer aided content analytic tool
in the larger context of methods for analyzing text data. We present some key features of topic
modeling based on Latent Dirichlet Allocation (LDA), and demonstrate its application by analyzing
the articles published in Organization Research Methods (ORM) since its inception. Our analysis,
based on 421 ORM articles reveals 15 topics, which are quite similar to other, more human intensive
review exercises. We also identified quantitative measures of relative importance of different topics,
which could be used as a variable for further analysis in quantitative studies. To further demonstrate
the usage of topic modeling, we identified how the emerged topics varied depending on the
disciplinary background of the authors. We conclude by providing some examples of the usage of
topic modeling in organizational research.
Keywords: Latent Dirichlet Allocation (LDA), topic model, text analysis

INTRODUCTION
Recent advances in collection and storage of text data offers many new opportunities as well as
challenges. On the one hand, such rich data can help answer questions that could not be answered in
the past due to unavailability or difficult access to text data. On the other hand, we still lack the
sophisticated methodologies through which researchers can harness the potential of big data stored
in text formats. In particular, despite many advances in the domain of content analysis, we still lack
sophisticated tools in organizational research that can be utilized to analyze big textual data such as
company reports, CEO speeches, and even newspaper reports. We elucidate the use of topic
modeling as a big data approach to identify themes in the content analysis of textual data.
As such, there is a long tradition of text analysis in organizational research as reflected by
several recent articles in Organizational Research Methods (Duriau, Reger, & Pfarrer, 2007; Short &
Palmer, 2008). As Duriau et al. (2007) identify, many of the existing tools of content analysis rely on
human interaction. For example, Duriau et al. (2007), in a content analysis of the literature on
content analysis, extensively relied on three coders, and analyzed a limited sample of only 98 articles.
There are two major limitations of content analysis that involves human interactions. First, most of
these methods require some extent of human coding which potentially biases the outcomes and
limits the amount of data that can be processed without putting undue stress on the human coders.
Human interactions puts excessive cost on data collection and analyses, forcing researchers to make
critical decisions about limiting the sampling size, and even research questions being investigated
(Weber, 1990). Second, human involvement may lead to researcher bias raising concerns about the
reliability and validity during the data coding and analysis stage (Carley, 1993). Despite these
limitations, content analysis continues to rely on human coding to a great degree.
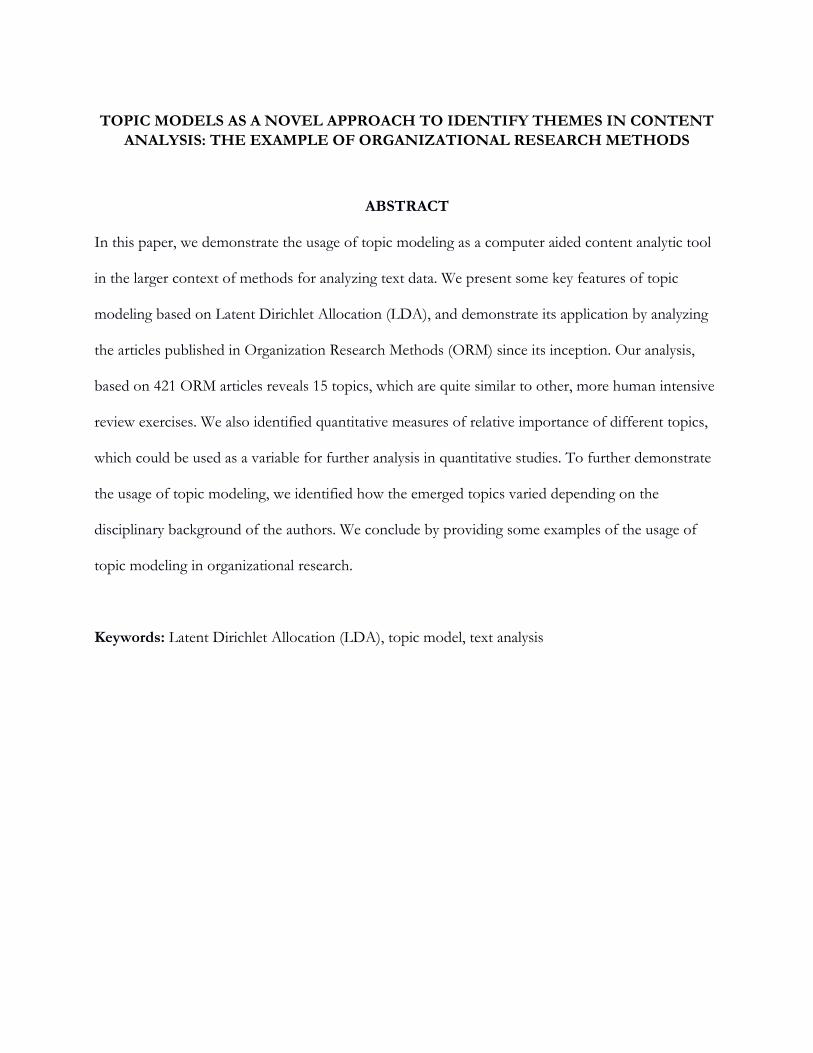
In recent years, some scholars have begun to harness the advancements in computer aided
analytic methods for content analyses. These offer several benefits. For example, large volumes of
textual data have become available in recent years, which allows for analyzing the entire populations
in a longitudinal setting (Osborne, Stubbart, & Ramaprasad, 2001). In a recent paper analyzing the
literature on emerging markets, Piepenbrink & Nurmammadov (2015) analyzed nearly 6000 texts
covering 18 years. Since, such analytic techniques do not rely on human interaction, there is little cost
considerations in analyzing large corpora of data. Use of computer aided methods also minimizes
researcher bias in different stages including sample selection, data coding as well as data analyses.
Thus, computer aided analytic tools enhance the reliability and validity of data coding and analyses.
Despite these advantages, Duriau et al. (2007) report that only 24.5% of the studies in their sample
utilized computer aided tools to some extent. One of the reasons for relatively limited adoption of
computer aided tools is lack of awareness about the theory and usability of different tools. In this
paper, we redress this by elaborating on “topic modeling” as a computer aided content analytic tool.
While topic modeling as a tool is relatively new, there has been a nascent stream of literature
in political science (Grimmer & Stewart, 2013) as well as management (Kaplan & Vakili, 2015) and
marketing (Tirunillai & Tellis, 2014) that demonstrates the tremendous potential of this technique for
analyzing large corpus of text data. In the following sections, we first put topic modeling in the
context of other text or content analysis methods for classification of large corpora of text. We then
provide the rational for topic models and give an intuitive description of the method, based on the
Latent Dirichlet Allocation (LDA) introduced by Blei, Ng, Jordan, & Lafferty (2003). We
demonstrate the use of topic modeling by analyzing the articles published in Organization Research
Methods since its inception. Throughout this article we will use the terminology of natural language

processing, where word is the basic unit of data and is an element of the vocabulary, which is a set of V
words or terms. A document is a sequence of N words, and a corpus is a collection of M documents. The
document-term-matrix (dtm) is a matrix representation of the corpus, with the rows presenting the
documents and the columns the vocabulary and the frequency of each word or term as entry into the
matrix elements.
TOPIC MODELING AND CONTENT ANALYSIS
Topic modeling falls under the broad domain of content analysis methods. Duriau et al. (2007: 6)
define content analysis as “any methodological measurement applied to text (or other symbolic
materials) for social science purpose”. We focus on those methods which are primarily used for
categorization and analysis of text data. Grimmer & Stewart (2013) provide a detailed categorization
of methods for text analysis, which we present in a simplified form in Figure 1.
----------Insert figure 1 about here----------
As presented in Figure 1, a key distinctive feature of different text analyses tools is the a
priori knowledge of categories, themes or topics. When the classification categories are known in
advance, specific coding scheme could be developed based on which human coders could manually
extract the topics. Reliance on human coders puts excessive burden and costs that forces the
researchers to limit the corpora for analysis. This limitation can be partially overcome by
computational dictionary or supervised learning methods. However, these methods are not
appropriate when the objective is to extract topics from corpora without prior knowledge of them.
Such methods fall under the category of fully automated classification or unsupervised learning. In
these cases, we analyze a document-term-matrix, which counts the frequency with which words of a
given vocabulary occur in each document under analysis.

The automated classification methods are further divided into single and mixed membership
models, depending on membership in one or more categories or clusters. Clustering such as k-means
or hierarchical clustering categorizes corpora into mutually exclusive clusters and exhaustive groups
and assigns each document into exactly one cluster (Manning, Raghavan, & Schütze, 2008). Mixed
membership models such as LDA, are however based on the principle that documents typically
consist of a mix of topics. Most clustering algorithms are based on similarity measures and an
optimization of objective functions that capture the idea of clustering of similar objects. LDA, on the
other hand, is a Bayesian inference method that estimates the most likely topics given the observed
corpus and the assumed generative process of the documents. Both require the input of the number
of classifications, clusters or topics or the cutoff point for hierarchical clustering, and are applicable
to large corpora. All these methods are strongly decreasing the dimensionality of the columns of the
dtm from the size of the vocabulary to the number of clusters respectively topics.
The mixed-membership models can be interpreted as a kind of principal component analysis
(PCA) for discrete problems as the dtm contains only integer and zero entries (Blei, 2012; Buntine &
Jakulin, 2006). The early roots of LDA are Latent Semantic Analysis (LSA), which was developed by
Landauer & Dumais (1997) in psychology to extract meaning from large corpora, using singular
value decomposition of linear algebra to reduce the dimensionality. The extension, probabilistic LSA
(pLSA), assumes the existence of latent classes and a probabilistic mix of classes for each document
and introduced statistical modeling (Hofmann, 1999) in finding the latent structure. However, the
topic mix for each document is a parameter rather than generated by a model, which leads to a
steady growth of parameters with increasing size of the corpus. Blei et al. (2003) address this issue in
their seminal paper on the LDA algorithm, which is an unsupervised machine learning method for

detecting topics without prior knowledge of them. It is a probabilistic generative model for
collections of documents (or more general collections of discrete data such as texts or images) to
infer the topics of documents as well as the topic proportion for each document. LDA uses Bayesian
inference based on Bayes' theorem, which estimates the probability of model parameters given the
observed data (Jebb & Woo, 2015).
𝑝(𝑝𝑎𝑟𝑎𝑚𝑡𝑒𝑟|𝑑𝑎𝑡𝑎) =𝑝(𝑝𝑎𝑟𝑎𝑚𝑒𝑡𝑒𝑟) × 𝑝(𝑑𝑎𝑡𝑎|𝑝𝑎𝑟𝑎𝑚𝑒𝑡𝑒𝑟)
𝑝(𝑑𝑎𝑡𝑎)
In Bayesian interpretation the left side is the posterior probability of the parameters, given the observed
data, while p(parameter) is the prior probability before the data are known, p(data|parameter) is the
likelihood, the probability of observing the data, given the parameters and p(data) is the evidence.
While topic modeling as a method is gaining traction in computer science, it is relatively new
in social science and organizational research. There are several advantages of using trained LDA
model for topic modeling from an application perspective. First, no prior knowledge of the topics is
required, which eliminates researchers’ bias as well as allows examining hitherto unknown topics.
Second, large corpora of thousands to millions of documents can be dealt with, removing the
computational limits imposed due to human coding and analysis. Third, it can capture polysemy (a
word can carry different meanings) as well as synonymy (different terms carry the same meaning),
which are both critical in analyzing texts. Fourth, it allows multiple topics per document. Fifth, new
documents can be analyzed by the same trained model. Finally, the model allows quantitative analysis
across topics, documents, words and meta-data. The “costs” of LDA is computer-intensive modeling
for large corpora and time-consuming model selection and validation process.

Latent Dirichlet Allocation
LDA is based on a simple premise that there are latent topics in a collection of documents (corpus).
There is a generative process to create the documents and the inference algorithm to extract the topics as
well as their proportion and word assignment in each document from the input of the observed
collection of documents (Blei et al, 2003; Blei & Lafferty, 2009; Blei, 2012; Steyvers & Griffiths,
2007). Here, we focus only on the intuition and logic behind LDA modeling.
The basic intuition of LDA is threefold: First, the corpus, such as the articles in the journal
of Organizational Research Methods (ORM) or their abstracts, covers a hidden or latent set of K
topics. The number of topics, K, is the key parameter of LDA. For instance Aguinis, Pierce, Bosco,
& Muslin (2009), in their analysis of the ORM, found topics such as survey, validity, reliability, or missing
data. Second, each topic is defined by a probability distribution over words of the vocabulary that co-
occur frequently, i.e. there are words that occur with high probability in the given topic, while others
are extremely unlikely. Typically the words with high probability will specify the topic. For instance
the topic of missing data may contain terms such as missing, impute, list wise with high probability. Third,
each document, specified by its words, covers typically a mix of topics with varying proportions for
each topic. The number of topics per document with substantial proportion can vary. For instance,
there could be just one dominant topic with 80 or 90 percent of all words contributed by this topic,
two strong topics with each of them contributing 60 and 40 percent respectively to the document or
three topics with the proportions of, for example, 20, 35 and 40 percent. Figure 2 shows an example
of an abstract with 3 topics. The superscripts indicate the topic number. The gray words were
eliminated in the preprocessing as described later.
----------Insert Figure 2 about here----------
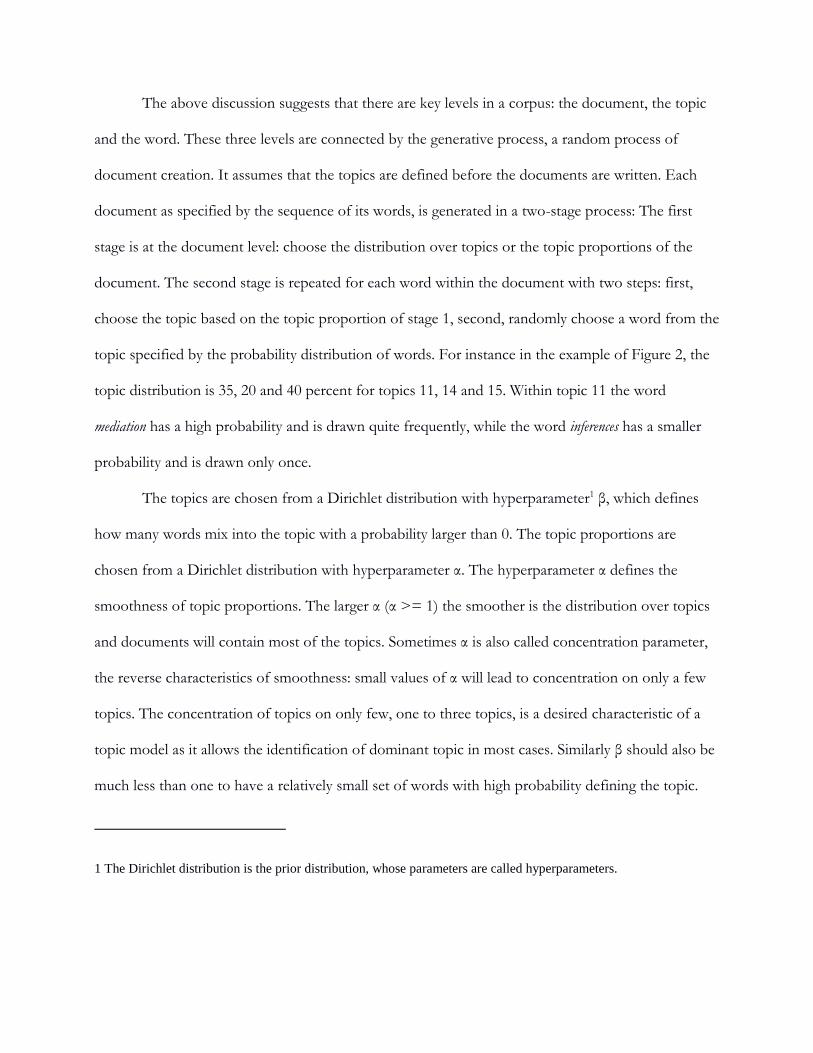
The above discussion suggests that there are key levels in a corpus: the document, the topic
and the word. These three levels are connected by the generative process, a random process of
document creation. It assumes that the topics are defined before the documents are written. Each
document as specified by the sequence of its words, is generated in a two-stage process: The first
stage is at the document level: choose the distribution over topics or the topic proportions of the
document. The second stage is repeated for each word within the document with two steps: first,
choose the topic based on the topic proportion of stage 1, second, randomly choose a word from the
topic specified by the probability distribution of words. For instance in the example of Figure 2, the
topic distribution is 35, 20 and 40 percent for topics 11, 14 and 15. Within topic 11 the word
mediation has a high probability and is drawn quite frequently, while the word inferences has a smaller
probability and is drawn only once.
The topics are chosen from a Dirichlet distribution with hyperparameter1 β, which defines
how many words mix into the topic with a probability larger than 0. The topic proportions are
chosen from a Dirichlet distribution with hyperparameter α. The hyperparameter α defines the
smoothness of topic proportions. The larger α (α >= 1) the smoother is the distribution over topics
and documents will contain most of the topics. Sometimes α is also called concentration parameter,
the reverse characteristics of smoothness: small values of α will lead to concentration on only a few
topics. The concentration of topics on only few, one to three topics, is a desired characteristic of a
topic model as it allows the identification of dominant topic in most cases. Similarly β should also be
much less than one to have a relatively small set of words with high probability defining the topic.
1 The Dirichlet distribution is the prior distribution, whose parameters are called hyperparameters.

If the topics are known, the two-stage process is quite straight-forward. However, in reality
the topics are the hidden or latent structure that the researcher wants to extract from a corpus. The
LDA method is designed such that it inverts the generative process (Blei, 2012) by working
backward to explain the observed data. It formulates generative process as well as the hidden
parameters such as the topics, the topic proportion, and the observed words in the corpus in
mathematical language. This leads to a joint probability distribution of latent and observed
parameters. From this the posterior distribution is derived. LDA describes the probability distribution of
topics and their proportions given the observed words of the corpus and α and β of the generative
process. While this formula is rather complex to compute, several inference algorithms from
machine learning exist for the approximate calculation of the latent parameters (Asuncion, Welling,
Smyth & Teh, 2009). All algorithms for calculating latent parameters start with random assumptions
regarding the probability distribution, check for the goodness of fit and update these iteratively.
The posterior distribution reflects the dependencies created by the generative process. For
instance the topic assignment for a given word and document depends on the topic proportions for
this document. Often the parameters α and β are specified heuristically such that α = 50/K and β =
0.01 (Griffiths & Steyvers, 2004). These can be further refined based on learning from the data. This
leaves K, the number of topics, as the only input parameter. The number of topics depends on the
research question and the required granularity of topics. The optimal number K is often determined
in a data-driven approach. We discuss these in the section on model selection.
WORK FLOW OF TOPIC MODELING
The process of topic modeling consists of five steps: The corpus collection and definition, the
preprocessing of the corpus, the topic modeling, the topic model validation and finally the topic
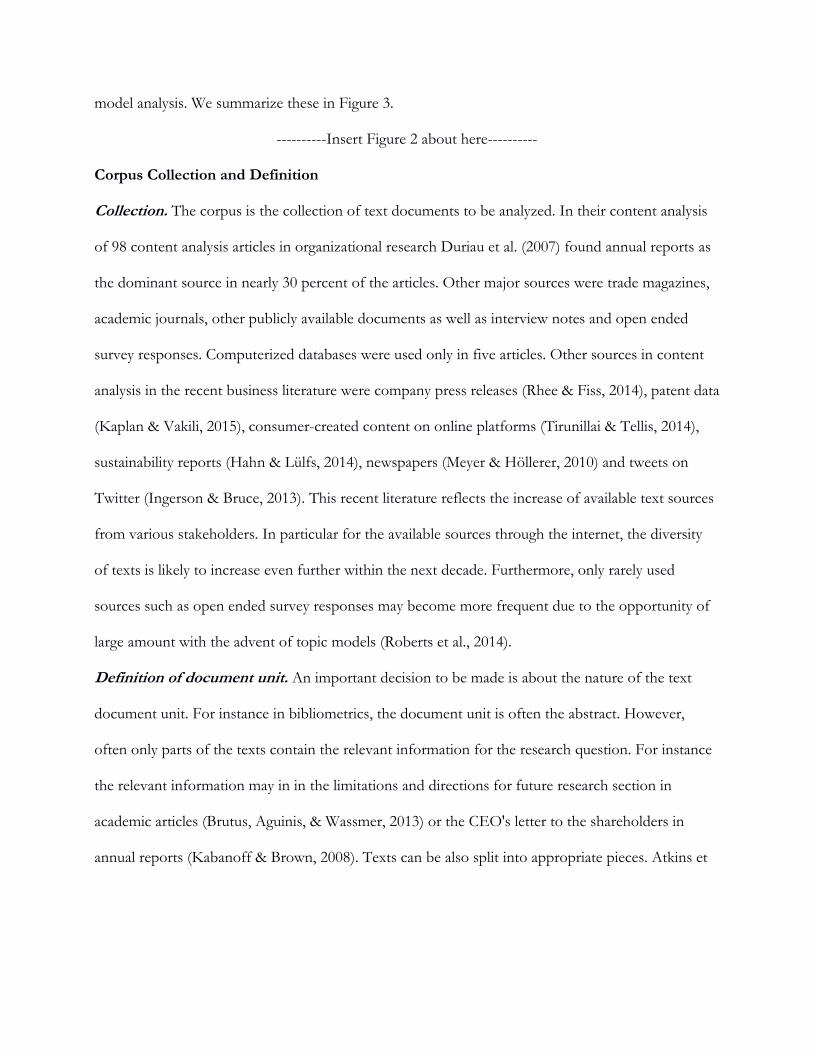
model analysis. We summarize these in Figure 3.
----------Insert Figure 2 about here----------
Corpus Collection and Definition
Collection. The corpus is the collection of text documents to be analyzed. In their content analysis
of 98 content analysis articles in organizational research Duriau et al. (2007) found annual reports as
the dominant source in nearly 30 percent of the articles. Other major sources were trade magazines,
academic journals, other publicly available documents as well as interview notes and open ended
survey responses. Computerized databases were used only in five articles. Other sources in content
analysis in the recent business literature were company press releases (Rhee & Fiss, 2014), patent data
(Kaplan & Vakili, 2015), consumer-created content on online platforms (Tirunillai & Tellis, 2014),
sustainability reports (Hahn & Lülfs, 2014), newspapers (Meyer & Höllerer, 2010) and tweets on
Twitter (Ingerson & Bruce, 2013). This recent literature reflects the increase of available text sources
from various stakeholders. In particular for the available sources through the internet, the diversity
of texts is likely to increase even further within the next decade. Furthermore, only rarely used
sources such as open ended survey responses may become more frequent due to the opportunity of
large amount with the advent of topic models (Roberts et al., 2014).
Definition of document unit. An important decision to be made is about the nature of the text
document unit. For instance in bibliometrics, the document unit is often the abstract. However,
often only parts of the texts contain the relevant information for the research question. For instance
the relevant information may in in the limitations and directions for future research section in
academic articles (Brutus, Aguinis, & Wassmer, 2013) or the CEO's letter to the shareholders in
annual reports (Kabanoff & Brown, 2008). Texts can be also split into appropriate pieces. Atkins et

al. (2012) in their analysis of topics in family therapy, split the transcripts of therapy sessions into
parts by wife, husband and therapist as they believe that the three parties may cover different topics.
On the other hand tweets are often aggregated to the daily contribution of writers (Barbera, 2015).
Preprocessing of the Corpus
The preprocessing of the corpus, a standard procedure in computational linguistics (Manning et al.,
2008), is the cleaning and consolidation of the vocabulary as well as the transformation of text into
quantitative data (Feinerer, Hornik & Meyer, 2008; Grimmer & Stewart, 2013; Lucas et al., 2015;
Roberts et al., 2014). The purpose of preprocessing is threefold. First, it removes noise, elements in
the text - punctuation, numbers and words - that carry little information. Second, it reduces the size
of the vocabulary, the dimensionality of the problem, and hence the computational as well as
interpretative complexity of the models (Atkins et al., 2012; Tirunillai & Tellis, 2014). Third, it
transforms the corpus into a document-term-matrix (dtm), with the documents as rows, the words as
columns and the frequency of each word for each text as entries (Grimmer & Stewart, 2013).
The preprocessing of the corpus contains several steps; many of them are a standard
procedure in quantitative text analysis. The key concept of topic models as well as many other
quantitative text analysis methods is the concept of bag of word, where the order of words do not
matter, only the frequency of their occurrence is important (Grimmer & Stewart, 2013).
Based on the list of words, typically in alphabetic order, following steps are performed. First,
numbers and punctuation, eventually url and html tags are removed, second all words are put into
lower case. Third, stop words, which are very common words in the language of analysis and convey
no meaning, are removed. Examples of stop words are "the" and "and" for the English language. In
addition to these stop words defined by the language, a domain-specific list of stop words can be
defined and accordingly removed. For instance for the corpus of ORM research, method, paper, and
article are general terms in the domain and will not carry information on the specific abstract. Often
also short words, typically less than three characters are removed.
Fourth, stemming removes the ending of words and reduces them to their lexical root or stem.
Different stemming algorithms are available. The Porter stemmer (Porter, 1980), which was also used
for this study, is one of the frequently used (Quinn et al., 2010). Singular and plural of a noun will be
identified as a single word. Similarly, different conjugations of a verb are reduced to one stem. For
instance, correlate, correlated, correlates, correlating, correlation, correlational and correlations in our vocabulary
are reduced to correl. However, nouns and their according verbs are not always reduced to the same
stem. For instance in our vocabulary usage, use, and user are still included after stemming. The
stemming leads to a significant reduction of the vocabulary. It also improves the performance of
topic models on small data sets (Roberts et al., 2014).
Fifth, further efforts may be taken to eliminate the most frequent and rare terms. A common
procedure is the term frequency-inverse document frequency algorithm (tf-idf), which assigns scores
to words within documents that reflect the importance (Blei, 2009; Grün & Hornik, 2011; Manning
et al. 2008). Intuitively the score is higher the more frequent the word is within the given text.
However, words common within the corpus will also appear more likely in a given document. For
instance method is likely to occur in nearly any abstract of our corpus. In order to penalize for
frequent occurrence, the inverse document frequency is calculated. It takes the number of
documents, in which the words occurs, into account, rather than the total occurrences over the
corpus. The tf-idf score is defined as the number of occurrences within a document divided by the
logarithm of the inverse percentage of documents in which it occurs.

The researchers choose a percentage threshold for the tf-idf and words with only a higher
score are retained. Other procedures to remove frequent and rare words is to cut all words above an
occurrence threshold, require a minimum occurrence of a term (Jelveh, Kogut, & Naidu, 2015) or
occurrence in a minimum number of documents (Quinn et al., 2010). For short texts such as
abstracts of articles the remaining text may be very short and a minimum of terms may be applied
(Siddiqui, 2013).
These five steps are frequently applied in the preprocessing of the corpus for topic modeling,
where steps 1 to 4 are applied in nearly all studies. The further reduction of the vocabulary in step 5
is less standard. While step 1 to 4 are rather mechanical without any detailed inspection of the
remaining vocabulary, the thresholds for tf-idf, minimum or maximum occurrence may be chosen
based on the resulting vocabulary, but then apply rigorously without exceptions. More refined
methods are the removal of proper nouns, context specific names and terms, such as country names in
a study across countries (Bagozzi, 2015), congress members and city names (Grimmer, forthcoming)
or species names in a bibliometric study on aquatics (Natale, Fiore, & Hofherr, 2012). A further
refinement of the vocabulary can be the identification of synonyms and their combination into a
joint term (Blaydes, Grimmer, & McQueen, 2013).
So far we discussed words as basic text elements. More complex element are n-grams, which
are combination of n adjacent words (Hopkins & King, 2010). For instance bigrams are pairs of
adjacent words; trigrams are combinations of three words. Words are a special case and are called
unigrams. With growing n the number of n-grams grows very rapidly, so larger n-grams are rarely
used. The advantage of n-grams is that they take some context into account as they keep some order
of word occurrence. For instance in the corpus of this study interrat agreement would be a relatively
frequent bi-gram. However, their large number increases the complexity. For instance Jelveh et al.
(2015) in their study on political ideology of economists used up to n-grams of length of eight
leading to more than one billion unique n-grams.
While LDA can be run on the original corpus, preprocessing makes the topics sharper and
more reliable as the vocabulary is more precise and carries more meaning. In particular non-
informative, frequent words can lead to quite uniform assignments of topics to most texts (Siddique,
2013) or some topics mainly consisting of frequent words without information (Roberts et al., 2014).
Topic Modeling
The estimation of the model typically starts with random initialization, testing of fit and
improvement of the parameters until the model converges. However, the result may be only a local
optimum. In order to increase the chance of a obtaining a good model, several models with different
initializations are run. It can be compared with the exploration of an unknown mountainous region
with the goal of finding the deepest valley. Explorers may choose different starting points and
compare the altitude of the found valley. The general approach is to run several models with
different random seeds, i.e. with randomly chosen initialization, as well as varying number of topics
and select the best model as described in the next section.
Model selection
The model selection consists mainly in choosing the parameters resulting in the most appropriate
model. As the number of topics, K, is the key input parameter, the appropriate choice of K is the
first task of model selection. We also need to define, what a good or best model should be, leading to
the task of topic quality assessment and validation of topics across various parameters, performed in
postprocessing. All three major steps – preprocessing, model design and postprocessing – can impact
the model selection (Chuang et al., 2014).
Number of topics: The number of topics K, the only input parameter into LDA, is not known a
priori. It depends on the size and diversity of the corpus as well as the research question and the
required granularity of topics (Roberts et al., 2014). In case of a too small K, topics are rather broad
and/or mixed, while in the case of too large K, topics become very specific and difficult to interpret.
Often also topics consisting mainly of words carrying little specific meaning, so-called random topics
(see below) emerge as results of overfitting (Steyvers & Griffiths, 2007). For instance, AlSumait,
Barbará, Gentle, & Domeniconi (2009) showed the example topic of {was, report, official, any, did, said,
ask, told, made, comment, time} for a corpus of Reuter news articles.
The common approach to define the number of topics is to run models with held-out data.
The main idea is to split the corpus in a training and a testing subset. The model is estimated, i.e.
trained, on the former and tested on the latter by predicting the words in the testing document.
Perplexity measures the performance of the prediction for the ntest words wtest in the test documents or
how surprised or perplexed the model is by the test documents.
𝑝𝑒𝑟𝑝𝑙𝑒𝑥𝑖𝑡𝑦(𝐷𝑡𝑒𝑠𝑡) = 𝑒𝑥𝑝 {−∑ log 𝑝(𝒘𝑑)𝑀
𝑑=1
∑ 𝑁𝑑𝑀𝑑=1
}
The perplexity measure is the inverse of the geometric mean of the per word probability in
the held-out document (Newman, Lau, Grieser, & Baldwin, 2010). It measures the uncertainty in the
prediction of a single word (Griffiths & Steyvers, 2004; Manning et al., 2008). The intuitive
interpretation is that of the expected size of a vocabulary in case of random assignment to generate
the observed words. A better than chance model requires a smaller vocabulary, indicated in a lower
perplexity value (Heinrich, 2005). Typically the perplexity measures of held-out documents for
models with varying K are calculated and the K with the minimum perplexity is chosen. Wallach,
Murray, Salakhutdinov, & Mimno (2009) compared and discussed several evaluation techniques to
estimate the perplexity. Related to the document held-out approach is document completion, where
documents, rather than the corpus, are split into training and testing parts (Rosen-Zvi, Griffiths,
Steyvers & Smith, 2004). Alternatively, Griffiths & Steyvers (2004) ran various models with
increasing K on the whole corpus with specified values for the hyperparameters via Gibbs sampling
and found a maximum for the log-likelihood, indicating the optimal value for K.
Quality of topics. As pointed out by Quinn & al. (2010) and Grimmer & Stewart (2013) the major
labor cost of researchers with LDA are in the post-processing of topic assessment and validation,
requiring high expert knowledge of the subject. We first introduce the issues, which can arise in topic
quality and then the methods to assess topic quality, including recent tools that support human
expertise with visualization of top words of topics ranked by statistical measures. Several reasons can
lead to poor – incoherent and difficult to infer meaning – topics (Mimno, Wallach, Talley, Leenders,
& McCallum, 2011, Newman, Karimi, & Cavedon, 2009). Two different topics may be chained
together by words frequently used in both of them. For example, articles on Carolina and Korea are
chained together by South and North, which are used for both (Newman et al., 2009). In intruded
topics often one or two words do not fit the overall cohesive set of words. There could also be
“Prose” style topics (Newman et al., 2009), which are defined by terms that carry little meaning. In
the context of ORM this would be a topic with words such as {discuss, evaluate, compare, want, increase},
which are frequent terms in most research and methods articles.
There are two ways to define the quality of a model – statistical approach and human
inference. The statistical approach is the comparison of the perplexity of the models and chooses the
model with the lowest/highest perplexity. Wallach et al. (2009) provided several methods for
evaluation purely based on statistical means. However, this measures the predictive power of the
model, but not the meaning of the topics. Chang, Boyd-Graber, Gerrish, Wang, & Blei (2009) have
shown that the statistically best topics are not necessarily the ones judged best by human experts.
They developed two tests for human interpreters: word intrusion and topic intrusion. In the word intrusion
task human raters had to identify randomly chosen intruding words that did not belong to the top
five words of a model. In case of a coherently defined topic by the top five words the intruder
should be easy to identify. In their simple example of {dog, cat, horse, apple, pig, cow} the word apple is
easy to pick as intruder, while in the set {car, teacher, platypus, agile, blue, Zaire} the identification of the
foreign word is largely a guess. In the topic intrusion task the human raters received the title, some
parts of the text of a document and its top three topics together with an intruding topic and were
asked to identify the intruder.
Several articles (e.g. Bischof & Airoldi, 2009; Chang et al., 2009; Mei, Shen, & Zhai, 2007,
Newman et al., 2009, Sievert & Shirley, 2014) suggested solutions to the issue of meaning,
interpretation and semantic cohesion of topics, what Newman et al. (2009) call usefulness for human
use. Roberts et al. (2014) argued that semantically interpretable topics are both cohesive and exclusive.
Cohesive means that the top words of a topic have a tendency to co-occur within documents, while
words normally appear only once as top word in a topic. Mei et al. (2007) developed algorithms to
assign topic labels, the essence of the meaning of a topic, automatically rather than by human
experts, following efforts focused on the development of scores to measure usefulness or coherence.
Newman et al. (2009) suggested the pointwise mutual information (PMI) score based on
pairwise co-occurrence of words in Wikipedia and Google's n-grams data set. They found a relatively

high correlation between both external PMI scores and human scoring. Mimno et al. (2011)
introduced the measure of topic coherence, which use word co-occurrences, similar to PMI, to detect
chaining and intrusion. Taddy (2012) introduced lift, which is a word's probability within a topic
divided by its marginal probability across the corpus. This reduces the importance of very frequent
words in the corpus; however, it can give too much weight to rare words in the topic definition.
Bischof & Airoldi (2012) introduced FREX, a weighted harmonic mean of words' ranks regarding
theirs frequency and exclusivity of words in a topics. The harmonic mean gives more weight to the
lower score of the two measures to avoid that a high score in one outweighs a poor score in the
other. Sievert & Shirley (2014) continue in this tradition and build on FREX and lift to define
relevance r with a weighting parameter λ between 0 and 1.
𝑟(𝑤, 𝑘|𝜆) = 𝜆 log(𝛷𝑘𝑤) + (1 − 𝜆)log (Φ𝑘𝑤
𝑝𝑤)
The left term is the logarithm of the topic probability Φ(w,k) multiplied by λ, the right term
the logarithm of the lift measure multiplied by ( λ-1). For λ=1 relevance reduces to the common
topic probability, for λ=0 to the logarithm of the lift measure. Sievert & Shirley (2014) found the
best agreement with human raters with a λ of approximately 0.6, giving slightly more weight to the
topic probability. These various approaches to reconcile best statistical models with human expert
assessment were further refined into interactive visualization tools (Chaney & Blei, 2012; Gardner et
al., 2010; Chuang, Manning, & Heer, 2012; Sievert & Shirley, 2014). These tools visualize the topics
by displaying the top words based on rankings by statistical measures such as relevance or lift and
allow the inspection and assessment of many topics, across several different models, a manageable
task for human experts based on statistical measurement. The next section shortly describes the
validation across several models.
Topic validation Researchers will compare the set of candidate models based on their
statistical properties such as perplexity and hyperparameter α, the coherence, often assessed with the
support of a visualization tool, and “exemplar” documents with a high proportion for a given topic
(Roberts et al., 2014). Typically one starts with a number of topics K indicated by perplexity analysis,
chooses the model with lowest perplexity within various initializations and assesses top words based
on a given measure and typically three exemplar documents. An assessment of topic coherence, for
instance by manually assigning a label, and fit of exemplar documents provide a good overview of
the overall quality of the model. Even if the first model is satisfying, it is important to check for the
stability across varying initialization parameters to guarantee that the chosen model is not a statistical
artifact, but robust against changing parameters (Roberts et al., 2014). For instance we found in our
model that the majority of topics, in particular with high quality assessment, are stable across varying
random seeds and increasing number of topics.
As a result of the evaluation of topic models researchers will agree on the best model, in the
following just called the (topic) model. This will be the input model for the further analysis.
Analysis of Topic Models
The major output of the model besides the topic definitions Θ, the list of words with their
probabilities, are the document-topic proportions θ, the percentages with which each topic occurs in
each text. They define the topic or intellectual structure of the corpus. Topics can serve as new unit
of analysis. For instance in bibliometrics, rather than studying relationships between disciplines,
journals, affiliations or countries, the intellectual structure as represented by the topics can be
examined. In general, the topics can be used in similar way as factors in factor analysis.
The quantitative nature of the output allows identification of documents of any given topic

distribution as well as calculating the similarity between topics as well as between documents. In
particular the latter is used for information retrieval to find documents with similar topics (Yi &
Allan, 2009). Together with additional meta-data of the documents, such as date, location, author, or
discipline, the changing structure of the corpus depending on the meta-data can be performed. In the
refined structural topic model (Roberts et al., 2014) the meta-data are included as covariates within
the model allowing for more advanced analysis.
Similarity between topics and documents. The distributions Θ and θ are probability distribution,
where Θ(t) for topic t is a vector of length V, the size of the vocabulary and θ(d), the topic
proportions for document d, is a vector of length K, the number of topics of the model. The distance
metric for two documents di and dj based on topic models is normally the Hellinger distance,
commonly used in the information retrieval literature (Moser & Reeves, 2014).
𝑑𝑖𝑠𝑡(𝑑𝑖 , 𝑑𝑗) = ∑ (√𝜃𝑖,𝑘 − √𝜃𝑗,𝑘 )2𝐾
𝑘=1
where θi,k and θj,k are the topic proportions of the kth topic in document i and j.
Steyvers & Griffiths (2007) discussed other similarity measures for probability distributions
as well as similarity between words based on sharing the same topics.
Topic-based similarity is in particular apt for estimating document similarity as it is close to
human judgment, which is based on shared concepts or topics. Newman et al. (2009) showed that
topic-based similarity calculated with Hellinger distance has an agreement with human judges of
nearly 90%. Tirunillai & Tellis (2014) used LDA in a marketing application to extract product quality
dimensions from user product reviews and use the Hellinger distance to calculate brand positioning
in the multidimensional space. As with any distance measures across objects, further multivariate

analysis such as clustering or multidimensional scaling (MDS) can be applied. The similarity of topics
is commonly used in topic model evaluation to assess the stability over different parameters (Steyvers
& Griffiths, 2007) and for visualization tools, where for instance multi-dimensional scaling is used to
display the topics on a two-dimensional map based on their similarity (Sievert & Shirley, 2014).
Meta data. The key question in this type of analysis is how the topic structure varies across
variables? Very common examples include the change of topic structure over time with the
identification of hot and cold topics, as well as those growing or declining over time (Griffiths &
Steyvers, 2004). Similarly the changing topic distribution across space can be studied (Ghosh &
Guha, 2013). Another common approach is the difference of topic structures across groups defined
by meta-data such as distinct topic coverage of disciplines in bibliometric studies (Piepenbrink &
Nurmammadov, 2015). A popular way of showing these varying topic structures are heatmaps, a
graphical presentation of (topic-group-) matrices where values of matrix elements are indicated by
colors on a color scale (Natale et al., 2012).
One can conduct more advanced analysis by using the output of topic models such as topic
proportions for further statistical tests or construct definition. For instance Moser & Reeves (2014)
measured the cohesion of speeches of Members of Parliament for different parties and years as
average distance of all speeches in each group and found significant differences between the two
observed years for both parties via t-test. Kaplan and Vakili (2015) used topic modeling on patents to
identify patents that started new topics in a given technological field.
EXAMPLE: THE INTELLECTUAL STRUCTURE OF ORM
Data collection
We collected the abstracts, our unit of text document, and meta information for ORM articles from
January 1998 to April 2015 from Web of Science (WOS). As the years 1999 and 2000 are not
included in WOS, their bibliometric information was retrieved from the website of ORM. In
addition thirteen online first abstracts and their meta information were retrieved in April 2015. This
leads to 421 unique entries in the database (editorial material, introductions to feature topics, book
reviews and corrections are excluded). As we are interested whether authors from ORM's two
disciplines – psychology and management – cover different topics, we added for each article a
discipline category in the following way: First, for each author we extracted the discipline based on
the affiliation or PhD information on the broad levels of psychology, management and other. Authors
outside of business schools, but related to management institutions, were assigned to management.
From the author disciplines, we categorized articles either as psychology, management, cross-disciplinary or
other. The first two categories define articles written from authors completely within the given
discipline, while cross-disciplinary articles have at least one author from management and one from
psychology, other have at least one author outside of the two disciplines of ORM.
We conducted the analysis with the statistical language R, Version 3.2.1. For the
preprocessing and the creation of the corpus we used the packages tm (Feinerer, Hornik & Meyer,
2008) and qdap (Rinker, 2013). We estimated the models with package topicmodels (Grün & Hornik,
2011) and inspected the models with the package LDAvis (Sievert & Shirley, 2014). We used the
package pheatmap (Kolde, 2015) to plot the heatmap of average topic proportions across disciplines.
Data Preprocessing
The corpus underwent preprocessing in the following order: First, we removed numbers and
punctuation, put all abstracts to lower letters and removed all words with less than three characters.
Second, we removed the stop-words and applied stemming. Third, we applied a threshold of 0.1 for
the tf-idf score to remove the most frequent words. While this worked quit well, a few words - valid,
correl, respons – were kept despite their low td-idf score as they are relevant to research methods.
However, the terms measur, regression, theori and construct we kept excluded as they are rather high level
and ubiquitous in the corpus. Fourth, we removed context-specific stop-words such as strateg, job and
satisfact, as these relate to the context in which the methods were exemplified, rather than describing
the methods themselves. Keeping these words leads to a mix of methods and context in topics as
well as in some context specific topics related to strategy or job performance. Alternatively we could have
manually split the abstracts in method and context part with each becoming the new basic document
unit. Finally, we removed words appearing less than six times in the corpus or in less than four
documents. To ensure that abstracts are sufficiently long, we removed documents with less than ten
words. All these steps resulted in a dtm of 411 documents and 611 unique words.
Selection of the Topic Model
For the sake of ease of reporting we choose a topic model of 15 topics with the vocabulary as
described above and the lowest perplexity. We chose four ways to select and validate the final topic
model: First, we inspected the top words for each topic with the package LDAvis and assessed the
coherence of the topic by looking for word intrusion (Chang et al., 2009). Second, we assess for each
topic the three articles with the highest proportion for this topic (typically larger than 95 %) for their
fit. We also seek for external validity by comparing the emerging topics with those identified by
Aguinis et al. (2009) with human coding as well as checking with articles from a suitable feature topic
issue. Following Sievert & Shirley (2014) we accounted for the frequency of words in the corpus and
chose a parameter of λ = 0.6.
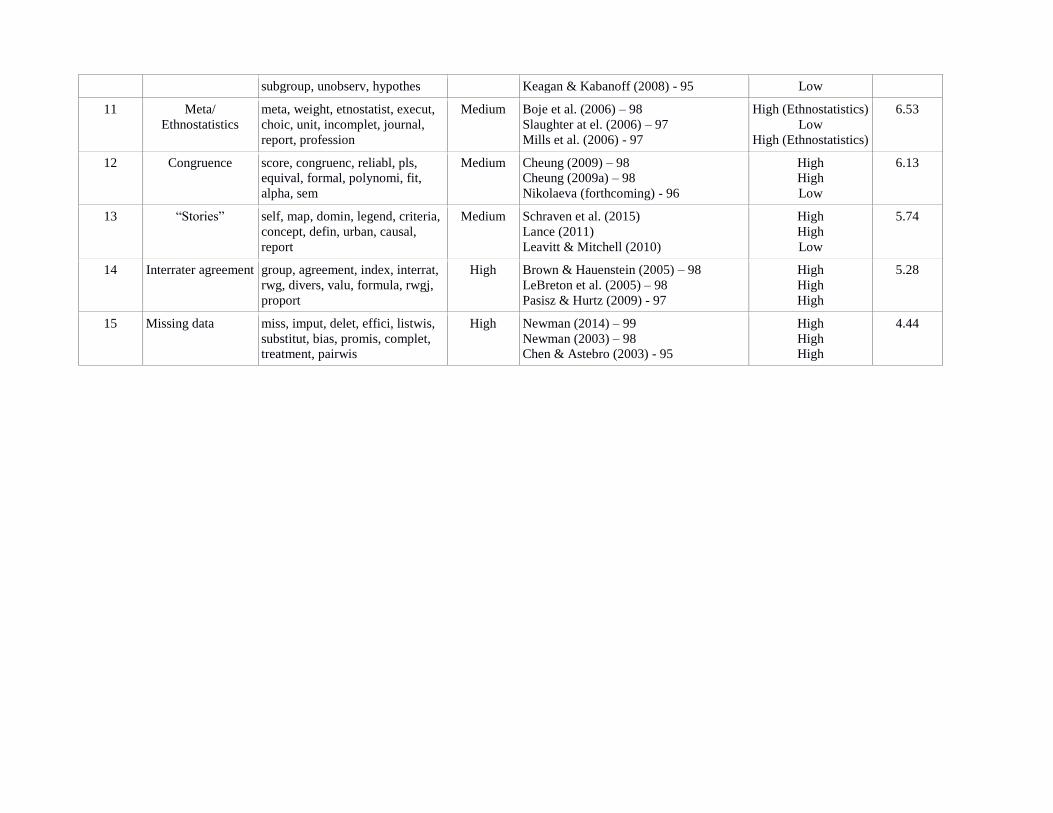
----------Insert Table 1 around here----------

In table 1 we provide the top 10 words based on this λ as well as a label for each topic and
our assessment of the topic cohesion, the top three articles with the topic specific θ and their fit for
this topic. We assessed the topic cohesion by asking ourselves the question “Do these words make
sense in an article about topic x?”. This mirrors the definition of cohesive by Roberts et al. (2014)
that highly probable words for a topic have a tendency of co-occurrence in a text. Out of the 15
topics eight are considered as highly cohesive, seven with medium cohesion, where two of these
seven appear as a mix of topics. While a refinement of the vocabulary may improve the results, as
little manual intervention as possible is preferred. Results of the topic modeling generally improve
with the amount of data, as the posterior distribution gets more and more information from the
observed data. In LDA, a corpus of a few hundred documents is considered as small. Second, for
each topic we read the top three abstracts and assessed how well these fit to topic. Overall, we
believe that the chosen topic model has reasonable cohesion given its parsimony with only 15 topics.
Aguinis et al. (2009) used a much more fine grained taxonomy based on ORM's categories
for reviewer assignment. They further analyzed for quantitative and qualitative, the stages of design,
measurement and analysis separately. They report the most popular topics for each of these
categories, resulting in 14 most popular topics for quantitative and four for qualitative methods, a
comparable number based on our analysis. Some of the topics prominently emerge in our topic
model, such as Survey response, scales and missing data, while others such as content analysis and validity
appear as part of the mixed topic Validity/Content analysis, temporal issues and multilevel within
Networks, qualitative research emerges as its own topic with Qualitative paradigm and as a specific
method of Ethnography. Other, more specific topics than in Aguinis et al. (2009), such as Mediation,
Interrater agreement and Congruence emerge.
Finally we analyzed for two feature topics in ORM with focus on topics identified in our
model. We expected that the articles of the special issue should have a high proportion of the topic
they focus on. We chose the feature topic Survey Nonresponse in April 2007 and Mediation in April 2008
as they both coincide with two of our topics.
Table 2 displays the six articles of Survey Nonresponse, their proportion in the top Survey response
and in the third column further topic assignments larger than 20 percent. First, all articles have a
proportion larger than 20 percent for Survey Response, which is large enough to consider the topic as
reasonably present. Four of the six articles have a topic proportion of close to 80 percent and higher.
Two of these articles are within the group of the top three articles and clearly identify Survey response
as the dominant topic. Rogelberg & Stanton (2007), where the topic proportion of Survey response is
still high, approximately equal with Missing data. They discuss nonresponse bias, and as bias is a top
term in Missing data this topic appears with a high percentage. Allen et al. (2007) is rather mixed with
Interrater agreement the strongest topic due to high occurrence of the terms ‘group’ and ‘divers’. It is an
example, where the context of work group mixes with the topic. We did not exclude the term group
due to its relevance for methods such as interrater agreement.
----------Insert Table 2 around here---------- Table 3 shows the list of eight articles, percentage for the topic Mediation and other topics
beyond 20 percent contribution. In this example all articles with the exception of Kenny (2008) have
a proportion of more than 20 percent. Four of the eight articles have a proportion close or above 80
percent, Taylor et al. (2008) is within the top three articles. We have a closer look at the four articles
with lower assignment. Mathieu et al. (2008) is the introduction to feature topic, where feature and
topic are relatively frequent words in Missing topics. Wood et al. (2008) perform a literature review on

more than 400 mediation studies in top organizational studies journals. They reach a high proportion
on Meta/Ethnostatistics. While they do not perform a meta analysis, a review is probably closest to
their approach of evaluating the performed studies as reflected such as report, which is quite strong in
Meta/Ethnostatistics. The other two are short commentaries with only 11 and 12 words left, where two
of them are related to numbers in the case of Kenny's commentary.
----------Insert Table 3 around here---------- In summary, for most articles, the featured topic is well identified as the dominant topic.
Those articles with rather low contribution are indications for improvement of the topic model such
as increasing the number of topics to have feature topic as a dedicated topic, a separation of context
and method and elimination of very short remaining texts and further cleaning of the vocabulary.
Analysis of the Topic Model
We focus in the analysis on the topic proportion within the whole corpus as well as authors across
the disciplines of ORM. The first question is the dominance of topics within the corpus, whether
they are equally well discussed or whether some topics are more popular than others. To answer this
question we calculated the arithmetic mean over all documents and display them in Table 1. With 15
topics, the uniform distribution yields 6.66 percent for each topic. This suggests that each topic with
average percentage of coverage above 6.66 percent is more frequent than in a uniform distribution
and below 6.66 percent underrepresented. We found that Missing data receives with a θ = 4.64
percent the lowest, and Qualitative paradigm with θ = 8.95 percent the highest attention.
As ORM is both a management as well as an applied psychology journal, we want to answer
the second question, whether scholars within the two different schools – business (185 articles) and
psychology (103) – as well cross-disciplinary teams of business and psychology (66) address different
topics in their articles. In order to answer this question we calculated for each topic, the arithmetic
average for each group. Figure 3 shows these values in the form of a heatmap, with blue indicating a
low and red a high mean with smooth color transition in between. The individual average values are
also displayed. We also performed hierarchical clustering on the topics based on the Hellinger
distance for the purpose to observe differences between clusters of topics across disciplines. We can
identify two topic clusters, which vary largely regarding their coverage across disciplines. The first
cluster (“Stories”, Scale items, Interrater agreement, Mediation, Missing data, Variance, Survey response and
Moderation) receives low coverage by business scholars, while the second cluster (Ethnography,
Qualitative paradigm, Networks, Validity/Content analysis, Congruence, Meta/Ethnostatistics and
Journal/Cognition) receive high attention by business researchers. In general the coverage flips, i.e.
low-coverage topics in business are high in psychology and vice versa. There are only two exceptions
to this rule – Interrater agreement and missing data – with also low coverage by psychologists. Author
teams from business and psychology make many contributions to Interrater agreement, Variance,
Networks, Meta/Ethnostatistics and Journal/Cognition, and have their “own” topic of Mediation. In
summary, ORM has varying topic coverage across its disciplines, as well as dominant topics for the
cross-disciplinary articles.
CONCLUSIONS
We set out to demonstrate the usage of topic modeling as a computer aided content analytic tool. We
presented topic modeling in the larger context of methods for analyzing text data. We then presented
some key features of LDA based topic modeling, and demonstrated its application by analyzing the
articles published in ORM since its inception.
We anticipate that text analytic tools, such as topic modeling will become increasing
important and popular tools in coming years. There are two main reasons for this. First, there will
be greater need and demand for tools for analyzing text data. With digitalization, there is ever
growing pool of valuable information, which is easily available. Researchers are often constrained by
the data they have or they can get in testing theories as well as in explaining important and interesting
phenomena. Text data provides rich information which could be mined to develop new constructs
and measures, which could be further combined with existing data for a richer analysis. Second,
there is growth in the number and sophistication of the computer-aided analytic tools that can
process text data in a scientific and rigorous manner. As more such tools become available, and
researchers become familiar with them, there will a cascading effect.
This paper is an attempt in this direction. By introducing topic modeling, we hope that
scholars will pick up topic modeling as a tool for not only literature review, but also for answering
novel and interesting research questions. We list some examples. A common criticism of strategy
research is that it is historic in nature, often analyzing past events, and not much useful in predicting
future events. One could analyze the speeches of CEOs at different forums to ascertain the future
course of action. One could also analyze the annual reports to ascertain the dominant themes on
which firms put emphasis, which could be an indicator of their future actions. In survey research,
open ended questions could be better utilized to get responses on issues on which it is difficult to get
response using close ended questions. There are many such discipline specific applications, and we
hope that this study helps scholars in uncovering and explaining interesting phenomena.
Appendix: Available software
Software, both open access and commercial, for LDA and further developments of topic modeling is
available from several sources. Grün & Hornik (2011) refer in their introduction to several available
software products for topicmodeling. Ponweiser (2012) provides a list available software packages
for topic modeling on page 30 of his diploma thesis. David Blei (2015) provides on his website a list
of open-source software provided by himself and his co-workers.
As we did our analysis with the statistical language R, which was already introduced in Organizational
Research Methods (Culpepper & Aguinis, 2011), we provide in Table 4 an overview of major R
packages that support topic modeling respectively the analysis of the results as of end of 2015.

REFERENCES
Aguinis, H., Pierce, C. A., Bosco, F. A., & Muslin, I. S. (2009). First decade of Organizational Research Methods. Organizational Research Methods, 12(1), 69–112.
Allen, N. J., Stanley, D. J., Williams, H. M., & Ross, S. J. (2007). Assessing the impact of nonresponse on work group diversity effects. Organizational Research Methods, 10(2), 262–286.
AlSumait, L., Barbará, D., Gentle, J., & Domeniconi, C. (2009). Topic significance ranking of LDA generative models. In W. Buntine, M. Grobelnik, D. Mladenić, & J. Shawe-Taylor (Eds.), Machine learning and knowledge discovery in databases (pp. 67–82). Springer Berlin Heidelberg.
Asuncion, A., Welling, M., Smyth, P., & Teh, Y. W. (2009). On smoothing and inference for topic models. In Proceedings of the twenty-fifth conference on uncertainty in artificial intelligence (pp. 27–34). Arlington, Virginia, United States: AUAI Press.
Atkins, D. C., Rubin, T. N., Steyvers, M., Doeden, M. A., Baucom, B. R., & Christensen, A. (2012). Topic models: A novel method for modeling couple and family text data. Journal of Familiy Psychology, 26(5), 816–827.
Bagozzi, B. E. (2015). The multifaceted nature of global climate change negotiations. The Review of International Organizations, 10(4), 439–464.
Barbera, P. (2015). Birds of the same feather tweet together. Bayesian ideal point estimation using twitter data. Political Analysis, 23(1), 76–91.
Bischof, J. M., & Airoldi, E. M. (2012). Summarizing topical content with word frequency and exclusivity. In J. Langford & J. Pineau (Eds.), In proceedings of the 29th international conference on machine learning (iCML-12) (pp. 201–208). New York, NY: Omnipress.
Blaydes, L., Grimmer, J., & McQuenn, A. (2013, October). Mirrors for princes and sultans: Advice on the art of governance in the medieval Christian and Islamic worlds (Stanford university mimeo).
Blei. (2009). Text mining: Classification, clustering, and applications . In A. Srivastava & M. Sahami (Eds.),. Chapman & Hall.
Blei, D. M. (2012). Probabilistic topic models. Communications of the ACM, 55(4), 77–84.
Blei, D. M., Ng, A. Y., & Jordan, M. I. (2003). Latent Dirichlet allocation. Journal of Machine Learning Research, 3(4/5), 993–1022.
Brutus, S., Aguinis, H., & Wassmer, U. (2013). Self-reported limitations and future directions in scholarly reports: Analysis and recommendations. Journal of Management, 39(1), 48–75.
Buntine, W., & Jakulin, A. (2006). Discrete component analysis. In C. Saunders, M. Grobelnik, S. Gunn, & J. Shawe-Taylor (Eds.), Subspace, latent structure and feature selection (Vol. 3940, pp. 1–33). Springer Berlin Heidelberg.
Carley, K. (1993). Coding choices for textual analysis: A comparison of content analysis and map analysis. Sociological Methodology, 23, 75–126.
Chaney, A. J., & Blei, D. M. (2012). Visualizing topic models. In Sixth international AAAI conference on weblogs and social media.
Chang, J., Boyd-Graber, J., Gerrish, S., Wang, C., & Blei, D. M. (2009). Advances in neural information proprocess systems. In Y. Bengio, D. Schuurmans, J. Lafferty, C. Williams, & A. Culol (Eds.), (pp. 288–96). Cambridge, MA: The MIT Press.
Chen, G., & Åstebro, T. (2003). How to deal with missing categorical data: Test of a simple Bayesian method. Organizational Research Methods, 6(3), 309–327.
Chuang, J., Manning, C. D., & Heer, J. (2012). Termite: Visualization techniques for assessing textual topic models. In Proceedings of the international working conference on advanced visual interfaces (pp. 74–77). New York, NY, USA: ACM.
Chuang, J., Wilkerson, J. D., Weiss, R., Tingley, D., Stewart, M. E., Brandon M.and Roberts, Poursabzi-Sagdeh, F., … Heer, J. (2014). Computer-assisted content analysis: Topic models for exploring multiple subjective interpretations. In Advances in neural information processing systems workshop on human-propelled machine learning.
Dalton, D. R., & Dalton, C. M. (2008). Meta-analyses: Some very good steps toward a bit longer journey. Organizational Research Methods, 11(1), 127–147.
Duriau, V. J., Reger, R. K., & Pfarrer, M. D. (2007). A content analysis of the content analysis literature in organization studies. Organizational Research Methods, 10(1), 5–34.
Feinerer, I., Hornik, K., & Meyer, D. (2008). Text mining infrastructure in R. Journal of Statistical Software, 25(5), 1–54.
Gardner, M. J., Lutes, J., Lund, J., Hansen, J., Walker, D., Ringger, E., & Seppi, K. (2010). The topic browser: An interactive tool for browsing topic models. In NIPS workshop on challenges of data visualization.
Ghosh, D., & Guha, R. (2013). What are we “tweeting” about obesity? Mapping tweets with topic modeling and geographic information system. Cartography and Geographic Information Science, 40(2), 90–102.
Griffiths, T. L., & Steyvers, M. (2004). Finding scientific topics. Proceedings of the National Academy of Sciences of the United States of America, 101, 5228–5235.
Grimmer, J. (Forthcoming). Data analytics in social science, government, and industry. In. Cambridge University Press.
Grimmer, J., & Stewart, B. M. (2013). Text as data: The promise and pitfalls of automatic text analysis methods for political texts. Political Analysis, 21(3), 267–297.
Grün, B., & Hornik, K. (2011). Topicmodels: An R package for fitting topic models. Journal of Statistical Software, 40(13), 1–30.
Hahn, R., & Lülfs, R. (2014). Legitimizing negative aspects in GRI-oriented sustainability reporting: A qualitative analysis of corporate disclosure strategies. Journal of Business Ethics, 123(3), 401–420.
Heinrich, G. (2005). Parameter estimation for text analysis. Technical Report. Fraunhofer IGD.
Hofmann, T. (1999). Probabilistic latent semantic analysis. In Uncertainty in artificial intelligence uIA ’99, Stockholm.
Hopkins, D. J., & King, G. (2010). A method of automated nonparametric content analysis for social science. American Journal of Political Science, 54(1), 229–247.
Ingerson, K., & Bruce, J. (2013). Leadership in the twitterverse. Journal of Leadership Studies, 7(3), 74–83.
James, L. R. (2008). On the path to mediation. Organizational Research Methods, 11(2), 359–363.
Janasik, N., Honkela, T., & Bruun, H. (2009). Text mining in qualitative research: Application of an unsupervised learning method. Organizational Research Methods, 12(3), 436–460.
Jebb, A. T., & Woo, S. E. (2015). A Bayesian primer for the organizational sciences: The “two sources” and an introduction to BugsXLA. Organizational Research Methods, 18(1), 92–132.
Jelveh, Z., Kogut, B., & Naidu, S. (2015). Political language in economics. Columbia Business School Research Paper No. 14-57. Available at SSRN: http://ssrn.com/abstract=2535453 or http://dx.doi.org/10.2139/ssrn.2535453.
Kabanoff, B., & Brown, S. (2008). Knowledge structures of prospectors, analyzers, and defenders: Content, structure, stability, and performance. Strategic Management Journal, 29(2), 149–171.
Kaplan, S., & Vakili, K. (2015). The double-edged sword of recombination in breakthrough innovation. Strategic Management Journal, 36(10), 1435–1457.
Kenny, D. A. (2008). Reflections on mediation. Organizational Research Methods, 11(2), 353–358.
Kisamore, J. L., & Brannick, M. T. (2008). An illustration of the consequences of meta-analysis model choice. Organizational Research Methods, 11(1), 35–53.
Kolde, R. (2015). Pheatmap: Pretty heatmaps (1.0.7).
Kruschke, J. K., Aguinis, H., & Joo, H. (2012). The time has come: Bayesian methods for data analysis in the organizational sciences. Organizational Research Methods, 15(4), 722–752.
Landauer, T. K., & Dumais, S. T. (1997). A solution to Plato’s problem: The latent semantic analysis theory of acquisition, induction, and representation of knowledge. Psychological Review, 104(2), 211–240.
Lucas, C., Nielsen, R., Roberts, M. E., Stewart, B. M., Storer, A., & Tingley, D. (2015). Computer assisted text analysis for comparative politics. Political Analysis, 23(2), 254–277.
Manning, C. D., Raghavan, P., & Schütze, H. (2008). An introduction to information retrieval. Cambridge: Cambridge University Press.
Mathieu, J. E., DeShon, R. P., & Bergh, D. D. (2008). Mediational inferences in organizational research. Then, now, and beyond. Organizational Research Methods, 11(2), 203–223.

McKenny, A. F., Short, J. C., & Payne, G. T. (2013). Using computer-aided text analysis to elevate constructs: An illustration using psychological capital. Organizational Research Methods, 16(1), 152–184.
Mei, Q., Shen, X., & Zhai, C. (2007). Automatic labeling of multinomial topic models. In Proceedings of the 13th ACM international conference on knowledge discovery and data mining (pp. 490–499). New York, NY, USA: ACM.
Meyer, R. E., & Höllerer, M. A. (2010). Meaning structures in a contested issue field: A topographic map of shareholder value in Austria. Academy of Management Journal, 53(6), 1241–1262.
Mimno, D., Wallach, H. M., Talley, E., Leenders, M., & McCallum, A. (2011). Optimizing semantic coherence in topic models. In Proceedings of the 2011 conference on empirical methods in natural language processing (pp. 262–272).
Moser, S., & Reeves, A. (2014). Taking the leap: Voting, rhetoric, and the determinants of electoral reform. Legislative Studies Quarterly, 19(4), 467–502.
Muller, D., Yzerbyt, V. Y., & Judd, C. M. (2008). Adjusting for a mediator in models with two crossed treatment variables. Organizational Research Methods, 11(2), 224–240.
Natale, F., Fiore, G., & Hofherr, J. (2012). Mapping the research on aquaculture. A bibliometric analysis of aquaculture literature. Scientometrics, 90(3), 983–999.
Newman, D., Lau, J. H., Grieser, K., & Baldwin, T. (2010). Automatic evaluation of topic coherence. In Human language technologies: The 2010 annual conference of the North American chapter of the ACL (pp. 100–108).
Newman, D., Karimi, S., & Cavedon, L. (2009). External evaluation of topic models. In Proceedings of the 14th Australasian document computing symposium, Sydney, Australia, 4 December 2009.
Osborne, J., Stubbart, C., & Ramaprasad, A. (2001). Strategic groups and competitive enactment: A study of dynamic relationships between mental models and performance. Strategic Management Journal, 22, 435–454.
Piepenbrink, A., & Nurmammadov, E. (2015). Topics in the literature of transition economies and emerging markets. Scientometrics, 102(3), 2107–2130.
Pollach, I. (2012). Taming textual data: The contribution of corpus linguistics to computer-aided text analysis. Organizational Research Methods, 15(2), 263–287.
Ponweiser, M. (2012). Latent Dirichlet allocation in R, diploma thesis. Vienna University of Economics; Business, Institute for Statistics; Mathematics.
Porter, M. (1980). An algorithm for suffix stripping. Program: Electronic Library and Information Systems, 14(3), 130–137.
Quinn, K. M., Monroe, B. L., Colaresi, M., Crespin, M. H., & Radev, D. R. (2010). How to analyze political attention with minimal assumptions and costs. American Journal of Political Science, 54(1), 209–228.
Rhee, E. Y., & Fiss, P.C. (2014). Framing controversial actions: Regulatory focus, source credibility, and stock market reaction to poison pill adoption. Academy of Management Journal, 57(6), 1734–1758.
Rinker, T. W. (2013). qdap: Quantitative discourse analysis package. Buffalo, New York: University at Buffalo/SUNY.
Roberts, M. E., Stewart, B. M., Tingley, D., Lucas, C., Leder-Luis, J., Gadarian, S. K., … Rand, D. G. (2014). Structural topic models for open-ended survey responses. American Journal of Political Science, 58(4), 1–19.
Rosen-Zvi, M., Griffiths, T., Steyvers, M., & Smyth, P. (2004). The author-topic model for authors and documents. In Proceedings of the 20th conference on uncertainty in artificial intelligence (pp. 487–494). AUAI Press.
Schmidt, F. (2008). Meta-analysis: A constantly evolving research integration tool. Organizational Research Methods, 11(1), 96–113.
Short, J. C., & Palmer, T. B. (2008). The application of DICTION to content analysis research in strategic management. Organizational Research Methods, 11(4), 727–752.
Short, J. C., Broberg, J. C., Cogliser, C. C., & Brigham, K. H. (2010). Construct validation using computer-aided text analysis (CATA). An illustration using entrepreneurial orientation. Organizational Research Methods, 13(2), 320–347.
Sievert, C., & Shirley, K. (2014). LDAvis: A method for visualizing and interpreting topics. In Proceedings of the workshop on interactive language learning, visualization, and interfaces (pp. 63–70). Baltimore, Maryland, USA: Association for Computational Linguistics.
Steel, P. D. G., & Kammeyer-Mueller, J. (2008). Bayesian variance estimation for meta-analysis. Organizational Research Methods, 11(1), 54–78.
Steyvers, M., & Griffiths, T. (2007). Probabilistic topic models. In T. Landauer, D. McNamara, D. S., & W. Kintsch (Eds.), Lawrence Erlbaum.
Stone-Romero, E. F., & Rosopa, P. J. (2008). The relative validity of inferences about mediation as a function of research design characteristics. Organizational Research Methods, 11(2), 326–352.
Taddy, M. A. (2012). On estimation and selection for topic models. In Proceedings of the 15th conference on artificial intelligence and statistics (AISTATS).
Taylor, A. B., MacKinnon, D. P., & Tein, J. (2008). Tests of the three-path mediated effect. Organizational Research Methods, 11(2), 241–269.

Tirunillai, S., & Tellis, G. J. (2014). Mining marketing meaning from online chatter: Strategic brand analysis of big data using latent Dirichlet allocation. Journal of Marketing Research, 51(4), 463–479.
Wallach, H. M., Murray, I., Salakhutdinov, R., & Mimno, D. (2009). Evaluation methods for topic models. In Proceedings of the 26th international conference on machine learning.
Weber, R. (1990). Basis content analysis (2nd ed.). Thousand Oaks, CA: Sage Publications.
Wood, J. A. (2008). Methodology for dealing with duplicate study effects in a meta-analysis. Organizational Research Methods, 11(1), 79–95.
Wood, R. E., Goodman, J. S., Beckmann, N., & Cook, A. (2008). Mediation testing in management research. A review and proposals. Organizational Research Methods, 11(2), 270–295.
Yi, X., & Allan, J. (2009). A comparative study of utilizing topic models for information retrieval. In M. Boughanem, C. Berrut, J. Mothe, & C. Soule-Dupuy (Eds.), Advances in information retrieval (Vol. 5478, pp. 29–41). Springer Berlin Heidelberg.
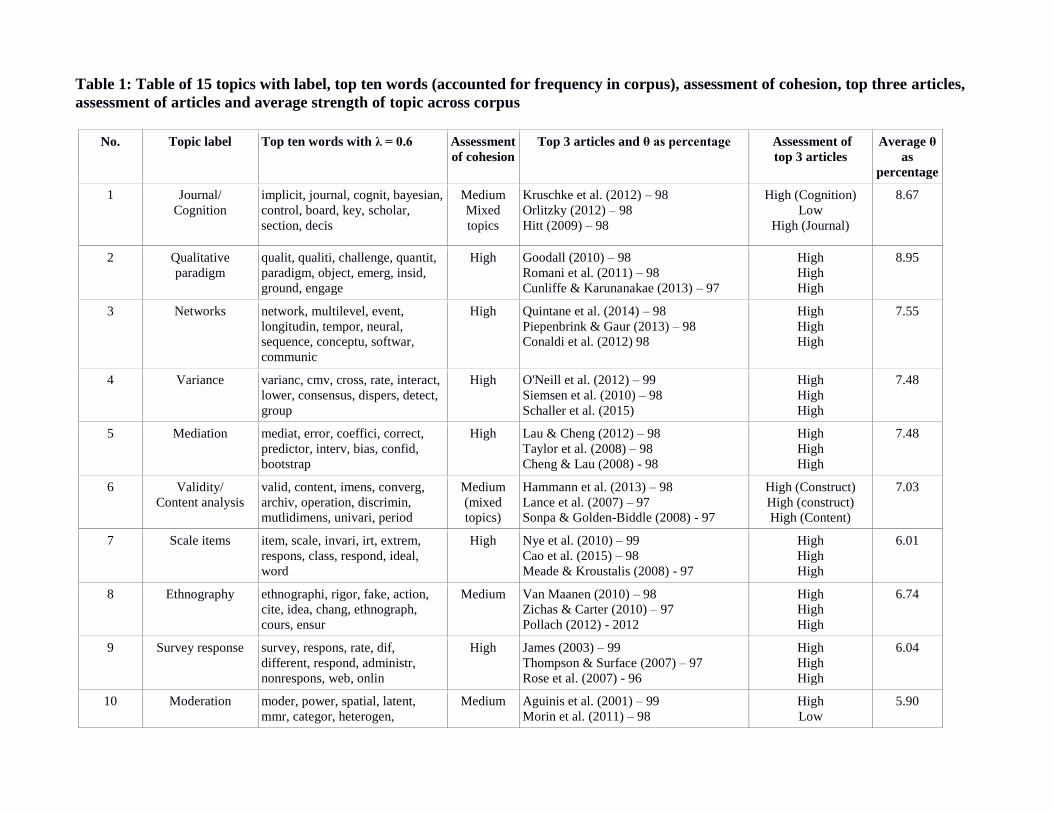
Table 1: Table of 15 topics with label, top ten words (accounted for frequency in corpus), assessment of cohesion, top three articles,
assessment of articles and average strength of topic across corpus
No. Topic label Top ten words with λ = 0.6 Assessment
of cohesion Top 3 articles and θ as percentage Assessment of
top 3 articles Average θ
as
percentage
1 Journal/
Cognition implicit, journal, cognit, bayesian,
control, board, key, scholar,
section, decis
Medium Mixed
topics
Kruschke et al. (2012) – 98
Orlitzky (2012) – 98
Hitt (2009) – 98
High (Cognition)
Low
High (Journal)
8.67
2 Qualitative
paradigm qualit, qualiti, challenge, quantit,
paradigm, object, emerg, insid,
ground, engage
High Goodall (2010) – 98
Romani et al. (2011) – 98
Cunliffe & Karunanakae (2013) – 97
High
High
High
8.95
3 Networks network, multilevel, event,
longitudin, tempor, neural,
sequence, conceptu, softwar,
communic
High Quintane et al. (2014) – 98
Piepenbrink & Gaur (2013) – 98
Conaldi et al. (2012) 98
High
High
High
7.55
4 Variance varianc, cmv, cross, rate, interact,
lower, consensus, dispers, detect,
group
High O'Neill et al. (2012) – 99
Siemsen et al. (2010) – 98
Schaller et al. (2015)
High
High
High
7.48
5 Mediation mediat, error, coeffici, correct,
predictor, interv, bias, confid,
bootstrap
High Lau & Cheng (2012) – 98
Taylor et al. (2008) – 98
Cheng & Lau (2008) - 98
High
High
High
7.48
6 Validity/
Content analysis valid, content, imens, converg,
archiv, operation, discrimin,
mutlidimens, univari, period
Medium
(mixed
topics)
Hammann et al. (2013) – 98
Lance et al. (2007) – 97
Sonpa & Golden-Biddle (2008) - 97
High (Construct)
High (construct)
High (Content)
7.03
7 Scale items item, scale, invari, irt, extrem,
respons, class, respond, ideal,
word
High Nye et al. (2010) – 99
Cao et al. (2015) – 98
Meade & Kroustalis (2008) - 97
High
High
High
6.01
8 Ethnography ethnographi, rigor, fake, action,
cite, idea, chang, ethnograph,
cours, ensur
Medium Van Maanen (2010) – 98
Zichas & Carter (2010) – 97
Pollach (2012) - 2012
High
High
High
6.74
9 Survey response survey, respons, rate, dif,
different, respond, administr,
nonrespons, web, onlin
High James (2003) – 99
Thompson & Surface (2007) – 97
Rose et al. (2007) - 96
High
High
High
6.04
10 Moderation moder, power, spatial, latent,
mmr, categor, heterogen,
Medium Aguinis et al. (2001) – 99
Morin et al. (2011) – 98
High
Low
5.90
subgroup, unobserv, hypothes Keagan & Kabanoff (2008) - 95 Low
11 Meta/
Ethnostatistics meta, weight, etnostatist, execut,
choic, unit, incomplet, journal,
report, profession
Medium Boje et al. (2006) – 98
Slaughter at el. (2006) – 97
Mills et al. (2006) - 97
High (Ethnostatistics)
Low
High (Ethnostatistics)
6.53
12 Congruence score, congruenc, reliabl, pls,
equival, formal, polynomi, fit,
alpha, sem
Medium Cheung (2009) – 98
Cheung (2009a) – 98
Nikolaeva (forthcoming) - 96
High
High
Low
6.13
13 “Stories” self, map, domin, legend, criteria,
concept, defin, urban, causal,
report
Medium Schraven et al. (2015)
Lance (2011)
Leavitt & Mitchell (2010)
High
High
Low
5.74
14 Interrater agreement group, agreement, index, interrat,
rwg, divers, valu, formula, rwgj,
proport
High Brown & Hauenstein (2005) – 98
LeBreton et al. (2005) – 98
Pasisz & Hurtz (2009) - 97
High
High
High
5.28
15 Missing data miss, imput, delet, effici, listwis,
substitut, bias, promis, complet,
treatment, pairwis
High Newman (2014) – 99
Newman (2003) – 98
Chen & Astebro (2003) - 95
High
High
High
4.44
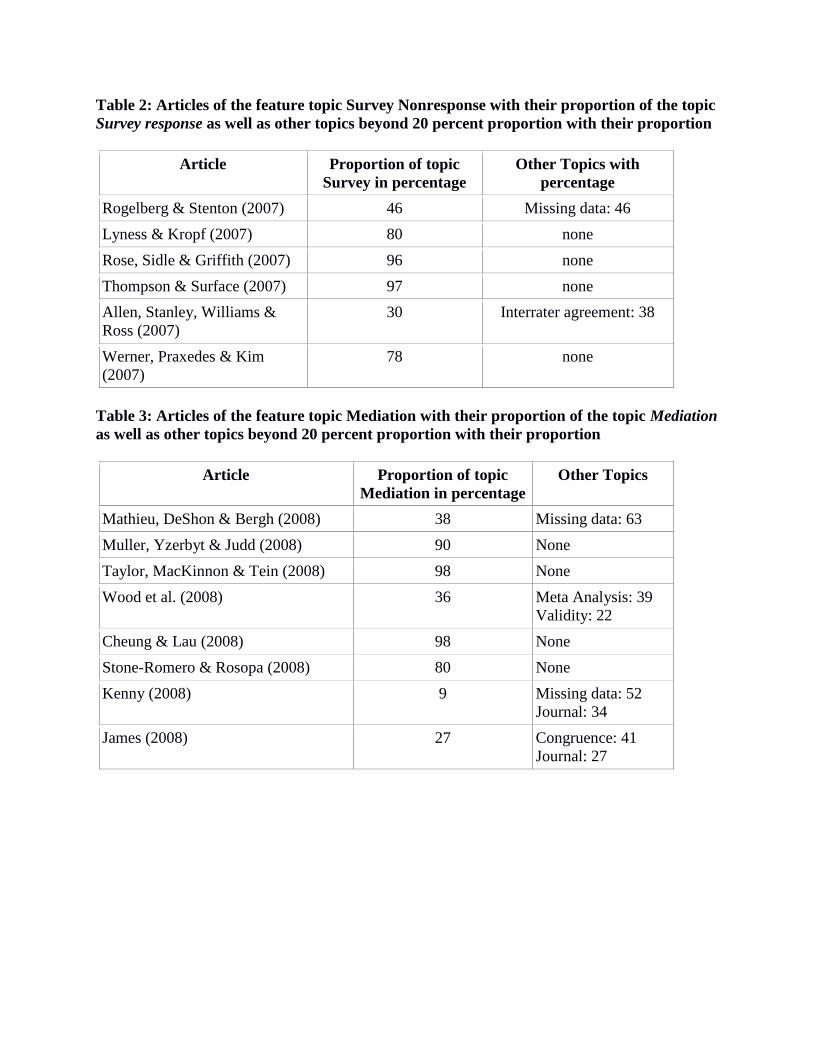
Table 2: Articles of the feature topic Survey Nonresponse with their proportion of the topic
Survey response as well as other topics beyond 20 percent proportion with their proportion
Article Proportion of topic
Survey in percentage Other Topics with
percentage Rogelberg & Stenton (2007) 46 Missing data: 46 Lyness & Kropf (2007) 80 none Rose, Sidle & Griffith (2007) 96 none Thompson & Surface (2007) 97 none Allen, Stanley, Williams &
Ross (2007) 30 Interrater agreement: 38
Werner, Praxedes & Kim
(2007) 78 none
Table 3: Articles of the feature topic Mediation with their proportion of the topic Mediation
as well as other topics beyond 20 percent proportion with their proportion
Article Proportion of topic
Mediation in percentage Other Topics
Mathieu, DeShon & Bergh (2008) 38 Missing data: 63 Muller, Yzerbyt & Judd (2008) 90 None Taylor, MacKinnon & Tein (2008) 98 None Wood et al. (2008) 36 Meta Analysis: 39
Validity: 22 Cheung & Lau (2008) 98 None Stone-Romero & Rosopa (2008) 80 None Kenny (2008) 9 Missing data: 52
Journal: 34 James (2008) 27 Congruence: 41
Journal: 27
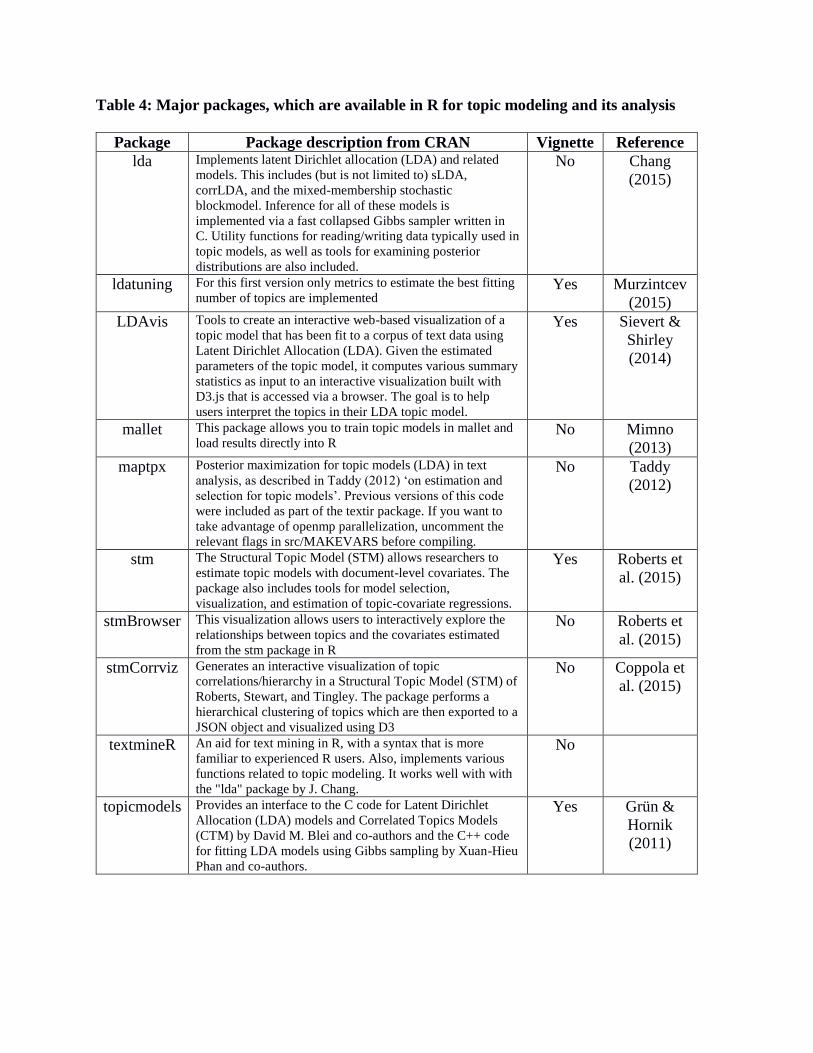
Table 4: Major packages, which are available in R for topic modeling and its analysis
Package Package description from CRAN Vignette Reference
lda Implements latent Dirichlet allocation (LDA) and related
models. This includes (but is not limited to) sLDA,
corrLDA, and the mixed-membership stochastic
blockmodel. Inference for all of these models is
implemented via a fast collapsed Gibbs sampler written in
C. Utility functions for reading/writing data typically used in
topic models, as well as tools for examining posterior
distributions are also included.
No Chang
(2015)
ldatuning For this first version only metrics to estimate the best fitting
number of topics are implemented Yes Murzintcev
(2015)
LDAvis Tools to create an interactive web-based visualization of a
topic model that has been fit to a corpus of text data using
Latent Dirichlet Allocation (LDA). Given the estimated
parameters of the topic model, it computes various summary
statistics as input to an interactive visualization built with
D3.js that is accessed via a browser. The goal is to help
users interpret the topics in their LDA topic model.
Yes Sievert &
Shirley
(2014)
mallet This package allows you to train topic models in mallet and
load results directly into R No Mimno
(2013)
maptpx Posterior maximization for topic models (LDA) in text
analysis, as described in Taddy (2012) ‘on estimation and
selection for topic models’. Previous versions of this code
were included as part of the textir package. If you want to
take advantage of openmp parallelization, uncomment the
relevant flags in src/MAKEVARS before compiling.
No Taddy
(2012)
stm The Structural Topic Model (STM) allows researchers to
estimate topic models with document-level covariates. The
package also includes tools for model selection,
visualization, and estimation of topic-covariate regressions.
Yes Roberts et
al. (2015)
stmBrowser This visualization allows users to interactively explore the
relationships between topics and the covariates estimated
from the stm package in R
No Roberts et
al. (2015)
stmCorrviz Generates an interactive visualization of topic
correlations/hierarchy in a Structural Topic Model (STM) of
Roberts, Stewart, and Tingley. The package performs a
hierarchical clustering of topics which are then exported to a
JSON object and visualized using D3
No Coppola et
al. (2015)
textmineR An aid for text mining in R, with a syntax that is more
familiar to experienced R users. Also, implements various
functions related to topic modeling. It works well with with
the "lda" package by J. Chang.
No
topicmodels Provides an interface to the C code for Latent Dirichlet
Allocation (LDA) models and Correlated Topics Models
(CTM) by David M. Blei and co-authors and the C++ code
for fitting LDA models using Gibbs sampling by Xuan-Hieu
Phan and co-authors.
Yes Grün &
Hornik
(2011)

Figure 1: Methods of text classification following Grimmer2013
Figure 2: Example text from Wood et al. (2008) with topic assignments indicated by
superscripts
The authors review and critique the conduct and reporting15
of mediation11
analyses in 409
studies published in five14
leading organization studies journals15
over the past 25 years. The
aim of the study is to learn14
from past practice and to use that knowledge15
to signal to
researchers the importance of correctly11
applying mediation11
tests as well as to facilitate14
the valid14
testing of mediation11
models and the reporting15
of mediation11
results in future
studies. The authors content14
code their sample for a wide range15
of characteristics and find
that the majority of inferences11
of full15
and partial14
mediation11
are based on testing
procedures that deviate11
significantly from procedures recommended by statisticians. In
addition, the reporting15
of results is often incomplete15
and inefficient. The authors discuss and
evaluate the findings of the study and make recommendations for future testing and reporting15
of results for mediation11
models.

Figure 3: Overview of work flow of topic modeling
Figure 4: Heatmap of mean topic proportions across disciplines