Embed Size (px)
Citation preview
StatistiqueCanada
StatisticsCanada
Catalogue no. 87-403-XIE
TourismStatisticalDigest
1999 Edition
Note of appreciation
Canada owes the success of its statistical system to a long-standing partnership betweenStatistics Canada, the citizens of Canada, its businesses, governments and other institutions.Accurate and timely statistical information could not be produced without their continuedcooperation and goodwill.
Published by authority of the Minister responsible for Statistics Canada
© Minister of Industry, 1999
All rights reserved. No part of this publication may be reproduced, stored in a retrieval system ortransmitted in any form or by any means, electronic, mechanical, photocopying, recording orotherwise without prior written permission from Licence Services, Marketing Division, StatisticsCanada, Ottawa, Ontario, Canada K1A 0T6.
November 1999
Catalogue no. 87-403-XPE
ISSN 1488-3082
Frequency: Biennial
Catalogue no. 87-403-XIE
ISSN 1488-3090
Ottawa
La version française de cette publication est disponible sur demande (no 87-403-XPF au catalogue).
Statistics CanadaTourism Statistics Program
TourismStatistical Digest1999 Edition
Data in many forms
Statistics Canada disseminates data in a variety of forms. In addition to publications, both standard and specialtabulations are offered. Data are available on the Internet, compact disc, diskette, computer printouts, microfiche andmicrofilm, and magnetic tape. Maps and other geographic reference materials are available for some types of data.Direct online access to aggregated information is possible through CANSIM, Statistics Canada’s machine-readabledatabase and retrieval system.
How to obtain more information
Inquiries about this product and related statistics or services should be directed to: Tourism Statistics Program,Statistics Canada, Ottawa, Ontario, K1A 0T6 (telephone: (613) 951-9169) or to the Statistics Canada RegionalReference Centre in:
Halifax (902) 426-5331 Regina (306) 780-5405Montréal (514) 283-5725 Edmonton (780) 495-3027Ottawa (613) 951-8116 Calgary (403) 292-6717Toronto (416) 973-6586 Vancouver (604) 666-3691Winnipeg (204) 983-4020
You can also visit our World Wide Web site:http://www.statcan.ca
Toll-free access is provided for all users who reside outside the local dialing area of any of the Regional ReferenceCentres.
National enquiries line 1 800 263-1136National telecommunications device for the hearing impaired 1 800 363-7629Order-only line (Canada and United States) 1 800 267-6677Fax Order line (Canada and United States) 1 877 287-4369
Ordering/Subscription information
All prices exclude sales tax
Catalogue no. 87-403-XPE, is published every two years as a standard paper product. The price for delivery in Canadais $45.00 and outside Canada for US $45.00. Please order by mail, at Statistics Canada, Dissemination Division,Circulation Management, 120 Parkdale Avenue, Ottawa, Ontario, K1A 0T6; by phone, at (613) 951-7277 or 1 800 700-1033;by fax, at (613) 951-1584 or 1 800 889-9734; or by Internet, at [email protected]. For changes of address, pleaseprovide both old and new addresses. Statistics Canada products may also be purchased from authorized agents,bookstores and local Statistics Canada offices.
This product is also available on the Internet as Catalogue no. 87-403-XIE for CDN $36.00. Users can obtain singleissues or subscribe at http://www.statcan.ca/cgi-bin/downpub/feepub.cgi.
Standards of service to the public
Statistics Canada is committed to serving its clients in a prompt, reliable and courteous manner and in the officiallanguage of their choice. To this end, the agency has developed standards of service which its employees observe inserving its clients. To obtain a copy of these service standards, please contact your nearest Statistics Canada RegionalReference Centre.
2 Tourism Statistical Digest Statistics Canada - Catalogue no. 87-403
ACKNOWLEDGEMENTSACKNOWLEDGEMENTS
This publication was prepared under the direction of:
Scott Murray, Director, Culture, Tourism and the Centre for Education StatisticsPaul McPhie, Assistant Director, Culture and TourismFrançois Gendron, Chief, Tourism Statistics ProgramDanielle Shaienks, Editor and Author, Tourism Statistics Program
This publication was a collaborative effort involving the valuable contribution and assistanceof many individuals. Special thanks to the authors, Élaine Fournier, Sylvie Bonhomme andLaurie McDougall from the Tourism Statistics Program, Harold Kohn from the TransportationDivision, Jacques Delisle and Sylvain Venne from the Income and Expenditures AccountsDivision, Stephen Smith, Bryan Smale and Candace Nykiforuk from the University ofWaterloo and Scott Meis from the Canadian Tourism Commission.
Special appreciation is extended to Monique Beyrouti for her help in reviewing the documentand to Noël Leblanc for his help in the production of the tables.
A special thanks are also extended to the Dissemination Division for its support, especiallyLouise Simard for composition, Rosemarie Andrews for graphics production and RachelPenkar for the cover design.
Half of the funding for the Tourism Statistical Digest has been provided by the CanadianTourism Commission.
Statistics Canada - Catalogue no. 87-403 Tourism Statistical Digest 3
FOREWORDFOREWORD
Between 1972 and 1988, Statistics Canada published nine editions of Tourism andRecreation – A Statistical Digest, under Catalogue No. 87-401. Though redesigned a numberof times, the publication was always intended to bring together in one place the manysources of data and survey results relating to tourism and travel by Canadians and foreignvisitors to Canada.
After a hiatus of more than 10 years, the Tourism Statistical Digest has been revived, in anew format, with plenty of tables and charts, a new cover and a different catalogue number.Despite these changes, the purposes for which the Statistical Digest was devised in theearly 1970s remain the same.
Like its predecessors, the 1999 edition contains Statistics Canada data on both the supplyof and demand for tourism services. Included for the first time in the Statistical Digest aredata from the National Tourism Indicators, which reflect tourism’s importance to the Canadianeconomy. Some data from sources other than Statistics Canada, notably the World TourismOrganization, are also provided.
The 1999 edition of the Tourism Statistical Digest is the fruit of a collaborative effort byStatistics Canada’s Tourism Statistics Program and the Canadian Tourism Commission(CTC). The CTC Research Committee also lent its support to the revival of this publication.
Happy reading.
Scott Meis Paul McPhieDirector, Research Assistant DirectorCanadian Tourism Culture and TourismCommission Statistics Canada
4 Tourism Statistical Digest Statistics Canada - Catalogue no. 87-403
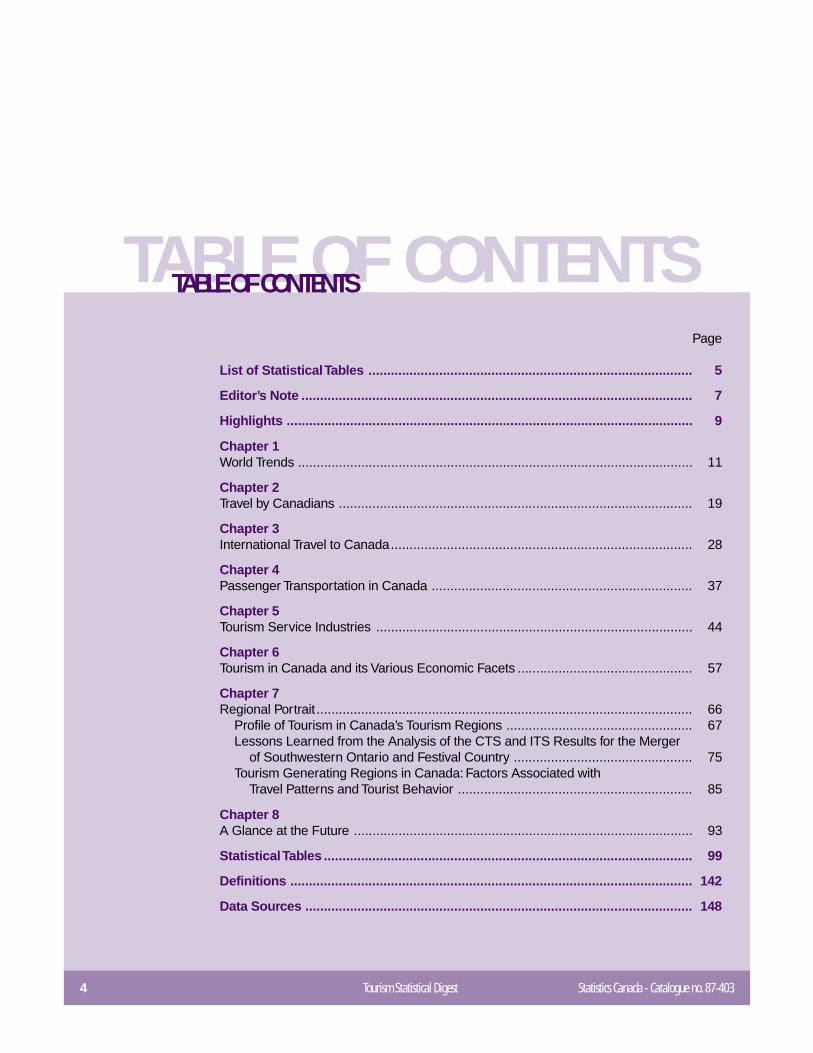
TABLE OF CONTENTSTABLE OF CONTENTS
Page
List of Statistical Tables ....................................................................................... 5
Editor’s Note ......................................................................................................... 7
Highlights ............................................................................................................. 9
Chapter 1World Trends .......................................................................................................... 11
Chapter 2Travel by Canadians ............................................................................................... 19
Chapter 3International Travel to Canada................................................................................. 28
Chapter 4Passenger Transportation in Canada ...................................................................... 37
Chapter 5Tourism Service Industries ..................................................................................... 44
Chapter 6Tourism in Canada and its Various Economic Facets ............................................... 57
Chapter 7Regional Portrait ..................................................................................................... 66
Profile of Tourism in Canada’s Tourism Regions .................................................. 67Lessons Learned from the Analysis of the CTS and ITS Results for the Merger
of Southwestern Ontario and Festival Country ................................................ 75Tourism Generating Regions in Canada: Factors Associated with
Travel Patterns and Tourist Behavior ............................................................... 85
Chapter 8A Glance at the Future ........................................................................................... 93
Statistical Tables ................................................................................................... 99
Definitions ............................................................................................................ 142
Data Sources ........................................................................................................ 148
Statistics Canada - Catalogue no. 87-403 Tourism Statistical Digest 5
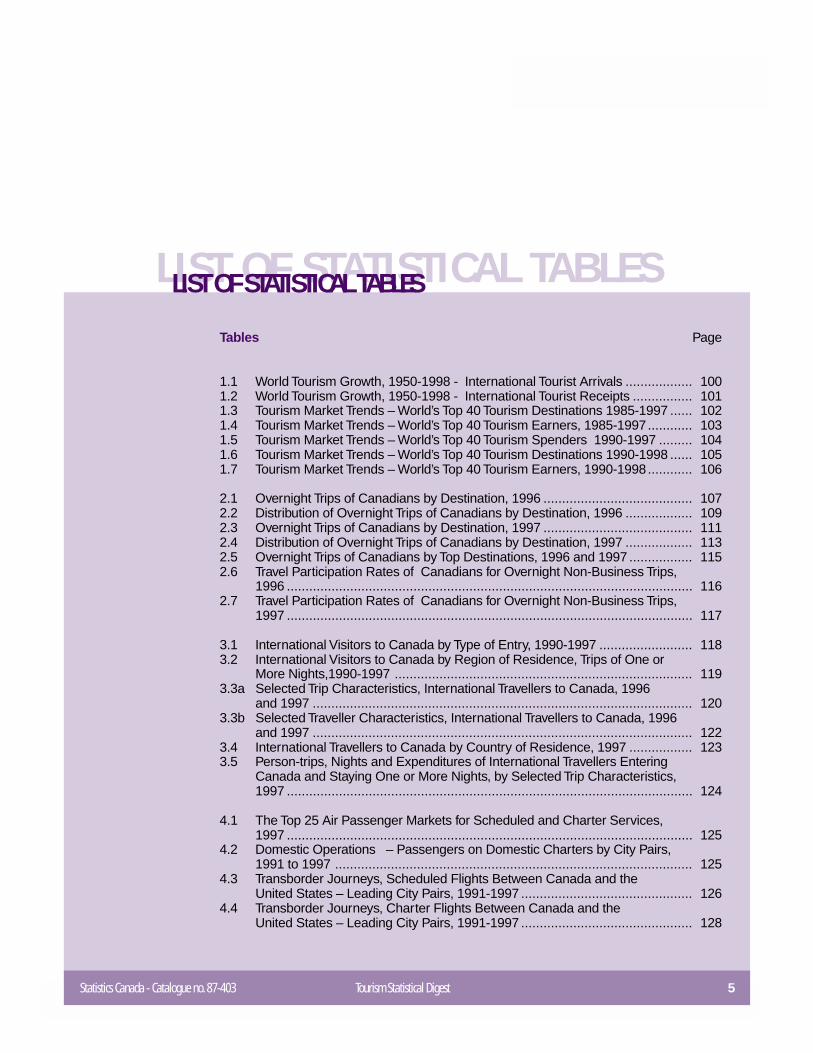
LIST OF STATISTICAL TABLESLIST OF STATISTICAL TABLES
Tables Page
1.1 World Tourism Growth, 1950-1998 - International Tourist Arrivals .................. 1001.2 World Tourism Growth, 1950-1998 - International Tourist Receipts ................ 1011.3 Tourism Market Trends – World’s Top 40 Tourism Destinations 1985-1997 ...... 1021.4 Tourism Market Trends – World’s Top 40 Tourism Earners, 1985-1997............ 1031.5 Tourism Market Trends – World’s Top 40 Tourism Spenders 1990-1997 ......... 1041.6 Tourism Market Trends – World’s Top 40 Tourism Destinations 1990-1998 ...... 1051.7 Tourism Market Trends – World’s Top 40 Tourism Earners, 1990-1998............ 106
2.1 Overnight Trips of Canadians by Destination, 1996 ........................................ 1072.2 Distribution of Overnight Trips of Canadians by Destination, 1996 .................. 1092.3 Overnight Trips of Canadians by Destination, 1997 ........................................ 1112.4 Distribution of Overnight Trips of Canadians by Destination, 1997 .................. 1132.5 Overnight Trips of Canadians by Top Destinations, 1996 and 1997 ................. 1152.6 Travel Participation Rates of Canadians for Overnight Non-Business Trips,
1996 ............................................................................................................. 1162.7 Travel Participation Rates of Canadians for Overnight Non-Business Trips,
1997 ............................................................................................................. 117
3.1 International Visitors to Canada by Type of Entry, 1990-1997 ......................... 1183.2 International Visitors to Canada by Region of Residence, Trips of One or
More Nights,1990-1997 ................................................................................ 1193.3a Selected Trip Characteristics, International Travellers to Canada, 1996
and 1997 ...................................................................................................... 1203.3b Selected Traveller Characteristics, International Travellers to Canada, 1996
and 1997 ...................................................................................................... 1223.4 International Travellers to Canada by Country of Residence, 1997 ................. 1233.5 Person-trips, Nights and Expenditures of International Travellers Entering
Canada and Staying One or More Nights, by Selected Trip Characteristics,1997 ............................................................................................................. 124
4.1 The Top 25 Air Passenger Markets for Scheduled and Charter Services,1997 ............................................................................................................. 125
4.2 Domestic Operations – Passengers on Domestic Charters by City Pairs,1991 to 1997 ................................................................................................ 125
4.3 Transborder Journeys, Scheduled Flights Between Canada and theUnited States – Leading City Pairs, 1991-1997 .............................................. 126
4.4 Transborder Journeys, Charter Flights Between Canada and theUnited States – Leading City Pairs, 1991-1997 .............................................. 128
6 Tourism Statistical Digest Statistics Canada - Catalogue no. 87-403
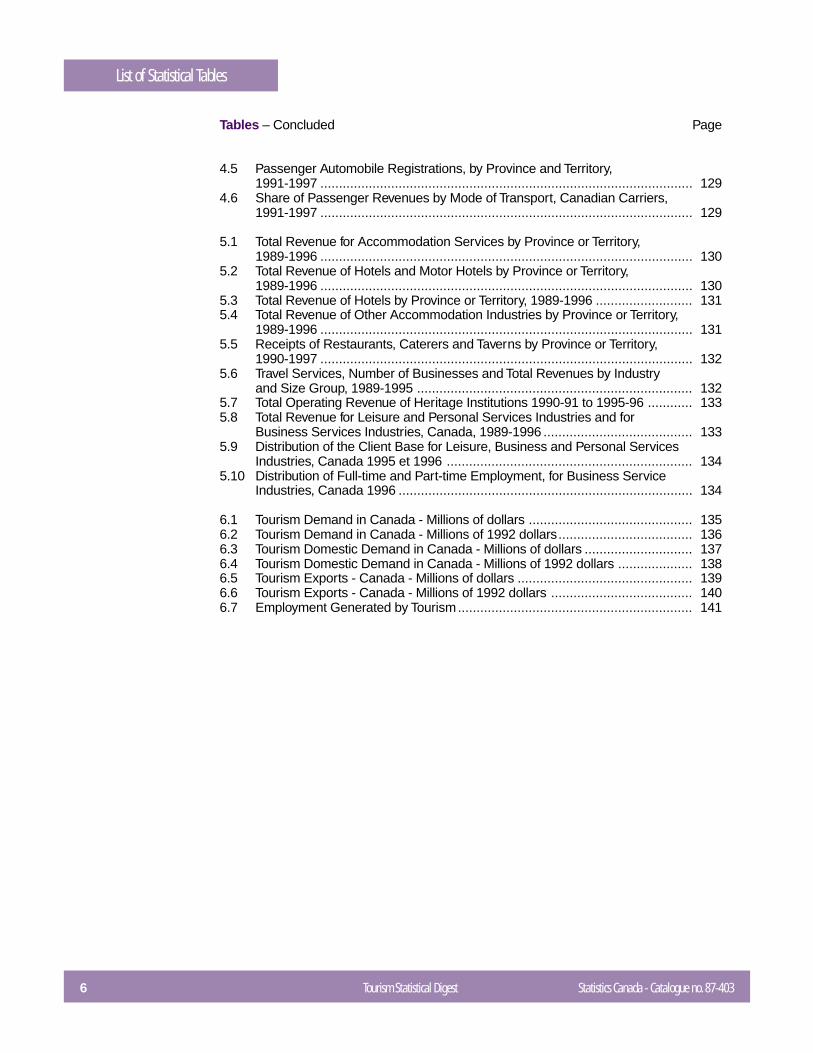
List of Statistical Tables
Tables – Concluded Page
4.5 Passenger Automobile Registrations, by Province and Territory,1991-1997 .................................................................................................... 129
4.6 Share of Passenger Revenues by Mode of Transport, Canadian Carriers,1991-1997 .................................................................................................... 129
5.1 Total Revenue for Accommodation Services by Province or Territory,1989-1996 .................................................................................................... 130
5.2 Total Revenue of Hotels and Motor Hotels by Province or Territory,1989-1996 .................................................................................................... 130
5.3 Total Revenue of Hotels by Province or Territory, 1989-1996 .......................... 1315.4 Total Revenue of Other Accommodation Industries by Province or Territory,
1989-1996 .................................................................................................... 1315.5 Receipts of Restaurants, Caterers and Taverns by Province or Territory,
1990-1997 .................................................................................................... 1325.6 Travel Services, Number of Businesses and Total Revenues by Industry
and Size Group, 1989-1995 .......................................................................... 1325.7 Total Operating Revenue of Heritage Institutions 1990-91 to 1995-96 ............ 1335.8 Total Revenue for Leisure and Personal Services Industries and for
Business Services Industries, Canada, 1989-1996 ........................................ 1335.9 Distribution of the Client Base for Leisure, Business and Personal Services
Industries, Canada 1995 et 1996 .................................................................. 1345.10 Distribution of Full-time and Part-time Employment, for Business Service
Industries, Canada 1996 ............................................................................... 134
6.1 Tourism Demand in Canada - Millions of dollars ............................................ 1356.2 Tourism Demand in Canada - Millions of 1992 dollars.................................... 1366.3 Tourism Domestic Demand in Canada - Millions of dollars ............................. 1376.4 Tourism Domestic Demand in Canada - Millions of 1992 dollars .................... 1386.5 Tourism Exports - Canada - Millions of dollars ............................................... 1396.6 Tourism Exports - Canada - Millions of 1992 dollars ...................................... 1406.7 Employment Generated by Tourism............................................................... 141
Statistics Canada - Catalogue no. 87-403 Tourism Statistical Digest 7
EDITOR’S NOTEEDITOR’S NOTE
This is the first edition of the new Tourism Statistical Digest. The Digest was revived inresponse to repeated requests by users of data. A market study was conducted in thesummer of 1998 to assess the potential for such a publication and to solicit user suggestionsregarding its format and contents. As in the past, the Digest will provide a complete summaryof statistics on travel and tourism by Canadians and foreign visitors to Canada. This editioncontains 1997 data.
The Digest is intended for tourism industry managers, policy planners, analysts, researchers,administrators, teachers, students and anyone else with a direct or indirect interest in theindustry. It is the fruit of a joint effort by Statistics Canada and the Canadian TourismCommission, with the assistance of contributors from various organizations.
This edition contains eight chapters and a series of statistical tables from various surveysand other sources. The names of the surveys that provided data for the Digest, along withthe associated catalogue numbers, are listed in an appendix. Since it was impossible todescribe the methodology of every survey cited here, readers may wish to consult thelisted publications for additional information or the latest statistics or analyses.
The Tourism Statistical Digest begins with an overview of global tourism as depicted bythe World Tourism Organisation data on arrivals, international receipts, as well as long-haul and intra-regional travel. World Trends describes Canada’s status as both aninternational tourist destination and a source of tourists. It provides an analysis of theeconomic situation in Canada’s main markets and the latest trends in the development ofnew tourism products.
Chapters 2 and 3, Travel by Canadians and International Travel to Canada, cover tourismdemand using data from two surveys conducted by the Tourism Statistics Program: theCanadian Travel Survey (CTS) and the International Travel Survey (ITS). Travel by Canadiansis analyzed by destination (intraprovincial, interprovincial, United States and overseas),while travel to Canada is analyzed by origin (United States and overseas).
Chapters 4 and 5, Passenger Transportation in Canada and Tourism Service Industries,deal with the supply of tourism services. The former, prepared by the Transportation Divisionusing data from its many surveys, provides 1997 statistical highlights for the variouscomponents of the transportation industry (road, air, water and rail). The latter examines allthe other services that contribute to the tourism experience: accommodation, food andbeverage services, travel agency and tour operator services, and tourist attractions.
8 Tourism Statistical Digest Statistics Canada - Catalogue no. 87-403
Editor’s Note
Chapter 6, Tourism in Canada and its Various Economic Facets, was prepared by the Incomeand Expenditure Accounts Division. Using information from the Tourism Satellite Account andthe National Tourism Indicators, it attempts to gauge the real importance of tourism in Canada’seconomy. Individual topics include tourism demand in Canada, the tourism gross domesticproduct (GDP), employment in the tourism industry, government revenues from tourism, andinflation in tourism.
Chapter 7, entitled Regional Portrait, contains three articles on tourism at the subprovinciallevel. This chapter was developed in response to the many requests made by potential users intheir answers to our market study questionnaire last summer. Each article looks at tourismareas from a different angle. “Profile of tourism in Canada’s tourism regions” examines the mostpopular tourism areas in Canada as destinations. In “Lessons learned from the analysis of1997 CTS and ITS results for the merger of southwestern Ontario and Festival Country”, thetwo regions’ client bases are analyzed with a view to developing a joint marketing plan. Thethird article, “Tourism-generating regions in Canada: Factors associated with travel patterns andtourist behaviour”, looks at tourism areas as origins.
Chapter 8, A Glance at the Future, was written by the Canadian Tourism Commission. It roundsout the Digest with a look ahead, using short-term and medium-term forecasts of global andCanada-bound tourist flows, and it concludes with a description of some of the challenges theindustry will face in the next millennium.
I hope you will enjoy reading this publication.
Danielle ShaienksEditor
Statistics Canada - Catalogue no. 87-403 Tourism Statistical Digest 9
HIGHLIGHTSHIGHLIGHTS
International tourism is one of the fastest-growing industries in the world. In 1997, therewere 611 million international arrivals, a 2.4% increase from 1996. Receipts were flat,however, as the East Asia/Pacific region, hard hit by the financial crisis, turned in its worstperformance of the decade, a 1% decline in arrivals and a 7% drop in receipts.
Long-haul travel was the driving force behind international tourism’s growth in most partsof the world during the last decade. Tourists were travelling farther and farther, and long-haul travellers spent more than intraregional travellers.
Canada ranked eighth among the most popular destinations in the world in 1997, animprovement over its eleventh place in 1995 and tenth place in 1996. More foreign visitorscame to Canada in 1997 than in any previous year. Taking advantage of the favourableexchange rate, Americans made 13.4 million overnight trips to Canada, up 3.8% from1996. In contrast, the number of overnight trips by overseas visitors fell 3% because of thefinancial crisis in Asia.
Canada’s strong economic performance in 1997 prompted many Canadians to travel insidethe country and overseas, and as a result it was a record-breaking year for overseas travel.Because of the low value of the Canadian dollar, fewer Canadians visited the United Statesin 1997. For Canadians who travelled in Canada, Ontario, British Columbia and Quebecwere the most popular provinces.
Air travel has been growing steadily in recent years, partly as a result of the 1995 “OpenSkies” agreement between Canada and the United States. Since the beginning of thedecade, the charter industry has nearly quintupled in size.
Generally, hotels and motor inns fared very well in 1996-97. Between 1993-94 and 1996-97, occupancy rates climbed from 59% to 64% and profit margins widened from –1% to12%.
Tourism expenditures in Canada totalled $44.0 billion in 1997, a 5.3% increase from 1996.Domestic demand was up 5.3% in 1997, the highest growth rate since 1990. On the otherhand, the growth rate of foreign demand (exports), plunged from 10.4% in 1996 to 5.2% in1997, its lowest level since 1992. Air transportation expenditures grew at a faster rate(10.3%) than any other expenditure component, making their best showing since 1987.
10 Tourism Statistical Digest Statistics Canada - Catalogue no. 87-403
Highlights
According to the World Tourism Organization, tourist arrivals worldwide are expected to continueclimbing, from 560 million in 1995 to 1.6 billion in 2020. Similarly, tourism receipts should increasefrom US$400 billion in 1995 to US$2 trillion by 2020.
The Canadian Tourism Commission estimates that the number of visitors to Canada will rise to22.6 million in 2003. If the downward trend in Canadian arrivals and expenditures in the UnitedStates and the vigorous growth in tourism receipts generated by Americans continue, Canada’stourism deficit with the United States could be erased by 2000 and transformed into an expandingsurplus through 2002.
CHAPTER 1WORLD TRENDS
Statistics Canada - Catalogue no. 87-403 Tourism Statistical Digest 11
International tourism is one of the fastest-growing industries in the world.Over the past ten years, the number of international arrivals at nationalborders has increased at an average annual rate of 5.2%, reaching611 million in 1997. According to the World Tourism Organisation1, arrivalswill rise to close to 700 million in the year 2000 and will be over one billion bythe year 2010. Between 1987 and 1997, receipts increased by an averageof 9.8% per year, reaching US$436 billion.2 However, this growth slowed in1997, when the East Asia/Pacific region, reeling from the financial crisis,turned in its worst performance since 1989 with decreases of 1% forinternational arrivals and 7% for receipts. This performance contrasted withgrowth rates of more than 10% experienced by the region in the first half ofthe decade.
The East Asia/Pacific region, which accounts for nearly 20% of global tourismreceipts, should still experience some difficult times in the next few years.But the World Tourism Organization expects that the growth of tourismworldwide will continue in 1998, at a rate that could range between 1.5%and 2.0%. This compares to rates of 2.4% and 5.5% respectively in 1997and 1996.
In 1997, despite their relatively small market share, South Asia and theMiddle East experienced higher growth rates than in 1996. Europemaintained a growth rate of 3%, while the East Asia/Pacific region registereda major decline.
The best regional performance in the world was that of South Asia andAfrica with increases in arrivals of 8.9% and 6.1% respectively. This isattributable to the very positive results of India, South Africa and Morocco.However, receipts grew generally more slowly, to some extent reflecting aslackening of expenditures in the main travel markets.
Total tourist arrivals in Europe grew by 3.2% in 1997, reaching 362 million.This represented nearly 60% of all international arrivals. Receipts fell slightlyto US$218 billion, representing just over 50% of all international receipts.This decline in receipts basically reflects the appreciation of the US dollar inrelation to various European currencies such as the French franc and theItalian lira, since in national currencies, those countries’ receipts increasedin 1997.
Danielle Shaienks,Tourism Statistics Program
12 Tourism Statistical Digest Statistics Canada - Catalogue no. 87-403
CHAPTER 1
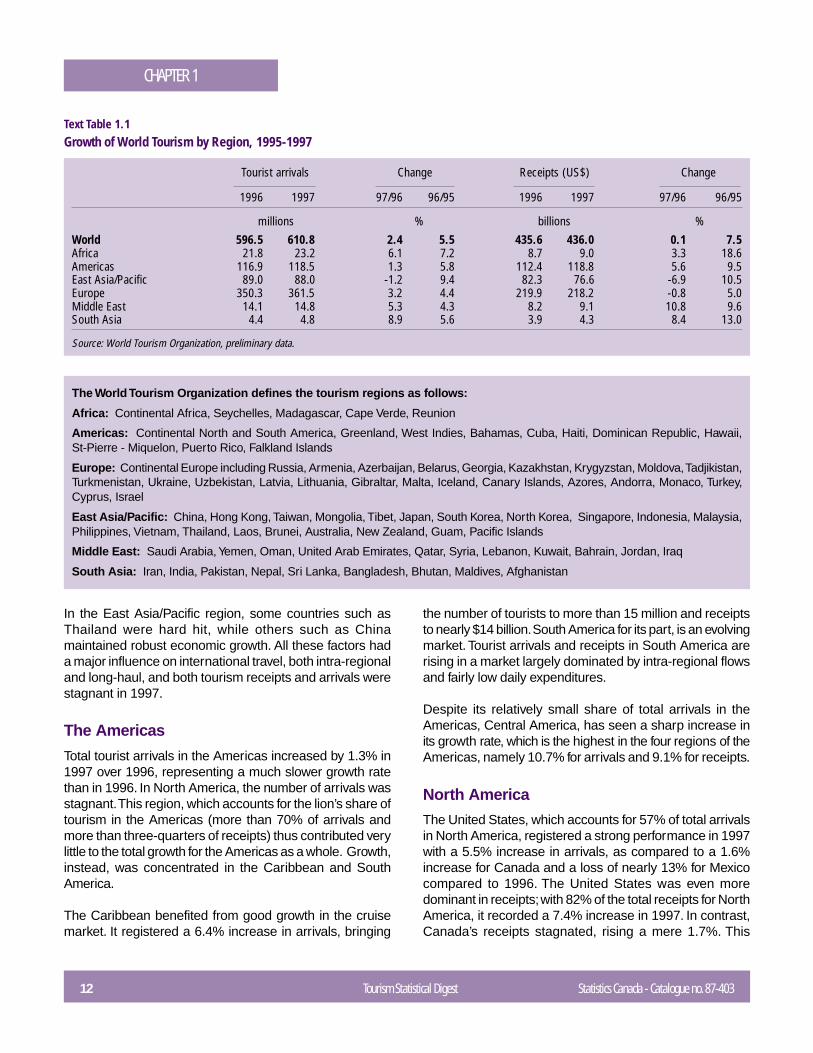
The World Tourism Organization defines the tourism regions as follows:
Africa: Continental Africa, Seychelles, Madagascar, Cape Verde, Reunion
Americas: Continental North and South America, Greenland, West Indies, Bahamas, Cuba, Haiti, Dominican Republic, Hawaii,St-Pierre - Miquelon, Puerto Rico, Falkland Islands
Europe: Continental Europe including Russia, Armenia, Azerbaijan, Belarus, Georgia, Kazakhstan, Krygyzstan, Moldova, Tadjikistan,Turkmenistan, Ukraine, Uzbekistan, Latvia, Lithuania, Gibraltar, Malta, Iceland, Canary Islands, Azores, Andorra, Monaco, Turkey,Cyprus, Israel
East Asia/Pacific: China, Hong Kong, Taiwan, Mongolia, Tibet, Japan, South Korea, North Korea, Singapore, Indonesia, Malaysia,Philippines, Vietnam, Thailand, Laos, Brunei, Australia, New Zealand, Guam, Pacific Islands
Middle East: Saudi Arabia, Yemen, Oman, United Arab Emirates, Qatar, Syria, Lebanon, Kuwait, Bahrain, Jordan, Iraq
South Asia: Iran, India, Pakistan, Nepal, Sri Lanka, Bangladesh, Bhutan, Maldives, Afghanistan
Tourist arrivals Change Receipts (US$) Change
1996 1997 97/96 96/95 1996 1997 97/96 96/95
millions % billions %World 596.5 610.8 2.4 5.5 435.6 436.0 0.1 7.5Africa 21.8 23.2 6.1 7.2 8.7 9.0 3.3 18.6Americas 116.9 118.5 1.3 5.8 112.4 118.8 5.6 9.5East Asia/Pacific 89.0 88.0 -1.2 9.4 82.3 76.6 -6.9 10.5Europe 350.3 361.5 3.2 4.4 219.9 218.2 -0.8 5.0Middle East 14.1 14.8 5.3 4.3 8.2 9.1 10.8 9.6South Asia 4.4 4.8 8.9 5.6 3.9 4.3 8.4 13.0
Source: World Tourism Organization, preliminary data.
Text Table 1.1Growth of World Tourism by Region, 1995-1997
In the East Asia/Pacific region, some countries such asThailand were hard hit, while others such as Chinamaintained robust economic growth. All these factors hada major influence on international travel, both intra-regionaland long-haul, and both tourism receipts and arrivals werestagnant in 1997.
The Americas
Total tourist arrivals in the Americas increased by 1.3% in1997 over 1996, representing a much slower growth ratethan in 1996. In North America, the number of arrivals wasstagnant. This region, which accounts for the lion’s share oftourism in the Americas (more than 70% of arrivals andmore than three-quarters of receipts) thus contributed verylittle to the total growth for the Americas as a whole. Growth,instead, was concentrated in the Caribbean and SouthAmerica.
The Caribbean benefited from good growth in the cruisemarket. It registered a 6.4% increase in arrivals, bringing
the number of tourists to more than 15 million and receiptsto nearly $14 billion. South America for its part, is an evolvingmarket. Tourist arrivals and receipts in South America arerising in a market largely dominated by intra-regional flowsand fairly low daily expenditures.
Despite its relatively small share of total arrivals in theAmericas, Central America, has seen a sharp increase inits growth rate, which is the highest in the four regions of theAmericas, namely 10.7% for arrivals and 9.1% for receipts.
North America
The United States, which accounts for 57% of total arrivalsin North America, registered a strong performance in 1997with a 5.5% increase in arrivals, as compared to a 1.6%increase for Canada and a loss of nearly 13% for Mexicocompared to 1996. The United States was even moredominant in receipts; with 82% of the total receipts for NorthAmerica, it recorded a 7.4% increase in 1997. In contrast,Canada’s receipts stagnated, rising a mere 1.7%. This
Statistics Canada - Catalogue no. 87-403 Tourism Statistical Digest 13
CHAPTER 1
Tourist arrivals Change Receipts (US$) Change
1996 1997 97/96 96/95 1996 1997 97/96 96/95
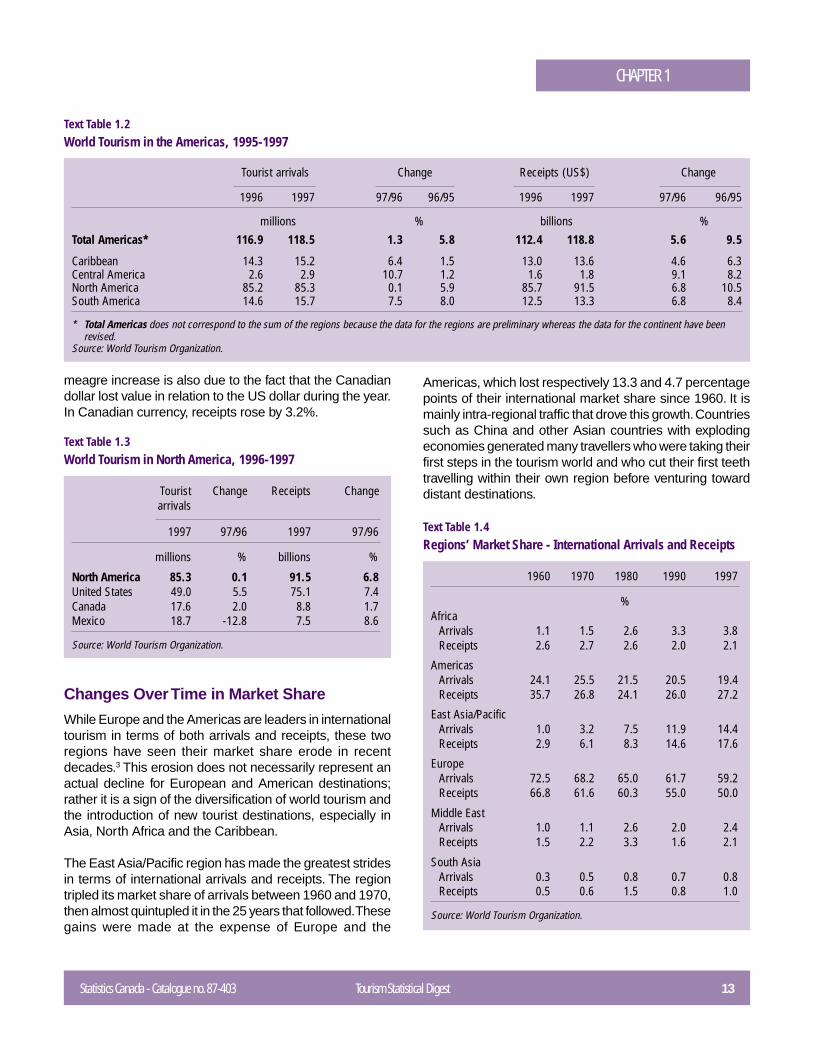
millions % billions %Total Americas* 116.9 118.5 1.3 5.8 112.4 118.8 5.6 9.5
Caribbean 14.3 15.2 6.4 1.5 13.0 13.6 4.6 6.3Central America 2.6 2.9 10.7 1.2 1.6 1.8 9.1 8.2North America 85.2 85.3 0.1 5.9 85.7 91.5 6.8 10.5South America 14.6 15.7 7.5 8.0 12.5 13.3 6.8 8.4
* Total Americas does not correspond to the sum of the regions because the data for the regions are preliminary whereas the data for the continent have beenrevised.
Source: World Tourism Organization.
Text Table 1.2World Tourism in the Americas, 1995-1997
Tourist Change Receipts Changearrivals
1997 97/96 1997 97/96
millions % billions %
North America 85.3 0.1 91.5 6.8United States 49.0 5.5 75.1 7.4Canada 17.6 2.0 8.8 1.7Mexico 18.7 -12.8 7.5 8.6
Source: World Tourism Organization.
Text Table 1.3World Tourism in North America, 1996-1997
Americas, which lost respectively 13.3 and 4.7 percentagepoints of their international market share since 1960. It ismainly intra-regional traffic that drove this growth. Countriessuch as China and other Asian countries with explodingeconomies generated many travellers who were taking theirfirst steps in the tourism world and who cut their first teethtravelling within their own region before venturing towarddistant destinations.
1960 1970 1980 1990 1997
%Africa
Arrivals 1.1 1.5 2.6 3.3 3.8Receipts 2.6 2.7 2.6 2.0 2.1
AmericasArrivals 24.1 25.5 21.5 20.5 19.4Receipts 35.7 26.8 24.1 26.0 27.2
East Asia/PacificArrivals 1.0 3.2 7.5 11.9 14.4Receipts 2.9 6.1 8.3 14.6 17.6
EuropeArrivals 72.5 68.2 65.0 61.7 59.2Receipts 66.8 61.6 60.3 55.0 50.0
Middle EastArrivals 1.0 1.1 2.6 2.0 2.4Receipts 1.5 2.2 3.3 1.6 2.1
South AsiaArrivals 0.3 0.5 0.8 0.7 0.8Receipts 0.5 0.6 1.5 0.8 1.0
Source: World Tourism Organization.
Text Table 1.4Regions’ Market Share - International Arrivals and Receipts
meagre increase is also due to the fact that the Canadiandollar lost value in relation to the US dollar during the year.In Canadian currency, receipts rose by 3.2%.
Changes Over Time in Market Share
While Europe and the Americas are leaders in internationaltourism in terms of both arrivals and receipts, these tworegions have seen their market share erode in recentdecades.3 This erosion does not necessarily represent anactual decline for European and American destinations;rather it is a sign of the diversification of world tourism andthe introduction of new tourist destinations, especially inAsia, North Africa and the Caribbean.
The East Asia/Pacific region has made the greatest stridesin terms of international arrivals and receipts. The regiontripled its market share of arrivals between 1960 and 1970,then almost quintupled it in the 25 years that followed. Thesegains were made at the expense of Europe and the
14 Tourism Statistical Digest Statistics Canada - Catalogue no. 87-403
CHAPTER 1
Regional Trends in Long-haul Travel Markets
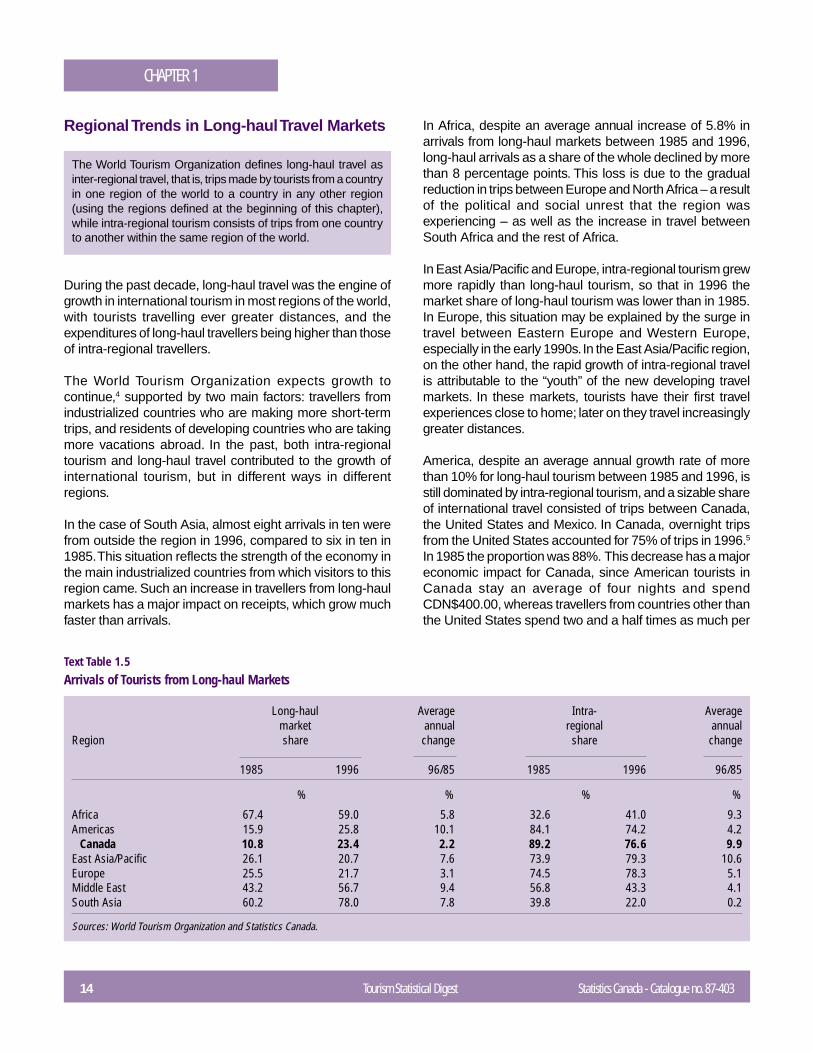
The World Tourism Organization defines long-haul travel asinter-regional travel, that is, trips made by tourists from a countryin one region of the world to a country in any other region(using the regions defined at the beginning of this chapter),while intra-regional tourism consists of trips from one countryto another within the same region of the world.
During the past decade, long-haul travel was the engine ofgrowth in international tourism in most regions of the world,with tourists travelling ever greater distances, and theexpenditures of long-haul travellers being higher than thoseof intra-regional travellers.
The World Tourism Organization expects growth tocontinue,4 supported by two main factors: travellers fromindustrialized countries who are making more short-termtrips, and residents of developing countries who are takingmore vacations abroad. In the past, both intra-regionaltourism and long-haul travel contributed to the growth ofinternational tourism, but in different ways in differentregions.
In the case of South Asia, almost eight arrivals in ten werefrom outside the region in 1996, compared to six in ten in1985. This situation reflects the strength of the economy inthe main industrialized countries from which visitors to thisregion came. Such an increase in travellers from long-haulmarkets has a major impact on receipts, which grow muchfaster than arrivals.
Long-haul Average Intra- Averagemarket annual regional annual
Region share change share change
1985 1996 96/85 1985 1996 96/85
% % % %
Africa 67.4 59.0 5.8 32.6 41.0 9.3Americas 15.9 25.8 10.1 84.1 74.2 4.2
Canada 10.8 23.4 2.2 89.2 76.6 9.9East Asia/Pacific 26.1 20.7 7.6 73.9 79.3 10.6Europe 25.5 21.7 3.1 74.5 78.3 5.1Middle East 43.2 56.7 9.4 56.8 43.3 4.1South Asia 60.2 78.0 7.8 39.8 22.0 0.2
Sources: World Tourism Organization and Statistics Canada.
Text Table 1.5Arrivals of Tourists from Long-haul Markets
In Africa, despite an average annual increase of 5.8% inarrivals from long-haul markets between 1985 and 1996,long-haul arrivals as a share of the whole declined by morethan 8 percentage points. This loss is due to the gradualreduction in trips between Europe and North Africa – a resultof the political and social unrest that the region wasexperiencing – as well as the increase in travel betweenSouth Africa and the rest of Africa.
In East Asia/Pacific and Europe, intra-regional tourism grewmore rapidly than long-haul tourism, so that in 1996 themarket share of long-haul tourism was lower than in 1985.In Europe, this situation may be explained by the surge intravel between Eastern Europe and Western Europe,especially in the early 1990s. In the East Asia/Pacific region,on the other hand, the rapid growth of intra-regional travelis attributable to the “youth” of the new developing travelmarkets. In these markets, tourists have their first travelexperiences close to home; later on they travel increasinglygreater distances.
America, despite an average annual growth rate of morethan 10% for long-haul tourism between 1985 and 1996, isstill dominated by intra-regional tourism, and a sizable shareof international travel consisted of trips between Canada,the United States and Mexico. In Canada, overnight tripsfrom the United States accounted for 75% of trips in 1996.5
In 1985 the proportion was 88%. This decrease has a majoreconomic impact for Canada, since American tourists inCanada stay an average of four nights and spendCDN$400.00, whereas travellers from countries other thanthe United States spend two and a half times as much per
Statistics Canada - Catalogue no. 87-403 Tourism Statistical Digest 15
CHAPTER 1
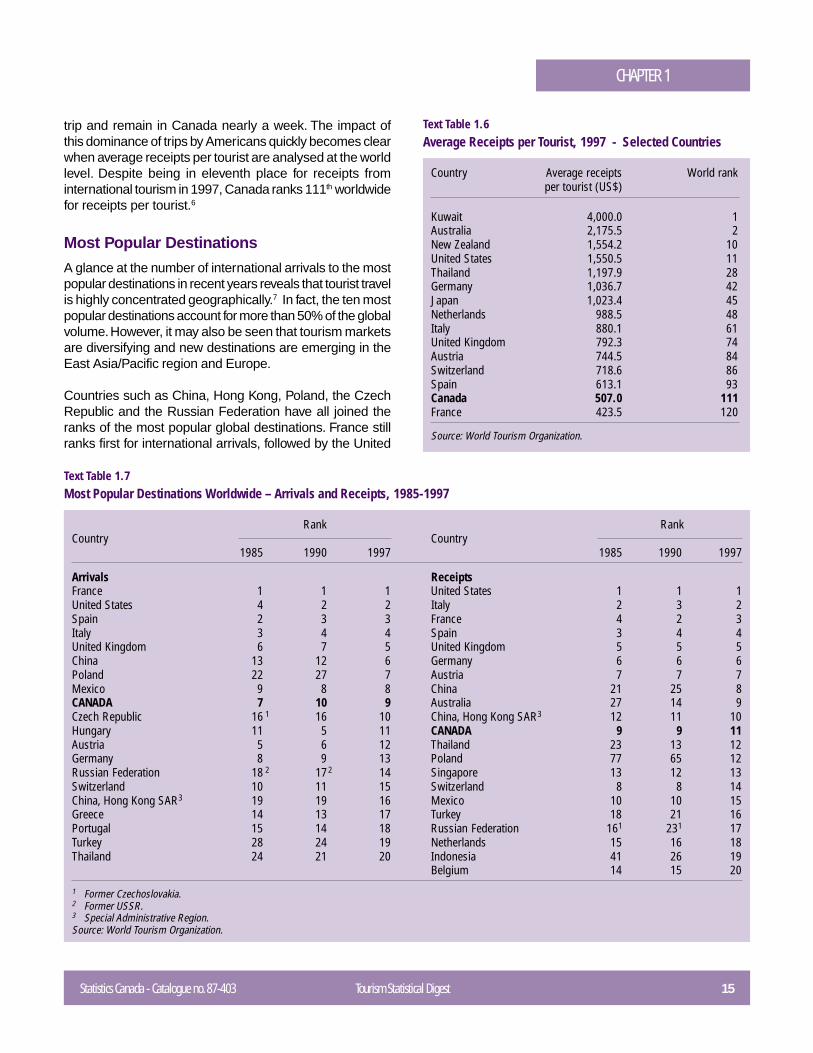
trip and remain in Canada nearly a week. The impact ofthis dominance of trips by Americans quickly becomes clearwhen average receipts per tourist are analysed at the worldlevel. Despite being in eleventh place for receipts frominternational tourism in 1997, Canada ranks 111th worldwidefor receipts per tourist.6
Most Popular Destinations
A glance at the number of international arrivals to the mostpopular destinations in recent years reveals that tourist travelis highly concentrated geographically.7 In fact, the ten mostpopular destinations account for more than 50% of the globalvolume. However, it may also be seen that tourism marketsare diversifying and new destinations are emerging in theEast Asia/Pacific region and Europe.
Countries such as China, Hong Kong, Poland, the CzechRepublic and the Russian Federation have all joined theranks of the most popular global destinations. France stillranks first for international arrivals, followed by the United
Country Average receipts World rankper tourist (US$)
Kuwait 4,000.0 1Australia 2,175.5 2New Zealand 1,554.2 10United States 1,550.5 11Thailand 1,197.9 28Germany 1,036.7 42Japan 1,023.4 45Netherlands 988.5 48Italy 880.1 61United Kingdom 792.3 74Austria 744.5 84Switzerland 718.6 86Spain 613.1 93Canada 507.0 111France 423.5 120
Source: World Tourism Organization.
Text Table 1.6Average Receipts per Tourist, 1997 - Selected Countries
Rank RankCountry Country
1985 1990 1997 1985 1990 1997
Arrivals ReceiptsFrance 1 1 1 United States 1 1 1United States 4 2 2 Italy 2 3 2Spain 2 3 3 France 4 2 3Italy 3 4 4 Spain 3 4 4United Kingdom 6 7 5 United Kingdom 5 5 5China 13 12 6 Germany 6 6 6Poland 22 27 7 Austria 7 7 7Mexico 9 8 8 China 21 25 8CANADA 7 10 9 Australia 27 14 9Czech Republic 16 1 16 10 China, Hong Kong SAR3 12 11 10Hungary 11 5 11 CANADA 9 9 11Austria 5 6 12 Thailand 23 13 12Germany 8 9 13 Poland 77 65 12Russian Federation 18 2 172 14 Singapore 13 12 13Switzerland 10 11 15 Switzerland 8 8 14China, Hong Kong SAR3 19 19 16 Mexico 10 10 15Greece 14 13 17 Turkey 18 21 16Portugal 15 14 18 Russian Federation 161 231 17Turkey 28 24 19 Netherlands 15 16 18Thailand 24 21 20 Indonesia 41 26 19
Belgium 14 15 20
1 Former Czechoslovakia.2 Former USSR.3 Special Administrative Region.Source: World Tourism Organization.
Text Table 1.7Most Popular Destinations Worldwide – Arrivals and Receipts, 1985-1997
16 Tourism Statistical Digest Statistics Canada - Catalogue no. 87-403
CHAPTER 1
States and Spain. Canada rose to the eighth placeworldwide in 1997, after holding eleventh place in 1995 andtenth in 1996.
When countries are classified according to their tourismreceipts, the same trends of concentration and diversificationare evident. The United States holds first place with nearly17% of global receipts in 1997. The European countriesthat hold the next six positions have all seen their respectiveshares of global receipts decline since 1990 in favour ofnew destinations such as China, Poland, Indonesia andTurkey. Canada, which ranked ninth in 1990, slipped toeleventh in 1997, with its market share declining from 2.4%to 2.0%.
Because of the strength of the US dollar in relation to thecurrencies of various countries, there is a sizable gapbetween world tourism as measured in dollars and byvolume. For some destinations, international receipts aredown while arrivals are up. This finding reflects the worldtrade situation, the evolution of which has been stronglyaffected by the appreciation of the dollar against thecurrencies of the main trading countries of Western Europeand Asia, despite an increase in trade volumes.8 Becauseof these two regions’ weight in world trade and their lowinflation levels, export prices in dollars have fallensignificantly, with the result that the growth rate of worldtrade has fallen when measured in terms of dollars, eventhough it has increased in terms of volume.
World Exports and International Tourism
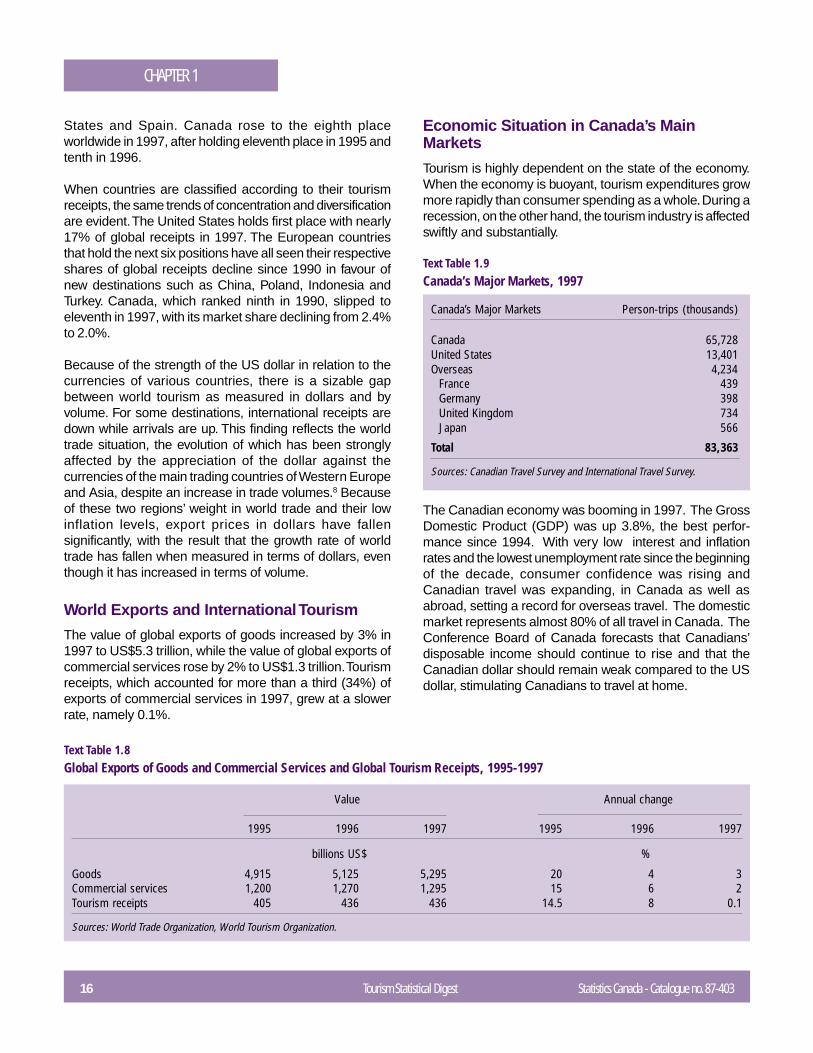
The value of global exports of goods increased by 3% in1997 to US$5.3 trillion, while the value of global exports ofcommercial services rose by 2% to US$1.3 trillion. Tourismreceipts, which accounted for more than a third (34%) ofexports of commercial services in 1997, grew at a slowerrate, namely 0.1%.
Value Annual change
1995 1996 1997 1995 1996 1997
billions US$ %
Goods 4,915 5,125 5,295 20 4 3Commercial services 1,200 1,270 1,295 15 6 2Tourism receipts 405 436 436 14.5 8 0.1
Sources: World Trade Organization, World Tourism Organization.
Text Table 1.8Global Exports of Goods and Commercial Services and Global Tourism Receipts, 1995-1997
Canada’s Major Markets Person-trips (thousands)
Canada 65,728United States 13,401Overseas 4,234
France 439Germany 398United Kingdom 734Japan 566
Total 83,363
Sources: Canadian Travel Survey and International Travel Survey.
Economic Situation in Canada’s MainMarkets
Tourism is highly dependent on the state of the economy.When the economy is buoyant, tourism expenditures growmore rapidly than consumer spending as a whole. During arecession, on the other hand, the tourism industry is affectedswiftly and substantially.
The Canadian economy was booming in 1997. The GrossDomestic Product (GDP) was up 3.8%, the best perfor-mance since 1994. With very low interest and inflationrates and the lowest unemployment rate since the beginningof the decade, consumer confidence was rising andCanadian travel was expanding, in Canada as well asabroad, setting a record for overseas travel. The domesticmarket represents almost 80% of all travel in Canada. TheConference Board of Canada forecasts that Canadians’disposable income should continue to rise and that theCanadian dollar should remain weak compared to the USdollar, stimulating Canadians to travel at home.
Text Table 1.9Canada’s Major Markets, 1997
Statistics Canada - Catalogue no. 87-403 Tourism Statistical Digest 17
CHAPTER 1
The US economy had a record year in 1997, with GDPexpanding by 3.9%. Paralleling this growth, now in itsseventh year, American consumer confidence has risen toits highest level in 30 years. Americans’ disposable incomeis also rising, creating an economic situation highlyfavourable to tourism.9 The prospects for the Americanmarket are excellent. According to the Conference Boardof Canada, economic growth should continue, albeit at asomewhat slower pace, and the US dollar is expected toremain strong for some time.10
Once again according to the Conference Board of Canada,the prospects for the main European markets are mixed.France and Germany had a strong economic performancein 1997, and this growth should continue. The Euro, whichwas adopted in January 1999 as the common currency ofthe European Union, is expected to rise in value againstthe Canadian dollar, and this should have a positive impacton travel from these two countries. Economic growth isexpected to slacken in the United Kingdom, and the dollarshould appreciate against the British pound. Therefore, travelfrom the United Kingdom will probably grow more slowly inthe coming years.
Impact of the Asian Crisis on World Tourism
Despite the region’s impressive economic performance inrecent years, a number of countries in East Asia and thePacific have experienced enormous pressures on theirfinancial markets, linked to high external debt levels andcurrencies continually losing value against the US dollar.11
According to all economic and social indicators, Japan hasgone through its worst recession since the war, and thesituation is still difficult. The economies of the other countriesin this region have experienced sharp reductions in theirgrowth rates; their currencies have fallen steeply againstthe US dollar and European currencies; inflation andunemployment rates are rising and external debt isskyrocketing. Only China and Taiwan have been more orless spared.
The populations of the Asian countries affected by the crisisare in a state of shock. Some people have lost a sizableshare of their capital in the collapse of the stock marketsand the devaluation of their currency, while others have losttheir businesses or jobs. This has led to a drop indiscretionary spending, and travel abroad has been the firstto suffer.
On the other hand, the devaluation of Asian currencies hassignificantly reduced the cost of travel to Asian destinations,and the World Tourism Organisation anticipates a strongincrease in the figures of long-haul travel from Europe andthe Americas in 1998.
The impact of the Asian financial crisis on world tourismcan thus be summarized as follows: intra-regional tourismand long-haul tourism originating from the region will decline,while foreign tourism with the region as its destination willrise.
Preliminary Review of 1998
The growth rate achieved worldwide in 1997 was maintainedin 1998 (2.5%) and the number of international tourismarrivals reached 635 million. International tourism receipts,which stagnated in 1997, resumed growth in 1998 (0.3 %)to reach US$439 billion. When analysing trends in inter-national receipts, one should consider the annual fluc-tuations of the various currencies against the US dollar;trends in international arrivals may be a more reliableindicator of industry performance. Despite the growth rateslowdown in the second half of the decade, the tourismindustry performance was remarkable given the sloweconomic recovery and the high unemployment rates insome major tourism markets and the financial crisis in Asia.
According to preliminary results from the World TourismOrganization12, Canada posted a strong increase in itsinternational arrivals and was able to maintain its 1997 eighthposition in the ranking of the world’s most popular destina-tions. In terms of ranking of international receipts (toptourism earners), Canada went from eleventh position toninth position despite an important decrease (-6.7%) in thevalue of the Canadian dollar compared to the US currency.
In addition to economic trends, the World TourismOrganization has identified a few trends concerning tourismproducts that should be increasingly in demand in the 21st
century13:
1) Adventure tourism: in an ever more heavily travelledworld, with very few destinations still untouched,adventure tourists will increasingly be drawn tounexplored destinations such as Antarctica, the peaksof Mount Everest or the ocean depths.
18 Tourism Statistical Digest Statistics Canada - Catalogue no. 87-403
CHAPTER 1
2) Cruises: the cruise industry has been enjoying aphenomenal growth rate – nearly 10% per year overthe past decade. Forty-two cruise ships are currentlyunder construction, and the trend is toward greater size.These immense ships offer definite advantages in termsof costs and the variety of services that can be providedon board. The number of destinations offered is alsoexpanding.
3) Ecotourism: more and more tourists are seeking a typeof travel that includes a nature and outdoor component,with a focus on either nature preservation or conserva-tion. These tourists are looking for a healthy, high-qualityenvironment and guides who can provide them withinterpretation services.
4) Cultural tourism: tourists will increasingly seek learningexperiences that add spiritual or educational value totheir lives; examples are aboriginal, cultural and heritagetourism, including visits to museums, art galleries,historic sites and national parks, or participation incultural events or festivals.
5) Theme parks: theme tourism is another type of travelthat will become an increasingly popular vacationchoice. Theme parks are currently in great demand,and new projects are in the planning stage throughoutthe world.
Above all else, traveller safety remains the number onepriority. Some destinations are consistently avoided owingto political instability, and they have difficulty rebuilding theirreputation after a few years of bad publicity.
In light of all these facts, the Canadian tourism industryseems well poised to capitalize on world trends. With
competitive prices and a reputation as a country that isclean, safe, friendly and respectful of nature, Canada shouldbenefit from a number of the above-mentioned trends, botheconomic and product-related.
Notes
1 World Tourism Organization, Tourism 2020 Vision, A NewForecast from the WTO.
2 World Tourism Organization, Tourism Highlights, 1997.
3 World Tourism Organization, Tourism Market Trends, 1997Edition, The World.
4 World Tourism Organization, Tourism Market Trends, 1997Edition, The World.
5 Statistics Canada, International Travel Survey.
6 World Tourism Organization.
7 World Tourism Organization, Tourism Highlights, 1997.
8 World Trade Organization.
9 Canadian Tourism Commission, The American Tourism Market:Evolution to 2010.
10 The Conference Board of Canada, Travel Markets Outlook, Fall1998.
11 World Tourism Organization, The Asian Financial Crisis and itsImpact on Tourism.
12 World Tourism Organization, Global Tourism Results in 1998.
13 World Tourism Organization, WTO Picks Hot Tourism Trendsfor 21st Century.
CHAPTER 2CANADIAN TRAVEL
Statistics Canada - Catalogue no. 87-403 Tourism Statistical Digest 19
Overview of Trends
Economic Situation
Canada’s economy was booming in 1997. The economy, as measuredby the Gross Domestic Product (GDP), grew 3.8% in 1997, its bestperformance since 1994 and the second best this decade. Consumerspending and business investment were bolstered by low interest rates, lowinflation and brighter job and business prospects. The unemployment ratedropped to 9.2%, the lowest level recorded over this decade.
Buoyed by the strongest consumer confidence over the last decade,Canadians opened up their pocket books in 1997. This situation occurreddespite virtually no change in personal disposable income. For manyCanadians it meant digging into debt or using their savings, which dwindledfrom 7.8% in 1995 to 1.8% in 1997. Low interest rates and robust sales ofnew dwellings spurred purchases of big-ticket items such as furniture,household appliances and motor vehicles. At the end of the year, consumershad spent 3.9% more on consumer goods and services. Durable goodswere among the most popular purchases in 1997, with increases of 11.9%in consumer spending.
1995 1996 1997
Gross Domestic Product ($billions) 760.3 767.7 799.1Consumer Price Index 111.8 113.5 115.4Unemployment Rate (%) 9.5 9.7 9.2Savings Rate (%) 7.8 5.8 1.8Personal Disposable Income ($) 17,248 17,296 17,292Canadian Dollar ($US/$CDN) 0.73 0.73 0.72Consumer Confidence Index 94.5 101.2 115.0
Sources: National Tourism Indicators Quarterly Estimates; Conference Board of Canada.
Text Table 2.1Selected Economic Indicators, 1995, 1996 and 1997
Élaine Fournier andLaurie McDougall,Tourism Statistics Program
20 Tourism Statistical Digest Statistics Canada - Catalogue no. 87-403
CHAPTER 2
This positive economic performance helped convince manyCanadians to travel in Canada and abroad, with 1997representing a record-setting year for trips to overseascountries. However, the falling value of the Canadian dollarcaused an ebb in the flow of Canadians travelling south ofthe border. Tourism spending by overnight domestictravellers totalled $13.3 billion, whereas tourism spendingon overnight trips by foreigners in Canada reached$9.9 billion.
Travel Participation Rates
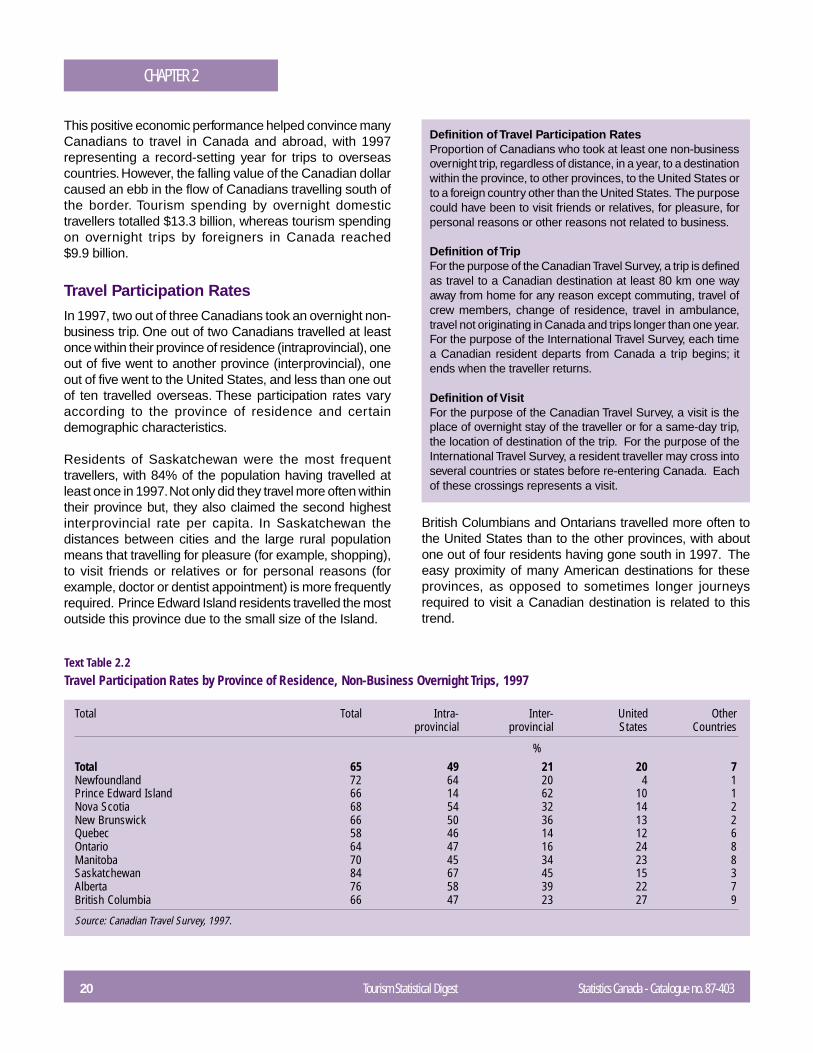
In 1997, two out of three Canadians took an overnight non-business trip. One out of two Canadians travelled at leastonce within their province of residence (intraprovincial), oneout of five went to another province (interprovincial), oneout of five went to the United States, and less than one outof ten travelled overseas. These participation rates varyaccording to the province of residence and certaindemographic characteristics.
Residents of Saskatchewan were the most frequenttravellers, with 84% of the population having travelled atleast once in 1997. Not only did they travel more often withintheir province but, they also claimed the second highestinterprovincial rate per capita. In Saskatchewan thedistances between cities and the large rural populationmeans that travelling for pleasure (for example, shopping),to visit friends or relatives or for personal reasons (forexample, doctor or dentist appointment) is more frequentlyrequired. Prince Edward Island residents travelled the mostoutside this province due to the small size of the Island.
Definition of Travel Participation RatesProportion of Canadians who took at least one non-businessovernight trip, regardless of distance, in a year, to a destinationwithin the province, to other provinces, to the United States orto a foreign country other than the United States. The purposecould have been to visit friends or relatives, for pleasure, forpersonal reasons or other reasons not related to business.
Definition of TripFor the purpose of the Canadian Travel Survey, a trip is definedas travel to a Canadian destination at least 80 km one wayaway from home for any reason except commuting, travel ofcrew members, change of residence, travel in ambulance,travel not originating in Canada and trips longer than one year.For the purpose of the International Travel Survey, each timea Canadian resident departs from Canada a trip begins; itends when the traveller returns.
Definition of VisitFor the purpose of the Canadian Travel Survey, a visit is theplace of overnight stay of the traveller or for a same-day trip,the location of destination of the trip. For the purpose of theInternational Travel Survey, a resident traveller may cross intoseveral countries or states before re-entering Canada. Eachof these crossings represents a visit.
Total Total Intra- Inter- United Otherprovincial provincial States Countries
%Total 65 49 21 20 7Newfoundland 72 64 20 4 1Prince Edward Island 66 14 62 10 1Nova Scotia 68 54 32 14 2New Brunswick 66 50 36 13 2Quebec 58 46 14 12 6Ontario 64 47 16 24 8Manitoba 70 45 34 23 8Saskatchewan 84 67 45 15 3Alberta 76 58 39 22 7British Columbia 66 47 23 27 9
Source: Canadian Travel Survey, 1997.
Text Table 2.2Travel Participation Rates by Province of Residence, Non-Business Overnight Trips, 1997
British Columbians and Ontarians travelled more often tothe United States than to the other provinces, with aboutone out of four residents having gone south in 1997. Theeasy proximity of many American destinations for theseprovinces, as opposed to sometimes longer journeysrequired to visit a Canadian destination is related to thistrend.
Statistics Canada - Catalogue no. 87-403 Tourism Statistical Digest 21
CHAPTER 2
While 7% of Canadians travelled to a country other thanthe United States, this proportion varies from 1% forresidents of Newfoundland and Prince Edward Island to9% for residents of British Columbia. The high proportionof Canadians of Asian origin living in southwestern BritishColumbia partly explains their high participation rate inoverseas travel; visiting friends and relative accounts for33% of visits to Asia.
With the exception of people in the 65 and over age group,who travel less than other age groups, the overall travelparticipation rate of Canadians is virtually the same regard-less of age, but it does vary depending on the destination.A greater proportion of Canadians aged between 55 and64, those who are approaching retirement or have alreadyretired, travelled to an interprovincial destination, the UnitedStates or a foreign country. People in this age groupgenerally have more free time and are often better off finan-cially and can therefore afford to undertake more extensivetrips.
Other demographic characteristics, such as level ofeducation, household income and type of occupation affectthe travel participation rate of Canadians. In general, theshare of travellers increases with the level of education andhousehold income. Thus, three-quarters of Canadians witha university degree travelled in 1997, compared to 40% ofthose with eight or less years of education. Similarly, morethan four out of five Canadians with a household income of$80,000 or more travelled, whereas less than half of thepeople with an income of $20,000 or less did any travelling.As far as the type of occupation is concerned, managersand professionals travelled more often than people workingin the manufacturing, construction or transportationindustries.
Between 1996 and 1997, the travel participation rateincreased significantly for two groups of Canadians. First,in 1996, approximately half of the residents of Prince EdwardIsland had travelled to another province. The following year,this proportion rose to 62%. The opening in May 1997 ofConfederation Bridge which connects Prince Edward Islandto New Brunswick surely contributed to this increase.Second, Canadians in the 55 and over age group alsoincreased their participation rate, mostly for trips to theUnited States and other provinces, but also overseas. Infact, these Canadians represent a segment of the marketthat will continue to expand in years to come.
Characteristics of Canadian Travel
Popular Destinations
When Canadians took a trip out of their home province in1997, many were bound for the most populous province inthe country, Ontario. Quebec was the largest source ofinterprovincial travellers to Ontario (50%) in 1997. Quebec,ranked in second position with 2.6 million interprovincialvisits in 1997. Ontario provided the lion’s share of Quebec’sdomestic market, with an 86% share of visits. This repre-sented the largest share of interprovincial travellers amongall the provinces. Alberta and British Columbia bothattracted almost 2.4 million non-residents in 1997. Albertanscontributed 66% of British Columbia’s non-resident domestictraffic, the second highest share of interprovincial travellersamong the provinces. In comparison, British Columbiasupplied 41% of Alberta’s non-resident market.
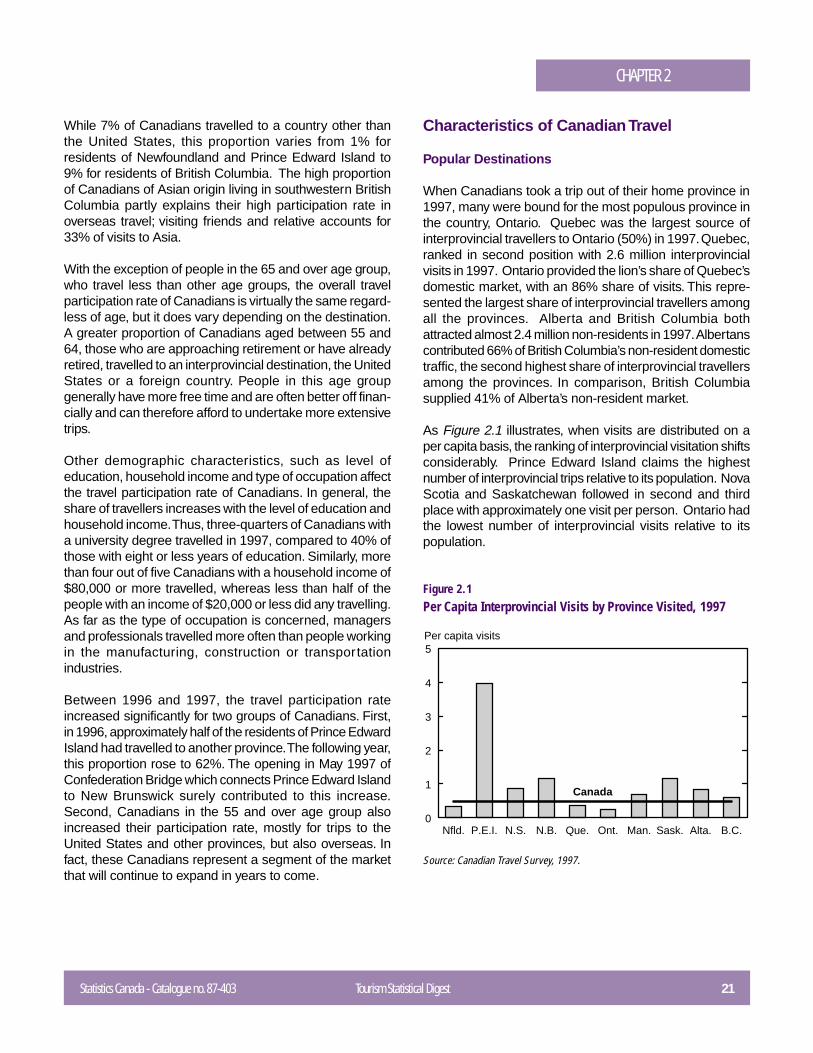
As Figure 2.1 illustrates, when visits are distributed on aper capita basis, the ranking of interprovincial visitation shiftsconsiderably. Prince Edward Island claims the highestnumber of interprovincial trips relative to its population. NovaScotia and Saskatchewan followed in second and thirdplace with approximately one visit per person. Ontario hadthe lowest number of interprovincial visits relative to itspopulation.
Figure 2.1Per Capita Interprovincial Visits by Province Visited, 1997
Source: Canadian Travel Survey, 1997.
Nfld. P.E.I. N.S. N.B. Que. Ont. Man. Sask. Alta. B.C.0
1
2
3
4
5
Canada
Per capita visits
22 Tourism Statistical Digest Statistics Canada - Catalogue no. 87-403
CHAPTER 2
The United Kingdom, a country that has strong traditionalties with Canada, was the overseas country visited the mostby Canadian travellers. Close to 600,000 Canadiansenjoyed the sun, sand and beaches of Mexico, making itthe second most popular country for Canadian travellers.France attracted the third largest contingent of Canadians,while Germany ranked fourth. Cuba was the fifth mostvisited overseas location, indicating Canadians strong desireto venture to sunny locales, especially during the cold wintermonths. The remaining five countries drew less than200,000 Canadian visitors each.
1997 Interprovincial Visits
thousands
Province VisitedOntario 2,692Quebec 2,614Alberta 2,390British Columbia 2,360Saskatchewan 1,177New Brunswick 875Nova Scotia 811Manitoba 780Prince Edward Island 546Newfoundland 188
Source: Canadian Travel Survey, 1997.
Text Table 2.3Ranking of Interprovincial Overnight Visits by Province, 1997
1997 Country Visits
thousandsUnited Kingdom 770Mexico 567France 404Germany 229Cuba 201Italy 161Netherlands 145Hong Kong 139Dominican Republic 138Switzerland 123
Source: International Travel Survey, 1997.
Text Table 2.4Top Ten Overseas Countries Visited by Canadians, OvernightVisits, 1997
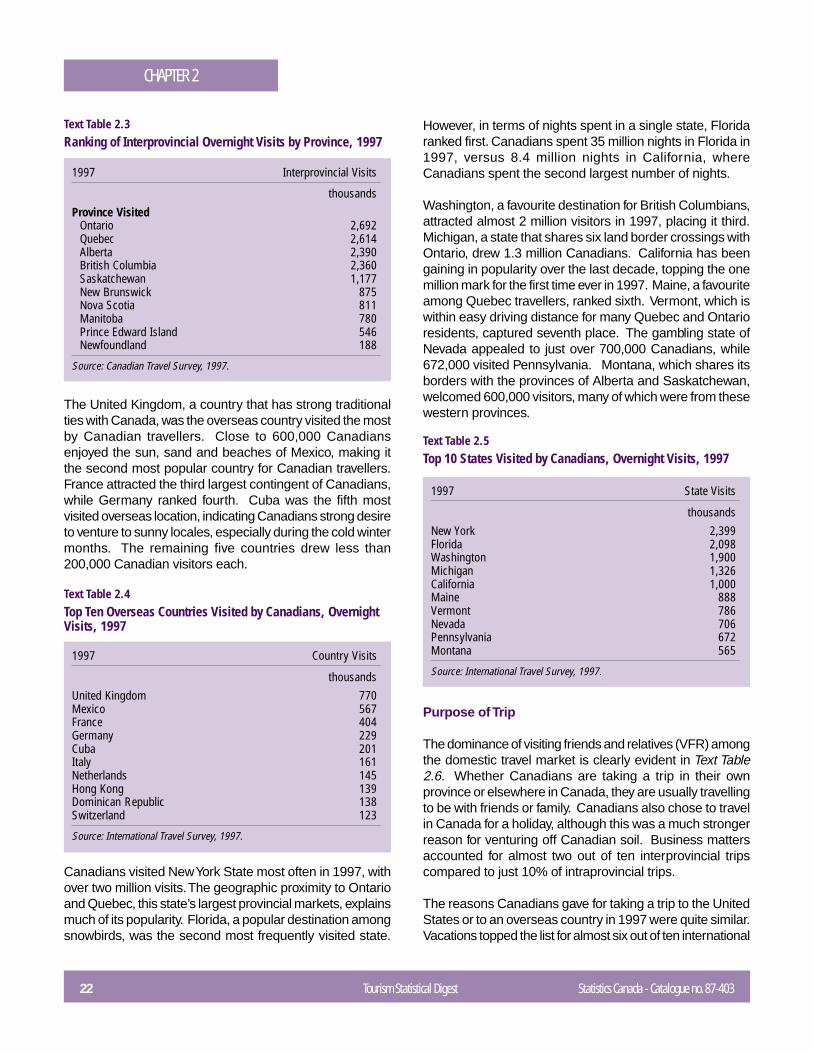
Canadians visited New York State most often in 1997, withover two million visits. The geographic proximity to Ontarioand Quebec, this state’s largest provincial markets, explainsmuch of its popularity. Florida, a popular destination amongsnowbirds, was the second most frequently visited state.
1997 State Visits
thousandsNew York 2,399Florida 2,098Washington 1,900Michigan 1,326California 1,000Maine 888Vermont 786Nevada 706Pennsylvania 672Montana 565
Source: International Travel Survey, 1997.
Text Table 2.5Top 10 States Visited by Canadians, Overnight Visits, 1997
However, in terms of nights spent in a single state, Floridaranked first. Canadians spent 35 million nights in Florida in1997, versus 8.4 million nights in California, whereCanadians spent the second largest number of nights.
Washington, a favourite destination for British Columbians,attracted almost 2 million visitors in 1997, placing it third.Michigan, a state that shares six land border crossings withOntario, drew 1.3 million Canadians. California has beengaining in popularity over the last decade, topping the onemillion mark for the first time ever in 1997. Maine, a favouriteamong Quebec travellers, ranked sixth. Vermont, which iswithin easy driving distance for many Quebec and Ontarioresidents, captured seventh place. The gambling state ofNevada appealed to just over 700,000 Canadians, while672,000 visited Pennsylvania. Montana, which shares itsborders with the provinces of Alberta and Saskatchewan,welcomed 600,000 visitors, many of which were from thesewestern provinces.
Purpose of Trip
The dominance of visiting friends and relatives (VFR) amongthe domestic travel market is clearly evident in Text Table2.6. Whether Canadians are taking a trip in their ownprovince or elsewhere in Canada, they are usually travellingto be with friends or family. Canadians also chose to travelin Canada for a holiday, although this was a much strongerreason for venturing off Canadian soil. Business mattersaccounted for almost two out of ten interprovincial tripscompared to just 10% of intraprovincial trips.
The reasons Canadians gave for taking a trip to the UnitedStates or to an overseas country in 1997 were quite similar.Vacations topped the list for almost six out of ten international
Statistics Canada - Catalogue no. 87-403 Tourism Statistical Digest 23
CHAPTER 2
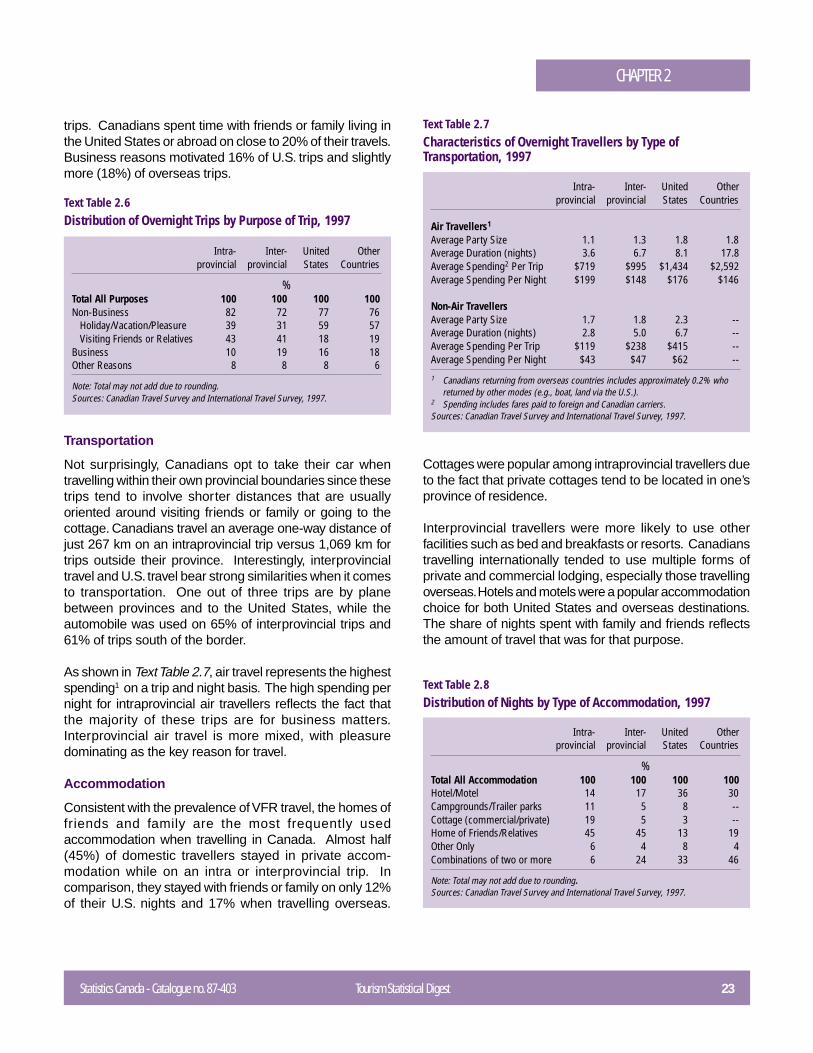
trips. Canadians spent time with friends or family living inthe United States or abroad on close to 20% of their travels.Business reasons motivated 16% of U.S. trips and slightlymore (18%) of overseas trips.
Intra- Inter- United Otherprovincial provincial States Countries
%Total All Purposes 100 100 100 100Non-Business 82 72 77 76
Holiday/Vacation/Pleasure 39 31 59 57Visiting Friends or Relatives 43 41 18 19
Business 10 19 16 18Other Reasons 8 8 8 6
Note: Total may not add due to rounding.Sources: Canadian Travel Survey and International Travel Survey, 1997.
Text Table 2.6Distribution of Overnight Trips by Purpose of Trip, 1997
Transportation
Not surprisingly, Canadians opt to take their car whentravelling within their own provincial boundaries since thesetrips tend to involve shorter distances that are usuallyoriented around visiting friends or family or going to thecottage. Canadians travel an average one-way distance ofjust 267 km on an intraprovincial trip versus 1,069 km fortrips outside their province. Interestingly, interprovincialtravel and U.S. travel bear strong similarities when it comesto transportation. One out of three trips are by planebetween provinces and to the United States, while theautomobile was used on 65% of interprovincial trips and61% of trips south of the border.
As shown in Text Table 2.7, air travel represents the highestspending1 on a trip and night basis. The high spending pernight for intraprovincial air travellers reflects the fact thatthe majority of these trips are for business matters.Interprovincial air travel is more mixed, with pleasuredominating as the key reason for travel.
Accommodation
Consistent with the prevalence of VFR travel, the homes offriends and family are the most frequently usedaccommodation when travelling in Canada. Almost half(45%) of domestic travellers stayed in private accom-modation while on an intra or interprovincial trip. Incomparison, they stayed with friends or family on only 12%of their U.S. nights and 17% when travelling overseas.
Intra- Inter- United Otherprovincial provincial States Countries
Air Travellers1
Average Party Size 1.1 1.3 1.8 1.8Average Duration (nights) 3.6 6.7 8.1 17.8Average Spending2 Per Trip $719 $995 $1,434 $2,592Average Spending Per Night $199 $148 $176 $146
Non-Air TravellersAverage Party Size 1.7 1.8 2.3 --Average Duration (nights) 2.8 5.0 6.7 --Average Spending Per Trip $119 $238 $415 --Average Spending Per Night $43 $47 $62 --
1 Canadians returning from overseas countries includes approximately 0.2% whoreturned by other modes (e.g., boat, land via the U.S.).
2 Spending includes fares paid to foreign and Canadian carriers.Sources: Canadian Travel Survey and International Travel Survey, 1997.
Text Table 2.7Characteristics of Overnight Travellers by Type ofTransportation, 1997
Cottages were popular among intraprovincial travellers dueto the fact that private cottages tend to be located in one’sprovince of residence.
Interprovincial travellers were more likely to use otherfacilities such as bed and breakfasts or resorts. Canadianstravelling internationally tended to use multiple forms ofprivate and commercial lodging, especially those travellingoverseas. Hotels and motels were a popular accommodationchoice for both United States and overseas destinations.The share of nights spent with family and friends reflectsthe amount of travel that was for that purpose.
Intra- Inter- United Otherprovincial provincial States Countries
%Total All Accommodation 100 100 100 100Hotel/Motel 14 17 36 30Campgrounds/Trailer parks 11 5 8 --Cottage (commercial/private) 19 5 3 --Home of Friends/Relatives 45 45 13 19Other Only 6 4 8 4Combinations of two or more 6 24 33 46
Note: Total may not add due to rounding.Sources: Canadian Travel Survey and International Travel Survey, 1997.
Text Table 2.8Distribution of Nights by Type of Accommodation, 1997
24 Tourism Statistical Digest Statistics Canada - Catalogue no. 87-403
CHAPTER 2
Seasonality
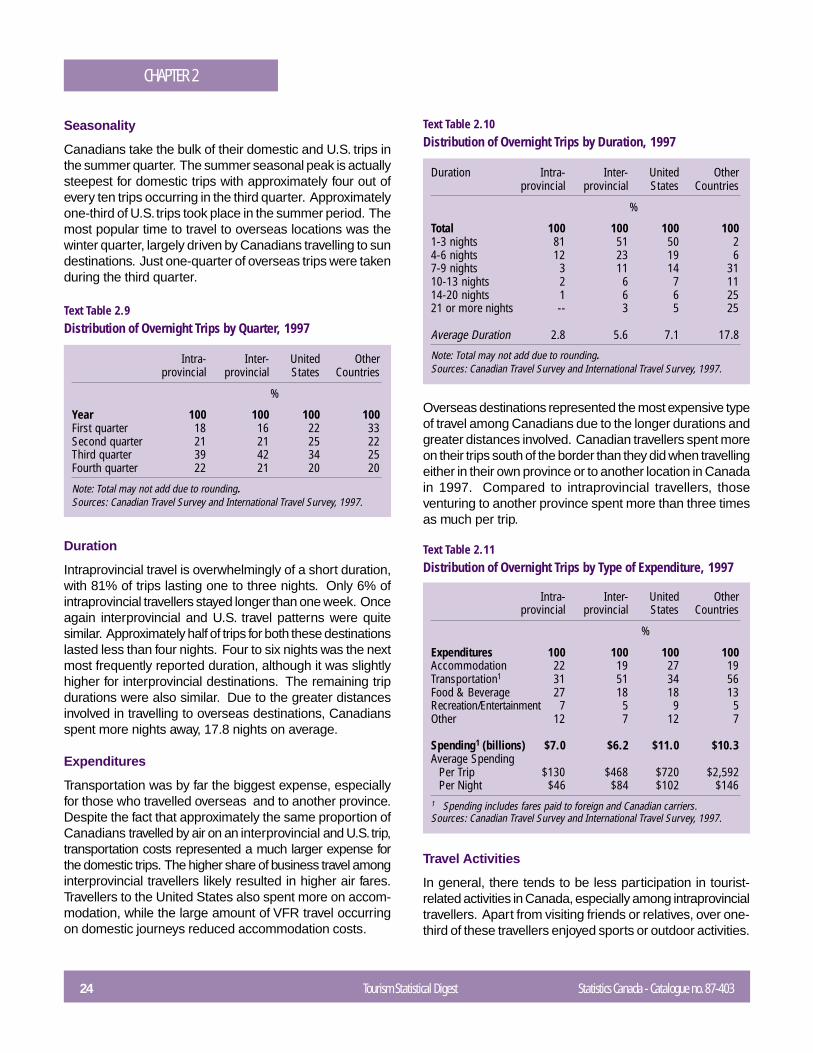
Canadians take the bulk of their domestic and U.S. trips inthe summer quarter. The summer seasonal peak is actuallysteepest for domestic trips with approximately four out ofevery ten trips occurring in the third quarter. Approximatelyone-third of U.S. trips took place in the summer period. Themost popular time to travel to overseas locations was thewinter quarter, largely driven by Canadians travelling to sundestinations. Just one-quarter of overseas trips were takenduring the third quarter.
Intra- Inter- United Otherprovincial provincial States Countries
%
Year 100 100 100 100First quarter 18 16 22 33Second quarter 21 21 25 22Third quarter 39 42 34 25Fourth quarter 22 21 20 20
Note: Total may not add due to rounding.Sources: Canadian Travel Survey and International Travel Survey, 1997.
Text Table 2.9Distribution of Overnight Trips by Quarter, 1997
Duration
Intraprovincial travel is overwhelmingly of a short duration,with 81% of trips lasting one to three nights. Only 6% ofintraprovincial travellers stayed longer than one week. Onceagain interprovincial and U.S. travel patterns were quitesimilar. Approximately half of trips for both these destinationslasted less than four nights. Four to six nights was the nextmost frequently reported duration, although it was slightlyhigher for interprovincial destinations. The remaining tripdurations were also similar. Due to the greater distancesinvolved in travelling to overseas destinations, Canadiansspent more nights away, 17.8 nights on average.
Expenditures
Transportation was by far the biggest expense, especiallyfor those who travelled overseas and to another province.Despite the fact that approximately the same proportion ofCanadians travelled by air on an interprovincial and U.S. trip,transportation costs represented a much larger expense forthe domestic trips. The higher share of business travel amonginterprovincial travellers likely resulted in higher air fares.Travellers to the United States also spent more on accom-modation, while the large amount of VFR travel occurringon domestic journeys reduced accommodation costs.
Duration Intra- Inter- United Otherprovincial provincial States Countries
%
Total 100 100 100 1001-3 nights 81 51 50 24-6 nights 12 23 19 67-9 nights 3 11 14 3110-13 nights 2 6 7 1114-20 nights 1 6 6 2521 or more nights -- 3 5 25
Average Duration 2.8 5.6 7.1 17.8
Note: Total may not add due to rounding.Sources: Canadian Travel Survey and International Travel Survey, 1997.
Text Table 2.10Distribution of Overnight Trips by Duration, 1997
Overseas destinations represented the most expensive typeof travel among Canadians due to the longer durations andgreater distances involved. Canadian travellers spent moreon their trips south of the border than they did when travellingeither in their own province or to another location in Canadain 1997. Compared to intraprovincial travellers, thoseventuring to another province spent more than three timesas much per trip.
Intra- Inter- United Otherprovincial provincial States Countries
%
Expenditures 100 100 100 100Accommodation 22 19 27 19Transportation1 31 51 34 56Food & Beverage 27 18 18 13Recreation/Entertainment 7 5 9 5Other 12 7 12 7
Spending1 (billions) $7.0 $6.2 $11.0 $10.3Average Spending
Per Trip $130 $468 $720 $2,592Per Night $46 $84 $102 $146
1 Spending includes fares paid to foreign and Canadian carriers.Sources: Canadian Travel Survey and International Travel Survey, 1997.
Text Table 2.11Distribution of Overnight Trips by Type of Expenditure, 1997
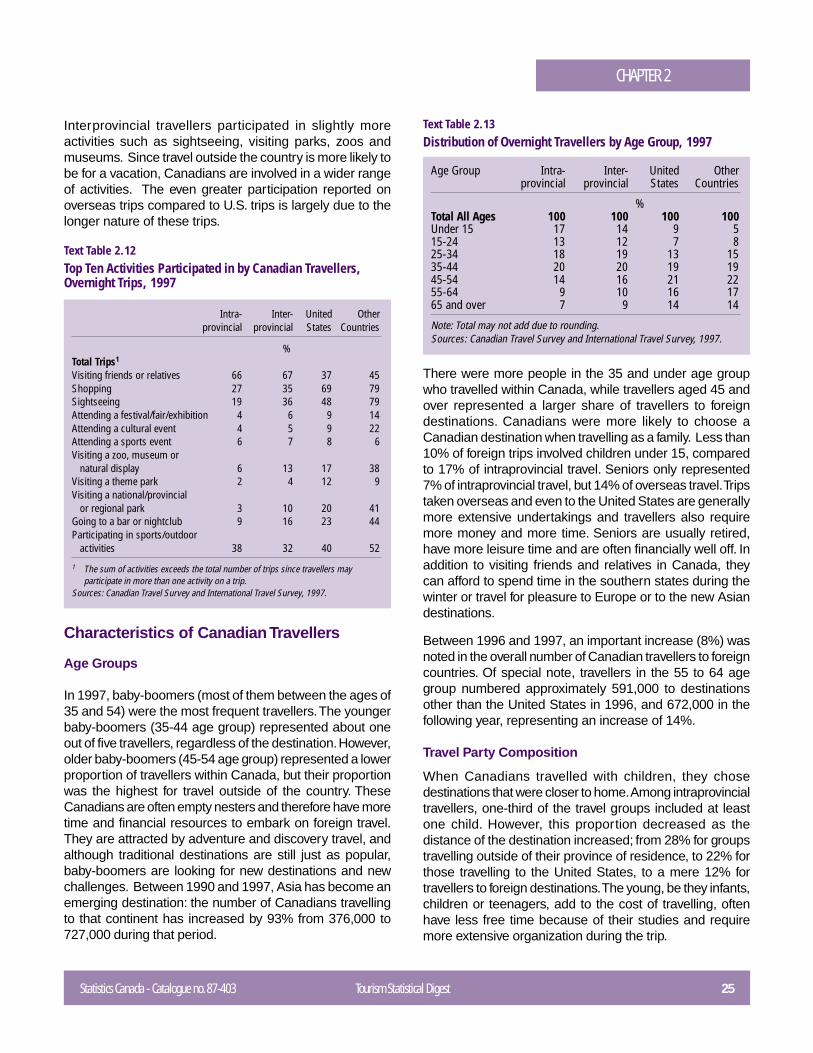
Travel Activities
In general, there tends to be less participation in tourist-related activities in Canada, especially among intraprovincialtravellers. Apart from visiting friends or relatives, over one-third of these travellers enjoyed sports or outdoor activities.
Statistics Canada - Catalogue no. 87-403 Tourism Statistical Digest 25
CHAPTER 2
Interprovincial travellers participated in slightly moreactivities such as sightseeing, visiting parks, zoos andmuseums. Since travel outside the country is more likely tobe for a vacation, Canadians are involved in a wider rangeof activities. The even greater participation reported onoverseas trips compared to U.S. trips is largely due to thelonger nature of these trips.
Intra- Inter- United Otherprovincial provincial States Countries
%Total Trips1
Visiting friends or relatives 66 67 37 45Shopping 27 35 69 79Sightseeing 19 36 48 79Attending a festival/fair/exhibition 4 6 9 14Attending a cultural event 4 5 9 22Attending a sports event 6 7 8 6Visiting a zoo, museum or
natural display 6 13 17 38Visiting a theme park 2 4 12 9Visiting a national/provincial
or regional park 3 10 20 41Going to a bar or nightclub 9 16 23 44Participating in sports/outdoor
activities 38 32 40 52
1 The sum of activities exceeds the total number of trips since travellers mayparticipate in more than one activity on a trip.
Sources: Canadian Travel Survey and International Travel Survey, 1997.
Text Table 2.12Top Ten Activities Participated in by Canadian Travellers,Overnight Trips, 1997
Characteristics of Canadian Travellers
Age Groups
In 1997, baby-boomers (most of them between the ages of35 and 54) were the most frequent travellers. The youngerbaby-boomers (35-44 age group) represented about oneout of five travellers, regardless of the destination. However,older baby-boomers (45-54 age group) represented a lowerproportion of travellers within Canada, but their proportionwas the highest for travel outside of the country. TheseCanadians are often empty nesters and therefore have moretime and financial resources to embark on foreign travel.They are attracted by adventure and discovery travel, andalthough traditional destinations are still just as popular,baby-boomers are looking for new destinations and newchallenges. Between 1990 and 1997, Asia has become anemerging destination: the number of Canadians travellingto that continent has increased by 93% from 376,000 to727,000 during that period.
Age Group Intra- Inter- United Otherprovincial provincial States Countries
%Total All Ages 100 100 100 100Under 15 17 14 9 515-24 13 12 7 825-34 18 19 13 1535-44 20 20 19 1945-54 14 16 21 2255-64 9 10 16 1765 and over 7 9 14 14
Note: Total may not add due to rounding.Sources: Canadian Travel Survey and International Travel Survey, 1997.
Text Table 2.13Distribution of Overnight Travellers by Age Group, 1997
There were more people in the 35 and under age groupwho travelled within Canada, while travellers aged 45 andover represented a larger share of travellers to foreigndestinations. Canadians were more likely to choose aCanadian destination when travelling as a family. Less than10% of foreign trips involved children under 15, comparedto 17% of intraprovincial travel. Seniors only represented7% of intraprovincial travel, but 14% of overseas travel. Tripstaken overseas and even to the United States are generallymore extensive undertakings and travellers also requiremore money and more time. Seniors are usually retired,have more leisure time and are often financially well off. Inaddition to visiting friends and relatives in Canada, theycan afford to spend time in the southern states during thewinter or travel for pleasure to Europe or to the new Asiandestinations.
Between 1996 and 1997, an important increase (8%) wasnoted in the overall number of Canadian travellers to foreigncountries. Of special note, travellers in the 55 to 64 agegroup numbered approximately 591,000 to destinationsother than the United States in 1996, and 672,000 in thefollowing year, representing an increase of 14%.
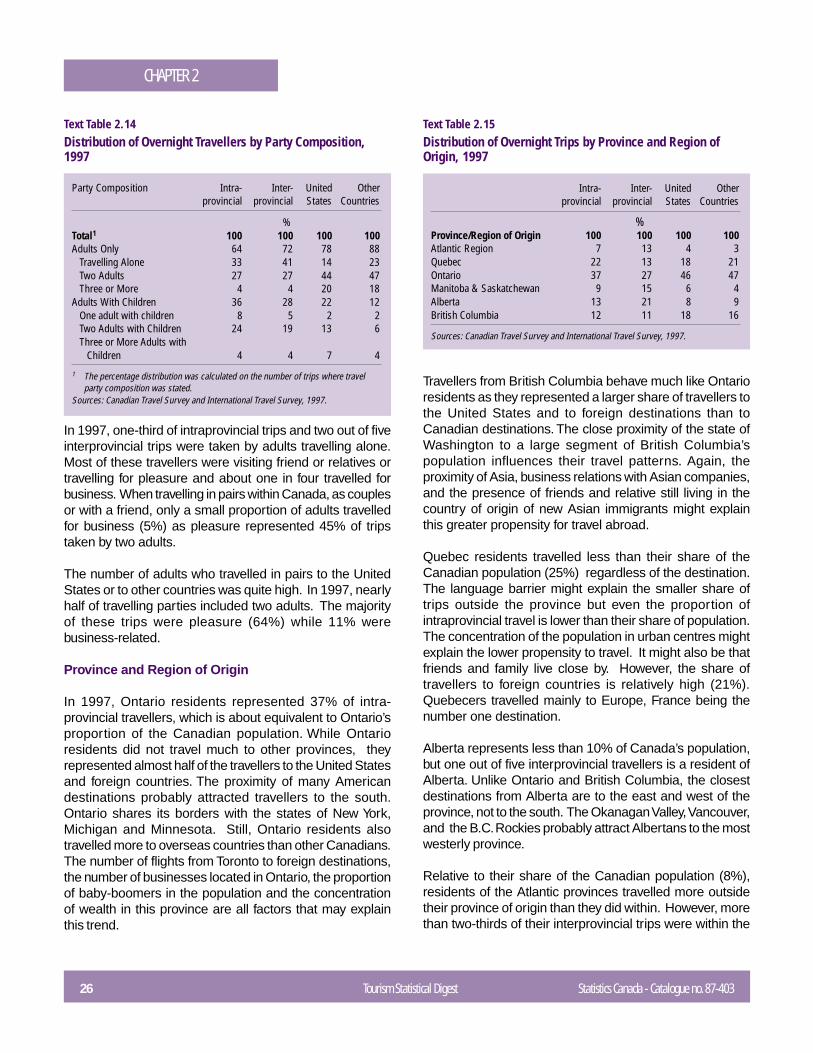
Travel Party Composition
When Canadians travelled with children, they chosedestinations that were closer to home. Among intraprovincialtravellers, one-third of the travel groups included at leastone child. However, this proportion decreased as thedistance of the destination increased; from 28% for groupstravelling outside of their province of residence, to 22% forthose travelling to the United States, to a mere 12% fortravellers to foreign destinations. The young, be they infants,children or teenagers, add to the cost of travelling, oftenhave less free time because of their studies and requiremore extensive organization during the trip.
26 Tourism Statistical Digest Statistics Canada - Catalogue no. 87-403
CHAPTER 2
Party Composition Intra- Inter- United Otherprovincial provincial States Countries
%Total1 100 100 100 100Adults Only 64 72 78 88
Travelling Alone 33 41 14 23Two Adults 27 27 44 47Three or More 4 4 20 18
Adults With Children 36 28 22 12One adult with children 8 5 2 2Two Adults with Children 24 19 13 6Three or More Adults with
Children 4 4 7 4
1 The percentage distribution was calculated on the number of trips where travelparty composition was stated.
Sources: Canadian Travel Survey and International Travel Survey, 1997.
Text Table 2.14Distribution of Overnight Travellers by Party Composition,1997
In 1997, one-third of intraprovincial trips and two out of fiveinterprovincial trips were taken by adults travelling alone.Most of these travellers were visiting friend or relatives ortravelling for pleasure and about one in four travelled forbusiness. When travelling in pairs within Canada, as couplesor with a friend, only a small proportion of adults travelledfor business (5%) as pleasure represented 45% of tripstaken by two adults.
The number of adults who travelled in pairs to the UnitedStates or to other countries was quite high. In 1997, nearlyhalf of travelling parties included two adults. The majorityof these trips were pleasure (64%) while 11% werebusiness-related.
Province and Region of Origin
In 1997, Ontario residents represented 37% of intra-provincial travellers, which is about equivalent to Ontario’sproportion of the Canadian population. While Ontarioresidents did not travel much to other provinces, theyrepresented almost half of the travellers to the United Statesand foreign countries. The proximity of many Americandestinations probably attracted travellers to the south.Ontario shares its borders with the states of New York,Michigan and Minnesota. Still, Ontario residents alsotravelled more to overseas countries than other Canadians.The number of flights from Toronto to foreign destinations,the number of businesses located in Ontario, the proportionof baby-boomers in the population and the concentrationof wealth in this province are all factors that may explainthis trend.
Intra- Inter- United Otherprovincial provincial States Countries
%Province/Region of Origin 100 100 100 100Atlantic Region 7 13 4 3Quebec 22 13 18 21Ontario 37 27 46 47Manitoba & Saskatchewan 9 15 6 4Alberta 13 21 8 9British Columbia 12 11 18 16
Sources: Canadian Travel Survey and International Travel Survey, 1997.
Text Table 2.15Distribution of Overnight Trips by Province and Region ofOrigin, 1997
Travellers from British Columbia behave much like Ontarioresidents as they represented a larger share of travellers tothe United States and to foreign destinations than toCanadian destinations. The close proximity of the state ofWashington to a large segment of British Columbia’spopulation influences their travel patterns. Again, theproximity of Asia, business relations with Asian companies,and the presence of friends and relative still living in thecountry of origin of new Asian immigrants might explainthis greater propensity for travel abroad.
Quebec residents travelled less than their share of theCanadian population (25%) regardless of the destination.The language barrier might explain the smaller share oftrips outside the province but even the proportion ofintraprovincial travel is lower than their share of population.The concentration of the population in urban centres mightexplain the lower propensity to travel. It might also be thatfriends and family live close by. However, the share oftravellers to foreign countries is relatively high (21%).Quebecers travelled mainly to Europe, France being thenumber one destination.
Alberta represents less than 10% of Canada’s population,but one out of five interprovincial travellers is a resident ofAlberta. Unlike Ontario and British Columbia, the closestdestinations from Alberta are to the east and west of theprovince, not to the south. The Okanagan Valley, Vancouver,and the B.C. Rockies probably attract Albertans to the mostwesterly province.
Relative to their share of the Canadian population (8%),residents of the Atlantic provinces travelled more outsidetheir province of origin than they did within. However, morethan two-thirds of their interprovincial trips were within the
Statistics Canada - Catalogue no. 87-403 Tourism Statistical Digest 27
CHAPTER 2
Atlantic region. Aside from New Brunswick, which sharesa border with the state of Maine, Atlantic Canadians liverelatively far from the United States.
There was a particularly sharp increase in the number oftrips made abroad by residents of Alberta, Manitoba andSaskatchewan between 1996 and 1997. The number oftravellers from Alberta to foreign countries increased by24% over these two years. For residents of Manitoba andSaskatchewan, the increase was 16%.
Conclusion
Canadians like to travel. They took almost 85 millionovernight trips in 1997. They travelled within their provinces,to other provinces, and to foreign destinations. Purpose,mode of transportation, duration and accommodation variedaccording to the destination. When they went to a Canadiandestination, Canadians travelled mostly to visit friends andfamily using their car. Pleasure was the main purpose andthey chose commercial accommodations when thedestination was foreign.
The baby-boomer generation took the most trips in 1997.The front-end boomers have paid off their houses, theirkids are starting to leave home and they are at the peak oftheir earning power2 . As they become older and retire atthe rate of 500,000 each year for the next twenty years,they will dominate the tourism industry3 . In fact, they willlook for more adventurous and unusual types of destinations.The cruise industry and the eco-tourism industry willprobably profit from these new types of travellers.
Notes
1 Spending includes fares paid to foreign and Canadian carriers.
2 Foot, David K., Boom, Bust & Echo, Toronto, 1996, p. 121.
3 Canadian Tourism Commission, Canadian Domestic TravelStrategic Marketing Plan for 1999/2000, 1998.
CHAPTER 3INTERNATIONAL TRAVEL TO CANADA
28 Tourism Statistical Digest Statistics Canada - Catalogue no. 87-403
Canada hosted over 45 million international visitors in 1997, the highestannual level in the 25 years that travel data have been collected. The majority,about 40.5 million came from the United States, up 5% from 1996. Theincrease in the American market helped offset a 4% decline in overseastrips to Canada, which fell to 4.6 million trips in 1997. The reduced outboundtravel by residents of Asian countries, which was largely due to the Asianfinancial crisis, contributed to slower growth in 1997. Even Canada’straditional European markets were relatively stagnant in 1997.
Canada received 27.4 million same-day visitors, establishing a new high forexcursion or same-day trips to Canada. Americans accounted forapproximately 27 million of these trips, up 6% compared to the previousyear. American same-day trips dropped from 22.8 million trips in 1990 to20.6 million in 1993, largely due to fluctuating exchange rates but continuedon an upward trend from 1994 to 1997. Overseas residents made 352,000same-day excursions to Canada via the United States in 1997, 14% fewerthan in 1997.
About 17.6 million visitors stayed at least one night on their trip to Canada in1997, setting a new record level for overnight trips (Text Table 3.1). Visitationstalled in the early 1990s due to the Gulf War and the worldwide recession,but climbed steadily from 1993 onwards. Throughout the 1993 to 1996 period,Canada enjoyed double-digit gains in overseas travel and more moderategains from the United States. Growth slowed in 1996 due to a slight downturnin American visitation (-1%). The reverse situation occurred in 1997, whereincreased American travel offset a decline in the overseas market. The dipin overseas visitation in 1997 was the first decline since 1991.
United States Travel to Canada
The year 1997 was a record-setting year for Canada’s largest tourism market.American same-day and overnight trips to Canada surpassed the 40 millionmark for the first time ever in the history of the International Travel Survey(ITS)1 . Americans took over 27 million same-day excursions to Canada in1997, 6% more than in 1996. This brought the number of same-day tripsback to levels not seen since the early 1980s (Figure 3.1).
Laurie McDougall,Tourism Statistics Program
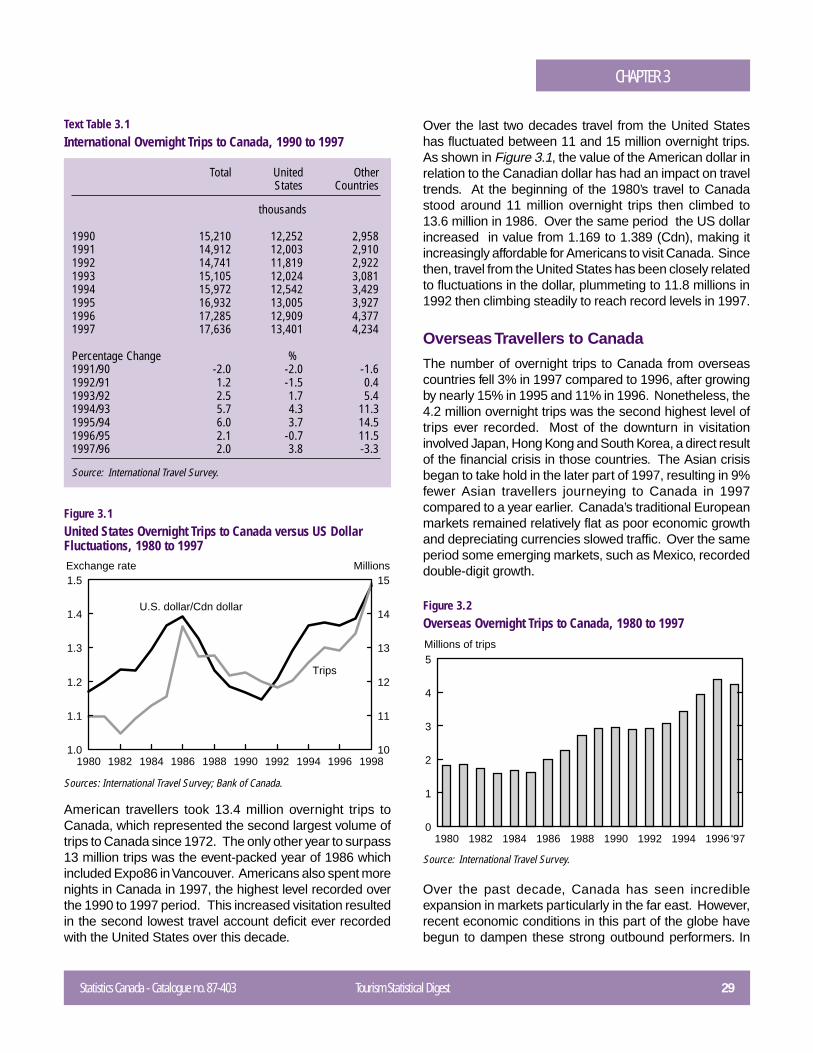
Statistics Canada - Catalogue no. 87-403 Tourism Statistical Digest 29
CHAPTER 3
Total United OtherStates Countries
thousands
1990 15,210 12,252 2,9581991 14,912 12,003 2,9101992 14,741 11,819 2,9221993 15,105 12,024 3,0811994 15,972 12,542 3,4291995 16,932 13,005 3,9271996 17,285 12,909 4,3771997 17,636 13,401 4,234
Percentage Change %1991/90 -2.0 -2.0 -1.61992/91 1.2 -1.5 0.41993/92 2.5 1.7 5.41994/93 5.7 4.3 11.31995/94 6.0 3.7 14.51996/95 2.1 -0.7 11.51997/96 2.0 3.8 -3.3
Source: International Travel Survey.
Text Table 3.1International Overnight Trips to Canada, 1990 to 1997
American travellers took 13.4 million overnight trips toCanada, which represented the second largest volume oftrips to Canada since 1972. The only other year to surpass13 million trips was the event-packed year of 1986 whichincluded Expo86 in Vancouver. Americans also spent morenights in Canada in 1997, the highest level recorded overthe 1990 to 1997 period. This increased visitation resultedin the second lowest travel account deficit ever recordedwith the United States over this decade.
Figure 3.1United States Overnight Trips to Canada versus US DollarFluctuations, 1980 to 1997
Over the last two decades travel from the United Stateshas fluctuated between 11 and 15 million overnight trips.As shown in Figure 3.1, the value of the American dollar inrelation to the Canadian dollar has had an impact on traveltrends. At the beginning of the 1980’s travel to Canadastood around 11 million overnight trips then climbed to13.6 million in 1986. Over the same period the US dollarincreased in value from 1.169 to 1.389 (Cdn), making itincreasingly affordable for Americans to visit Canada. Sincethen, travel from the United States has been closely relatedto fluctuations in the dollar, plummeting to 11.8 millions in1992 then climbing steadily to reach record levels in 1997.
Overseas Travellers to Canada
The number of overnight trips to Canada from overseascountries fell 3% in 1997 compared to 1996, after growingby nearly 15% in 1995 and 11% in 1996. Nonetheless, the4.2 million overnight trips was the second highest level oftrips ever recorded. Most of the downturn in visitationinvolved Japan, Hong Kong and South Korea, a direct resultof the financial crisis in those countries. The Asian crisisbegan to take hold in the later part of 1997, resulting in 9%fewer Asian travellers journeying to Canada in 1997compared to a year earlier. Canada’s traditional Europeanmarkets remained relatively flat as poor economic growthand depreciating currencies slowed traffic. Over the sameperiod some emerging markets, such as Mexico, recordeddouble-digit growth.
Figure 3.2Overseas Overnight Trips to Canada, 1980 to 1997
Over the past decade, Canada has seen incredibleexpansion in markets particularly in the far east. However,recent economic conditions in this part of the globe havebegun to dampen these strong outbound performers. In
Sources: International Travel Survey; Bank of Canada.
Source: International Travel Survey.
1980 1982 1984 1986 1988 1990 1992 1994 1996 19981.0
1.1
1.2
1.3
1.4
1.5
10
11
12
13
14
15Exchange rate Millions
U.S. dollar/Cdn dollar
Trips
1980 1982 1984 1986 1988 1990 1992 1994 19960
1
2
3
4
5Millions of trips
'97
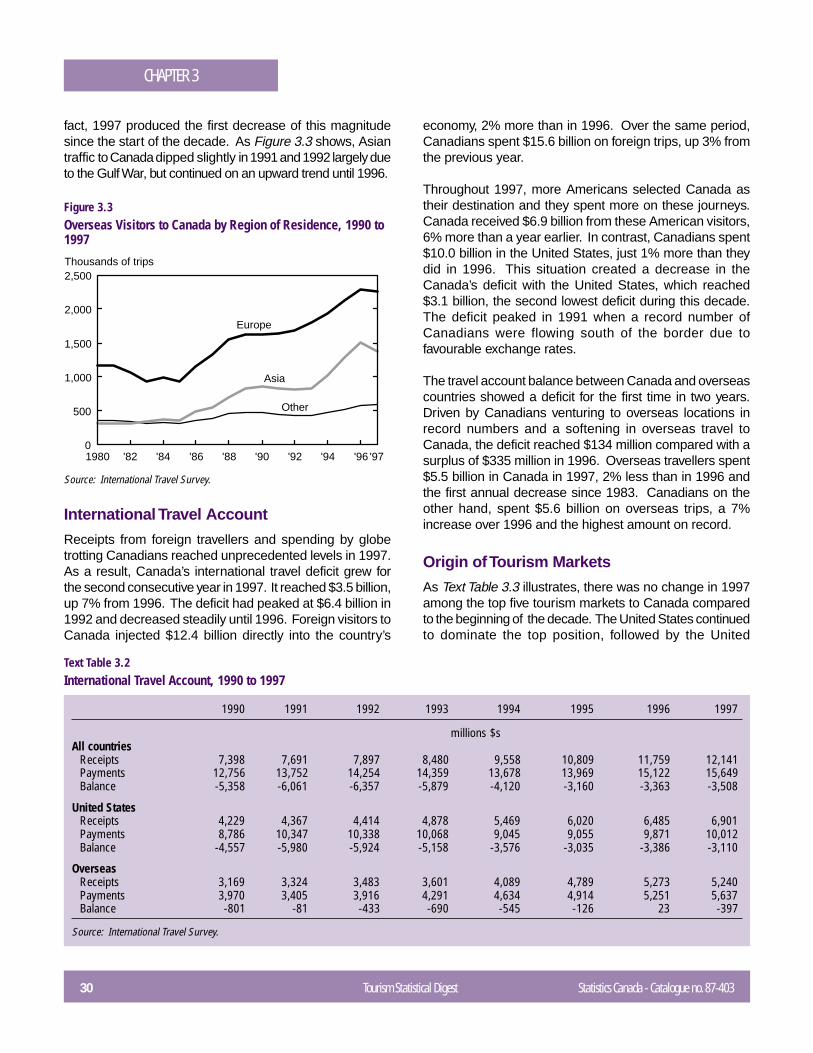
30 Tourism Statistical Digest Statistics Canada - Catalogue no. 87-403
CHAPTER 3
fact, 1997 produced the first decrease of this magnitudesince the start of the decade. As Figure 3.3 shows, Asiantraffic to Canada dipped slightly in 1991 and 1992 largely dueto the Gulf War, but continued on an upward trend until 1996.
International Travel Account
Receipts from foreign travellers and spending by globetrotting Canadians reached unprecedented levels in 1997.As a result, Canada’s international travel deficit grew forthe second consecutive year in 1997. It reached $3.5 billion,up 7% from 1996. The deficit had peaked at $6.4 billion in1992 and decreased steadily until 1996. Foreign visitors toCanada injected $12.4 billion directly into the country’s
Figure 3.3Overseas Visitors to Canada by Region of Residence, 1990 to1997
economy, 2% more than in 1996. Over the same period,Canadians spent $15.6 billion on foreign trips, up 3% fromthe previous year.
Throughout 1997, more Americans selected Canada astheir destination and they spent more on these journeys.Canada received $6.9 billion from these American visitors,6% more than a year earlier. In contrast, Canadians spent$10.0 billion in the United States, just 1% more than theydid in 1996. This situation created a decrease in theCanada’s deficit with the United States, which reached$3.1 billion, the second lowest deficit during this decade.The deficit peaked in 1991 when a record number ofCanadians were flowing south of the border due tofavourable exchange rates.
The travel account balance between Canada and overseascountries showed a deficit for the first time in two years.Driven by Canadians venturing to overseas locations inrecord numbers and a softening in overseas travel toCanada, the deficit reached $134 million compared with asurplus of $335 million in 1996. Overseas travellers spent$5.5 billion in Canada in 1997, 2% less than in 1996 andthe first annual decrease since 1983. Canadians on theother hand, spent $5.6 billion on overseas trips, a 7%increase over 1996 and the highest amount on record.
Origin of Tourism Markets
As Text Table 3.3 illustrates, there was no change in 1997among the top five tourism markets to Canada comparedto the beginning of the decade. The United States continuedto dominate the top position, followed by the United
1990 1991 1992 1993 1994 1995 1996 1997
millions $sAll countries
Receipts 7,398 7,691 7,897 8,480 9,558 10,809 11,759 12,141Payments 12,756 13,752 14,254 14,359 13,678 13,969 15,122 15,649Balance -5,358 -6,061 -6,357 -5,879 -4,120 -3,160 -3,363 -3,508
United StatesReceipts 4,229 4,367 4,414 4,878 5,469 6,020 6,485 6,901Payments 8,786 10,347 10,338 10,068 9,045 9,055 9,871 10,012Balance -4,557 -5,980 -5,924 -5,158 -3,576 -3,035 -3,386 -3,110
OverseasReceipts 3,169 3,324 3,483 3,601 4,089 4,789 5,273 5,240Payments 3,970 3,405 3,916 4,291 4,634 4,914 5,251 5,637Balance -801 -81 -433 -690 -545 -126 23 -397
Source: International Travel Survey.
Text Table 3.2International Travel Account, 1990 to 1997
Source: International Travel Survey.
1980 '82 '84 '86 '88 '90 '92 '94 '960
500
1,000
1,500
2,000
2,500Thousands of trips
Europe
Asia
Other
'97
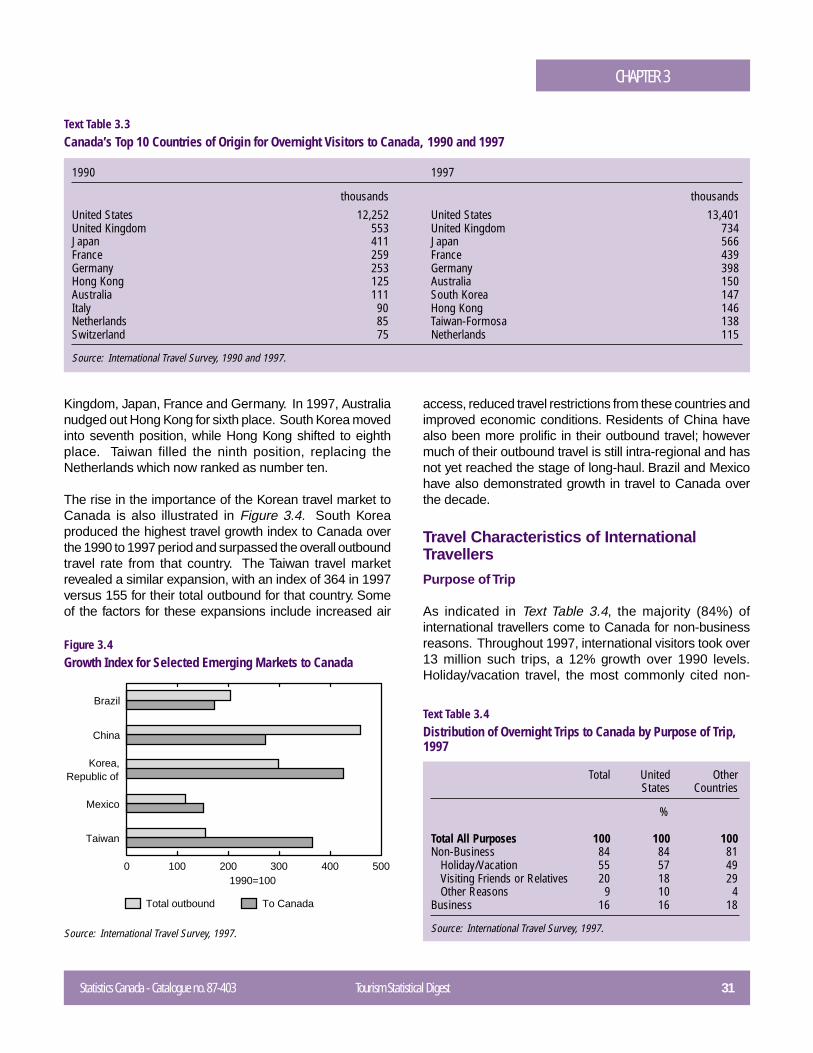
Statistics Canada - Catalogue no. 87-403 Tourism Statistical Digest 31
CHAPTER 3
1990 1997
thousands thousandsUnited States 12,252 United States 13,401United Kingdom 553 United Kingdom 734Japan 411 Japan 566France 259 France 439Germany 253 Germany 398Hong Kong 125 Australia 150Australia 111 South Korea 147Italy 90 Hong Kong 146Netherlands 85 Taiwan-Formosa 138Switzerland 75 Netherlands 115
Source: International Travel Survey, 1990 and 1997.
Text Table 3.3Canada’s Top 10 Countries of Origin for Overnight Visitors to Canada, 1990 and 1997
Kingdom, Japan, France and Germany. In 1997, Australianudged out Hong Kong for sixth place. South Korea movedinto seventh position, while Hong Kong shifted to eighthplace. Taiwan filled the ninth position, replacing theNetherlands which now ranked as number ten.
The rise in the importance of the Korean travel market toCanada is also illustrated in Figure 3.4. South Koreaproduced the highest travel growth index to Canada overthe 1990 to 1997 period and surpassed the overall outboundtravel rate from that country. The Taiwan travel marketrevealed a similar expansion, with an index of 364 in 1997versus 155 for their total outbound for that country. Someof the factors for these expansions include increased air
Figure 3.4Growth Index for Selected Emerging Markets to Canada
access, reduced travel restrictions from these countries andimproved economic conditions. Residents of China havealso been more prolific in their outbound travel; howevermuch of their outbound travel is still intra-regional and hasnot yet reached the stage of long-haul. Brazil and Mexicohave also demonstrated growth in travel to Canada overthe decade.
Travel Characteristics of InternationalTravellers
Purpose of Trip
As indicated in Text Table 3.4, the majority (84%) ofinternational travellers come to Canada for non-businessreasons. Throughout 1997, international visitors took over13 million such trips, a 12% growth over 1990 levels.Holiday/vacation travel, the most commonly cited non-
Brazil
China
Korea,Republic of
Mexico
Taiwan
0 100 200 300 400 5001990=100
Total outbound To Canada
Total United OtherStates Countries
%
Total All Purposes 100 100 100Non-Business 84 84 81
Holiday/Vacation 55 57 49Visiting Friends or Relatives 20 18 29Other Reasons 9 10 4
Business 16 16 18
Source: International Travel Survey, 1997.
Text Table 3.4Distribution of Overnight Trips to Canada by Purpose of Trip,1997
Source: International Travel Survey, 1997.
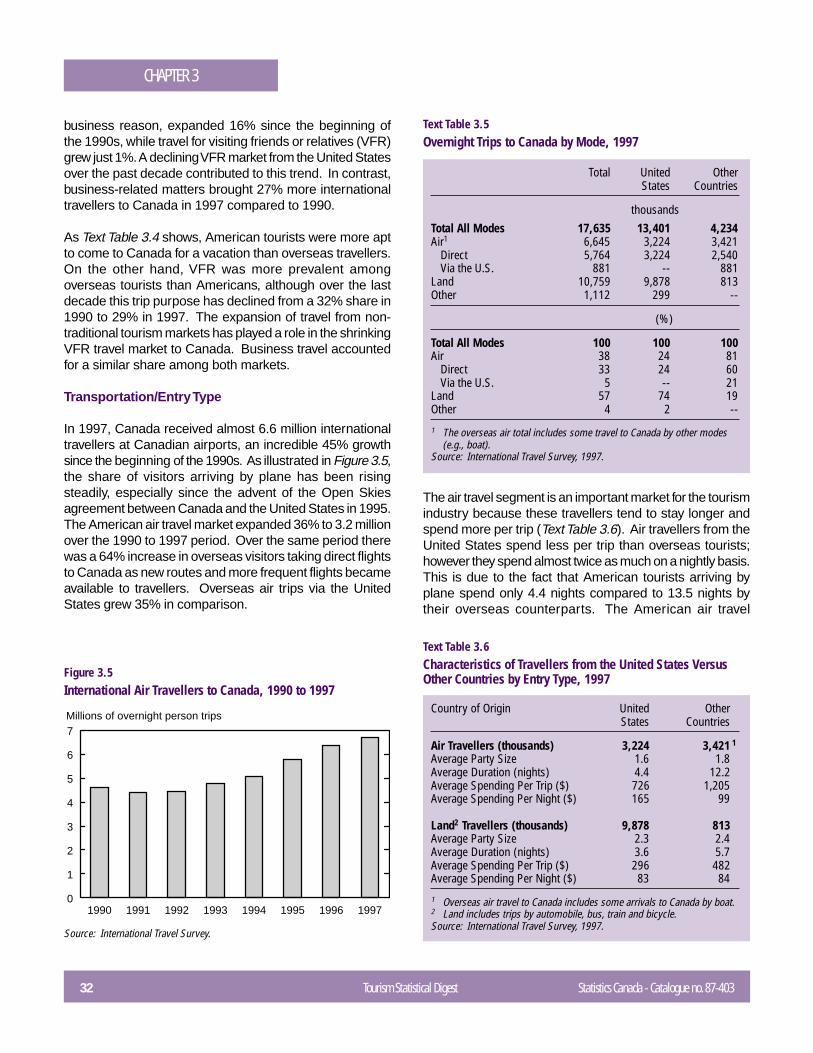
32 Tourism Statistical Digest Statistics Canada - Catalogue no. 87-403
CHAPTER 3
business reason, expanded 16% since the beginning ofthe 1990s, while travel for visiting friends or relatives (VFR)grew just 1%. A declining VFR market from the United Statesover the past decade contributed to this trend. In contrast,business-related matters brought 27% more internationaltravellers to Canada in 1997 compared to 1990.
As Text Table 3.4 shows, American tourists were more aptto come to Canada for a vacation than overseas travellers.On the other hand, VFR was more prevalent amongoverseas tourists than Americans, although over the lastdecade this trip purpose has declined from a 32% share in1990 to 29% in 1997. The expansion of travel from non-traditional tourism markets has played a role in the shrinkingVFR travel market to Canada. Business travel accountedfor a similar share among both markets.
Transportation/Entry Type
In 1997, Canada received almost 6.6 million internationaltravellers at Canadian airports, an incredible 45% growthsince the beginning of the 1990s. As illustrated in Figure 3.5,the share of visitors arriving by plane has been risingsteadily, especially since the advent of the Open Skiesagreement between Canada and the United States in 1995.The American air travel market expanded 36% to 3.2 millionover the 1990 to 1997 period. Over the same period therewas a 64% increase in overseas visitors taking direct flightsto Canada as new routes and more frequent flights becameavailable to travellers. Overseas air trips via the UnitedStates grew 35% in comparison.
Figure 3.5International Air Travellers to Canada, 1990 to 1997
Total United OtherStates Countries
thousandsTotal All Modes 17,635 13,401 4,234Air1 6,645 3,224 3,421
Direct 5,764 3,224 2,540Via the U.S. 881 -- 881
Land 10,759 9,878 813Other 1,112 299 --
(%)
Total All Modes 100 100 100Air 38 24 81
Direct 33 24 60Via the U.S. 5 -- 21
Land 57 74 19Other 4 2 --
1 The overseas air total includes some travel to Canada by other modes(e.g., boat).
Source: International Travel Survey, 1997.
Text Table 3.5Overnight Trips to Canada by Mode, 1997
The air travel segment is an important market for the tourismindustry because these travellers tend to stay longer andspend more per trip (Text Table 3.6). Air travellers from theUnited States spend less per trip than overseas tourists;however they spend almost twice as much on a nightly basis.This is due to the fact that American tourists arriving byplane spend only 4.4 nights compared to 13.5 nights bytheir overseas counterparts. The American air travel
Country of Origin United OtherStates Countries
Air Travellers (thousands) 3,224 3,421 1
Average Party Size 1.6 1.8Average Duration (nights) 4.4 12.2Average Spending Per Trip ($) 726 1,205Average Spending Per Night ($) 165 99
Land2 Travellers (thousands) 9,878 813Average Party Size 2.3 2.4Average Duration (nights) 3.6 5.7Average Spending Per Trip ($) 296 482Average Spending Per Night ($) 83 84
1 Overseas air travel to Canada includes some arrivals to Canada by boat.2 Land includes trips by automobile, bus, train and bicycle.Source: International Travel Survey, 1997.
Text Table 3.6Characteristics of Travellers from the United States VersusOther Countries by Entry Type, 1997
Source: International Travel Survey.
1990 1991 1992 1993 1994 1995 1996 19970
1
2
3
4
5
6
7Millions of overnight person trips
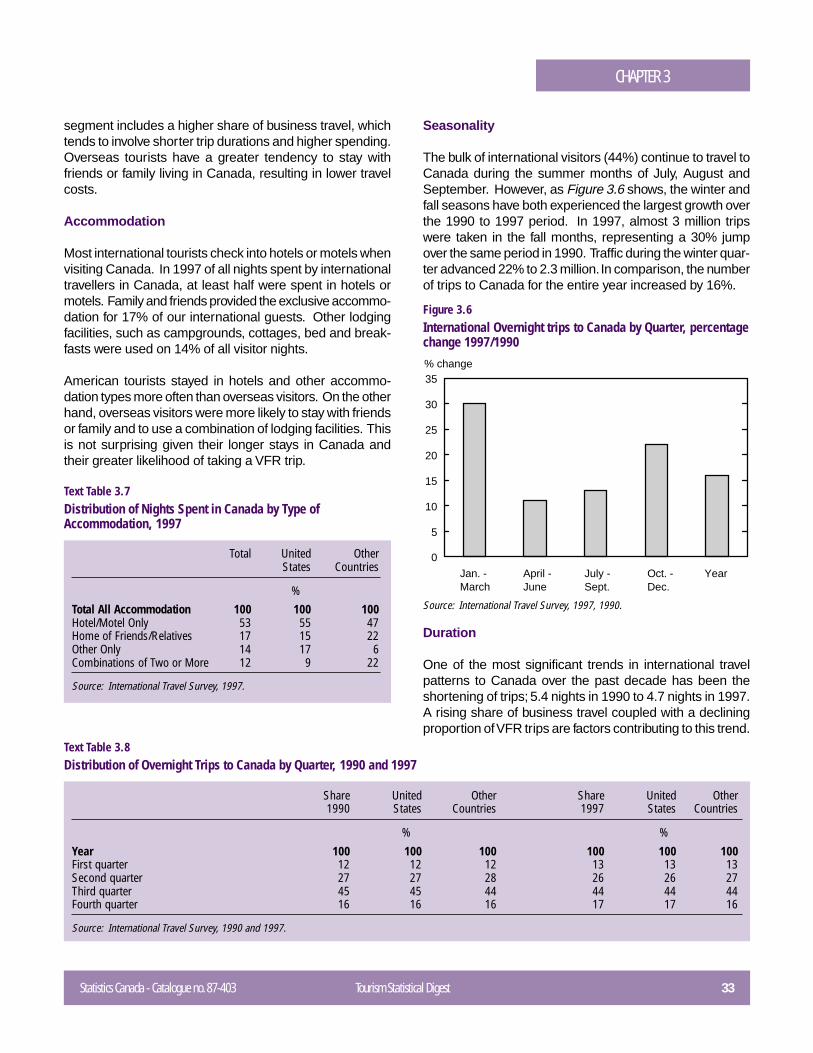
Statistics Canada - Catalogue no. 87-403 Tourism Statistical Digest 33
CHAPTER 3
segment includes a higher share of business travel, whichtends to involve shorter trip durations and higher spending.Overseas tourists have a greater tendency to stay withfriends or family living in Canada, resulting in lower travelcosts.
Accommodation
Most international tourists check into hotels or motels whenvisiting Canada. In 1997 of all nights spent by internationaltravellers in Canada, at least half were spent in hotels ormotels. Family and friends provided the exclusive accommo-dation for 17% of our international guests. Other lodgingfacilities, such as campgrounds, cottages, bed and break-fasts were used on 14% of all visitor nights.
American tourists stayed in hotels and other accommo-dation types more often than overseas visitors. On the otherhand, overseas visitors were more likely to stay with friendsor family and to use a combination of lodging facilities. Thisis not surprising given their longer stays in Canada andtheir greater likelihood of taking a VFR trip.
Total United OtherStates Countries
%Total All Accommodation 100 100 100Hotel/Motel Only 53 55 47Home of Friends/Relatives 17 15 22Other Only 14 17 6Combinations of Two or More 12 9 22
Source: International Travel Survey, 1997.
Text Table 3.7Distribution of Nights Spent in Canada by Type ofAccommodation, 1997
Figure 3.6International Overnight trips to Canada by Quarter, percentagechange 1997/1990
Seasonality
The bulk of international visitors (44%) continue to travel toCanada during the summer months of July, August andSeptember. However, as Figure 3.6 shows, the winter andfall seasons have both experienced the largest growth overthe 1990 to 1997 period. In 1997, almost 3 million tripswere taken in the fall months, representing a 30% jumpover the same period in 1990. Traffic during the winter quar-ter advanced 22% to 2.3 million. In comparison, the numberof trips to Canada for the entire year increased by 16%.
Share United Other Share United Other1990 States Countries 1997 States Countries
% %
Year 100 100 100 100 100 100First quarter 12 12 12 13 13 13Second quarter 27 27 28 26 26 27Third quarter 45 45 44 44 44 44Fourth quarter 16 16 16 17 17 16
Source: International Travel Survey, 1990 and 1997.
Text Table 3.8Distribution of Overnight Trips to Canada by Quarter, 1990 and 1997
Source: International Travel Survey, 1997, 1990.
Duration
One of the most significant trends in international travelpatterns to Canada over the past decade has been theshortening of trips; 5.4 nights in 1990 to 4.7 nights in 1997.A rising share of business travel coupled with a decliningproportion of VFR trips are factors contributing to this trend.
0
5
10
15
20
25
30
35% change
Jan. - March
April - June
July - Sept.
Oct. - Dec.
Year
34 Tourism Statistical Digest Statistics Canada - Catalogue no. 87-403
CHAPTER 3
American travellers stayed 3.8 nights on average in 1997,while overseas visitors spent 10.9 nights in Canada. Adecade ago, Americans spent 4.0 nights compared to 11.1among overseas visitors. Another factor impacting thelength of stay of international visitors is the shrinking VFRtravel market, which is usually associated with longerdurations. For example, a typical overseas VFR trip lasted13.8 nights in 1997 compared to 10.3 for vacation trips andjust 7.6 for business trips.
As shown in Text Table 3.9, more than half of trips to Canadalasted one to three nights, reflecting the popularity of shorttrips from the United States and the large “rubber tire“market. Overseas travellers were more likely to stay inCanada at least one week. Overseas trips involving lessthan four nights are often a side trip to Canada from theUnited States.
Duration Total United OtherStates Countries
%Total 100 100 1001-3 nights 53 63 214-6 nights 21 21 227-9 nights 12 10 1710-13 nights 5 3 1314-20 nights 5 2 1521 or more nights 3 1 12
Average Duration (nights) 4.7 3.8 10.9
Source: International Travel Survey, 1997.
Text Table 3.9Distribution of Overnight Trips to Canada by Duration, 1997
Activity Total United OtherStates Countries
%
Total Trips1 100 100 100Shopping 65 60 80Sightseeing 62 58 77Dining at high quality restaurants 43 43 44Visiting parks or historic sites 39 35 53Visiting friends or relatives 36 30 54Participating in sports/
outdoor activities 29 29 28Visiting a zoo, museum or
natural display 27 22 21Participating in nightlife/
entertainment 20 20 17Attending cultural events 12 12 15Attending festivals or fairs 10 9 12
1 The sum of activities exceeds the total number of trips since travellersmay participate in more than one activity per trip.
Source: International Travel Survey, 1997.
Text Table 3.10Top Ten Activities Participated in by International Travellers toCanada, 1997
Museums, galleries, zoos and natural displays wereincluded on the itinerary of 27% of visitors, although thisactivity was much more prominent on overseas trips (42%).Visitors got a taste of Canadian culture through nightlife/entertainment activities, cultural events and festivals (10%).
Provincial Visitation
Ontario clearly dominates the international visitor market,capturing 45% of all international travel in 1997, followedby British Columbia with 21%. Approximately 15% ofinternational visitors went to the province of Quebec, while8% saw Alberta. Just 6% took in the sights in the Atlanticregion, while 3% visited Manitoba and Saskatchewan.
As Figure 3.7 illustrates, the share of American versusoverseas visitation varies considerably by province andregion. Quebec receives 39% of its international visitationfrom overseas markets compared to only 22% for Manitobaand Saskatchewan. The Atlantic Region also receives asmaller share of overseas visitation compared to the Canadatotal. Alberta, like Quebec, depends more than the rest ofCanada on the overseas market for its international tourism.Ontario and British Columbia are the most similar in thedistribution of American and overseas visitors.
Travel Activities
As shown in Text Table 3.10, apart from the typical tourist-related activities such as shopping and sightseeing,Canada’s parks and historic sites are a favourite pastimefor many international visitors to Canada. The overseasmarket showed an even stronger penchant for Canada’snatural beauty with over half of tourists reporting this activity.Visiting friends or family is another frequently reportedactivity among overseas travellers (54%), but was lesscommonly cited by Americans (30%).
Enjoying sports or outdoor activities figured prominently,indicating that visitors enjoy an active Canadian holiday.
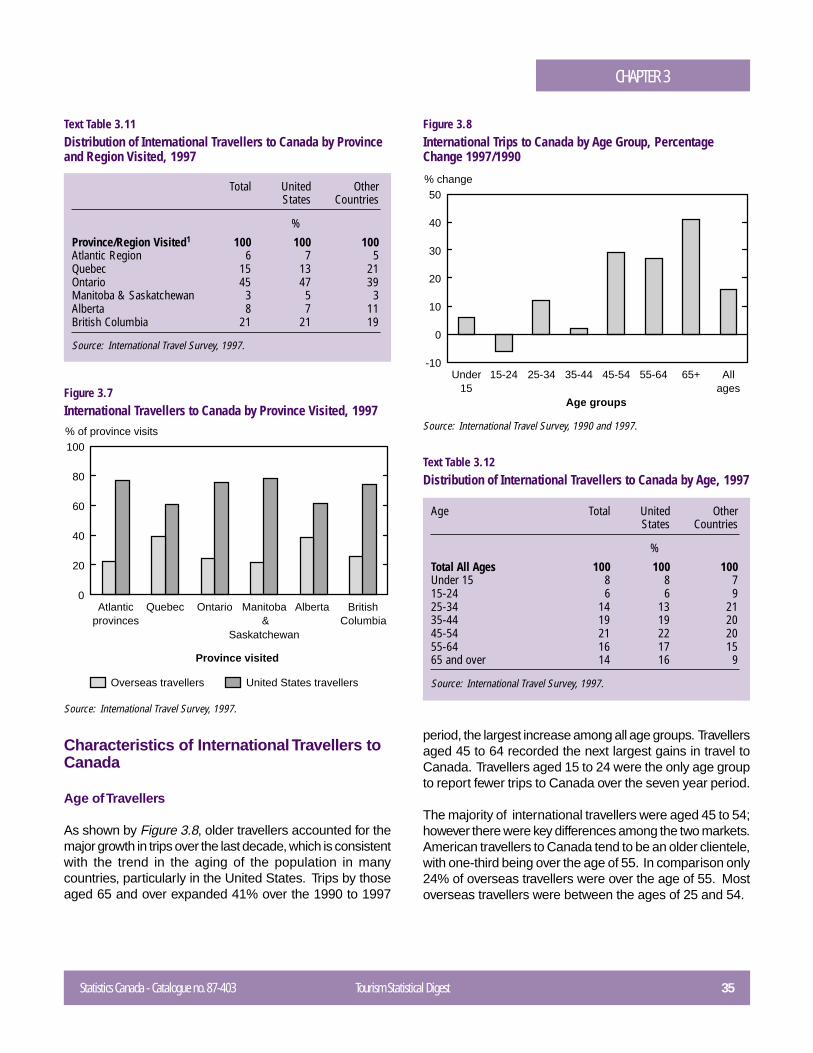
Statistics Canada - Catalogue no. 87-403 Tourism Statistical Digest 35
CHAPTER 3
Total United OtherStates Countries
%
Province/Region Visited1 100 100 100Atlantic Region 6 7 5Quebec 15 13 21Ontario 45 47 39Manitoba & Saskatchewan 3 5 3Alberta 8 7 11British Columbia 21 21 19
Source: International Travel Survey, 1997.
Text Table 3.11Distribution of International Travellers to Canada by Provinceand Region Visited, 1997
Characteristics of International Travellers toCanada
Age of Travellers
As shown by Figure 3.8, older travellers accounted for themajor growth in trips over the last decade, which is consistentwith the trend in the aging of the population in manycountries, particularly in the United States. Trips by thoseaged 65 and over expanded 41% over the 1990 to 1997
period, the largest increase among all age groups. Travellersaged 45 to 64 recorded the next largest gains in travel toCanada. Travellers aged 15 to 24 were the only age groupto report fewer trips to Canada over the seven year period.
The majority of international travellers were aged 45 to 54;however there were key differences among the two markets.American travellers to Canada tend to be an older clientele,with one-third being over the age of 55. In comparison only24% of overseas travellers were over the age of 55. Mostoverseas travellers were between the ages of 25 and 54.
Figure 3.8International Trips to Canada by Age Group, PercentageChange 1997/1990
Age Total United OtherStates Countries
%
Total All Ages 100 100 100Under 15 8 8 715-24 6 6 925-34 14 13 2135-44 19 19 2045-54 21 22 2055-64 16 17 1565 and over 14 16 9
Source: International Travel Survey, 1997.
Text Table 3.12Distribution of International Travellers to Canada by Age, 1997
Figure 3.7International Travellers to Canada by Province Visited, 1997
Source: International Travel Survey, 1997.
Source: International Travel Survey, 1990 and 1997.
Under15
15-24 25-34 35-44 45-54 55-64 65+ Allages
0
10
20
30
40
50
-10
% change
Age groups
Atlanticprovinces
Quebec Ontario Manitoba &
Saskatchewan
Alberta BritishColumbia
0
20
40
60
80
100% of province visits
Province visited
Overseas travellers United States travellers
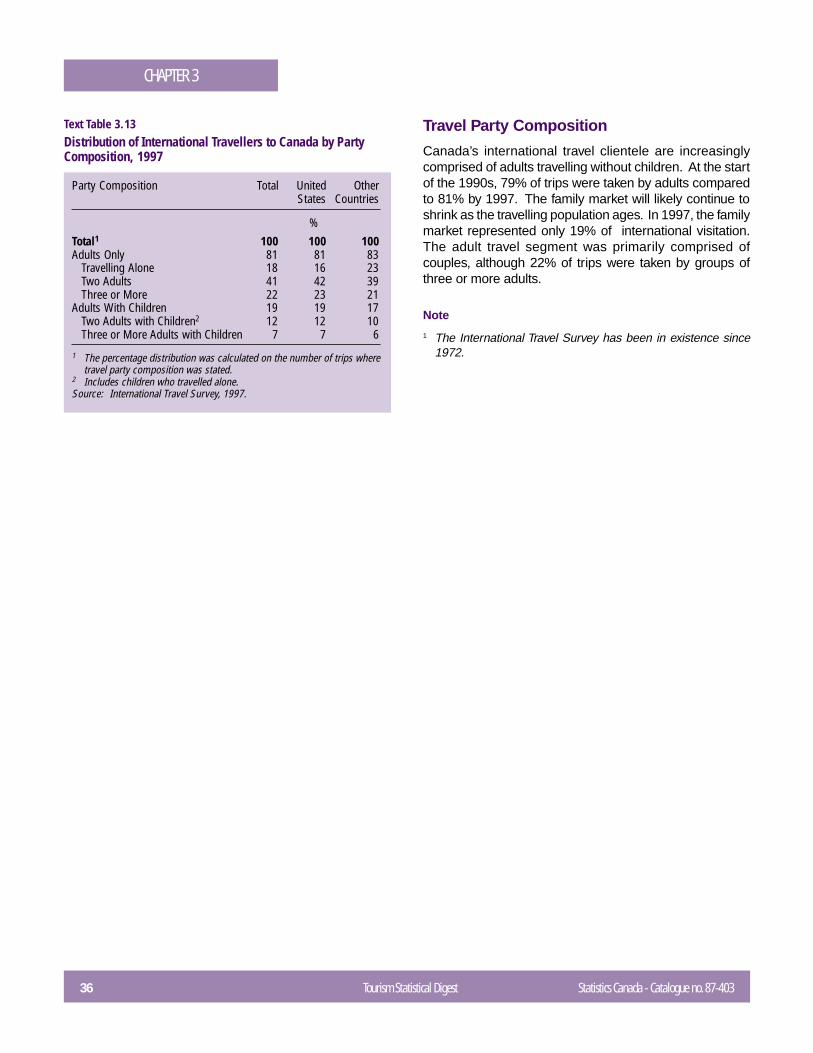
36 Tourism Statistical Digest Statistics Canada - Catalogue no. 87-403
CHAPTER 3
Party Composition Total United OtherStates Countries
%Total1 100 100 100Adults Only 81 81 83
Travelling Alone 18 16 23Two Adults 41 42 39Three or More 22 23 21
Adults With Children 19 19 17Two Adults with Children2 12 12 10Three or More Adults with Children 7 7 6
1 The percentage distribution was calculated on the number of trips wheretravel party composition was stated.
2 Includes children who travelled alone.Source: International Travel Survey, 1997.
Text Table 3.13Distribution of International Travellers to Canada by PartyComposition, 1997
Travel Party Composition
Canada’s international travel clientele are increasinglycomprised of adults travelling without children. At the startof the 1990s, 79% of trips were taken by adults comparedto 81% by 1997. The family market will likely continue toshrink as the travelling population ages. In 1997, the familymarket represented only 19% of international visitation.The adult travel segment was primarily comprised ofcouples, although 22% of trips were taken by groups ofthree or more adults.
Note
1 The International Travel Survey has been in existence since1972.
CHAPTER 4PASSENGER TRANSPORTATION IN CANADA
Statistics Canada - Catalogue no. 87-403 Tourism Statistical Digest 37
Vast distances, dependence on trade and low population density(compared to the United States and Europe) make transportation vitallyimportant in Canada.
The nation’s travel and tourism patterns, both domestically and internationally,are a mirror image of Canadian business, lifestyles and quality of life. Manyfactors make Canada popular with tourists and travellers all over the world,starting with its natural beauty, wide-open spaces and abundant wildlife.The numerous attractions offered in relatively clean and safe cities, a favorableexchange rate that makes charter fares and accommodation inexpensive,the friendly people and Canada’s reputation of one of the best countries inthe world to visit and live in all make it attractive to visitors. Because asignificant portion of Canada’s economy is related to international trade,Canada is both an origin and destination of business people from all cornersof the globe.
The Canadian economy being a western economy, tourism and travel inCanada are integrated with the world economy. Canada is not insulatedfrom challenges facing other nations. For example, the dynamic andinterdependent world business economy, coupled with increasing levels oftourism, have placed a strain on facilities. These factors, as well as the highcost of building new infrastructure and maintaining an aging infrastructureacross all modes, could constrain the ability of Canada (as well as the UnitedStates and Mexico) to handle increases in international trade and tourism.Slowdowns could affect future growth trends. Further, as facilities across allmodes become privatized, issues arise as to the ability of local authoritiesto raise the capital required to modernize, upgrade and repair expensivebridges and other facilities. In the United States, replacement of the domesticfleet plus the ability to handle growth over the next ten years will cost inexcess of $US 100 billion dollars.
Influences on the Demand and Supply of Transportation
Over the years, there have been many influences on the demand for andsupply of passenger transportation services in Canada. These factors includegovernment policy, economic conditions, social activities and technology.
Harold Kohn,Transportation DivisionStatistics Canada
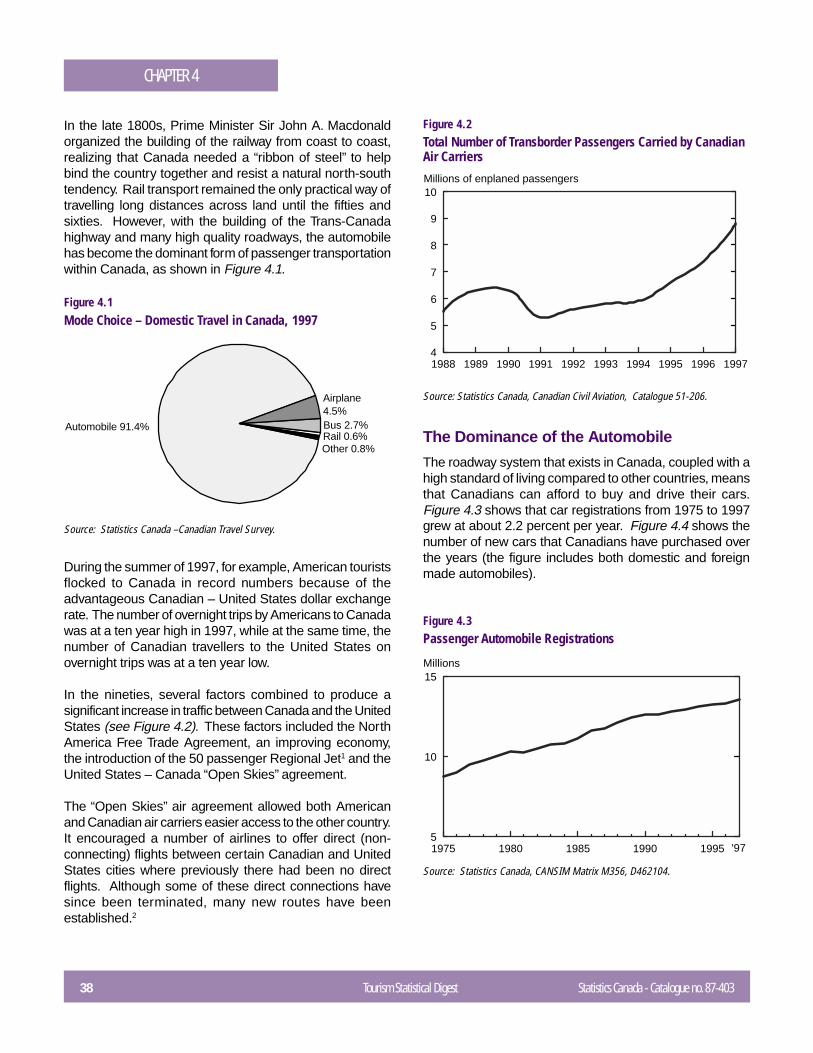
38 Tourism Statistical Digest Statistics Canada - Catalogue no. 87-403
CHAPTER 4
Figure 4.1Mode Choice – Domestic Travel in Canada, 1997
In the late 1800s, Prime Minister Sir John A. Macdonaldorganized the building of the railway from coast to coast,realizing that Canada needed a “ribbon of steel” to helpbind the country together and resist a natural north-southtendency. Rail transport remained the only practical way oftravelling long distances across land until the fifties andsixties. However, with the building of the Trans-Canadahighway and many high quality roadways, the automobilehas become the dominant form of passenger transportationwithin Canada, as shown in Figure 4.1.
During the summer of 1997, for example, American touristsflocked to Canada in record numbers because of theadvantageous Canadian – United States dollar exchangerate. The number of overnight trips by Americans to Canadawas at a ten year high in 1997, while at the same time, thenumber of Canadian travellers to the United States onovernight trips was at a ten year low.
In the nineties, several factors combined to produce asignificant increase in traffic between Canada and the UnitedStates (see Figure 4.2). These factors included the NorthAmerica Free Trade Agreement, an improving economy,the introduction of the 50 passenger Regional Jet1 and theUnited States – Canada “Open Skies” agreement.
The “Open Skies” air agreement allowed both Americanand Canadian air carriers easier access to the other country.It encouraged a number of airlines to offer direct (non-connecting) flights between certain Canadian and UnitedStates cities where previously there had been no directflights. Although some of these direct connections havesince been terminated, many new routes have beenestablished.2
Source: Statistics Canada – Canadian Travel Survey.
Figure 4.2Total Number of Transborder Passengers Carried by CanadianAir Carriers
Source: Statistics Canada, Canadian Civil Aviation, Catalogue 51-206.
1988 1989 1990 1991 1992 1993 1994 1995 1996 19974
5
6
7
8
9
10Millions of enplaned passengers
The Dominance of the Automobile
The roadway system that exists in Canada, coupled with ahigh standard of living compared to other countries, meansthat Canadians can afford to buy and drive their cars.Figure 4.3 shows that car registrations from 1975 to 1997grew at about 2.2 percent per year. Figure 4.4 shows thenumber of new cars that Canadians have purchased overthe years (the figure includes both domestic and foreignmade automobiles).
Figure 4.3Passenger Automobile Registrations
Source: Statistics Canada, CANSIM Matrix M356, D462104.
1975 1980 1985 1990 19955
10
15Millions
'97
Airplane 4.5%Bus 2.7%Rail 0.6%Other 0.8%
Automobile 91.4%
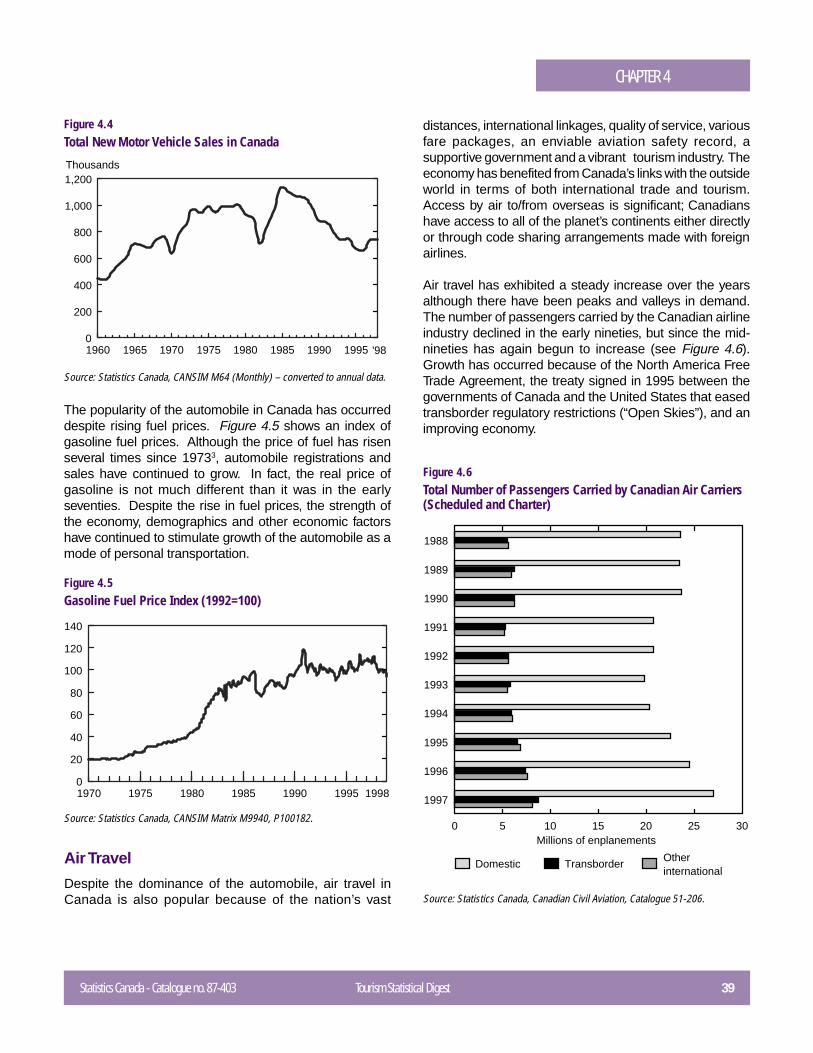
Statistics Canada - Catalogue no. 87-403 Tourism Statistical Digest 39
CHAPTER 4
The popularity of the automobile in Canada has occurreddespite rising fuel prices. Figure 4.5 shows an index ofgasoline fuel prices. Although the price of fuel has risenseveral times since 19733, automobile registrations andsales have continued to grow. In fact, the real price ofgasoline is not much different than it was in the earlyseventies. Despite the rise in fuel prices, the strength ofthe economy, demographics and other economic factorshave continued to stimulate growth of the automobile as amode of personal transportation.
Figure 4.4Total New Motor Vehicle Sales in Canada
Source: Statistics Canada, CANSIM M64 (Monthly) – converted to annual data.
Figure 4.5Gasoline Fuel Price Index (1992=100)
Source: Statistics Canada, CANSIM Matrix M9940, P100182.
Air Travel
Despite the dominance of the automobile, air travel inCanada is also popular because of the nation’s vast
1970 1975 1980 1985 1990 1995 19980
20
40
60
80
100
120
140
distances, international linkages, quality of service, variousfare packages, an enviable aviation safety record, asupportive government and a vibrant tourism industry. Theeconomy has benefited from Canada’s links with the outsideworld in terms of both international trade and tourism.Access by air to/from overseas is significant; Canadianshave access to all of the planet’s continents either directlyor through code sharing arrangements made with foreignairlines.
Air travel has exhibited a steady increase over the yearsalthough there have been peaks and valleys in demand.The number of passengers carried by the Canadian airlineindustry declined in the early nineties, but since the mid-nineties has again begun to increase (see Figure 4.6).Growth has occurred because of the North America FreeTrade Agreement, the treaty signed in 1995 between thegovernments of Canada and the United States that easedtransborder regulatory restrictions (“Open Skies”), and animproving economy.
Figure 4.6Total Number of Passengers Carried by Canadian Air Carriers(Scheduled and Charter)
Source: Statistics Canada, Canadian Civil Aviation, Catalogue 51-206.
1988
1989
1990
1991
1992
1993
1994
1995
1996
1997
0 5 10 15 20 25 30Millions of enplanements
Domestic TransborderOther international
1960 1965 1970 1975 1980 1985 1990 19950
200
400
600
800
1,000
1,200Thousands
'98
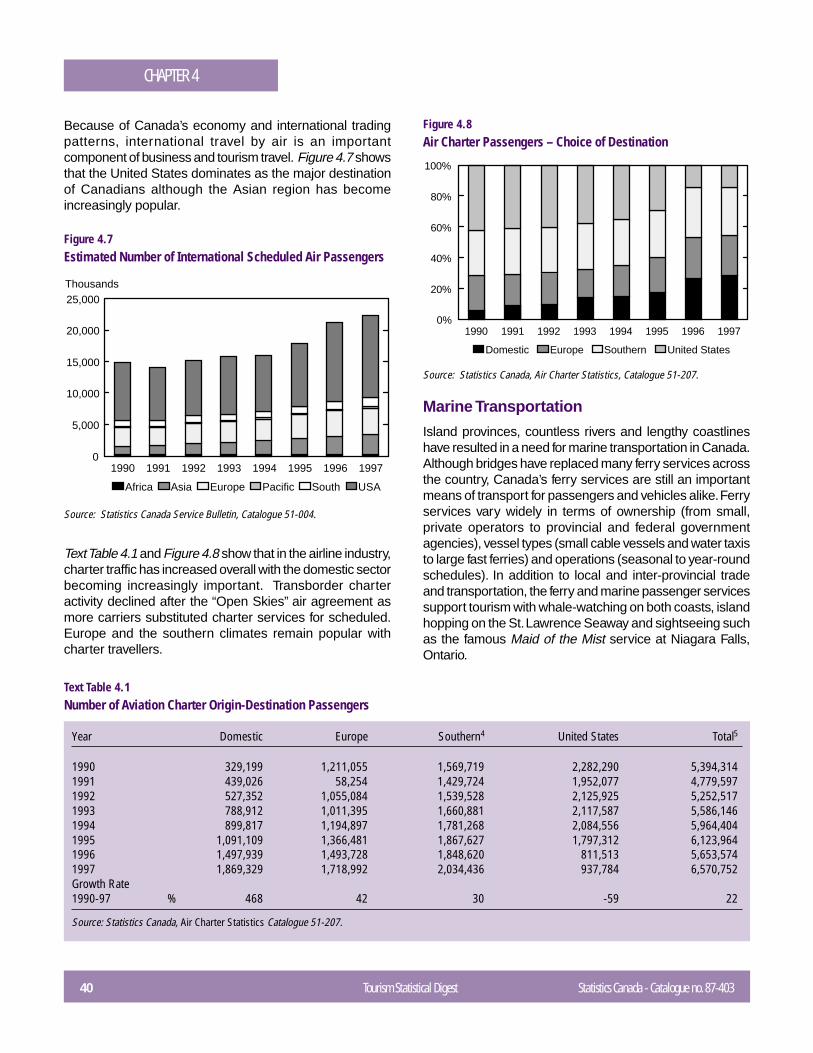
40 Tourism Statistical Digest Statistics Canada - Catalogue no. 87-403
CHAPTER 4
Because of Canada’s economy and international tradingpatterns, international travel by air is an importantcomponent of business and tourism travel. Figure 4.7 showsthat the United States dominates as the major destinationof Canadians although the Asian region has becomeincreasingly popular.
Figure 4.7Estimated Number of International Scheduled Air Passengers
Source: Statistics Canada Service Bulletin, Catalogue 51-004.
Figure 4.8Air Charter Passengers – Choice of Destination
Source: Statistics Canada, Air Charter Statistics, Catalogue 51-207.
1990 1991 1992 1993 1994 1995 1996 19970%
20%
40%
60%
80%
100%
Domestic Europe Southern United States
Year Domestic Europe Southern4 United States Total5
1990 329,199 1,211,055 1,569,719 2,282,290 5,394,3141991 439,026 58,254 1,429,724 1,952,077 4,779,5971992 527,352 1,055,084 1,539,528 2,125,925 5,252,5171993 788,912 1,011,395 1,660,881 2,117,587 5,586,1461994 899,817 1,194,897 1,781,268 2,084,556 5,964,4041995 1,091,109 1,366,481 1,867,627 1,797,312 6,123,9641996 1,497,939 1,493,728 1,848,620 811,513 5,653,5741997 1,869,329 1,718,992 2,034,436 937,784 6,570,752Growth Rate1990-97 % 468 42 30 -59 22
Source: Statistics Canada, Air Charter Statistics Catalogue 51-207.
Text Table 4.1Number of Aviation Charter Origin-Destination Passengers
Marine Transportation
Island provinces, countless rivers and lengthy coastlineshave resulted in a need for marine transportation in Canada.Although bridges have replaced many ferry services acrossthe country, Canada’s ferry services are still an importantmeans of transport for passengers and vehicles alike. Ferryservices vary widely in terms of ownership (from small,private operators to provincial and federal governmentagencies), vessel types (small cable vessels and water taxisto large fast ferries) and operations (seasonal to year-roundschedules). In addition to local and inter-provincial tradeand transportation, the ferry and marine passenger servicessupport tourism with whale-watching on both coasts, islandhopping on the St. Lawrence Seaway and sightseeing suchas the famous Maid of the Mist service at Niagara Falls,Ontario.
Text Table 4.1 and Figure 4.8 show that in the airline industry,charter traffic has increased overall with the domestic sectorbecoming increasingly important. Transborder charteractivity declined after the “Open Skies” air agreement asmore carriers substituted charter services for scheduled.Europe and the southern climates remain popular withcharter travellers.
1990 1991 1992 1993 1994 1995 1996 19970
5,000
10,000
15,000
20,000
25,000
Africa Asia Europe Pacific South USA
Thousands
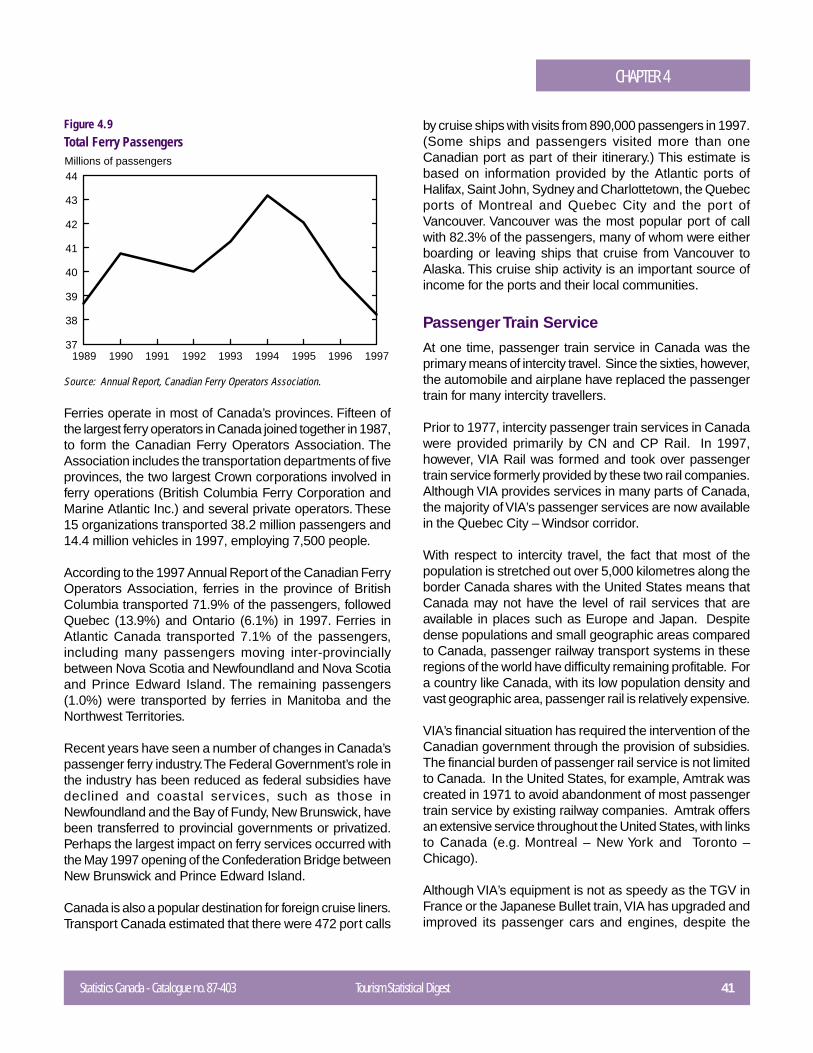
Statistics Canada - Catalogue no. 87-403 Tourism Statistical Digest 41
CHAPTER 4
Figure 4.9Total Ferry Passengers
Source: Annual Report, Canadian Ferry Operators Association.
Ferries operate in most of Canada’s provinces. Fifteen ofthe largest ferry operators in Canada joined together in 1987,to form the Canadian Ferry Operators Association. TheAssociation includes the transportation departments of fiveprovinces, the two largest Crown corporations involved inferry operations (British Columbia Ferry Corporation andMarine Atlantic Inc.) and several private operators. These15 organizations transported 38.2 million passengers and14.4 million vehicles in 1997, employing 7,500 people.
According to the 1997 Annual Report of the Canadian FerryOperators Association, ferries in the province of BritishColumbia transported 71.9% of the passengers, followedQuebec (13.9%) and Ontario (6.1%) in 1997. Ferries inAtlantic Canada transported 7.1% of the passengers,including many passengers moving inter-provinciallybetween Nova Scotia and Newfoundland and Nova Scotiaand Prince Edward Island. The remaining passengers(1.0%) were transported by ferries in Manitoba and theNorthwest Territories.
Recent years have seen a number of changes in Canada’spassenger ferry industry. The Federal Government’s role inthe industry has been reduced as federal subsidies havedeclined and coastal services, such as those inNewfoundland and the Bay of Fundy, New Brunswick, havebeen transferred to provincial governments or privatized.Perhaps the largest impact on ferry services occurred withthe May 1997 opening of the Confederation Bridge betweenNew Brunswick and Prince Edward Island.
Canada is also a popular destination for foreign cruise liners.Transport Canada estimated that there were 472 port calls
1989 1990 1991 1992 1993 1994 1995 1996 199737
38
39
40
41
42
43
44Millions of passengers
by cruise ships with visits from 890,000 passengers in 1997.(Some ships and passengers visited more than oneCanadian port as part of their itinerary.) This estimate isbased on information provided by the Atlantic ports ofHalifax, Saint John, Sydney and Charlottetown, the Quebecports of Montreal and Quebec City and the port ofVancouver. Vancouver was the most popular port of callwith 82.3% of the passengers, many of whom were eitherboarding or leaving ships that cruise from Vancouver toAlaska. This cruise ship activity is an important source ofincome for the ports and their local communities.
Passenger Train Service
At one time, passenger train service in Canada was theprimary means of intercity travel. Since the sixties, however,the automobile and airplane have replaced the passengertrain for many intercity travellers.
Prior to 1977, intercity passenger train services in Canadawere provided primarily by CN and CP Rail. In 1997,however, VIA Rail was formed and took over passengertrain service formerly provided by these two rail companies.Although VIA provides services in many parts of Canada,the majority of VIA’s passenger services are now availablein the Quebec City – Windsor corridor.
With respect to intercity travel, the fact that most of thepopulation is stretched out over 5,000 kilometres along theborder Canada shares with the United States means thatCanada may not have the level of rail services that areavailable in places such as Europe and Japan. Despitedense populations and small geographic areas comparedto Canada, passenger railway transport systems in theseregions of the world have difficulty remaining profitable. Fora country like Canada, with its low population density andvast geographic area, passenger rail is relatively expensive.
VIA’s financial situation has required the intervention of theCanadian government through the provision of subsidies.The financial burden of passenger rail service is not limitedto Canada. In the United States, for example, Amtrak wascreated in 1971 to avoid abandonment of most passengertrain service by existing railway companies. Amtrak offersan extensive service throughout the United States, with linksto Canada (e.g. Montreal – New York and Toronto –Chicago).
Although VIA’s equipment is not as speedy as the TGV inFrance or the Japanese Bullet train, VIA has upgraded andimproved its passenger cars and engines, despite the
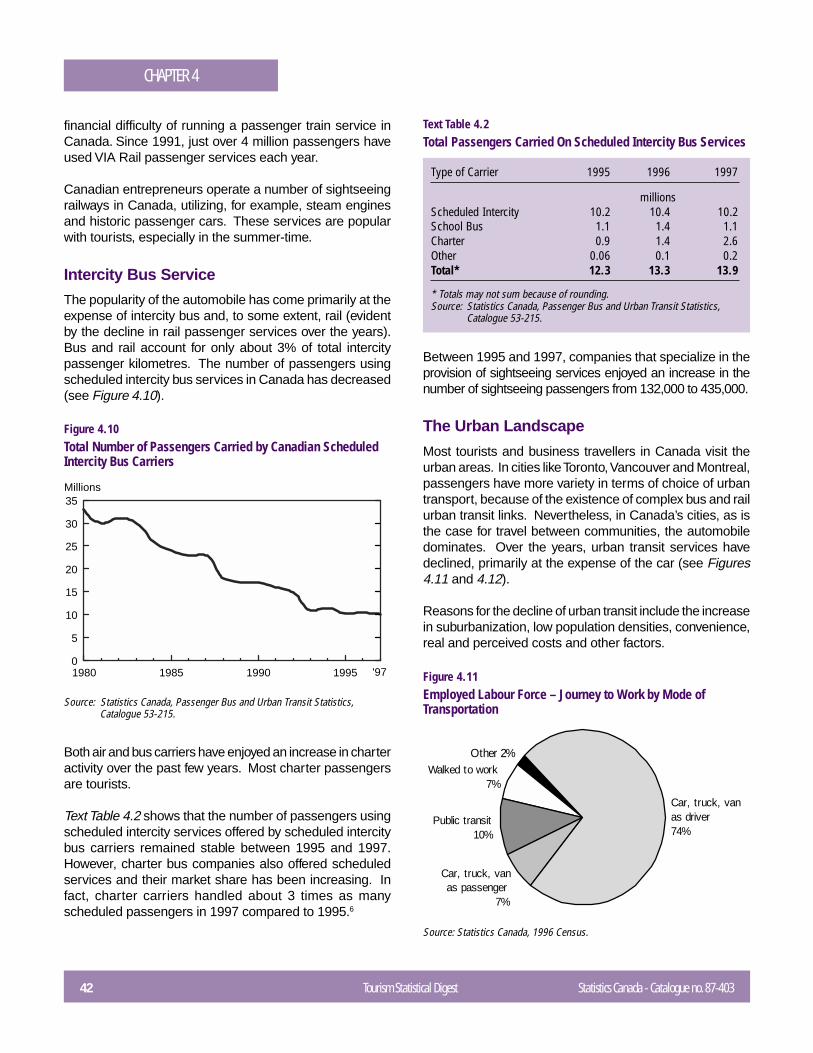
42 Tourism Statistical Digest Statistics Canada - Catalogue no. 87-403
CHAPTER 4
financial difficulty of running a passenger train service inCanada. Since 1991, just over 4 million passengers haveused VIA Rail passenger services each year.
Canadian entrepreneurs operate a number of sightseeingrailways in Canada, utilizing, for example, steam enginesand historic passenger cars. These services are popularwith tourists, especially in the summer-time.
Intercity Bus Service
The popularity of the automobile has come primarily at theexpense of intercity bus and, to some extent, rail (evidentby the decline in rail passenger services over the years).Bus and rail account for only about 3% of total intercitypassenger kilometres. The number of passengers usingscheduled intercity bus services in Canada has decreased(see Figure 4.10).
Figure 4.10Total Number of Passengers Carried by Canadian ScheduledIntercity Bus Carriers
Source: Statistics Canada, Passenger Bus and Urban Transit Statistics,Catalogue 53-215.
Both air and bus carriers have enjoyed an increase in charteractivity over the past few years. Most charter passengersare tourists.
Text Table 4.2 shows that the number of passengers usingscheduled intercity services offered by scheduled intercitybus carriers remained stable between 1995 and 1997.However, charter bus companies also offered scheduledservices and their market share has been increasing. Infact, charter carriers handled about 3 times as manyscheduled passengers in 1997 compared to 1995.6
1980 1985 1990 19950
5
10
15
20
25
30
35Millions
'97
Type of Carrier 1995 1996 1997
millionsScheduled Intercity 10.2 10.4 10.2School Bus 1.1 1.4 1.1Charter 0.9 1.4 2.6Other 0.06 0.1 0.2Total* 12.3 13.3 13.9
* Totals may not sum because of rounding.Source: Statistics Canada, Passenger Bus and Urban Transit Statistics,
Catalogue 53-215.
Text Table 4.2Total Passengers Carried On Scheduled Intercity Bus Services
Between 1995 and 1997, companies that specialize in theprovision of sightseeing services enjoyed an increase in thenumber of sightseeing passengers from 132,000 to 435,000.
The Urban Landscape
Most tourists and business travellers in Canada visit theurban areas. In cities like Toronto, Vancouver and Montreal,passengers have more variety in terms of choice of urbantransport, because of the existence of complex bus and railurban transit links. Nevertheless, in Canada’s cities, as isthe case for travel between communities, the automobiledominates. Over the years, urban transit services havedeclined, primarily at the expense of the car (see Figures4.11 and 4.12).
Reasons for the decline of urban transit include the increasein suburbanization, low population densities, convenience,real and perceived costs and other factors.
Figure 4.11Employed Labour Force – Journey to Work by Mode ofTransportation
Source: Statistics Canada, 1996 Census.
Car, truck, van as driver74%
Car, truck, van as passenger
7%
Public transit10%
Walked to work7%
Other 2%
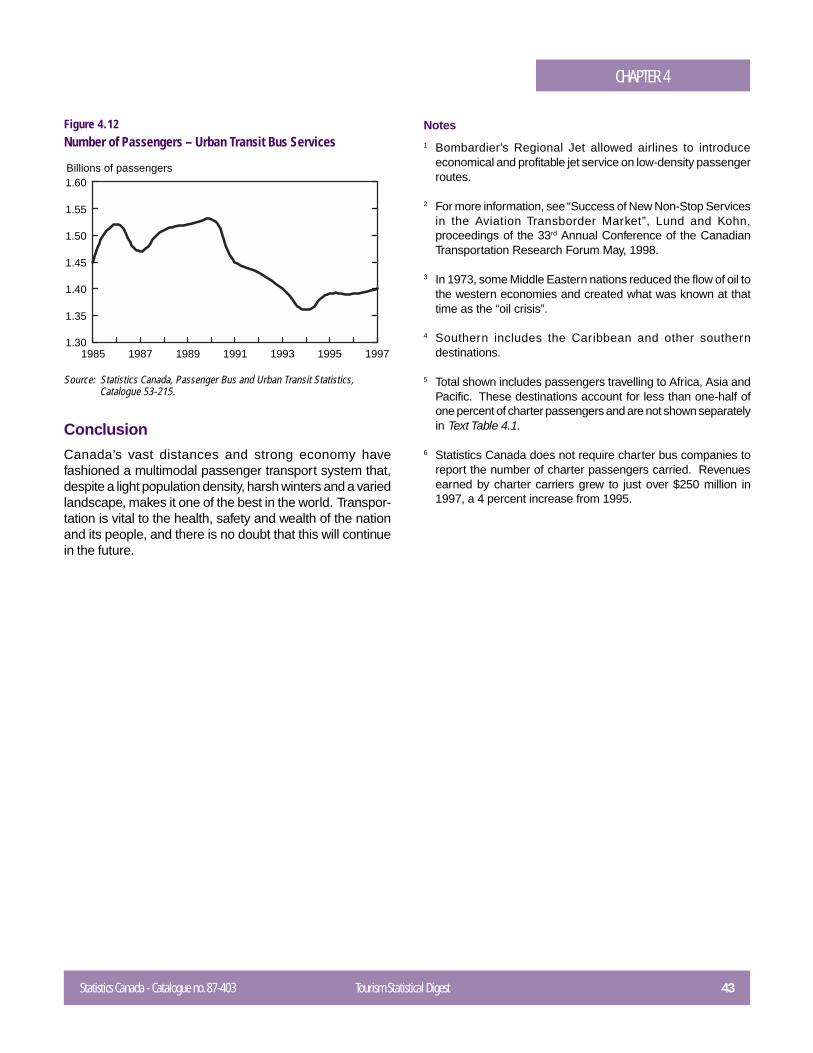
Statistics Canada - Catalogue no. 87-403 Tourism Statistical Digest 43
CHAPTER 4
Figure 4.12Number of Passengers – Urban Transit Bus Services
Source: Statistics Canada, Passenger Bus and Urban Transit Statistics,Catalogue 53-215.
Conclusion
Canada’s vast distances and strong economy havefashioned a multimodal passenger transport system that,despite a light population density, harsh winters and a variedlandscape, makes it one of the best in the world. Transpor-tation is vital to the health, safety and wealth of the nationand its people, and there is no doubt that this will continuein the future.
1985 1987 1989 1991 1993 1995 19971.30
1.35
1.40
1.45
1.50
1.55
1.60Billions of passengers
Notes
1 Bombardier’s Regional Jet allowed airlines to introduceeconomical and profitable jet service on low-density passengerroutes.
2 For more information, see “Success of New Non-Stop Servicesin the Aviation Transborder Market”, Lund and Kohn,proceedings of the 33rd Annual Conference of the CanadianTransportation Research Forum May, 1998.
3 In 1973, some Middle Eastern nations reduced the flow of oil tothe western economies and created what was known at thattime as the “oil crisis”.
4 Southern includes the Caribbean and other southerndestinations.
5 Total shown includes passengers travelling to Africa, Asia andPacific. These destinations account for less than one-half ofone percent of charter passengers and are not shown separatelyin Text Table 4.1.
6 Statistics Canada does not require charter bus companies toreport the number of charter passengers carried. Revenuesearned by charter carriers grew to just over $250 million in1997, a 4 percent increase from 1995.
CHAPTER 5TOURISM SERVICE INDUSTRIES
44 Tourism Statistical Digest Statistics Canada - Catalogue no. 87-403
As it accounts for close to 50% of tourism demand in Canada1 in 1997,transport is clearly the most significant sector in the tourism industry. Thebalance of demand is served by the other major sectors of the industry.This chapter covers the other sectors, which are critically important to thetourism experience. Data for these sectors are more fragmented and,because they are occasionally compiled from taxation data, available muchlater.
This chapter describes four specific industry sectors: accommodationservices, restaurant services, travel agencies and tour operators, andCanadian tourist attractions.
Traveller Accommodation2
General Overview
The traveller accommodation industry plays a critical role in the supportand economic development of Canadian tourism. Its economic health isintimately tied to the growth of tourism activities. With $10 billion in revenuein 1996-1997, it is a major contributor to the Canadian economy and localemployment.
Accommodation Hotel and Motel OtherService Motor Hotel Industry Accommodation
Industries Industry Industries
Number of establishments 15,789 5,183 3,984 6,622Distribution % 100 33 25 42
Total revenue $Million 10,201 8,010 1,025 1,166Distribution % 100 79 10 11
Source: Traveller Accommodation Survey, 1996-1997.
Text Table 5.1Number of Establishments and Total Revenue Traveller AccommodationIndustry, 1996-1997
Danielle Shaienks,Tourism Statistics Program
Statistics Canada - Catalogue no. 87-403 Tourism Statistical Digest 45
CHAPTER 5
This section of the chapter presents a general overview ofall traveller accommodation services in Canada. It firstpresents the financial results and client profile for each ofthe three industry components (hotels and motor hotels,motels, and other accommodation). It then analyses theoperating characteristics of large hotels and motor hotelsmaking up the largest component of the industry.
About the Data
Source:
Data in what follows are drawn from the Traveller Accommo-dation Survey. The base unit for the survey is the establishment.Data are collected on operating characteristics (number ofrooms, occupation rate, facilities, reservation system, marketinformation).
Methodology:
The basic methodology for the Survey of Traveller Accommo-dation is that adopted in 1985 for all service industries. Thismethodology relies on a direct questionnaire sample surveyof a very significant portion of the targeted industries. Surveydata are then supplemented with taxation administrativerecords to provide estimates for the entire industry.
In all, 3,000 traveller accommodation establishments, eachwith a minimum gross revenue of $250,000, are sampled fromthe individual industry populations. The aim of the sampleselection is to achieve maximum industry/province coveragein terms of revenue. The current sample survey is by far thelargest and most comprehensive for the Canadianaccommodation service industries.2 The overall sample surveyrepresents the bulk of the traveller accommodation activities;the results are considered to well reflect the general industryperformance, structures and operating characteristics.
Hotels and Motor Hotels
Hotels and motor hotels have always made up the largestsegment of traveller accommodation industry. In 1996-1997,this industry generated revenues in excess of $8 billion, ormore than three quarters of all revenues from accommo-dation. In number, however, this segment accounts for onlyone third of all establishments. Hotels and motor hotelsgenerally have more rooms than other types of travelleraccommodation establishments. They usually offer a rangeof services and amenities to their guests: restaurants, bars,dance halls, meeting or conference facilities, shops,swimming pools, athletic facilities, and so on. Hotels havea significant impact on local employment and the general
economic vitality of the tourism industry. As may beexpected, most hotel establishments are located indowntown areas, while a small number are located nearairports. Rooms account for close to half of hotel revenues,while meals and alcoholic beverages make up a good shareof the other revenues. Business and pleasure travellerseach account more than one-third of all guests. Foreignvisitors make up one-fifth of the total clientele.
Text Table 5.2Distribution of Revenue Sources, Traveller AccommodationService Industries, 1996 - 1997
Accom- Hotel and Motel Othermodation Motor Accom-
Service Hotel modationIndustries Industries
%Revenue by source
Accommodation 55 52 69 73Meals 18 20 13 6Alcohol 16 18 7 2Merchandise 2 1 6 9Services 4 4 2 5Other revenue 5 5 3 5
Total revenue 100 100 100 100
Source: Traveller Accommodation Survey, 1996-1997.
Text Table 5.3Client Base, Traveller Accommodation Service Industries,1996 - 1997
Accom- Hotel and Motel Othermodation Motor Industry Accom-
Service Hotel modationIndustries Industry Industries
%Domestic clients 78 80 91 72
Individuals 38 37 54 65Business 32 35 31 6Government 8 8 7 1
Foreign clients 22 20 9 28
Total 100 100 100 100
Source: Traveller Accommodation Survey, 1996-1997.
46 Tourism Statistical Digest Statistics Canada - Catalogue no. 87-403
CHAPTER 5
Motels
The motel industry generated $1 billion in revenue in 1996-1997 (10% of total accommodation industry revenue),second only to the hotel and motor hotel industry. Motelbusinesses generally operate in low-rise structures withdirect access to guest room doors from the exterior.Compared to hotels, motel establishments have fewerrooms, facilities and amenities. In terms of services, mostproperties are rated as economy and mid-scale. Very fewmotels are upscale and none are rated as luxury.
Motel properties are fairly evenly distributed betweenhighway, suburban and city centre locations. Only a smallnumber of establishments are found in airport and ruralareas. Unlike hotels, motels generate a larger proportionof business revenue from accommodation services, whilea smaller percentage comes from the serving of meals andnon-alcoholic and alcoholic beverages. Over half of motelclients were Canadians travelling for leisure while one-thirdof clients were Canadians visiting motels for businesspurposes. Foreign clients accounted for close to one-tenthof motel visitors.
Other Accommodation Industries
This segment of the traveller accommodation services iscomprised of six relatively small accommodation serviceindustries as defined under the 1980 Canadian StandardIndustrial Classification. They include: tourist courts andcabins; guest houses and tourist homes; lodging homesand residential clubs; camping grounds and travel trailerparks; outfitters (hunting and fishing camps); and otherrecreation and vacation camps. This group of travelleraccommodation services accounted for 40% of all businessestablishments, but generated only about 11% of totalrevenue in fiscal year 1996-1997.
The business and operating characteristics of thesebusinesses are quite different from those of hotels, motorhotels and motels. Most business establishments are smallin terms of room count (fewer than 50) and are locatedprimarily in rural areas. Unlike hotels and motels, theybasically operate independently, without any chain orfranchise business affiliation. The type of travelleraccommodation services offered tend to be specialized incertain interests or activities. Many are related closely to aspecific outdoor environment and atmosphere.
Business operation in this segment of the traveller accom-modation services is very seasonal. The main source ofrevenue in these businesses is accommodation serviceswhich, in the case of outfitters, may include other servicesin the package price. Although the majority of the clientelein these businesses are Canadians visiting for personal andleisure purposes, the proportion of foreign clients is muchhigher than in either hotels and motels.
Performance Indicators for Hotels and MotorHotels
Financial Performance
Fiscal year 1996-1997 was generally a very good year forhotels and motor hotels. Their occupancy rate and profitmargin have been improving constantly since 1993-1994,from 59% to 64% and -1% to 12%, respectively. Provincially,the financial performance of hotels3 was very differentbetween eastern and western provinces. Hotels in easternprovinces reported lower occupancy rates than those inthe west. In addition, western establishments reported animprovement in their profitability over the previous fiscalyear (except in the Yukon). Alberta is now the provincereporting the highest profit margin (close to 20%).
Text Table 5.4Performance Indicators by Province, Surveyed Hotels andMotor Hotels, 1996 - 1997
Profit Occupancy Averagemargin rate revenue
per room
% % $
Canada 12 64 84Newfoundland 9 53 69Prince Edward Island 12 55 67Nova Scotia 14 61 67New Brunswick 10 59 63Quebec 7 59 88Ontario 11 65 87Manitoba 11 65 58Saskatchewan 13 62 53Alberta 19 68 85British Columbia 14 68 100Yukon 5 67 39Northwest Territories 12 57 96
Source: Traveller Accommodation Survey, 1996-1997.
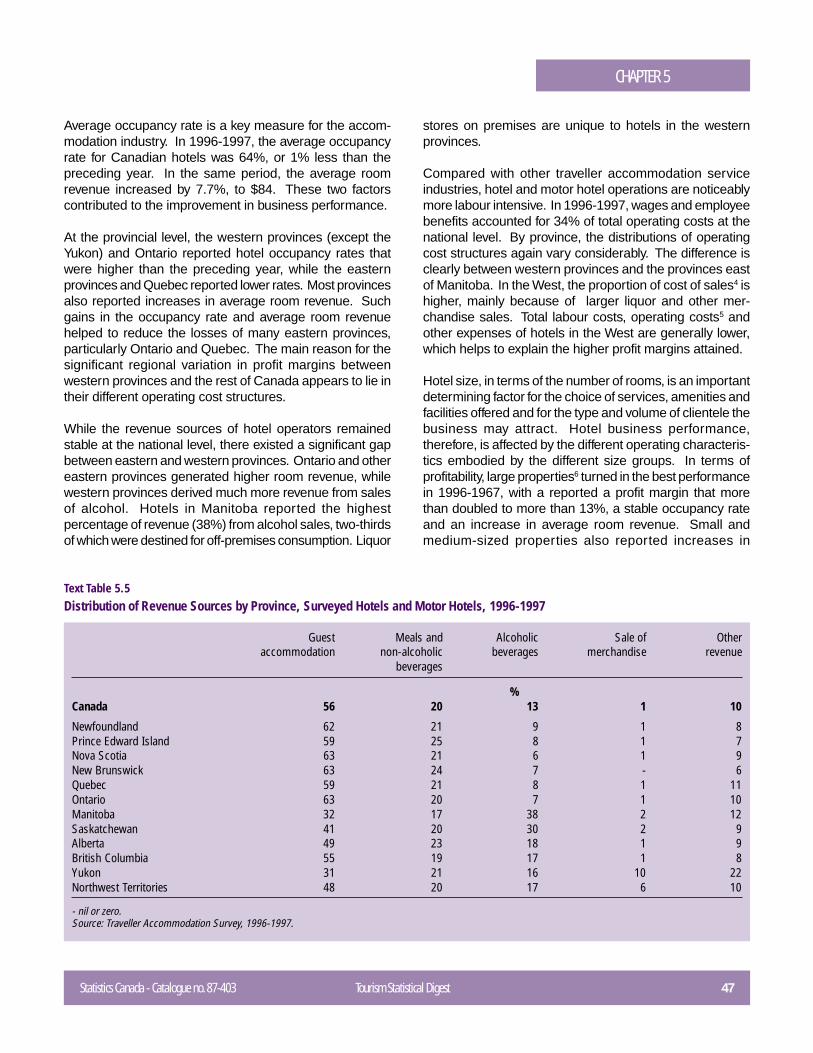
Statistics Canada - Catalogue no. 87-403 Tourism Statistical Digest 47
CHAPTER 5
Average occupancy rate is a key measure for the accom-modation industry. In 1996-1997, the average occupancyrate for Canadian hotels was 64%, or 1% less than thepreceding year. In the same period, the average roomrevenue increased by 7.7%, to $84. These two factorscontributed to the improvement in business performance.
At the provincial level, the western provinces (except theYukon) and Ontario reported hotel occupancy rates thatwere higher than the preceding year, while the easternprovinces and Quebec reported lower rates. Most provincesalso reported increases in average room revenue. Suchgains in the occupancy rate and average room revenuehelped to reduce the losses of many eastern provinces,particularly Ontario and Quebec. The main reason for thesignificant regional variation in profit margins betweenwestern provinces and the rest of Canada appears to lie intheir different operating cost structures.
While the revenue sources of hotel operators remainedstable at the national level, there existed a significant gapbetween eastern and western provinces. Ontario and othereastern provinces generated higher room revenue, whilewestern provinces derived much more revenue from salesof alcohol. Hotels in Manitoba reported the highestpercentage of revenue (38%) from alcohol sales, two-thirdsof which were destined for off-premises consumption. Liquor
Guest Meals and Alcoholic Sale of Otheraccommodation non-alcoholic beverages merchandise revenue
beverages
%Canada 56 20 13 1 10
Newfoundland 62 21 9 1 8Prince Edward Island 59 25 8 1 7Nova Scotia 63 21 6 1 9New Brunswick 63 24 7 - 6Quebec 59 21 8 1 11Ontario 63 20 7 1 10Manitoba 32 17 38 2 12Saskatchewan 41 20 30 2 9Alberta 49 23 18 1 9British Columbia 55 19 17 1 8Yukon 31 21 16 10 22Northwest Territories 48 20 17 6 10
- nil or zero.Source: Traveller Accommodation Survey, 1996-1997.
Text Table 5.5Distribution of Revenue Sources by Province, Surveyed Hotels and Motor Hotels, 1996-1997
stores on premises are unique to hotels in the westernprovinces.
Compared with other traveller accommodation serviceindustries, hotel and motor hotel operations are noticeablymore labour intensive. In 1996-1997, wages and employeebenefits accounted for 34% of total operating costs at thenational level. By province, the distributions of operatingcost structures again vary considerably. The difference isclearly between western provinces and the provinces eastof Manitoba. In the West, the proportion of cost of sales4 ishigher, mainly because of larger liquor and other mer-chandise sales. Total labour costs, operating costs5 andother expenses of hotels in the West are generally lower,which helps to explain the higher profit margins attained.
Hotel size, in terms of the number of rooms, is an importantdetermining factor for the choice of services, amenities andfacilities offered and for the type and volume of clientele thebusiness may attract. Hotel business performance,therefore, is affected by the different operating characteris-tics embodied by the different size groups. In terms ofprofitability, large properties6 turned in the best performancein 1996-1967, with a reported a profit margin that morethan doubled to more than 13%, a stable occupancy rateand an increase in average room revenue. Small andmedium-sized properties also reported increases in
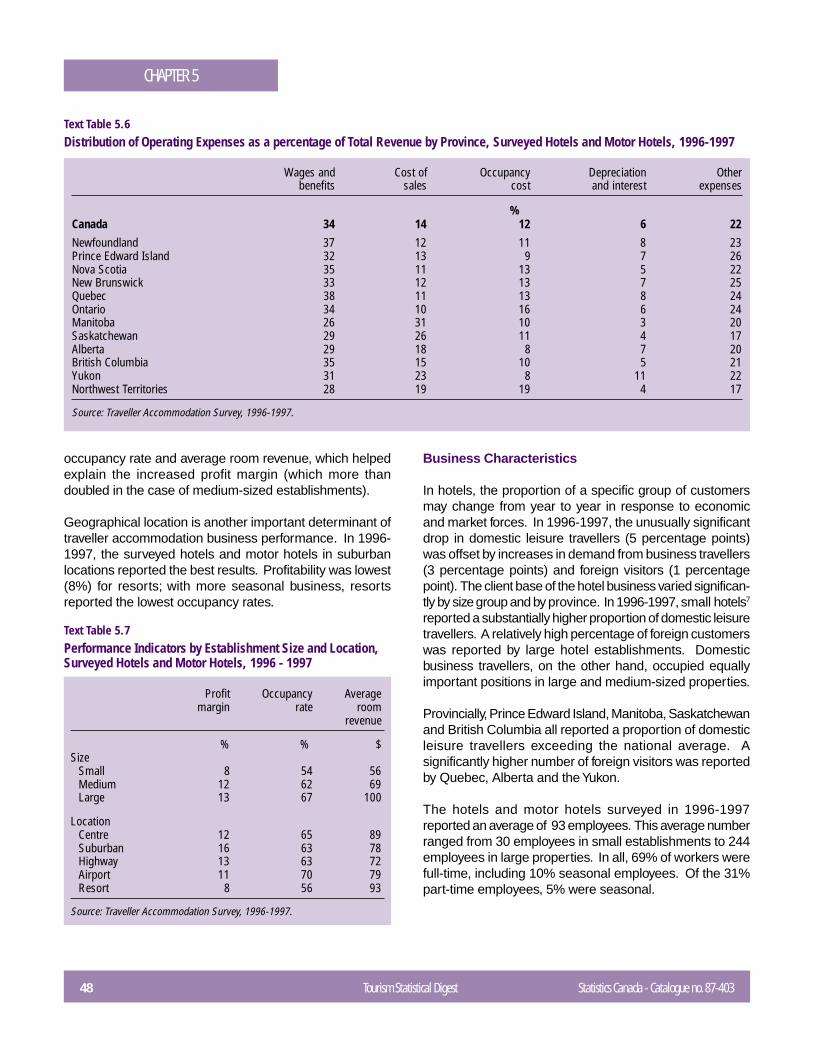
48 Tourism Statistical Digest Statistics Canada - Catalogue no. 87-403
CHAPTER 5
Wages and Cost of Occupancy Depreciation Otherbenefits sales cost and interest expenses
%Canada 34 14 12 6 22Newfoundland 37 12 11 8 23Prince Edward Island 32 13 9 7 26Nova Scotia 35 11 13 5 22New Brunswick 33 12 13 7 25Quebec 38 11 13 8 24Ontario 34 10 16 6 24Manitoba 26 31 10 3 20Saskatchewan 29 26 11 4 17Alberta 29 18 8 7 20British Columbia 35 15 10 5 21Yukon 31 23 8 11 22Northwest Territories 28 19 19 4 17
Source: Traveller Accommodation Survey, 1996-1997.
Text Table 5.6Distribution of Operating Expenses as a percentage of Total Revenue by Province, Surveyed Hotels and Motor Hotels, 1996-1997
occupancy rate and average room revenue, which helpedexplain the increased profit margin (which more thandoubled in the case of medium-sized establishments).
Geographical location is another important determinant oftraveller accommodation business performance. In 1996-1997, the surveyed hotels and motor hotels in suburbanlocations reported the best results. Profitability was lowest(8%) for resorts; with more seasonal business, resortsreported the lowest occupancy rates.
Text Table 5.7Performance Indicators by Establishment Size and Location,Surveyed Hotels and Motor Hotels, 1996 - 1997
Profit Occupancy Averagemargin rate room
revenue
% % $Size
Small 8 54 56Medium 12 62 69Large 13 67 100
LocationCentre 12 65 89Suburban 16 63 78Highway 13 63 72Airport 11 70 79Resort 8 56 93
Source: Traveller Accommodation Survey, 1996-1997.
Business Characteristics
In hotels, the proportion of a specific group of customersmay change from year to year in response to economicand market forces. In 1996-1997, the unusually significantdrop in domestic leisure travellers (5 percentage points)was offset by increases in demand from business travellers(3 percentage points) and foreign visitors (1 percentagepoint). The client base of the hotel business varied significan-tly by size group and by province. In 1996-1997, small hotels7
reported a substantially higher proportion of domestic leisuretravellers. A relatively high percentage of foreign customerswas reported by large hotel establishments. Domesticbusiness travellers, on the other hand, occupied equallyimportant positions in large and medium-sized properties.
Provincially, Prince Edward Island, Manitoba, Saskatchewanand British Columbia all reported a proportion of domesticleisure travellers exceeding the national average. Asignificantly higher number of foreign visitors was reportedby Quebec, Alberta and the Yukon.
The hotels and motor hotels surveyed in 1996-1997reported an average of 93 employees. This average numberranged from 30 employees in small establishments to 244employees in large properties. In all, 69% of workers werefull-time, including 10% seasonal employees. Of the 31%part-time employees, 5% were seasonal.
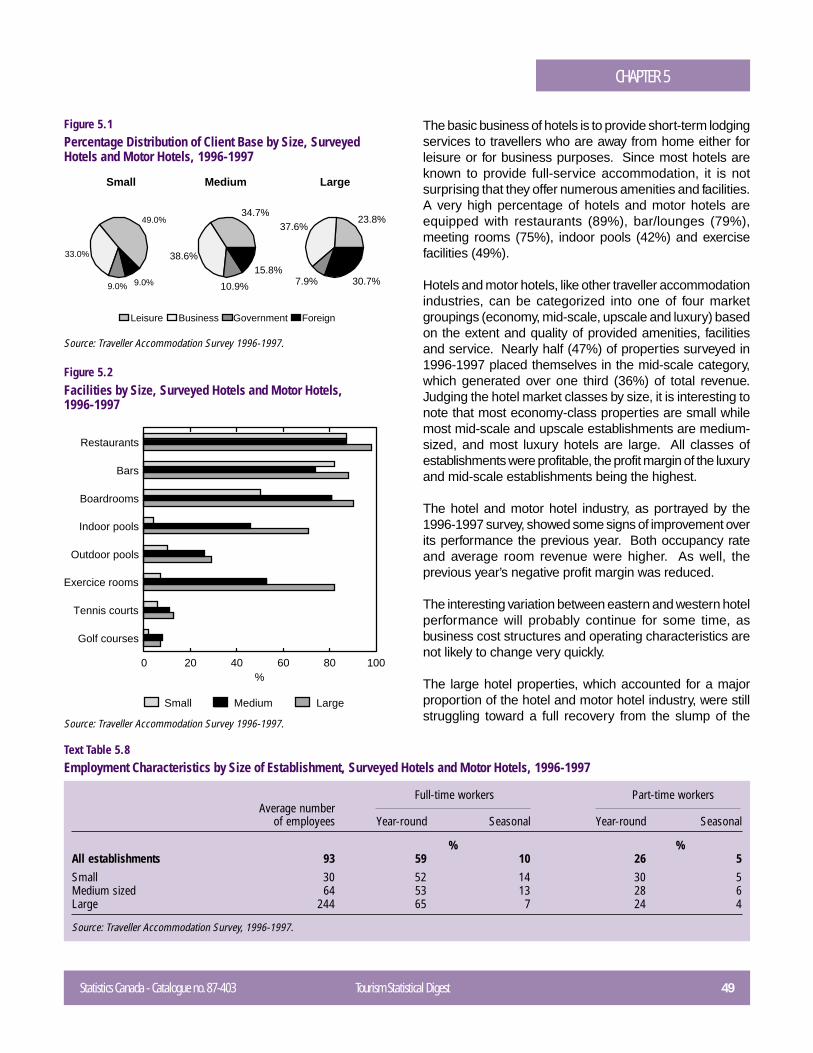
Statistics Canada - Catalogue no. 87-403 Tourism Statistical Digest 49
CHAPTER 5
Figure 5.1Percentage Distribution of Client Base by Size, SurveyedHotels and Motor Hotels, 1996-1997
49.0%
33.0%
9.0% 9.0%
34.7%
38.6%
10.9%
15.8%
23.8%37.6%
7.9% 30.7%
Leisure Business Government Foreign
Small Medium Large
Figure 5.2Facilities by Size, Surveyed Hotels and Motor Hotels,1996-1997
Full-time workers Part-time workersAverage number
of employees Year-round Seasonal Year-round Seasonal
% %All establishments 93 59 10 26 5Small 30 52 14 30 5Medium sized 64 53 13 28 6Large 244 65 7 24 4
Source: Traveller Accommodation Survey, 1996-1997.
Text Table 5.8Employment Characteristics by Size of Establishment, Surveyed Hotels and Motor Hotels, 1996-1997
The basic business of hotels is to provide short-term lodgingservices to travellers who are away from home either forleisure or for business purposes. Since most hotels areknown to provide full-service accommodation, it is notsurprising that they offer numerous amenities and facilities.A very high percentage of hotels and motor hotels areequipped with restaurants (89%), bar/lounges (79%),meeting rooms (75%), indoor pools (42%) and exercisefacilities (49%).
Hotels and motor hotels, like other traveller accommodationindustries, can be categorized into one of four marketgroupings (economy, mid-scale, upscale and luxury) basedon the extent and quality of provided amenities, facilitiesand service. Nearly half (47%) of properties surveyed in1996-1997 placed themselves in the mid-scale category,which generated over one third (36%) of total revenue.Judging the hotel market classes by size, it is interesting tonote that most economy-class properties are small whilemost mid-scale and upscale establishments are medium-sized, and most luxury hotels are large. All classes ofestablishments were profitable, the profit margin of the luxuryand mid-scale establishments being the highest.
The hotel and motor hotel industry, as portrayed by the1996-1997 survey, showed some signs of improvement overits performance the previous year. Both occupancy rateand average room revenue were higher. As well, theprevious year’s negative profit margin was reduced.
The interesting variation between eastern and western hotelperformance will probably continue for some time, asbusiness cost structures and operating characteristics arenot likely to change very quickly.
The large hotel properties, which accounted for a majorproportion of the hotel and motor hotel industry, were stillstruggling toward a full recovery from the slump of the
Source: Traveller Accommodation Survey 1996-1997.
Source: Traveller Accommodation Survey 1996-1997.
Restaurants
Bars
Boardrooms
Indoor pools
Outdoor pools
Exercice rooms
Tennis courts
Golf courses
0 20 40 60 80 100%
Small Medium Large
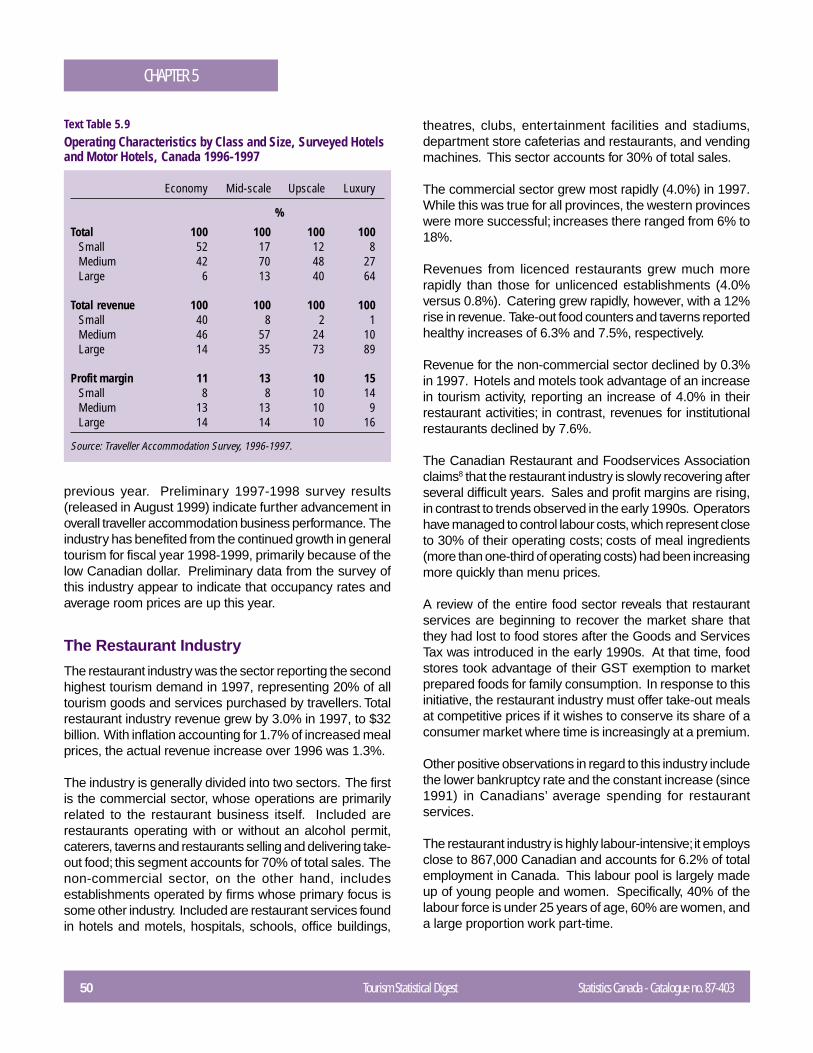
50 Tourism Statistical Digest Statistics Canada - Catalogue no. 87-403
CHAPTER 5
Text Table 5.9Operating Characteristics by Class and Size, Surveyed Hotelsand Motor Hotels, Canada 1996-1997
Economy Mid-scale Upscale Luxury
%
Total 100 100 100 100Small 52 17 12 8Medium 42 70 48 27Large 6 13 40 64
Total revenue 100 100 100 100Small 40 8 2 1Medium 46 57 24 10Large 14 35 73 89
Profit margin 11 13 10 15Small 8 8 10 14Medium 13 13 10 9Large 14 14 10 16
Source: Traveller Accommodation Survey, 1996-1997.
previous year. Preliminary 1997-1998 survey results(released in August 1999) indicate further advancement inoverall traveller accommodation business performance. Theindustry has benefited from the continued growth in generaltourism for fiscal year 1998-1999, primarily because of thelow Canadian dollar. Preliminary data from the survey ofthis industry appear to indicate that occupancy rates andaverage room prices are up this year.
The Restaurant Industry
The restaurant industry was the sector reporting the secondhighest tourism demand in 1997, representing 20% of alltourism goods and services purchased by travellers. Totalrestaurant industry revenue grew by 3.0% in 1997, to $32billion. With inflation accounting for 1.7% of increased mealprices, the actual revenue increase over 1996 was 1.3%.
The industry is generally divided into two sectors. The firstis the commercial sector, whose operations are primarilyrelated to the restaurant business itself. Included arerestaurants operating with or without an alcohol permit,caterers, taverns and restaurants selling and delivering take-out food; this segment accounts for 70% of total sales. Thenon-commercial sector, on the other hand, includesestablishments operated by firms whose primary focus issome other industry. Included are restaurant services foundin hotels and motels, hospitals, schools, office buildings,
theatres, clubs, entertainment facilities and stadiums,department store cafeterias and restaurants, and vendingmachines. This sector accounts for 30% of total sales.
The commercial sector grew most rapidly (4.0%) in 1997.While this was true for all provinces, the western provinceswere more successful; increases there ranged from 6% to18%.
Revenues from licenced restaurants grew much morerapidly than those for unlicenced establishments (4.0%versus 0.8%). Catering grew rapidly, however, with a 12%rise in revenue. Take-out food counters and taverns reportedhealthy increases of 6.3% and 7.5%, respectively.
Revenue for the non-commercial sector declined by 0.3%in 1997. Hotels and motels took advantage of an increasein tourism activity, reporting an increase of 4.0% in theirrestaurant activities; in contrast, revenues for institutionalrestaurants declined by 7.6%.
The Canadian Restaurant and Foodservices Associationclaims8 that the restaurant industry is slowly recovering afterseveral difficult years. Sales and profit margins are rising,in contrast to trends observed in the early 1990s. Operatorshave managed to control labour costs, which represent closeto 30% of their operating costs; costs of meal ingredients(more than one-third of operating costs) had been increasingmore quickly than menu prices.
A review of the entire food sector reveals that restaurantservices are beginning to recover the market share thatthey had lost to food stores after the Goods and ServicesTax was introduced in the early 1990s. At that time, foodstores took advantage of their GST exemption to marketprepared foods for family consumption. In response to thisinitiative, the restaurant industry must offer take-out mealsat competitive prices if it wishes to conserve its share of aconsumer market where time is increasingly at a premium.
Other positive observations in regard to this industry includethe lower bankruptcy rate and the constant increase (since1991) in Canadians’ average spending for restaurantservices.
The restaurant industry is highly labour-intensive; it employsclose to 867,000 Canadian and accounts for 6.2% of totalemployment in Canada. This labour pool is largely madeup of young people and women. Specifically, 40% of thelabour force is under 25 years of age, 60% are women, anda large proportion work part-time.
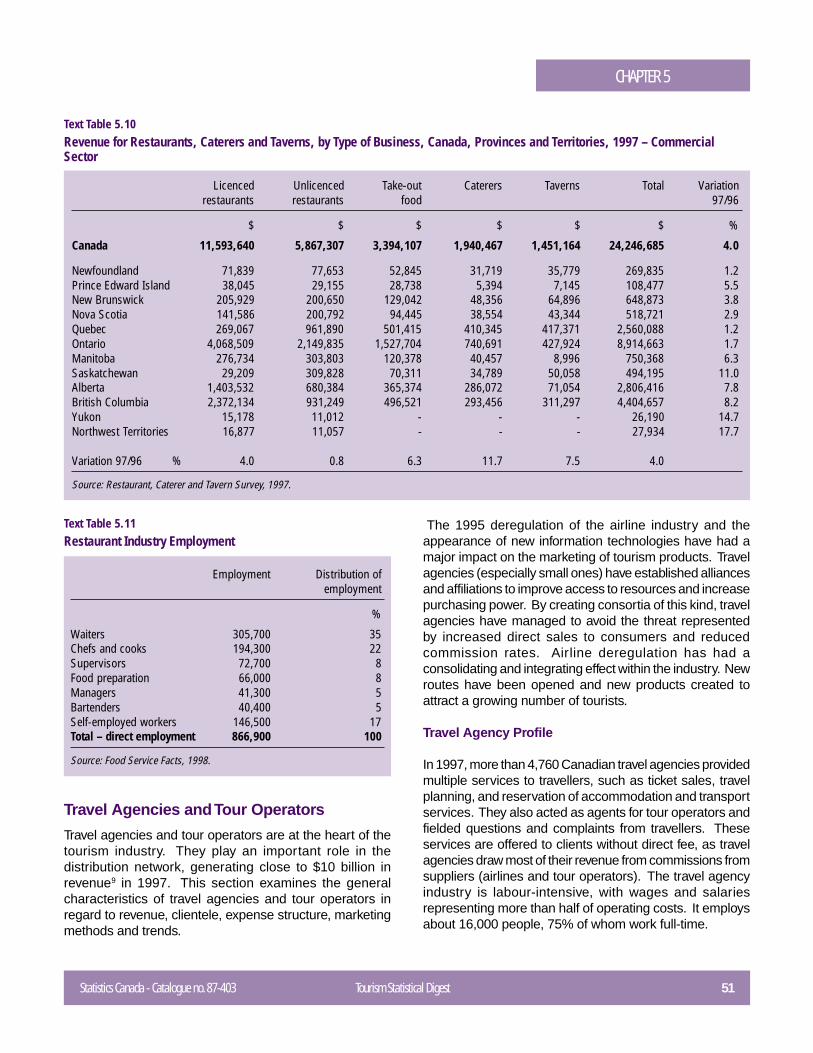
Statistics Canada - Catalogue no. 87-403 Tourism Statistical Digest 51
CHAPTER 5
Licenced Unlicenced Take-out Caterers Taverns Total Variationrestaurants restaurants food 97/96
$ $ $ $ $ $ %
Canada 11,593,640 5,867,307 3,394,107 1,940,467 1,451,164 24,246,685 4.0
Newfoundland 71,839 77,653 52,845 31,719 35,779 269,835 1.2Prince Edward Island 38,045 29,155 28,738 5,394 7,145 108,477 5.5New Brunswick 205,929 200,650 129,042 48,356 64,896 648,873 3.8Nova Scotia 141,586 200,792 94,445 38,554 43,344 518,721 2.9Quebec 269,067 961,890 501,415 410,345 417,371 2,560,088 1.2Ontario 4,068,509 2,149,835 1,527,704 740,691 427,924 8,914,663 1.7Manitoba 276,734 303,803 120,378 40,457 8,996 750,368 6.3Saskatchewan 29,209 309,828 70,311 34,789 50,058 494,195 11.0Alberta 1,403,532 680,384 365,374 286,072 71,054 2,806,416 7.8British Columbia 2,372,134 931,249 496,521 293,456 311,297 4,404,657 8.2Yukon 15,178 11,012 - - - 26,190 14.7Northwest Territories 16,877 11,057 - - - 27,934 17.7
Variation 97/96 % 4.0 0.8 6.3 11.7 7.5 4.0
Source: Restaurant, Caterer and Tavern Survey, 1997.
Text Table 5.10Revenue for Restaurants, Caterers and Taverns, by Type of Business, Canada, Provinces and Territories, 1997 – CommercialSector
Text Table 5.11Restaurant Industry Employment
Employment Distribution ofemployment
%
Waiters 305,700 35Chefs and cooks 194,300 22Supervisors 72,700 8Food preparation 66,000 8Managers 41,300 5Bartenders 40,400 5Self-employed workers 146,500 17Total – direct employment 866,900 100
Source: Food Service Facts, 1998.
Travel Agencies and Tour Operators
Travel agencies and tour operators are at the heart of thetourism industry. They play an important role in thedistribution network, generating close to $10 billion inrevenue9 in 1997. This section examines the generalcharacteristics of travel agencies and tour operators inregard to revenue, clientele, expense structure, marketingmethods and trends.
The 1995 deregulation of the airline industry and theappearance of new information technologies have had amajor impact on the marketing of tourism products. Travelagencies (especially small ones) have established alliancesand affiliations to improve access to resources and increasepurchasing power. By creating consortia of this kind, travelagencies have managed to avoid the threat representedby increased direct sales to consumers and reducedcommission rates. Airline deregulation has had aconsolidating and integrating effect within the industry. Newroutes have been opened and new products created toattract a growing number of tourists.
Travel Agency Profile
In 1997, more than 4,760 Canadian travel agencies providedmultiple services to travellers, such as ticket sales, travelplanning, and reservation of accommodation and transportservices. They also acted as agents for tour operators andfielded questions and complaints from travellers. Theseservices are offered to clients without direct fee, as travelagencies draw most of their revenue from commissions fromsuppliers (airlines and tour operators). The travel agencyindustry is labour-intensive, with wages and salariesrepresenting more than half of operating costs. It employsabout 16,000 people, 75% of whom work full-time.
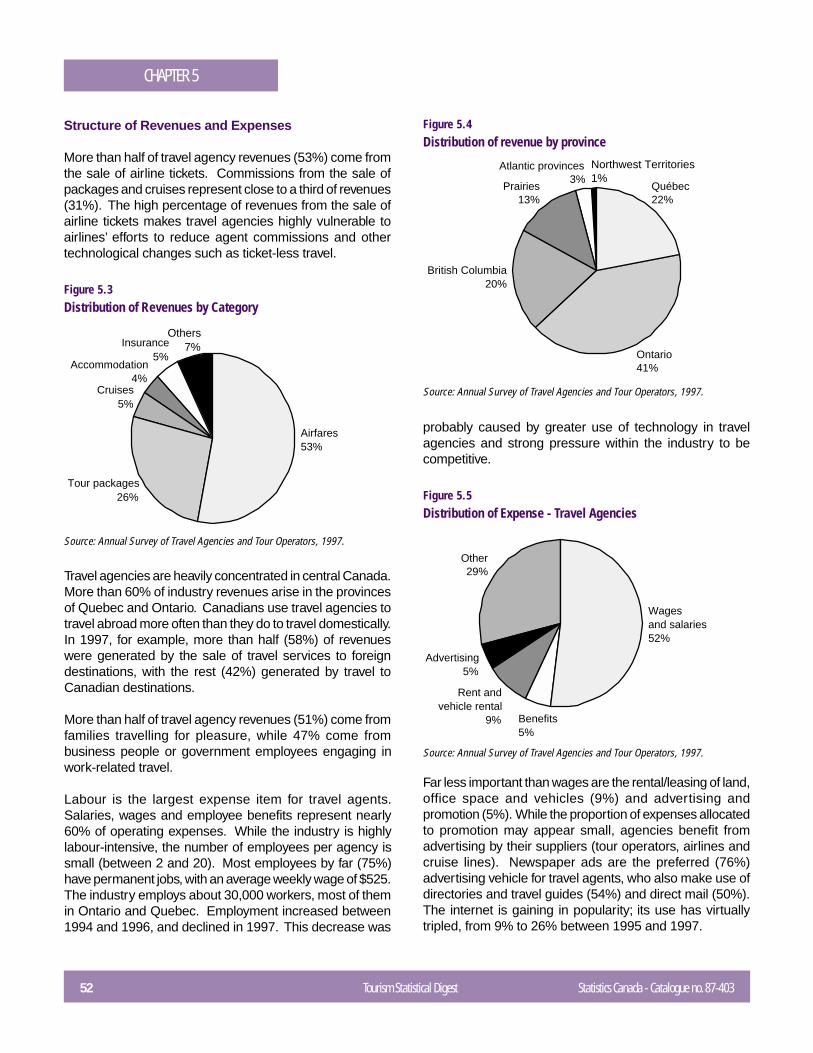
52 Tourism Statistical Digest Statistics Canada - Catalogue no. 87-403
CHAPTER 5
Structure of Revenues and Expenses
More than half of travel agency revenues (53%) come fromthe sale of airline tickets. Commissions from the sale ofpackages and cruises represent close to a third of revenues(31%). The high percentage of revenues from the sale ofairline tickets makes travel agencies highly vulnerable toairlines’ efforts to reduce agent commissions and othertechnological changes such as ticket-less travel.
Figure 5.3Distribution of Revenues by Category
Airfares53%
Cruises5%
Accommodation 4%
Insurance 5%
Others7%
Tour packages26%
Travel agencies are heavily concentrated in central Canada.More than 60% of industry revenues arise in the provincesof Quebec and Ontario. Canadians use travel agencies totravel abroad more often than they do to travel domestically.In 1997, for example, more than half (58%) of revenueswere generated by the sale of travel services to foreigndestinations, with the rest (42%) generated by travel toCanadian destinations.
More than half of travel agency revenues (51%) come fromfamilies travelling for pleasure, while 47% come frombusiness people or government employees engaging inwork-related travel.
Labour is the largest expense item for travel agents.Salaries, wages and employee benefits represent nearly60% of operating expenses. While the industry is highlylabour-intensive, the number of employees per agency issmall (between 2 and 20). Most employees by far (75%)have permanent jobs, with an average weekly wage of $525.The industry employs about 30,000 workers, most of themin Ontario and Quebec. Employment increased between1994 and 1996, and declined in 1997. This decrease was
Figure 5.4Distribution of revenue by province
Québec22%
British Columbia20%
Prairies13%
Atlantic provinces3%
Northwest Territories1%
Ontario41%
probably caused by greater use of technology in travelagencies and strong pressure within the industry to becompetitive.
Figure 5.5Distribution of Expense - Travel Agencies
Benefits5%
Advertising5%
Other29%
Wages and salaries52%
Rent and vehicle rental
9%
Source: Annual Survey of Travel Agencies and Tour Operators, 1997.
Source: Annual Survey of Travel Agencies and Tour Operators, 1997.
Source: Annual Survey of Travel Agencies and Tour Operators, 1997.
Far less important than wages are the rental/leasing of land,office space and vehicles (9%) and advertising andpromotion (5%). While the proportion of expenses allocatedto promotion may appear small, agencies benefit fromadvertising by their suppliers (tour operators, airlines andcruise lines). Newspaper ads are the preferred (76%)advertising vehicle for travel agents, who also make use ofdirectories and travel guides (54%) and direct mail (50%).The internet is gaining in popularity; its use has virtuallytripled, from 9% to 26% between 1995 and 1997.
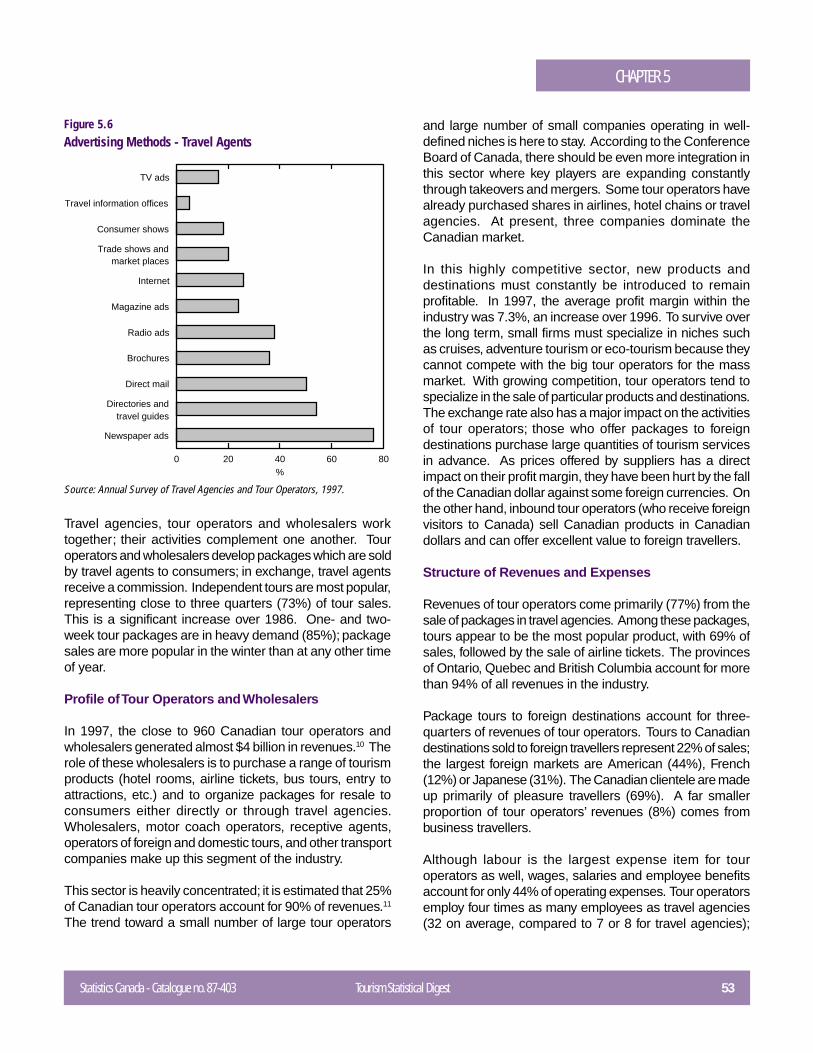
Statistics Canada - Catalogue no. 87-403 Tourism Statistical Digest 53
CHAPTER 5
Figure 5.6Advertising Methods - Travel Agents
TV ads
Travel information offices
Consumer shows
Trade shows andmarket places
Internet
Magazine ads
Radio ads
Brochures
Direct mail
Directories andtravel guides
Newspaper ads
0 20 40 60 80%
Travel agencies, tour operators and wholesalers worktogether; their activities complement one another. Touroperators and wholesalers develop packages which are soldby travel agents to consumers; in exchange, travel agentsreceive a commission. Independent tours are most popular,representing close to three quarters (73%) of tour sales.This is a significant increase over 1986. One- and two-week tour packages are in heavy demand (85%); packagesales are more popular in the winter than at any other timeof year.
Profile of Tour Operators and Wholesalers
In 1997, the close to 960 Canadian tour operators andwholesalers generated almost $4 billion in revenues.10 Therole of these wholesalers is to purchase a range of tourismproducts (hotel rooms, airline tickets, bus tours, entry toattractions, etc.) and to organize packages for resale toconsumers either directly or through travel agencies.Wholesalers, motor coach operators, receptive agents,operators of foreign and domestic tours, and other transportcompanies make up this segment of the industry.
This sector is heavily concentrated; it is estimated that 25%of Canadian tour operators account for 90% of revenues.11
The trend toward a small number of large tour operators
and large number of small companies operating in well-defined niches is here to stay. According to the ConferenceBoard of Canada, there should be even more integration inthis sector where key players are expanding constantlythrough takeovers and mergers. Some tour operators havealready purchased shares in airlines, hotel chains or travelagencies. At present, three companies dominate theCanadian market.
In this highly competitive sector, new products anddestinations must constantly be introduced to remainprofitable. In 1997, the average profit margin within theindustry was 7.3%, an increase over 1996. To survive overthe long term, small firms must specialize in niches suchas cruises, adventure tourism or eco-tourism because theycannot compete with the big tour operators for the massmarket. With growing competition, tour operators tend tospecialize in the sale of particular products and destinations.The exchange rate also has a major impact on the activitiesof tour operators; those who offer packages to foreigndestinations purchase large quantities of tourism servicesin advance. As prices offered by suppliers has a directimpact on their profit margin, they have been hurt by the fallof the Canadian dollar against some foreign currencies. Onthe other hand, inbound tour operators (who receive foreignvisitors to Canada) sell Canadian products in Canadiandollars and can offer excellent value to foreign travellers.
Structure of Revenues and Expenses
Revenues of tour operators come primarily (77%) from thesale of packages in travel agencies. Among these packages,tours appear to be the most popular product, with 69% ofsales, followed by the sale of airline tickets. The provincesof Ontario, Quebec and British Columbia account for morethan 94% of all revenues in the industry.
Package tours to foreign destinations account for three-quarters of revenues of tour operators. Tours to Canadiandestinations sold to foreign travellers represent 22% of sales;the largest foreign markets are American (44%), French(12%) or Japanese (31%). The Canadian clientele are madeup primarily of pleasure travellers (69%). A far smallerproportion of tour operators’ revenues (8%) comes frombusiness travellers.
Although labour is the largest expense item for touroperators as well, wages, salaries and employee benefitsaccount for only 44% of operating expenses. Tour operatorsemploy four times as many employees as travel agencies(32 on average, compared to 7 or 8 for travel agencies);
Source: Annual Survey of Travel Agencies and Tour Operators, 1997.
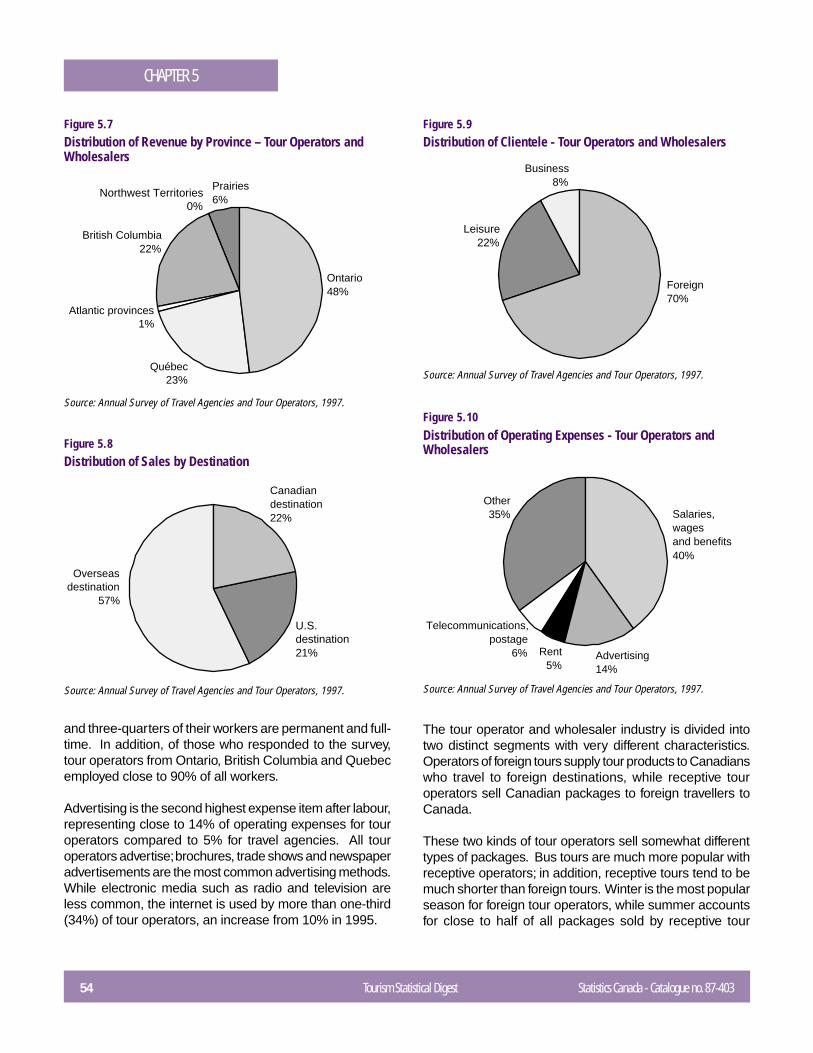
54 Tourism Statistical Digest Statistics Canada - Catalogue no. 87-403
CHAPTER 5
Figure 5.7Distribution of Revenue by Province – Tour Operators andWholesalers
Québec23%
British Columbia22%
Prairies6%
Atlantic provinces1%
Northwest Territories0%
Ontario48%
Figure 5.8Distribution of Sales by Destination
Canadian destination22%
Overseas destination
57%
U.S. destination21%
Figure 5.9Distribution of Clientele - Tour Operators and Wholesalers
Foreign70%
Business8%
Leisure22%
and three-quarters of their workers are permanent and full-time. In addition, of those who responded to the survey,tour operators from Ontario, British Columbia and Quebecemployed close to 90% of all workers.
Advertising is the second highest expense item after labour,representing close to 14% of operating expenses for touroperators compared to 5% for travel agencies. All touroperators advertise; brochures, trade shows and newspaperadvertisements are the most common advertising methods.While electronic media such as radio and television areless common, the internet is used by more than one-third(34%) of tour operators, an increase from 10% in 1995.
Figure 5.10Distribution of Operating Expenses - Tour Operators andWholesalers
Salaries, wages and benefits40%
Rent5%
Other35%
Advertising14%
Telecommunications, postage
6%
The tour operator and wholesaler industry is divided intotwo distinct segments with very different characteristics.Operators of foreign tours supply tour products to Canadianswho travel to foreign destinations, while receptive touroperators sell Canadian packages to foreign travellers toCanada.
These two kinds of tour operators sell somewhat differenttypes of packages. Bus tours are much more popular withreceptive operators; in addition, receptive tours tend to bemuch shorter than foreign tours. Winter is the most popularseason for foreign tour operators, while summer accountsfor close to half of all packages sold by receptive tour
Source: Annual Survey of Travel Agencies and Tour Operators, 1997.
Source: Annual Survey of Travel Agencies and Tour Operators, 1997.
Source: Annual Survey of Travel Agencies and Tour Operators, 1997.
Source: Annual Survey of Travel Agencies and Tour Operators, 1997.
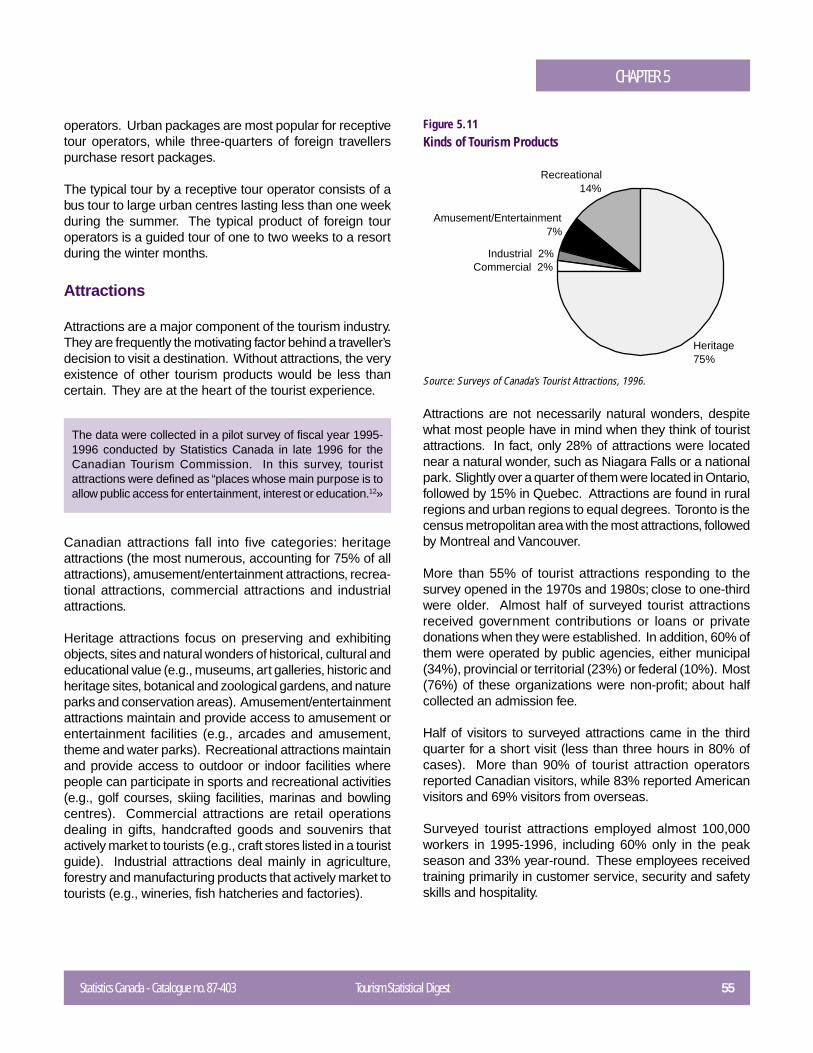
Statistics Canada - Catalogue no. 87-403 Tourism Statistical Digest 55
CHAPTER 5
operators. Urban packages are most popular for receptivetour operators, while three-quarters of foreign travellerspurchase resort packages.
The typical tour by a receptive tour operator consists of abus tour to large urban centres lasting less than one weekduring the summer. The typical product of foreign touroperators is a guided tour of one to two weeks to a resortduring the winter months.
Attractions
Attractions are a major component of the tourism industry.They are frequently the motivating factor behind a traveller’sdecision to visit a destination. Without attractions, the veryexistence of other tourism products would be less thancertain. They are at the heart of the tourist experience.
The data were collected in a pilot survey of fiscal year 1995-1996 conducted by Statistics Canada in late 1996 for theCanadian Tourism Commission. In this survey, touristattractions were defined as “places whose main purpose is toallow public access for entertainment, interest or education.12»
Canadian attractions fall into five categories: heritageattractions (the most numerous, accounting for 75% of allattractions), amusement/entertainment attractions, recrea-tional attractions, commercial attractions and industrialattractions.
Heritage attractions focus on preserving and exhibitingobjects, sites and natural wonders of historical, cultural andeducational value (e.g., museums, art galleries, historic andheritage sites, botanical and zoological gardens, and natureparks and conservation areas). Amusement/entertainmentattractions maintain and provide access to amusement orentertainment facilities (e.g., arcades and amusement,theme and water parks). Recreational attractions maintainand provide access to outdoor or indoor facilities wherepeople can participate in sports and recreational activities(e.g., golf courses, skiing facilities, marinas and bowlingcentres). Commercial attractions are retail operationsdealing in gifts, handcrafted goods and souvenirs thatactively market to tourists (e.g., craft stores listed in a touristguide). Industrial attractions deal mainly in agriculture,forestry and manufacturing products that actively market totourists (e.g., wineries, fish hatcheries and factories).
Figure 5.11Kinds of Tourism Products
Amusement/Entertainment7%
Recreational14%
Heritage75%
Commercial 2%Industrial 2%
Attractions are not necessarily natural wonders, despitewhat most people have in mind when they think of touristattractions. In fact, only 28% of attractions were locatednear a natural wonder, such as Niagara Falls or a nationalpark. Slightly over a quarter of them were located in Ontario,followed by 15% in Quebec. Attractions are found in ruralregions and urban regions to equal degrees. Toronto is thecensus metropolitan area with the most attractions, followedby Montreal and Vancouver.
More than 55% of tourist attractions responding to thesurvey opened in the 1970s and 1980s; close to one-thirdwere older. Almost half of surveyed tourist attractionsreceived government contributions or loans or privatedonations when they were established. In addition, 60% ofthem were operated by public agencies, either municipal(34%), provincial or territorial (23%) or federal (10%). Most(76%) of these organizations were non-profit; about halfcollected an admission fee.
Half of visitors to surveyed attractions came in the thirdquarter for a short visit (less than three hours in 80% ofcases). More than 90% of tourist attraction operatorsreported Canadian visitors, while 83% reported Americanvisitors and 69% visitors from overseas.
Surveyed tourist attractions employed almost 100,000workers in 1995-1996, including 60% only in the peakseason and 33% year-round. These employees receivedtraining primarily in customer service, security and safetyskills and hospitality.
Source: Surveys of Canada’s Tourist Attractions, 1996.
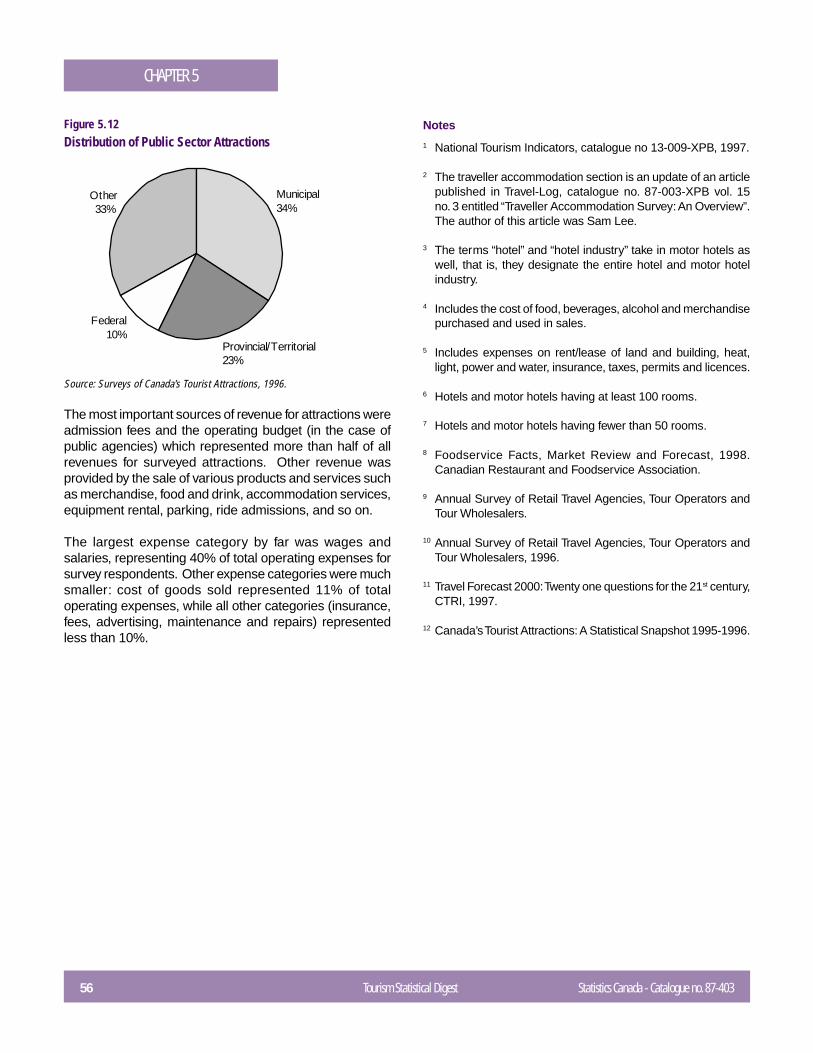
56 Tourism Statistical Digest Statistics Canada - Catalogue no. 87-403
CHAPTER 5
Figure 5.12Distribution of Public Sector Attractions
Municipal34%
Federal10%
Provincial/Territorial23%
Other33%
The most important sources of revenue for attractions wereadmission fees and the operating budget (in the case ofpublic agencies) which represented more than half of allrevenues for surveyed attractions. Other revenue wasprovided by the sale of various products and services suchas merchandise, food and drink, accommodation services,equipment rental, parking, ride admissions, and so on.
The largest expense category by far was wages andsalaries, representing 40% of total operating expenses forsurvey respondents. Other expense categories were muchsmaller: cost of goods sold represented 11% of totaloperating expenses, while all other categories (insurance,fees, advertising, maintenance and repairs) representedless than 10%.
Notes
1 National Tourism Indicators, catalogue no 13-009-XPB, 1997.
2 The traveller accommodation section is an update of an articlepublished in Travel-Log, catalogue no. 87-003-XPB vol. 15no. 3 entitled “Traveller Accommodation Survey: An Overview”.The author of this article was Sam Lee.
3 The terms “hotel” and “hotel industry” take in motor hotels aswell, that is, they designate the entire hotel and motor hotelindustry.
4 Includes the cost of food, beverages, alcohol and merchandisepurchased and used in sales.
5 Includes expenses on rent/lease of land and building, heat,light, power and water, insurance, taxes, permits and licences.
6 Hotels and motor hotels having at least 100 rooms.
7 Hotels and motor hotels having fewer than 50 rooms.
8 Foodservice Facts, Market Review and Forecast, 1998.Canadian Restaurant and Foodservice Association.
9 Annual Survey of Retail Travel Agencies, Tour Operators andTour Wholesalers.
10 Annual Survey of Retail Travel Agencies, Tour Operators andTour Wholesalers, 1996.
11 Travel Forecast 2000: Twenty one questions for the 21st century,CTRI, 1997.
12 Canada’s Tourist Attractions: A Statistical Snapshot 1995-1996.
Source: Surveys of Canada’s Tourist Attractions, 1996.
CHAPTER 6TOURISM IN CANADA AND ITS VARIOUS ECONOMIC FACETS1
Statistics Canada - Catalogue no. 87-403 Tourism Statistical Digest 57
Introduction
Tourism affects a number of industries. Hotels, travel agencies, airlinesand restaurants are to varying degrees affected by tourism. Thus, tourism isnot just one industry, but an amalgam of several, and the tourismphenomenon raises a number of questions because of its complexity, itsvarious ramifications and its scope.
What is the real magnitude of tourism in Canada? What are the total tourismexpenditures in Canada? Is it possible to identify a trend in theseexpenditures, inflation-adjusted or otherwise? What proportions of theseexpenditures are made by foreign and Canadian visitors? Has the latterproportion grown or declined in recent years? To what extent does tourismcontribute to the output of goods and services within the overall economy?How many jobs are generated by tourism activity? What is the inflation ratefor tourism commodities, and is this rate rising faster than for the economyas a whole? What is tourism’s share in the total revenue from a good orservice? What government revenues are attributable to tourism?
This chapter will attempt to answer these various questions, drawing oninformation contained in the Tourism Satellite Account (TSA) and the NationalTourism Indicators (NTI). The analysis will focus on 1997 and 19982, whileproviding a historical perspective.
Before beginning, it is important to identify clearly what we are seeking tomeasure. The definition of tourism used in the TSA and the NTI is the oneadopted by the World Tourism Organization and the United Nations StatisticalCommission. It reads as follows: “the activities of persons travelling to andstaying in places outside their usual environment for not more than oneconsecutive year for leisure, business and other purposes.” Clearly, thisdefinition is both broad and general – broad because it includes not onlypersonal trips but also trips made primarily for business; and general,because it does not attempt to clarify the concept of usual environment.Each country is therefore free to use its own criteria in order to arrive at apractical application and reflect its own particular circumstances. In Canada,the distance criterion is used. Thus, tourism is generally considered to consistof the trips3 of Canadians travelling within Canada for a distance of
Jacques Delisle and Sylvain Venne,Income and ExpenditureAccounts DivisionStatistics Canada
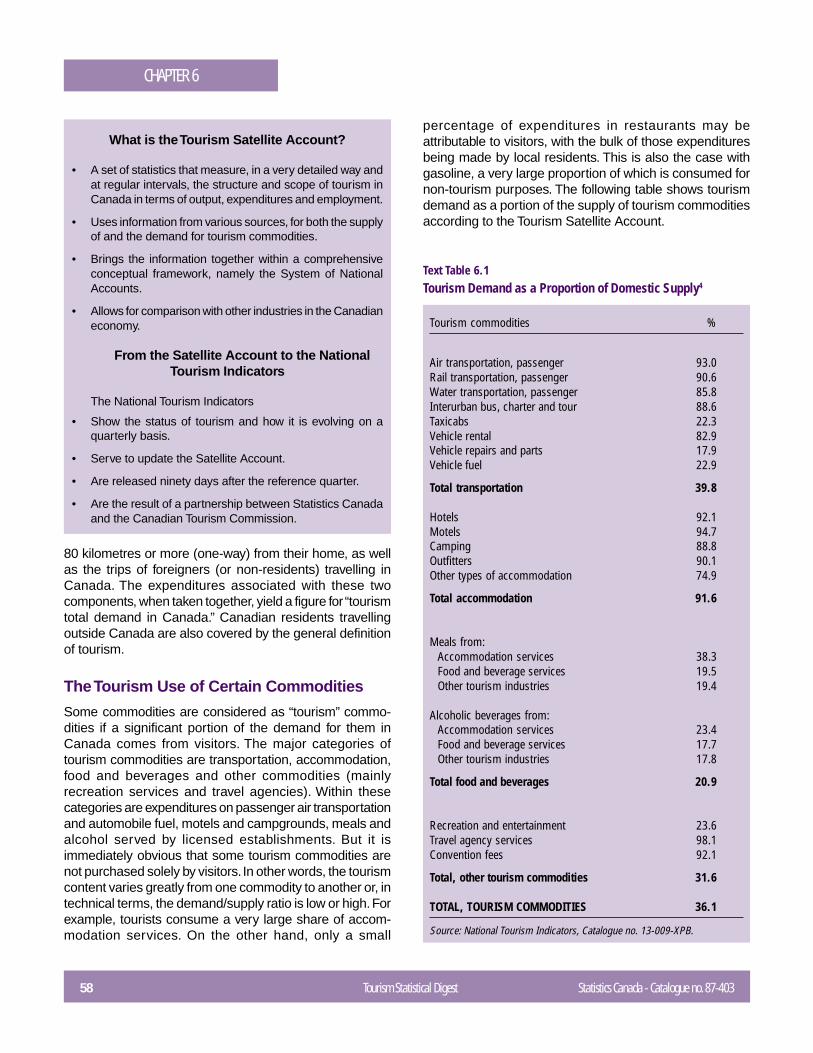
58 Tourism Statistical Digest Statistics Canada - Catalogue no. 87-403
CHAPTER 6
What is the Tourism Satellite Account?
• A set of statistics that measure, in a very detailed way andat regular intervals, the structure and scope of tourism inCanada in terms of output, expenditures and employment.
• Uses information from various sources, for both the supplyof and the demand for tourism commodities.
• Brings the information together within a comprehensiveconceptual framework, namely the System of NationalAccounts.
• Allows for comparison with other industries in the Canadianeconomy.
From the Satellite Account to the NationalTourism Indicators
The National Tourism Indicators
• Show the status of tourism and how it is evolving on aquarterly basis.
• Serve to update the Satellite Account.
• Are released ninety days after the reference quarter.
• Are the result of a partnership between Statistics Canadaand the Canadian Tourism Commission.
80 kilometres or more (one-way) from their home, as wellas the trips of foreigners (or non-residents) travelling inCanada. The expenditures associated with these twocomponents, when taken together, yield a figure for “tourismtotal demand in Canada.” Canadian residents travellingoutside Canada are also covered by the general definitionof tourism.
The Tourism Use of Certain Commodities
Some commodities are considered as “tourism” commo-dities if a significant portion of the demand for them inCanada comes from visitors. The major categories oftourism commodities are transportation, accommodation,food and beverages and other commodities (mainlyrecreation services and travel agencies). Within thesecategories are expenditures on passenger air transportationand automobile fuel, motels and campgrounds, meals andalcohol served by licensed establishments. But it isimmediately obvious that some tourism commodities arenot purchased solely by visitors. In other words, the tourismcontent varies greatly from one commodity to another or, intechnical terms, the demand/supply ratio is low or high. Forexample, tourists consume a very large share of accom-modation services. On the other hand, only a small
percentage of expenditures in restaurants may beattributable to visitors, with the bulk of those expendituresbeing made by local residents. This is also the case withgasoline, a very large proportion of which is consumed fornon-tourism purposes. The following table shows tourismdemand as a portion of the supply of tourism commoditiesaccording to the Tourism Satellite Account.
Text Table 6.1Tourism Demand as a Proportion of Domestic Supply4
Tourism commodities %
Air transportation, passenger 93.0Rail transportation, passenger 90.6Water transportation, passenger 85.8Interurban bus, charter and tour 88.6Taxicabs 22.3Vehicle rental 82.9Vehicle repairs and parts 17.9Vehicle fuel 22.9
Total transportation 39.8
Hotels 92.1Motels 94.7Camping 88.8Outfitters 90.1Other types of accommodation 74.9
Total accommodation 91.6
Meals from:Accommodation services 38.3Food and beverage services 19.5Other tourism industries 19.4
Alcoholic beverages from:Accommodation services 23.4Food and beverage services 17.7Other tourism industries 17.8
Total food and beverages 20.9
Recreation and entertainment 23.6Travel agency services 98.1Convention fees 92.1
Total, other tourism commodities 31.6
TOTAL, TOURISM COMMODITIES 36.1
Source: National Tourism Indicators, Catalogue no. 13-009-XPB.
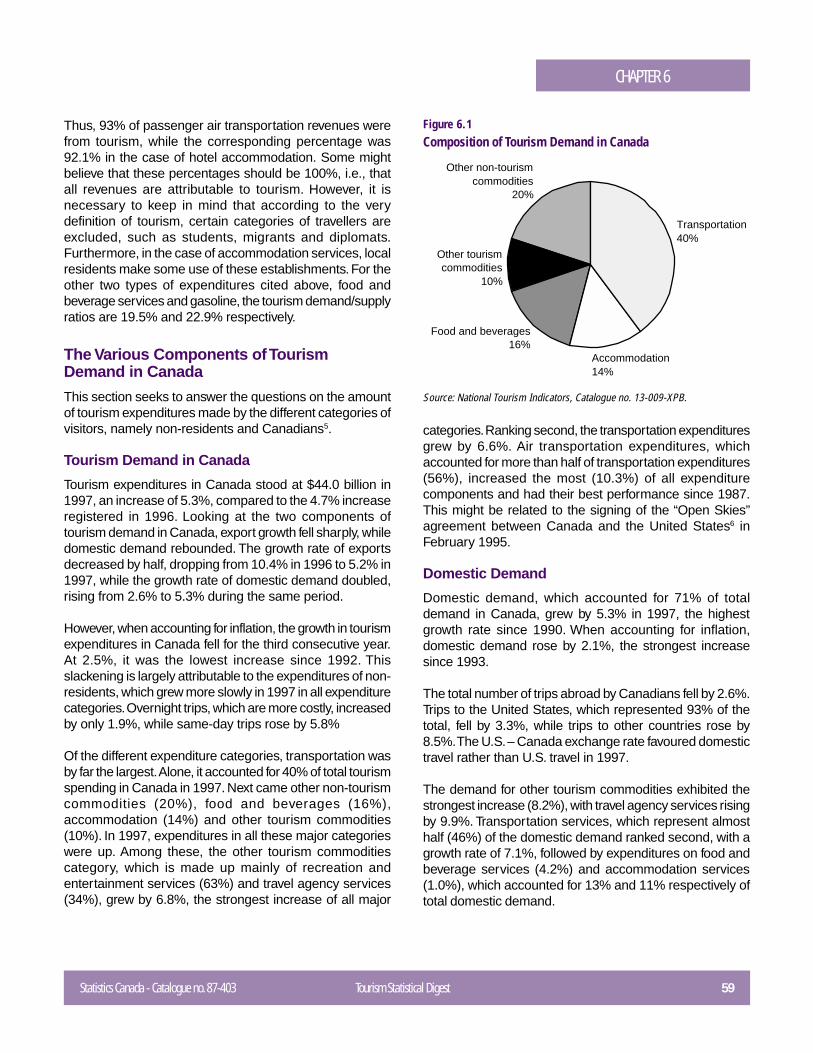
Statistics Canada - Catalogue no. 87-403 Tourism Statistical Digest 59
CHAPTER 6
Thus, 93% of passenger air transportation revenues werefrom tourism, while the corresponding percentage was92.1% in the case of hotel accommodation. Some mightbelieve that these percentages should be 100%, i.e., thatall revenues are attributable to tourism. However, it isnecessary to keep in mind that according to the verydefinition of tourism, certain categories of travellers areexcluded, such as students, migrants and diplomats.Furthermore, in the case of accommodation services, localresidents make some use of these establishments. For theother two types of expenditures cited above, food andbeverage services and gasoline, the tourism demand/supplyratios are 19.5% and 22.9% respectively.
The Various Components of TourismDemand in Canada
This section seeks to answer the questions on the amountof tourism expenditures made by the different categories ofvisitors, namely non-residents and Canadians5.
Tourism Demand in Canada
Tourism expenditures in Canada stood at $44.0 billion in1997, an increase of 5.3%, compared to the 4.7% increaseregistered in 1996. Looking at the two components oftourism demand in Canada, export growth fell sharply, whiledomestic demand rebounded. The growth rate of exportsdecreased by half, dropping from 10.4% in 1996 to 5.2% in1997, while the growth rate of domestic demand doubled,rising from 2.6% to 5.3% during the same period.
However, when accounting for inflation, the growth in tourismexpenditures in Canada fell for the third consecutive year.At 2.5%, it was the lowest increase since 1992. Thisslackening is largely attributable to the expenditures of non-residents, which grew more slowly in 1997 in all expenditurecategories. Overnight trips, which are more costly, increasedby only 1.9%, while same-day trips rose by 5.8%
Of the different expenditure categories, transportation wasby far the largest. Alone, it accounted for 40% of total tourismspending in Canada in 1997. Next came other non-tourismcommodities (20%), food and beverages (16%),accommodation (14%) and other tourism commodities(10%). In 1997, expenditures in all these major categorieswere up. Among these, the other tourism commoditiescategory, which is made up mainly of recreation andentertainment services (63%) and travel agency services(34%), grew by 6.8%, the strongest increase of all major
Figure 6.1Composition of Tourism Demand in Canada
Accommodation14%
Other tourism commodities
10%
Other non-tourism commodities
20%
Transportation40%
Food and beverages16%
categories. Ranking second, the transportation expendituresgrew by 6.6%. Air transportation expenditures, whichaccounted for more than half of transportation expenditures(56%), increased the most (10.3%) of all expenditurecomponents and had their best performance since 1987.This might be related to the signing of the “Open Skies”agreement between Canada and the United States6 inFebruary 1995.
Domestic Demand
Domestic demand, which accounted for 71% of totaldemand in Canada, grew by 5.3% in 1997, the highestgrowth rate since 1990. When accounting for inflation,domestic demand rose by 2.1%, the strongest increasesince 1993.
The total number of trips abroad by Canadians fell by 2.6%.Trips to the United States, which represented 93% of thetotal, fell by 3.3%, while trips to other countries rose by8.5%. The U.S. – Canada exchange rate favoured domestictravel rather than U.S. travel in 1997.
The demand for other tourism commodities exhibited thestrongest increase (8.2%), with travel agency services risingby 9.9%. Transportation services, which represent almosthalf (46%) of the domestic demand ranked second, with agrowth rate of 7.1%, followed by expenditures on food andbeverage services (4.2%) and accommodation services(1.0%), which accounted for 13% and 11% respectively oftotal domestic demand.
Source: National Tourism Indicators, Catalogue no. 13-009-XPB.
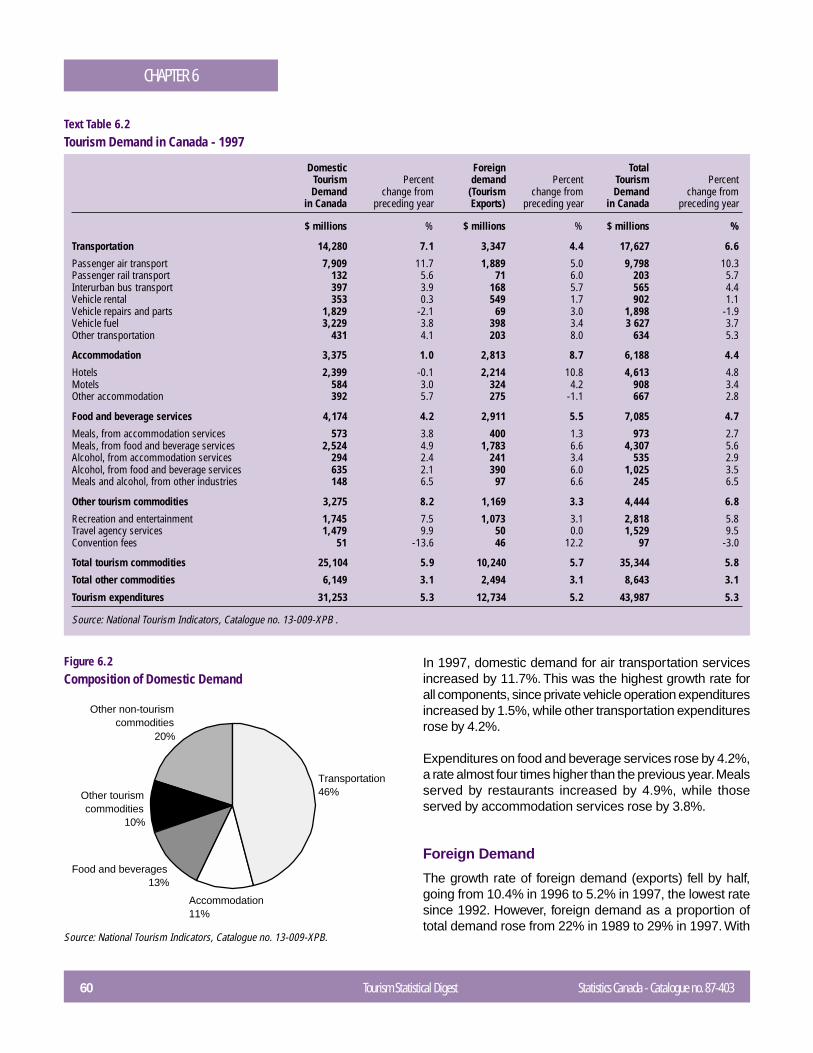
60 Tourism Statistical Digest Statistics Canada - Catalogue no. 87-403
CHAPTER 6
Domestic Foreign TotalTourism Percent demand Percent Tourism PercentDemand change from (Tourism change from Demand change from
in Canada preceding year Exports) preceding year in Canada preceding year
$ millions % $ millions % $ millions %
Transportation 14,280 7.1 3,347 4.4 17,627 6.6
Passenger air transport 7,909 11.7 1,889 5.0 9,798 10.3Passenger rail transport 132 5.6 71 6.0 203 5.7Interurban bus transport 397 3.9 168 5.7 565 4.4Vehicle rental 353 0.3 549 1.7 902 1.1Vehicle repairs and parts 1,829 -2.1 69 3.0 1,898 -1.9Vehicle fuel 3,229 3.8 398 3.4 3 627 3.7Other transportation 431 4.1 203 8.0 634 5.3
Accommodation 3,375 1.0 2,813 8.7 6,188 4.4
Hotels 2,399 -0.1 2,214 10.8 4,613 4.8Motels 584 3.0 324 4.2 908 3.4Other accommodation 392 5.7 275 -1.1 667 2.8
Food and beverage services 4,174 4.2 2,911 5.5 7,085 4.7
Meals, from accommodation services 573 3.8 400 1.3 973 2.7Meals, from food and beverage services 2,524 4.9 1,783 6.6 4,307 5.6Alcohol, from accommodation services 294 2.4 241 3.4 535 2.9Alcohol, from food and beverage services 635 2.1 390 6.0 1,025 3.5Meals and alcohol, from other industries 148 6.5 97 6.6 245 6.5
Other tourism commodities 3,275 8.2 1,169 3.3 4,444 6.8
Recreation and entertainment 1,745 7.5 1,073 3.1 2,818 5.8Travel agency services 1,479 9.9 50 0.0 1,529 9.5Convention fees 51 -13.6 46 12.2 97 -3.0
Total tourism commodities 25,104 5.9 10,240 5.7 35,344 5.8
Total other commodities 6,149 3.1 2,494 3.1 8,643 3.1
Tourism expenditures 31,253 5.3 12,734 5.2 43,987 5.3
Source: National Tourism Indicators, Catalogue no. 13-009-XPB .
Text Table 6.2Tourism Demand in Canada - 1997
Accommodation11%
Other tourism commodities
10%
Other non-tourism commodities
20%
Transportation46%
Food and beverages13%
In 1997, domestic demand for air transportation servicesincreased by 11.7%. This was the highest growth rate forall components, since private vehicle operation expendituresincreased by 1.5%, while other transportation expendituresrose by 4.2%.
Expenditures on food and beverage services rose by 4.2%,a rate almost four times higher than the previous year. Mealsserved by restaurants increased by 4.9%, while thoseserved by accommodation services rose by 3.8%.
Foreign Demand
The growth rate of foreign demand (exports) fell by half,going from 10.4% in 1996 to 5.2% in 1997, the lowest ratesince 1992. However, foreign demand as a proportion oftotal demand rose from 22% in 1989 to 29% in 1997. With
Figure 6.2Composition of Domestic Demand
Source: National Tourism Indicators, Catalogue no. 13-009-XPB.
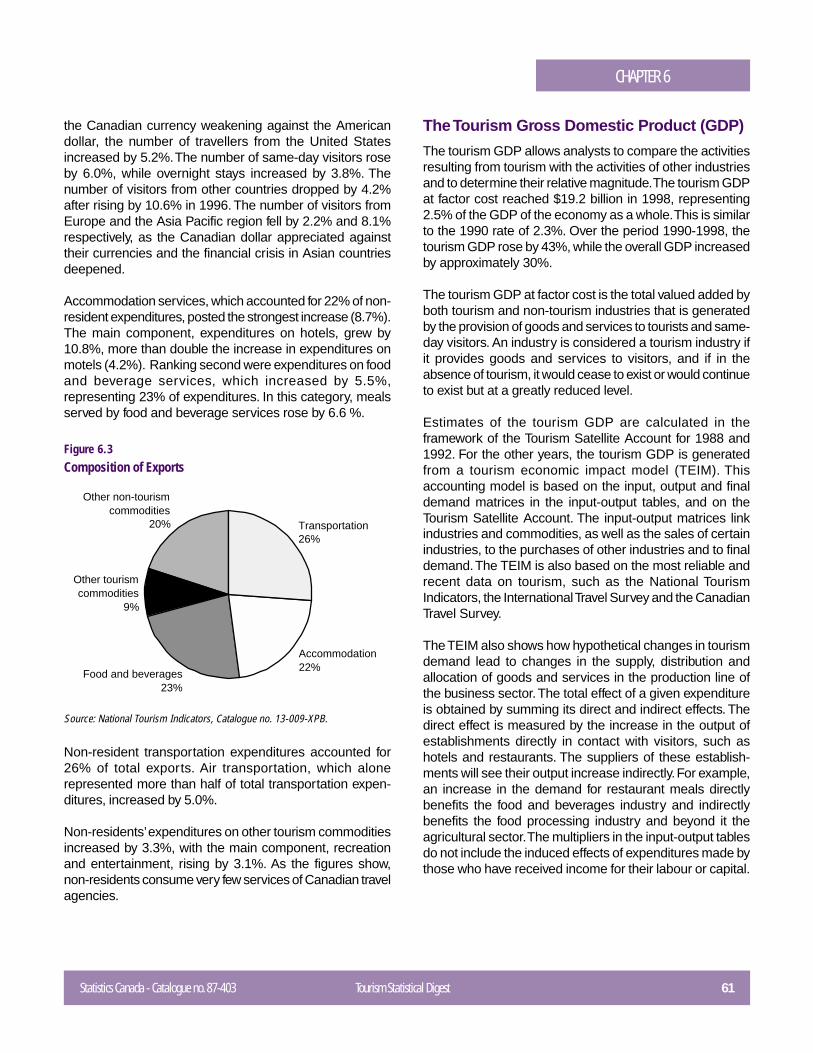
Statistics Canada - Catalogue no. 87-403 Tourism Statistical Digest 61
CHAPTER 6
the Canadian currency weakening against the Americandollar, the number of travellers from the United Statesincreased by 5.2%. The number of same-day visitors roseby 6.0%, while overnight stays increased by 3.8%. Thenumber of visitors from other countries dropped by 4.2%after rising by 10.6% in 1996. The number of visitors fromEurope and the Asia Pacific region fell by 2.2% and 8.1%respectively, as the Canadian dollar appreciated againsttheir currencies and the financial crisis in Asian countriesdeepened.
Accommodation services, which accounted for 22% of non-resident expenditures, posted the strongest increase (8.7%).The main component, expenditures on hotels, grew by10.8%, more than double the increase in expenditures onmotels (4.2%). Ranking second were expenditures on foodand beverage services, which increased by 5.5%,representing 23% of expenditures. In this category, mealsserved by food and beverage services rose by 6.6 %.
Figure 6.3Composition of Exports
Non-resident transportation expenditures accounted for26% of total exports. Air transportation, which alonerepresented more than half of total transportation expen-ditures, increased by 5.0%.
Non-residents’ expenditures on other tourism commoditiesincreased by 3.3%, with the main component, recreationand entertainment, rising by 3.1%. As the figures show,non-residents consume very few services of Canadian travelagencies.
The Tourism Gross Domestic Product (GDP)
The tourism GDP allows analysts to compare the activitiesresulting from tourism with the activities of other industriesand to determine their relative magnitude. The tourism GDPat factor cost reached $19.2 billion in 1998, representing2.5% of the GDP of the economy as a whole. This is similarto the 1990 rate of 2.3%. Over the period 1990-1998, thetourism GDP rose by 43%, while the overall GDP increasedby approximately 30%.
The tourism GDP at factor cost is the total valued added byboth tourism and non-tourism industries that is generatedby the provision of goods and services to tourists and same-day visitors. An industry is considered a tourism industry ifit provides goods and services to visitors, and if in theabsence of tourism, it would cease to exist or would continueto exist but at a greatly reduced level.
Estimates of the tourism GDP are calculated in theframework of the Tourism Satellite Account for 1988 and1992. For the other years, the tourism GDP is generatedfrom a tourism economic impact model (TEIM). Thisaccounting model is based on the input, output and finaldemand matrices in the input-output tables, and on theTourism Satellite Account. The input-output matrices linkindustries and commodities, as well as the sales of certainindustries, to the purchases of other industries and to finaldemand. The TEIM is also based on the most reliable andrecent data on tourism, such as the National TourismIndicators, the International Travel Survey and the CanadianTravel Survey.
The TEIM also shows how hypothetical changes in tourismdemand lead to changes in the supply, distribution andallocation of goods and services in the production line ofthe business sector. The total effect of a given expenditureis obtained by summing its direct and indirect effects. Thedirect effect is measured by the increase in the output ofestablishments directly in contact with visitors, such ashotels and restaurants. The suppliers of these establish-ments will see their output increase indirectly. For example,an increase in the demand for restaurant meals directlybenefits the food and beverages industry and indirectlybenefits the food processing industry and beyond it theagricultural sector. The multipliers in the input-output tablesdo not include the induced effects of expenditures made bythose who have received income for their labour or capital.
Accommodation22%
Other tourism commodities
9%
Other non-tourism commodities
20% Transportation26%
Food and beverages23%
Source: National Tourism Indicators, Catalogue no. 13-009-XPB.
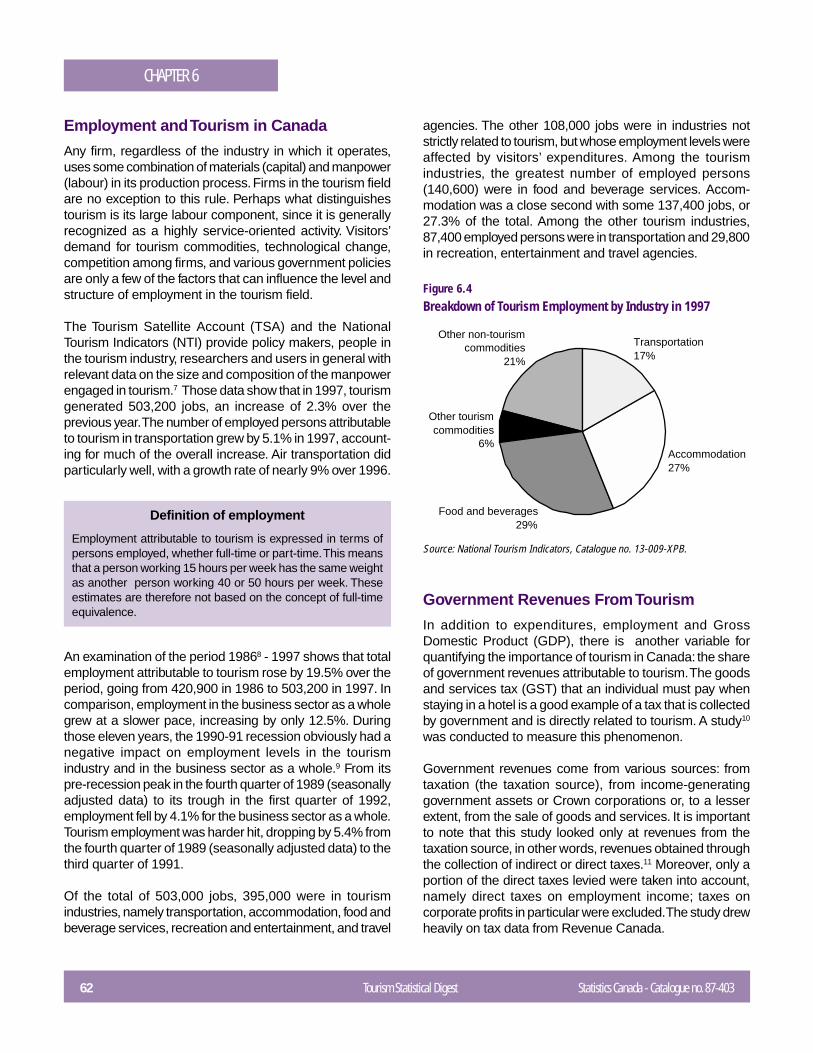
62 Tourism Statistical Digest Statistics Canada - Catalogue no. 87-403
CHAPTER 6
Definition of employment
Employment attributable to tourism is expressed in terms ofpersons employed, whether full-time or part-time. This meansthat a person working 15 hours per week has the same weightas another person working 40 or 50 hours per week. Theseestimates are therefore not based on the concept of full-timeequivalence.
Employment and Tourism in Canada
Any firm, regardless of the industry in which it operates,uses some combination of materials (capital) and manpower(labour) in its production process. Firms in the tourism fieldare no exception to this rule. Perhaps what distinguishestourism is its large labour component, since it is generallyrecognized as a highly service-oriented activity. Visitors’demand for tourism commodities, technological change,competition among firms, and various government policiesare only a few of the factors that can influence the level andstructure of employment in the tourism field.
The Tourism Satellite Account (TSA) and the NationalTourism Indicators (NTI) provide policy makers, people inthe tourism industry, researchers and users in general withrelevant data on the size and composition of the manpowerengaged in tourism.7 Those data show that in 1997, tourismgenerated 503,200 jobs, an increase of 2.3% over theprevious year. The number of employed persons attributableto tourism in transportation grew by 5.1% in 1997, account-ing for much of the overall increase. Air transportation didparticularly well, with a growth rate of nearly 9% over 1996.
An examination of the period 19868 - 1997 shows that totalemployment attributable to tourism rose by 19.5% over theperiod, going from 420,900 in 1986 to 503,200 in 1997. Incomparison, employment in the business sector as a wholegrew at a slower pace, increasing by only 12.5%. Duringthose eleven years, the 1990-91 recession obviously had anegative impact on employment levels in the tourismindustry and in the business sector as a whole.9 From itspre-recession peak in the fourth quarter of 1989 (seasonallyadjusted data) to its trough in the first quarter of 1992,employment fell by 4.1% for the business sector as a whole.Tourism employment was harder hit, dropping by 5.4% fromthe fourth quarter of 1989 (seasonally adjusted data) to thethird quarter of 1991.
Of the total of 503,000 jobs, 395,000 were in tourismindustries, namely transportation, accommodation, food andbeverage services, recreation and entertainment, and travel
agencies. The other 108,000 jobs were in industries notstrictly related to tourism, but whose employment levels wereaffected by visitors’ expenditures. Among the tourismindustries, the greatest number of employed persons(140,600) were in food and beverage services. Accom-modation was a close second with some 137,400 jobs, or27.3% of the total. Among the other tourism industries,87,400 employed persons were in transportation and 29,800in recreation, entertainment and travel agencies.
Figure 6.4Breakdown of Tourism Employment by Industry in 1997
Government Revenues From Tourism
In addition to expenditures, employment and GrossDomestic Product (GDP), there is another variable forquantifying the importance of tourism in Canada: the shareof government revenues attributable to tourism. The goodsand services tax (GST) that an individual must pay whenstaying in a hotel is a good example of a tax that is collectedby government and is directly related to tourism. A study10
was conducted to measure this phenomenon.
Government revenues come from various sources: fromtaxation (the taxation source), from income-generatinggovernment assets or Crown corporations or, to a lesserextent, from the sale of goods and services. It is importantto note that this study looked only at revenues from thetaxation source, in other words, revenues obtained throughthe collection of indirect or direct taxes.11 Moreover, only aportion of the direct taxes levied were taken into account,namely direct taxes on employment income; taxes oncorporate profits in particular were excluded. The study drewheavily on tax data from Revenue Canada.
Accommodation27%
Other tourism commodities
6%
Other non-tourism commodities
21%
Transportation17%
Food and beverages29%
Source: National Tourism Indicators, Catalogue no. 13-009-XPB.
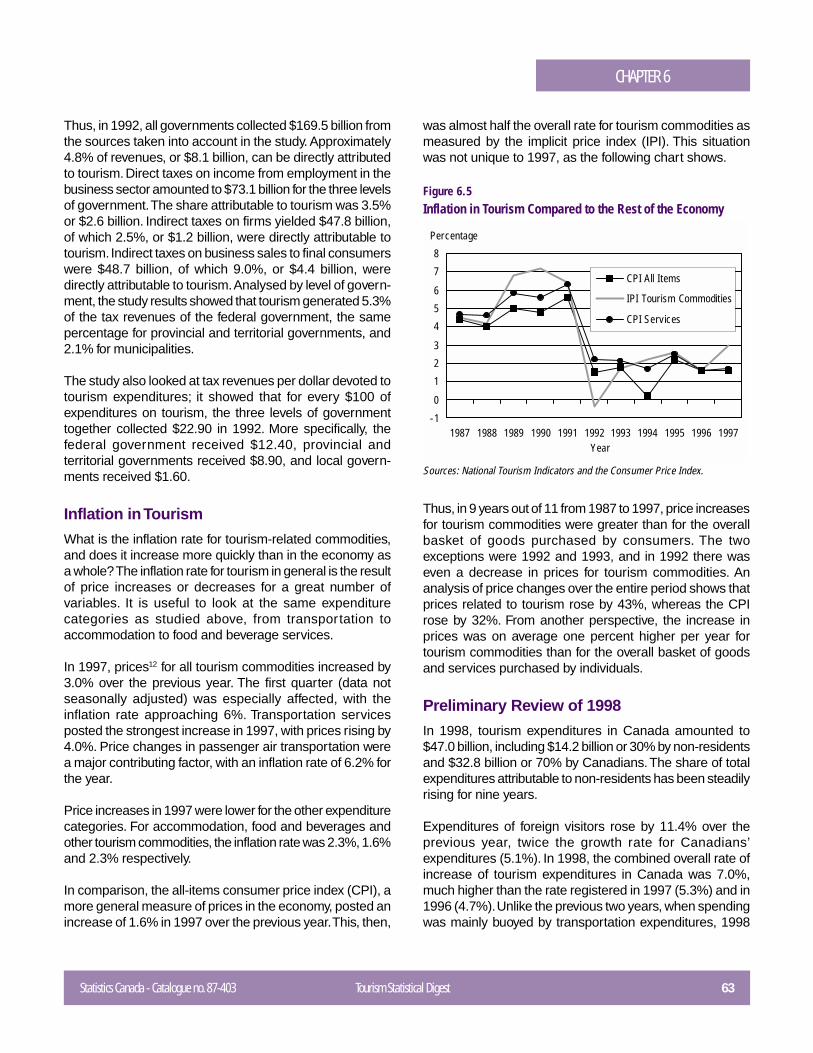
Statistics Canada - Catalogue no. 87-403 Tourism Statistical Digest 63
CHAPTER 6
Thus, in 1992, all governments collected $169.5 billion fromthe sources taken into account in the study. Approximately4.8% of revenues, or $8.1 billion, can be directly attributedto tourism. Direct taxes on income from employment in thebusiness sector amounted to $73.1 billion for the three levelsof government. The share attributable to tourism was 3.5%or $2.6 billion. Indirect taxes on firms yielded $47.8 billion,of which 2.5%, or $1.2 billion, were directly attributable totourism. Indirect taxes on business sales to final consumerswere $48.7 billion, of which 9.0%, or $4.4 billion, weredirectly attributable to tourism. Analysed by level of govern-ment, the study results showed that tourism generated 5.3%of the tax revenues of the federal government, the samepercentage for provincial and territorial governments, and2.1% for municipalities.
The study also looked at tax revenues per dollar devoted totourism expenditures; it showed that for every $100 ofexpenditures on tourism, the three levels of governmenttogether collected $22.90 in 1992. More specifically, thefederal government received $12.40, provincial andterritorial governments received $8.90, and local govern-ments received $1.60.
Inflation in Tourism
What is the inflation rate for tourism-related commodities,and does it increase more quickly than in the economy asa whole? The inflation rate for tourism in general is the resultof price increases or decreases for a great number ofvariables. It is useful to look at the same expenditurecategories as studied above, from transportation toaccommodation to food and beverage services.
In 1997, prices12 for all tourism commodities increased by3.0% over the previous year. The first quarter (data notseasonally adjusted) was especially affected, with theinflation rate approaching 6%. Transportation servicesposted the strongest increase in 1997, with prices rising by4.0%. Price changes in passenger air transportation werea major contributing factor, with an inflation rate of 6.2% forthe year.
Price increases in 1997 were lower for the other expenditurecategories. For accommodation, food and beverages andother tourism commodities, the inflation rate was 2.3%, 1.6%and 2.3% respectively.
In comparison, the all-items consumer price index (CPI), amore general measure of prices in the economy, posted anincrease of 1.6% in 1997 over the previous year. This, then,
was almost half the overall rate for tourism commodities asmeasured by the implicit price index (IPI). This situationwas not unique to 1997, as the following chart shows.
Figure 6.5Inflation in Tourism Compared to the Rest of the Economy
Thus, in 9 years out of 11 from 1987 to 1997, price increasesfor tourism commodities were greater than for the overallbasket of goods purchased by consumers. The twoexceptions were 1992 and 1993, and in 1992 there waseven a decrease in prices for tourism commodities. Ananalysis of price changes over the entire period shows thatprices related to tourism rose by 43%, whereas the CPIrose by 32%. From another perspective, the increase inprices was on average one percent higher per year fortourism commodities than for the overall basket of goodsand services purchased by individuals.
Preliminary Review of 1998
In 1998, tourism expenditures in Canada amounted to$47.0 billion, including $14.2 billion or 30% by non-residentsand $32.8 billion or 70% by Canadians. The share of totalexpenditures attributable to non-residents has been steadilyrising for nine years.
Expenditures of foreign visitors rose by 11.4% over theprevious year, twice the growth rate for Canadians’expenditures (5.1%). In 1998, the combined overall rate ofincrease of tourism expenditures in Canada was 7.0%,much higher than the rate registered in 1997 (5.3%) and in1996 (4.7%). Unlike the previous two years, when spendingwas mainly buoyed by transportation expenditures, 1998
-1
0
1
2
3
4
5
6
7
8
1987 1988 1989 1990 1991 1992 1993 1994 1995 1996 1997Year
Percentage
CPI All Items
IPI Tourism Commodities
CPI Services
Sources: National Tourism Indicators and the Consumer Price Index.
64 Tourism Statistical Digest Statistics Canada - Catalogue no. 87-403
CHAPTER 6
was marked by sizeable gains in expenditures onaccommodation (10.7%) and food and beverages (9.0 %).
After correcting for inflation, tourism expenditures roseconsiderably in Canada in 1998 (5.0%), ending a downwardtrend observed since 1995. The sizeable increase (9.0%)in the expenditures of non-residents was once again themain source of growth in overall demand, with Canadiansincreasing their expenditures by 3.3%. In 1998, the numberof Americans travelling to Canada increased by 8.3% over1997 as they continued to take advantage of the weakCanadian dollar. The number of overnight trips, which aremore costly, grew by 11.1%, almost double the growth rateobserved for same-day visits (6.9%). However, the situationfor visitors from Europe or the Asia Pacific region was notnearly as favourable. The number of European visitors fellfor the second time this decade (-2.4%), while the numberof visitors from the Asia Pacific region fell even more sharply(-19.5%).
Canada’s travel account balance (including passenger fares)–the difference between the expenditures of foreign visitorsin Canada and those of Canadian residents abroad–stoodat minus $3.3 billion in 1998, representing the lowest deficitin ten years. This situation resulted from a greater numberof American visitors to Canada and the fact that almost15% more Canadian visitors decided to stay home in 1998.
Price Increases in Tourism Commodities Outpace theConsumer Price Index
The overall tourism inflation rate as measured by the implicitindex of tourism commodity prices was 2.1% in 1998,compared to 3.0% in the previous year. By comparison, theConsumer Price Index (CPI) for all goods and services, amore general measure of price changes, rose only slightly(1%) during the year. The greatest price increase was inaccommodation (4.5%), with a more modest increase intransportation prices (1.1 %).
More Jobs Generated by Tourism
In 1998, tourism generated a total of 518,000 full-time andpart-time jobs, an increase of 3.0% over the previous year.Especially good results were obtained in the airtransportation sector, with an increase in the number oftravellers. After outpacing the rate of job growth in thebusiness sector for the previous three years, in 1998,tourism-related job growth was comparable to that of thebusiness sector as a whole.
Summary and Conclusion
The Tourism Satellite Account and the National TourismIndicators are a major source of information for analysingthe tourism sector in Canada. This article sought to answervarious questions concerning the impact of tourism in termsof the value of expenditures made by the different categoriesof visitors, the employment attributable to tourism, and theamounts that governments receive from tourism in the formof taxes. The size of the amounts involved shows thesignificant role of tourism in the Canadian economy.
Furthermore, the various changes that are currently takingplace within our society (such as the growing use of theinternet, the globalization of trade, the near-elimination ofnational borders in Europe and the retirement of the babyboomers) will undoubtedly, in the fairly near future, have adirect impact on tourism in both Canada and the rest of theworld.
Notes
1 The original version was written in French.
2 Using data available on April 1st 1999.
3 Not all trips constitute tourism. Not included are commuting,trips for the purpose of education or work in a new location, ortrips made by migrants, diplomats or members of the ArmedForces on assignment, as well as flight personnel.
4 Percentages are based on the 1992 reference year.
5 Spending by non-residents is also referred to as “exports” or“foreign demand” and spending by Canadians in the countryas “domestic demand”.
6 See Travel Log, Catalogue no. 87-003, Vol. 18 no.3 The US-Canada Open Skies Agreement: Three Years Later.
7 Statistics Canada’s Income and Expenditure Accounts Divisionis currently undertaking a major effort to set up a module onhuman resources for tourism, which would supplement the TSAand NTI. The module would serve to extend and disaggregatethe current measures of employment and wages and use themin combination with socio-demographic variables such as sex,age, education level and type of occupation.
8 First year for which data are available from the National TourismIndicators.
Statistics Canada - Catalogue no. 87-403 Tourism Statistical Digest 65
CHAPTER 6
9 There is usually some time lag between a drop in output andfirms’ decision to lay off employees. Similarly, once businesspicks up, firms generally prefer to wait a while before callingback all their employees.
10 This section draws on the broad outlines of a study conductedby Statistics Canada’s Income and Expenditure AccountsDivision for the Canadian Tourism Commission, entitled“Estimates of Government Revenues Attributable to Tourism,1992”. The reader should note that some revisions were madeto the totals estimated for various taxes after the study wasreleased.
11 Indirect taxes are mainly associated with expenditures, whiledirect taxes are primarily associated with income.
12 These estimates are derived from implicit price indexes; that is,they are obtained by dividing expenditure estimates in currentprices by those in constant prices for the base year (1992). Inthis way, the prices reflect not only pure price changes but alsochanges in the expenditure weighting pattern.
CHAPTER 7REGIONAL PORTRAIT
66 Tourism Statistical Digest Statistics Canada - Catalogue no. 87-403
Profile of Tourism in Canada’s Tourism Regions
Lessons Learned from the Analysis of the CTS and ITS Results for theMerger of Southwestern Ontario and Festival Country
Tourism Generating Regions in Canada: Factors Associated with TravelPatterns and Tourist Behavior
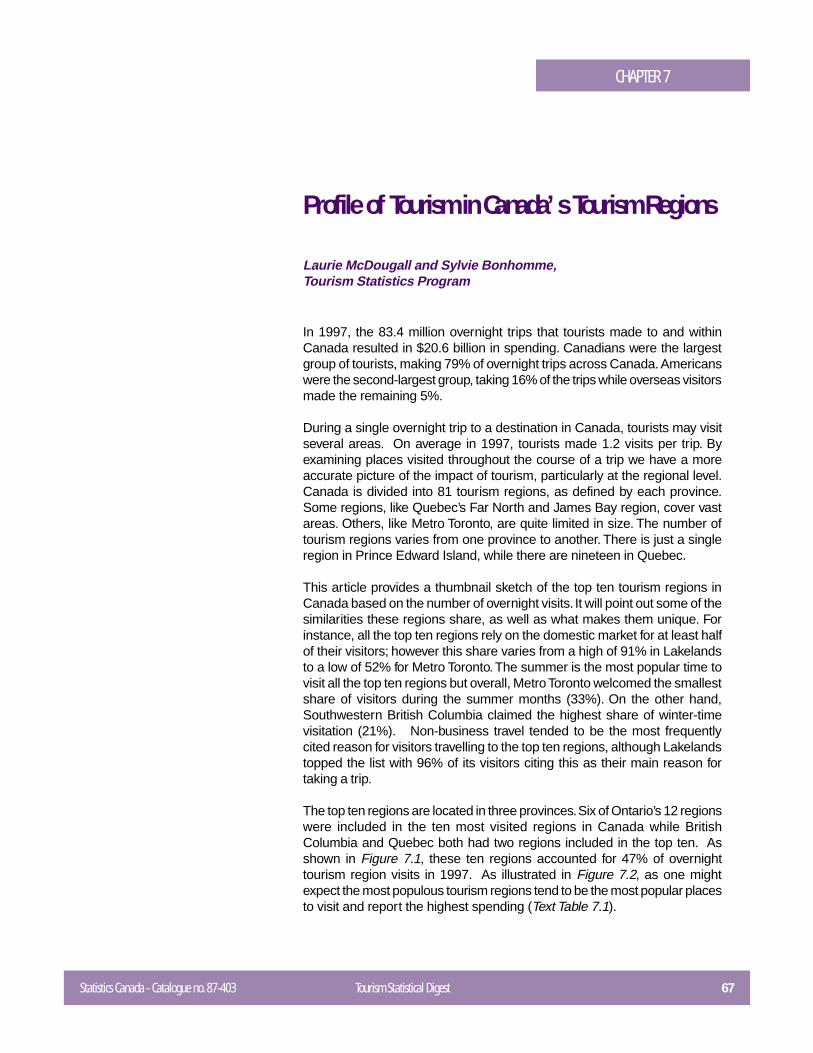
Statistics Canada - Catalogue no. 87-403 Tourism Statistical Digest 67
CHAPTER 7
Profile of Tourism in Canada’s Tourism Regions
Laurie McDougall and Sylvie Bonhomme,Tourism Statistics Program
In 1997, the 83.4 million overnight trips that tourists made to and withinCanada resulted in $20.6 billion in spending. Canadians were the largestgroup of tourists, making 79% of overnight trips across Canada. Americanswere the second-largest group, taking 16% of the trips while overseas visitorsmade the remaining 5%.
During a single overnight trip to a destination in Canada, tourists may visitseveral areas. On average in 1997, tourists made 1.2 visits per trip. Byexamining places visited throughout the course of a trip we have a moreaccurate picture of the impact of tourism, particularly at the regional level.Canada is divided into 81 tourism regions, as defined by each province.Some regions, like Quebec’s Far North and James Bay region, cover vastareas. Others, like Metro Toronto, are quite limited in size. The number oftourism regions varies from one province to another. There is just a singleregion in Prince Edward Island, while there are nineteen in Quebec.
This article provides a thumbnail sketch of the top ten tourism regions inCanada based on the number of overnight visits. It will point out some of thesimilarities these regions share, as well as what makes them unique. Forinstance, all the top ten regions rely on the domestic market for at least halfof their visitors; however this share varies from a high of 91% in Lakelandsto a low of 52% for Metro Toronto. The summer is the most popular time tovisit all the top ten regions but overall, Metro Toronto welcomed the smallestshare of visitors during the summer months (33%). On the other hand,Southwestern British Columbia claimed the highest share of winter-timevisitation (21%). Non-business travel tended to be the most frequentlycited reason for visitors travelling to the top ten regions, although Lakelandstopped the list with 96% of its visitors citing this as their main reason fortaking a trip.
The top ten regions are located in three provinces. Six of Ontario’s 12 regionswere included in the ten most visited regions in Canada while BritishColumbia and Quebec both had two regions included in the top ten. Asshown in Figure 7.1, these ten regions accounted for 47% of overnighttourism region visits in 1997. As illustrated in Figure 7.2, as one mightexpect the most populous tourism regions tend to be the most popular placesto visit and report the highest spending (Text Table 7.1).
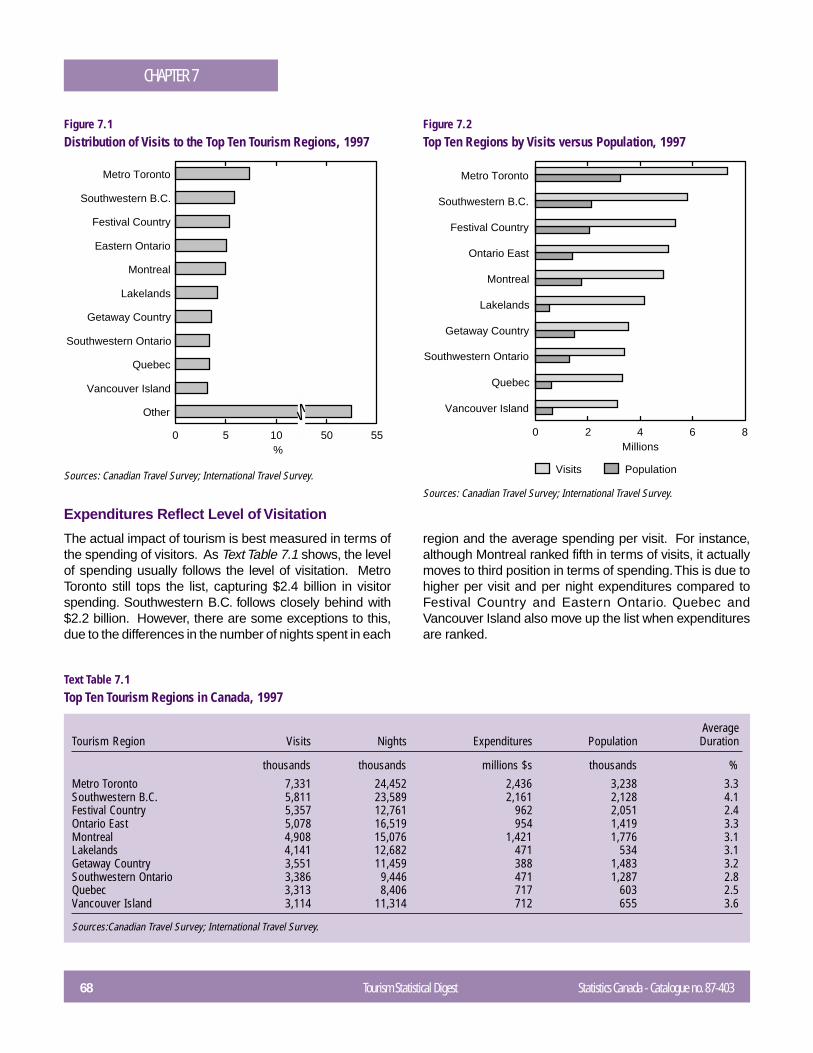
68 Tourism Statistical Digest Statistics Canada - Catalogue no. 87-403
CHAPTER 7
Figure 7.1Distribution of Visits to the Top Ten Tourism Regions, 1997
Figure 7.2Top Ten Regions by Visits versus Population, 1997
AverageTourism Region Visits Nights Expenditures Population Duration
thousands thousands millions $s thousands %Metro Toronto 7,331 24,452 2,436 3,238 3.3Southwestern B.C. 5,811 23,589 2,161 2,128 4.1Festival Country 5,357 12,761 962 2,051 2.4Ontario East 5,078 16,519 954 1,419 3.3Montreal 4,908 15,076 1,421 1,776 3.1Lakelands 4,141 12,682 471 534 3.1Getaway Country 3,551 11,459 388 1,483 3.2Southwestern Ontario 3,386 9,446 471 1,287 2.8Quebec 3,313 8,406 717 603 2.5Vancouver Island 3,114 11,314 712 655 3.6
Sources:Canadian Travel Survey; International Travel Survey.
Text Table 7.1Top Ten Tourism Regions in Canada, 1997
Expenditures Reflect Level of Visitation
The actual impact of tourism is best measured in terms ofthe spending of visitors. As Text Table 7.1 shows, the levelof spending usually follows the level of visitation. MetroToronto still tops the list, capturing $2.4 billion in visitorspending. Southwestern B.C. follows closely behind with$2.2 billion. However, there are some exceptions to this,due to the differences in the number of nights spent in each
region and the average spending per visit. For instance,although Montreal ranked fifth in terms of visits, it actuallymoves to third position in terms of spending. This is due tohigher per visit and per night expenditures compared toFestival Country and Eastern Ontario. Quebec andVancouver Island also move up the list when expendituresare ranked.
Sources: Canadian Travel Survey; International Travel Survey.
Sources: Canadian Travel Survey; International Travel Survey.
Metro Toronto
Southwestern B.C.
Festival Country
Eastern Ontario
Montreal
Lakelands
Getaway Country
Southwestern Ontario
Quebec
Vancouver Island
Other
0 5 10 15 20%
50 55
Metro Toronto
Southwestern B.C.
Festival Country
Ontario East
Montreal
Lakelands
Getaway Country
Southwestern Ontario
Quebec
Vancouver Island
0 2 4 6 8Millions
Visits Population
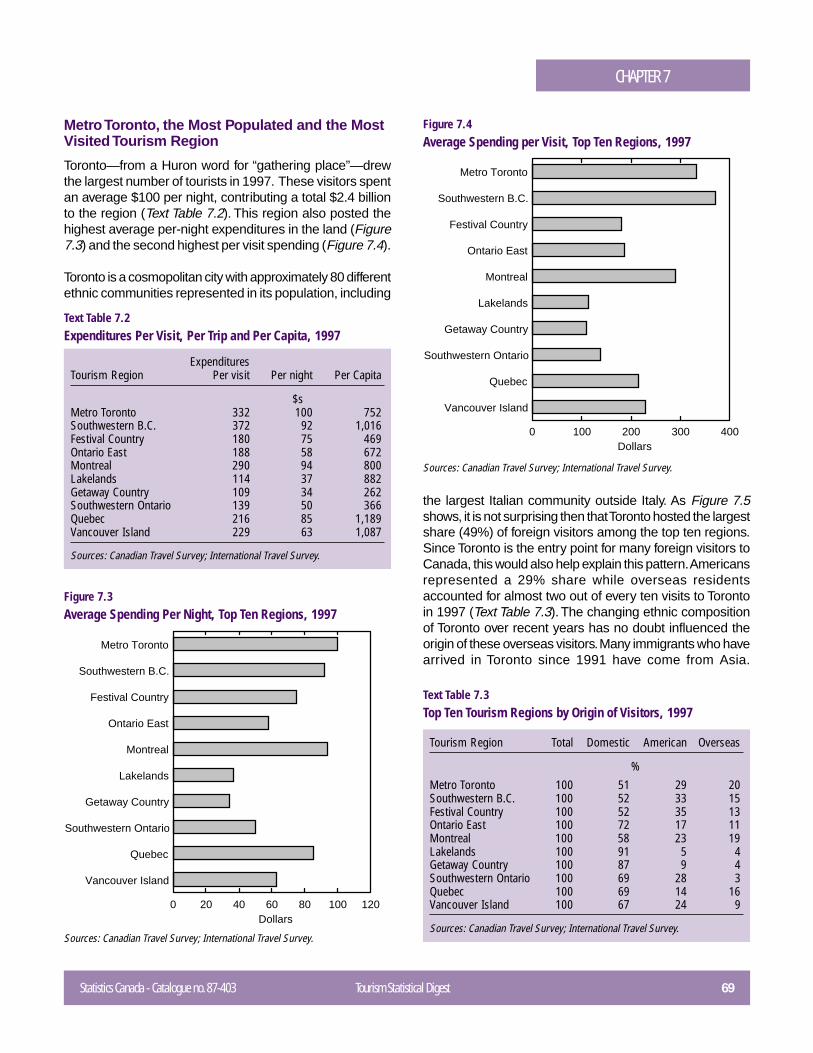
Statistics Canada - Catalogue no. 87-403 Tourism Statistical Digest 69
CHAPTER 7
Metro Toronto, the Most Populated and the MostVisited Tourism Region
Toronto—from a Huron word for “gathering place”—drewthe largest number of tourists in 1997. These visitors spentan average $100 per night, contributing a total $2.4 billionto the region (Text Table 7.2). This region also posted thehighest average per-night expenditures in the land (Figure7.3) and the second highest per visit spending (Figure 7.4).
Toronto is a cosmopolitan city with approximately 80 differentethnic communities represented in its population, including
Text Table 7.2Expenditures Per Visit, Per Trip and Per Capita, 1997
ExpendituresTourism Region Per visit Per night Per Capita
$sMetro Toronto 332 100 752Southwestern B.C. 372 92 1,016Festival Country 180 75 469Ontario East 188 58 672Montreal 290 94 800Lakelands 114 37 882Getaway Country 109 34 262Southwestern Ontario 139 50 366Quebec 216 85 1,189Vancouver Island 229 63 1,087
Sources: Canadian Travel Survey; International Travel Survey.
Figure 7.3Average Spending Per Night, Top Ten Regions, 1997
Figure 7.4Average Spending per Visit, Top Ten Regions, 1997
the largest Italian community outside Italy. As Figure 7.5shows, it is not surprising then that Toronto hosted the largestshare (49%) of foreign visitors among the top ten regions.Since Toronto is the entry point for many foreign visitors toCanada, this would also help explain this pattern. Americansrepresented a 29% share while overseas residentsaccounted for almost two out of every ten visits to Torontoin 1997 (Text Table 7.3). The changing ethnic compositionof Toronto over recent years has no doubt influenced theorigin of these overseas visitors. Many immigrants who havearrived in Toronto since 1991 have come from Asia.
Text Table 7.3Top Ten Tourism Regions by Origin of Visitors, 1997
Tourism Region Total Domestic American Overseas
%Metro Toronto 100 51 29 20Southwestern B.C. 100 52 33 15Festival Country 100 52 35 13Ontario East 100 72 17 11Montreal 100 58 23 19Lakelands 100 91 5 4Getaway Country 100 87 9 4Southwestern Ontario 100 69 28 3Quebec 100 69 14 16Vancouver Island 100 67 24 9
Sources: Canadian Travel Survey; International Travel Survey.Sources: Canadian Travel Survey; International Travel Survey.
Sources: Canadian Travel Survey; International Travel Survey.
Metro Toronto
Southwestern B.C.
Festival Country
Ontario East
Montreal
Lakelands
Getaway Country
Southwestern Ontario
Quebec
Vancouver Island
0 100 200 300 400Dollars
Metro Toronto
Southwestern B.C.
Festival Country
Ontario East
Montreal
Lakelands
Getaway Country
Southwestern Ontario
Quebec
Vancouver Island
0 20 40 60 80 100 120Dollars
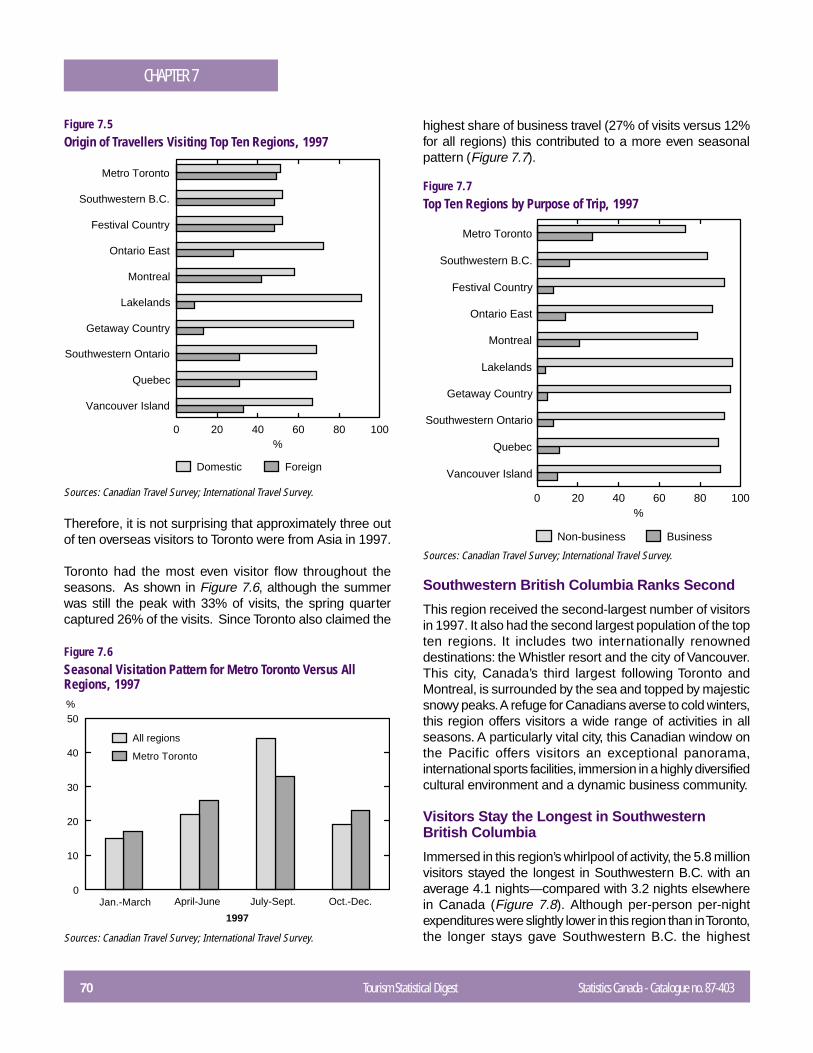
70 Tourism Statistical Digest Statistics Canada - Catalogue no. 87-403
CHAPTER 7
Therefore, it is not surprising that approximately three outof ten overseas visitors to Toronto were from Asia in 1997.
Toronto had the most even visitor flow throughout theseasons. As shown in Figure 7.6, although the summerwas still the peak with 33% of visits, the spring quartercaptured 26% of the visits. Since Toronto also claimed the
Figure 7.5Origin of Travellers Visiting Top Ten Regions, 1997
Figure 7.6Seasonal Visitation Pattern for Metro Toronto Versus AllRegions, 1997
Figure 7.7Top Ten Regions by Purpose of Trip, 1997
Sources: Canadian Travel Survey; International Travel Survey.
Sources: Canadian Travel Survey; International Travel Survey.
Sources: Canadian Travel Survey; International Travel Survey.
highest share of business travel (27% of visits versus 12%for all regions) this contributed to a more even seasonalpattern (Figure 7.7).
Southwestern British Columbia Ranks Second
This region received the second-largest number of visitorsin 1997. It also had the second largest population of the topten regions. It includes two internationally renowneddestinations: the Whistler resort and the city of Vancouver.This city, Canada’s third largest following Toronto andMontreal, is surrounded by the sea and topped by majesticsnowy peaks. A refuge for Canadians averse to cold winters,this region offers visitors a wide range of activities in allseasons. A particularly vital city, this Canadian window onthe Pacific offers visitors an exceptional panorama,international sports facilities, immersion in a highly diversifiedcultural environment and a dynamic business community.
Visitors Stay the Longest in SouthwesternBritish Columbia
Immersed in this region’s whirlpool of activity, the 5.8 millionvisitors stayed the longest in Southwestern B.C. with anaverage 4.1 nights—compared with 3.2 nights elsewherein Canada (Figure 7.8). Although per-person per-nightexpenditures were slightly lower in this region than in Toronto,the longer stays gave Southwestern B.C. the highest
Metro Toronto
Southwestern B.C.
Festival Country
Ontario East
Montreal
Lakelands
Getaway Country
Southwestern Ontario
Quebec
Vancouver Island
0 20 40 60 80 100%
Domestic Foreign
Metro Toronto
Southwestern B.C.
Festival Country
Ontario East
Montreal
Lakelands
Getaway Country
Southwestern Ontario
Quebec
Vancouver Island
0 20 40 60 80 100%
Non-business Business
0
10
20
30
40
50%
1997
All regions
Metro Toronto
Jan.-March April-June July-Sept. Oct.-Dec.
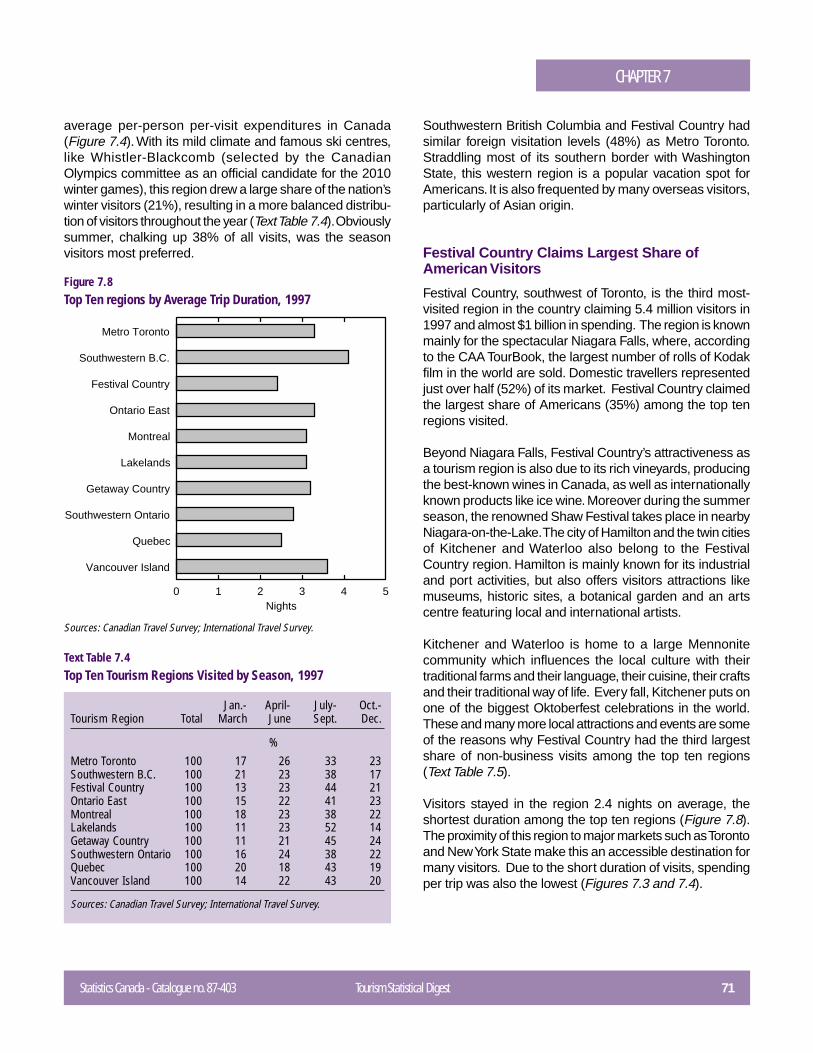
Statistics Canada - Catalogue no. 87-403 Tourism Statistical Digest 71
CHAPTER 7
Figure 7.8Top Ten regions by Average Trip Duration, 1997
average per-person per-visit expenditures in Canada(Figure 7.4). With its mild climate and famous ski centres,like Whistler-Blackcomb (selected by the CanadianOlympics committee as an official candidate for the 2010winter games), this region drew a large share of the nation’swinter visitors (21%), resulting in a more balanced distribu-tion of visitors throughout the year (Text Table 7.4). Obviouslysummer, chalking up 38% of all visits, was the seasonvisitors most preferred.
Text Table 7.4Top Ten Tourism Regions Visited by Season, 1997
Jan.- April- July- Oct.-Tourism Region Total March June Sept. Dec.
%Metro Toronto 100 17 26 33 23Southwestern B.C. 100 21 23 38 17Festival Country 100 13 23 44 21Ontario East 100 15 22 41 23Montreal 100 18 23 38 22Lakelands 100 11 23 52 14Getaway Country 100 11 21 45 24Southwestern Ontario 100 16 24 38 22Quebec 100 20 18 43 19Vancouver Island 100 14 22 43 20
Sources: Canadian Travel Survey; International Travel Survey.
Southwestern British Columbia and Festival Country hadsimilar foreign visitation levels (48%) as Metro Toronto.Straddling most of its southern border with WashingtonState, this western region is a popular vacation spot forAmericans. It is also frequented by many overseas visitors,particularly of Asian origin.
Festival Country Claims Largest Share ofAmerican Visitors
Festival Country, southwest of Toronto, is the third most-visited region in the country claiming 5.4 million visitors in1997 and almost $1 billion in spending. The region is knownmainly for the spectacular Niagara Falls, where, accordingto the CAA TourBook, the largest number of rolls of Kodakfilm in the world are sold. Domestic travellers representedjust over half (52%) of its market. Festival Country claimedthe largest share of Americans (35%) among the top tenregions visited.
Beyond Niagara Falls, Festival Country’s attractiveness asa tourism region is also due to its rich vineyards, producingthe best-known wines in Canada, as well as internationallyknown products like ice wine. Moreover during the summerseason, the renowned Shaw Festival takes place in nearbyNiagara-on-the-Lake. The city of Hamilton and the twin citiesof Kitchener and Waterloo also belong to the FestivalCountry region. Hamilton is mainly known for its industrialand port activities, but also offers visitors attractions likemuseums, historic sites, a botanical garden and an artscentre featuring local and international artists.
Kitchener and Waterloo is home to a large Mennonitecommunity which influences the local culture with theirtraditional farms and their language, their cuisine, their craftsand their traditional way of life. Every fall, Kitchener puts onone of the biggest Oktoberfest celebrations in the world.These and many more local attractions and events are someof the reasons why Festival Country had the third largestshare of non-business visits among the top ten regions(Text Table 7.5).
Visitors stayed in the region 2.4 nights on average, theshortest duration among the top ten regions (Figure 7.8).The proximity of this region to major markets such as Torontoand New York State make this an accessible destination formany visitors. Due to the short duration of visits, spendingper trip was also the lowest (Figures 7.3 and 7.4).
Sources: Canadian Travel Survey; International Travel Survey.
Metro Toronto
Southwestern B.C.
Festival Country
Ontario East
Montreal
Lakelands
Getaway Country
Southwestern Ontario
Quebec
Vancouver Island
0 1 2 3 4 5Nights
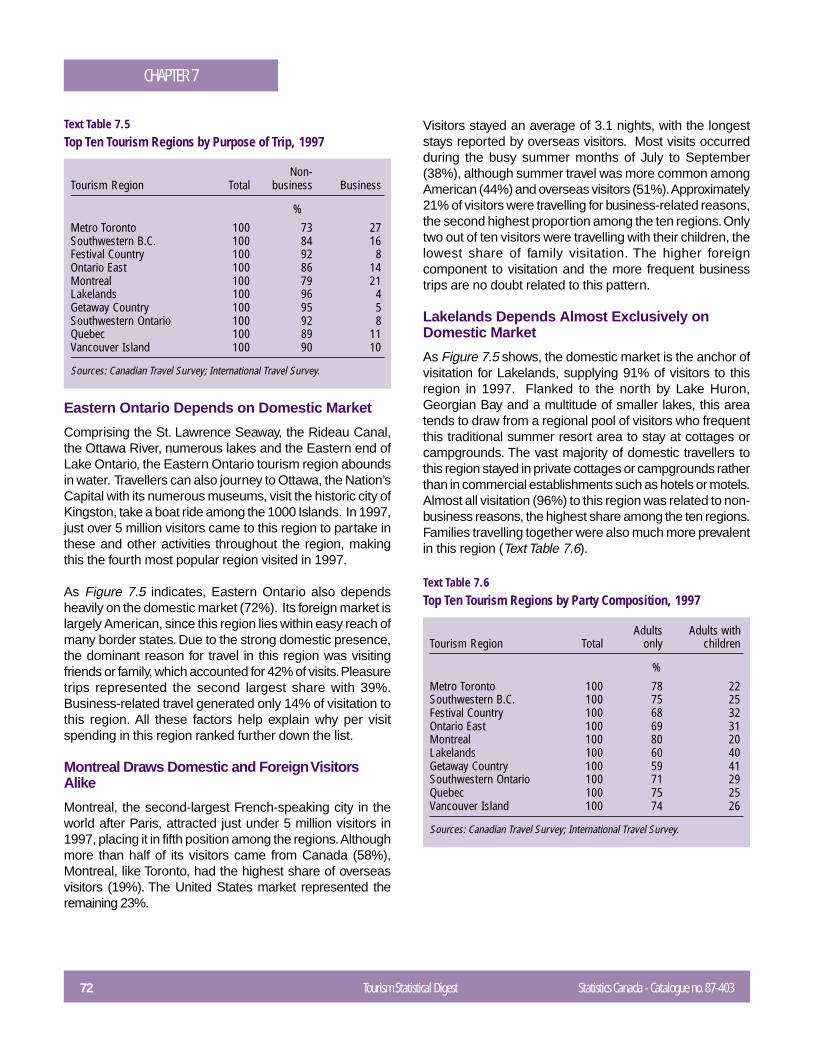
72 Tourism Statistical Digest Statistics Canada - Catalogue no. 87-403
CHAPTER 7
Text Table 7.5Top Ten Tourism Regions by Purpose of Trip, 1997
Non-Tourism Region Total business Business
%Metro Toronto 100 73 27Southwestern B.C. 100 84 16Festival Country 100 92 8Ontario East 100 86 14Montreal 100 79 21Lakelands 100 96 4Getaway Country 100 95 5Southwestern Ontario 100 92 8Quebec 100 89 11Vancouver Island 100 90 10
Sources: Canadian Travel Survey; International Travel Survey.
Eastern Ontario Depends on Domestic Market
Comprising the St. Lawrence Seaway, the Rideau Canal,the Ottawa River, numerous lakes and the Eastern end ofLake Ontario, the Eastern Ontario tourism region aboundsin water. Travellers can also journey to Ottawa, the Nation’sCapital with its numerous museums, visit the historic city ofKingston, take a boat ride among the 1000 Islands. In 1997,just over 5 million visitors came to this region to partake inthese and other activities throughout the region, makingthis the fourth most popular region visited in 1997.
As Figure 7.5 indicates, Eastern Ontario also dependsheavily on the domestic market (72%). Its foreign market islargely American, since this region lies within easy reach ofmany border states. Due to the strong domestic presence,the dominant reason for travel in this region was visitingfriends or family, which accounted for 42% of visits. Pleasuretrips represented the second largest share with 39%.Business-related travel generated only 14% of visitation tothis region. All these factors help explain why per visitspending in this region ranked further down the list.
Montreal Draws Domestic and Foreign VisitorsAlike
Montreal, the second-largest French-speaking city in theworld after Paris, attracted just under 5 million visitors in1997, placing it in fifth position among the regions. Althoughmore than half of its visitors came from Canada (58%),Montreal, like Toronto, had the highest share of overseasvisitors (19%). The United States market represented theremaining 23%.
Visitors stayed an average of 3.1 nights, with the longeststays reported by overseas visitors. Most visits occurredduring the busy summer months of July to September(38%), although summer travel was more common amongAmerican (44%) and overseas visitors (51%). Approximately21% of visitors were travelling for business-related reasons,the second highest proportion among the ten regions. Onlytwo out of ten visitors were travelling with their children, thelowest share of family visitation. The higher foreigncomponent to visitation and the more frequent businesstrips are no doubt related to this pattern.
Lakelands Depends Almost Exclusively onDomestic Market
As Figure 7.5 shows, the domestic market is the anchor ofvisitation for Lakelands, supplying 91% of visitors to thisregion in 1997. Flanked to the north by Lake Huron,Georgian Bay and a multitude of smaller lakes, this areatends to draw from a regional pool of visitors who frequentthis traditional summer resort area to stay at cottages orcampgrounds. The vast majority of domestic travellers tothis region stayed in private cottages or campgrounds ratherthan in commercial establishments such as hotels or motels.Almost all visitation (96%) to this region was related to non-business reasons, the highest share among the ten regions.Families travelling together were also much more prevalentin this region (Text Table 7.6).
Text Table 7.6Top Ten Tourism Regions by Party Composition, 1997
Adults Adults withTourism Region Total only children
%
Metro Toronto 100 78 22Southwestern B.C. 100 75 25Festival Country 100 68 32Ontario East 100 69 31Montreal 100 80 20Lakelands 100 60 40Getaway Country 100 59 41Southwestern Ontario 100 71 29Quebec 100 75 25Vancouver Island 100 74 26
Sources: Canadian Travel Survey; International Travel Survey.
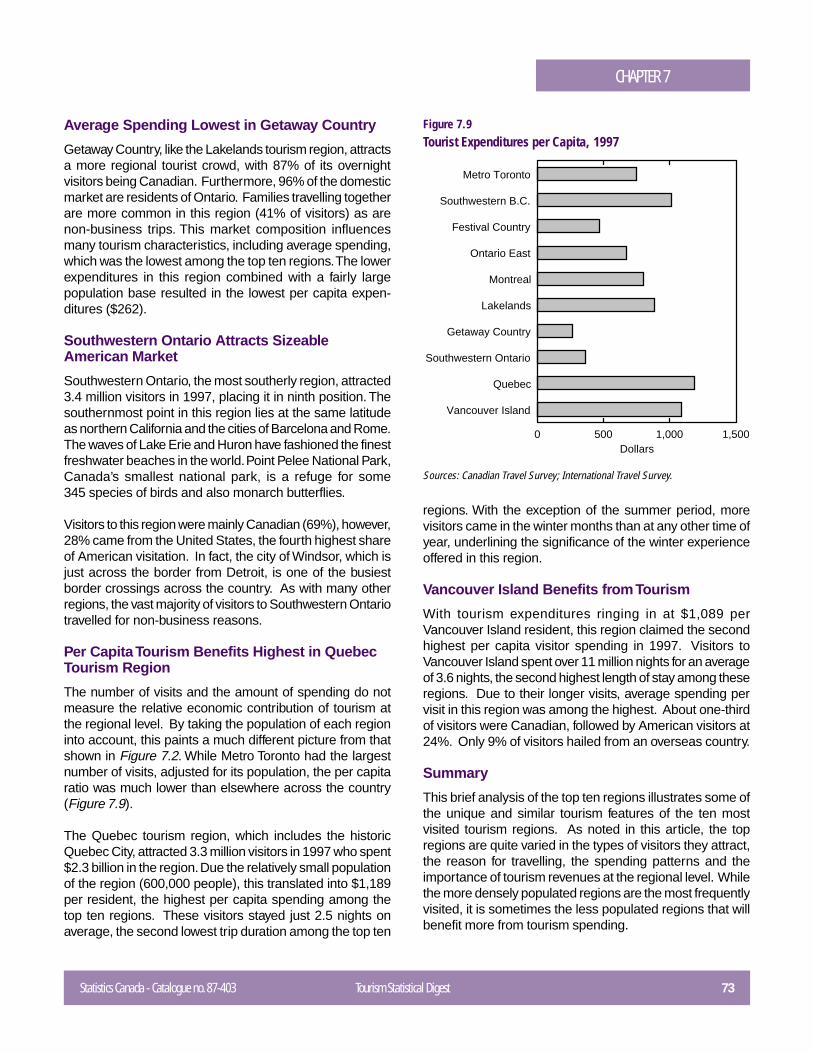
Statistics Canada - Catalogue no. 87-403 Tourism Statistical Digest 73
CHAPTER 7
Average Spending Lowest in Getaway Country
Getaway Country, like the Lakelands tourism region, attractsa more regional tourist crowd, with 87% of its overnightvisitors being Canadian. Furthermore, 96% of the domesticmarket are residents of Ontario. Families travelling togetherare more common in this region (41% of visitors) as arenon-business trips. This market composition influencesmany tourism characteristics, including average spending,which was the lowest among the top ten regions. The lowerexpenditures in this region combined with a fairly largepopulation base resulted in the lowest per capita expen-ditures ($262).
Southwestern Ontario Attracts SizeableAmerican Market
Southwestern Ontario, the most southerly region, attracted3.4 million visitors in 1997, placing it in ninth position. Thesouthernmost point in this region lies at the same latitudeas northern California and the cities of Barcelona and Rome.The waves of Lake Erie and Huron have fashioned the finestfreshwater beaches in the world. Point Pelee National Park,Canada’s smallest national park, is a refuge for some345 species of birds and also monarch butterflies.
Visitors to this region were mainly Canadian (69%), however,28% came from the United States, the fourth highest shareof American visitation. In fact, the city of Windsor, which isjust across the border from Detroit, is one of the busiestborder crossings across the country. As with many otherregions, the vast majority of visitors to Southwestern Ontariotravelled for non-business reasons.
Per Capita Tourism Benefits Highest in QuebecTourism Region
The number of visits and the amount of spending do notmeasure the relative economic contribution of tourism atthe regional level. By taking the population of each regioninto account, this paints a much different picture from thatshown in Figure 7.2. While Metro Toronto had the largestnumber of visits, adjusted for its population, the per capitaratio was much lower than elsewhere across the country(Figure 7.9).
The Quebec tourism region, which includes the historicQuebec City, attracted 3.3 million visitors in 1997 who spent$2.3 billion in the region. Due the relatively small populationof the region (600,000 people), this translated into $1,189per resident, the highest per capita spending among thetop ten regions. These visitors stayed just 2.5 nights onaverage, the second lowest trip duration among the top ten
regions. With the exception of the summer period, morevisitors came in the winter months than at any other time ofyear, underlining the significance of the winter experienceoffered in this region.
Vancouver Island Benefits from Tourism
With tourism expenditures ringing in at $1,089 perVancouver Island resident, this region claimed the secondhighest per capita visitor spending in 1997. Visitors toVancouver Island spent over 11 million nights for an averageof 3.6 nights, the second highest length of stay among theseregions. Due to their longer visits, average spending pervisit in this region was among the highest. About one-thirdof visitors were Canadian, followed by American visitors at24%. Only 9% of visitors hailed from an overseas country.
Summary
This brief analysis of the top ten regions illustrates some ofthe unique and similar tourism features of the ten mostvisited tourism regions. As noted in this article, the topregions are quite varied in the types of visitors they attract,the reason for travelling, the spending patterns and theimportance of tourism revenues at the regional level. Whilethe more densely populated regions are the most frequentlyvisited, it is sometimes the less populated regions that willbenefit more from tourism spending.
Figure 7.9Tourist Expenditures per Capita, 1997
Sources: Canadian Travel Survey; International Travel Survey.
Metro Toronto
Southwestern B.C.
Festival Country
Ontario East
Montreal
Lakelands
Getaway Country
Southwestern Ontario
Quebec
Vancouver Island
0 500 1,000 1,500Dollars
74 Tourism Statistical Digest Statistics Canada - Catalogue no. 87-403
CHAPTER 7
Lessons Learned from the Analysis of the 1997CTS and ITS for the Merger of SouthwesternOntario and Festival Country
Stephen L. J. SmithDepartment of Recreation and Leisure StudiesUniversity of Waterloo
Background
The Province of Ontario has traditionally been divided into 12 travel regionsknown as OTAPs (Ontario Travel Association Partners). Core funding forthese OTAPS comes from the Ministry of Economic Development, Trade,and Tourism (MEDTT); this is supplemented by membership fees, co-opadvertising revenues, and other sources. In 1998, MEDTT initiated a majorre-organization of provincial tourism marketing. As part of this re-organization, MEDTT officials announced their intention to phase out theOTAPs and replace them with a new regional structure based on five regions:Southern Ontario, Toronto, Eastern Ontario, Central Ontario, and NorthernOntario.
In response to this announcement, two adjacent OTAPs - Niagara andMidwestern Ontario (also known as Festival Country) and SouthwesternOntario Travel Association (SWOTA) - began discussion on forming a new,larger regional organization that would form the new Southern Ontario region.
The two OTAPs are roughly comparable in geographic extent and eachconsists of eight counties. Festival Country extends from Niagara Falls,through Hamilton, to north of Kitchener-Waterloo; SWOTA extends fromWindsor to Stratford. The 1998/1999 operating budgets both SWOTA andFestival Country are about $800,000. Each region draws about 15 milliondomestic, US, and overseas visitors1 (see Text Table 7.7). By way ofcomparison, Ontario drew 79.2 million (out of the Canadian total of 168.6million). These two OTAPS thus generate nearly two-fifths of all visits toOntario and nearly one-fifth of all visits to Canada.
Both appeal more strongly to a same-day market than the province as awhole (see Text Table 7.7), a pattern that is of concern to the Boards ofDirectors and marketing committees of both OTAPS as they strive to increasetheir draw of the more lucrative overnight market. This is a particular issuein SWOTA where less than one-quarter of all visitors stay overnight,compared to over two-fifths for Ontario as a whole.
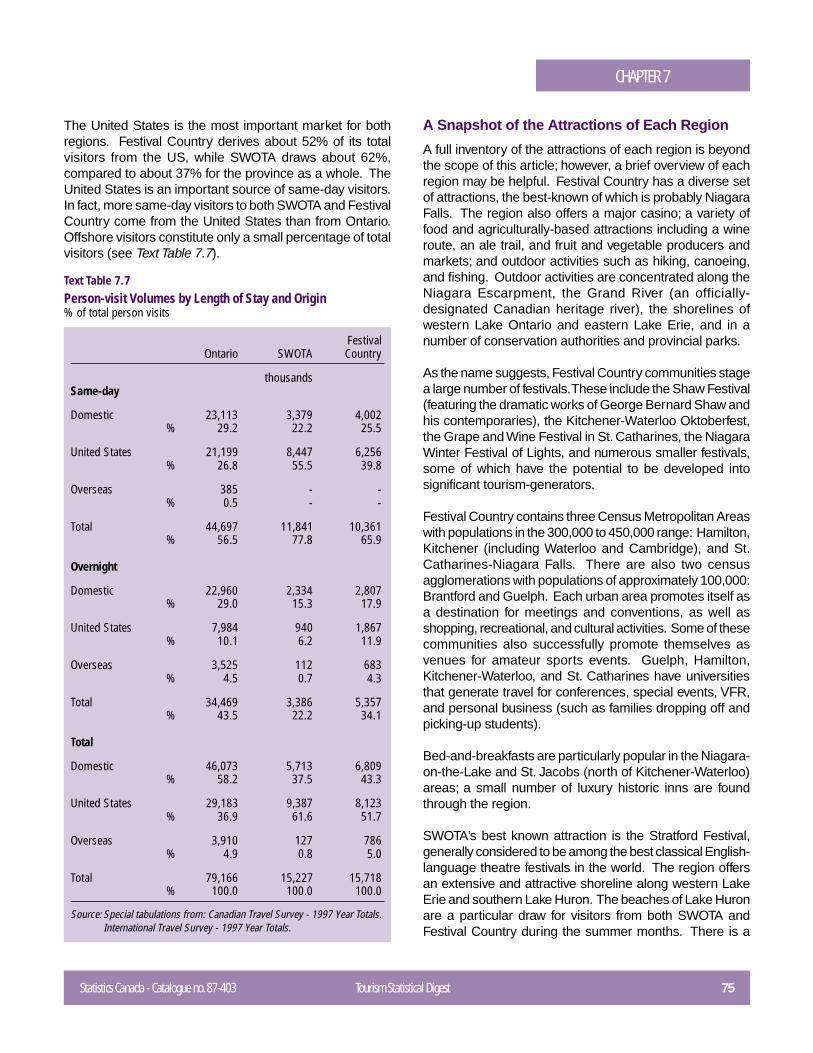
Statistics Canada - Catalogue no. 87-403 Tourism Statistical Digest 75
CHAPTER 7
The United States is the most important market for bothregions. Festival Country derives about 52% of its totalvisitors from the US, while SWOTA draws about 62%,compared to about 37% for the province as a whole. TheUnited States is an important source of same-day visitors.In fact, more same-day visitors to both SWOTA and FestivalCountry come from the United States than from Ontario.Offshore visitors constitute only a small percentage of totalvisitors (see Text Table 7.7).
Text Table 7.7Person-visit Volumes by Length of Stay and Origin% of total person visits
FestivalOntario SWOTA Country
thousandsSame-day
Domestic 23,113 3,379 4,002% 29.2 22.2 25.5
United States 21,199 8,447 6,256% 26.8 55.5 39.8
Overseas 385 - -% 0.5 - -
Total 44,697 11,841 10,361% 56.5 77.8 65.9
Overnight
Domestic 22,960 2,334 2,807% 29.0 15.3 17.9
United States 7,984 940 1,867% 10.1 6.2 11.9
Overseas 3,525 112 683% 4.5 0.7 4.3
Total 34,469 3,386 5,357% 43.5 22.2 34.1
Total
Domestic 46,073 5,713 6,809% 58.2 37.5 43.3
United States 29,183 9,387 8,123% 36.9 61.6 51.7
Overseas 3,910 127 786% 4.9 0.8 5.0
Total 79,166 15,227 15,718% 100.0 100.0 100.0
Source: Special tabulations from: Canadian Travel Survey - 1997 Year Totals.International Travel Survey - 1997 Year Totals.
A Snapshot of the Attractions of Each Region
A full inventory of the attractions of each region is beyondthe scope of this article; however, a brief overview of eachregion may be helpful. Festival Country has a diverse setof attractions, the best-known of which is probably NiagaraFalls. The region also offers a major casino; a variety offood and agriculturally-based attractions including a wineroute, an ale trail, and fruit and vegetable producers andmarkets; and outdoor activities such as hiking, canoeing,and fishing. Outdoor activities are concentrated along theNiagara Escarpment, the Grand River (an officially-designated Canadian heritage river), the shorelines ofwestern Lake Ontario and eastern Lake Erie, and in anumber of conservation authorities and provincial parks.
As the name suggests, Festival Country communities stagea large number of festivals. These include the Shaw Festival(featuring the dramatic works of George Bernard Shaw andhis contemporaries), the Kitchener-Waterloo Oktoberfest,the Grape and Wine Festival in St. Catharines, the NiagaraWinter Festival of Lights, and numerous smaller festivals,some of which have the potential to be developed intosignificant tourism-generators.
Festival Country contains three Census Metropolitan Areaswith populations in the 300,000 to 450,000 range: Hamilton,Kitchener (including Waterloo and Cambridge), and St.Catharines-Niagara Falls. There are also two censusagglomerations with populations of approximately 100,000:Brantford and Guelph. Each urban area promotes itself asa destination for meetings and conventions, as well asshopping, recreational, and cultural activities. Some of thesecommunities also successfully promote themselves asvenues for amateur sports events. Guelph, Hamilton,Kitchener-Waterloo, and St. Catharines have universitiesthat generate travel for conferences, special events, VFR,and personal business (such as families dropping off andpicking-up students).
Bed-and-breakfasts are particularly popular in the Niagara-on-the-Lake and St. Jacobs (north of Kitchener-Waterloo)areas; a small number of luxury historic inns are foundthrough the region.
SWOTA’s best known attraction is the Stratford Festival,generally considered to be among the best classical English-language theatre festivals in the world. The region offersan extensive and attractive shoreline along western LakeErie and southern Lake Huron. The beaches of Lake Huronare a particular draw for visitors from both SWOTA andFestival Country during the summer months. There is a
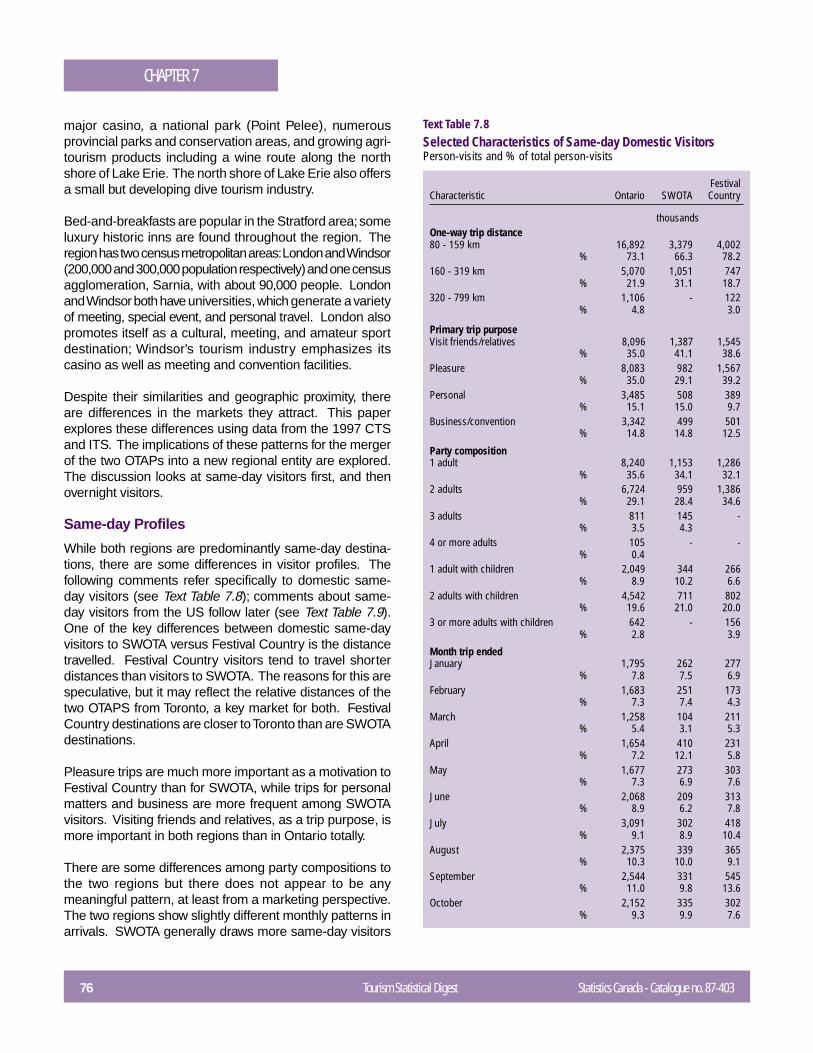
76 Tourism Statistical Digest Statistics Canada - Catalogue no. 87-403
CHAPTER 7
major casino, a national park (Point Pelee), numerousprovincial parks and conservation areas, and growing agri-tourism products including a wine route along the northshore of Lake Erie. The north shore of Lake Erie also offersa small but developing dive tourism industry.
Bed-and-breakfasts are popular in the Stratford area; someluxury historic inns are found throughout the region. Theregion has two census metropolitan areas: London and Windsor(200,000 and 300,000 population respectively) and one censusagglomeration, Sarnia, with about 90,000 people. Londonand Windsor both have universities, which generate a varietyof meeting, special event, and personal travel. London alsopromotes itself as a cultural, meeting, and amateur sportdestination; Windsor’s tourism industry emphasizes itscasino as well as meeting and convention facilities.
Despite their similarities and geographic proximity, thereare differences in the markets they attract. This paperexplores these differences using data from the 1997 CTSand ITS. The implications of these patterns for the mergerof the two OTAPs into a new regional entity are explored.The discussion looks at same-day visitors first, and thenovernight visitors.
Same-day Profiles
While both regions are predominantly same-day destina-tions, there are some differences in visitor profiles. Thefollowing comments refer specifically to domestic same-day visitors (see Text Table 7.8); comments about same-day visitors from the US follow later (see Text Table 7.9).One of the key differences between domestic same-dayvisitors to SWOTA versus Festival Country is the distancetravelled. Festival Country visitors tend to travel shorterdistances than visitors to SWOTA. The reasons for this arespeculative, but it may reflect the relative distances of thetwo OTAPS from Toronto, a key market for both. FestivalCountry destinations are closer to Toronto than are SWOTAdestinations.
Pleasure trips are much more important as a motivation toFestival Country than for SWOTA, while trips for personalmatters and business are more frequent among SWOTAvisitors. Visiting friends and relatives, as a trip purpose, ismore important in both regions than in Ontario totally.
There are some differences among party compositions tothe two regions but there does not appear to be anymeaningful pattern, at least from a marketing perspective.The two regions show slightly different monthly patterns inarrivals. SWOTA generally draws more same-day visitors
Text Table 7.8Selected Characteristics of Same-day Domestic VisitorsPerson-visits and % of total person-visits
FestivalCharacteristic Ontario SWOTA Country
thousandsOne-way trip distance80 - 159 km 16,892 3,379 4,002
% 73.1 66.3 78.2160 - 319 km 5,070 1,051 747
% 21.9 31.1 18.7320 - 799 km 1,106 - 122
% 4.8 3.0
Primary trip purposeVisit friends/relatives 8,096 1,387 1,545
% 35.0 41.1 38.6Pleasure 8,083 982 1,567
% 35.0 29.1 39.2Personal 3,485 508 389
% 15.1 15.0 9.7Business/convention 3,342 499 501
% 14.8 14.8 12.5
Party composition1 adult 8,240 1,153 1,286
% 35.6 34.1 32.12 adults 6,724 959 1,386
% 29.1 28.4 34.63 adults 811 145 -
% 3.5 4.34 or more adults 105 - -
% 0.41 adult with children 2,049 344 266
% 8.9 10.2 6.62 adults with children 4,542 711 802
% 19.6 21.0 20.03 or more adults with children 642 - 156
% 2.8 3.9
Month trip endedJanuary 1,795 262 277
% 7.8 7.5 6.9February 1,683 251 173
% 7.3 7.4 4.3March 1,258 104 211
% 5.4 3.1 5.3April 1,654 410 231
% 7.2 12.1 5.8May 1,677 273 303
% 7.3 6.9 7.6June 2,068 209 313
% 8.9 6.2 7.8July 3,091 302 418
% 9.1 8.9 10.4August 2,375 339 365
% 10.3 10.0 9.1September 2,544 331 545
% 11.0 9.8 13.6October 2,152 335 302
% 9.3 9.9 7.6
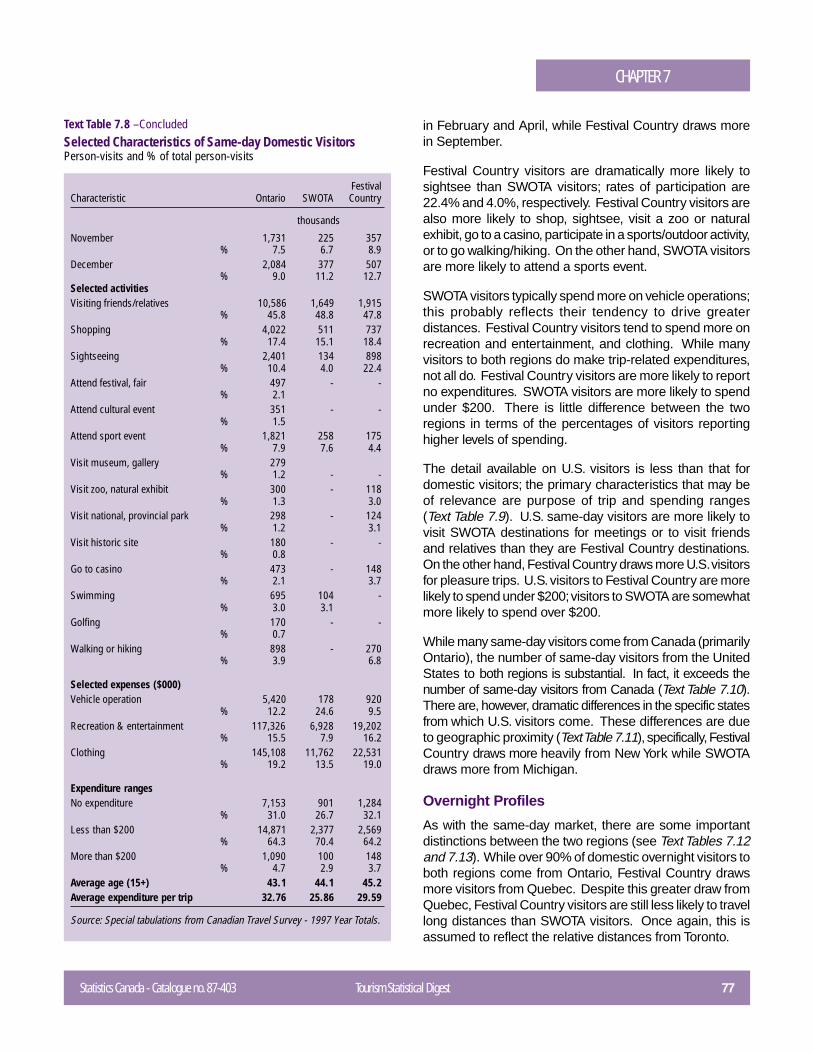
Statistics Canada - Catalogue no. 87-403 Tourism Statistical Digest 77
CHAPTER 7
Text Table 7.8 – ConcludedSelected Characteristics of Same-day Domestic VisitorsPerson-visits and % of total person-visits
FestivalCharacteristic Ontario SWOTA Country
thousands
November 1,731 225 357% 7.5 6.7 8.9
December 2,084 377 507% 9.0 11.2 12.7
Selected activitiesVisiting friends/relatives 10,586 1,649 1,915
% 45.8 48.8 47.8Shopping 4,022 511 737
% 17.4 15.1 18.4Sightseeing 2,401 134 898
% 10.4 4.0 22.4Attend festival, fair 497 - -
% 2.1Attend cultural event 351 - -
% 1.5Attend sport event 1,821 258 175
% 7.9 7.6 4.4Visit museum, gallery 279
% 1.2 - -Visit zoo, natural exhibit 300 - 118
% 1.3 3.0Visit national, provincial park 298 - 124
% 1.2 3.1Visit historic site 180 - -
% 0.8Go to casino 473 - 148
% 2.1 3.7Swimming 695 104 -
% 3.0 3.1Golfing 170 - -
% 0.7Walking or hiking 898 - 270
% 3.9 6.8
Selected expenses ($000)Vehicle operation 5,420 178 920
% 12.2 24.6 9.5Recreation & entertainment 117,326 6,928 19,202
% 15.5 7.9 16.2Clothing 145,108 11,762 22,531
% 19.2 13.5 19.0
Expenditure rangesNo expenditure 7,153 901 1,284
% 31.0 26.7 32.1Less than $200 14,871 2,377 2,569
% 64.3 70.4 64.2More than $200 1,090 100 148
% 4.7 2.9 3.7Average age (15+) 43.1 44.1 45.2Average expenditure per trip 32.76 25.86 29.59
Source: Special tabulations from Canadian Travel Survey - 1997 Year Totals.
in February and April, while Festival Country draws morein September.
Festival Country visitors are dramatically more likely tosightsee than SWOTA visitors; rates of participation are22.4% and 4.0%, respectively. Festival Country visitors arealso more likely to shop, sightsee, visit a zoo or naturalexhibit, go to a casino, participate in a sports/outdoor activity,or to go walking/hiking. On the other hand, SWOTA visitorsare more likely to attend a sports event.
SWOTA visitors typically spend more on vehicle operations;this probably reflects their tendency to drive greaterdistances. Festival Country visitors tend to spend more onrecreation and entertainment, and clothing. While manyvisitors to both regions do make trip-related expenditures,not all do. Festival Country visitors are more likely to reportno expenditures. SWOTA visitors are more likely to spendunder $200. There is little difference between the tworegions in terms of the percentages of visitors reportinghigher levels of spending.
The detail available on U.S. visitors is less than that fordomestic visitors; the primary characteristics that may beof relevance are purpose of trip and spending ranges(Text Table 7.9). U.S. same-day visitors are more likely tovisit SWOTA destinations for meetings or to visit friendsand relatives than they are Festival Country destinations.On the other hand, Festival Country draws more U.S. visitorsfor pleasure trips. U.S. visitors to Festival Country are morelikely to spend under $200; visitors to SWOTA are somewhatmore likely to spend over $200.
While many same-day visitors come from Canada (primarilyOntario), the number of same-day visitors from the UnitedStates to both regions is substantial. In fact, it exceeds thenumber of same-day visitors from Canada (Text Table 7.10).There are, however, dramatic differences in the specific statesfrom which U.S. visitors come. These differences are dueto geographic proximity (Text Table 7.11), specifically, FestivalCountry draws more heavily from New York while SWOTAdraws more from Michigan.
Overnight Profiles
As with the same-day market, there are some importantdistinctions between the two regions (see Text Tables 7.12and 7.13). While over 90% of domestic overnight visitors toboth regions come from Ontario, Festival Country drawsmore visitors from Quebec. Despite this greater draw fromQuebec, Festival Country visitors are still less likely to travellong distances than SWOTA visitors. Once again, this isassumed to reflect the relative distances from Toronto.
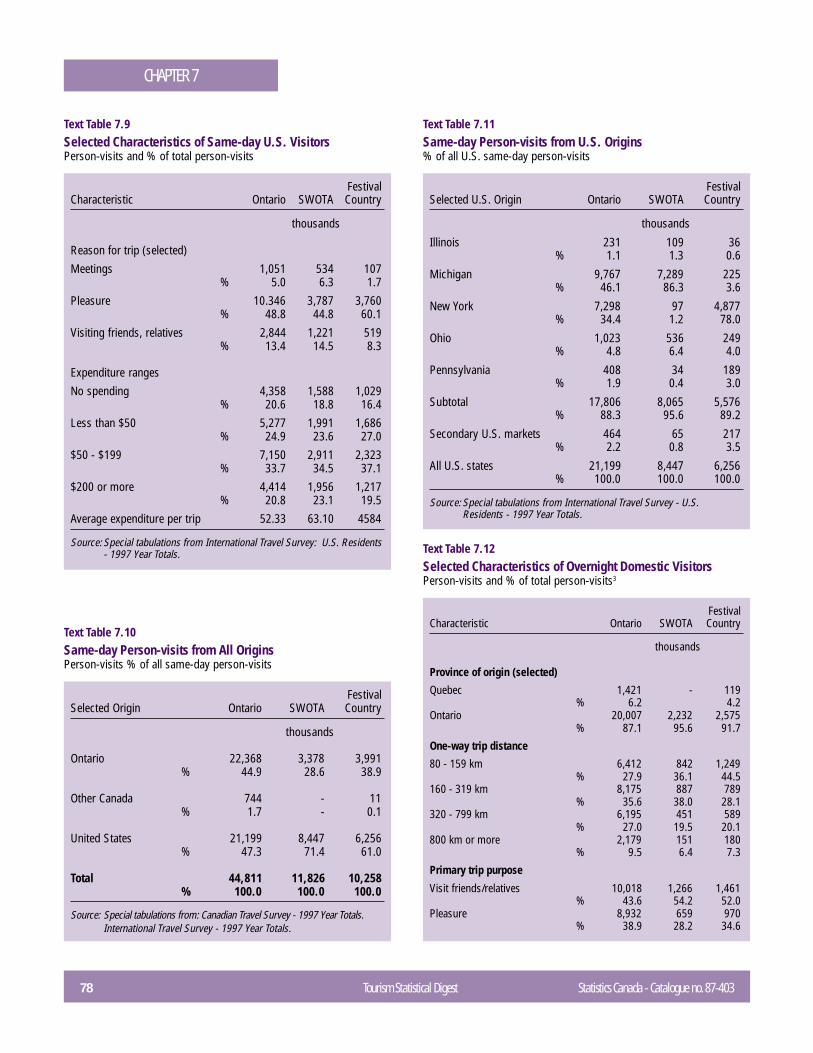
78 Tourism Statistical Digest Statistics Canada - Catalogue no. 87-403
CHAPTER 7
Text Table 7.9Selected Characteristics of Same-day U.S. VisitorsPerson-visits and % of total person-visits
FestivalCharacteristic Ontario SWOTA Country
thousands
Reason for trip (selected)Meetings 1,051 534 107
% 5.0 6.3 1.7Pleasure 10.346 3,787 3,760
% 48.8 44.8 60.1Visiting friends, relatives 2,844 1,221 519
% 13.4 14.5 8.3
Expenditure rangesNo spending 4,358 1,588 1,029
% 20.6 18.8 16.4Less than $50 5,277 1,991 1,686
% 24.9 23.6 27.0$50 - $199 7,150 2,911 2,323
% 33.7 34.5 37.1$200 or more 4,414 1,956 1,217
% 20.8 23.1 19.5Average expenditure per trip 52.33 63.10 4584
Source: Special tabulations from International Travel Survey: U.S. Residents- 1997 Year Totals.
Text Table 7.10Same-day Person-visits from All OriginsPerson-visits % of all same-day person-visits
FestivalSelected Origin Ontario SWOTA Country
thousands
Ontario 22,368 3,378 3,991% 44.9 28.6 38.9
Other Canada 744 - 11% 1.7 - 0.1
United States 21,199 8,447 6,256% 47.3 71.4 61.0
Total 44,811 11,826 10,258% 100.0 100.0 100.0
Source: Special tabulations from: Canadian Travel Survey - 1997 Year Totals.International Travel Survey - 1997 Year Totals.
Text Table 7.11Same-day Person-visits from U.S. Origins% of all U.S. same-day person-visits
FestivalSelected U.S. Origin Ontario SWOTA Country
thousands
Illinois 231 109 36% 1.1 1.3 0.6
Michigan 9,767 7,289 225% 46.1 86.3 3.6
New York 7,298 97 4,877% 34.4 1.2 78.0
Ohio 1,023 536 249% 4.8 6.4 4.0
Pennsylvania 408 34 189% 1.9 0.4 3.0
Subtotal 17,806 8,065 5,576% 88.3 95.6 89.2
Secondary U.S. markets 464 65 217% 2.2 0.8 3.5
All U.S. states 21,199 8,447 6,256% 100.0 100.0 100.0
Source: Special tabulations from International Travel Survey - U.S.Residents - 1997 Year Totals.
Text Table 7.12Selected Characteristics of Overnight Domestic VisitorsPerson-visits and % of total person-visits3
FestivalCharacteristic Ontario SWOTA Country
thousands
Province of origin (selected)
Quebec 1,421 - 119% 6.2 4.2
Ontario 20,007 2,232 2,575% 87.1 95.6 91.7
One-way trip distance
80 - 159 km 6,412 842 1,249% 27.9 36.1 44.5
160 - 319 km 8,175 887 789% 35.6 38.0 28.1
320 - 799 km 6,195 451 589% 27.0 19.5 20.1
800 km or more 2,179 151 180% 9.5 6.4 7.3
Primary trip purpose
Visit friends/relatives 10,018 1,266 1,461% 43.6 54.2 52.0
Pleasure 8,932 659 970% 38.9 28.2 34.6
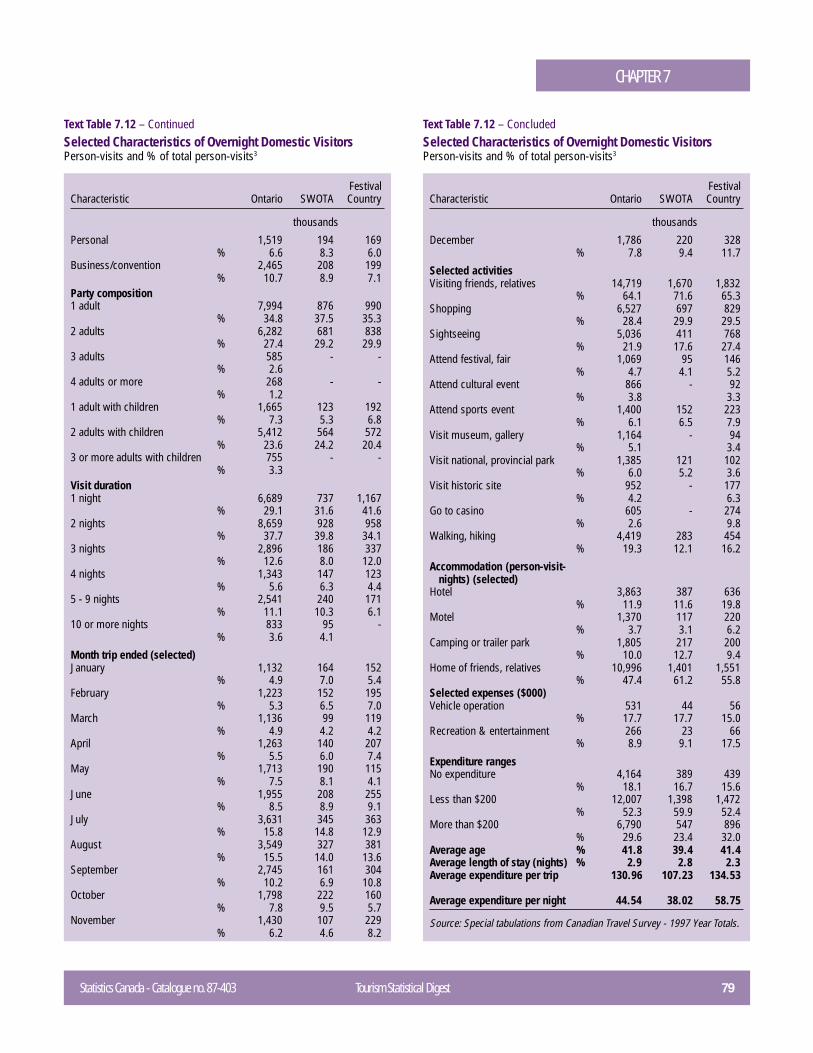
Statistics Canada - Catalogue no. 87-403 Tourism Statistical Digest 79
CHAPTER 7
Text Table 7.12 – ContinuedSelected Characteristics of Overnight Domestic VisitorsPerson-visits and % of total person-visits3
FestivalCharacteristic Ontario SWOTA Country
thousands
Personal 1,519 194 169% 6.6 8.3 6.0
Business/convention 2,465 208 199% 10.7 8.9 7.1
Party composition1 adult 7,994 876 990
% 34.8 37.5 35.32 adults 6,282 681 838
% 27.4 29.2 29.93 adults 585 - -
% 2.64 adults or more 268 - -
% 1.21 adult with children 1,665 123 192
% 7.3 5.3 6.82 adults with children 5,412 564 572
% 23.6 24.2 20.43 or more adults with children 755 - -
% 3.3Visit duration1 night 6,689 737 1,167
% 29.1 31.6 41.62 nights 8,659 928 958
% 37.7 39.8 34.13 nights 2,896 186 337
% 12.6 8.0 12.04 nights 1,343 147 123
% 5.6 6.3 4.45 - 9 nights 2,541 240 171
% 11.1 10.3 6.110 or more nights 833 95 -
% 3.6 4.1
Month trip ended (selected)January 1,132 164 152
% 4.9 7.0 5.4February 1,223 152 195
% 5.3 6.5 7.0March 1,136 99 119
% 4.9 4.2 4.2April 1,263 140 207
% 5.5 6.0 7.4May 1,713 190 115
% 7.5 8.1 4.1June 1,955 208 255
% 8.5 8.9 9.1July 3,631 345 363
% 15.8 14.8 12.9August 3,549 327 381
% 15.5 14.0 13.6September 2,745 161 304
% 10.2 6.9 10.8October 1,798 222 160
% 7.8 9.5 5.7November 1,430 107 229
% 6.2 4.6 8.2
Text Table 7.12 – ConcludedSelected Characteristics of Overnight Domestic VisitorsPerson-visits and % of total person-visits3
FestivalCharacteristic Ontario SWOTA Country
thousands
December 1,786 220 328% 7.8 9.4 11.7
Selected activitiesVisiting friends, relatives 14,719 1,670 1,832
% 64.1 71.6 65.3Shopping 6,527 697 829
% 28.4 29.9 29.5Sightseeing 5,036 411 768
% 21.9 17.6 27.4Attend festival, fair 1,069 95 146
% 4.7 4.1 5.2Attend cultural event 866 - 92
% 3.8 3.3Attend sports event 1,400 152 223
% 6.1 6.5 7.9Visit museum, gallery 1,164 - 94
% 5.1 3.4Visit national, provincial park 1,385 121 102
% 6.0 5.2 3.6Visit historic site 952 - 177
% 4.2 6.3Go to casino 605 - 274
% 2.6 9.8Walking, hiking 4,419 283 454
% 19.3 12.1 16.2
Accommodation (person-visit-nights) (selected)
Hotel 3,863 387 636% 11.9 11.6 19.8
Motel 1,370 117 220% 3.7 3.1 6.2
Camping or trailer park 1,805 217 200% 10.0 12.7 9.4
Home of friends, relatives 10,996 1,401 1,551% 47.4 61.2 55.8
Selected expenses ($000)Vehicle operation 531 44 56
% 17.7 17.7 15.0Recreation & entertainment 266 23 66
% 8.9 9.1 17.5
Expenditure rangesNo expenditure 4,164 389 439
% 18.1 16.7 15.6Less than $200 12,007 1,398 1,472
% 52.3 59.9 52.4More than $200 6,790 547 896
% 29.6 23.4 32.0Average age % 41.8 39.4 41.4Average length of stay (nights) % 2.9 2.8 2.3Average expenditure per trip 130.96 107.23 134.53
Average expenditure per night 44.54 38.02 58.75
Source: Special tabulations from Canadian Travel Survey - 1997 Year Totals.
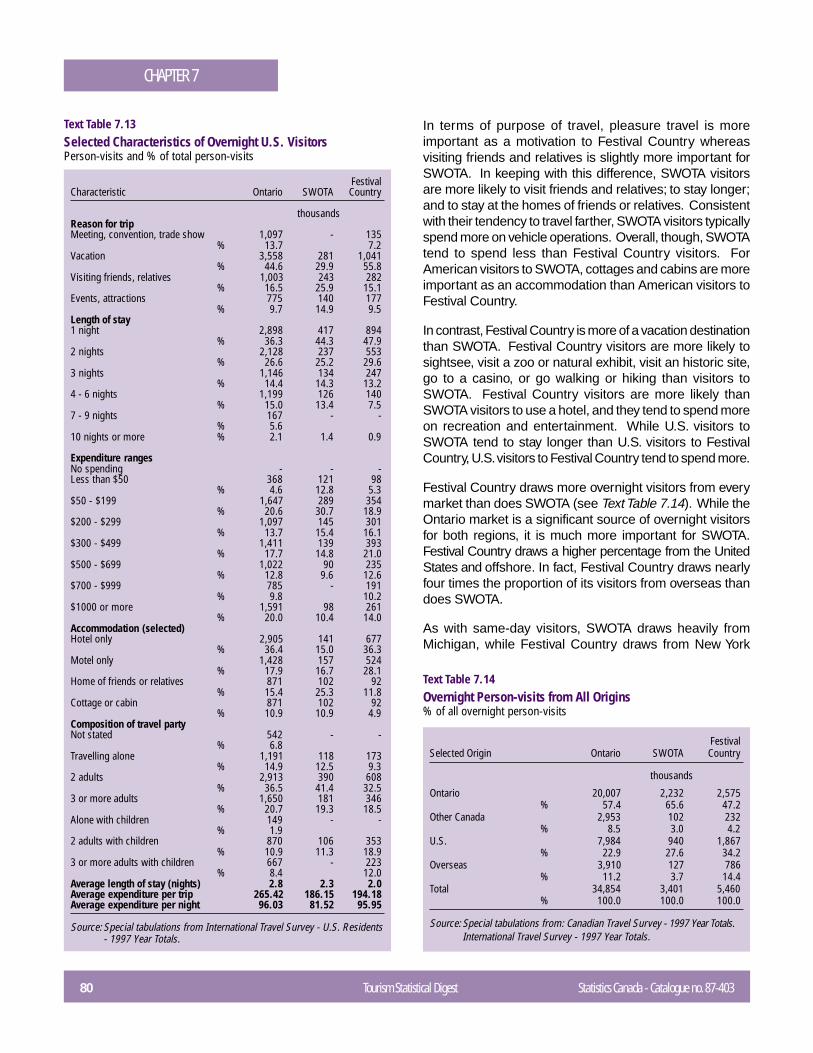
80 Tourism Statistical Digest Statistics Canada - Catalogue no. 87-403
CHAPTER 7
In terms of purpose of travel, pleasure travel is moreimportant as a motivation to Festival Country whereasvisiting friends and relatives is slightly more important forSWOTA. In keeping with this difference, SWOTA visitorsare more likely to visit friends and relatives; to stay longer;and to stay at the homes of friends or relatives. Consistentwith their tendency to travel farther, SWOTA visitors typicallyspend more on vehicle operations. Overall, though, SWOTAtend to spend less than Festival Country visitors. ForAmerican visitors to SWOTA, cottages and cabins are moreimportant as an accommodation than American visitors toFestival Country.
In contrast, Festival Country is more of a vacation destinationthan SWOTA. Festival Country visitors are more likely tosightsee, visit a zoo or natural exhibit, visit an historic site,go to a casino, or go walking or hiking than visitors toSWOTA. Festival Country visitors are more likely thanSWOTA visitors to use a hotel, and they tend to spend moreon recreation and entertainment. While U.S. visitors toSWOTA tend to stay longer than U.S. visitors to FestivalCountry, U.S. visitors to Festival Country tend to spend more.
Festival Country draws more overnight visitors from everymarket than does SWOTA (see Text Table 7.14). While theOntario market is a significant source of overnight visitorsfor both regions, it is much more important for SWOTA.Festival Country draws a higher percentage from the UnitedStates and offshore. In fact, Festival Country draws nearlyfour times the proportion of its visitors from overseas thandoes SWOTA.
As with same-day visitors, SWOTA draws heavily fromMichigan, while Festival Country draws from New York
Text Table 7.13Selected Characteristics of Overnight U.S. VisitorsPerson-visits and % of total person-visits
FestivalCharacteristic Ontario SWOTA Country
thousandsReason for tripMeeting, convention, trade show 1,097 - 135
% 13.7 7.2Vacation 3,558 281 1,041
% 44.6 29.9 55.8Visiting friends, relatives 1,003 243 282
% 16.5 25.9 15.1Events, attractions 775 140 177
% 9.7 14.9 9.5Length of stay1 night 2,898 417 894
% 36.3 44.3 47.92 nights 2,128 237 553
% 26.6 25.2 29.63 nights 1,146 134 247
% 14.4 14.3 13.24 - 6 nights 1,199 126 140
% 15.0 13.4 7.57 - 9 nights 167 - -
% 5.610 nights or more % 2.1 1.4 0.9
Expenditure rangesNo spending - - -Less than $50 368 121 98
% 4.6 12.8 5.3$50 - $199 1,647 289 354
% 20.6 30.7 18.9$200 - $299 1,097 145 301
% 13.7 15.4 16.1$300 - $499 1,411 139 393
% 17.7 14.8 21.0$500 - $699 1,022 90 235
% 12.8 9.6 12.6$700 - $999 785 - 191
% 9.8 10.2$1000 or more 1,591 98 261
% 20.0 10.4 14.0Accommodation (selected)Hotel only 2,905 141 677
% 36.4 15.0 36.3Motel only 1,428 157 524
% 17.9 16.7 28.1Home of friends or relatives 871 102 92
% 15.4 25.3 11.8Cottage or cabin 871 102 92
% 10.9 10.9 4.9Composition of travel partyNot stated 542 - -
% 6.8Travelling alone 1,191 118 173
% 14.9 12.5 9.32 adults 2,913 390 608
% 36.5 41.4 32.53 or more adults 1,650 181 346
% 20.7 19.3 18.5Alone with children 149 - -
% 1.92 adults with children 870 106 353
% 10.9 11.3 18.93 or more adults with children 667 - 223
% 8.4 12.0Average length of stay (nights) 2.8 2.3 2.0Average expenditure per trip 265.42 186.15 194.18Average expenditure per night 96.03 81.52 95.95
Source: Special tabulations from International Travel Survey - U.S. Residents- 1997 Year Totals.
Text Table 7.14Overnight Person-visits from All Origins% of all overnight person-visits
FestivalSelected Origin Ontario SWOTA Country
thousands
Ontario 20,007 2,232 2,575% 57.4 65.6 47.2
Other Canada 2,953 102 232% 8.5 3.0 4.2
U.S. 7,984 940 1,867% 22.9 27.6 34.2
Overseas 3,910 127 786% 11.2 3.7 14.4
Total 34,854 3,401 5,460% 100.0 100.0 100.0
Source: Special tabulations from: Canadian Travel Survey - 1997 Year Totals.International Travel Survey - 1997 Year Totals.
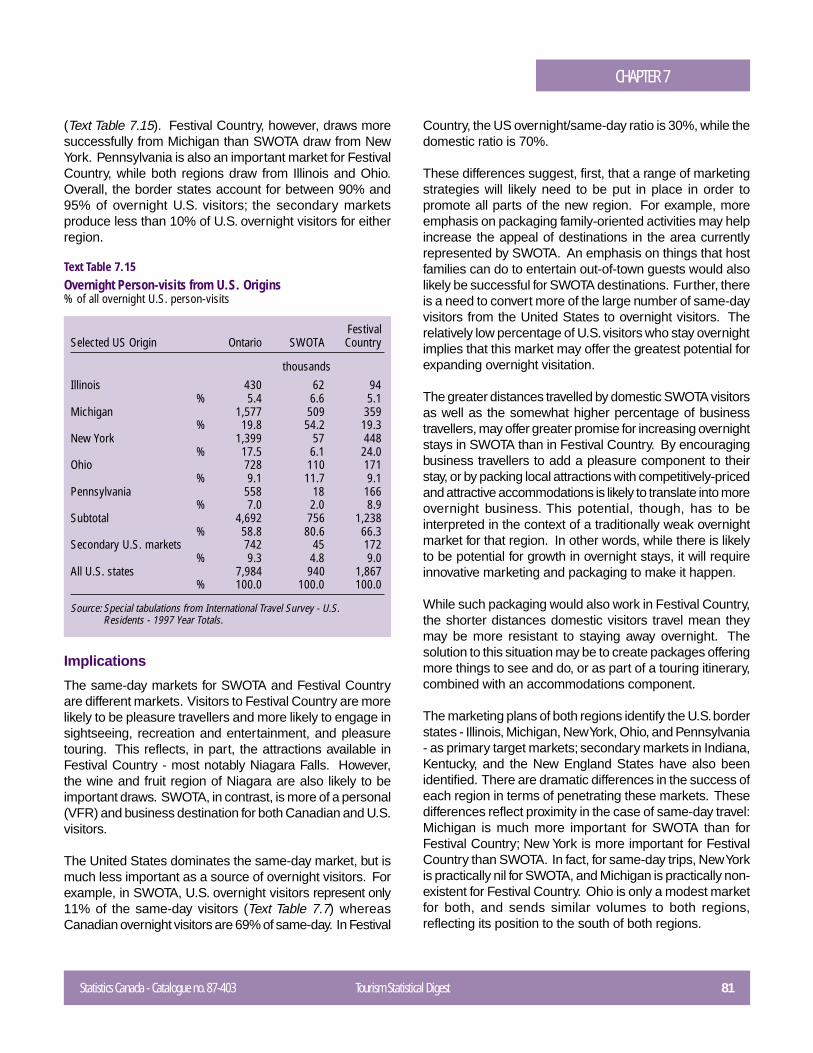
Statistics Canada - Catalogue no. 87-403 Tourism Statistical Digest 81
CHAPTER 7
(Text Table 7.15). Festival Country, however, draws moresuccessfully from Michigan than SWOTA draw from NewYork. Pennsylvania is also an important market for FestivalCountry, while both regions draw from Illinois and Ohio.Overall, the border states account for between 90% and95% of overnight U.S. visitors; the secondary marketsproduce less than 10% of U.S. overnight visitors for eitherregion.
Text Table 7.15Overnight Person-visits from U.S. Origins% of all overnight U.S. person-visits
FestivalSelected US Origin Ontario SWOTA Country
thousandsIllinois 430 62 94
% 5.4 6.6 5.1Michigan 1,577 509 359
% 19.8 54.2 19.3New York 1,399 57 448
% 17.5 6.1 24.0Ohio 728 110 171
% 9.1 11.7 9.1Pennsylvania 558 18 166
% 7.0 2.0 8.9Subtotal 4,692 756 1,238
% 58.8 80.6 66.3Secondary U.S. markets 742 45 172
% 9.3 4.8 9.0All U.S. states 7,984 940 1,867
% 100.0 100.0 100.0
Source: Special tabulations from International Travel Survey - U.S.Residents - 1997 Year Totals.
Implications
The same-day markets for SWOTA and Festival Countryare different markets. Visitors to Festival Country are morelikely to be pleasure travellers and more likely to engage insightseeing, recreation and entertainment, and pleasuretouring. This reflects, in part, the attractions available inFestival Country - most notably Niagara Falls. However,the wine and fruit region of Niagara are also likely to beimportant draws. SWOTA, in contrast, is more of a personal(VFR) and business destination for both Canadian and U.S.visitors.
The United States dominates the same-day market, but ismuch less important as a source of overnight visitors. Forexample, in SWOTA, U.S. overnight visitors represent only11% of the same-day visitors (Text Table 7.7) whereasCanadian overnight visitors are 69% of same-day. In Festival
Country, the US overnight/same-day ratio is 30%, while thedomestic ratio is 70%.
These differences suggest, first, that a range of marketingstrategies will likely need to be put in place in order topromote all parts of the new region. For example, moreemphasis on packaging family-oriented activities may helpincrease the appeal of destinations in the area currentlyrepresented by SWOTA. An emphasis on things that hostfamilies can do to entertain out-of-town guests would alsolikely be successful for SWOTA destinations. Further, thereis a need to convert more of the large number of same-dayvisitors from the United States to overnight visitors. Therelatively low percentage of U.S. visitors who stay overnightimplies that this market may offer the greatest potential forexpanding overnight visitation.
The greater distances travelled by domestic SWOTA visitorsas well as the somewhat higher percentage of businesstravellers, may offer greater promise for increasing overnightstays in SWOTA than in Festival Country. By encouragingbusiness travellers to add a pleasure component to theirstay, or by packing local attractions with competitively-pricedand attractive accommodations is likely to translate into moreovernight business. This potential, though, has to beinterpreted in the context of a traditionally weak overnightmarket for that region. In other words, while there is likelyto be potential for growth in overnight stays, it will requireinnovative marketing and packaging to make it happen.
While such packaging would also work in Festival Country,the shorter distances domestic visitors travel mean theymay be more resistant to staying away overnight. Thesolution to this situation may be to create packages offeringmore things to see and do, or as part of a touring itinerary,combined with an accommodations component.
The marketing plans of both regions identify the U.S. borderstates - Illinois, Michigan, New York, Ohio, and Pennsylvania- as primary target markets; secondary markets in Indiana,Kentucky, and the New England States have also beenidentified. There are dramatic differences in the success ofeach region in terms of penetrating these markets. Thesedifferences reflect proximity in the case of same-day travel:Michigan is much more important for SWOTA than forFestival Country; New York is more important for FestivalCountry than SWOTA. In fact, for same-day trips, New Yorkis practically nil for SWOTA, and Michigan is practically non-existent for Festival Country. Ohio is only a modest marketfor both, and sends similar volumes to both regions,reflecting its position to the south of both regions.
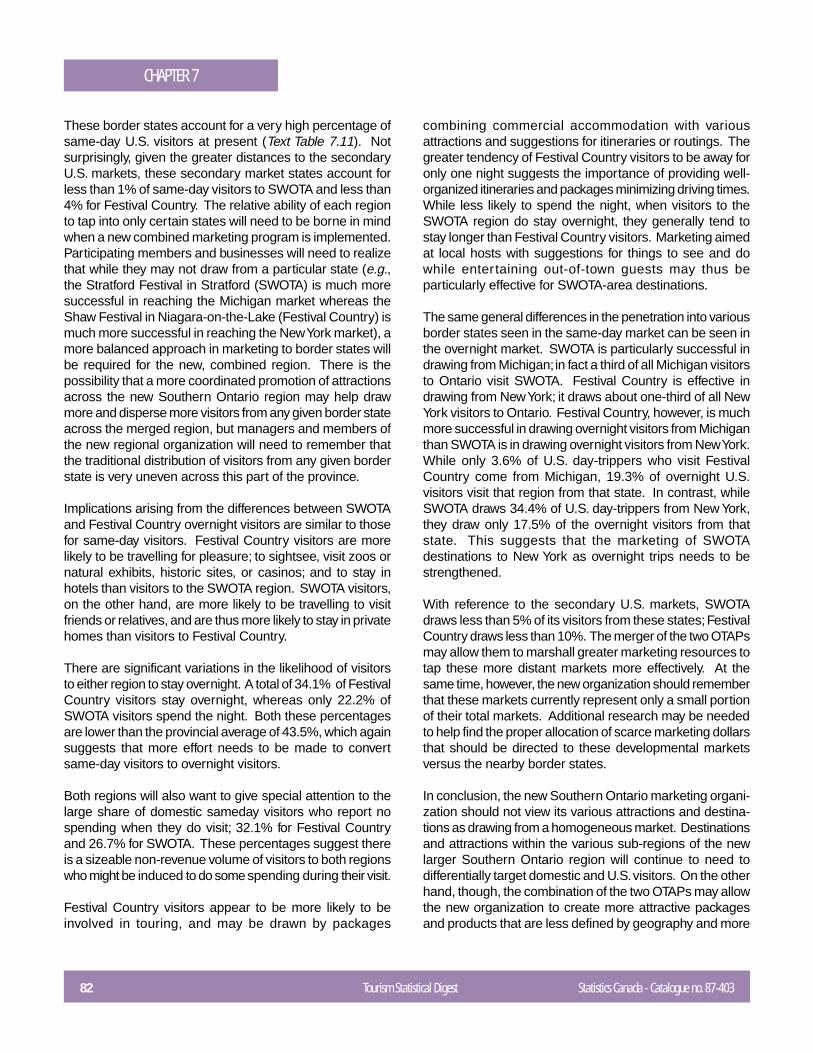
82 Tourism Statistical Digest Statistics Canada - Catalogue no. 87-403
CHAPTER 7
These border states account for a very high percentage ofsame-day U.S. visitors at present (Text Table 7.11). Notsurprisingly, given the greater distances to the secondaryU.S. markets, these secondary market states account forless than 1% of same-day visitors to SWOTA and less than4% for Festival Country. The relative ability of each regionto tap into only certain states will need to be borne in mindwhen a new combined marketing program is implemented.Participating members and businesses will need to realizethat while they may not draw from a particular state (e.g.,the Stratford Festival in Stratford (SWOTA) is much moresuccessful in reaching the Michigan market whereas theShaw Festival in Niagara-on-the-Lake (Festival Country) ismuch more successful in reaching the New York market), amore balanced approach in marketing to border states willbe required for the new, combined region. There is thepossibility that a more coordinated promotion of attractionsacross the new Southern Ontario region may help drawmore and disperse more visitors from any given border stateacross the merged region, but managers and members ofthe new regional organization will need to remember thatthe traditional distribution of visitors from any given borderstate is very uneven across this part of the province.
Implications arising from the differences between SWOTAand Festival Country overnight visitors are similar to thosefor same-day visitors. Festival Country visitors are morelikely to be travelling for pleasure; to sightsee, visit zoos ornatural exhibits, historic sites, or casinos; and to stay inhotels than visitors to the SWOTA region. SWOTA visitors,on the other hand, are more likely to be travelling to visitfriends or relatives, and are thus more likely to stay in privatehomes than visitors to Festival Country.
There are significant variations in the likelihood of visitorsto either region to stay overnight. A total of 34.1% of FestivalCountry visitors stay overnight, whereas only 22.2% ofSWOTA visitors spend the night. Both these percentagesare lower than the provincial average of 43.5%, which againsuggests that more effort needs to be made to convertsame-day visitors to overnight visitors.
Both regions will also want to give special attention to thelarge share of domestic sameday visitors who report nospending when they do visit; 32.1% for Festival Countryand 26.7% for SWOTA. These percentages suggest thereis a sizeable non-revenue volume of visitors to both regionswho might be induced to do some spending during their visit.
Festival Country visitors appear to be more likely to beinvolved in touring, and may be drawn by packages
combining commercial accommodation with variousattractions and suggestions for itineraries or routings. Thegreater tendency of Festival Country visitors to be away foronly one night suggests the importance of providing well-organized itineraries and packages minimizing driving times.While less likely to spend the night, when visitors to theSWOTA region do stay overnight, they generally tend tostay longer than Festival Country visitors. Marketing aimedat local hosts with suggestions for things to see and dowhile entertaining out-of-town guests may thus beparticularly effective for SWOTA-area destinations.
The same general differences in the penetration into variousborder states seen in the same-day market can be seen inthe overnight market. SWOTA is particularly successful indrawing from Michigan; in fact a third of all Michigan visitorsto Ontario visit SWOTA. Festival Country is effective indrawing from New York; it draws about one-third of all NewYork visitors to Ontario. Festival Country, however, is muchmore successful in drawing overnight visitors from Michiganthan SWOTA is in drawing overnight visitors from New York.While only 3.6% of U.S. day-trippers who visit FestivalCountry come from Michigan, 19.3% of overnight U.S.visitors visit that region from that state. In contrast, whileSWOTA draws 34.4% of U.S. day-trippers from New York,they draw only 17.5% of the overnight visitors from thatstate. This suggests that the marketing of SWOTAdestinations to New York as overnight trips needs to bestrengthened.
With reference to the secondary U.S. markets, SWOTAdraws less than 5% of its visitors from these states; FestivalCountry draws less than 10%. The merger of the two OTAPsmay allow them to marshall greater marketing resources totap these more distant markets more effectively. At thesame time, however, the new organization should rememberthat these markets currently represent only a small portionof their total markets. Additional research may be neededto help find the proper allocation of scarce marketing dollarsthat should be directed to these developmental marketsversus the nearby border states.
In conclusion, the new Southern Ontario marketing organi-zation should not view its various attractions and destina-tions as drawing from a homogeneous market. Destinationsand attractions within the various sub-regions of the newlarger Southern Ontario region will continue to need todifferentially target domestic and U.S. visitors. On the otherhand, though, the combination of the two OTAPs may allowthe new organization to create more attractive packagesand products that are less defined by geography and more
Statistics Canada - Catalogue no. 87-403 Tourism Statistical Digest 83
CHAPTER 7
defined in terms of experiences. For example, the mergerwill bring the Shaw Festival (in Festival Country) and theStratford Festival (in SWOTA) together in the same region.While these two theatrical companies do already cooperateto an extent, their union in a new, larger marketing regionmay facilitate even more joint promotion. Similarly, theagricultural and wine industries of both regions might bemore easily marketed as broader touring experiences thanis currently the case.
Notes
1 The unit of analysis for visitor volumes is “person-visits”. Aperson-visit is one visit by one person (either same-day orovernight). No distinction is made between multiple visits byone person and multiple persons making a single visit. In otherwords, two person-visits may refer to one person making twovisits or two people making one visit.
84 Tourism Statistical Digest Statistics Canada - Catalogue no. 87-403
CHAPTER 7
Tourism Generating Regions in Canada:Factors Associated with Travel Patterns andTourist BehavioursBryan J.A. Smale and Candace I.J. NykiforukDepartment of Recreation and Leisure StudiesUniversity of Waterloo
Background
This analysis is based on the assumption that a basic precursor tounderstanding tourism behaviour is an examination of the movement ofpeople from one place to another1. As the two key elements of this assumptionare people and place, we focused on the examination of place from ageographical or spatial perspective, and considered people in relation toplace based on their demographic and behavioural characteristics. In thislatter regard, this project was unique in that it focused on the origins oftourists rather than on their destinations, and it goes beyond much of theexisting research on tourism behaviour which has typically focused on peopleand only rarely included a consideration of place2.
The focus of the analysis on flows of tourists from generating regions inCanada, rather than on both origin and destination regions, was based uponboth conceptual and methodological foundations. From a conceptualstandpoint, there is a gap in the tourism literature on origins and theirpopulations’ characteristics as determining factors in the propensity togenerate tourists from specific regions. Most of the literature has tended tofocus on the drawing power, or attractivity, of destination regions. Furthermore,information about the tourists themselves could be put to better use by linkingit with information about the regions from which the tourists come for thepurpose of defining potential markets for tourism.
Secondly, a methodological strategy based in geographic analysis – locationquotients – provided an innovative means by which tourism generatingpotential might be measured and assessed against a variety of demographicand behavioural factors. The approach opened up an area largely unexploredby tourism researchers, and used simple, accessible methods that make itadaptable to a great variety of tourism settings3. This study also providednew information that should be of interest in the recognition of existing andpotential tourism markets, and how the numbers of tourists originating fromdifferent regions, and the demographic and behavioural factors that mayinfluence their travel, will affect those markets.
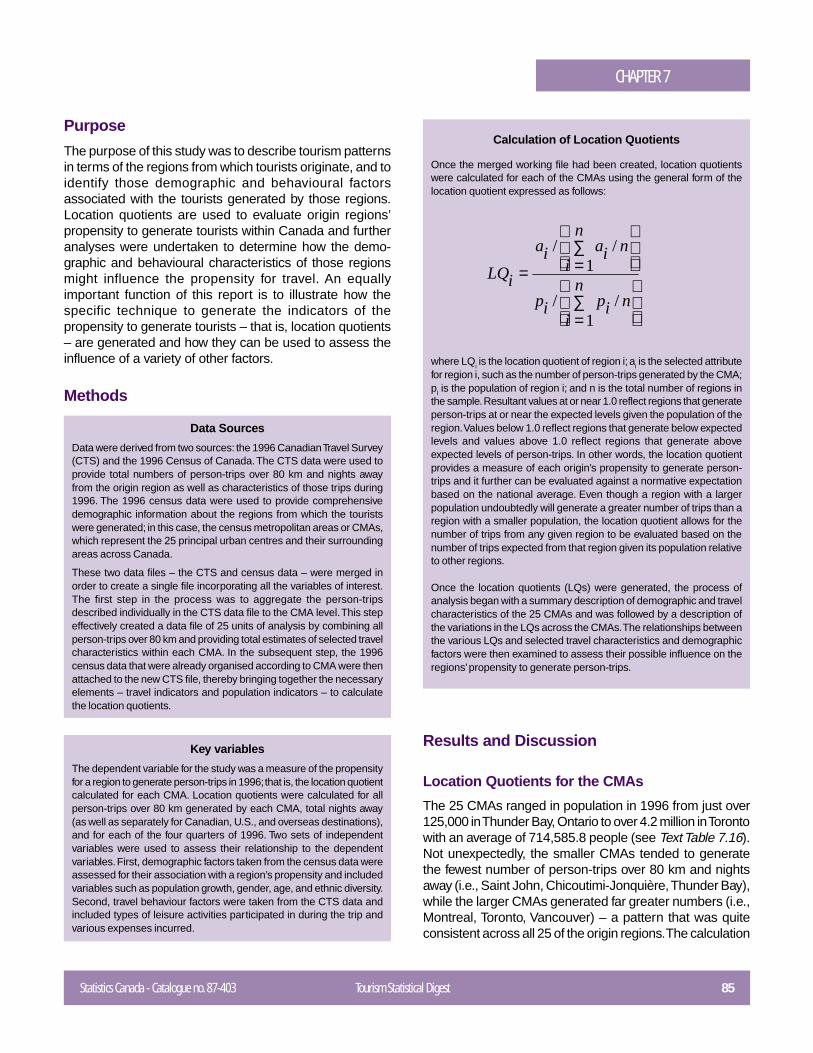
Statistics Canada - Catalogue no. 87-403 Tourism Statistical Digest 85
CHAPTER 7
Purpose
The purpose of this study was to describe tourism patternsin terms of the regions from which tourists originate, and toidentify those demographic and behavioural factorsassociated with the tourists generated by those regions.Location quotients are used to evaluate origin regions’propensity to generate tourists within Canada and furtheranalyses were undertaken to determine how the demo-graphic and behavioural characteristics of those regionsmight influence the propensity for travel. An equallyimportant function of this report is to illustrate how thespecific technique to generate the indicators of thepropensity to generate tourists – that is, location quotients– are generated and how they can be used to assess theinfluence of a variety of other factors.
Methods
Data Sources
Data were derived from two sources: the 1996 Canadian Travel Survey(CTS) and the 1996 Census of Canada. The CTS data were used toprovide total numbers of person-trips over 80 km and nights awayfrom the origin region as well as characteristics of those trips during1996. The 1996 census data were used to provide comprehensivedemographic information about the regions from which the touristswere generated; in this case, the census metropolitan areas or CMAs,which represent the 25 principal urban centres and their surroundingareas across Canada.
These two data files – the CTS and census data – were merged inorder to create a single file incorporating all the variables of interest.The first step in the process was to aggregate the person-tripsdescribed individually in the CTS data file to the CMA level. This stepeffectively created a data file of 25 units of analysis by combining allperson-trips over 80 km and providing total estimates of selected travelcharacteristics within each CMA. In the subsequent step, the 1996census data that were already organised according to CMA were thenattached to the new CTS file, thereby bringing together the necessaryelements – travel indicators and population indicators – to calculatethe location quotients.
Key variables
The dependent variable for the study was a measure of the propensityfor a region to generate person-trips in 1996; that is, the location quotientcalculated for each CMA. Location quotients were calculated for allperson-trips over 80 km generated by each CMA, total nights away(as well as separately for Canadian, U.S., and overseas destinations),and for each of the four quarters of 1996. Two sets of independentvariables were used to assess their relationship to the dependentvariables. First, demographic factors taken from the census data wereassessed for their association with a region’s propensity and includedvariables such as population growth, gender, age, and ethnic diversity.Second, travel behaviour factors were taken from the CTS data andincluded types of leisure activities participated in during the trip andvarious expenses incurred.
Calculation of Location Quotients
Once the merged working file had been created, location quotientswere calculated for each of the CMAs using the general form of thelocation quotient expressed as follows:
where LQi is the location quotient of region i; ai is the selected attributefor region i, such as the number of person-trips generated by the CMA;pI is the population of region i; and n is the total number of regions inthe sample. Resultant values at or near 1.0 reflect regions that generateperson-trips at or near the expected levels given the population of theregion. Values below 1.0 reflect regions that generate below expectedlevels and values above 1.0 reflect regions that generate aboveexpected levels of person-trips. In other words, the location quotientprovides a measure of each origin’s propensity to generate person-trips and it further can be evaluated against a normative expectationbased on the national average. Even though a region with a largerpopulation undoubtedly will generate a greater number of trips than aregion with a smaller population, the location quotient allows for thenumber of trips from any given region to be evaluated based on thenumber of trips expected from that region given its population relativeto other regions.
Once the location quotients (LQs) were generated, the process ofanalysis began with a summary description of demographic and travelcharacteristics of the 25 CMAs and was followed by a description ofthe variations in the LQs across the CMAs. The relationships betweenthe various LQs and selected travel characteristics and demographicfactors were then examined to assess their possible influence on theregions’ propensity to generate person-trips.
Results and Discussion
Location Quotients for the CMAs
The 25 CMAs ranged in population in 1996 from just over125,000 in Thunder Bay, Ontario to over 4.2 million in Torontowith an average of 714,585.8 people (see Text Table 7.16).Not unexpectedly, the smaller CMAs tended to generatethe fewest number of person-trips over 80 km and nightsaway (i.e., Saint John, Chicoutimi-Jonquière, Thunder Bay),while the larger CMAs generated far greater numbers (i.e.,Montreal, Toronto, Vancouver) – a pattern that was quiteconsistent across all 25 of the origin regions. The calculation
∑=
∑==n
inipip
n
iniaia
iLQ
1//
1//
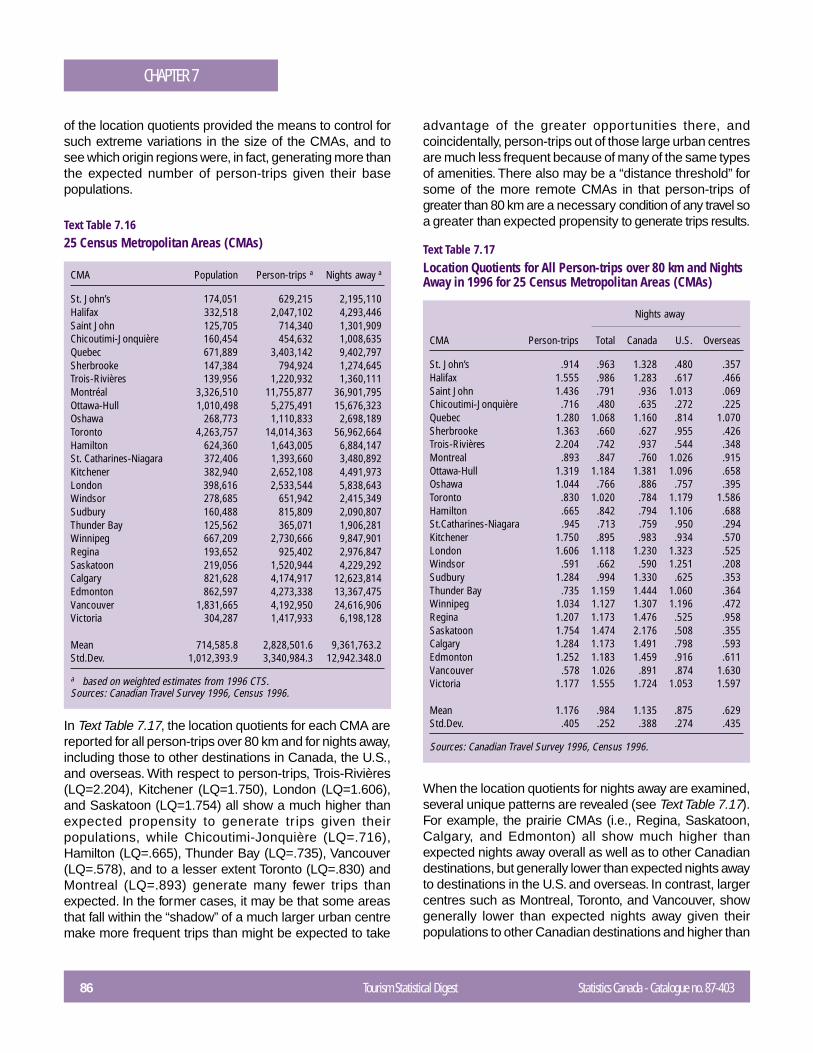
86 Tourism Statistical Digest Statistics Canada - Catalogue no. 87-403
CHAPTER 7
of the location quotients provided the means to control forsuch extreme variations in the size of the CMAs, and tosee which origin regions were, in fact, generating more thanthe expected number of person-trips given their basepopulations.
Text Table 7.1625 Census Metropolitan Areas (CMAs)
CMA Population Person-trips a Nights away a
St. John’s 174,051 629,215 2,195,110Halifax 332,518 2,047,102 4,293,446Saint John 125,705 714,340 1,301,909Chicoutimi-Jonquière 160,454 454,632 1,008,635Quebec 671,889 3,403,142 9,402,797Sherbrooke 147,384 794,924 1,274,645Trois-Rivières 139,956 1,220,932 1,360,111Montréal 3,326,510 11,755,877 36,901,795Ottawa-Hull 1,010,498 5,275,491 15,676,323Oshawa 268,773 1,110,833 2,698,189Toronto 4,263,757 14,014,363 56,962,664Hamilton 624,360 1,643,005 6,884,147St. Catharines-Niagara 372,406 1,393,660 3,480,892Kitchener 382,940 2,652,108 4,491,973London 398,616 2,533,544 5,838,643Windsor 278,685 651,942 2,415,349Sudbury 160,488 815,809 2,090,807Thunder Bay 125,562 365,071 1,906,281Winnipeg 667,209 2,730,666 9,847,901Regina 193,652 925,402 2,976,847Saskatoon 219,056 1,520,944 4,229,292Calgary 821,628 4,174,917 12,623,814Edmonton 862,597 4,273,338 13,367,475Vancouver 1,831,665 4,192,950 24,616,906Victoria 304,287 1,417,933 6,198,128
Mean 714,585.8 2,828,501.6 9,361,763.2Std.Dev. 1,012,393.9 3,340,984.3 12,942.348.0
a based on weighted estimates from 1996 CTS.Sources: Canadian Travel Survey 1996, Census 1996.
In Text Table 7.17, the location quotients for each CMA arereported for all person-trips over 80 km and for nights away,including those to other destinations in Canada, the U.S.,and overseas. With respect to person-trips, Trois-Rivières(LQ=2.204), Kitchener (LQ=1.750), London (LQ=1.606),and Saskatoon (LQ=1.754) all show a much higher thanexpected propensity to generate tr ips given theirpopulations, while Chicoutimi-Jonquière (LQ=.716),Hamilton (LQ=.665), Thunder Bay (LQ=.735), Vancouver(LQ=.578), and to a lesser extent Toronto (LQ=.830) andMontreal (LQ=.893) generate many fewer trips thanexpected. In the former cases, it may be that some areasthat fall within the “shadow” of a much larger urban centremake more frequent trips than might be expected to take
advantage of the greater opportunities there, andcoincidentally, person-trips out of those large urban centresare much less frequent because of many of the same typesof amenities. There also may be a “distance threshold” forsome of the more remote CMAs in that person-trips ofgreater than 80 km are a necessary condition of any travel soa greater than expected propensity to generate trips results.
Text Table 7.17Location Quotients for All Person-trips over 80 km and NightsAway in 1996 for 25 Census Metropolitan Areas (CMAs)
Nights away
CMA Person-trips Total Canada U.S. Overseas
St. John’s .914 .963 1.328 .480 .357Halifax 1.555 .986 1.283 .617 .466Saint John 1.436 .791 .936 1.013 .069Chicoutimi-Jonquière .716 .480 .635 .272 .225Quebec 1.280 1.068 1.160 .814 1.070Sherbrooke 1.363 .660 .627 .955 .426Trois-Rivières 2.204 .742 .937 .544 .348Montreal .893 .847 .760 1.026 .915Ottawa-Hull 1.319 1.184 1.381 1.096 .658Oshawa 1.044 .766 .886 .757 .395Toronto .830 1.020 .784 1.179 1.586Hamilton .665 .842 .794 1.106 .688St.Catharines-Niagara .945 .713 .759 .950 .294Kitchener 1.750 .895 .983 .934 .570London 1.606 1.118 1.230 1.323 .525Windsor .591 .662 .590 1.251 .208Sudbury 1.284 .994 1.330 .625 .353Thunder Bay .735 1.159 1.444 1.060 .364Winnipeg 1.034 1.127 1.307 1.196 .472Regina 1.207 1.173 1.476 .525 .958Saskatoon 1.754 1.474 2.176 .508 .355Calgary 1.284 1.173 1.491 .798 .593Edmonton 1.252 1.183 1.459 .916 .611Vancouver .578 1.026 .891 .874 1.630Victoria 1.177 1.555 1.724 1.053 1.597
Mean 1.176 .984 1.135 .875 .629Std.Dev. .405 .252 .388 .274 .435
Sources: Canadian Travel Survey 1996, Census 1996.
When the location quotients for nights away are examined,several unique patterns are revealed (see Text Table 7.17).For example, the prairie CMAs (i.e., Regina, Saskatoon,Calgary, and Edmonton) all show much higher thanexpected nights away overall as well as to other Canadiandestinations, but generally lower than expected nights awayto destinations in the U.S. and overseas. In contrast, largercentres such as Montreal, Toronto, and Vancouver, showgenerally lower than expected nights away given theirpopulations to other Canadian destinations and higher than
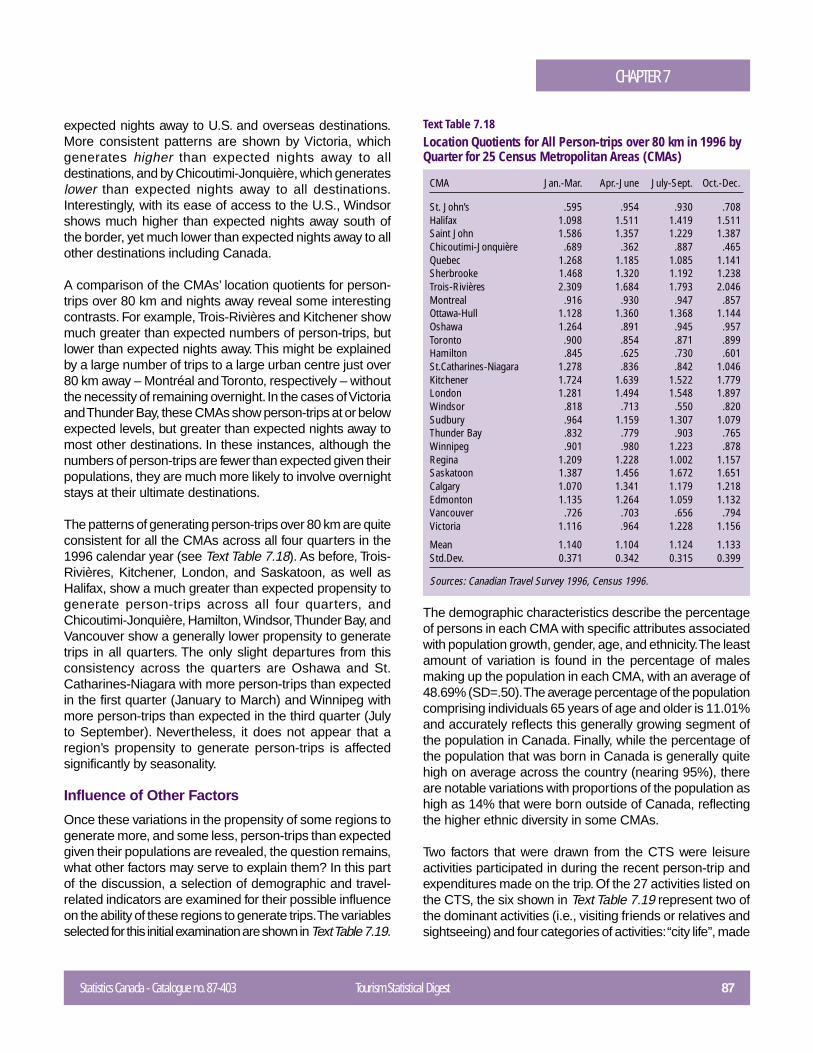
Statistics Canada - Catalogue no. 87-403 Tourism Statistical Digest 87
CHAPTER 7
expected nights away to U.S. and overseas destinations.More consistent patterns are shown by Victoria, whichgenerates higher than expected nights away to alldestinations, and by Chicoutimi-Jonquière, which generateslower than expected nights away to all destinations.Interestingly, with its ease of access to the U.S., Windsorshows much higher than expected nights away south ofthe border, yet much lower than expected nights away to allother destinations including Canada.
A comparison of the CMAs’ location quotients for person-trips over 80 km and nights away reveal some interestingcontrasts. For example, Trois-Rivières and Kitchener showmuch greater than expected numbers of person-trips, butlower than expected nights away. This might be explainedby a large number of trips to a large urban centre just over80 km away – Montréal and Toronto, respectively – withoutthe necessity of remaining overnight. In the cases of Victoriaand Thunder Bay, these CMAs show person-trips at or belowexpected levels, but greater than expected nights away tomost other destinations. In these instances, although thenumbers of person-trips are fewer than expected given theirpopulations, they are much more likely to involve overnightstays at their ultimate destinations.
The patterns of generating person-trips over 80 km are quiteconsistent for all the CMAs across all four quarters in the1996 calendar year (see Text Table 7.18). As before, Trois-Rivières, Kitchener, London, and Saskatoon, as well asHalifax, show a much greater than expected propensity togenerate person-trips across all four quarters, andChicoutimi-Jonquière, Hamilton, Windsor, Thunder Bay, andVancouver show a generally lower propensity to generatetrips in all quarters. The only slight departures from thisconsistency across the quarters are Oshawa and St.Catharines-Niagara with more person-trips than expectedin the first quarter (January to March) and Winnipeg withmore person-trips than expected in the third quarter (Julyto September). Nevertheless, it does not appear that aregion’s propensity to generate person-trips is affectedsignificantly by seasonality.
Influence of Other Factors
Once these variations in the propensity of some regions togenerate more, and some less, person-trips than expectedgiven their populations are revealed, the question remains,what other factors may serve to explain them? In this partof the discussion, a selection of demographic and travel-related indicators are examined for their possible influenceon the ability of these regions to generate trips. The variablesselected for this initial examination are shown in Text Table 7.19.
Text Table 7.18Location Quotients for All Person-trips over 80 km in 1996 byQuarter for 25 Census Metropolitan Areas (CMAs)
CMA Jan.-Mar. Apr.-June July-Sept. Oct.-Dec.
St. John’s .595 .954 .930 .708Halifax 1.098 1.511 1.419 1.511Saint John 1.586 1.357 1.229 1.387Chicoutimi-Jonquière .689 .362 .887 .465Quebec 1.268 1.185 1.085 1.141Sherbrooke 1.468 1.320 1.192 1.238Trois-Rivières 2.309 1.684 1.793 2.046Montreal .916 .930 .947 .857Ottawa-Hull 1.128 1.360 1.368 1.144Oshawa 1.264 .891 .945 .957Toronto .900 .854 .871 .899Hamilton .845 .625 .730 .601St.Catharines-Niagara 1.278 .836 .842 1.046Kitchener 1.724 1.639 1.522 1.779London 1.281 1.494 1.548 1.897Windsor .818 .713 .550 .820Sudbury .964 1.159 1.307 1.079Thunder Bay .832 .779 .903 .765Winnipeg .901 .980 1.223 .878Regina 1.209 1.228 1.002 1.157Saskatoon 1.387 1.456 1.672 1.651Calgary 1.070 1.341 1.179 1.218Edmonton 1.135 1.264 1.059 1.132Vancouver .726 .703 .656 .794Victoria 1.116 .964 1.228 1.156
Mean 1.140 1.104 1.124 1.133Std.Dev. 0.371 0.342 0.315 0.399
Sources: Canadian Travel Survey 1996, Census 1996.
The demographic characteristics describe the percentageof persons in each CMA with specific attributes associatedwith population growth, gender, age, and ethnicity. The leastamount of variation is found in the percentage of malesmaking up the population in each CMA, with an average of48.69% (SD=.50). The average percentage of the populationcomprising individuals 65 years of age and older is 11.01%and accurately reflects this generally growing segment ofthe population in Canada. Finally, while the percentage ofthe population that was born in Canada is generally quitehigh on average across the country (nearing 95%), thereare notable variations with proportions of the population ashigh as 14% that were born outside of Canada, reflectingthe higher ethnic diversity in some CMAs.
Two factors that were drawn from the CTS were leisureactivities participated in during the recent person-trip andexpenditures made on the trip. Of the 27 activities listed onthe CTS, the six shown in Text Table 7.19 represent two ofthe dominant activities (i.e., visiting friends or relatives andsightseeing) and four categories of activities: “city life”, made
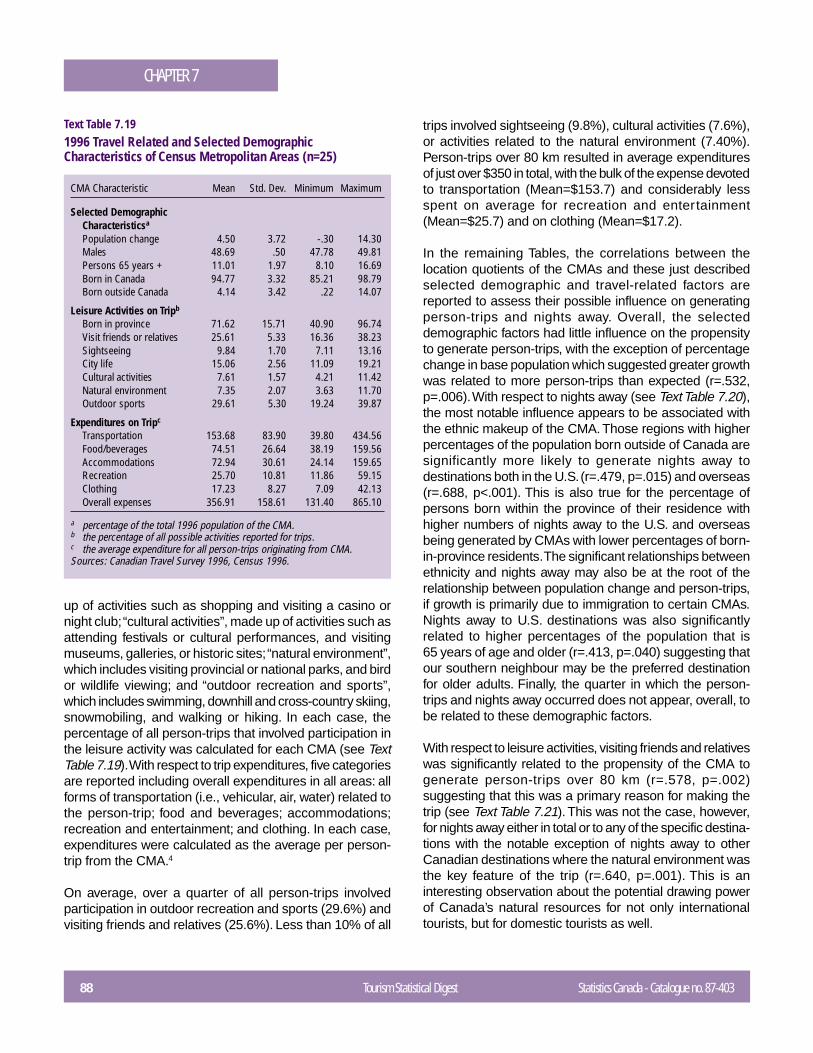
88 Tourism Statistical Digest Statistics Canada - Catalogue no. 87-403
CHAPTER 7
Text Table 7.191996 Travel Related and Selected DemographicCharacteristics of Census Metropolitan Areas (n=25)
CMA Characteristic Mean Std. Dev. Minimum Maximum
Selected DemographicCharacteristicsa
Population change 4.50 3.72 -.30 14.30Males 48.69 .50 47.78 49.81Persons 65 years + 11.01 1.97 8.10 16.69Born in Canada 94.77 3.32 85.21 98.79Born outside Canada 4.14 3.42 .22 14.07
Leisure Activities on Tripb
Born in province 71.62 15.71 40.90 96.74Visit friends or relatives 25.61 5.33 16.36 38.23Sightseeing 9.84 1.70 7.11 13.16City life 15.06 2.56 11.09 19.21Cultural activities 7.61 1.57 4.21 11.42Natural environment 7.35 2.07 3.63 11.70Outdoor sports 29.61 5.30 19.24 39.87
Expenditures on Tripc
Transportation 153.68 83.90 39.80 434.56Food/beverages 74.51 26.64 38.19 159.56Accommodations 72.94 30.61 24.14 159.65Recreation 25.70 10.81 11.86 59.15Clothing 17.23 8.27 7.09 42.13Overall expenses 356.91 158.61 131.40 865.10
a percentage of the total 1996 population of the CMA.b the percentage of all possible activities reported for trips.c the average expenditure for all person-trips originating from CMA.Sources: Canadian Travel Survey 1996, Census 1996.
up of activities such as shopping and visiting a casino ornight club; “cultural activities”, made up of activities such asattending festivals or cultural performances, and visitingmuseums, galleries, or historic sites; “natural environment”,which includes visiting provincial or national parks, and birdor wildlife viewing; and “outdoor recreation and sports”,which includes swimming, downhill and cross-country skiing,snowmobiling, and walking or hiking. In each case, thepercentage of all person-trips that involved participation inthe leisure activity was calculated for each CMA (see TextTable 7.19). With respect to trip expenditures, five categoriesare reported including overall expenditures in all areas: allforms of transportation (i.e., vehicular, air, water) related tothe person-trip; food and beverages; accommodations;recreation and entertainment; and clothing. In each case,expenditures were calculated as the average per person-trip from the CMA.4
On average, over a quarter of all person-trips involvedparticipation in outdoor recreation and sports (29.6%) andvisiting friends and relatives (25.6%). Less than 10% of all
trips involved sightseeing (9.8%), cultural activities (7.6%),or activities related to the natural environment (7.40%).Person-trips over 80 km resulted in average expendituresof just over $350 in total, with the bulk of the expense devotedto transportation (Mean=$153.7) and considerably lessspent on average for recreation and entertainment(Mean=$25.7) and on clothing (Mean=$17.2).
In the remaining Tables, the correlations between thelocation quotients of the CMAs and these just describedselected demographic and travel-related factors arereported to assess their possible influence on generatingperson-trips and nights away. Overall, the selecteddemographic factors had little influence on the propensityto generate person-trips, with the exception of percentagechange in base population which suggested greater growthwas related to more person-trips than expected (r=.532,p=.006). With respect to nights away (see Text Table 7.20),the most notable influence appears to be associated withthe ethnic makeup of the CMA. Those regions with higherpercentages of the population born outside of Canada aresignificantly more likely to generate nights away todestinations both in the U.S. (r=.479, p=.015) and overseas(r=.688, p<.001). This is also true for the percentage ofpersons born within the province of their residence withhigher numbers of nights away to the U.S. and overseasbeing generated by CMAs with lower percentages of born-in-province residents. The significant relationships betweenethnicity and nights away may also be at the root of therelationship between population change and person-trips,if growth is primarily due to immigration to certain CMAs.Nights away to U.S. destinations was also significantlyrelated to higher percentages of the population that is65 years of age and older (r=.413, p=.040) suggesting thatour southern neighbour may be the preferred destinationfor older adults. Finally, the quarter in which the person-trips and nights away occurred does not appear, overall, tobe related to these demographic factors.
With respect to leisure activities, visiting friends and relativeswas significantly related to the propensity of the CMA togenerate person-trips over 80 km (r=.578, p=.002)suggesting that this was a primary reason for making thetrip (see Text Table 7.21). This was not the case, however,for nights away either in total or to any of the specific destina-tions with the notable exception of nights away to otherCanadian destinations where the natural environment wasthe key feature of the trip (r=.640, p=.001). This is aninteresting observation about the potential drawing powerof Canada’s natural resources for not only internationaltourists, but for domestic tourists as well.
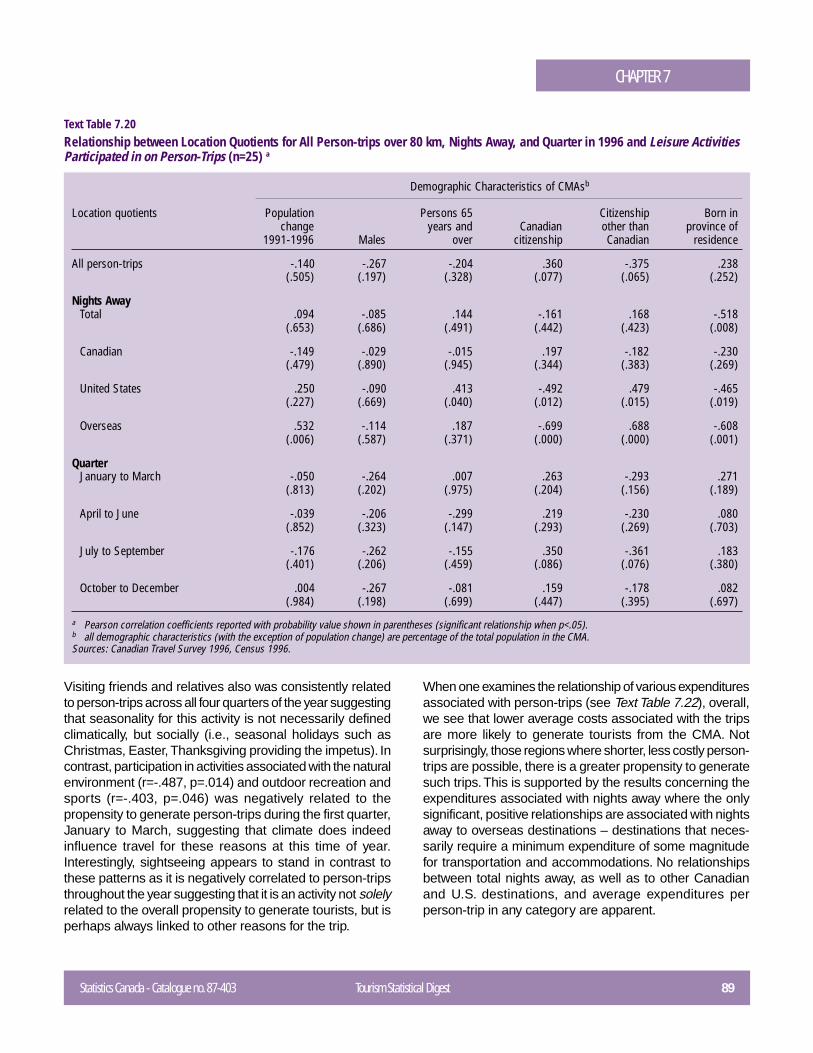
Statistics Canada - Catalogue no. 87-403 Tourism Statistical Digest 89
CHAPTER 7
Demographic Characteristics of CMAsb
Location quotients Population Persons 65 Citizenship Born inchange years and Canadian other than province of
1991-1996 Males over citizenship Canadian residence
All person-trips -.140 -.267 -.204 .360 -.375 .238(.505) (.197) (.328) (.077) (.065) (.252)
Nights AwayTotal .094 -.085 .144 -.161 .168 -.518
(.653) (.686) (.491) (.442) (.423) (.008)
Canadian -.149 -.029 -.015 .197 -.182 -.230(.479) (.890) (.945) (.344) (.383) (.269)
United States .250 -.090 .413 -.492 .479 -.465(.227) (.669) (.040) (.012) (.015) (.019)
Overseas .532 -.114 .187 -.699 .688 -.608(.006) (.587) (.371) (.000) (.000) (.001)
QuarterJanuary to March -.050 -.264 .007 .263 -.293 .271
(.813) (.202) (.975) (.204) (.156) (.189)
April to June -.039 -.206 -.299 .219 -.230 .080(.852) (.323) (.147) (.293) (.269) (.703)
July to September -.176 -.262 -.155 .350 -.361 .183(.401) (.206) (.459) (.086) (.076) (.380)
October to December .004 -.267 -.081 .159 -.178 .082(.984) (.198) (.699) (.447) (.395) (.697)
a Pearson correlation coefficients reported with probability value shown in parentheses (significant relationship when p<.05).b all demographic characteristics (with the exception of population change) are percentage of the total population in the CMA.Sources: Canadian Travel Survey 1996, Census 1996.
Text Table 7.20Relationship between Location Quotients for All Person-trips over 80 km, Nights Away, and Quarter in 1996 and Leisure ActivitiesParticipated in on Person-Trips (n=25) a
Visiting friends and relatives also was consistently relatedto person-trips across all four quarters of the year suggestingthat seasonality for this activity is not necessarily definedclimatically, but socially (i.e., seasonal holidays such asChristmas, Easter, Thanksgiving providing the impetus). Incontrast, participation in activities associated with the naturalenvironment (r=-.487, p=.014) and outdoor recreation andsports (r=-.403, p=.046) was negatively related to thepropensity to generate person-trips during the first quarter,January to March, suggesting that climate does indeedinfluence travel for these reasons at this time of year.Interestingly, sightseeing appears to stand in contrast tothese patterns as it is negatively correlated to person-tripsthroughout the year suggesting that it is an activity not solelyrelated to the overall propensity to generate tourists, but isperhaps always linked to other reasons for the trip.
When one examines the relationship of various expendituresassociated with person-trips (see Text Table 7.22), overall,we see that lower average costs associated with the tripsare more likely to generate tourists from the CMA. Notsurprisingly, those regions where shorter, less costly person-trips are possible, there is a greater propensity to generatesuch trips. This is supported by the results concerning theexpenditures associated with nights away where the onlysignificant, positive relationships are associated with nightsaway to overseas destinations – destinations that neces-sarily require a minimum expenditure of some magnitudefor transportation and accommodations. No relationshipsbetween total nights away, as well as to other Canadianand U.S. destinations, and average expenditures perperson-trip in any category are apparent.
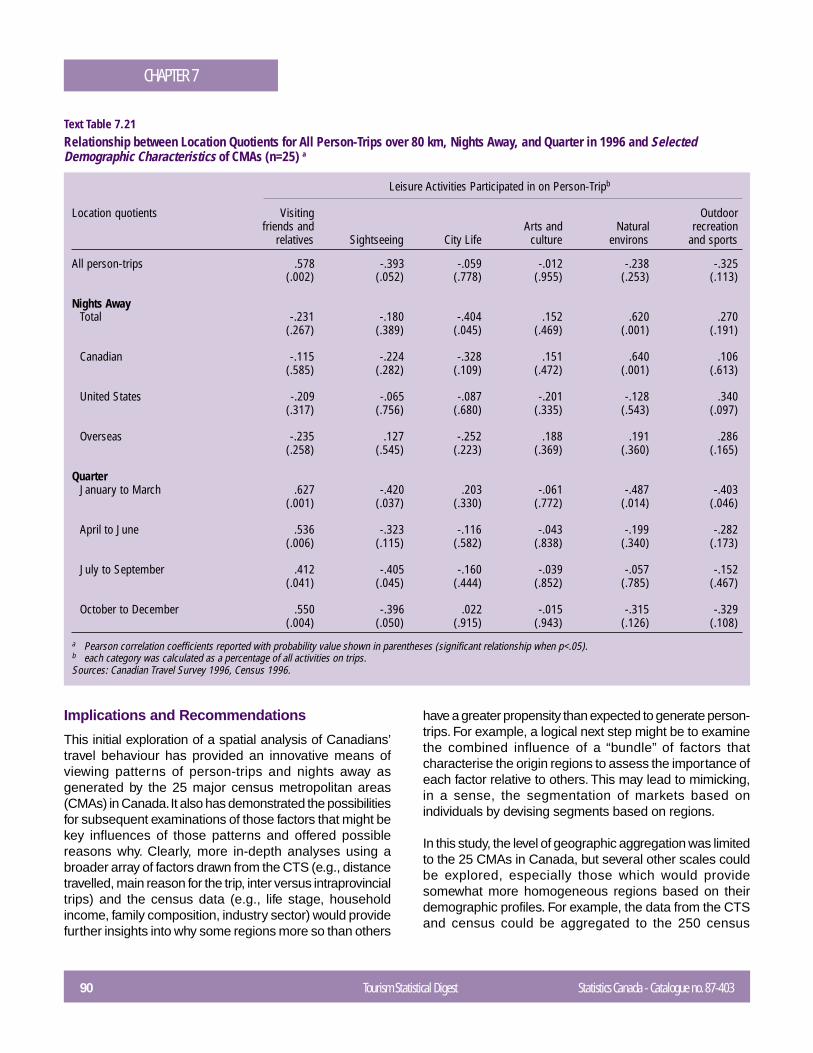
90 Tourism Statistical Digest Statistics Canada - Catalogue no. 87-403
CHAPTER 7
Leisure Activities Participated in on Person-Tripb
Location quotients Visiting Outdoorfriends and Arts and Natural recreation
relatives Sightseeing City Life culture environs and sports
All person-trips .578 -.393 -.059 -.012 -.238 -.325(.002) (.052) (.778) (.955) (.253) (.113)
Nights AwayTotal -.231 -.180 -.404 .152 .620 .270
(.267) (.389) (.045) (.469) (.001) (.191)
Canadian -.115 -.224 -.328 .151 .640 .106(.585) (.282) (.109) (.472) (.001) (.613)
United States -.209 -.065 -.087 -.201 -.128 .340(.317) (.756) (.680) (.335) (.543) (.097)
Overseas -.235 .127 -.252 .188 .191 .286(.258) (.545) (.223) (.369) (.360) (.165)
QuarterJanuary to March .627 -.420 .203 -.061 -.487 -.403
(.001) (.037) (.330) (.772) (.014) (.046)
April to June .536 -.323 -.116 -.043 -.199 -.282(.006) (.115) (.582) (.838) (.340) (.173)
July to September .412 -.405 -.160 -.039 -.057 -.152(.041) (.045) (.444) (.852) (.785) (.467)
October to December .550 -.396 .022 -.015 -.315 -.329(.004) (.050) (.915) (.943) (.126) (.108)
a Pearson correlation coefficients reported with probability value shown in parentheses (significant relationship when p<.05).b each category was calculated as a percentage of all activities on trips.Sources: Canadian Travel Survey 1996, Census 1996.
Text Table 7.21Relationship between Location Quotients for All Person-Trips over 80 km, Nights Away, and Quarter in 1996 and SelectedDemographic Characteristics of CMAs (n=25) a
Implications and Recommendations
This initial exploration of a spatial analysis of Canadians’travel behaviour has provided an innovative means ofviewing patterns of person-trips and nights away asgenerated by the 25 major census metropolitan areas(CMAs) in Canada. It also has demonstrated the possibilitiesfor subsequent examinations of those factors that might bekey influences of those patterns and offered possiblereasons why. Clearly, more in-depth analyses using abroader array of factors drawn from the CTS (e.g., distancetravelled, main reason for the trip, inter versus intraprovincialtrips) and the census data (e.g., life stage, householdincome, family composition, industry sector) would providefurther insights into why some regions more so than others
have a greater propensity than expected to generate person-trips. For example, a logical next step might be to examinethe combined influence of a “bundle” of factors thatcharacterise the origin regions to assess the importance ofeach factor relative to others. This may lead to mimicking,in a sense, the segmentation of markets based onindividuals by devising segments based on regions.
In this study, the level of geographic aggregation was limitedto the 25 CMAs in Canada, but several other scales couldbe explored, especially those which would providesomewhat more homogeneous regions based on theirdemographic profiles. For example, the data from the CTSand census could be aggregated to the 250 census
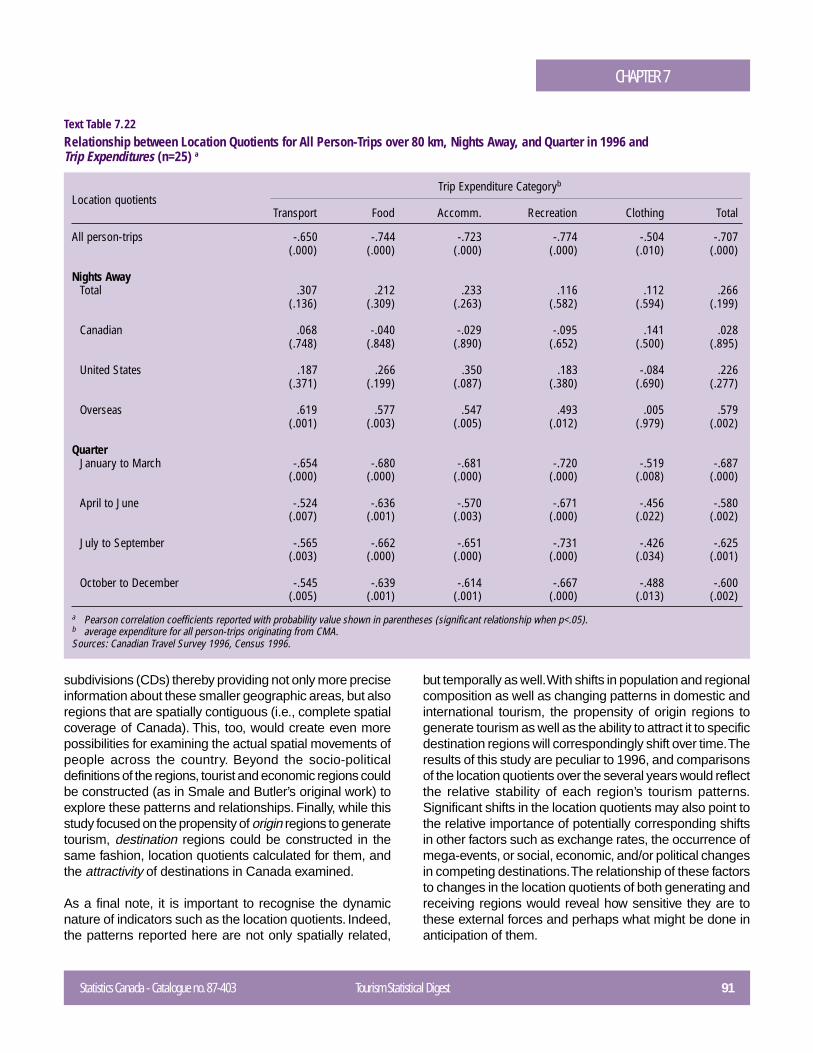
Statistics Canada - Catalogue no. 87-403 Tourism Statistical Digest 91
CHAPTER 7
Trip Expenditure Categoryb
Location quotientsTransport Food Accomm. Recreation Clothing Total
All person-trips -.650 -.744 -.723 -.774 -.504 -.707(.000) (.000) (.000) (.000) (.010) (.000)
Nights AwayTotal .307 .212 .233 .116 .112 .266
(.136) (.309) (.263) (.582) (.594) (.199)
Canadian .068 -.040 -.029 -.095 .141 .028(.748) (.848) (.890) (.652) (.500) (.895)
United States .187 .266 .350 .183 -.084 .226(.371) (.199) (.087) (.380) (.690) (.277)
Overseas .619 .577 .547 .493 .005 .579(.001) (.003) (.005) (.012) (.979) (.002)
QuarterJanuary to March -.654 -.680 -.681 -.720 -.519 -.687
(.000) (.000) (.000) (.000) (.008) (.000)
April to June -.524 -.636 -.570 -.671 -.456 -.580(.007) (.001) (.003) (.000) (.022) (.002)
July to September -.565 -.662 -.651 -.731 -.426 -.625(.003) (.000) (.000) (.000) (.034) (.001)
October to December -.545 -.639 -.614 -.667 -.488 -.600(.005) (.001) (.001) (.000) (.013) (.002)
a Pearson correlation coefficients reported with probability value shown in parentheses (significant relationship when p<.05).b average expenditure for all person-trips originating from CMA.Sources: Canadian Travel Survey 1996, Census 1996.
Text Table 7.22Relationship between Location Quotients for All Person-Trips over 80 km, Nights Away, and Quarter in 1996 andTrip Expenditures (n=25) a
subdivisions (CDs) thereby providing not only more preciseinformation about these smaller geographic areas, but alsoregions that are spatially contiguous (i.e., complete spatialcoverage of Canada). This, too, would create even morepossibilities for examining the actual spatial movements ofpeople across the country. Beyond the socio-politicaldefinitions of the regions, tourist and economic regions couldbe constructed (as in Smale and Butler’s original work) toexplore these patterns and relationships. Finally, while thisstudy focused on the propensity of origin regions to generatetourism, destination regions could be constructed in thesame fashion, location quotients calculated for them, andthe attractivity of destinations in Canada examined.
As a final note, it is important to recognise the dynamicnature of indicators such as the location quotients. Indeed,the patterns reported here are not only spatially related,
but temporally as well. With shifts in population and regionalcomposition as well as changing patterns in domestic andinternational tourism, the propensity of origin regions togenerate tourism as well as the ability to attract it to specificdestination regions will correspondingly shift over time. Theresults of this study are peculiar to 1996, and comparisonsof the location quotients over the several years would reflectthe relative stability of each region’s tourism patterns.Significant shifts in the location quotients may also point tothe relative importance of potentially corresponding shiftsin other factors such as exchange rates, the occurrence ofmega-events, or social, economic, and/or political changesin competing destinations. The relationship of these factorsto changes in the location quotients of both generating andreceiving regions would reveal how sensitive they are tothese external forces and perhaps what might be done inanticipation of them.
92 Tourism Statistical Digest Statistics Canada - Catalogue no. 87-403
CHAPTER 7
Notes
1 Smith, S.L.J. (1995). Tourism analysis: A handbook. (2nd ed.).Harlow, UK: Longman.
2 Bonn, M.A., Furr, L.H., & Uysal, M. (1992). Seasonal variationof coastal resort visitors: Hilton Head Island. Journal of TravelResearch, 31, 50-56.Pearce, D. (1995). Tourism today: A geographical analysis.(2nd ed.). Harlow, UK: Longman.Warnick, R.B. (1993, October). U.S. domestic travel, 1979 to1991: Generational trends in travel. Abstracts of the LeisureResearch Symposium, National Recreation and ParksAssociation Congress, Tourism and Leisure Section, San Jose,California, October 21-24, 1993.
Yoon, J., & Shafer, E.L. (1996). Models of U.S. travel demandpatterns for the Bahamas. Journal of Travel Research, 35, 1:50-56.
3 For more details on previous work that led to the developmentof the methodology used in the analysis, please contact theauthors at the University of Waterloo.
4 Calculating the percentage of person-trips involving the leisureactivity and the average expenditure per person-trip was aneffective means of controlling for wide variations in the totalamount of person-trips and expenditures across the 25 CMAs,which otherwise would have exaggerated the subsequentstatistical relationships.
CHAPTER 8A GLANCE AT THE FUTURE
Statistics Canada - Catalogue no. 87-403 Tourism Statistical Digest 93
Introduction
The continuing rapid expansion of tourism is a striking feature of the modernperiod of economic growth. International tourism, in particular, is frequentlycited as one of the major manifestations of globalization along withtransportation and communications with which it is closely linked1. Tourismhas been and continues to be seen as a leading growth sector and jobcreator in both the Canadian2 and the world economy3. This optimistic outlookcontinues despite the recent and continuing economic crisis in many majorAsian economies and the attendant slowdown in tourism growth, both withinthe region of East Asia and in many destination economies throughout theworld4. The purpose of this chapter is, first, to review some of the currentlong and medium term forecasts for tourism globally and within Canada.Secondly, the chapter discusses some of the Canadian tourism industries’current responses to their changing economic and social context.
World Tourism Long Term Forecasts
Some have argued that tourism is the largest and fastest growing industryin the world5. At the same time, however, these generalizations have beenchallenged and debated due to the gaps and limitations of existing globaldata and the lack of accepted economic measurement standards for tourismthat would enable comparisons with other economic activities in nationaland global economic accounts. What is indisputable is that growth rates forinternational tourism activity, have been, and are projected to continue tobe, substantially greater than the rates of growth of national income in generaland world economic growth overall.
According to a World Tourism Organization forecasting study, “Tourism 2020Vision”, international tourism arrivals worldwide will grow from 560 million in1995 to 1.6 billion in the year 2020. More specifically, international arrivalsare forecast to rise to 573 million in 2000, top 1.0 billion in 2010 and reachthe 1.6 billion mark in 2020. Correspondingly, tourism receipts will growfrom US$ 400 billion in 1995 to US$ 2 trillion. These growth projectionsrepresent sustained average annual rates of growth of 4.3% in arrivals and6.7% in receipts – exceeding by far maximum projected growth rates forworld wealth in general.
Scott Meis,Canadian Tourism Commission
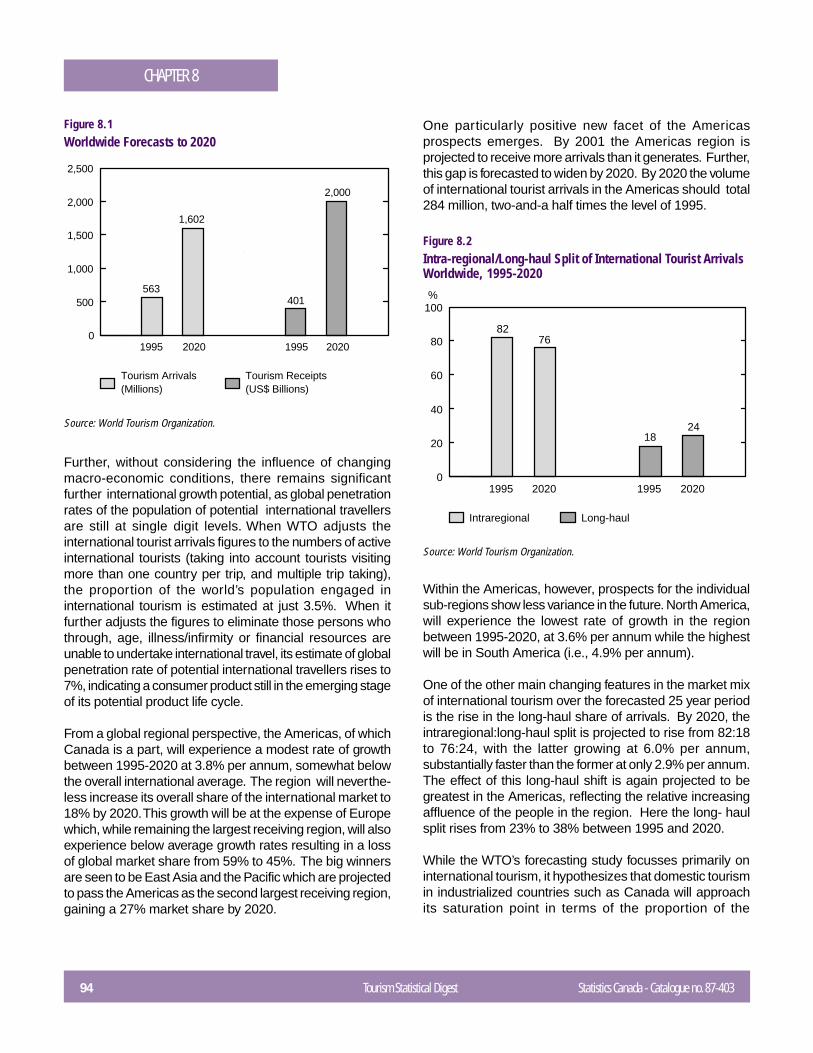
94 Tourism Statistical Digest Statistics Canada - Catalogue no. 87-403
CHAPTER 8
Further, without considering the influence of changingmacro-economic conditions, there remains significantfurther international growth potential, as global penetrationrates of the population of potential international travellersare still at single digit levels. When WTO adjusts theinternational tourist arrivals figures to the numbers of activeinternational tourists (taking into account tourists visitingmore than one country per trip, and multiple trip taking),the proportion of the world’s population engaged ininternational tourism is estimated at just 3.5%. When itfurther adjusts the figures to eliminate those persons whothrough, age, illness/infirmity or financial resources areunable to undertake international travel, its estimate of globalpenetration rate of potential international travellers rises to7%, indicating a consumer product still in the emerging stageof its potential product life cycle.
From a global regional perspective, the Americas, of whichCanada is a part, will experience a modest rate of growthbetween 1995-2020 at 3.8% per annum, somewhat belowthe overall international average. The region will neverthe-less increase its overall share of the international market to18% by 2020. This growth will be at the expense of Europewhich, while remaining the largest receiving region, will alsoexperience below average growth rates resulting in a lossof global market share from 59% to 45%. The big winnersare seen to be East Asia and the Pacific which are projectedto pass the Americas as the second largest receiving region,gaining a 27% market share by 2020.
Figure 8.1Worldwide Forecasts to 2020
Source: World Tourism Organization.
One particularly positive new facet of the Americasprospects emerges. By 2001 the Americas region isprojected to receive more arrivals than it generates. Further,this gap is forecasted to widen by 2020. By 2020 the volumeof international tourist arrivals in the Americas should total284 million, two-and-a half times the level of 1995.
Figure 8.2Intra-regional/Long-haul Split of International Tourist ArrivalsWorldwide, 1995-2020
Source: World Tourism Organization.
Within the Americas, however, prospects for the individualsub-regions show less variance in the future. North America,will experience the lowest rate of growth in the regionbetween 1995-2020, at 3.6% per annum while the highestwill be in South America (i.e., 4.9% per annum).
One of the other main changing features in the market mixof international tourism over the forecasted 25 year periodis the rise in the long-haul share of arrivals. By 2020, theintraregional:long-haul split is projected to rise from 82:18to 76:24, with the latter growing at 6.0% per annum,substantially faster than the former at only 2.9% per annum.The effect of this long-haul shift is again projected to begreatest in the Americas, reflecting the relative increasingaffluence of the people in the region. Here the long- haulsplit rises from 23% to 38% between 1995 and 2020.
While the WTO’s forecasting study focusses primarily oninternational tourism, it hypothesizes that domestic tourismin industrialized countries such as Canada will approachits saturation point in terms of the proportion of the
0
500
1,000
1,500
2,000
2,500
Tourism Arrivals (Millions)
Tourism Receipts (US$ Billions)
1995 19952020 2020
563
1,602
401
2,000
0
20
40
60
80
100
Intraregional Long-haul
1995 19952020 2020
8276
1824
%
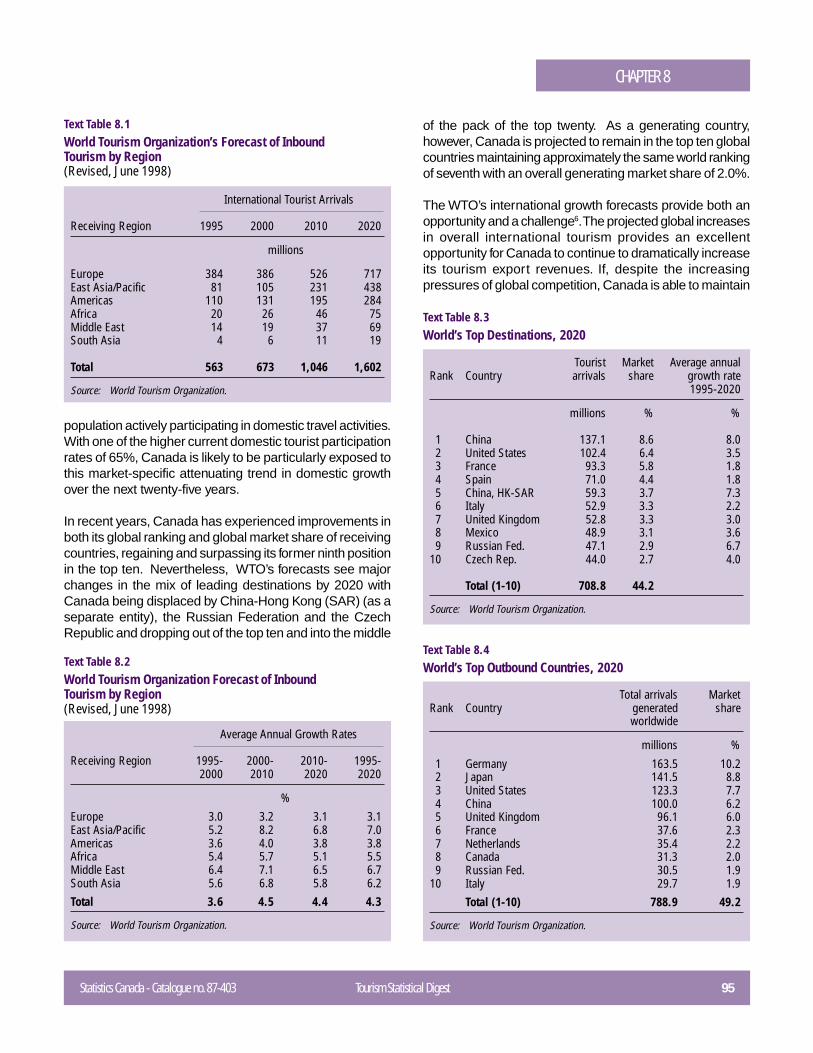
Statistics Canada - Catalogue no. 87-403 Tourism Statistical Digest 95
CHAPTER 8
Text Table 8.1World Tourism Organization’s Forecast of InboundTourism by Region(Revised, June 1998)
International Tourist Arrivals
Receiving Region 1995 2000 2010 2020
millions
Europe 384 386 526 717East Asia/Pacific 81 105 231 438Americas 110 131 195 284Africa 20 26 46 75Middle East 14 19 37 69South Asia 4 6 11 19
Total 563 673 1,046 1,602
Source: World Tourism Organization.
population actively participating in domestic travel activities.With one of the higher current domestic tourist participationrates of 65%, Canada is likely to be particularly exposed tothis market-specific attenuating trend in domestic growthover the next twenty-five years.
In recent years, Canada has experienced improvements inboth its global ranking and global market share of receivingcountries, regaining and surpassing its former ninth positionin the top ten. Nevertheless, WTO’s forecasts see majorchanges in the mix of leading destinations by 2020 withCanada being displaced by China-Hong Kong (SAR) (as aseparate entity), the Russian Federation and the CzechRepublic and dropping out of the top ten and into the middle
Text Table 8.2World Tourism Organization Forecast of InboundTourism by Region(Revised, June 1998)
Average Annual Growth Rates
Receiving Region 1995- 2000- 2010- 1995-2000 2010 2020 2020
%Europe 3.0 3.2 3.1 3.1East Asia/Pacific 5.2 8.2 6.8 7.0Americas 3.6 4.0 3.8 3.8Africa 5.4 5.7 5.1 5.5Middle East 6.4 7.1 6.5 6.7South Asia 5.6 6.8 5.8 6.2Total 3.6 4.5 4.4 4.3
Source: World Tourism Organization.
of the pack of the top twenty. As a generating country,however, Canada is projected to remain in the top ten globalcountries maintaining approximately the same world rankingof seventh with an overall generating market share of 2.0%.
The WTO’s international growth forecasts provide both anopportunity and a challenge6. The projected global increasesin overall international tourism provides an excellentopportunity for Canada to continue to dramatically increaseits tourism export revenues. If, despite the increasingpressures of global competition, Canada is able to maintain
Text Table 8.3World’s Top Destinations, 2020
Tourist Market Average annualRank Country arrivals share growth rate
1995-2020
millions % %
1 China 137.1 8.6 8.02 United States 102.4 6.4 3.53 France 93.3 5.8 1.84 Spain 71.0 4.4 1.85 China, HK-SAR 59.3 3.7 7.36 Italy 52.9 3.3 2.27 United Kingdom 52.8 3.3 3.08 Mexico 48.9 3.1 3.69 Russian Fed. 47.1 2.9 6.7
10 Czech Rep. 44.0 2.7 4.0
Total (1-10) 708.8 44.2
Source: World Tourism Organization.
Text Table 8.4World’s Top Outbound Countries, 2020
Total arrivals MarketRank Country generated share
worldwide
millions %
1 Germany 163.5 10.22 Japan 141.5 8.83 United States 123.3 7.74 China 100.0 6.25 United Kingdom 96.1 6.06 France 37.6 2.37 Netherlands 35.4 2.28 Canada 31.3 2.09 Russian Fed. 30.5 1.9
10 Italy 29.7 1.9Total (1-10) 788.9 49.2
Source: World Tourism Organization.
96 Tourism Statistical Digest Statistics Canada - Catalogue no. 87-403
CHAPTER 8
its current global destination ranking and market share ofapproximately 2.0% of world-wide international receipts,international visitors could generate incremental revenuesof US$ 30 billion by 2020.
Canada’s Medium Term Tourism Forecasts
The Canadian Tourism Commission publishes regular shortand medium term forecasts for all Canada’s major primaryand secondary markets7. These forecasts are updatedannually by the Conference Board of Canada, CanadianTourism Research Institute based on a combination of aneconometric model developed by the Conference Boardand expert judgement adjustments provided by CanadianTourism Commission staff to capture the effect of non-economic events.
The coverage of the forecasts includes international travelvolumes, receipts and expenditures, account balance aswell as yields for Canada’s major primary and secondarymarkets of interest. Aggregate forecasts are also producedas a weighted average of individual country forecasts.
According to the CTC’s forecasts, overnight travel to Canadafrom all international destinations will grow from 18.8 millionin 1998 to 22.6 million in 2003. However, the annual rate ofgrowth will decline over the medium term forecast period.Overall growth rates per annum in this period will declinefrom the 6.8% in 1998 to a low of 3.0% in 2001 and 2002.A rebound in this declining medium term scenario is notexpected until after 2003.
Overnight travel from overseas destinations will increasefrom 3.9 million in 1998 to 4.4 million in visits in 2003. Whilesharp declines are expected in 1998 (-7.1%), these declinesare expected to level off in 1999 and 2000 and then reboundmoderately in 2001 through 2003.
Smaller declines in Europe in 1998 (-2.2%) and a quickerand sharper rebound in 1999 through 2003 is expected tooffset the continuing weak performance and slower recoveryfrom the Asian markets.
The outlook for the United States on the other hand,continues to be a good news story. The CTC projects thatovernight U.S. travel will increase 7.0% in 1999 and 5.0%in 2000, resulting in an overall increase in overnight trips
from the United States to Canada from 14.5 million in 1998to 18.3 million in 2003. This rosy scenario is a result of thecombination of a U.S. economy projected to remain strong(albeit, somewhat slower); the continuing positive impact ofthe Open Skies agreement and the relative value of theCanadian dollar in foreign exchange markets.
Travel by air will continue to increase at a faster pacecompared with other modes of travel, primarily auto. Stronggrowth rates of 10.0% per annum or more are forecast forovernight trips from the United States to Canada by air inthe short term while more moderate rates of 4.5% perannum are forecast in the period 2001-2003.
One of the major changes in Canada’s international travelsituation in the past few years has been the double digitdeclines in overnight travel to the United States. As a resultof the recent depreciation of the Canadian dollar againstthe U.S. dollar, Canadians decided to either travel withinCanada or visit overseas destinations. Another factorinfluencing Canadians’ choice of a vacation in Canadainstead of the United States is the CTC’s new domesticmarketing initiative. This program targets Canadians whoregularly visit the United States, but could potentially bepersuaded to travel in Canada instead.
The CTC’s 1999 Spring Update of its International TravelForecasts projects that overnight travel to the United Stateswill continue to decline in the short term, but will bottom outand begin to rebound slowly in the period 2000-2003 inresponse to a higher valued Canadian dollar. However,growth rates in outbound overnight travel to the UnitedStates are expected to peak at 2.7% in 2001-2002.
The current trends of declining visits and expenditures byCanadians in the United States in combination with therecent surge in U.S. visits to Canada and a very strong(25%) increase in U.S. travel receipts in Canada haveproduced Canada’s lowest travel deficit with the UnitedStates in recent history. If these trends continue as forecast,the United States travel deficit will reach 0 in the year 2000and become a growing surplus through 2002. By 2002,CTC forecasts that the value of the U.S. travel surplus couldreach nearly $1.3 billion. On the other hand, Canada’s totalworld travel balance is expected to reach its lowest level in2000 at $1.14 billion but gradually inch its way back up to$1.21 billion by 2003.
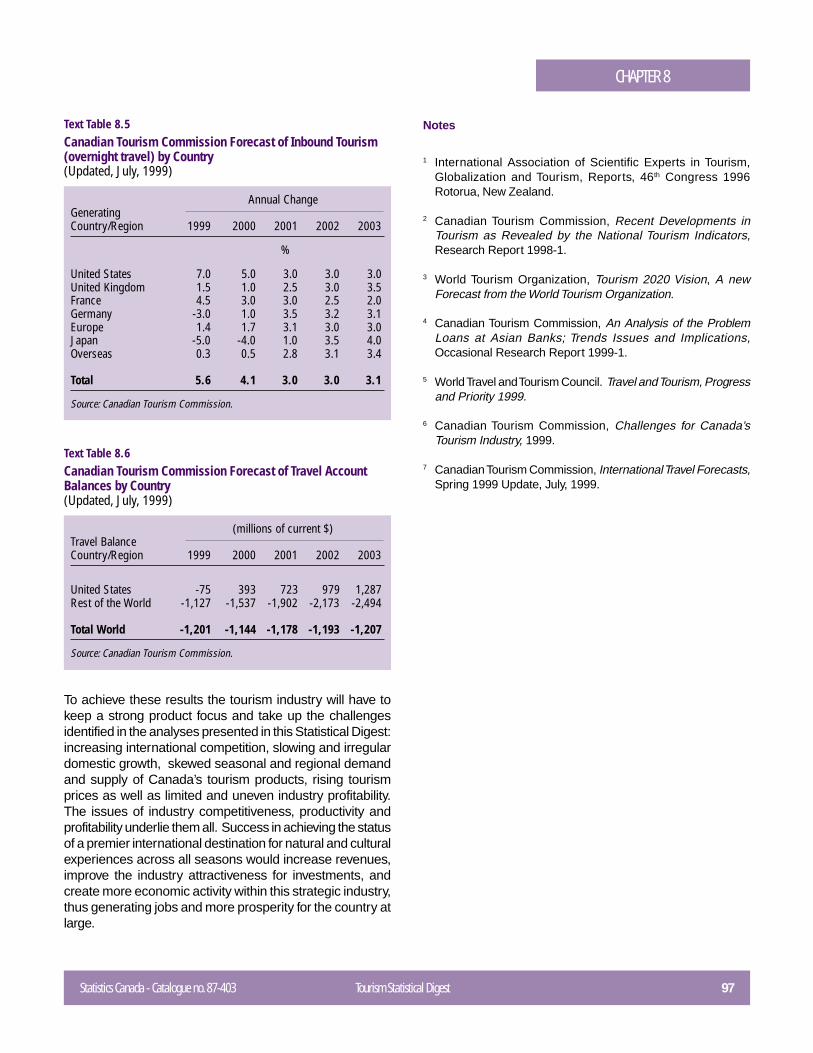
Statistics Canada - Catalogue no. 87-403 Tourism Statistical Digest 97
CHAPTER 8
Text Table 8.5Canadian Tourism Commission Forecast of Inbound Tourism(overnight travel) by Country(Updated, July, 1999)
Annual ChangeGeneratingCountry/Region 1999 2000 2001 2002 2003
%
United States 7.0 5.0 3.0 3.0 3.0United Kingdom 1.5 1.0 2.5 3.0 3.5France 4.5 3.0 3.0 2.5 2.0Germany -3.0 1.0 3.5 3.2 3.1Europe 1.4 1.7 3.1 3.0 3.0Japan -5.0 -4.0 1.0 3.5 4.0Overseas 0.3 0.5 2.8 3.1 3.4
Total 5.6 4.1 3.0 3.0 3.1
Source: Canadian Tourism Commission.
Text Table 8.6Canadian Tourism Commission Forecast of Travel AccountBalances by Country(Updated, July, 1999)
(millions of current $)Travel BalanceCountry/Region 1999 2000 2001 2002 2003
United States -75 393 723 979 1,287Rest of the World -1,127 -1,537 -1,902 -2,173 -2,494
Total World -1,201 -1,144 -1,178 -1,193 -1,207
Source: Canadian Tourism Commission.
To achieve these results the tourism industry will have tokeep a strong product focus and take up the challengesidentified in the analyses presented in this Statistical Digest:increasing international competition, slowing and irregulardomestic growth, skewed seasonal and regional demandand supply of Canada’s tourism products, rising tourismprices as well as limited and uneven industry profitability.The issues of industry competitiveness, productivity andprofitability underlie them all. Success in achieving the statusof a premier international destination for natural and culturalexperiences across all seasons would increase revenues,improve the industry attractiveness for investments, andcreate more economic activity within this strategic industry,thus generating jobs and more prosperity for the country atlarge.
Notes
1 International Association of Scientific Experts in Tourism,Globalization and Tourism, Reports, 46th Congress 1996Rotorua, New Zealand.
2 Canadian Tourism Commission, Recent Developments inTourism as Revealed by the National Tourism Indicators,Research Report 1998-1.
3 World Tourism Organization, Tourism 2020 Vision, A newForecast from the World Tourism Organization.
4 Canadian Tourism Commission, An Analysis of the ProblemLoans at Asian Banks; Trends Issues and Implications,Occasional Research Report 1999-1.
5 World Travel and Tourism Council. Travel and Tourism, Progressand Priority 1999.
6 Canadian Tourism Commission, Challenges for Canada’sTourism Industry, 1999.
7 Canadian Tourism Commission, International Travel Forecasts,Spring 1999 Update, July, 1999.
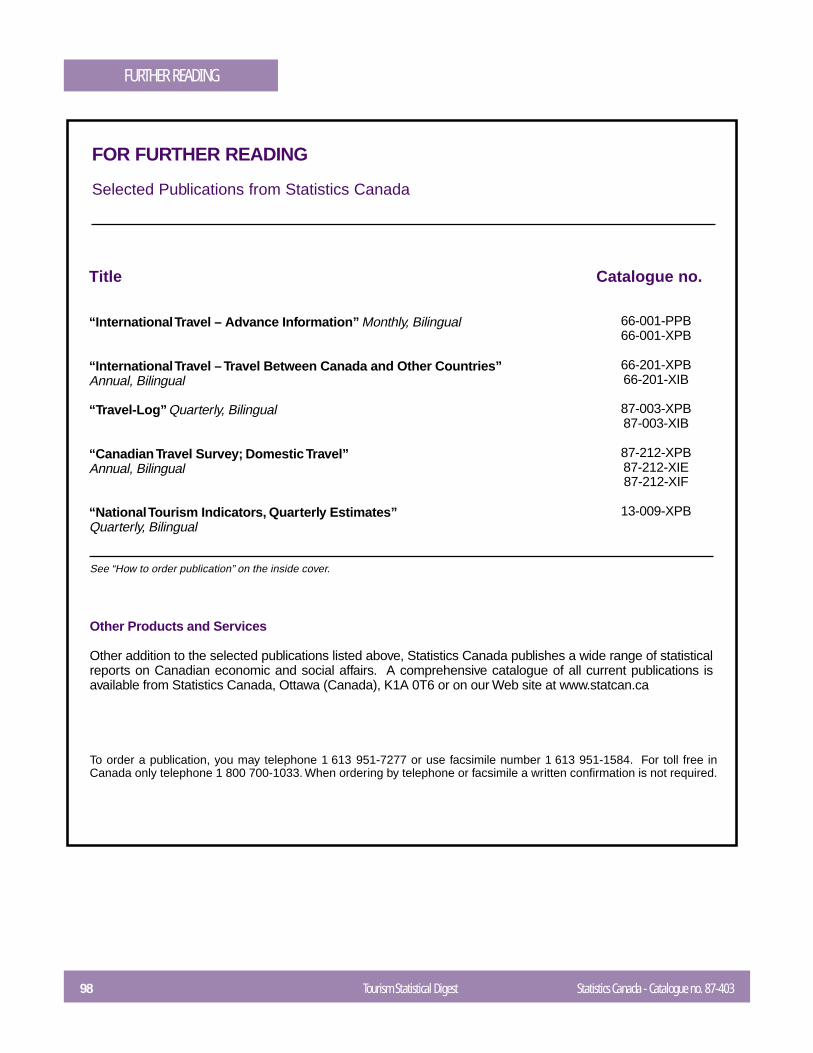
98 Tourism Statistical Digest Statistics Canada - Catalogue no. 87-403
FURTHER READING
To order a publication, you may telephone 1 613 951-7277 or use facsimile number 1 613 951-1584. For toll free inCanada only telephone 1 800 700-1033. When ordering by telephone or facsimile a written confirmation is not required.
FOR FURTHER READING
Selected Publications from Statistics Canada
Title
“International Travel – Advance Information” Monthly, Bilingual
“International Travel – Travel Between Canada and Other Countries”Annual, Bilingual
“Travel-Log” Quarterly, Bilingual
“Canadian Travel Survey; Domestic Travel”Annual, Bilingual
“National Tourism Indicators, Quarterly Estimates”Quarterly, Bilingual
Catalogue no.
66-001-PPB66-001-XPB
66-201-XPB66-201-XIB
87-003-XPB87-003-XIB
87-212-XPB87-212-XIE87-212-XIF
13-009-XPB
See “How to order publication” on the inside cover.
Other Products and Services
Other addition to the selected publications listed above, Statistics Canada publishes a wide range of statisticalreports on Canadian economic and social affairs. A comprehensive catalogue of all current publications isavailable from Statistics Canada, Ottawa (Canada), K1A 0T6 or on our Web site at www.statcan.ca

STATISTICAL TABLESSTATISTICAL TABLES
Statistics Canada - Catalogue no. 87-403 Tourism Statistical Digest 99
Symbols
-- amount too small to be expressed.- figures not available.
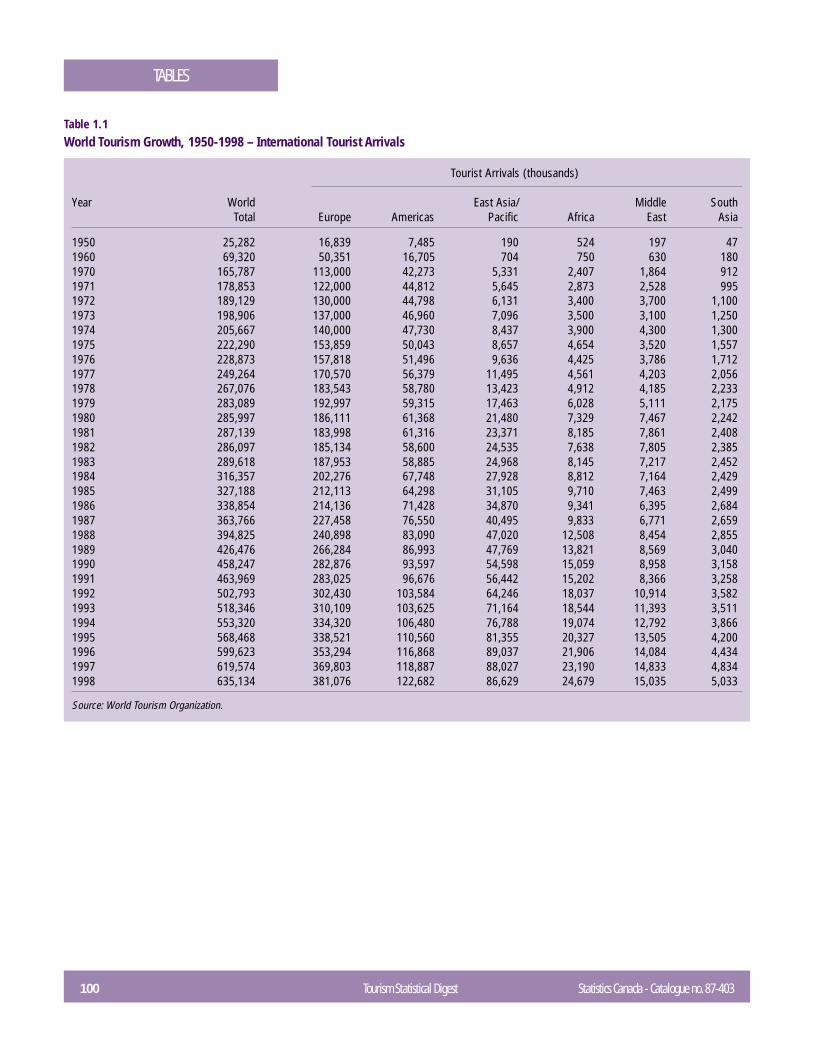
100 Tourism Statistical Digest Statistics Canada - Catalogue no. 87-403
TABLES
Tourist Arrivals (thousands)
Year World East Asia/ Middle SouthTotal Europe Americas Pacific Africa East Asia
1950 25,282 16,839 7,485 190 524 197 471960 69,320 50,351 16,705 704 750 630 1801970 165,787 113,000 42,273 5,331 2,407 1,864 9121971 178,853 122,000 44,812 5,645 2,873 2,528 9951972 189,129 130,000 44,798 6,131 3,400 3,700 1,1001973 198,906 137,000 46,960 7,096 3,500 3,100 1,2501974 205,667 140,000 47,730 8,437 3,900 4,300 1,3001975 222,290 153,859 50,043 8,657 4,654 3,520 1,5571976 228,873 157,818 51,496 9,636 4,425 3,786 1,7121977 249,264 170,570 56,379 11,495 4,561 4,203 2,0561978 267,076 183,543 58,780 13,423 4,912 4,185 2,2331979 283,089 192,997 59,315 17,463 6,028 5,111 2,1751980 285,997 186,111 61,368 21,480 7,329 7,467 2,2421981 287,139 183,998 61,316 23,371 8,185 7,861 2,4081982 286,097 185,134 58,600 24,535 7,638 7,805 2,3851983 289,618 187,953 58,885 24,968 8,145 7,217 2,4521984 316,357 202,276 67,748 27,928 8,812 7,164 2,4291985 327,188 212,113 64,298 31,105 9,710 7,463 2,4991986 338,854 214,136 71,428 34,870 9,341 6,395 2,6841987 363,766 227,458 76,550 40,495 9,833 6,771 2,6591988 394,825 240,898 83,090 47,020 12,508 8,454 2,8551989 426,476 266,284 86,993 47,769 13,821 8,569 3,0401990 458,247 282,876 93,597 54,598 15,059 8,958 3,1581991 463,969 283,025 96,676 56,442 15,202 8,366 3,2581992 502,793 302,430 103,584 64,246 18,037 10,914 3,5821993 518,346 310,109 103,625 71,164 18,544 11,393 3,5111994 553,320 334,320 106,480 76,788 19,074 12,792 3,8661995 568,468 338,521 110,560 81,355 20,327 13,505 4,2001996 599,623 353,294 116,868 89,037 21,906 14,084 4,4341997 619,574 369,803 118,887 88,027 23,190 14,833 4,8341998 635,134 381,076 122,682 86,629 24,679 15,035 5,033
Source: World Tourism Organization.
Table 1.1World Tourism Growth, 1950-1998 – International Tourist Arrivals
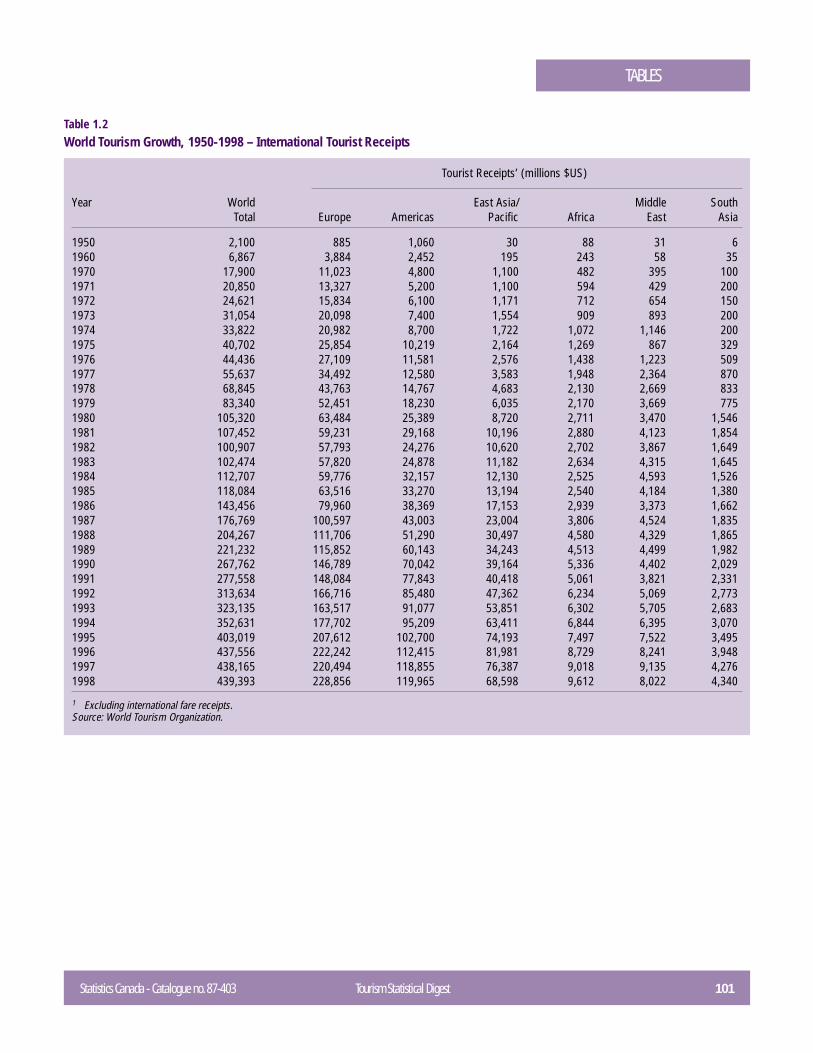
Statistics Canada - Catalogue no. 87-403 Tourism Statistical Digest 101
TABLES
Tourist Receipts’ (millions $US)
Year World East Asia/ Middle SouthTotal Europe Americas Pacific Africa East Asia
1950 2,100 885 1,060 30 88 31 61960 6,867 3,884 2,452 195 243 58 351970 17,900 11,023 4,800 1,100 482 395 1001971 20,850 13,327 5,200 1,100 594 429 2001972 24,621 15,834 6,100 1,171 712 654 1501973 31,054 20,098 7,400 1,554 909 893 2001974 33,822 20,982 8,700 1,722 1,072 1,146 2001975 40,702 25,854 10,219 2,164 1,269 867 3291976 44,436 27,109 11,581 2,576 1,438 1,223 5091977 55,637 34,492 12,580 3,583 1,948 2,364 8701978 68,845 43,763 14,767 4,683 2,130 2,669 8331979 83,340 52,451 18,230 6,035 2,170 3,669 7751980 105,320 63,484 25,389 8,720 2,711 3,470 1,5461981 107,452 59,231 29,168 10,196 2,880 4,123 1,8541982 100,907 57,793 24,276 10,620 2,702 3,867 1,6491983 102,474 57,820 24,878 11,182 2,634 4,315 1,6451984 112,707 59,776 32,157 12,130 2,525 4,593 1,5261985 118,084 63,516 33,270 13,194 2,540 4,184 1,3801986 143,456 79,960 38,369 17,153 2,939 3,373 1,6621987 176,769 100,597 43,003 23,004 3,806 4,524 1,8351988 204,267 111,706 51,290 30,497 4,580 4,329 1,8651989 221,232 115,852 60,143 34,243 4,513 4,499 1,9821990 267,762 146,789 70,042 39,164 5,336 4,402 2,0291991 277,558 148,084 77,843 40,418 5,061 3,821 2,3311992 313,634 166,716 85,480 47,362 6,234 5,069 2,7731993 323,135 163,517 91,077 53,851 6,302 5,705 2,6831994 352,631 177,702 95,209 63,411 6,844 6,395 3,0701995 403,019 207,612 102,700 74,193 7,497 7,522 3,4951996 437,556 222,242 112,415 81,981 8,729 8,241 3,9481997 438,165 220,494 118,855 76,387 9,018 9,135 4,2761998 439,393 228,856 119,965 68,598 9,612 8,022 4,340
1 Excluding international fare receipts.Source: World Tourism Organization.
Table 1.2World Tourism Growth, 1950-1998 – International Tourist Receipts
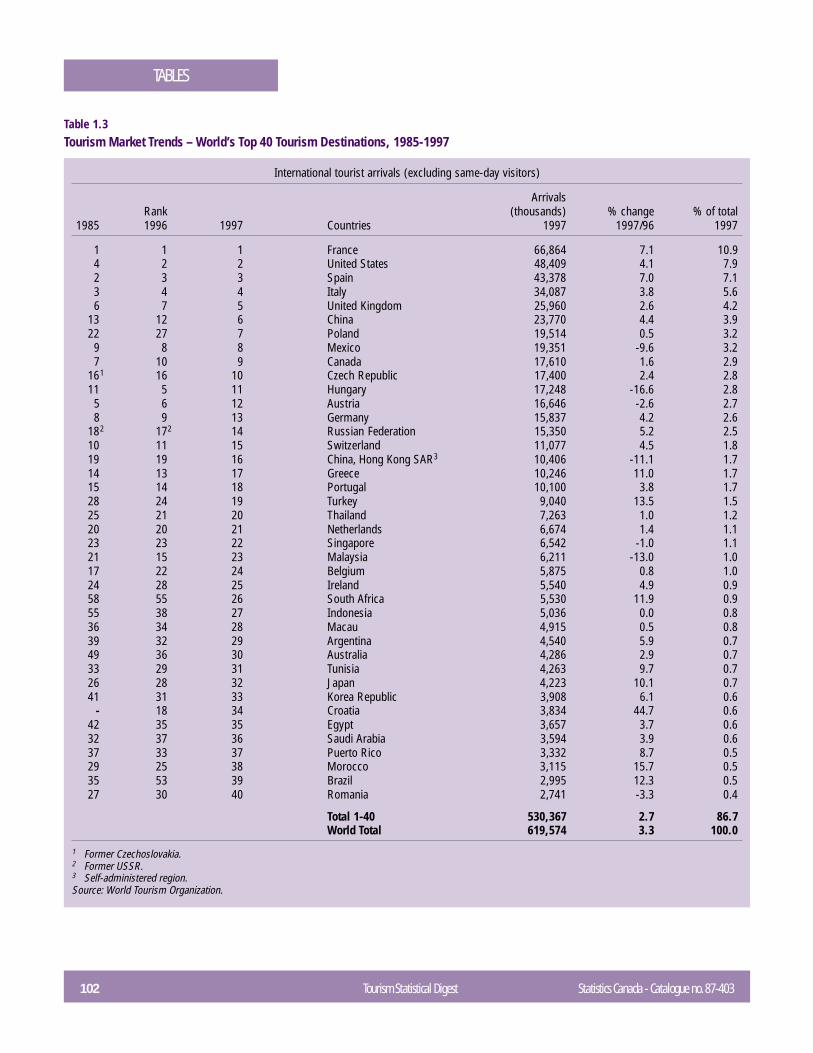
102 Tourism Statistical Digest Statistics Canada - Catalogue no. 87-403
TABLES
International tourist arrivals (excluding same-day visitors)
ArrivalsRank (thousands) % change % of total
1985 1996 1997 Countries 1997 1997/96 1997
1 1 1 France 66,864 7.1 10.94 2 2 United States 48,409 4.1 7.92 3 3 Spain 43,378 7.0 7.13 4 4 Italy 34,087 3.8 5.66 7 5 United Kingdom 25,960 2.6 4.2
13 12 6 China 23,770 4.4 3.922 27 7 Poland 19,514 0.5 3.2
9 8 8 Mexico 19,351 -9.6 3.27 10 9 Canada 17,610 1.6 2.9
161 16 10 Czech Republic 17,400 2.4 2.811 5 11 Hungary 17,248 -16.6 2.8
5 6 12 Austria 16,646 -2.6 2.78 9 13 Germany 15,837 4.2 2.6
182 172 14 Russian Federation 15,350 5.2 2.510 11 15 Switzerland 11,077 4.5 1.819 19 16 China, Hong Kong SAR3 10,406 -11.1 1.714 13 17 Greece 10,246 11.0 1.715 14 18 Portugal 10,100 3.8 1.728 24 19 Turkey 9,040 13.5 1.525 21 20 Thailand 7,263 1.0 1.220 20 21 Netherlands 6,674 1.4 1.123 23 22 Singapore 6,542 -1.0 1.121 15 23 Malaysia 6,211 -13.0 1.017 22 24 Belgium 5,875 0.8 1.024 28 25 Ireland 5,540 4.9 0.958 55 26 South Africa 5,530 11.9 0.955 38 27 Indonesia 5,036 0.0 0.836 34 28 Macau 4,915 0.5 0.839 32 29 Argentina 4,540 5.9 0.749 36 30 Australia 4,286 2.9 0.733 29 31 Tunisia 4,263 9.7 0.726 28 32 Japan 4,223 10.1 0.741 31 33 Korea Republic 3,908 6.1 0.6
- 18 34 Croatia 3,834 44.7 0.642 35 35 Egypt 3,657 3.7 0.632 37 36 Saudi Arabia 3,594 3.9 0.637 33 37 Puerto Rico 3,332 8.7 0.529 25 38 Morocco 3,115 15.7 0.535 53 39 Brazil 2,995 12.3 0.527 30 40 Romania 2,741 -3.3 0.4
Total 1-40 530,367 2.7 86.7World Total 619,574 3.3 100.0
1 Former Czechoslovakia.2 Former USSR.3 Self-administered region.Source: World Tourism Organization.
Table 1.3Tourism Market Trends – World’s Top 40 Tourism Destinations, 1985-1997
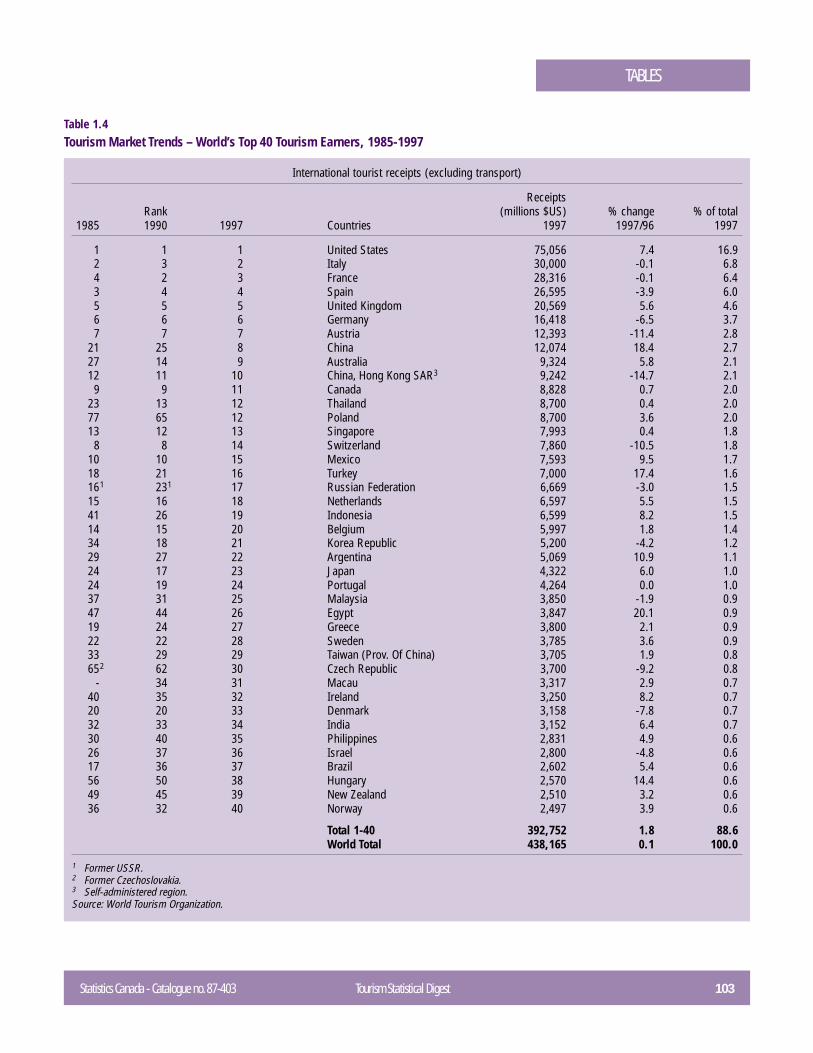
Statistics Canada - Catalogue no. 87-403 Tourism Statistical Digest 103
TABLES
International tourist receipts (excluding transport)
ReceiptsRank (millions $US) % change % of total
1985 1990 1997 Countries 1997 1997/96 1997
1 1 1 United States 75,056 7.4 16.92 3 2 Italy 30,000 -0.1 6.84 2 3 France 28,316 -0.1 6.43 4 4 Spain 26,595 -3.9 6.05 5 5 United Kingdom 20,569 5.6 4.66 6 6 Germany 16,418 -6.5 3.77 7 7 Austria 12,393 -11.4 2.8
21 25 8 China 12,074 18.4 2.727 14 9 Australia 9,324 5.8 2.112 11 10 China, Hong Kong SAR3 9,242 -14.7 2.1
9 9 11 Canada 8,828 0.7 2.023 13 12 Thailand 8,700 0.4 2.077 65 12 Poland 8,700 3.6 2.013 12 13 Singapore 7,993 0.4 1.8
8 8 14 Switzerland 7,860 -10.5 1.810 10 15 Mexico 7,593 9.5 1.718 21 16 Turkey 7,000 17.4 1.6161 231 17 Russian Federation 6,669 -3.0 1.515 16 18 Netherlands 6,597 5.5 1.541 26 19 Indonesia 6,599 8.2 1.514 15 20 Belgium 5,997 1.8 1.434 18 21 Korea Republic 5,200 -4.2 1.229 27 22 Argentina 5,069 10.9 1.124 17 23 Japan 4,322 6.0 1.024 19 24 Portugal 4,264 0.0 1.037 31 25 Malaysia 3,850 -1.9 0.947 44 26 Egypt 3,847 20.1 0.919 24 27 Greece 3,800 2.1 0.922 22 28 Sweden 3,785 3.6 0.933 29 29 Taiwan (Prov. Of China) 3,705 1.9 0.8652 62 30 Czech Republic 3,700 -9.2 0.8
- 34 31 Macau 3,317 2.9 0.740 35 32 Ireland 3,250 8.2 0.720 20 33 Denmark 3,158 -7.8 0.732 33 34 India 3,152 6.4 0.730 40 35 Philippines 2,831 4.9 0.626 37 36 Israel 2,800 -4.8 0.617 36 37 Brazil 2,602 5.4 0.656 50 38 Hungary 2,570 14.4 0.649 45 39 New Zealand 2,510 3.2 0.636 32 40 Norway 2,497 3.9 0.6
Total 1-40 392,752 1.8 88.6World Total 438,165 0.1 100.0
1 Former USSR.2 Former Czechoslovakia.3 Self-administered region.Source: World Tourism Organization.
Table 1.4Tourism Market Trends – World’s Top 40 Tourism Earners, 1985-1997
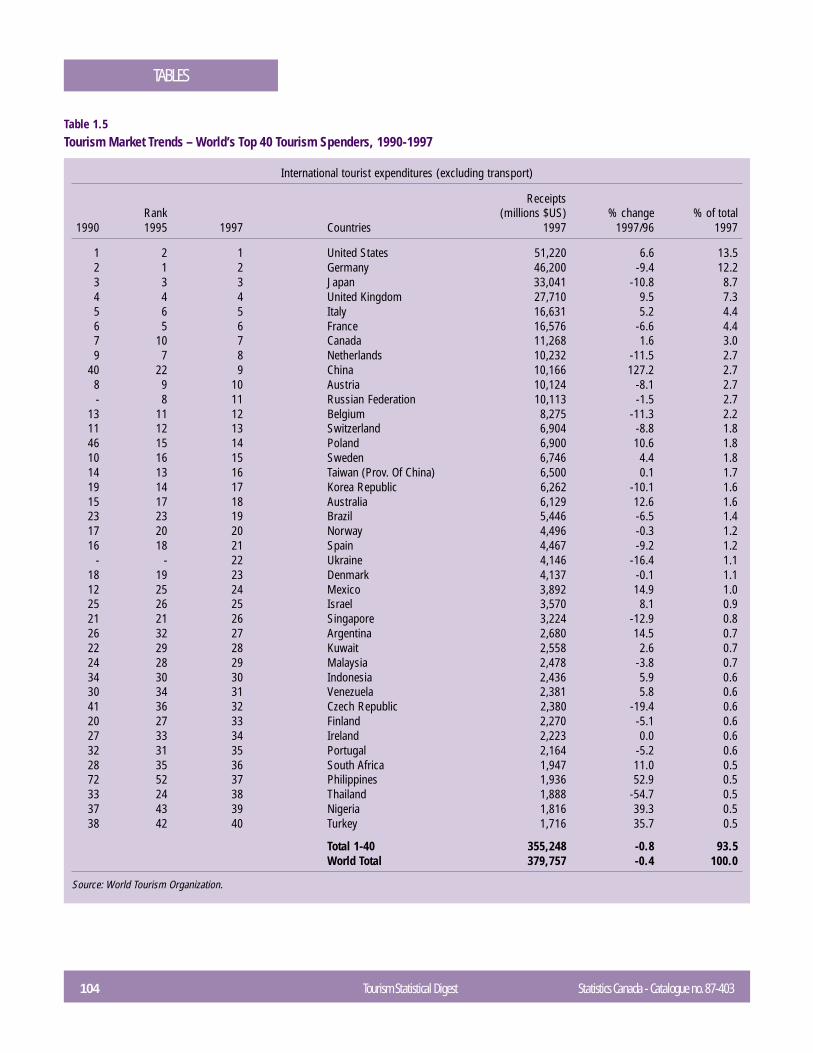
104 Tourism Statistical Digest Statistics Canada - Catalogue no. 87-403
TABLES
International tourist expenditures (excluding transport)
ReceiptsRank (millions $US) % change % of total
1990 1995 1997 Countries 1997 1997/96 1997
1 2 1 United States 51,220 6.6 13.52 1 2 Germany 46,200 -9.4 12.23 3 3 Japan 33,041 -10.8 8.74 4 4 United Kingdom 27,710 9.5 7.35 6 5 Italy 16,631 5.2 4.46 5 6 France 16,576 -6.6 4.47 10 7 Canada 11,268 1.6 3.09 7 8 Netherlands 10,232 -11.5 2.7
40 22 9 China 10,166 127.2 2.78 9 10 Austria 10,124 -8.1 2.7- 8 11 Russian Federation 10,113 -1.5 2.7
13 11 12 Belgium 8,275 -11.3 2.211 12 13 Switzerland 6,904 -8.8 1.846 15 14 Poland 6,900 10.6 1.810 16 15 Sweden 6,746 4.4 1.814 13 16 Taiwan (Prov. Of China) 6,500 0.1 1.719 14 17 Korea Republic 6,262 -10.1 1.615 17 18 Australia 6,129 12.6 1.623 23 19 Brazil 5,446 -6.5 1.417 20 20 Norway 4,496 -0.3 1.216 18 21 Spain 4,467 -9.2 1.2
- - 22 Ukraine 4,146 -16.4 1.118 19 23 Denmark 4,137 -0.1 1.112 25 24 Mexico 3,892 14.9 1.025 26 25 Israel 3,570 8.1 0.921 21 26 Singapore 3,224 -12.9 0.826 32 27 Argentina 2,680 14.5 0.722 29 28 Kuwait 2,558 2.6 0.724 28 29 Malaysia 2,478 -3.8 0.734 30 30 Indonesia 2,436 5.9 0.630 34 31 Venezuela 2,381 5.8 0.641 36 32 Czech Republic 2,380 -19.4 0.620 27 33 Finland 2,270 -5.1 0.627 33 34 Ireland 2,223 0.0 0.632 31 35 Portugal 2,164 -5.2 0.628 35 36 South Africa 1,947 11.0 0.572 52 37 Philippines 1,936 52.9 0.533 24 38 Thailand 1,888 -54.7 0.537 43 39 Nigeria 1,816 39.3 0.538 42 40 Turkey 1,716 35.7 0.5
Total 1-40 355,248 -0.8 93.5World Total 379,757 -0.4 100.0
Source: World Tourism Organization.
Table 1.5Tourism Market Trends – World’s Top 40 Tourism Spenders, 1990-1997
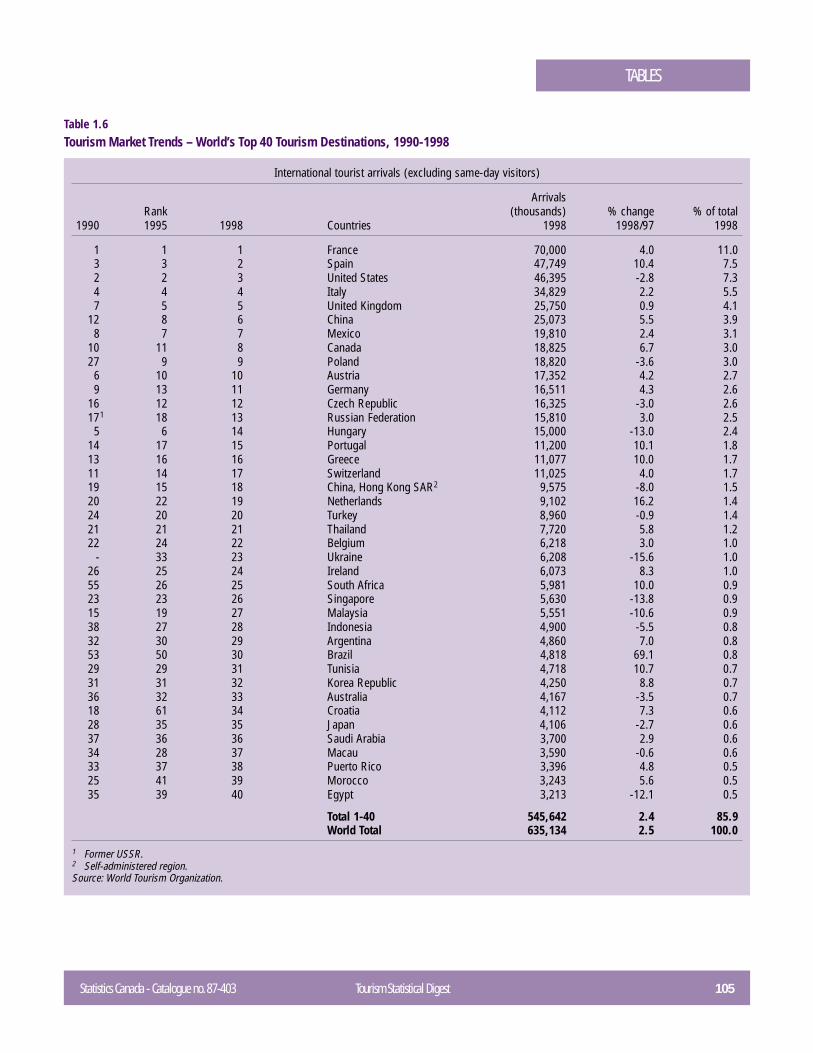
Statistics Canada - Catalogue no. 87-403 Tourism Statistical Digest 105
TABLES
International tourist arrivals (excluding same-day visitors)
ArrivalsRank (thousands) % change % of total
1990 1995 1998 Countries 1998 1998/97 1998
1 1 1 France 70,000 4.0 11.03 3 2 Spain 47,749 10.4 7.52 2 3 United States 46,395 -2.8 7.34 4 4 Italy 34,829 2.2 5.57 5 5 United Kingdom 25,750 0.9 4.1
12 8 6 China 25,073 5.5 3.98 7 7 Mexico 19,810 2.4 3.1
10 11 8 Canada 18,825 6.7 3.027 9 9 Poland 18,820 -3.6 3.0
6 10 10 Austria 17,352 4.2 2.79 13 11 Germany 16,511 4.3 2.6
16 12 12 Czech Republic 16,325 -3.0 2.6171 18 13 Russian Federation 15,810 3.0 2.5
5 6 14 Hungary 15,000 -13.0 2.414 17 15 Portugal 11,200 10.1 1.813 16 16 Greece 11,077 10.0 1.711 14 17 Switzerland 11,025 4.0 1.719 15 18 China, Hong Kong SAR2 9,575 -8.0 1.520 22 19 Netherlands 9,102 16.2 1.424 20 20 Turkey 8,960 -0.9 1.421 21 21 Thailand 7,720 5.8 1.222 24 22 Belgium 6,218 3.0 1.0
- 33 23 Ukraine 6,208 -15.6 1.026 25 24 Ireland 6,073 8.3 1.055 26 25 South Africa 5,981 10.0 0.923 23 26 Singapore 5,630 -13.8 0.915 19 27 Malaysia 5,551 -10.6 0.938 27 28 Indonesia 4,900 -5.5 0.832 30 29 Argentina 4,860 7.0 0.853 50 30 Brazil 4,818 69.1 0.829 29 31 Tunisia 4,718 10.7 0.731 31 32 Korea Republic 4,250 8.8 0.736 32 33 Australia 4,167 -3.5 0.718 61 34 Croatia 4,112 7.3 0.628 35 35 Japan 4,106 -2.7 0.637 36 36 Saudi Arabia 3,700 2.9 0.634 28 37 Macau 3,590 -0.6 0.633 37 38 Puerto Rico 3,396 4.8 0.525 41 39 Morocco 3,243 5.6 0.535 39 40 Egypt 3,213 -12.1 0.5
Total 1-40 545,642 2.4 85.9World Total 635,134 2.5 100.0
1 Former USSR.2 Self-administered region.Source: World Tourism Organization.
Table 1.6Tourism Market Trends – World’s Top 40 Tourism Destinations, 1990-1998
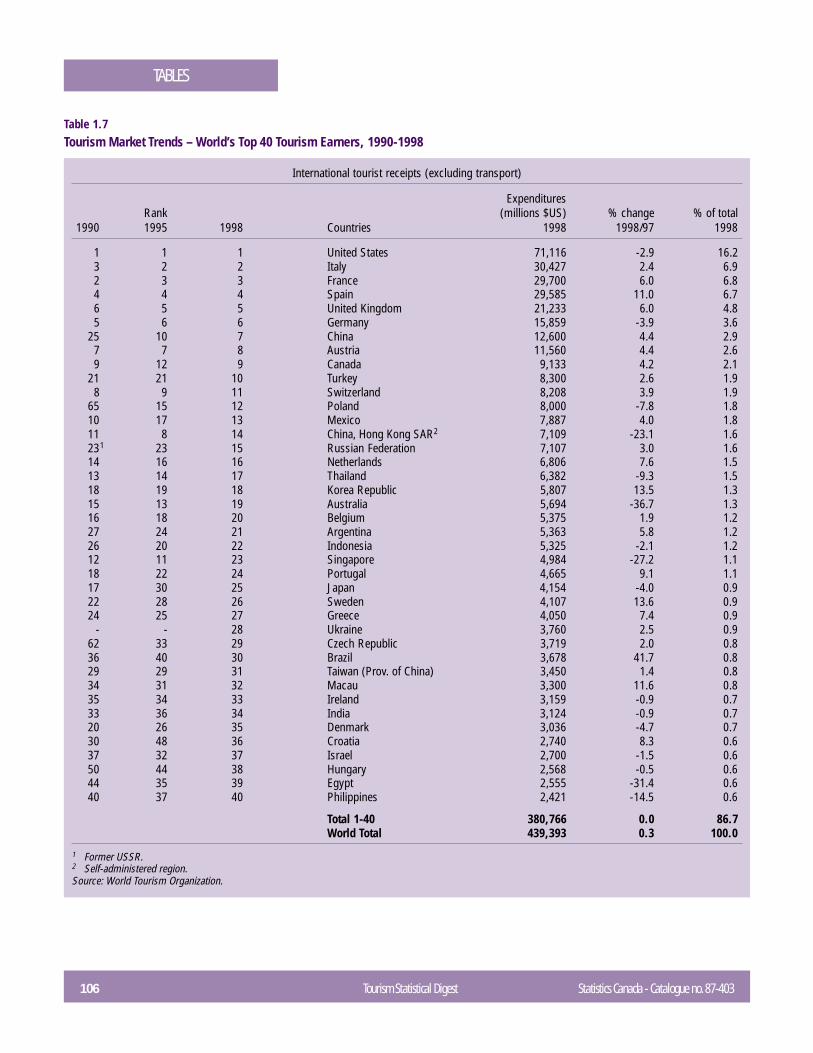
106 Tourism Statistical Digest Statistics Canada - Catalogue no. 87-403
TABLES
International tourist receipts (excluding transport)
ExpendituresRank (millions $US) % change % of total
1990 1995 1998 Countries 1998 1998/97 1998
1 1 1 United States 71,116 -2.9 16.23 2 2 Italy 30,427 2.4 6.92 3 3 France 29,700 6.0 6.84 4 4 Spain 29,585 11.0 6.76 5 5 United Kingdom 21,233 6.0 4.85 6 6 Germany 15,859 -3.9 3.6
25 10 7 China 12,600 4.4 2.97 7 8 Austria 11,560 4.4 2.69 12 9 Canada 9,133 4.2 2.1
21 21 10 Turkey 8,300 2.6 1.98 9 11 Switzerland 8,208 3.9 1.9
65 15 12 Poland 8,000 -7.8 1.810 17 13 Mexico 7,887 4.0 1.811 8 14 China, Hong Kong SAR2 7,109 -23.1 1.6231 23 15 Russian Federation 7,107 3.0 1.614 16 16 Netherlands 6,806 7.6 1.513 14 17 Thailand 6,382 -9.3 1.518 19 18 Korea Republic 5,807 13.5 1.315 13 19 Australia 5,694 -36.7 1.316 18 20 Belgium 5,375 1.9 1.227 24 21 Argentina 5,363 5.8 1.226 20 22 Indonesia 5,325 -2.1 1.212 11 23 Singapore 4,984 -27.2 1.118 22 24 Portugal 4,665 9.1 1.117 30 25 Japan 4,154 -4.0 0.922 28 26 Sweden 4,107 13.6 0.924 25 27 Greece 4,050 7.4 0.9
- - 28 Ukraine 3,760 2.5 0.962 33 29 Czech Republic 3,719 2.0 0.836 40 30 Brazil 3,678 41.7 0.829 29 31 Taiwan (Prov. of China) 3,450 1.4 0.834 31 32 Macau 3,300 11.6 0.835 34 33 Ireland 3,159 -0.9 0.733 36 34 India 3,124 -0.9 0.720 26 35 Denmark 3,036 -4.7 0.730 48 36 Croatia 2,740 8.3 0.637 32 37 Israel 2,700 -1.5 0.650 44 38 Hungary 2,568 -0.5 0.644 35 39 Egypt 2,555 -31.4 0.640 37 40 Philippines 2,421 -14.5 0.6
Total 1-40 380,766 0.0 86.7World Total 439,393 0.3 100.0
1 Former USSR.2 Self-administered region.Source: World Tourism Organization.
Table 1.7Tourism Market Trends – World’s Top 40 Tourism Earners, 1990-1998
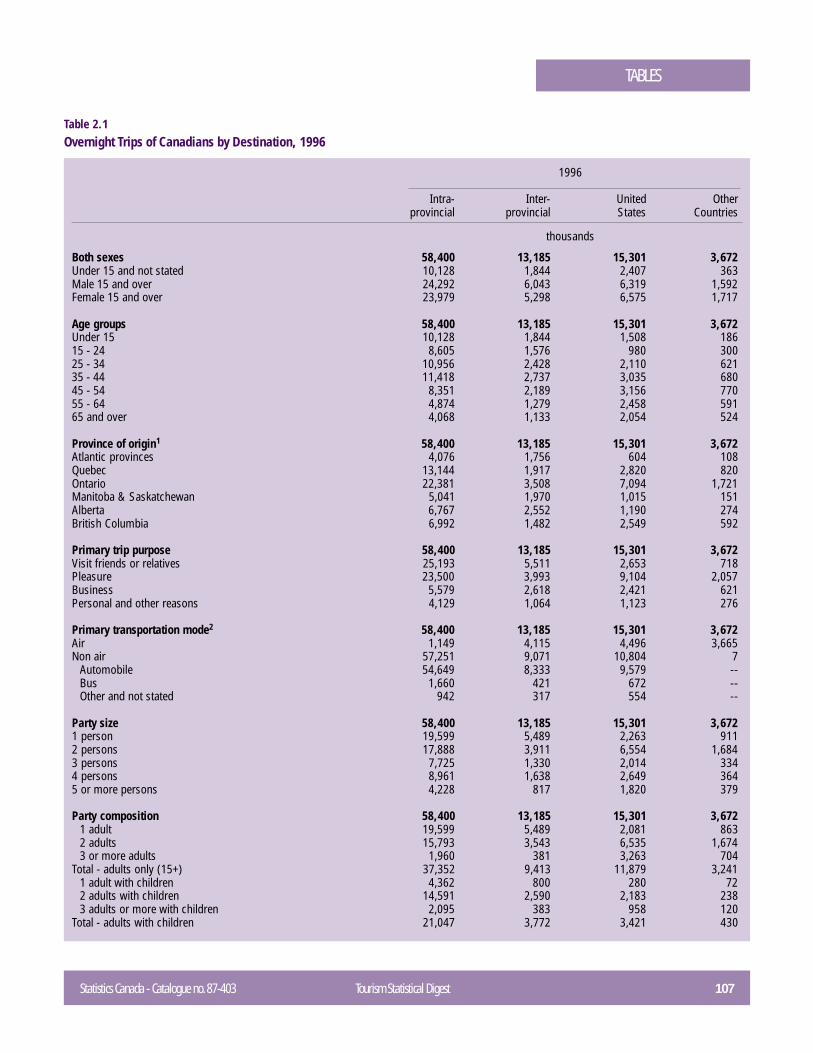
Statistics Canada - Catalogue no. 87-403 Tourism Statistical Digest 107
TABLES
1996
Intra- Inter- United Otherprovincial provincial States Countries
thousands
Both sexes 58,400 13,185 15,301 3,672Under 15 and not stated 10,128 1,844 2,407 363Male 15 and over 24,292 6,043 6,319 1,592Female 15 and over 23,979 5,298 6,575 1,717
Age groups 58,400 13,185 15,301 3,672Under 15 10,128 1,844 1,508 18615 - 24 8,605 1,576 980 30025 - 34 10,956 2,428 2,110 62135 - 44 11,418 2,737 3,035 68045 - 54 8,351 2,189 3,156 77055 - 64 4,874 1,279 2,458 59165 and over 4,068 1,133 2,054 524
Province of origin1 58,400 13,185 15,301 3,672Atlantic provinces 4,076 1,756 604 108Quebec 13,144 1,917 2,820 820Ontario 22,381 3,508 7,094 1,721Manitoba & Saskatchewan 5,041 1,970 1,015 151Alberta 6,767 2,552 1,190 274British Columbia 6,992 1,482 2,549 592
Primary trip purpose 58,400 13,185 15,301 3,672Visit friends or relatives 25,193 5,511 2,653 718Pleasure 23,500 3,993 9,104 2,057Business 5,579 2,618 2,421 621Personal and other reasons 4,129 1,064 1,123 276
Primary transportation mode2 58,400 13,185 15,301 3,672Air 1,149 4,115 4,496 3,665Non air 57,251 9,071 10,804 7
Automobile 54,649 8,333 9,579 --Bus 1,660 421 672 --Other and not stated 942 317 554 --
Party size 58,400 13,185 15,301 3,6721 person 19,599 5,489 2,263 9112 persons 17,888 3,911 6,554 1,6843 persons 7,725 1,330 2,014 3344 persons 8,961 1,638 2,649 3645 or more persons 4,228 817 1,820 379
Party composition 58,400 13,185 15,301 3,6721 adult 19,599 5,489 2,081 8632 adults 15,793 3,543 6,535 1,6743 or more adults 1,960 381 3,263 704
Total - adults only (15+) 37,352 9,413 11,879 3,2411 adult with children 4,362 800 280 722 adults with children 14,591 2,590 2,183 2383 adults or more with children 2,095 383 958 120
Total - adults with children 21,047 3,772 3,421 430
Table 2.1Overnight Trips of Canadians by Destination, 1996

108 Tourism Statistical Digest Statistics Canada - Catalogue no. 87-403
TABLES
Table 2.1Overnight Trips of Canadians by Destination, 1996 – Concluded
1996
Intra- Inter- United Otherprovincial provincial States Countries
thousands
Trip duration 58,400 13,185 15,301 3,6721 - 3 nights 47,960 6,909 7,686 584 - 6 nights 6,506 2,897 2,875 2077 - 9 nights 2,037 1,376 2,125 1,06010 - 13 nights 900 855 996 40614 - 20 nights 771 772 921 96321 or more nights 227 376 699 978
Survey quarter 58,400 13,185 15,301 3,6721st quarter (Jan.-Mar.) 11,565 2,428 3,399 1,2332nd quarter (Apr.-June) 12,945 3,122 3,745 7913rd quarter (July-Sept.) 22,502 5,130 5,189 9134th quarter (Oct.-Dec.) 11,388 2,505 2,968 734
Accommodation (person-nights) 159,665 71,535 108,673 69,345Hotel/Motel 20,791 12,846 38,070 19,456Camping or trailer park 17,188 3,266 8,716 52Cottages (commercial/private) 28,961 3,421 2,972 365Home of friends/relatives 73,895 32,278 13,755 13,708Other only 10,042 3,895 8,380 2,838Combinations of two or more 8,788 15,829 36,780 32,926
Reported trip expenditures ($)Total expenditures 7,037,893 6,224,077 10,440,915 9,534,045Accommodation 1,577,296 1,186,697 2,822,252 1,850,272Transportation 2,200,122 3,200,443 3,485,608 5,224,142Food and beverage 1,897,784 1,124,444 1,910,950 1,264,762Recreation & entertainment 503,901 300,226 936,887 513,458Other (clothing, souvenirs, etc.) 858,790 412,268 1,285,217 681,411
Activities (multiple counts)Visiting friends or relatives 38,943 8,836 5,611 1,768Shopping 14,933 4,784 10,631 2,915Sightseeing 11,063 4,574 7,246 2,878Attending a festival, fair or exhibition 2,300 845 1,307 538Attending cultural events (plays, concerts) 1,876 838 1,473 843Attending sports event 3,369 1,053 1,115 272Visiting a zoo, museum, natural display 2,884 1,638 2,479 1,448Visiting a theme park 966 674 1,685 334Visiting a national/provincial park or historic site 4,553 2,165 3,158 1,559Enjoying nightlife and entertainment 4,014 1,651 3,714 1,620Participating in sports /outdoor activity 21,922 4,081 5,901 1,843Swimming 8,150 1,467 3,798 1,487Other water-based activities 4,695 739 708 610Hunting or fishing 4,733 439 288 84Cross-country skiing 575 57 30 4Downhill skiing 1,161 366 302 32Other sports or outdoor activities 15,332 3,149 3,517 821
-- Amount to small to be expressed.1 Province of residence for foreign destinations.2 Allocation of trips by mode of transportation is based on the volume of Canadians returning from countries other than the United States by type of transportation.Sources: Canadian Travel Survey and International Travel Survey.
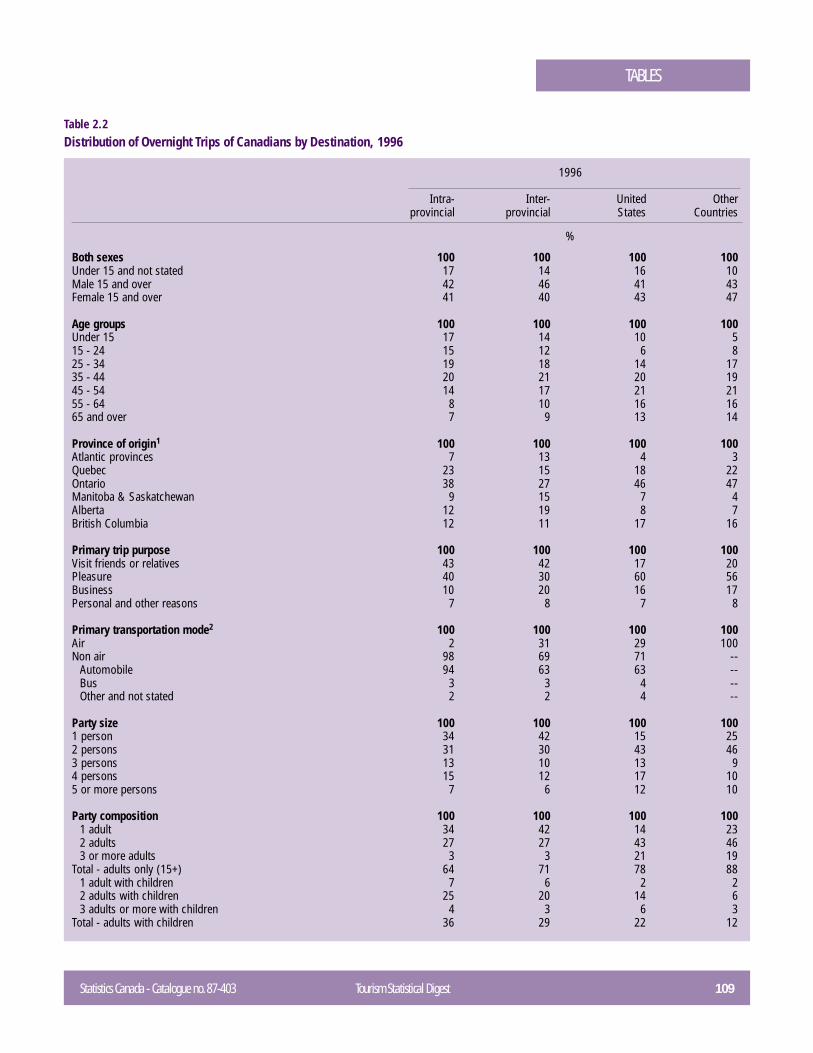
Statistics Canada - Catalogue no. 87-403 Tourism Statistical Digest 109
TABLES
1996
Intra- Inter- United Otherprovincial provincial States Countries
%
Both sexes 100 100 100 100Under 15 and not stated 17 14 16 10Male 15 and over 42 46 41 43Female 15 and over 41 40 43 47
Age groups 100 100 100 100Under 15 17 14 10 515 - 24 15 12 6 825 - 34 19 18 14 1735 - 44 20 21 20 1945 - 54 14 17 21 2155 - 64 8 10 16 1665 and over 7 9 13 14
Province of origin1 100 100 100 100Atlantic provinces 7 13 4 3Quebec 23 15 18 22Ontario 38 27 46 47Manitoba & Saskatchewan 9 15 7 4Alberta 12 19 8 7British Columbia 12 11 17 16
Primary trip purpose 100 100 100 100Visit friends or relatives 43 42 17 20Pleasure 40 30 60 56Business 10 20 16 17Personal and other reasons 7 8 7 8
Primary transportation mode2 100 100 100 100Air 2 31 29 100Non air 98 69 71 --
Automobile 94 63 63 --Bus 3 3 4 --Other and not stated 2 2 4 --
Party size 100 100 100 1001 person 34 42 15 252 persons 31 30 43 463 persons 13 10 13 94 persons 15 12 17 105 or more persons 7 6 12 10
Party composition 100 100 100 1001 adult 34 42 14 232 adults 27 27 43 463 or more adults 3 3 21 19
Total - adults only (15+) 64 71 78 881 adult with children 7 6 2 22 adults with children 25 20 14 63 adults or more with children 4 3 6 3
Total - adults with children 36 29 22 12
Table 2.2Distribution of Overnight Trips of Canadians by Destination, 1996
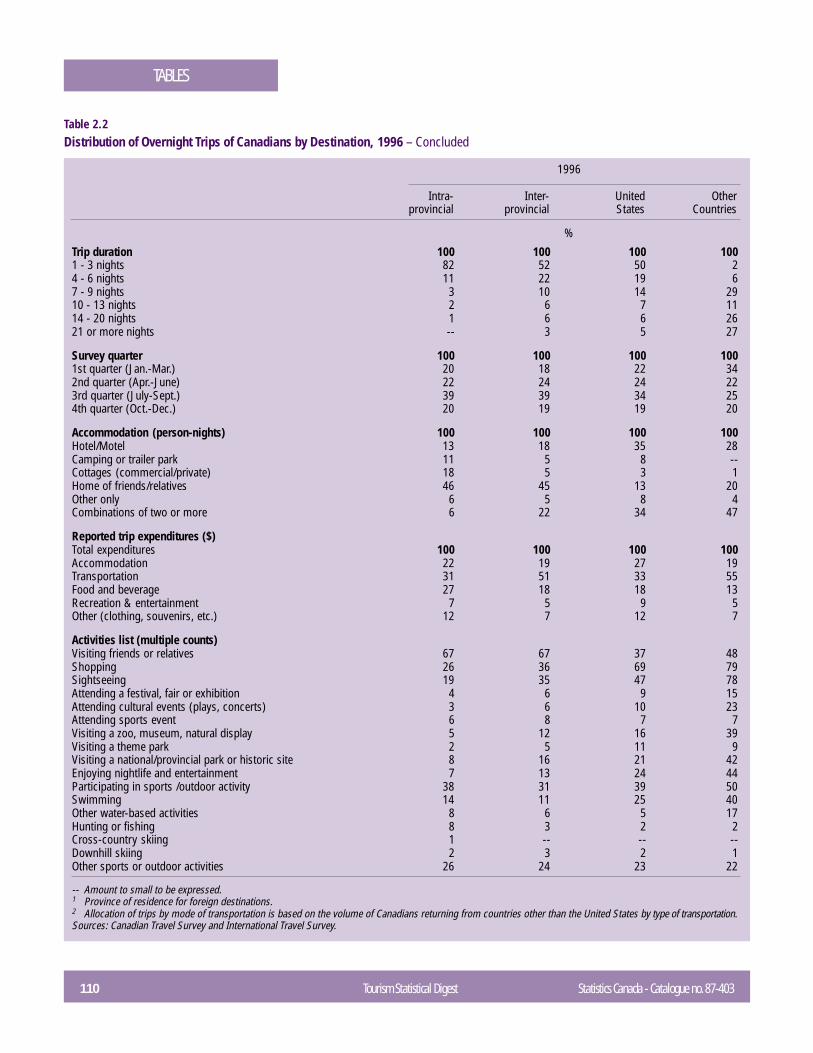
110 Tourism Statistical Digest Statistics Canada - Catalogue no. 87-403
TABLES
Table 2.2Distribution of Overnight Trips of Canadians by Destination, 1996 – Concluded
1996
Intra- Inter- United Otherprovincial provincial States Countries
%
Trip duration 100 100 100 1001 - 3 nights 82 52 50 24 - 6 nights 11 22 19 67 - 9 nights 3 10 14 2910 - 13 nights 2 6 7 1114 - 20 nights 1 6 6 2621 or more nights -- 3 5 27
Survey quarter 100 100 100 1001st quarter (Jan.-Mar.) 20 18 22 342nd quarter (Apr.-June) 22 24 24 223rd quarter (July-Sept.) 39 39 34 254th quarter (Oct.-Dec.) 20 19 19 20
Accommodation (person-nights) 100 100 100 100Hotel/Motel 13 18 35 28Camping or trailer park 11 5 8 --Cottages (commercial/private) 18 5 3 1Home of friends/relatives 46 45 13 20Other only 6 5 8 4Combinations of two or more 6 22 34 47
Reported trip expenditures ($)Total expenditures 100 100 100 100Accommodation 22 19 27 19Transportation 31 51 33 55Food and beverage 27 18 18 13Recreation & entertainment 7 5 9 5Other (clothing, souvenirs, etc.) 12 7 12 7
Activities list (multiple counts)Visiting friends or relatives 67 67 37 48Shopping 26 36 69 79Sightseeing 19 35 47 78Attending a festival, fair or exhibition 4 6 9 15Attending cultural events (plays, concerts) 3 6 10 23Attending sports event 6 8 7 7Visiting a zoo, museum, natural display 5 12 16 39Visiting a theme park 2 5 11 9Visiting a national/provincial park or historic site 8 16 21 42Enjoying nightlife and entertainment 7 13 24 44Participating in sports /outdoor activity 38 31 39 50Swimming 14 11 25 40Other water-based activities 8 6 5 17Hunting or fishing 8 3 2 2Cross-country skiing 1 -- -- --Downhill skiing 2 3 2 1Other sports or outdoor activities 26 24 23 22
-- Amount to small to be expressed.1 Province of residence for foreign destinations.2 Allocation of trips by mode of transportation is based on the volume of Canadians returning from countries other than the United States by type of transportation.Sources: Canadian Travel Survey and International Travel Survey.
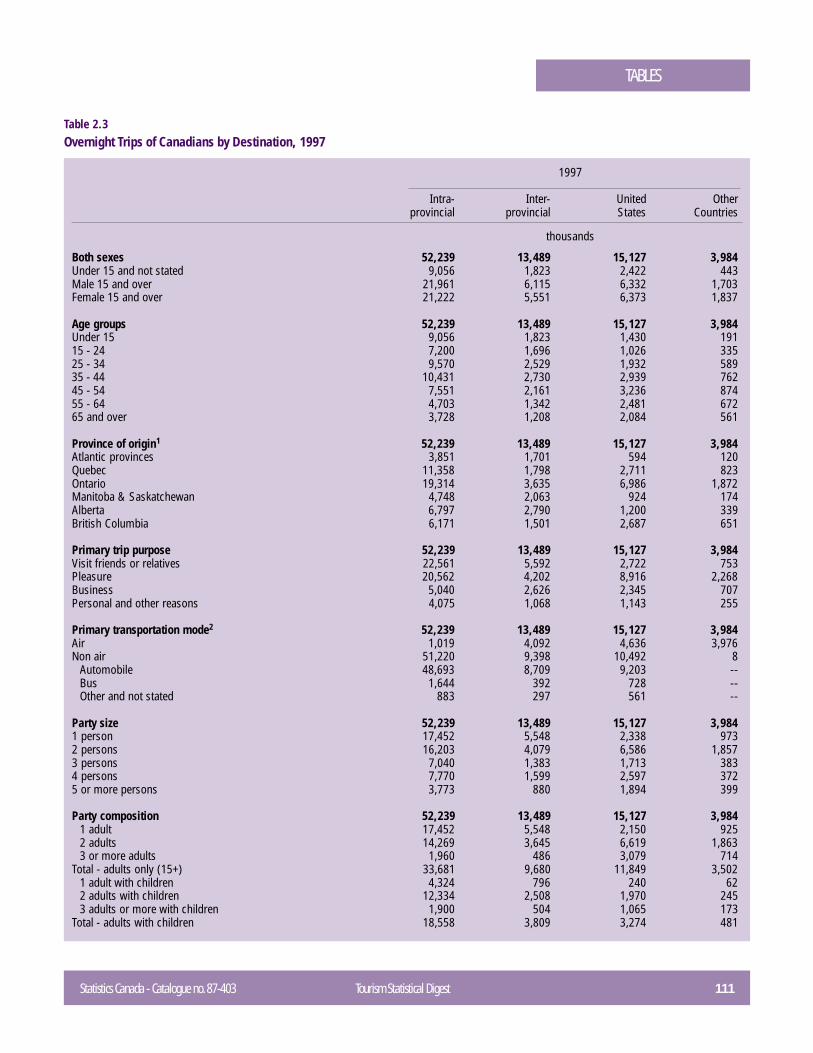
Statistics Canada - Catalogue no. 87-403 Tourism Statistical Digest 111
TABLES
1997
Intra- Inter- United Otherprovincial provincial States Countries
thousands
Both sexes 52,239 13,489 15,127 3,984Under 15 and not stated 9,056 1,823 2,422 443Male 15 and over 21,961 6,115 6,332 1,703Female 15 and over 21,222 5,551 6,373 1,837
Age groups 52,239 13,489 15,127 3,984Under 15 9,056 1,823 1,430 19115 - 24 7,200 1,696 1,026 33525 - 34 9,570 2,529 1,932 58935 - 44 10,431 2,730 2,939 76245 - 54 7,551 2,161 3,236 87455 - 64 4,703 1,342 2,481 67265 and over 3,728 1,208 2,084 561
Province of origin1 52,239 13,489 15,127 3,984Atlantic provinces 3,851 1,701 594 120Quebec 11,358 1,798 2,711 823Ontario 19,314 3,635 6,986 1,872Manitoba & Saskatchewan 4,748 2,063 924 174Alberta 6,797 2,790 1,200 339British Columbia 6,171 1,501 2,687 651
Primary trip purpose 52,239 13,489 15,127 3,984Visit friends or relatives 22,561 5,592 2,722 753Pleasure 20,562 4,202 8,916 2,268Business 5,040 2,626 2,345 707Personal and other reasons 4,075 1,068 1,143 255
Primary transportation mode2 52,239 13,489 15,127 3,984Air 1,019 4,092 4,636 3,976Non air 51,220 9,398 10,492 8
Automobile 48,693 8,709 9,203 --Bus 1,644 392 728 --Other and not stated 883 297 561 --
Party size 52,239 13,489 15,127 3,9841 person 17,452 5,548 2,338 9732 persons 16,203 4,079 6,586 1,8573 persons 7,040 1,383 1,713 3834 persons 7,770 1,599 2,597 3725 or more persons 3,773 880 1,894 399
Party composition 52,239 13,489 15,127 3,9841 adult 17,452 5,548 2,150 9252 adults 14,269 3,645 6,619 1,8633 or more adults 1,960 486 3,079 714
Total - adults only (15+) 33,681 9,680 11,849 3,5021 adult with children 4,324 796 240 622 adults with children 12,334 2,508 1,970 2453 adults or more with children 1,900 504 1,065 173
Total - adults with children 18,558 3,809 3,274 481
Table 2.3Overnight Trips of Canadians by Destination, 1997
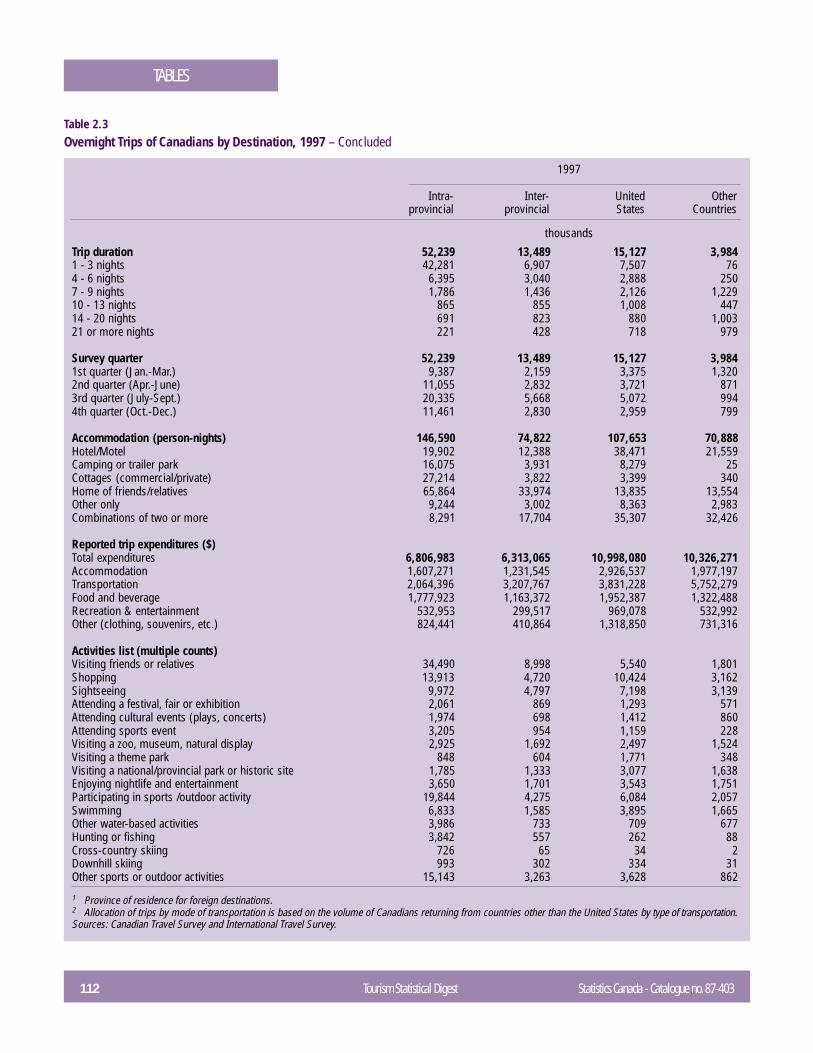
112 Tourism Statistical Digest Statistics Canada - Catalogue no. 87-403
TABLES
Table 2.3Overnight Trips of Canadians by Destination, 1997 – Concluded
1997
Intra- Inter- United Otherprovincial provincial States Countries
thousands
Trip duration 52,239 13,489 15,127 3,9841 - 3 nights 42,281 6,907 7,507 764 - 6 nights 6,395 3,040 2,888 2507 - 9 nights 1,786 1,436 2,126 1,22910 - 13 nights 865 855 1,008 44714 - 20 nights 691 823 880 1,00321 or more nights 221 428 718 979
Survey quarter 52,239 13,489 15,127 3,9841st quarter (Jan.-Mar.) 9,387 2,159 3,375 1,3202nd quarter (Apr.-June) 11,055 2,832 3,721 8713rd quarter (July-Sept.) 20,335 5,668 5,072 9944th quarter (Oct.-Dec.) 11,461 2,830 2,959 799
Accommodation (person-nights) 146,590 74,822 107,653 70,888Hotel/Motel 19,902 12,388 38,471 21,559Camping or trailer park 16,075 3,931 8,279 25Cottages (commercial/private) 27,214 3,822 3,399 340Home of friends/relatives 65,864 33,974 13,835 13,554Other only 9,244 3,002 8,363 2,983Combinations of two or more 8,291 17,704 35,307 32,426
Reported trip expenditures ($)Total expenditures 6,806,983 6,313,065 10,998,080 10,326,271Accommodation 1,607,271 1,231,545 2,926,537 1,977,197Transportation 2,064,396 3,207,767 3,831,228 5,752,279Food and beverage 1,777,923 1,163,372 1,952,387 1,322,488Recreation & entertainment 532,953 299,517 969,078 532,992Other (clothing, souvenirs, etc.) 824,441 410,864 1,318,850 731,316
Activities list (multiple counts)Visiting friends or relatives 34,490 8,998 5,540 1,801Shopping 13,913 4,720 10,424 3,162Sightseeing 9,972 4,797 7,198 3,139Attending a festival, fair or exhibition 2,061 869 1,293 571Attending cultural events (plays, concerts) 1,974 698 1,412 860Attending sports event 3,205 954 1,159 228Visiting a zoo, museum, natural display 2,925 1,692 2,497 1,524Visiting a theme park 848 604 1,771 348Visiting a national/provincial park or historic site 1,785 1,333 3,077 1,638Enjoying nightlife and entertainment 3,650 1,701 3,543 1,751Participating in sports /outdoor activity 19,844 4,275 6,084 2,057Swimming 6,833 1,585 3,895 1,665Other water-based activities 3,986 733 709 677Hunting or fishing 3,842 557 262 88Cross-country skiing 726 65 34 2Downhill skiing 993 302 334 31Other sports or outdoor activities 15,143 3,263 3,628 862
1 Province of residence for foreign destinations.2 Allocation of trips by mode of transportation is based on the volume of Canadians returning from countries other than the United States by type of transportation.Sources: Canadian Travel Survey and International Travel Survey.
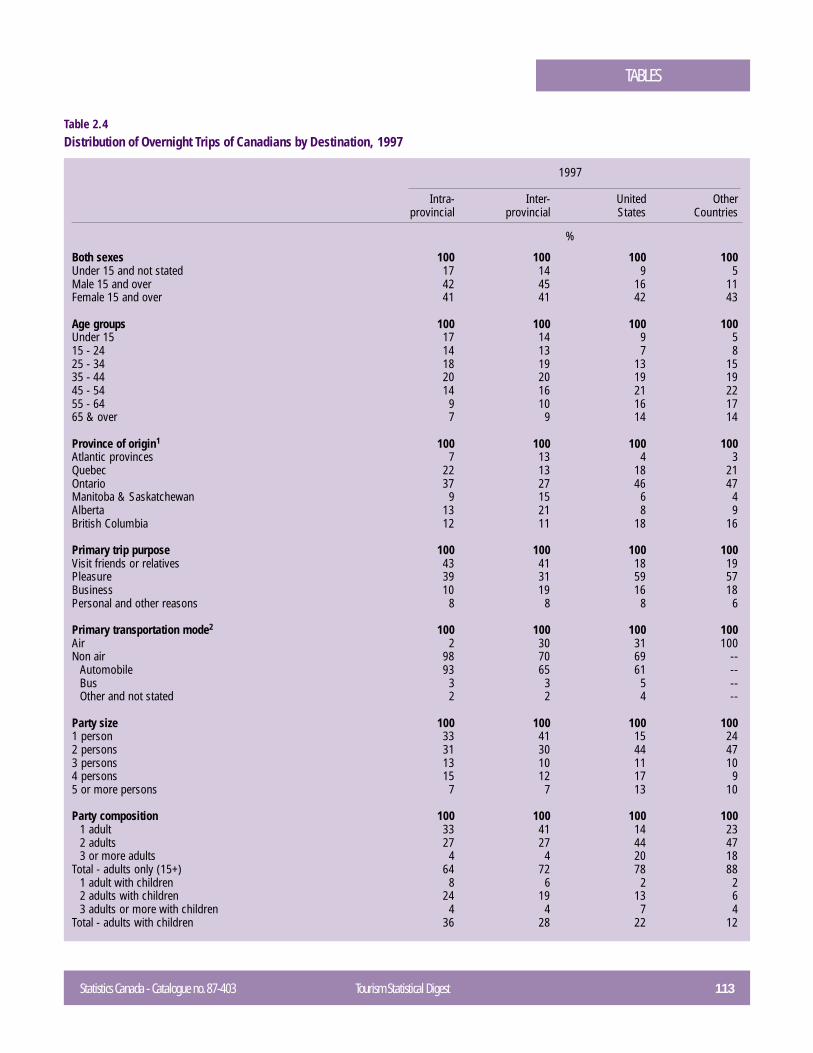
Statistics Canada - Catalogue no. 87-403 Tourism Statistical Digest 113
TABLES
1997
Intra- Inter- United Otherprovincial provincial States Countries
%
Both sexes 100 100 100 100Under 15 and not stated 17 14 9 5Male 15 and over 42 45 16 11Female 15 and over 41 41 42 43
Age groups 100 100 100 100Under 15 17 14 9 515 - 24 14 13 7 825 - 34 18 19 13 1535 - 44 20 20 19 1945 - 54 14 16 21 2255 - 64 9 10 16 1765 & over 7 9 14 14
Province of origin1 100 100 100 100Atlantic provinces 7 13 4 3Quebec 22 13 18 21Ontario 37 27 46 47Manitoba & Saskatchewan 9 15 6 4Alberta 13 21 8 9British Columbia 12 11 18 16
Primary trip purpose 100 100 100 100Visit friends or relatives 43 41 18 19Pleasure 39 31 59 57Business 10 19 16 18Personal and other reasons 8 8 8 6
Primary transportation mode2 100 100 100 100Air 2 30 31 100Non air 98 70 69 --
Automobile 93 65 61 --Bus 3 3 5 --Other and not stated 2 2 4 --
Party size 100 100 100 1001 person 33 41 15 242 persons 31 30 44 473 persons 13 10 11 104 persons 15 12 17 95 or more persons 7 7 13 10
Party composition 100 100 100 1001 adult 33 41 14 232 adults 27 27 44 473 or more adults 4 4 20 18
Total - adults only (15+) 64 72 78 881 adult with children 8 6 2 22 adults with children 24 19 13 63 adults or more with children 4 4 7 4
Total - adults with children 36 28 22 12
Table 2.4Distribution of Overnight Trips of Canadians by Destination, 1997
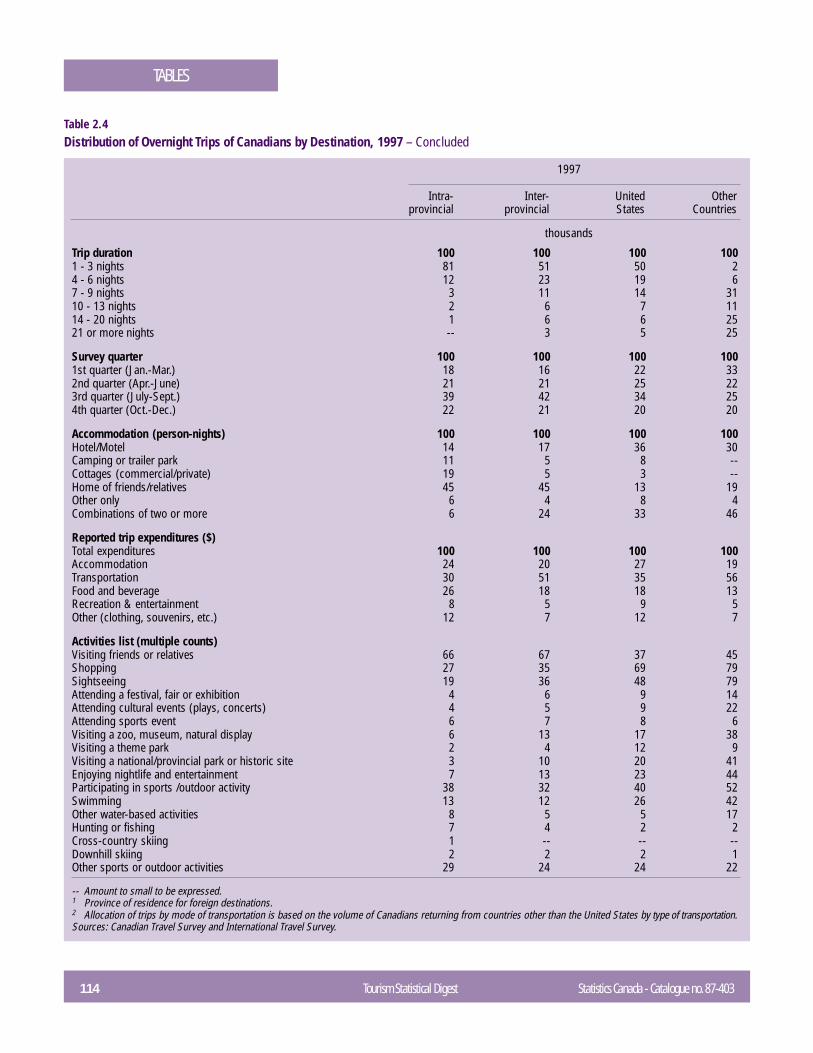
114 Tourism Statistical Digest Statistics Canada - Catalogue no. 87-403
TABLES
Table 2.4Distribution of Overnight Trips of Canadians by Destination, 1997 – Concluded
1997
Intra- Inter- United Otherprovincial provincial States Countries
thousands
Trip duration 100 100 100 1001 - 3 nights 81 51 50 24 - 6 nights 12 23 19 67 - 9 nights 3 11 14 3110 - 13 nights 2 6 7 1114 - 20 nights 1 6 6 2521 or more nights -- 3 5 25
Survey quarter 100 100 100 1001st quarter (Jan.-Mar.) 18 16 22 332nd quarter (Apr.-June) 21 21 25 223rd quarter (July-Sept.) 39 42 34 254th quarter (Oct.-Dec.) 22 21 20 20
Accommodation (person-nights) 100 100 100 100Hotel/Motel 14 17 36 30Camping or trailer park 11 5 8 --Cottages (commercial/private) 19 5 3 --Home of friends/relatives 45 45 13 19Other only 6 4 8 4Combinations of two or more 6 24 33 46
Reported trip expenditures ($)Total expenditures 100 100 100 100Accommodation 24 20 27 19Transportation 30 51 35 56Food and beverage 26 18 18 13Recreation & entertainment 8 5 9 5Other (clothing, souvenirs, etc.) 12 7 12 7
Activities list (multiple counts)Visiting friends or relatives 66 67 37 45Shopping 27 35 69 79Sightseeing 19 36 48 79Attending a festival, fair or exhibition 4 6 9 14Attending cultural events (plays, concerts) 4 5 9 22Attending sports event 6 7 8 6Visiting a zoo, museum, natural display 6 13 17 38Visiting a theme park 2 4 12 9Visiting a national/provincial park or historic site 3 10 20 41Enjoying nightlife and entertainment 7 13 23 44Participating in sports /outdoor activity 38 32 40 52Swimming 13 12 26 42Other water-based activities 8 5 5 17Hunting or fishing 7 4 2 2Cross-country skiing 1 -- -- --Downhill skiing 2 2 2 1Other sports or outdoor activities 29 24 24 22
-- Amount to small to be expressed.1 Province of residence for foreign destinations.2 Allocation of trips by mode of transportation is based on the volume of Canadians returning from countries other than the United States by type of transportation.Sources: Canadian Travel Survey and International Travel Survey.
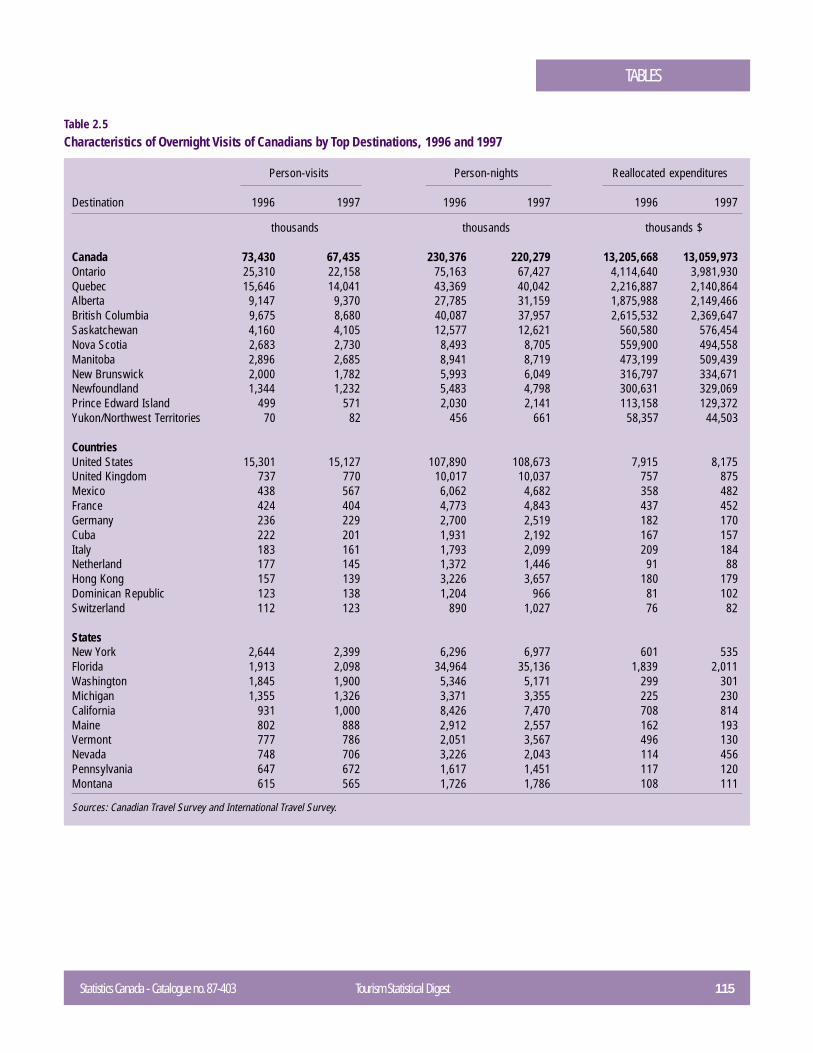
Statistics Canada - Catalogue no. 87-403 Tourism Statistical Digest 115
TABLES
Person-visits Person-nights Reallocated expenditures
Destination 1996 1997 1996 1997 1996 1997
thousands thousands thousands $
Canada 73,430 67,435 230,376 220,279 13,205,668 13,059,973Ontario 25,310 22,158 75,163 67,427 4,114,640 3,981,930Quebec 15,646 14,041 43,369 40,042 2,216,887 2,140,864Alberta 9,147 9,370 27,785 31,159 1,875,988 2,149,466British Columbia 9,675 8,680 40,087 37,957 2,615,532 2,369,647Saskatchewan 4,160 4,105 12,577 12,621 560,580 576,454Nova Scotia 2,683 2,730 8,493 8,705 559,900 494,558Manitoba 2,896 2,685 8,941 8,719 473,199 509,439New Brunswick 2,000 1,782 5,993 6,049 316,797 334,671Newfoundland 1,344 1,232 5,483 4,798 300,631 329,069Prince Edward Island 499 571 2,030 2,141 113,158 129,372Yukon/Northwest Territories 70 82 456 661 58,357 44,503
CountriesUnited States 15,301 15,127 107,890 108,673 7,915 8,175United Kingdom 737 770 10,017 10,037 757 875Mexico 438 567 6,062 4,682 358 482France 424 404 4,773 4,843 437 452Germany 236 229 2,700 2,519 182 170Cuba 222 201 1,931 2,192 167 157Italy 183 161 1,793 2,099 209 184Netherland 177 145 1,372 1,446 91 88Hong Kong 157 139 3,226 3,657 180 179Dominican Republic 123 138 1,204 966 81 102Switzerland 112 123 890 1,027 76 82
StatesNew York 2,644 2,399 6,296 6,977 601 535Florida 1,913 2,098 34,964 35,136 1,839 2,011Washington 1,845 1,900 5,346 5,171 299 301Michigan 1,355 1,326 3,371 3,355 225 230California 931 1,000 8,426 7,470 708 814Maine 802 888 2,912 2,557 162 193Vermont 777 786 2,051 3,567 496 130Nevada 748 706 3,226 2,043 114 456Pennsylvania 647 672 1,617 1,451 117 120Montana 615 565 1,726 1,786 108 111
Sources: Canadian Travel Survey and International Travel Survey.
Table 2.5Characteristics of Overnight Visits of Canadians by Top Destinations, 1996 and 1997
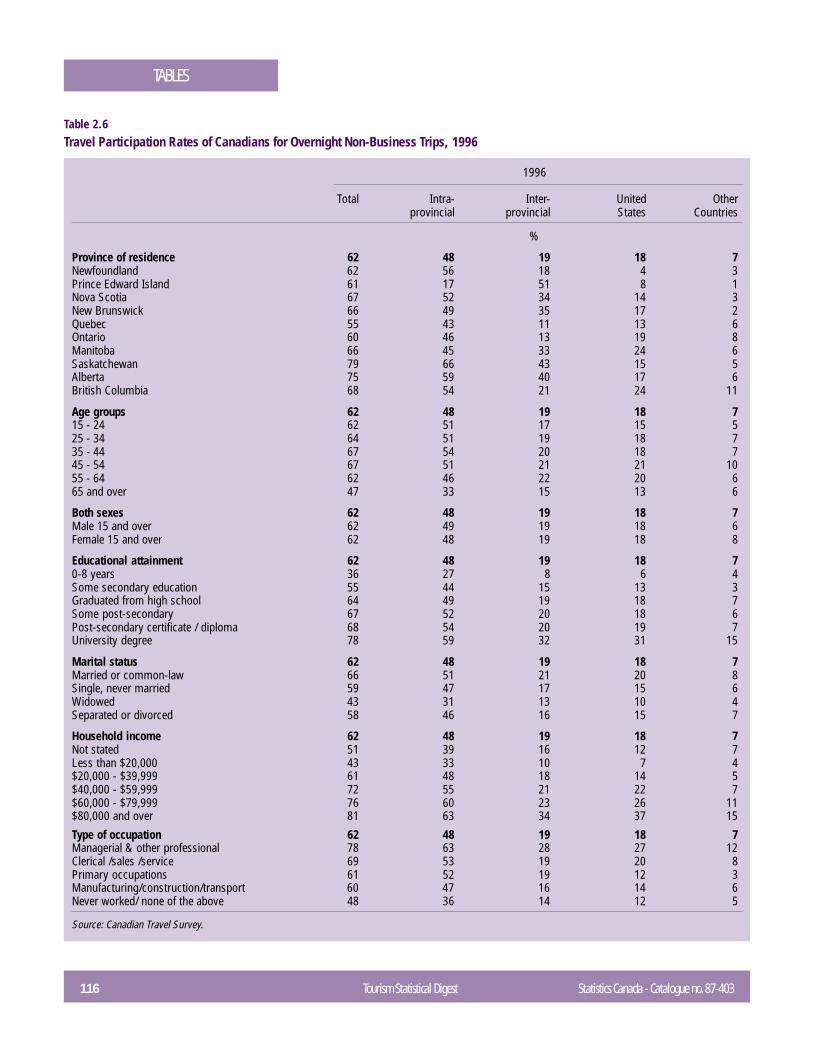
116 Tourism Statistical Digest Statistics Canada - Catalogue no. 87-403
TABLES
1996
Total Intra- Inter- United Otherprovincial provincial States Countries
%
Province of residence 62 48 19 18 7Newfoundland 62 56 18 4 3Prince Edward Island 61 17 51 8 1Nova Scotia 67 52 34 14 3New Brunswick 66 49 35 17 2Quebec 55 43 11 13 6Ontario 60 46 13 19 8Manitoba 66 45 33 24 6Saskatchewan 79 66 43 15 5Alberta 75 59 40 17 6British Columbia 68 54 21 24 11
Age groups 62 48 19 18 715 - 24 62 51 17 15 525 - 34 64 51 19 18 735 - 44 67 54 20 18 745 - 54 67 51 21 21 1055 - 64 62 46 22 20 665 and over 47 33 15 13 6
Both sexes 62 48 19 18 7Male 15 and over 62 49 19 18 6Female 15 and over 62 48 19 18 8
Educational attainment 62 48 19 18 70-8 years 36 27 8 6 4Some secondary education 55 44 15 13 3Graduated from high school 64 49 19 18 7Some post-secondary 67 52 20 18 6Post-secondary certificate / diploma 68 54 20 19 7University degree 78 59 32 31 15
Marital status 62 48 19 18 7Married or common-law 66 51 21 20 8Single, never married 59 47 17 15 6Widowed 43 31 13 10 4Separated or divorced 58 46 16 15 7
Household income 62 48 19 18 7Not stated 51 39 16 12 7Less than $20,000 43 33 10 7 4$20,000 - $39,999 61 48 18 14 5$40,000 - $59,999 72 55 21 22 7$60,000 - $79,999 76 60 23 26 11$80,000 and over 81 63 34 37 15
Type of occupation 62 48 19 18 7Managerial & other professional 78 63 28 27 12Clerical /sales /service 69 53 19 20 8Primary occupations 61 52 19 12 3Manufacturing/construction/transport 60 47 16 14 6Never worked/ none of the above 48 36 14 12 5
Source: Canadian Travel Survey.
Table 2.6Travel Participation Rates of Canadians for Overnight Non-Business Trips, 1996
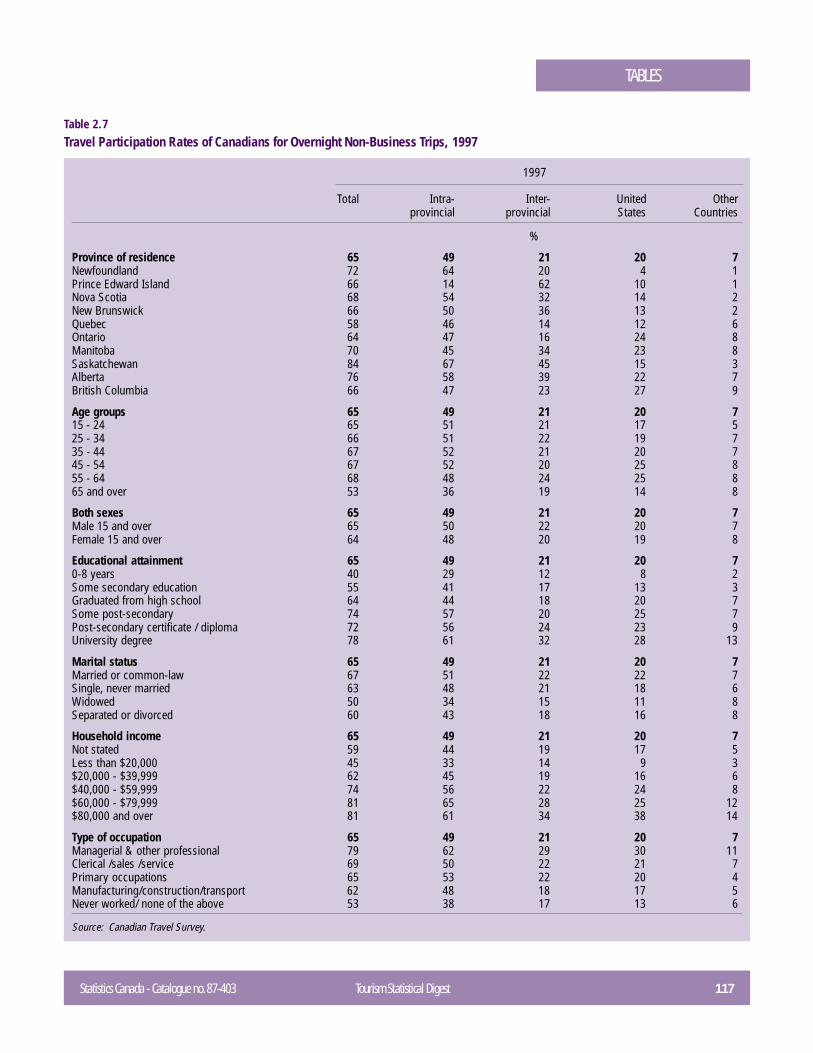
Statistics Canada - Catalogue no. 87-403 Tourism Statistical Digest 117
TABLES
1997
Total Intra- Inter- United Otherprovincial provincial States Countries
%
Province of residence 65 49 21 20 7Newfoundland 72 64 20 4 1Prince Edward Island 66 14 62 10 1Nova Scotia 68 54 32 14 2New Brunswick 66 50 36 13 2Quebec 58 46 14 12 6Ontario 64 47 16 24 8Manitoba 70 45 34 23 8Saskatchewan 84 67 45 15 3Alberta 76 58 39 22 7British Columbia 66 47 23 27 9
Age groups 65 49 21 20 715 - 24 65 51 21 17 525 - 34 66 51 22 19 735 - 44 67 52 21 20 745 - 54 67 52 20 25 855 - 64 68 48 24 25 865 and over 53 36 19 14 8
Both sexes 65 49 21 20 7Male 15 and over 65 50 22 20 7Female 15 and over 64 48 20 19 8
Educational attainment 65 49 21 20 70-8 years 40 29 12 8 2Some secondary education 55 41 17 13 3Graduated from high school 64 44 18 20 7Some post-secondary 74 57 20 25 7Post-secondary certificate / diploma 72 56 24 23 9University degree 78 61 32 28 13
Marital status 65 49 21 20 7Married or common-law 67 51 22 22 7Single, never married 63 48 21 18 6Widowed 50 34 15 11 8Separated or divorced 60 43 18 16 8
Household income 65 49 21 20 7Not stated 59 44 19 17 5Less than $20,000 45 33 14 9 3$20,000 - $39,999 62 45 19 16 6$40,000 - $59,999 74 56 22 24 8$60,000 - $79,999 81 65 28 25 12$80,000 and over 81 61 34 38 14
Type of occupation 65 49 21 20 7Managerial & other professional 79 62 29 30 11Clerical /sales /service 69 50 22 21 7Primary occupations 65 53 22 20 4Manufacturing/construction/transport 62 48 18 17 5Never worked/ none of the above 53 38 17 13 6
Source: Canadian Travel Survey.
Table 2.7Travel Participation Rates of Canadians for Overnight Non-Business Trips, 1997
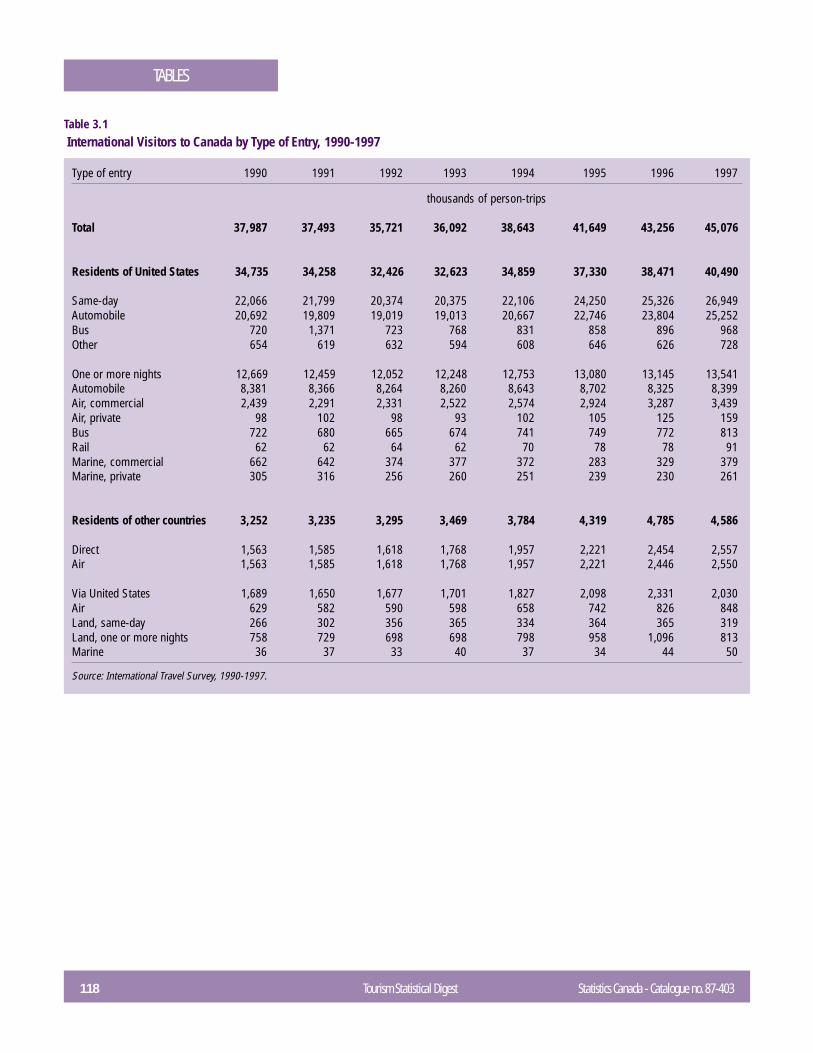
118 Tourism Statistical Digest Statistics Canada - Catalogue no. 87-403
TABLES
Type of entry 1990 1991 1992 1993 1994 1995 1996 1997
thousands of person-trips
Total 37,987 37,493 35,721 36,092 38,643 41,649 43,256 45,076
Residents of United States 34,735 34,258 32,426 32,623 34,859 37,330 38,471 40,490
Same-day 22,066 21,799 20,374 20,375 22,106 24,250 25,326 26,949Automobile 20,692 19,809 19,019 19,013 20,667 22,746 23,804 25,252Bus 720 1,371 723 768 831 858 896 968Other 654 619 632 594 608 646 626 728
One or more nights 12,669 12,459 12,052 12,248 12,753 13,080 13,145 13,541Automobile 8,381 8,366 8,264 8,260 8,643 8,702 8,325 8,399Air, commercial 2,439 2,291 2,331 2,522 2,574 2,924 3,287 3,439Air, private 98 102 98 93 102 105 125 159Bus 722 680 665 674 741 749 772 813Rail 62 62 64 62 70 78 78 91Marine, commercial 662 642 374 377 372 283 329 379Marine, private 305 316 256 260 251 239 230 261
Residents of other countries 3,252 3,235 3,295 3,469 3,784 4,319 4,785 4,586
Direct 1,563 1,585 1,618 1,768 1,957 2,221 2,454 2,557Air 1,563 1,585 1,618 1,768 1,957 2,221 2,446 2,550
Via United States 1,689 1,650 1,677 1,701 1,827 2,098 2,331 2,030Air 629 582 590 598 658 742 826 848Land, same-day 266 302 356 365 334 364 365 319Land, one or more nights 758 729 698 698 798 958 1,096 813Marine 36 37 33 40 37 34 44 50
Source: International Travel Survey, 1990-1997.
Table 3.1 International Visitors to Canada by Type of Entry, 1990-1997
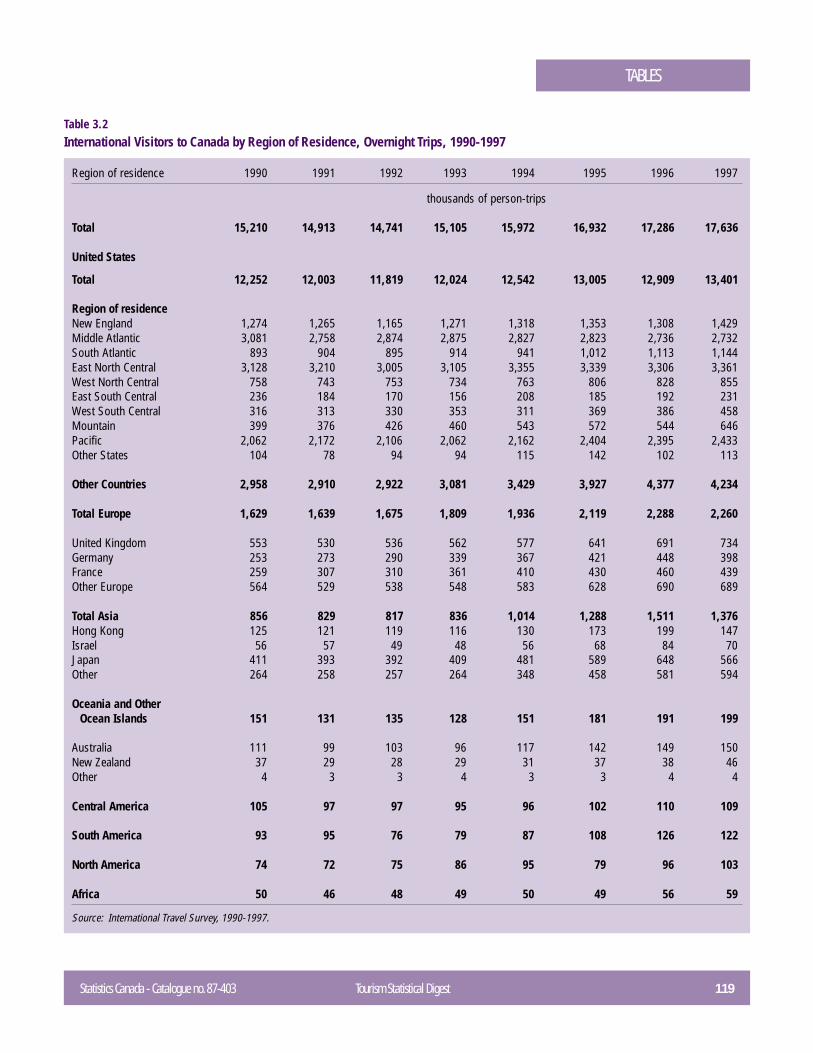
Statistics Canada - Catalogue no. 87-403 Tourism Statistical Digest 119
TABLES
Region of residence 1990 1991 1992 1993 1994 1995 1996 1997
thousands of person-trips
Total 15,210 14,913 14,741 15,105 15,972 16,932 17,286 17,636
United States
Total 12,252 12,003 11,819 12,024 12,542 13,005 12,909 13,401
Region of residenceNew England 1,274 1,265 1,165 1,271 1,318 1,353 1,308 1,429Middle Atlantic 3,081 2,758 2,874 2,875 2,827 2,823 2,736 2,732South Atlantic 893 904 895 914 941 1,012 1,113 1,144East North Central 3,128 3,210 3,005 3,105 3,355 3,339 3,306 3,361West North Central 758 743 753 734 763 806 828 855East South Central 236 184 170 156 208 185 192 231West South Central 316 313 330 353 311 369 386 458Mountain 399 376 426 460 543 572 544 646Pacific 2,062 2,172 2,106 2,062 2,162 2,404 2,395 2,433Other States 104 78 94 94 115 142 102 113
Other Countries 2,958 2,910 2,922 3,081 3,429 3,927 4,377 4,234
Total Europe 1,629 1,639 1,675 1,809 1,936 2,119 2,288 2,260
United Kingdom 553 530 536 562 577 641 691 734Germany 253 273 290 339 367 421 448 398France 259 307 310 361 410 430 460 439Other Europe 564 529 538 548 583 628 690 689
Total Asia 856 829 817 836 1,014 1,288 1,511 1,376Hong Kong 125 121 119 116 130 173 199 147Israel 56 57 49 48 56 68 84 70Japan 411 393 392 409 481 589 648 566Other 264 258 257 264 348 458 581 594
Oceania and OtherOcean Islands 151 131 135 128 151 181 191 199
Australia 111 99 103 96 117 142 149 150New Zealand 37 29 28 29 31 37 38 46Other 4 3 3 4 3 3 4 4
Central America 105 97 97 95 96 102 110 109
South America 93 95 76 79 87 108 126 122
North America 74 72 75 86 95 79 96 103
Africa 50 46 48 49 50 49 56 59
Source: International Travel Survey, 1990-1997.
Table 3.2International Visitors to Canada by Region of Residence, Overnight Trips, 1990-1997
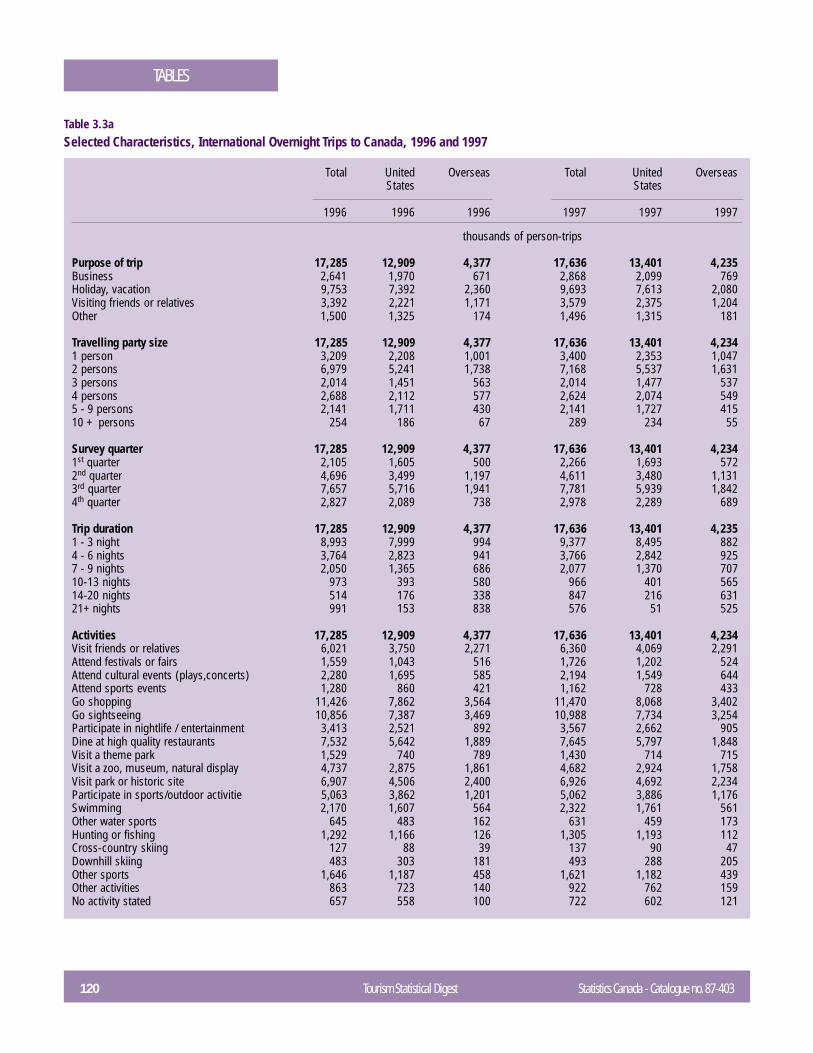
120 Tourism Statistical Digest Statistics Canada - Catalogue no. 87-403
TABLES
Total United Overseas Total United OverseasStates States
1996 1996 1996 1997 1997 1997
thousands of person-trips
Purpose of trip 17,285 12,909 4,377 17,636 13,401 4,235Business 2,641 1,970 671 2,868 2,099 769Holiday, vacation 9,753 7,392 2,360 9,693 7,613 2,080Visiting friends or relatives 3,392 2,221 1,171 3,579 2,375 1,204Other 1,500 1,325 174 1,496 1,315 181
Travelling party size 17,285 12,909 4,377 17,636 13,401 4,2341 person 3,209 2,208 1,001 3,400 2,353 1,0472 persons 6,979 5,241 1,738 7,168 5,537 1,6313 persons 2,014 1,451 563 2,014 1,477 5374 persons 2,688 2,112 577 2,624 2,074 5495 - 9 persons 2,141 1,711 430 2,141 1,727 41510 + persons 254 186 67 289 234 55
Survey quarter 17,285 12,909 4,377 17,636 13,401 4,2341st quarter 2,105 1,605 500 2,266 1,693 5722nd quarter 4,696 3,499 1,197 4,611 3,480 1,1313rd quarter 7,657 5,716 1,941 7,781 5,939 1,8424th quarter 2,827 2,089 738 2,978 2,289 689
Trip duration 17,285 12,909 4,377 17,636 13,401 4,2351 - 3 night 8,993 7,999 994 9,377 8,495 8824 - 6 nights 3,764 2,823 941 3,766 2,842 9257 - 9 nights 2,050 1,365 686 2,077 1,370 70710-13 nights 973 393 580 966 401 56514-20 nights 514 176 338 847 216 63121+ nights 991 153 838 576 51 525
Activities 17,285 12,909 4,377 17,636 13,401 4,234Visit friends or relatives 6,021 3,750 2,271 6,360 4,069 2,291Attend festivals or fairs 1,559 1,043 516 1,726 1,202 524Attend cultural events (plays,concerts) 2,280 1,695 585 2,194 1,549 644Attend sports events 1,280 860 421 1,162 728 433Go shopping 11,426 7,862 3,564 11,470 8,068 3,402Go sightseeing 10,856 7,387 3,469 10,988 7,734 3,254Participate in nightlife / entertainment 3,413 2,521 892 3,567 2,662 905Dine at high quality restaurants 7,532 5,642 1,889 7,645 5,797 1,848Visit a theme park 1,529 740 789 1,430 714 715Visit a zoo, museum, natural display 4,737 2,875 1,861 4,682 2,924 1,758Visit park or historic site 6,907 4,506 2,400 6,926 4,692 2,234Participate in sports/outdoor activitie 5,063 3,862 1,201 5,062 3,886 1,176Swimming 2,170 1,607 564 2,322 1,761 561Other water sports 645 483 162 631 459 173Hunting or fishing 1,292 1,166 126 1,305 1,193 112Cross-country skiing 127 88 39 137 90 47Downhill skiing 483 303 181 493 288 205Other sports 1,646 1,187 458 1,621 1,182 439Other activities 863 723 140 922 762 159No activity stated 657 558 100 722 602 121
Table 3.3aSelected Characteristics, International Overnight Trips to Canada, 1996 and 1997
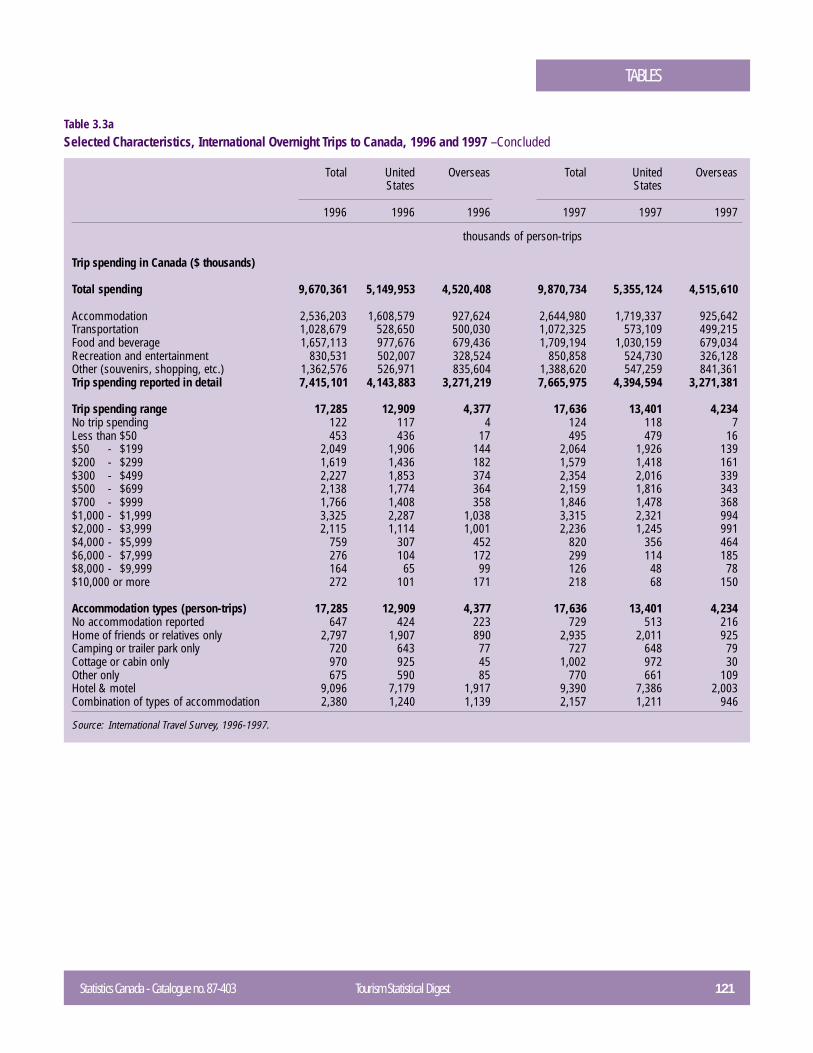
Statistics Canada - Catalogue no. 87-403 Tourism Statistical Digest 121
TABLES
Total United Overseas Total United OverseasStates States
1996 1996 1996 1997 1997 1997
thousands of person-trips
Trip spending in Canada ($ thousands)
Total spending 9,670,361 5,149,953 4,520,408 9,870,734 5,355,124 4,515,610
Accommodation 2,536,203 1,608,579 927,624 2,644,980 1,719,337 925,642Transportation 1,028,679 528,650 500,030 1,072,325 573,109 499,215Food and beverage 1,657,113 977,676 679,436 1,709,194 1,030,159 679,034Recreation and entertainment 830,531 502,007 328,524 850,858 524,730 326,128Other (souvenirs, shopping, etc.) 1,362,576 526,971 835,604 1,388,620 547,259 841,361Trip spending reported in detail 7,415,101 4,143,883 3,271,219 7,665,975 4,394,594 3,271,381
Trip spending range 17,285 12,909 4,377 17,636 13,401 4,234No trip spending 122 117 4 124 118 7Less than $50 453 436 17 495 479 16$50 - $199 2,049 1,906 144 2,064 1,926 139$200 - $299 1,619 1,436 182 1,579 1,418 161$300 - $499 2,227 1,853 374 2,354 2,016 339$500 - $699 2,138 1,774 364 2,159 1,816 343$700 - $999 1,766 1,408 358 1,846 1,478 368$1,000 - $1,999 3,325 2,287 1,038 3,315 2,321 994$2,000 - $3,999 2,115 1,114 1,001 2,236 1,245 991$4,000 - $5,999 759 307 452 820 356 464$6,000 - $7,999 276 104 172 299 114 185$8,000 - $9,999 164 65 99 126 48 78$10,000 or more 272 101 171 218 68 150
Accommodation types (person-trips) 17,285 12,909 4,377 17,636 13,401 4,234No accommodation reported 647 424 223 729 513 216Home of friends or relatives only 2,797 1,907 890 2,935 2,011 925Camping or trailer park only 720 643 77 727 648 79Cottage or cabin only 970 925 45 1,002 972 30Other only 675 590 85 770 661 109Hotel & motel 9,096 7,179 1,917 9,390 7,386 2,003Combination of types of accommodation 2,380 1,240 1,139 2,157 1,211 946
Source: International Travel Survey, 1996-1997.
Table 3.3aSelected Characteristics, International Overnight Trips to Canada, 1996 and 1997 – Concluded
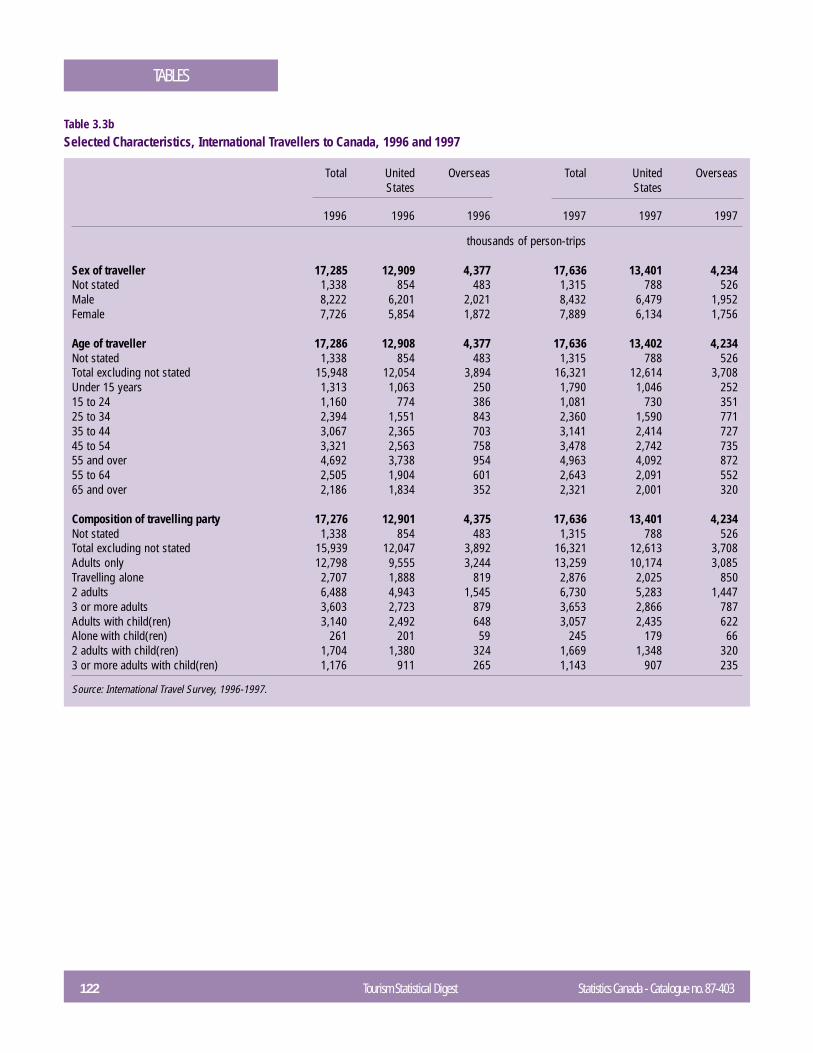
122 Tourism Statistical Digest Statistics Canada - Catalogue no. 87-403
TABLES
Total United Overseas Total United OverseasStates States
1996 1996 1996 1997 1997 1997
thousands of person-trips
Sex of traveller 17,285 12,909 4,377 17,636 13,401 4,234Not stated 1,338 854 483 1,315 788 526Male 8,222 6,201 2,021 8,432 6,479 1,952Female 7,726 5,854 1,872 7,889 6,134 1,756
Age of traveller 17,286 12,908 4,377 17,636 13,402 4,234Not stated 1,338 854 483 1,315 788 526Total excluding not stated 15,948 12,054 3,894 16,321 12,614 3,708Under 15 years 1,313 1,063 250 1,790 1,046 25215 to 24 1,160 774 386 1,081 730 35125 to 34 2,394 1,551 843 2,360 1,590 77135 to 44 3,067 2,365 703 3,141 2,414 72745 to 54 3,321 2,563 758 3,478 2,742 73555 and over 4,692 3,738 954 4,963 4,092 87255 to 64 2,505 1,904 601 2,643 2,091 55265 and over 2,186 1,834 352 2,321 2,001 320
Composition of travelling party 17,276 12,901 4,375 17,636 13,401 4,234Not stated 1,338 854 483 1,315 788 526Total excluding not stated 15,939 12,047 3,892 16,321 12,613 3,708Adults only 12,798 9,555 3,244 13,259 10,174 3,085Travelling alone 2,707 1,888 819 2,876 2,025 8502 adults 6,488 4,943 1,545 6,730 5,283 1,4473 or more adults 3,603 2,723 879 3,653 2,866 787Adults with child(ren) 3,140 2,492 648 3,057 2,435 622Alone with child(ren) 261 201 59 245 179 662 adults with child(ren) 1,704 1,380 324 1,669 1,348 3203 or more adults with child(ren) 1,176 911 265 1,143 907 235
Source: International Travel Survey, 1996-1997.
Table 3.3bSelected Characteristics, International Travellers to Canada, 1996 and 1997
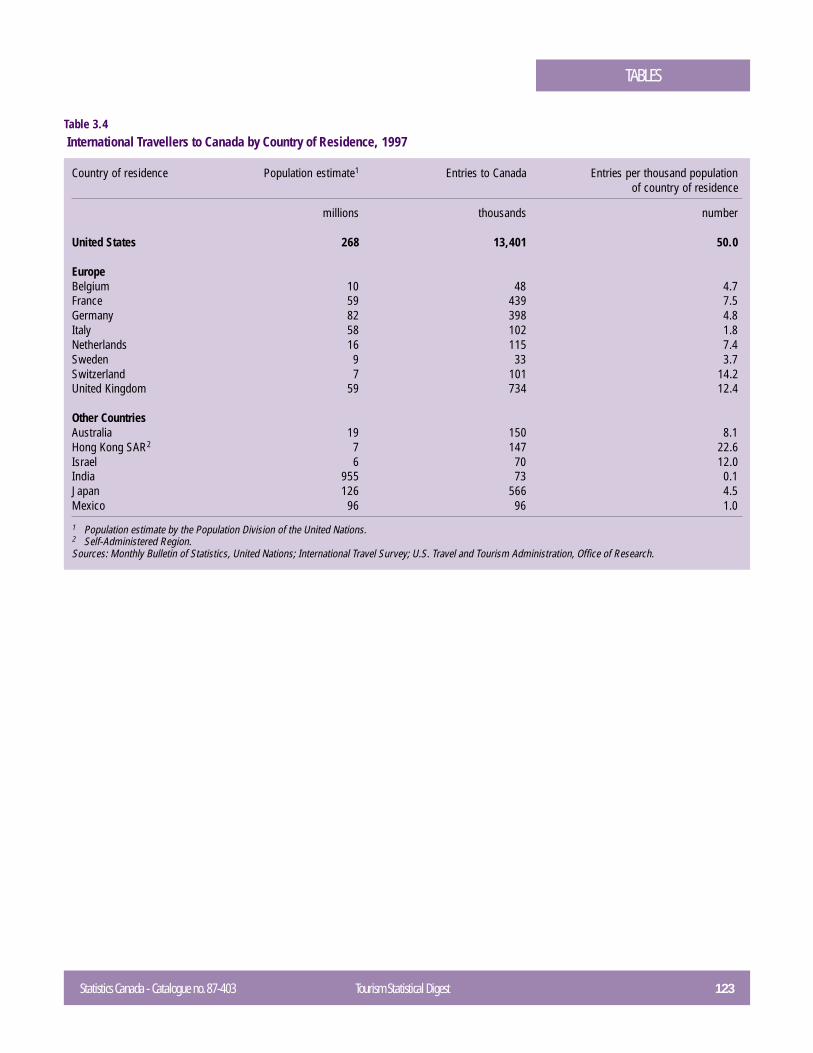
Statistics Canada - Catalogue no. 87-403 Tourism Statistical Digest 123
TABLES
Country of residence Population estimate1 Entries to Canada Entries per thousand populationof country of residence
millions thousands number
United States 268 13,401 50.0
EuropeBelgium 10 48 4.7France 59 439 7.5Germany 82 398 4.8Italy 58 102 1.8Netherlands 16 115 7.4Sweden 9 33 3.7Switzerland 7 101 14.2United Kingdom 59 734 12.4
Other CountriesAustralia 19 150 8.1Hong Kong SAR2 7 147 22.6Israel 6 70 12.0India 955 73 0.1Japan 126 566 4.5Mexico 96 96 1.0
1 Population estimate by the Population Division of the United Nations.2 Self-Administered Region.Sources: Monthly Bulletin of Statistics, United Nations; International Travel Survey; U.S. Travel and Tourism Administration, Office of Research.
Table 3.4 International Travellers to Canada by Country of Residence, 1997
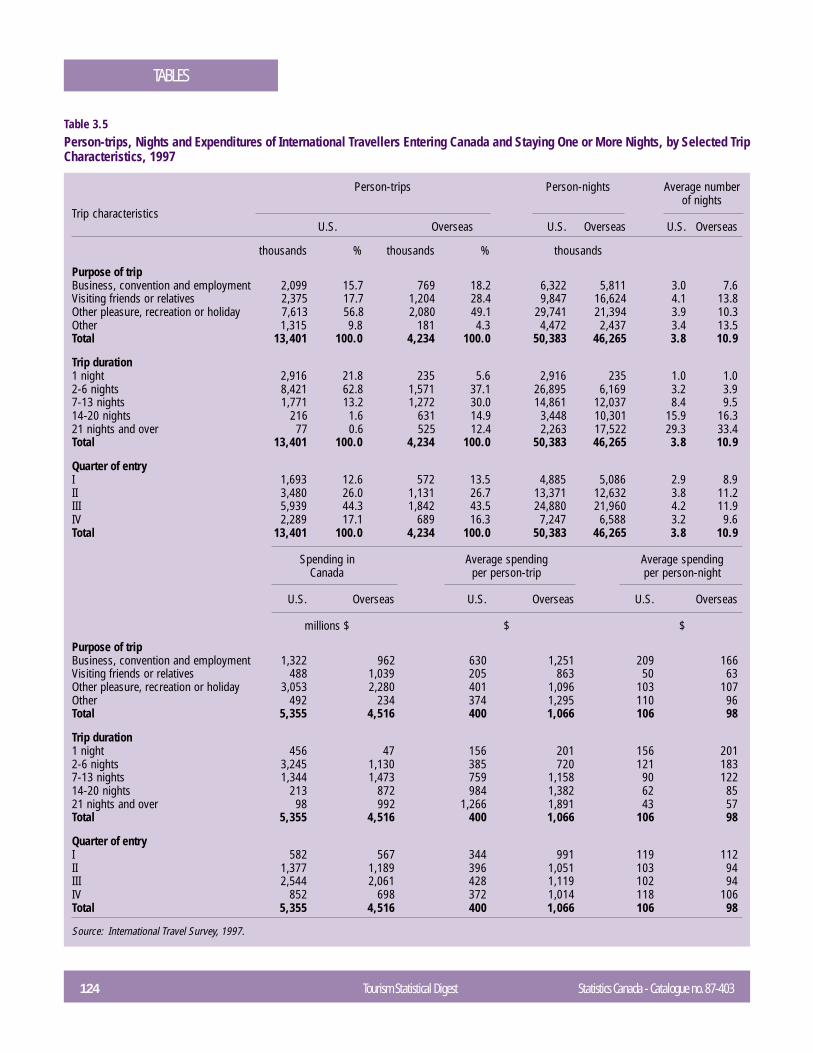
124 Tourism Statistical Digest Statistics Canada - Catalogue no. 87-403
TABLES
Person-trips Person-nights Average numberof nights
Trip characteristicsU.S. Overseas U.S. Overseas U.S. Overseas
thousands % thousands % thousands
Purpose of tripBusiness, convention and employment 2,099 15.7 769 18.2 6,322 5,811 3.0 7.6Visiting friends or relatives 2,375 17.7 1,204 28.4 9,847 16,624 4.1 13.8Other pleasure, recreation or holiday 7,613 56.8 2,080 49.1 29,741 21,394 3.9 10.3Other 1,315 9.8 181 4.3 4,472 2,437 3.4 13.5Total 13,401 100.0 4,234 100.0 50,383 46,265 3.8 10.9
Trip duration1 night 2,916 21.8 235 5.6 2,916 235 1.0 1.02-6 nights 8,421 62.8 1,571 37.1 26,895 6,169 3.2 3.97-13 nights 1,771 13.2 1,272 30.0 14,861 12,037 8.4 9.514-20 nights 216 1.6 631 14.9 3,448 10,301 15.9 16.321 nights and over 77 0.6 525 12.4 2,263 17,522 29.3 33.4Total 13,401 100.0 4,234 100.0 50,383 46,265 3.8 10.9
Quarter of entryI 1,693 12.6 572 13.5 4,885 5,086 2.9 8.9II 3,480 26.0 1,131 26.7 13,371 12,632 3.8 11.2III 5,939 44.3 1,842 43.5 24,880 21,960 4.2 11.9IV 2,289 17.1 689 16.3 7,247 6,588 3.2 9.6Total 13,401 100.0 4,234 100.0 50,383 46,265 3.8 10.9
Spending in Average spending Average spendingCanada per person-trip per person-night
U.S. Overseas U.S. Overseas U.S. Overseas
millions $ $ $
Purpose of tripBusiness, convention and employment 1,322 962 630 1,251 209 166Visiting friends or relatives 488 1,039 205 863 50 63Other pleasure, recreation or holiday 3,053 2,280 401 1,096 103 107Other 492 234 374 1,295 110 96Total 5,355 4,516 400 1,066 106 98
Trip duration1 night 456 47 156 201 156 2012-6 nights 3,245 1,130 385 720 121 1837-13 nights 1,344 1,473 759 1,158 90 12214-20 nights 213 872 984 1,382 62 8521 nights and over 98 992 1,266 1,891 43 57Total 5,355 4,516 400 1,066 106 98
Quarter of entryI 582 567 344 991 119 112II 1,377 1,189 396 1,051 103 94III 2,544 2,061 428 1,119 102 94IV 852 698 372 1,014 118 106Total 5,355 4,516 400 1,066 106 98
Source: International Travel Survey, 1997.
Table 3.5Person-trips, Nights and Expenditures of International Travellers Entering Canada and Staying One or More Nights, by Selected TripCharacteristics, 1997
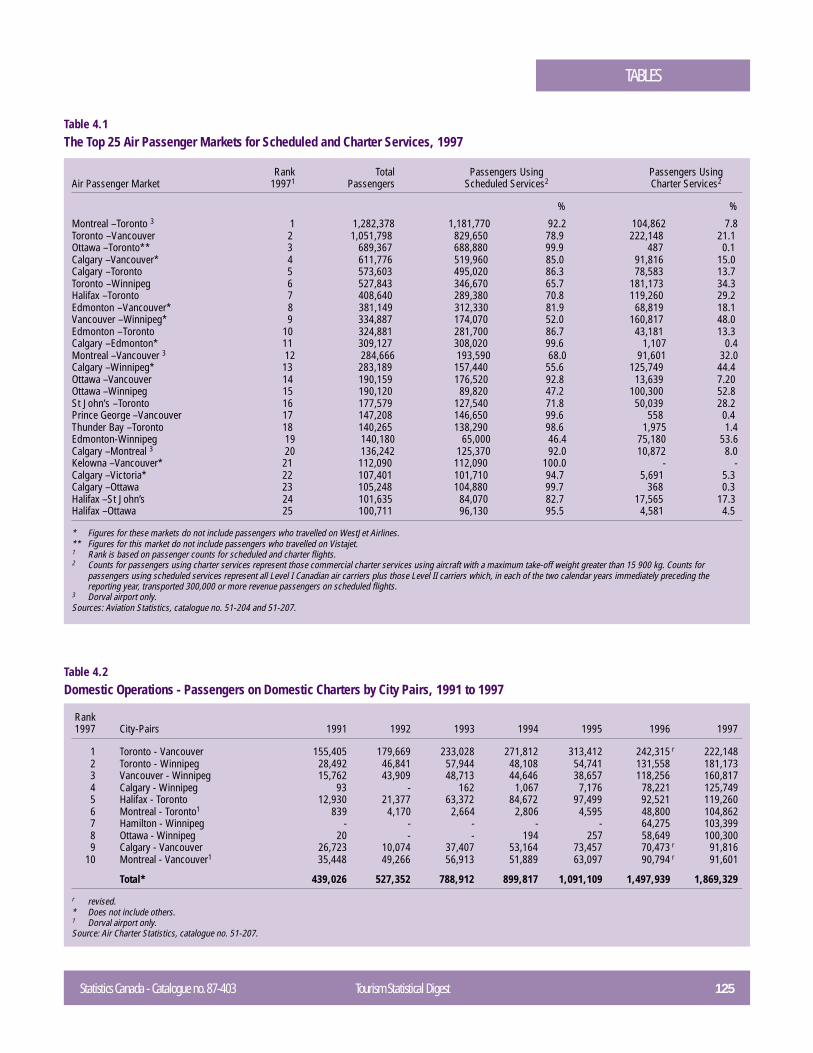
Statistics Canada - Catalogue no. 87-403 Tourism Statistical Digest 125
TABLES
Rank Total Passengers Using Passengers UsingAir Passenger Market 19971 Passengers Scheduled Services2 Charter Services2
% %
Montreal – Toronto 3 1 1,282,378 1,181,770 92.2 104,862 7.8Toronto – Vancouver 2 1,051,798 829,650 78.9 222,148 21.1Ottawa – Toronto** 3 689,367 688,880 99.9 487 0.1Calgary – Vancouver* 4 611,776 519,960 85.0 91,816 15.0Calgary – Toronto 5 573,603 495,020 86.3 78,583 13.7Toronto – Winnipeg 6 527,843 346,670 65.7 181,173 34.3Halifax – Toronto 7 408,640 289,380 70.8 119,260 29.2Edmonton – Vancouver* 8 381,149 312,330 81.9 68,819 18.1Vancouver – Winnipeg* 9 334,887 174,070 52.0 160,817 48.0Edmonton – Toronto 10 324,881 281,700 86.7 43,181 13.3Calgary – Edmonton* 11 309,127 308,020 99.6 1,107 0.4Montreal – Vancouver 3 12 284,666 193,590 68.0 91,601 32.0Calgary – Winnipeg* 13 283,189 157,440 55.6 125,749 44.4Ottawa – Vancouver 14 190,159 176,520 92.8 13,639 7.20Ottawa – Winnipeg 15 190,120 89,820 47.2 100,300 52.8St John’s – Toronto 16 177,579 127,540 71.8 50,039 28.2Prince George – Vancouver 17 147,208 146,650 99.6 558 0.4Thunder Bay – Toronto 18 140,265 138,290 98.6 1,975 1.4Edmonton-Winnipeg 19 140,180 65,000 46.4 75,180 53.6Calgary – Montreal 3 20 136,242 125,370 92.0 10,872 8.0Kelowna – Vancouver* 21 112,090 112,090 100.0 - -Calgary – Victoria* 22 107,401 101,710 94.7 5,691 5.3Calgary – Ottawa 23 105,248 104,880 99.7 368 0.3Halifax – St John’s 24 101,635 84,070 82.7 17,565 17.3Halifax – Ottawa 25 100,711 96,130 95.5 4,581 4.5
* Figures for these markets do not include passengers who travelled on WestJet Airlines.** Figures for this market do not include passengers who travelled on Vistajet.1 Rank is based on passenger counts for scheduled and charter flights.2 Counts for passengers using charter services represent those commercial charter services using aircraft with a maximum take-off weight greater than 15 900 kg. Counts for
passengers using scheduled services represent all Level I Canadian air carriers plus those Level II carriers which, in each of the two calendar years immediately preceding thereporting year, transported 300,000 or more revenue passengers on scheduled flights.
3 Dorval airport only.Sources: Aviation Statistics, catalogue no. 51-204 and 51-207.
Table 4.1The Top 25 Air Passenger Markets for Scheduled and Charter Services, 1997
Rank1997 City-Pairs 1991 1992 1993 1994 1995 1996 1997
1 Toronto - Vancouver 155,405 179,669 233,028 271,812 313,412 242,315 r 222,1482 Toronto - Winnipeg 28,492 46,841 57,944 48,108 54,741 131,558 181,1733 Vancouver - Winnipeg 15,762 43,909 48,713 44,646 38,657 118,256 160,8174 Calgary - Winnipeg 93 - 162 1,067 7,176 78,221 125,7495 Halifax - Toronto 12,930 21,377 63,372 84,672 97,499 92,521 119,2606 Montreal - Toronto1 839 4,170 2,664 2,806 4,595 48,800 104,8627 Hamilton - Winnipeg - - - - - 64,275 103,3998 Ottawa - Winnipeg 20 - - 194 257 58,649 100,3009 Calgary - Vancouver 26,723 10,074 37,407 53,164 73,457 70,473 r 91,816
10 Montreal - Vancouver1 35,448 49,266 56,913 51,889 63,097 90,794 r 91,601
Total* 439,026 527,352 788,912 899,817 1,091,109 1,497,939 1,869,329
r revised.* Does not include others.1 Dorval airport only.Source: Air Charter Statistics, catalogue no. 51-207.
Table 4.2Domestic Operations - Passengers on Domestic Charters by City Pairs, 1991 to 1997
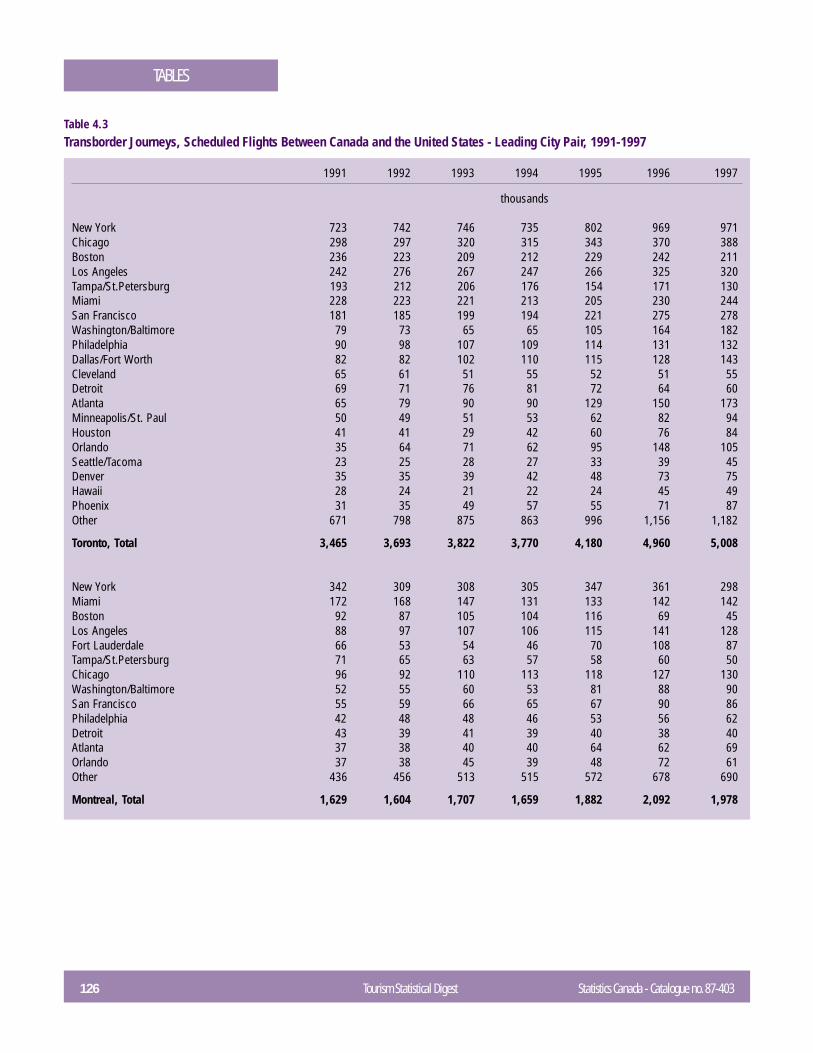
126 Tourism Statistical Digest Statistics Canada - Catalogue no. 87-403
TABLES
1991 1992 1993 1994 1995 1996 1997
thousands
New York 723 742 746 735 802 969 971Chicago 298 297 320 315 343 370 388Boston 236 223 209 212 229 242 211Los Angeles 242 276 267 247 266 325 320Tampa/St.Petersburg 193 212 206 176 154 171 130Miami 228 223 221 213 205 230 244San Francisco 181 185 199 194 221 275 278Washington/Baltimore 79 73 65 65 105 164 182Philadelphia 90 98 107 109 114 131 132Dallas/Fort Worth 82 82 102 110 115 128 143Cleveland 65 61 51 55 52 51 55Detroit 69 71 76 81 72 64 60Atlanta 65 79 90 90 129 150 173Minneapolis/St. Paul 50 49 51 53 62 82 94Houston 41 41 29 42 60 76 84Orlando 35 64 71 62 95 148 105Seattle/Tacoma 23 25 28 27 33 39 45Denver 35 35 39 42 48 73 75Hawaii 28 24 21 22 24 45 49Phoenix 31 35 49 57 55 71 87Other 671 798 875 863 996 1,156 1,182
Toronto, Total 3,465 3,693 3,822 3,770 4,180 4,960 5,008
New York 342 309 308 305 347 361 298Miami 172 168 147 131 133 142 142Boston 92 87 105 104 116 69 45Los Angeles 88 97 107 106 115 141 128Fort Lauderdale 66 53 54 46 70 108 87Tampa/St.Petersburg 71 65 63 57 58 60 50Chicago 96 92 110 113 118 127 130Washington/Baltimore 52 55 60 53 81 88 90San Francisco 55 59 66 65 67 90 86Philadelphia 42 48 48 46 53 56 62Detroit 43 39 41 39 40 38 40Atlanta 37 38 40 40 64 62 69Orlando 37 38 45 39 48 72 61Other 436 456 513 515 572 678 690
Montreal, Total 1,629 1,604 1,707 1,659 1,882 2,092 1,978
Table 4.3Transborder Journeys, Scheduled Flights Between Canada and the United States - Leading City Pair, 1991-1997
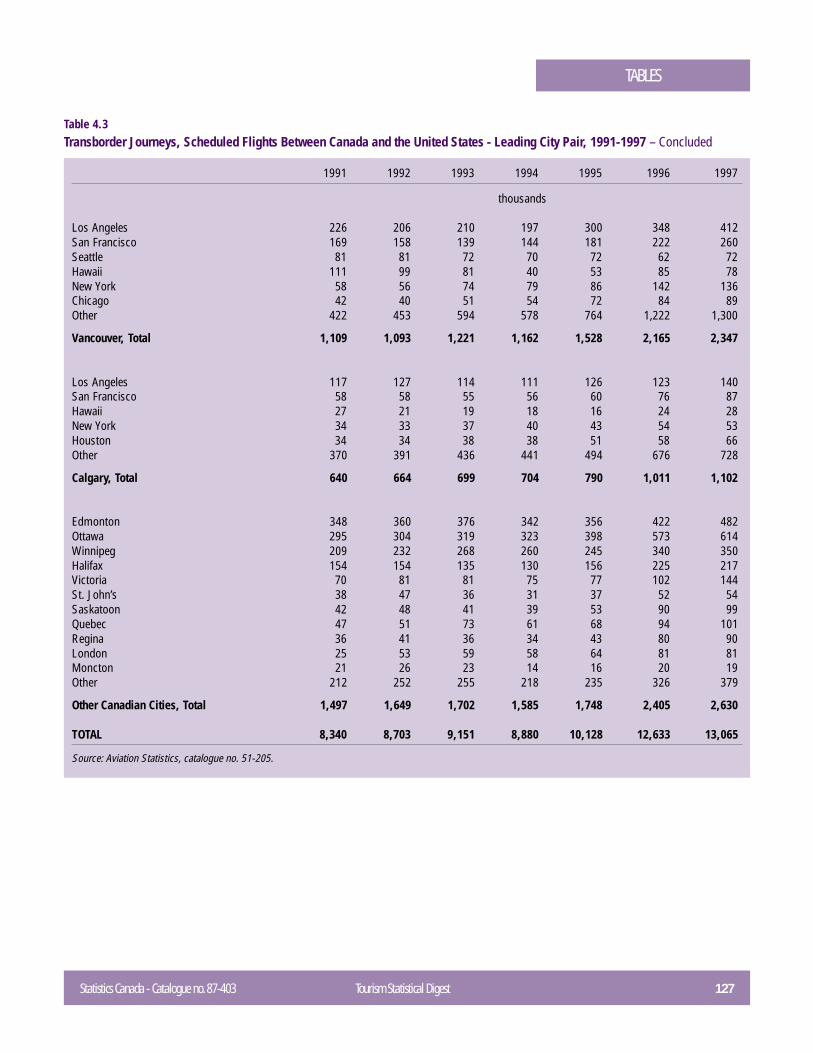
Statistics Canada - Catalogue no. 87-403 Tourism Statistical Digest 127
TABLES
1991 1992 1993 1994 1995 1996 1997
thousands
Los Angeles 226 206 210 197 300 348 412San Francisco 169 158 139 144 181 222 260Seattle 81 81 72 70 72 62 72Hawaii 111 99 81 40 53 85 78New York 58 56 74 79 86 142 136Chicago 42 40 51 54 72 84 89Other 422 453 594 578 764 1,222 1,300
Vancouver, Total 1,109 1,093 1,221 1,162 1,528 2,165 2,347
Los Angeles 117 127 114 111 126 123 140San Francisco 58 58 55 56 60 76 87Hawaii 27 21 19 18 16 24 28New York 34 33 37 40 43 54 53Houston 34 34 38 38 51 58 66Other 370 391 436 441 494 676 728
Calgary, Total 640 664 699 704 790 1,011 1,102
Edmonton 348 360 376 342 356 422 482Ottawa 295 304 319 323 398 573 614Winnipeg 209 232 268 260 245 340 350Halifax 154 154 135 130 156 225 217Victoria 70 81 81 75 77 102 144St. John’s 38 47 36 31 37 52 54Saskatoon 42 48 41 39 53 90 99Quebec 47 51 73 61 68 94 101Regina 36 41 36 34 43 80 90London 25 53 59 58 64 81 81Moncton 21 26 23 14 16 20 19Other 212 252 255 218 235 326 379
Other Canadian Cities, Total 1,497 1,649 1,702 1,585 1,748 2,405 2,630
TOTAL 8,340 8,703 9,151 8,880 10,128 12,633 13,065
Source: Aviation Statistics, catalogue no. 51-205.
Table 4.3Transborder Journeys, Scheduled Flights Between Canada and the United States - Leading City Pair, 1991-1997 – Concluded
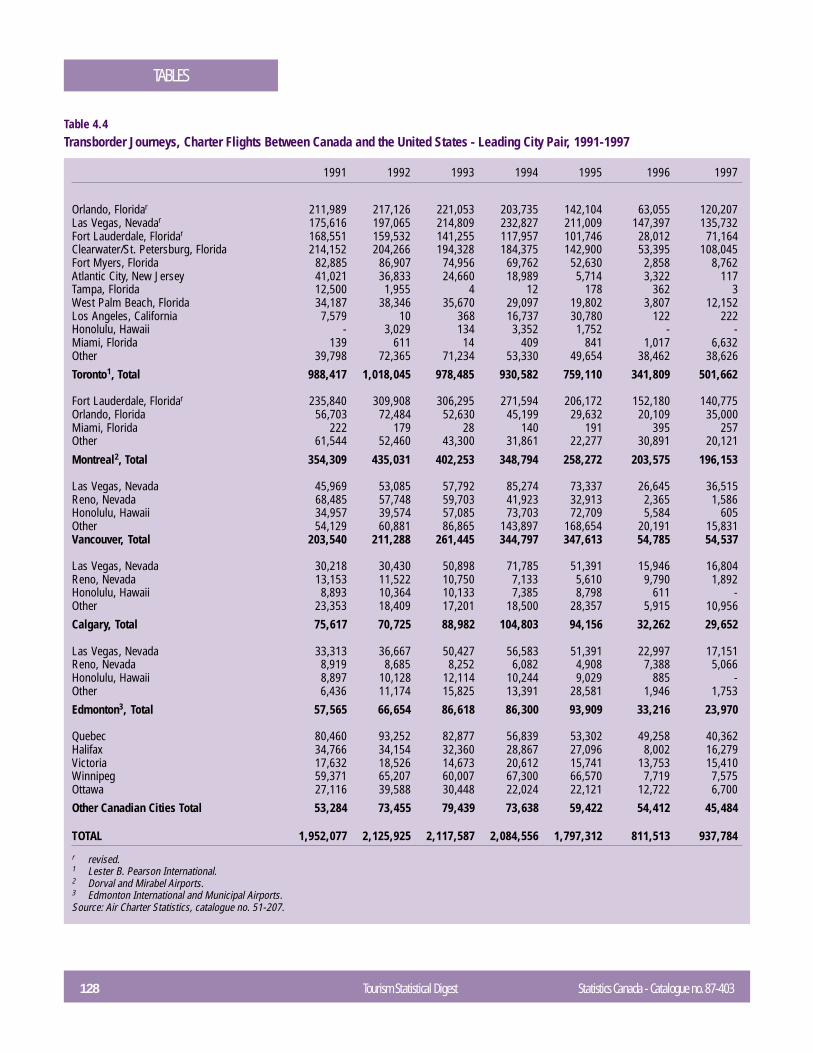
128 Tourism Statistical Digest Statistics Canada - Catalogue no. 87-403
TABLES
1991 1992 1993 1994 1995 1996 1997
Orlando, Floridar 211,989 217,126 221,053 203,735 142,104 63,055 120,207Las Vegas, Nevadar 175,616 197,065 214,809 232,827 211,009 147,397 135,732Fort Lauderdale, Floridar 168,551 159,532 141,255 117,957 101,746 28,012 71,164Clearwater/St. Petersburg, Florida 214,152 204,266 194,328 184,375 142,900 53,395 108,045Fort Myers, Florida 82,885 86,907 74,956 69,762 52,630 2,858 8,762Atlantic City, New Jersey 41,021 36,833 24,660 18,989 5,714 3,322 117Tampa, Florida 12,500 1,955 4 12 178 362 3West Palm Beach, Florida 34,187 38,346 35,670 29,097 19,802 3,807 12,152Los Angeles, California 7,579 10 368 16,737 30,780 122 222Honolulu, Hawaii - 3,029 134 3,352 1,752 - -Miami, Florida 139 611 14 409 841 1,017 6,632Other 39,798 72,365 71,234 53,330 49,654 38,462 38,626Toronto1, Total 988,417 1,018,045 978,485 930,582 759,110 341,809 501,662
Fort Lauderdale, Floridar 235,840 309,908 306,295 271,594 206,172 152,180 140,775Orlando, Florida 56,703 72,484 52,630 45,199 29,632 20,109 35,000Miami, Florida 222 179 28 140 191 395 257Other 61,544 52,460 43,300 31,861 22,277 30,891 20,121
Montreal2, Total 354,309 435,031 402,253 348,794 258,272 203,575 196,153
Las Vegas, Nevada 45,969 53,085 57,792 85,274 73,337 26,645 36,515Reno, Nevada 68,485 57,748 59,703 41,923 32,913 2,365 1,586Honolulu, Hawaii 34,957 39,574 57,085 73,703 72,709 5,584 605Other 54,129 60,881 86,865 143,897 168,654 20,191 15,831Vancouver, Total 203,540 211,288 261,445 344,797 347,613 54,785 54,537
Las Vegas, Nevada 30,218 30,430 50,898 71,785 51,391 15,946 16,804Reno, Nevada 13,153 11,522 10,750 7,133 5,610 9,790 1,892Honolulu, Hawaii 8,893 10,364 10,133 7,385 8,798 611 -Other 23,353 18,409 17,201 18,500 28,357 5,915 10,956Calgary, Total 75,617 70,725 88,982 104,803 94,156 32,262 29,652
Las Vegas, Nevada 33,313 36,667 50,427 56,583 51,391 22,997 17,151Reno, Nevada 8,919 8,685 8,252 6,082 4,908 7,388 5,066Honolulu, Hawaii 8,897 10,128 12,114 10,244 9,029 885 -Other 6,436 11,174 15,825 13,391 28,581 1,946 1,753Edmonton3, Total 57,565 66,654 86,618 86,300 93,909 33,216 23,970
Quebec 80,460 93,252 82,877 56,839 53,302 49,258 40,362Halifax 34,766 34,154 32,360 28,867 27,096 8,002 16,279Victoria 17,632 18,526 14,673 20,612 15,741 13,753 15,410Winnipeg 59,371 65,207 60,007 67,300 66,570 7,719 7,575Ottawa 27,116 39,588 30,448 22,024 22,121 12,722 6,700Other Canadian Cities Total 53,284 73,455 79,439 73,638 59,422 54,412 45,484
TOTAL 1,952,077 2,125,925 2,117,587 2,084,556 1,797,312 811,513 937,784
r revised.1 Lester B. Pearson International.2 Dorval and Mirabel Airports.3 Edmonton International and Municipal Airports.Source: Air Charter Statistics, catalogue no. 51-207.
Table 4.4Transborder Journeys, Charter Flights Between Canada and the United States - Leading City Pair, 1991-1997
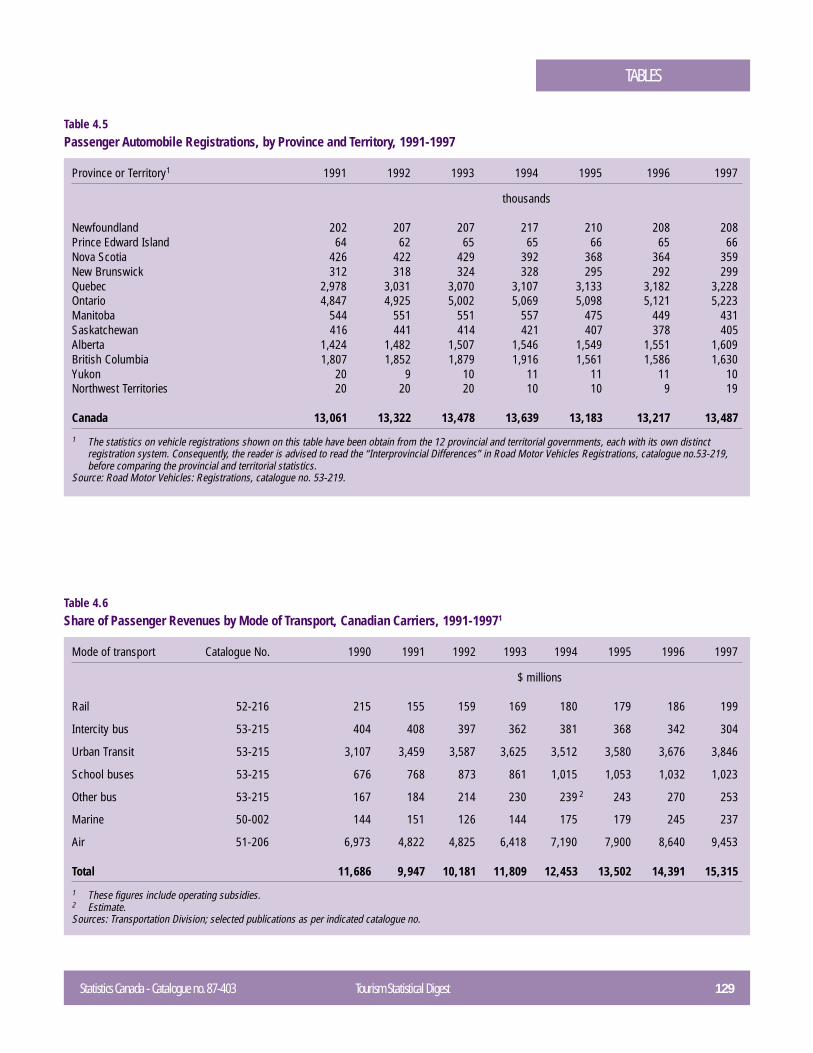
Statistics Canada - Catalogue no. 87-403 Tourism Statistical Digest 129
TABLES
Province or Territory1 1991 1992 1993 1994 1995 1996 1997
thousands
Newfoundland 202 207 207 217 210 208 208Prince Edward Island 64 62 65 65 66 65 66Nova Scotia 426 422 429 392 368 364 359New Brunswick 312 318 324 328 295 292 299Quebec 2,978 3,031 3,070 3,107 3,133 3,182 3,228Ontario 4,847 4,925 5,002 5,069 5,098 5,121 5,223Manitoba 544 551 551 557 475 449 431Saskatchewan 416 441 414 421 407 378 405Alberta 1,424 1,482 1,507 1,546 1,549 1,551 1,609British Columbia 1,807 1,852 1,879 1,916 1,561 1,586 1,630Yukon 20 9 10 11 11 11 10Northwest Territories 20 20 20 10 10 9 19
Canada 13,061 13,322 13,478 13,639 13,183 13,217 13,487
1 The statistics on vehicle registrations shown on this table have been obtain from the 12 provincial and territorial governments, each with its own distinctregistration system. Consequently, the reader is advised to read the “ Interprovincial Differences” in Road Motor Vehicles Registrations, catalogue no.53-219,before comparing the provincial and territorial statistics.
Source: Road Motor Vehicles: Registrations, catalogue no. 53-219.
Table 4.5Passenger Automobile Registrations, by Province and Territory, 1991-1997
Mode of transport Catalogue No. 1990 1991 1992 1993 1994 1995 1996 1997
$ millions
Rail 52-216 215 155 159 169 180 179 186 199
Intercity bus 53-215 404 408 397 362 381 368 342 304
Urban Transit 53-215 3,107 3,459 3,587 3,625 3,512 3,580 3,676 3,846
School buses 53-215 676 768 873 861 1,015 1,053 1,032 1,023
Other bus 53-215 167 184 214 230 239 2 243 270 253
Marine 50-002 144 151 126 144 175 179 245 237
Air 51-206 6,973 4,822 4,825 6,418 7,190 7,900 8,640 9,453
Total 11,686 9,947 10,181 11,809 12,453 13,502 14,391 15,315
1 These figures include operating subsidies.2 Estimate.Sources: Transportation Division; selected publications as per indicated catalogue no.
Table 4.6Share of Passenger Revenues by Mode of Transport, Canadian Carriers, 1991-19971
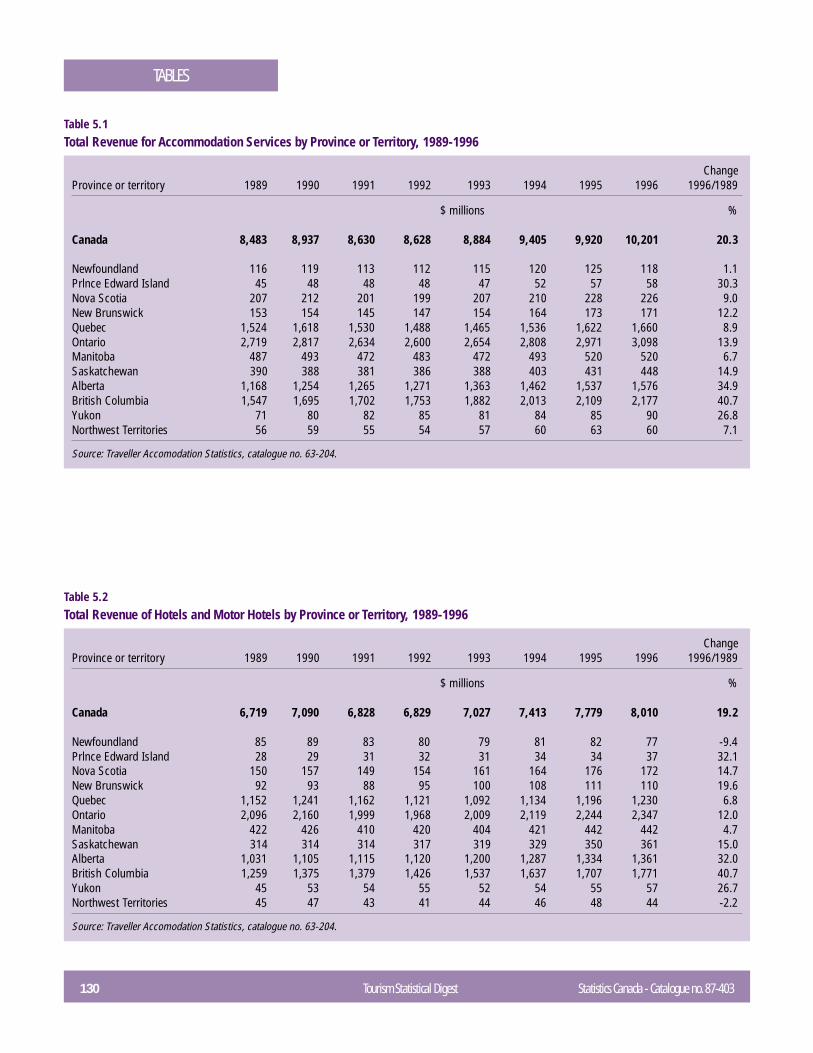
130 Tourism Statistical Digest Statistics Canada - Catalogue no. 87-403
TABLES
ChangeProvince or territory 1989 1990 1991 1992 1993 1994 1995 1996 1996/1989
$ millions %
Canada 8,483 8,937 8,630 8,628 8,884 9,405 9,920 10,201 20.3
Newfoundland 116 119 113 112 115 120 125 118 1.1Prlnce Edward Island 45 48 48 48 47 52 57 58 30.3Nova Scotia 207 212 201 199 207 210 228 226 9.0New Brunswick 153 154 145 147 154 164 173 171 12.2Quebec 1,524 1,618 1,530 1,488 1,465 1,536 1,622 1,660 8.9Ontario 2,719 2,817 2,634 2,600 2,654 2,808 2,971 3,098 13.9Manitoba 487 493 472 483 472 493 520 520 6.7Saskatchewan 390 388 381 386 388 403 431 448 14.9Alberta 1,168 1,254 1,265 1,271 1,363 1,462 1,537 1,576 34.9British Columbia 1,547 1,695 1,702 1,753 1,882 2,013 2,109 2,177 40.7Yukon 71 80 82 85 81 84 85 90 26.8Northwest Territories 56 59 55 54 57 60 63 60 7.1
Source: Traveller Accomodation Statistics, catalogue no. 63-204.
Table 5.1Total Revenue for Accommodation Services by Province or Territory, 1989-1996
ChangeProvince or territory 1989 1990 1991 1992 1993 1994 1995 1996 1996/1989
$ millions %
Canada 6,719 7,090 6,828 6,829 7,027 7,413 7,779 8,010 19.2
Newfoundland 85 89 83 80 79 81 82 77 -9.4Prlnce Edward Island 28 29 31 32 31 34 34 37 32.1Nova Scotia 150 157 149 154 161 164 176 172 14.7New Brunswick 92 93 88 95 100 108 111 110 19.6Quebec 1,152 1,241 1,162 1,121 1,092 1,134 1,196 1,230 6.8Ontario 2,096 2,160 1,999 1,968 2,009 2,119 2,244 2,347 12.0Manitoba 422 426 410 420 404 421 442 442 4.7Saskatchewan 314 314 314 317 319 329 350 361 15.0Alberta 1,031 1,105 1,115 1,120 1,200 1,287 1,334 1,361 32.0British Columbia 1,259 1,375 1,379 1,426 1,537 1,637 1,707 1,771 40.7Yukon 45 53 54 55 52 54 55 57 26.7Northwest Territories 45 47 43 41 44 46 48 44 -2.2
Source: Traveller Accomodation Statistics, catalogue no. 63-204.
Table 5.2Total Revenue of Hotels and Motor Hotels by Province or Territory, 1989-1996
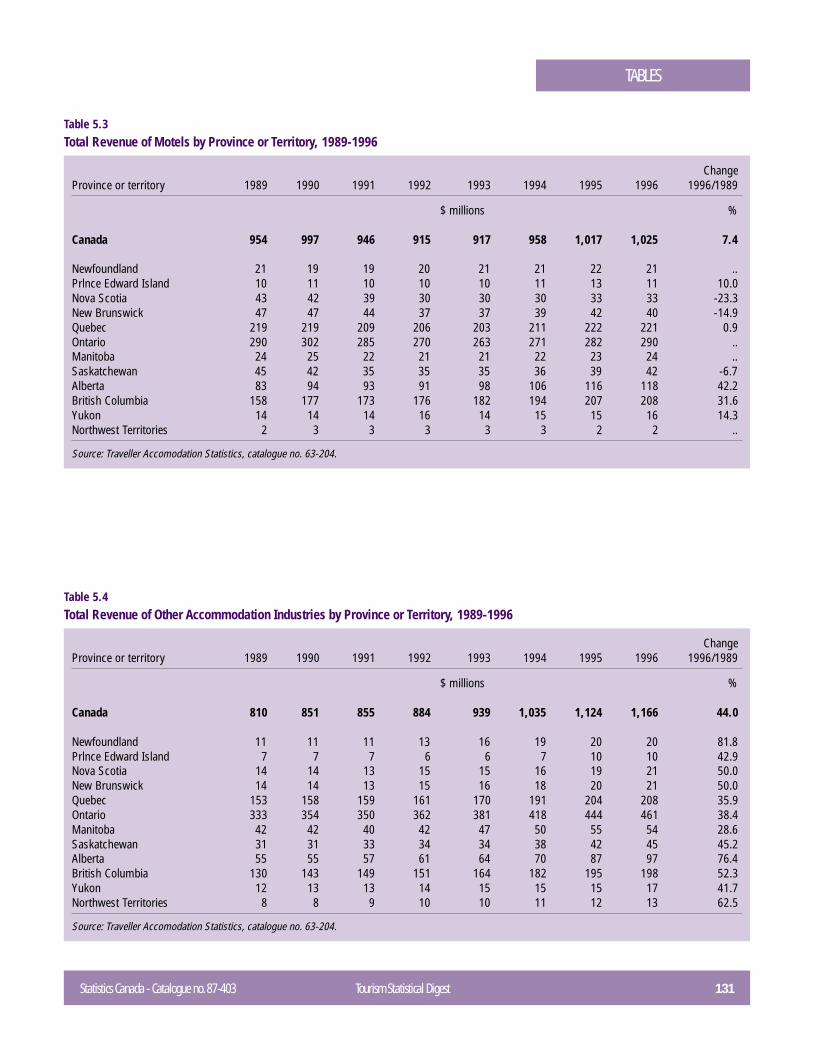
Statistics Canada - Catalogue no. 87-403 Tourism Statistical Digest 131
TABLES
ChangeProvince or territory 1989 1990 1991 1992 1993 1994 1995 1996 1996/1989
$ millions %
Canada 954 997 946 915 917 958 1,017 1,025 7.4
Newfoundland 21 19 19 20 21 21 22 21 ..Prlnce Edward Island 10 11 10 10 10 11 13 11 10.0Nova Scotia 43 42 39 30 30 30 33 33 -23.3New Brunswick 47 47 44 37 37 39 42 40 -14.9Quebec 219 219 209 206 203 211 222 221 0.9Ontario 290 302 285 270 263 271 282 290 ..Manitoba 24 25 22 21 21 22 23 24 ..Saskatchewan 45 42 35 35 35 36 39 42 -6.7Alberta 83 94 93 91 98 106 116 118 42.2British Columbia 158 177 173 176 182 194 207 208 31.6Yukon 14 14 14 16 14 15 15 16 14.3Northwest Territories 2 3 3 3 3 3 2 2 ..
Source: Traveller Accomodation Statistics, catalogue no. 63-204.
Table 5.3Total Revenue of Motels by Province or Territory, 1989-1996
ChangeProvince or territory 1989 1990 1991 1992 1993 1994 1995 1996 1996/1989
$ millions %
Canada 810 851 855 884 939 1,035 1,124 1,166 44.0
Newfoundland 11 11 11 13 16 19 20 20 81.8Prlnce Edward Island 7 7 7 6 6 7 10 10 42.9Nova Scotia 14 14 13 15 15 16 19 21 50.0New Brunswick 14 14 13 15 16 18 20 21 50.0Quebec 153 158 159 161 170 191 204 208 35.9Ontario 333 354 350 362 381 418 444 461 38.4Manitoba 42 42 40 42 47 50 55 54 28.6Saskatchewan 31 31 33 34 34 38 42 45 45.2Alberta 55 55 57 61 64 70 87 97 76.4British Columbia 130 143 149 151 164 182 195 198 52.3Yukon 12 13 13 14 15 15 15 17 41.7Northwest Territories 8 8 9 10 10 11 12 13 62.5
Source: Traveller Accomodation Statistics, catalogue no. 63-204.
Table 5.4Total Revenue of Other Accommodation Industries by Province or Territory, 1989-1996
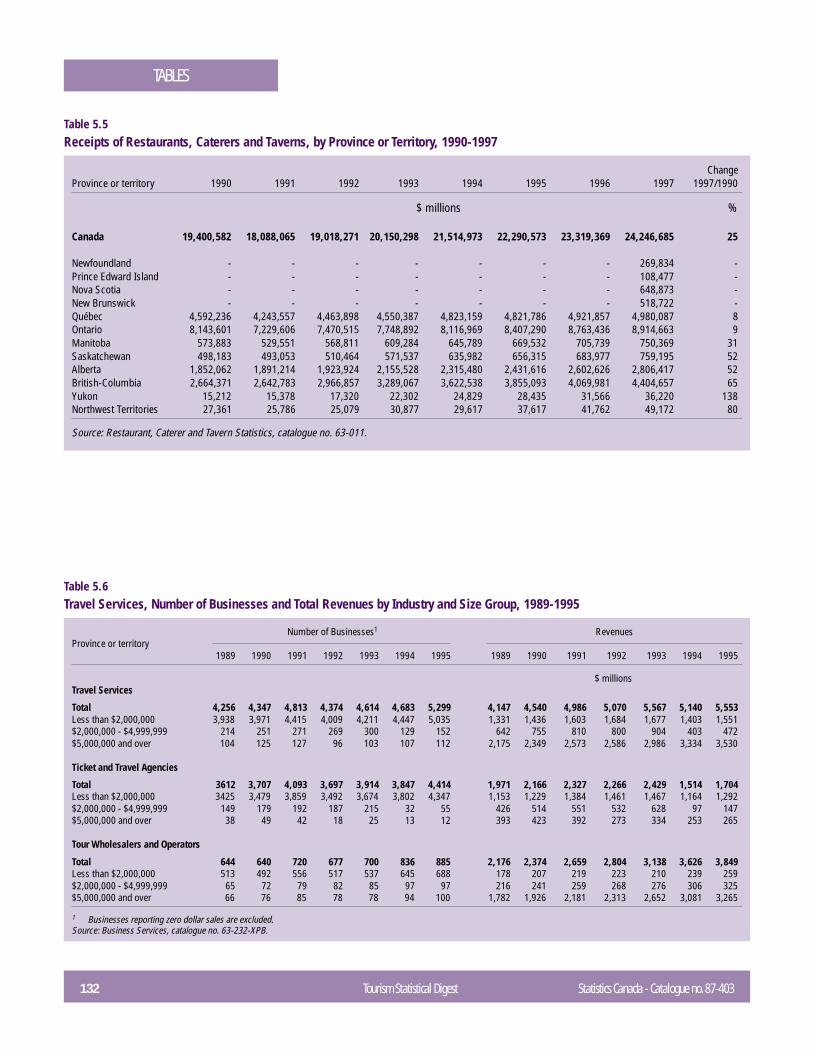
132 Tourism Statistical Digest Statistics Canada - Catalogue no. 87-403
TABLES
ChangeProvince or territory 1990 1991 1992 1993 1994 1995 1996 1997 1997/1990
$ millions %
Canada 19,400,582 18,088,065 19,018,271 20,150,298 21,514,973 22,290,573 23,319,369 24,246,685 25
Newfoundland - - - - - - - 269,834 -Prince Edward Island - - - - - - - 108,477 -Nova Scotia - - - - - - - 648,873 -New Brunswick - - - - - - - 518,722 -Québec 4,592,236 4,243,557 4,463,898 4,550,387 4,823,159 4,821,786 4,921,857 4,980,087 8Ontario 8,143,601 7,229,606 7,470,515 7,748,892 8,116,969 8,407,290 8,763,436 8,914,663 9Manitoba 573,883 529,551 568,811 609,284 645,789 669,532 705,739 750,369 31Saskatchewan 498,183 493,053 510,464 571,537 635,982 656,315 683,977 759,195 52Alberta 1,852,062 1,891,214 1,923,924 2,155,528 2,315,480 2,431,616 2,602,626 2,806,417 52British-Columbia 2,664,371 2,642,783 2,966,857 3,289,067 3,622,538 3,855,093 4,069,981 4,404,657 65Yukon 15,212 15,378 17,320 22,302 24,829 28,435 31,566 36,220 138Northwest Territories 27,361 25,786 25,079 30,877 29,617 37,617 41,762 49,172 80
Source: Restaurant, Caterer and Tavern Statistics, catalogue no. 63-011.
Table 5.5Receipts of Restaurants, Caterers and Taverns, by Province or Territory, 1990-1997
Number of Businesses1 RevenuesProvince or territory
1989 1990 1991 1992 1993 1994 1995 1989 1990 1991 1992 1993 1994 1995
$ millionsTravel Services
Total 4,256 4,347 4,813 4,374 4,614 4,683 5,299 4,147 4,540 4,986 5,070 5,567 5,140 5,553Less than $2,000,000 3,938 3,971 4,415 4,009 4,211 4,447 5,035 1,331 1,436 1,603 1,684 1,677 1,403 1,551$2,000,000 - $4,999,999 214 251 271 269 300 129 152 642 755 810 800 904 403 472$5,000,000 and over 104 125 127 96 103 107 112 2,175 2,349 2,573 2,586 2,986 3,334 3,530
Ticket and Travel Agencies
Total 3612 3,707 4,093 3,697 3,914 3,847 4,414 1,971 2,166 2,327 2,266 2,429 1,514 1,704Less than $2,000,000 3425 3,479 3,859 3,492 3,674 3,802 4,347 1,153 1,229 1,384 1,461 1,467 1,164 1,292$2,000,000 - $4,999,999 149 179 192 187 215 32 55 426 514 551 532 628 97 147$5,000,000 and over 38 49 42 18 25 13 12 393 423 392 273 334 253 265
Tour Wholesalers and Operators
Total 644 640 720 677 700 836 885 2,176 2,374 2,659 2,804 3,138 3,626 3,849Less than $2,000,000 513 492 556 517 537 645 688 178 207 219 223 210 239 259$2,000,000 - $4,999,999 65 72 79 82 85 97 97 216 241 259 268 276 306 325$5,000,000 and over 66 76 85 78 78 94 100 1,782 1,926 2,181 2,313 2,652 3,081 3,265
1 Businesses reporting zero dollar sales are excluded.Source: Business Services, catalogue no. 63-232-XPB.
Table 5.6Travel Services, Number of Businesses and Total Revenues by Industry and Size Group, 1989-1995
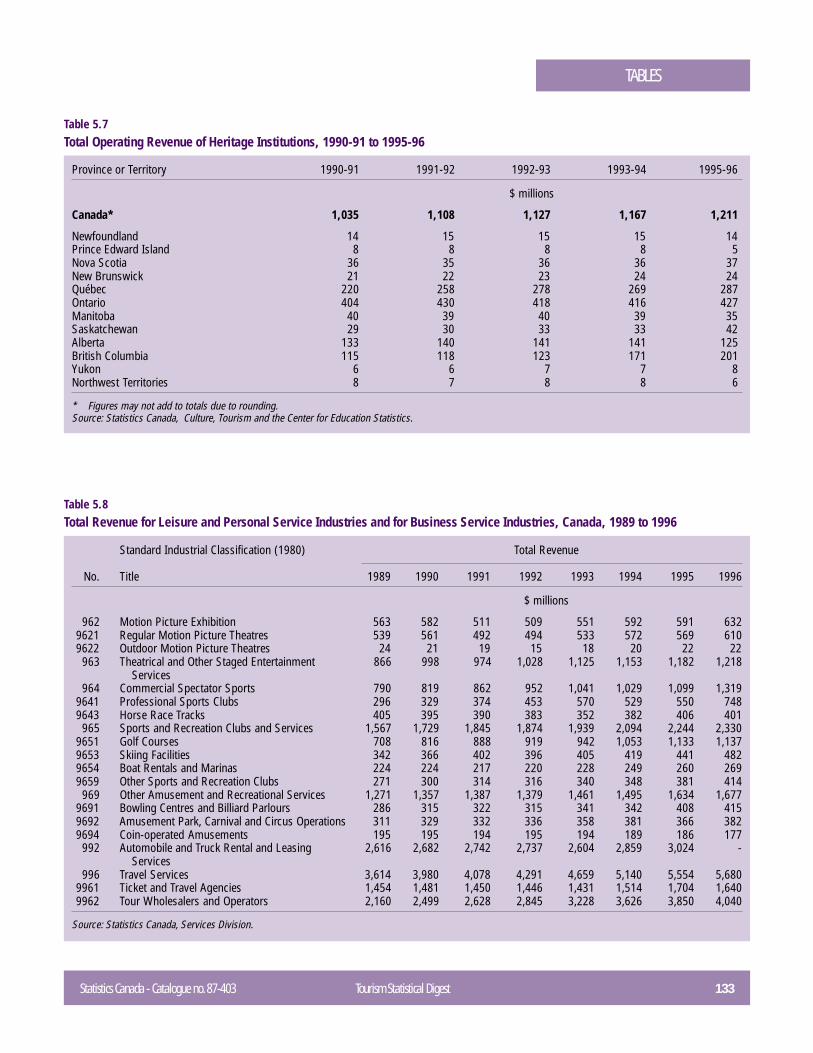
Statistics Canada - Catalogue no. 87-403 Tourism Statistical Digest 133
TABLES
Province or Territory 1990-91 1991-92 1992-93 1993-94 1995-96
$ millions
Canada* 1,035 1,108 1,127 1,167 1,211
Newfoundland 14 15 15 15 14Prince Edward Island 8 8 8 8 5Nova Scotia 36 35 36 36 37New Brunswick 21 22 23 24 24Québec 220 258 278 269 287Ontario 404 430 418 416 427Manitoba 40 39 40 39 35Saskatchewan 29 30 33 33 42Alberta 133 140 141 141 125British Columbia 115 118 123 171 201Yukon 6 6 7 7 8Northwest Territories 8 7 8 8 6
* Figures may not add to totals due to rounding.Source: Statistics Canada, Culture, Tourism and the Center for Education Statistics.
Table 5.7Total Operating Revenue of Heritage Institutions, 1990-91 to 1995-96
Standard Industrial Classification (1980) Total Revenue
No. Title 1989 1990 1991 1992 1993 1994 1995 1996
$ millions
962 Motion Picture Exhibition 563 582 511 509 551 592 591 6329621 Regular Motion Picture Theatres 539 561 492 494 533 572 569 6109622 Outdoor Motion Picture Theatres 24 21 19 15 18 20 22 22
963 Theatrical and Other Staged Entertainment 866 998 974 1,028 1,125 1,153 1,182 1,218Services
964 Commercial Spectator Sports 790 819 862 952 1,041 1,029 1,099 1,3199641 Professional Sports Clubs 296 329 374 453 570 529 550 7489643 Horse Race Tracks 405 395 390 383 352 382 406 401
965 Sports and Recreation Clubs and Services 1,567 1,729 1,845 1,874 1,939 2,094 2,244 2,3309651 Golf Courses 708 816 888 919 942 1,053 1,133 1,1379653 Skiing Facilities 342 366 402 396 405 419 441 4829654 Boat Rentals and Marinas 224 224 217 220 228 249 260 2699659 Other Sports and Recreation Clubs 271 300 314 316 340 348 381 414
969 Other Amusement and Recreational Services 1,271 1,357 1,387 1,379 1,461 1,495 1,634 1,6779691 Bowling Centres and Billiard Parlours 286 315 322 315 341 342 408 4159692 Amusement Park, Carnival and Circus Operations 311 329 332 336 358 381 366 3829694 Coin-operated Amusements 195 195 194 195 194 189 186 177
992 Automobile and Truck Rental and Leasing 2,616 2,682 2,742 2,737 2,604 2,859 3,024 -Services
996 Travel Services 3,614 3,980 4,078 4,291 4,659 5,140 5,554 5,6809961 Ticket and Travel Agencies 1,454 1,481 1,450 1,446 1,431 1,514 1,704 1,6409962 Tour Wholesalers and Operators 2,160 2,499 2,628 2,845 3,228 3,626 3,850 4,040
Source: Statistics Canada, Services Division.
Table 5.8Total Revenue for Leisure and Personal Service Industries and for Business Service Industries, Canada, 1989 to 1996
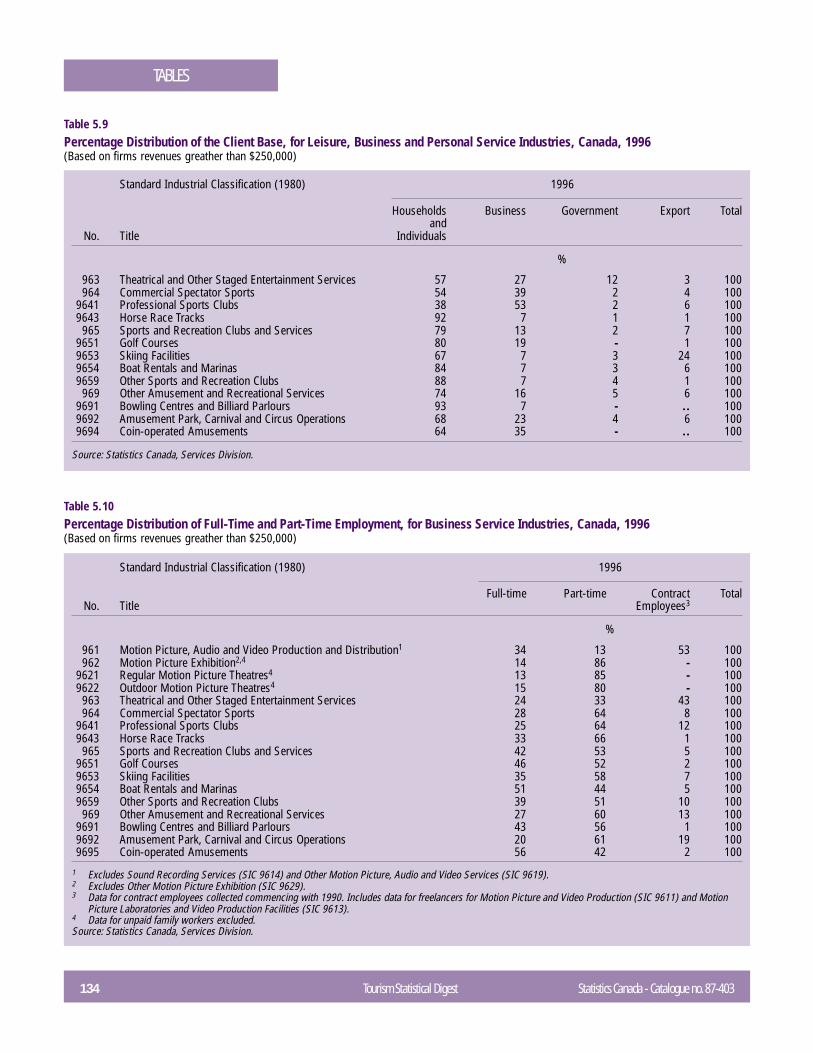
134 Tourism Statistical Digest Statistics Canada - Catalogue no. 87-403
TABLES
Standard Industrial Classification (1980) 1996
Households Business Government Export Totaland
No. Title Individuals
%
963 Theatrical and Other Staged Entertainment Services 57 27 12 3 100964 Commercial Spectator Sports 54 39 2 4 100
9641 Professional Sports Clubs 38 53 2 6 1009643 Horse Race Tracks 92 7 1 1 100
965 Sports and Recreation Clubs and Services 79 13 2 7 1009651 Golf Courses 80 19 - 1 1009653 Skiing Facilities 67 7 3 24 1009654 Boat Rentals and Marinas 84 7 3 6 1009659 Other Sports and Recreation Clubs 88 7 4 1 100
969 Other Amusement and Recreational Services 74 16 5 6 1009691 Bowling Centres and Billiard Parlours 93 7 - .. 1009692 Amusement Park, Carnival and Circus Operations 68 23 4 6 1009694 Coin-operated Amusements 64 35 - .. 100
Source: Statistics Canada, Services Division.
Table 5.9Percentage Distribution of the Client Base, for Leisure, Business and Personal Service Industries, Canada, 1996(Based on firms revenues greather than $250,000)
Standard Industrial Classification (1980) 1996
Full-time Part-time Contract TotalNo. Title Employees3
%
961 Motion Picture, Audio and Video Production and Distribution1 34 13 53 100962 Motion Picture Exhibition2,4 14 86 - 100
9621 Regular Motion Picture Theatres4 13 85 - 1009622 Outdoor Motion Picture Theatres4 15 80 - 100
963 Theatrical and Other Staged Entertainment Services 24 33 43 100964 Commercial Spectator Sports 28 64 8 100
9641 Professional Sports Clubs 25 64 12 1009643 Horse Race Tracks 33 66 1 100
965 Sports and Recreation Clubs and Services 42 53 5 1009651 Golf Courses 46 52 2 1009653 Skiing Facilities 35 58 7 1009654 Boat Rentals and Marinas 51 44 5 1009659 Other Sports and Recreation Clubs 39 51 10 100
969 Other Amusement and Recreational Services 27 60 13 1009691 Bowling Centres and Billiard Parlours 43 56 1 1009692 Amusement Park, Carnival and Circus Operations 20 61 19 1009695 Coin-operated Amusements 56 42 2 100
1 Excludes Sound Recording Services (SIC 9614) and Other Motion Picture, Audio and Video Services (SIC 9619).2 Excludes Other Motion Picture Exhibition (SIC 9629).3 Data for contract employees collected commencing with 1990. Includes data for freelancers for Motion Picture and Video Production (SIC 9611) and Motion
Picture Laboratories and Video Production Facilities (SIC 9613).4 Data for unpaid family workers excluded.Source: Statistics Canada, Services Division.
Table 5.10Percentage Distribution of Full-Time and Part-Time Employment, for Business Service Industries, Canada, 1996(Based on firms revenues greather than $250,000)
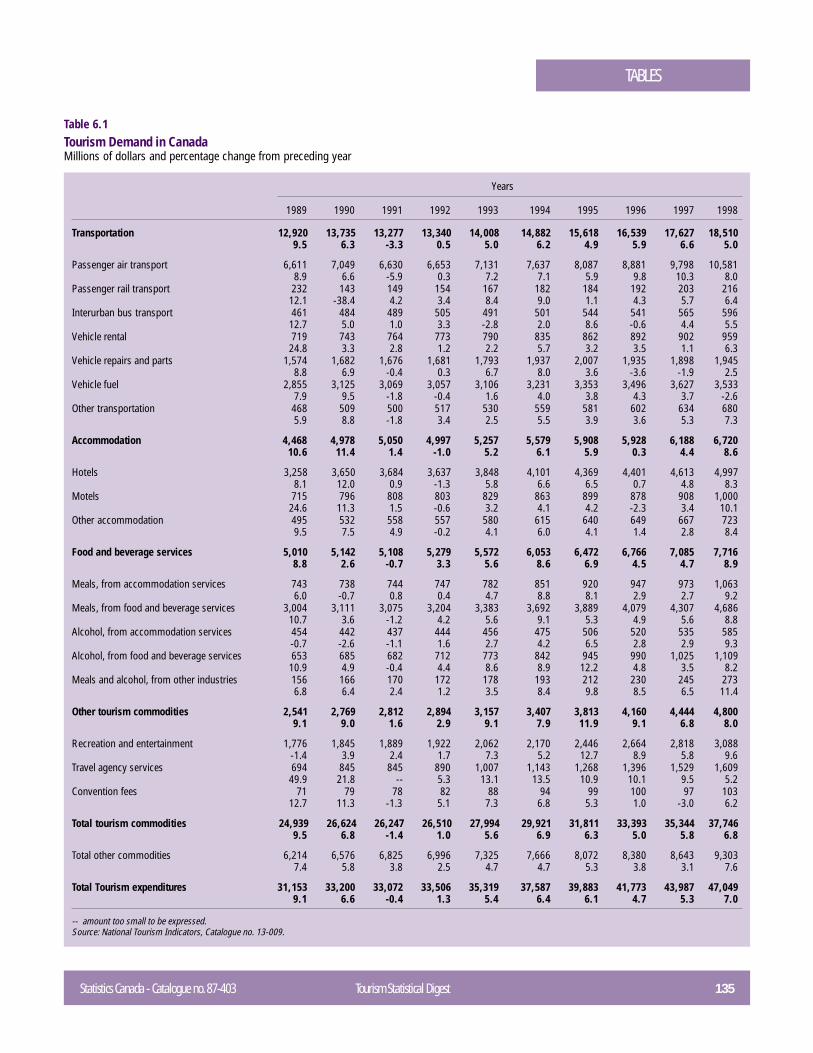
Statistics Canada - Catalogue no. 87-403 Tourism Statistical Digest 135
TABLES
Years
1989 1990 1991 1992 1993 1994 1995 1996 1997 1998
Transportation 12,920 13,735 13,277 13,340 14,008 14,882 15,618 16,539 17,627 18,5109.5 6.3 -3.3 0.5 5.0 6.2 4.9 5.9 6.6 5.0
Passenger air transport 6,611 7,049 6,630 6,653 7,131 7,637 8,087 8,881 9,798 10,5818.9 6.6 -5.9 0.3 7.2 7.1 5.9 9.8 10.3 8.0
Passenger rail transport 232 143 149 154 167 182 184 192 203 21612.1 -38.4 4.2 3.4 8.4 9.0 1.1 4.3 5.7 6.4
Interurban bus transport 461 484 489 505 491 501 544 541 565 59612.7 5.0 1.0 3.3 -2.8 2.0 8.6 -0.6 4.4 5.5
Vehicle rental 719 743 764 773 790 835 862 892 902 95924.8 3.3 2.8 1.2 2.2 5.7 3.2 3.5 1.1 6.3
Vehicle repairs and parts 1,574 1,682 1,676 1,681 1,793 1,937 2,007 1,935 1,898 1,9458.8 6.9 -0.4 0.3 6.7 8.0 3.6 -3.6 -1.9 2.5
Vehicle fuel 2,855 3,125 3,069 3,057 3,106 3,231 3,353 3,496 3,627 3,5337.9 9.5 -1.8 -0.4 1.6 4.0 3.8 4.3 3.7 -2.6
Other transportation 468 509 500 517 530 559 581 602 634 6805.9 8.8 -1.8 3.4 2.5 5.5 3.9 3.6 5.3 7.3
Accommodation 4,468 4,978 5,050 4,997 5,257 5,579 5,908 5,928 6,188 6,72010.6 11.4 1.4 -1.0 5.2 6.1 5.9 0.3 4.4 8.6
Hotels 3,258 3,650 3,684 3,637 3,848 4,101 4,369 4,401 4,613 4,9978.1 12.0 0.9 -1.3 5.8 6.6 6.5 0.7 4.8 8.3
Motels 715 796 808 803 829 863 899 878 908 1,00024.6 11.3 1.5 -0.6 3.2 4.1 4.2 -2.3 3.4 10.1
Other accommodation 495 532 558 557 580 615 640 649 667 7239.5 7.5 4.9 -0.2 4.1 6.0 4.1 1.4 2.8 8.4
Food and beverage services 5,010 5,142 5,108 5,279 5,572 6,053 6,472 6,766 7,085 7,7168.8 2.6 -0.7 3.3 5.6 8.6 6.9 4.5 4.7 8.9
Meals, from accommodation services 743 738 744 747 782 851 920 947 973 1,0636.0 -0.7 0.8 0.4 4.7 8.8 8.1 2.9 2.7 9.2
Meals, from food and beverage services 3,004 3,111 3,075 3,204 3,383 3,692 3,889 4,079 4,307 4,68610.7 3.6 -1.2 4.2 5.6 9.1 5.3 4.9 5.6 8.8
Alcohol, from accommodation services 454 442 437 444 456 475 506 520 535 585-0.7 -2.6 -1.1 1.6 2.7 4.2 6.5 2.8 2.9 9.3
Alcohol, from food and beverage services 653 685 682 712 773 842 945 990 1,025 1,10910.9 4.9 -0.4 4.4 8.6 8.9 12.2 4.8 3.5 8.2
Meals and alcohol, from other industries 156 166 170 172 178 193 212 230 245 2736.8 6.4 2.4 1.2 3.5 8.4 9.8 8.5 6.5 11.4
Other tourism commodities 2,541 2,769 2,812 2,894 3,157 3,407 3,813 4,160 4,444 4,8009.1 9.0 1.6 2.9 9.1 7.9 11.9 9.1 6.8 8.0
Recreation and entertainment 1,776 1,845 1,889 1,922 2,062 2,170 2,446 2,664 2,818 3,088-1.4 3.9 2.4 1.7 7.3 5.2 12.7 8.9 5.8 9.6
Travel agency services 694 845 845 890 1,007 1,143 1,268 1,396 1,529 1,60949.9 21.8 -- 5.3 13.1 13.5 10.9 10.1 9.5 5.2
Convention fees 71 79 78 82 88 94 99 100 97 10312.7 11.3 -1.3 5.1 7.3 6.8 5.3 1.0 -3.0 6.2
Total tourism commodities 24,939 26,624 26,247 26,510 27,994 29,921 31,811 33,393 35,344 37,7469.5 6.8 -1.4 1.0 5.6 6.9 6.3 5.0 5.8 6.8
Total other commodities 6,214 6,576 6,825 6,996 7,325 7,666 8,072 8,380 8,643 9,3037.4 5.8 3.8 2.5 4.7 4.7 5.3 3.8 3.1 7.6
Total Tourism expenditures 31,153 33,200 33,072 33,506 35,319 37,587 39,883 41,773 43,987 47,0499.1 6.6 -0.4 1.3 5.4 6.4 6.1 4.7 5.3 7.0
-- amount too small to be expressed.Source: National Tourism Indicators, Catalogue no. 13-009.
Table 6.1Tourism Demand in CanadaMillions of dollars and percentage change from preceding year
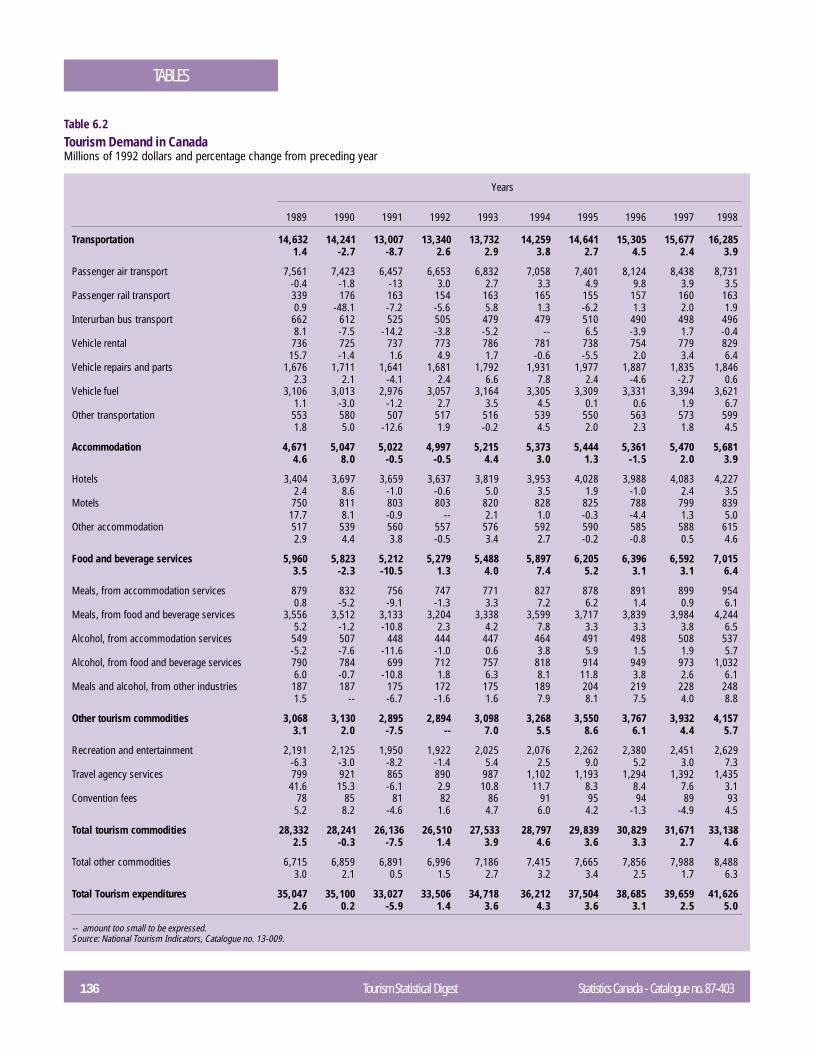
136 Tourism Statistical Digest Statistics Canada - Catalogue no. 87-403
TABLES
Years
1989 1990 1991 1992 1993 1994 1995 1996 1997 1998
Transportation 14,632 14,241 13,007 13,340 13,732 14,259 14,641 15,305 15,677 16,2851.4 -2.7 -8.7 2.6 2.9 3.8 2.7 4.5 2.4 3.9
Passenger air transport 7,561 7,423 6,457 6,653 6,832 7,058 7,401 8,124 8,438 8,731 -0.4 -1.8 -13 3.0 2.7 3.3 4.9 9.8 3.9 3.5
Passenger rail transport 339 176 163 154 163 165 155 157 160 163 0.9 -48.1 -7.2 -5.6 5.8 1.3 -6.2 1.3 2.0 1.9
Interurban bus transport 662 612 525 505 479 479 510 490 498 4968.1 -7.5 -14.2 -3.8 -5.2 -- 6.5 -3.9 1.7 -0.4
Vehicle rental 736 725 737 773 786 781 738 754 779 82915.7 -1.4 1.6 4.9 1.7 -0.6 -5.5 2.0 3.4 6.4
Vehicle repairs and parts 1,676 1,711 1,641 1,681 1,792 1,931 1,977 1,887 1,835 1,8462.3 2.1 -4.1 2.4 6.6 7.8 2.4 -4.6 -2.7 0.6
Vehicle fuel 3,106 3,013 2,976 3,057 3,164 3,305 3,309 3,331 3,394 3,6211.1 -3.0 -1.2 2.7 3.5 4.5 0.1 0.6 1.9 6.7
Other transportation 553 580 507 517 516 539 550 563 573 5991.8 5.0 -12.6 1.9 -0.2 4.5 2.0 2.3 1.8 4.5
Accommodation 4,671 5,047 5,022 4,997 5,215 5,373 5,444 5,361 5,470 5,6814.6 8.0 -0.5 -0.5 4.4 3.0 1.3 -1.5 2.0 3.9
Hotels 3,404 3,697 3,659 3,637 3,819 3,953 4,028 3,988 4,083 4,2272.4 8.6 -1.0 -0.6 5.0 3.5 1.9 -1.0 2.4 3.5
Motels 750 811 803 803 820 828 825 788 799 83917.7 8.1 -0.9 -- 2.1 1.0 -0.3 -4.4 1.3 5.0
Other accommodation 517 539 560 557 576 592 590 585 588 615 2.9 4.4 3.8 -0.5 3.4 2.7 -0.2 -0.8 0.5 4.6
Food and beverage services 5,960 5,823 5,212 5,279 5,488 5,897 6,205 6,396 6,592 7,0153.5 -2.3 -10.5 1.3 4.0 7.4 5.2 3.1 3.1 6.4
Meals, from accommodation services 879 832 756 747 771 827 878 891 899 9540.8 -5.2 -9.1 -1.3 3.3 7.2 6.2 1.4 0.9 6.1
Meals, from food and beverage services 3,556 3,512 3,133 3,204 3,338 3,599 3,717 3,839 3,984 4,2445.2 -1.2 -10.8 2.3 4.2 7.8 3.3 3.3 3.8 6.5
Alcohol, from accommodation services 549 507 448 444 447 464 491 498 508 537 -5.2 -7.6 -11.6 -1.0 0.6 3.8 5.9 1.5 1.9 5.7
Alcohol, from food and beverage services 790 784 699 712 757 818 914 949 973 1,0326.0 -0.7 -10.8 1.8 6.3 8.1 11.8 3.8 2.6 6.1
Meals and alcohol, from other industries 187 187 175 172 175 189 204 219 228 2481.5 -- -6.7 -1.6 1.6 7.9 8.1 7.5 4.0 8.8
Other tourism commodities 3,068 3,130 2,895 2,894 3,098 3,268 3,550 3,767 3,932 4,1573.1 2.0 -7.5 -- 7.0 5.5 8.6 6.1 4.4 5.7
Recreation and entertainment 2,191 2,125 1,950 1,922 2,025 2,076 2,262 2,380 2,451 2,629-6.3 -3.0 -8.2 -1.4 5.4 2.5 9.0 5.2 3.0 7.3
Travel agency services 799 921 865 890 987 1,102 1,193 1,294 1,392 1,435 41.6 15.3 -6.1 2.9 10.8 11.7 8.3 8.4 7.6 3.1
Convention fees 78 85 81 82 86 91 95 94 89 93 5.2 8.2 -4.6 1.6 4.7 6.0 4.2 -1.3 -4.9 4.5
Total tourism commodities 28,332 28,241 26,136 26,510 27,533 28,797 29,839 30,829 31,671 33,1382.5 -0.3 -7.5 1.4 3.9 4.6 3.6 3.3 2.7 4.6
Total other commodities 6,715 6,859 6,891 6,996 7,186 7,415 7,665 7,856 7,988 8,4883.0 2.1 0.5 1.5 2.7 3.2 3.4 2.5 1.7 6.3
Total Tourism expenditures 35,047 35,100 33,027 33,506 34,718 36,212 37,504 38,685 39,659 41,626 2.6 0.2 -5.9 1.4 3.6 4.3 3.6 3.1 2.5 5.0
-- amount too small to be expressed.Source: National Tourism Indicators, Catalogue no. 13-009.
Table 6.2Tourism Demand in CanadaMillions of 1992 dollars and percentage change from preceding year
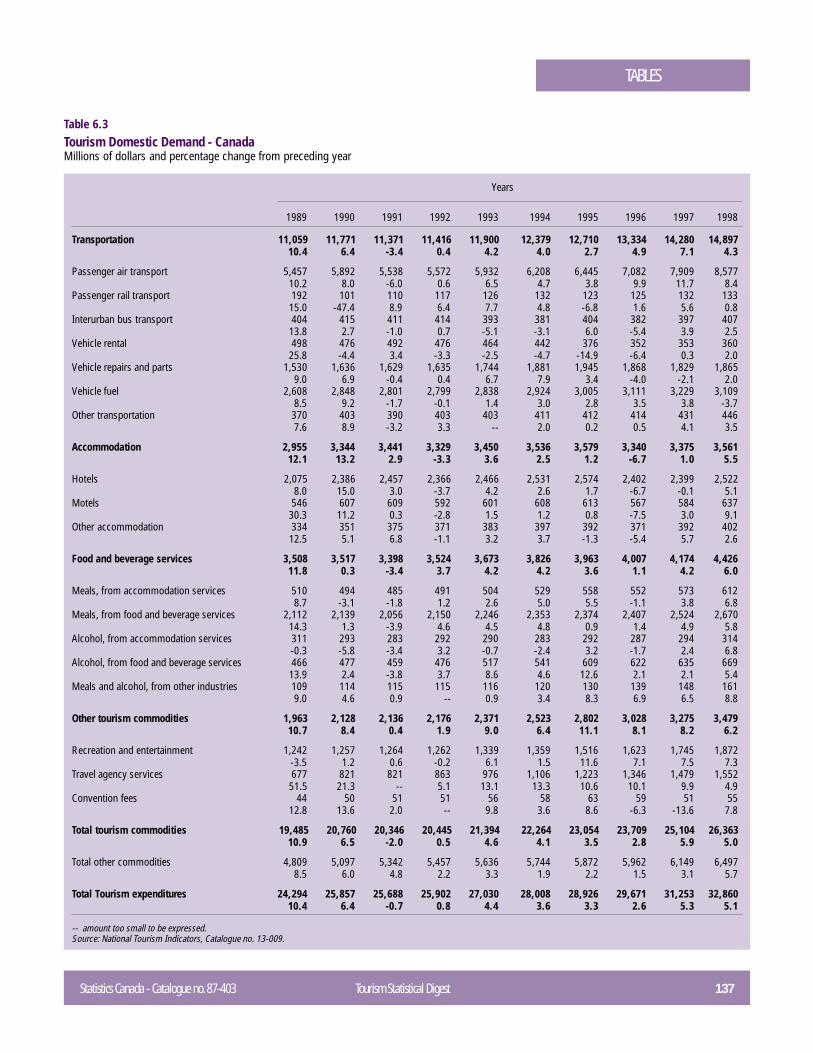
Statistics Canada - Catalogue no. 87-403 Tourism Statistical Digest 137
TABLES
Years
1989 1990 1991 1992 1993 1994 1995 1996 1997 1998
Transportation 11,059 11,771 11,371 11,416 11,900 12,379 12,710 13,334 14,280 14,897 10.4 6.4 -3.4 0.4 4.2 4.0 2.7 4.9 7.1 4.3
Passenger air transport 5,457 5,892 5,538 5,572 5,932 6,208 6,445 7,082 7,909 8,57710.2 8.0 -6.0 0.6 6.5 4.7 3.8 9.9 11.7 8.4
Passenger rail transport 192 101 110 117 126 132 123 125 132 13315.0 -47.4 8.9 6.4 7.7 4.8 -6.8 1.6 5.6 0.8
Interurban bus transport 404 415 411 414 393 381 404 382 397 40713.8 2.7 -1.0 0.7 -5.1 -3.1 6.0 -5.4 3.9 2.5
Vehicle rental 498 476 492 476 464 442 376 352 353 360 25.8 -4.4 3.4 -3.3 -2.5 -4.7 -14.9 -6.4 0.3 2.0
Vehicle repairs and parts 1,530 1,636 1,629 1,635 1,744 1,881 1,945 1,868 1,829 1,865 9.0 6.9 -0.4 0.4 6.7 7.9 3.4 -4.0 -2.1 2.0
Vehicle fuel 2,608 2,848 2,801 2,799 2,838 2,924 3,005 3,111 3,229 3,109 8.5 9.2 -1.7 -0.1 1.4 3.0 2.8 3.5 3.8 -3.7
Other transportation 370 403 390 403 403 411 412 414 431 4467.6 8.9 -3.2 3.3 -- 2.0 0.2 0.5 4.1 3.5
Accommodation 2,955 3,344 3,441 3,329 3,450 3,536 3,579 3,340 3,375 3,56112.1 13.2 2.9 -3.3 3.6 2.5 1.2 -6.7 1.0 5.5
Hotels 2,075 2,386 2,457 2,366 2,466 2,531 2,574 2,402 2,399 2,5228.0 15.0 3.0 -3.7 4.2 2.6 1.7 -6.7 -0.1 5.1
Motels 546 607 609 592 601 608 613 567 584 637 30.3 11.2 0.3 -2.8 1.5 1.2 0.8 -7.5 3.0 9.1
Other accommodation 334 351 375 371 383 397 392 371 392 40212.5 5.1 6.8 -1.1 3.2 3.7 -1.3 -5.4 5.7 2.6
Food and beverage services 3,508 3,517 3,398 3,524 3,673 3,826 3,963 4,007 4,174 4,426 11.8 0.3 -3.4 3.7 4.2 4.2 3.6 1.1 4.2 6.0
Meals, from accommodation services 510 494 485 491 504 529 558 552 573 6128.7 -3.1 -1.8 1.2 2.6 5.0 5.5 -1.1 3.8 6.8
Meals, from food and beverage services 2,112 2,139 2,056 2,150 2,246 2,353 2,374 2,407 2,524 2,67014.3 1.3 -3.9 4.6 4.5 4.8 0.9 1.4 4.9 5.8
Alcohol, from accommodation services 311 293 283 292 290 283 292 287 294 314 -0.3 -5.8 -3.4 3.2 -0.7 -2.4 3.2 -1.7 2.4 6.8
Alcohol, from food and beverage services 466 477 459 476 517 541 609 622 635 66913.9 2.4 -3.8 3.7 8.6 4.6 12.6 2.1 2.1 5.4
Meals and alcohol, from other industries 109 114 115 115 116 120 130 139 148 1619.0 4.6 0.9 -- 0.9 3.4 8.3 6.9 6.5 8.8
Other tourism commodities 1,963 2,128 2,136 2,176 2,371 2,523 2,802 3,028 3,275 3,47910.7 8.4 0.4 1.9 9.0 6.4 11.1 8.1 8.2 6.2
Recreation and entertainment 1,242 1,257 1,264 1,262 1,339 1,359 1,516 1,623 1,745 1,872-3.5 1.2 0.6 -0.2 6.1 1.5 11.6 7.1 7.5 7.3
Travel agency services 677 821 821 863 976 1,106 1,223 1,346 1,479 1,55251.5 21.3 -- 5.1 13.1 13.3 10.6 10.1 9.9 4.9
Convention fees 44 50 51 51 56 58 63 59 51 5512.8 13.6 2.0 -- 9.8 3.6 8.6 -6.3 -13.6 7.8
Total tourism commodities 19,485 20,760 20,346 20,445 21,394 22,264 23,054 23,709 25,104 26,36310.9 6.5 -2.0 0.5 4.6 4.1 3.5 2.8 5.9 5.0
Total other commodities 4,809 5,097 5,342 5,457 5,636 5,744 5,872 5,962 6,149 6,4978.5 6.0 4.8 2.2 3.3 1.9 2.2 1.5 3.1 5.7
Total Tourism expenditures 24,294 25,857 25,688 25,902 27,030 28,008 28,926 29,671 31,253 32,86010.4 6.4 -0.7 0.8 4.4 3.6 3.3 2.6 5.3 5.1
-- amount too small to be expressed.Source: National Tourism Indicators, Catalogue no. 13-009.
Table 6.3Tourism Domestic Demand - CanadaMillions of dollars and percentage change from preceding year
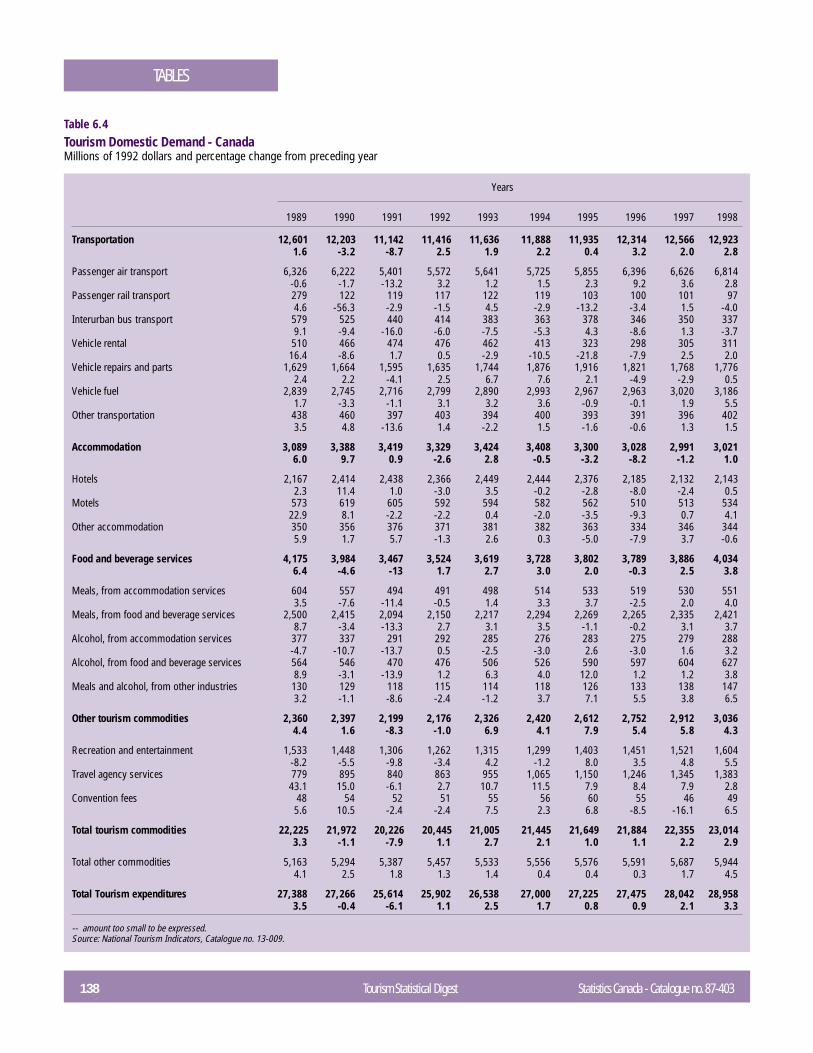
138 Tourism Statistical Digest Statistics Canada - Catalogue no. 87-403
TABLES
Years
1989 1990 1991 1992 1993 1994 1995 1996 1997 1998
Transportation 12,601 12,203 11,142 11,416 11,636 11,888 11,935 12,314 12,566 12,9231.6 -3.2 -8.7 2.5 1.9 2.2 0.4 3.2 2.0 2.8
Passenger air transport 6,326 6,222 5,401 5,572 5,641 5,725 5,855 6,396 6,626 6,814-0.6 -1.7 -13.2 3.2 1.2 1.5 2.3 9.2 3.6 2.8
Passenger rail transport 279 122 119 117 122 119 103 100 101 974.6 -56.3 -2.9 -1.5 4.5 -2.9 -13.2 -3.4 1.5 -4.0
Interurban bus transport 579 525 440 414 383 363 378 346 350 3379.1 -9.4 -16.0 -6.0 -7.5 -5.3 4.3 -8.6 1.3 -3.7
Vehicle rental 510 466 474 476 462 413 323 298 305 31116.4 -8.6 1.7 0.5 -2.9 -10.5 -21.8 -7.9 2.5 2.0
Vehicle repairs and parts 1,629 1,664 1,595 1,635 1,744 1,876 1,916 1,821 1,768 1,7762.4 2.2 -4.1 2.5 6.7 7.6 2.1 -4.9 -2.9 0.5
Vehicle fuel 2,839 2,745 2,716 2,799 2,890 2,993 2,967 2,963 3,020 3,1861.7 -3.3 -1.1 3.1 3.2 3.6 -0.9 -0.1 1.9 5.5
Other transportation 438 460 397 403 394 400 393 391 396 4023.5 4.8 -13.6 1.4 -2.2 1.5 -1.6 -0.6 1.3 1.5
Accommodation 3,089 3,388 3,419 3,329 3,424 3,408 3,300 3,028 2,991 3,0216.0 9.7 0.9 -2.6 2.8 -0.5 -3.2 -8.2 -1.2 1.0
Hotels 2,167 2,414 2,438 2,366 2,449 2,444 2,376 2,185 2,132 2,1432.3 11.4 1.0 -3.0 3.5 -0.2 -2.8 -8.0 -2.4 0.5
Motels 573 619 605 592 594 582 562 510 513 53422.9 8.1 -2.2 -2.2 0.4 -2.0 -3.5 -9.3 0.7 4.1
Other accommodation 350 356 376 371 381 382 363 334 346 3445.9 1.7 5.7 -1.3 2.6 0.3 -5.0 -7.9 3.7 -0.6
Food and beverage services 4,175 3,984 3,467 3,524 3,619 3,728 3,802 3,789 3,886 4,0346.4 -4.6 -13 1.7 2.7 3.0 2.0 -0.3 2.5 3.8
Meals, from accommodation services 604 557 494 491 498 514 533 519 530 5513.5 -7.6 -11.4 -0.5 1.4 3.3 3.7 -2.5 2.0 4.0
Meals, from food and beverage services 2,500 2,415 2,094 2,150 2,217 2,294 2,269 2,265 2,335 2,4218.7 -3.4 -13.3 2.7 3.1 3.5 -1.1 -0.2 3.1 3.7
Alcohol, from accommodation services 377 337 291 292 285 276 283 275 279 288-4.7 -10.7 -13.7 0.5 -2.5 -3.0 2.6 -3.0 1.6 3.2
Alcohol, from food and beverage services 564 546 470 476 506 526 590 597 604 6278.9 -3.1 -13.9 1.2 6.3 4.0 12.0 1.2 1.2 3.8
Meals and alcohol, from other industries 130 129 118 115 114 118 126 133 138 1473.2 -1.1 -8.6 -2.4 -1.2 3.7 7.1 5.5 3.8 6.5
Other tourism commodities 2,360 2,397 2,199 2,176 2,326 2,420 2,612 2,752 2,912 3,0364.4 1.6 -8.3 -1.0 6.9 4.1 7.9 5.4 5.8 4.3
Recreation and entertainment 1,533 1,448 1,306 1,262 1,315 1,299 1,403 1,451 1,521 1,604-8.2 -5.5 -9.8 -3.4 4.2 -1.2 8.0 3.5 4.8 5.5
Travel agency services 779 895 840 863 955 1,065 1,150 1,246 1,345 1,38343.1 15.0 -6.1 2.7 10.7 11.5 7.9 8.4 7.9 2.8
Convention fees 48 54 52 51 55 56 60 55 46 495.6 10.5 -2.4 -2.4 7.5 2.3 6.8 -8.5 -16.1 6.5
Total tourism commodities 22,225 21,972 20,226 20,445 21,005 21,445 21,649 21,884 22,355 23,0143.3 -1.1 -7.9 1.1 2.7 2.1 1.0 1.1 2.2 2.9
Total other commodities 5,163 5,294 5,387 5,457 5,533 5,556 5,576 5,591 5,687 5,9444.1 2.5 1.8 1.3 1.4 0.4 0.4 0.3 1.7 4.5
Total Tourism expenditures 27,388 27,266 25,614 25,902 26,538 27,000 27,225 27,475 28,042 28,9583.5 -0.4 -6.1 1.1 2.5 1.7 0.8 0.9 2.1 3.3
-- amount too small to be expressed.Source: National Tourism Indicators, Catalogue no. 13-009.
Table 6.4Tourism Domestic Demand - CanadaMillions of 1992 dollars and percentage change from preceding year
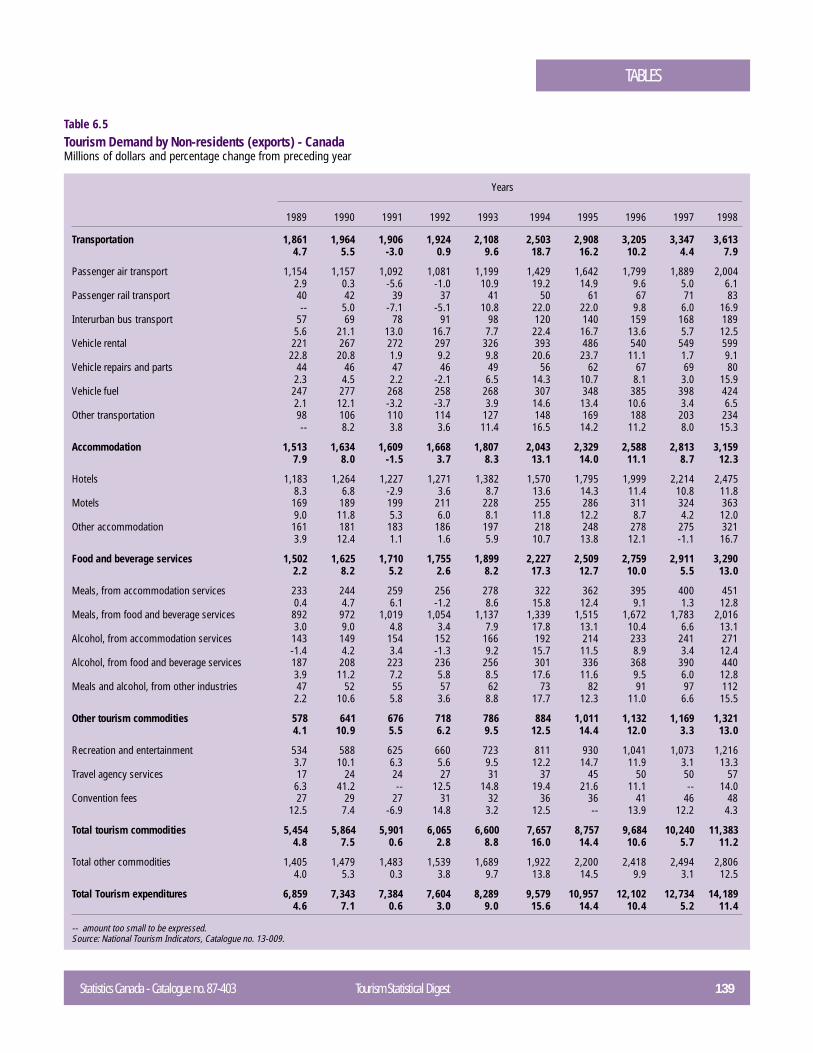
Statistics Canada - Catalogue no. 87-403 Tourism Statistical Digest 139
TABLES
Years
1989 1990 1991 1992 1993 1994 1995 1996 1997 1998
Transportation 1,861 1,964 1,906 1,924 2,108 2,503 2,908 3,205 3,347 3,6134.7 5.5 -3.0 0.9 9.6 18.7 16.2 10.2 4.4 7.9
Passenger air transport 1,154 1,157 1,092 1,081 1,199 1,429 1,642 1,799 1,889 2,0042.9 0.3 -5.6 -1.0 10.9 19.2 14.9 9.6 5.0 6.1
Passenger rail transport 40 42 39 37 41 50 61 67 71 83-- 5.0 -7.1 -5.1 10.8 22.0 22.0 9.8 6.0 16.9
Interurban bus transport 57 69 78 91 98 120 140 159 168 1895.6 21.1 13.0 16.7 7.7 22.4 16.7 13.6 5.7 12.5
Vehicle rental 221 267 272 297 326 393 486 540 549 59922.8 20.8 1.9 9.2 9.8 20.6 23.7 11.1 1.7 9.1
Vehicle repairs and parts 44 46 47 46 49 56 62 67 69 802.3 4.5 2.2 -2.1 6.5 14.3 10.7 8.1 3.0 15.9
Vehicle fuel 247 277 268 258 268 307 348 385 398 4242.1 12.1 -3.2 -3.7 3.9 14.6 13.4 10.6 3.4 6.5
Other transportation 98 106 110 114 127 148 169 188 203 234-- 8.2 3.8 3.6 11.4 16.5 14.2 11.2 8.0 15.3
Accommodation 1,513 1,634 1,609 1,668 1,807 2,043 2,329 2,588 2,813 3,1597.9 8.0 -1.5 3.7 8.3 13.1 14.0 11.1 8.7 12.3
Hotels 1,183 1,264 1,227 1,271 1,382 1,570 1,795 1,999 2,214 2,4758.3 6.8 -2.9 3.6 8.7 13.6 14.3 11.4 10.8 11.8
Motels 169 189 199 211 228 255 286 311 324 3639.0 11.8 5.3 6.0 8.1 11.8 12.2 8.7 4.2 12.0
Other accommodation 161 181 183 186 197 218 248 278 275 3213.9 12.4 1.1 1.6 5.9 10.7 13.8 12.1 -1.1 16.7
Food and beverage services 1,502 1,625 1,710 1,755 1,899 2,227 2,509 2,759 2,911 3,2902.2 8.2 5.2 2.6 8.2 17.3 12.7 10.0 5.5 13.0
Meals, from accommodation services 233 244 259 256 278 322 362 395 400 4510.4 4.7 6.1 -1.2 8.6 15.8 12.4 9.1 1.3 12.8
Meals, from food and beverage services 892 972 1,019 1,054 1,137 1,339 1,515 1,672 1,783 2,0163.0 9.0 4.8 3.4 7.9 17.8 13.1 10.4 6.6 13.1
Alcohol, from accommodation services 143 149 154 152 166 192 214 233 241 271-1.4 4.2 3.4 -1.3 9.2 15.7 11.5 8.9 3.4 12.4
Alcohol, from food and beverage services 187 208 223 236 256 301 336 368 390 4403.9 11.2 7.2 5.8 8.5 17.6 11.6 9.5 6.0 12.8
Meals and alcohol, from other industries 47 52 55 57 62 73 82 91 97 1122.2 10.6 5.8 3.6 8.8 17.7 12.3 11.0 6.6 15.5
Other tourism commodities 578 641 676 718 786 884 1,011 1,132 1,169 1,3214.1 10.9 5.5 6.2 9.5 12.5 14.4 12.0 3.3 13.0
Recreation and entertainment 534 588 625 660 723 811 930 1,041 1,073 1,2163.7 10.1 6.3 5.6 9.5 12.2 14.7 11.9 3.1 13.3
Travel agency services 17 24 24 27 31 37 45 50 50 576.3 41.2 -- 12.5 14.8 19.4 21.6 11.1 -- 14.0
Convention fees 27 29 27 31 32 36 36 41 46 4812.5 7.4 -6.9 14.8 3.2 12.5 -- 13.9 12.2 4.3
Total tourism commodities 5,454 5,864 5,901 6,065 6,600 7,657 8,757 9,684 10,240 11,3834.8 7.5 0.6 2.8 8.8 16.0 14.4 10.6 5.7 11.2
Total other commodities 1,405 1,479 1,483 1,539 1,689 1,922 2,200 2,418 2,494 2,8064.0 5.3 0.3 3.8 9.7 13.8 14.5 9.9 3.1 12.5
Total Tourism expenditures 6,859 7,343 7,384 7,604 8,289 9,579 10,957 12,102 12,734 14,1894.6 7.1 0.6 3.0 9.0 15.6 14.4 10.4 5.2 11.4
-- amount too small to be expressed.Source: National Tourism Indicators, Catalogue no. 13-009.
Table 6.5Tourism Demand by Non-residents (exports) - CanadaMillions of dollars and percentage change from preceding year
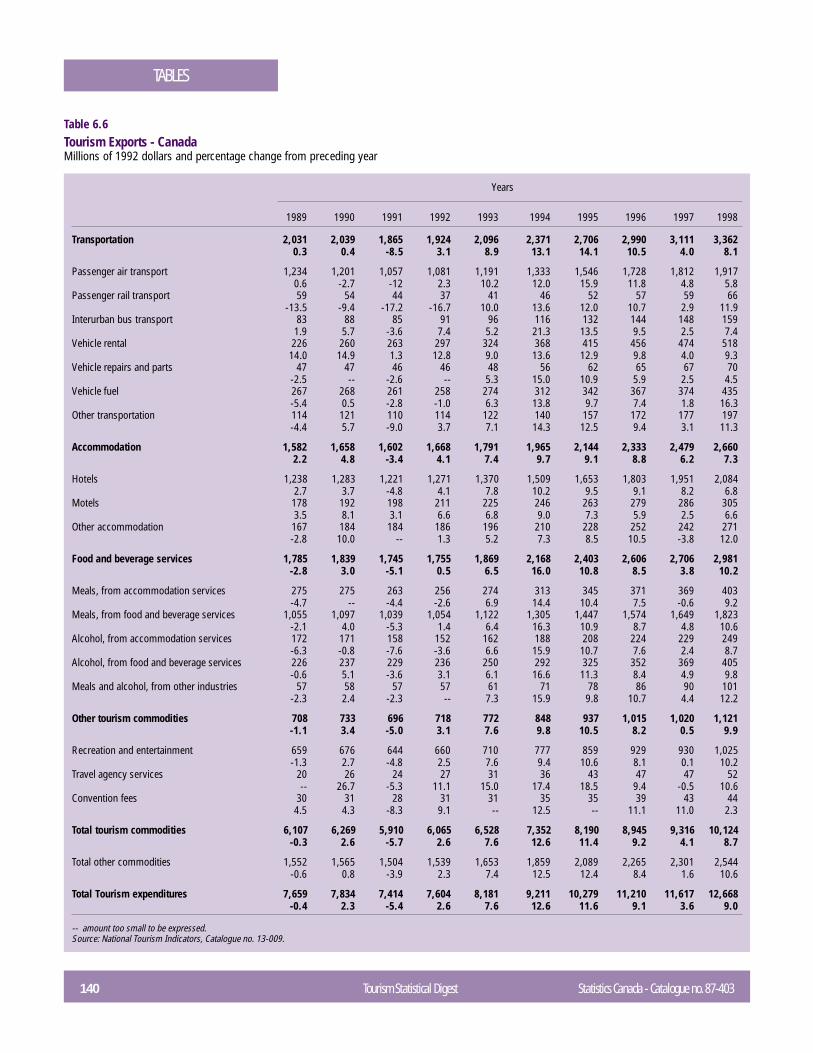
140 Tourism Statistical Digest Statistics Canada - Catalogue no. 87-403
TABLES
Years
1989 1990 1991 1992 1993 1994 1995 1996 1997 1998
Transportation 2,031 2,039 1,865 1,924 2,096 2,371 2,706 2,990 3,111 3,3620.3 0.4 -8.5 3.1 8.9 13.1 14.1 10.5 4.0 8.1
Passenger air transport 1,234 1,201 1,057 1,081 1,191 1,333 1,546 1,728 1,812 1,9170.6 -2.7 -12 2.3 10.2 12.0 15.9 11.8 4.8 5.8
Passenger rail transport 59 54 44 37 41 46 52 57 59 66-13.5 -9.4 -17.2 -16.7 10.0 13.6 12.0 10.7 2.9 11.9
Interurban bus transport 83 88 85 91 96 116 132 144 148 1591.9 5.7 -3.6 7.4 5.2 21.3 13.5 9.5 2.5 7.4
Vehicle rental 226 260 263 297 324 368 415 456 474 51814.0 14.9 1.3 12.8 9.0 13.6 12.9 9.8 4.0 9.3
Vehicle repairs and parts 47 47 46 46 48 56 62 65 67 70-2.5 -- -2.6 -- 5.3 15.0 10.9 5.9 2.5 4.5
Vehicle fuel 267 268 261 258 274 312 342 367 374 435-5.4 0.5 -2.8 -1.0 6.3 13.8 9.7 7.4 1.8 16.3
Other transportation 114 121 110 114 122 140 157 172 177 197-4.4 5.7 -9.0 3.7 7.1 14.3 12.5 9.4 3.1 11.3
Accommodation 1,582 1,658 1,602 1,668 1,791 1,965 2,144 2,333 2,479 2,6602.2 4.8 -3.4 4.1 7.4 9.7 9.1 8.8 6.2 7.3
Hotels 1,238 1,283 1,221 1,271 1,370 1,509 1,653 1,803 1,951 2,0842.7 3.7 -4.8 4.1 7.8 10.2 9.5 9.1 8.2 6.8
Motels 178 192 198 211 225 246 263 279 286 3053.5 8.1 3.1 6.6 6.8 9.0 7.3 5.9 2.5 6.6
Other accommodation 167 184 184 186 196 210 228 252 242 271-2.8 10.0 -- 1.3 5.2 7.3 8.5 10.5 -3.8 12.0
Food and beverage services 1,785 1,839 1,745 1,755 1,869 2,168 2,403 2,606 2,706 2,981-2.8 3.0 -5.1 0.5 6.5 16.0 10.8 8.5 3.8 10.2
Meals, from accommodation services 275 275 263 256 274 313 345 371 369 403-4.7 -- -4.4 -2.6 6.9 14.4 10.4 7.5 -0.6 9.2
Meals, from food and beverage services 1,055 1,097 1,039 1,054 1,122 1,305 1,447 1,574 1,649 1,823-2.1 4.0 -5.3 1.4 6.4 16.3 10.9 8.7 4.8 10.6
Alcohol, from accommodation services 172 171 158 152 162 188 208 224 229 249-6.3 -0.8 -7.6 -3.6 6.6 15.9 10.7 7.6 2.4 8.7
Alcohol, from food and beverage services 226 237 229 236 250 292 325 352 369 405-0.6 5.1 -3.6 3.1 6.1 16.6 11.3 8.4 4.9 9.8
Meals and alcohol, from other industries 57 58 57 57 61 71 78 86 90 101-2.3 2.4 -2.3 -- 7.3 15.9 9.8 10.7 4.4 12.2
Other tourism commodities 708 733 696 718 772 848 937 1,015 1,020 1,121-1.1 3.4 -5.0 3.1 7.6 9.8 10.5 8.2 0.5 9.9
Recreation and entertainment 659 676 644 660 710 777 859 929 930 1,025-1.3 2.7 -4.8 2.5 7.6 9.4 10.6 8.1 0.1 10.2
Travel agency services 20 26 24 27 31 36 43 47 47 52-- 26.7 -5.3 11.1 15.0 17.4 18.5 9.4 -0.5 10.6
Convention fees 30 31 28 31 31 35 35 39 43 444.5 4.3 -8.3 9.1 -- 12.5 -- 11.1 11.0 2.3
Total tourism commodities 6,107 6,269 5,910 6,065 6,528 7,352 8,190 8,945 9,316 10,124-0.3 2.6 -5.7 2.6 7.6 12.6 11.4 9.2 4.1 8.7
Total other commodities 1,552 1,565 1,504 1,539 1,653 1,859 2,089 2,265 2,301 2,544-0.6 0.8 -3.9 2.3 7.4 12.5 12.4 8.4 1.6 10.6
Total Tourism expenditures 7,659 7,834 7,414 7,604 8,181 9,211 10,279 11,210 11,617 12,668-0.4 2.3 -5.4 2.6 7.6 12.6 11.6 9.1 3.6 9.0
-- amount too small to be expressed.Source: National Tourism Indicators, Catalogue no. 13-009.
Table 6.6Tourism Exports - CanadaMillions of 1992 dollars and percentage change from preceding year
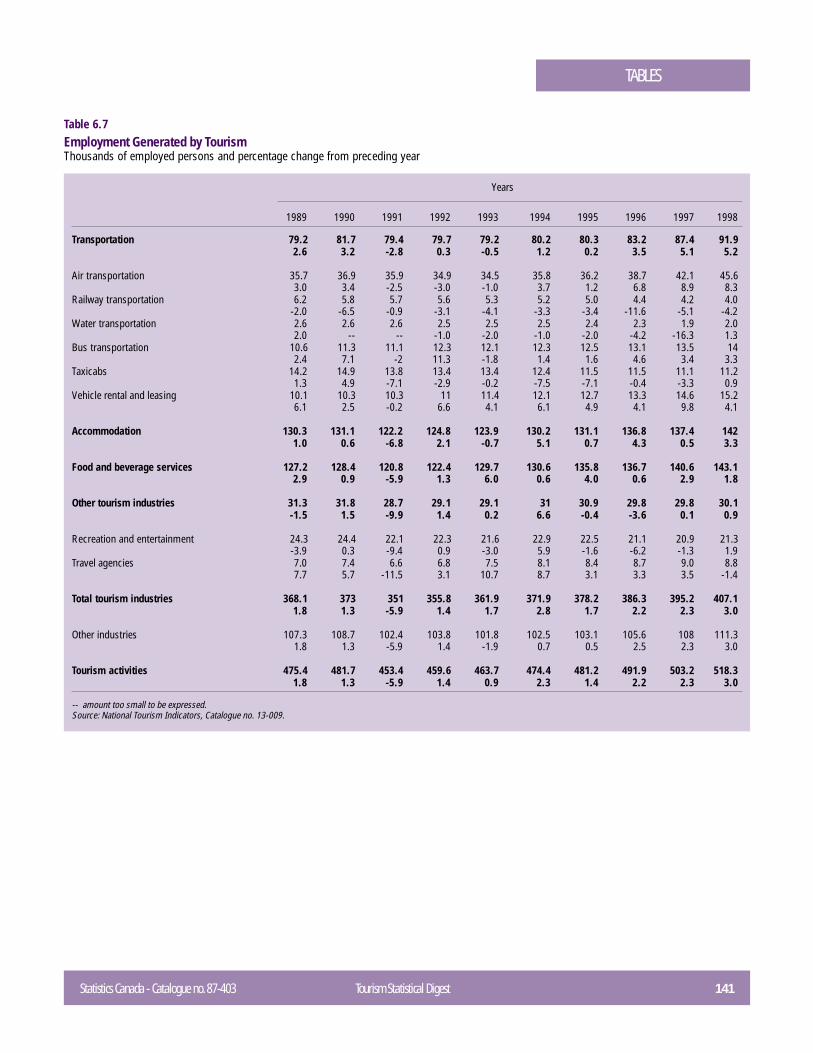
Statistics Canada - Catalogue no. 87-403 Tourism Statistical Digest 141
TABLES
Years
1989 1990 1991 1992 1993 1994 1995 1996 1997 1998
Transportation 79.2 81.7 79.4 79.7 79.2 80.2 80.3 83.2 87.4 91.92.6 3.2 -2.8 0.3 -0.5 1.2 0.2 3.5 5.1 5.2
Air transportation 35.7 36.9 35.9 34.9 34.5 35.8 36.2 38.7 42.1 45.63.0 3.4 -2.5 -3.0 -1.0 3.7 1.2 6.8 8.9 8.3
Railway transportation 6.2 5.8 5.7 5.6 5.3 5.2 5.0 4.4 4.2 4.0-2.0 -6.5 -0.9 -3.1 -4.1 -3.3 -3.4 -11.6 -5.1 -4.2
Water transportation 2.6 2.6 2.6 2.5 2.5 2.5 2.4 2.3 1.9 2.02.0 -- -- -1.0 -2.0 -1.0 -2.0 -4.2 -16.3 1.3
Bus transportation 10.6 11.3 11.1 12.3 12.1 12.3 12.5 13.1 13.5 142.4 7.1 -2 11.3 -1.8 1.4 1.6 4.6 3.4 3.3
Taxicabs 14.2 14.9 13.8 13.4 13.4 12.4 11.5 11.5 11.1 11.21.3 4.9 -7.1 -2.9 -0.2 -7.5 -7.1 -0.4 -3.3 0.9
Vehicle rental and leasing 10.1 10.3 10.3 11 11.4 12.1 12.7 13.3 14.6 15.26.1 2.5 -0.2 6.6 4.1 6.1 4.9 4.1 9.8 4.1
Accommodation 130.3 131.1 122.2 124.8 123.9 130.2 131.1 136.8 137.4 1421.0 0.6 -6.8 2.1 -0.7 5.1 0.7 4.3 0.5 3.3
Food and beverage services 127.2 128.4 120.8 122.4 129.7 130.6 135.8 136.7 140.6 143.12.9 0.9 -5.9 1.3 6.0 0.6 4.0 0.6 2.9 1.8
Other tourism industries 31.3 31.8 28.7 29.1 29.1 31 30.9 29.8 29.8 30.1-1.5 1.5 -9.9 1.4 0.2 6.6 -0.4 -3.6 0.1 0.9
Recreation and entertainment 24.3 24.4 22.1 22.3 21.6 22.9 22.5 21.1 20.9 21.3-3.9 0.3 -9.4 0.9 -3.0 5.9 -1.6 -6.2 -1.3 1.9
Travel agencies 7.0 7.4 6.6 6.8 7.5 8.1 8.4 8.7 9.0 8.87.7 5.7 -11.5 3.1 10.7 8.7 3.1 3.3 3.5 -1.4
Total tourism industries 368.1 373 351 355.8 361.9 371.9 378.2 386.3 395.2 407.11.8 1.3 -5.9 1.4 1.7 2.8 1.7 2.2 2.3 3.0
Other industries 107.3 108.7 102.4 103.8 101.8 102.5 103.1 105.6 108 111.31.8 1.3 -5.9 1.4 -1.9 0.7 0.5 2.5 2.3 3.0
Tourism activities 475.4 481.7 453.4 459.6 463.7 474.4 481.2 491.9 503.2 518.31.8 1.3 -5.9 1.4 0.9 2.3 1.4 2.2 2.3 3.0
-- amount too small to be expressed.Source: National Tourism Indicators, Catalogue no. 13-009.
Table 6.7Employment Generated by TourismThousands of employed persons and percentage change from preceding year
142 Tourism Statistical Digest Statistics Canada - Catalogue no. 87-403
DEFINITIONSDEFINITIONS
Chapter 1
Concepts of tourism
Tourism comprises the activities of persons travelling to and staying in places outside theirusual environment for not more than one consecutive year for leisure, business and otherpurposes. The use of this broad concept makes it possible to identify tourism betweencountries as well as tourism within a country. “Tourism” refers to all activities of visitors,including both “tourists (overnight visitors)” and “same-day visitors”.
Forms of tourism
In relation to a given country, the following forms of tourism can be distinguished:
a) Domestic tourism, involving residents of the given country travelling only withinthis country;
b) Inbound tourism, involving non-residents travelling in the given country;c) Outbound tourism, involving residents travelling in another country.
Chapter 2, 3 and 7
Trip
In the Canadian Travel Survey (CTS), a trip is defined as travel to a Canadian destinationat least 80 km one-way from home for any reason except:
• travel to and from work or school (i.e. commuting);• one-way travel involving a change of residence;• travel of operating crew members of buses, airplanes, boats, etc;• travel in an ambulance to a hospital or clinic;• trips that do not originate in Canada; and• trips longer than one year.
A trip may involve one person travelling alone or several persons from the same householdtravelling together. Persons from different households travelling together are defined astaking different trips.
Statistics Canada - Catalogue no. 87-403 Tourism Statistical Digest 143
Definitions
In the International Travel Survey (ITS), a trip is definedas travel for any reason by anybody arriving or returning toCanada who is cleared through Customs and Immigrationpoints of entry. ITS includes travellers coming/returning toCanada for a period of less than 12 months and excludesthe following types of international travellers:
• immigrants;• former residents;• military personnel, diplomats and dependants;
and• crews.
In the ITS, travellers entering Canada for the followingreasons are included:
• business, commuting to work or other works;• attending a convention, conference or seminar;• study, summer resident;• visiting friends or relatives;• pleasure, holiday, vacation, health and shopping;
and• persons travelling in transit who clear Canada
Customs.
Travel party
In the CTS, a travel party is defined as one or more personsfrom the same household travelling together.
In the ITS, a travel party is defined as persons from thesame country travelling together (whether they are fromthe same household or not) who agree to report collectivelytheir trip characteristics.
Person-trip
In the CTS, a person-trip starts when the traveller leaveshis/her home to go on a trip. The total number of person-trips for a population is the count of the number of personson each trip taken in the population.
In the ITS, each time a non-resident traveller enters Canadait is the beginning of a person-trip. The traveller’s entry isrecorded by Canada Customs. The person-trip ends whenthe traveller leaves Canada. For residents, each time aperson departs from Canada, a person-trip begins. Theperson-trip ends when the traveller returns to Canada. If aperson travels with other persons, the number of person-trips will equal the number of persons on the trip. If fourpersons go on a trip together, it counts as four person-trips.If the same person takes two trips, it counts as two person-trips.
Same-day trip
In the CTS, a trip which does not include a night away fromhome.
In the ITS, same-day travel encompasses travellers whoenter and leave the country in less than 24 hours.
Overnight trip
In the CTS, a trip that includes at least one night away fromhome.
In the ITS, travel of one or more nights includes travellersstaying at least 24 hours in a country other than that inwhich he/she resides.
Purpose of trip
In the CTS, the main reason the respondent to the surveywent on a trip, regardless of the reason anyone else fromthe household had for taking the same trip.
In the ITS, the main reason the travel party went on a trip.
• Visiting friends or relatives• Pleasure• Business• Personal reasons and other
Origin or residence
In the CTS, the origin of the trip corresponds to therespondent’s place of residence at the time the trip wastaken.
In the ITS, the origin or residence is the place of lastpermanent residence, by state for United States residentsand by country for other residents.
Destination
In the CTS, the place reported by the respondent as thedestination of a trip. If a respondent visited more than oneplace during a trip, the destination is the place furthest fromhis/her home.
In the ITS, the respondent does not report a destination.Only the locations visited are reported.
144 Tourism Statistical Digest Statistics Canada - Catalogue no. 87-403
Definitions
Mode of transportation
In the CTS, only one mode of transportation is recorded. Itis the mode of transportation used to travel the greatestdistance during a trip.
In the ITS, the mode of transportation to enter and exitCanada is captured as well as any mode of transportationthat was used to travel while in Canada.
Distance
In the CTS, one-way distance between the trip origin andits destination expressed in kilometres.
In the ITS, this variable is not available.
Trip duration
In the CTS, a trip starts when the respondent leaves his/her usual residence. It ends when he/she comes back.The trip duration is measured by the number of nights arespondent spends away from his/her usual residence.
In the ITS, a trip starts when a person crosses the borderand ends when he/she leaves the country. The trip durationis measured by the number of nights a traveller spends inCanada.
Type of entry in the country
In the CTS, this variable is not applicable.
In the ITS, travellers are grouped by type of entry and modeof transportation used to enter Canada. Four categoriesare found:
Direct to CanadaVia the United States – by land – same-day tripVia the United States – by land – overnight tripVia the United States – by other methods
Visit
Same-day visit
In the CTS, a same-day visit can only be made on the courseof a same-day trip. In such a case, a visit is recorded at thedestination of the trip.
In the ITS, on the course of a same-day trip, a non-residenttraveller may visit different location(s); each location visitedwill be assigned a visit. Only one location per province iscaptured on a same-day trip. The respondent can howeverreport visiting more than one province. On the course ofan overnight trip, every location visited where the respondenthas not spent a night is recorded as a same-day visit.
Overnight visit
Both in the CTS and the ITS, an overnight visit can only bedone on an overnight trip. In such a case, the locationvisited is defined as the location where the respondent hasspent at least one night. If, during the same trip, multiplenights are spent at the same location, or the same locationis travelled to multiple times, only one visit is recorded forthat location.
Person-visit
Same-day or overnight visit made by a person taking a trip.
In the CTS, the total number of person-visits for a populationis the count of the number of visits made by each person inthe population on each trip taken.
In the ITS, the total number of person-visits made by foreigntravellers entering Canada is the total number of visits madeby each person, on each travel party, on each trip taken.
The unit of measure used in this report is a person-visit.
Chapter 4
Transborder services
Services between points in Canada and Alaska, Canadaand Hawaii and Canada and continental United States.
Charter services
Transportation of persons and /or goods pursuant to acontract where a person other than the air carrier thatoperates the air service reserves a block of seats or part ofthe cargo space for their own use or for resale, in whole orin part, to the public.
Statistics Canada - Catalogue no. 87-403 Tourism Statistical Digest 145
Definitions
Scheduled services
Transportation of persons and/or goods where the air carrieror his agent operates the air service and sells directly tothe public, seats and/or cargo space on a price per seat orper unit of mass or volume of cargo basis.
City-pair
Two cities between which travel is authorized by a ticket orpart of a ticket
Chapter 5
Accommodation Services Industries
This major group of industries includes businesses primarilyengaged in providing accommodation services to domesticand international travellers who travel either for pleasure orfor business purposes. It covers a wide range of travelleraccommodation service industries, extending from hotelsand motels to tourist courts and camping grounds.
Hotels and Motor Hotels
This industry includes establishments or business opera-tions primarily engaged in providing short term accommo-dation to the public, with or without food, beverage and otherservices. Those operations with six or more hotel or motelhotel-type rooms are classified here regardless of the majorsource of revenue. Those with fewer than six rooms areclassified according to their major source of revenue.Businesses primarily engaged in operating apartment hotelsare classified in Operators of Residential Buildings andDwellings.
Motels
Establishments or business operations primarily engagedin short term accommodation to the public, with or withoutfood, beverage and other services. Businesses with threeor more motel-type rooms are classified here regardless ofthe major source of revenue. A motel-type room has accessfrom the exterior only and has parking facilities in closeproximity.
Tourist Courts and Cabins
Establishments or business operations primarily engagedin operating tourist courts and cabins on a short term basis,with or without food and beverage services. Businesses
operating three or more units are classified here regardlessof the major source of revenue.
Guest Houses and Tourist Homes
Establishments or business operations primarily engagedin renting rooms, with or without board, to transient guests.
Lodging Houses and Residential Clubs
Establishments or business operations primarily engagedin renting rooms, with or without board, to permanent guestsor members. This industry includes rooming and boardinghouses open to the public and lodging hotels operated bymembership organisations and not open to the public.
Camping Grounds and Travel Trailer Parks
Establishments or business operations primarily engagedin providing overnight or short-term sites, with or withoututilities, for campers with trailers, recreational vehicles ortents.
Outfitters (Hunting and Fishing Camps)
Establishments primarily engaged in operating hunting andfishing camps open to the public which may providesupplies, equipment rentals and guide services.
Other Recreation and Vacation Camps
Establishments primarily engaged in operating recreationaland vacation camps.
Travel Agencies
Businesses mainly acting as ticket and travel agents,furnishing travel information, acting as agents in arrangingtours, booking accommodation and transportation fortravellers or acting as independent agencies fortransportation companies.
Tour Operators
Businesses in this industry are primarily engaged indeveloping, designing and wholesaling travel tour plans andpackage vacation tours.
146 Tourism Statistical Digest Statistics Canada - Catalogue no. 87-403
Definitions
Tourist Attractions
Tourist attractions are places; events; and events inplaces, where the primary purpose of the attraction is toallow public access for entertainment, interest or educationrather than being primarily a retail outlet or a venue for filmperformances.
Chapter 6
Tourism
The most important concept underlying the TSA (TourismSatellite Account) and the NTI (National Tourism Indicators),that of ‘tourism’, has been evolving over time. The definitionused here is the one most recently adopted by the WorldTourism Organization and the United Nations StatisticalCommission: “the activities of persons travelling to andstaying in places outside their usual environment for notmore than one consecutive year for leisure, business andother purposes”1
This definition goes beyond the concept of tourism as merelytravel for leisure. It also encompasses travel for businesspurposes, to visit friends and relatives or for personalreasons, such as health treatment. On the other hand, notall travel constitutes tourism. Excluded are commuting toand from work, travel for purposes of study or job relocation,as well as travel by migrants and diplomats or members ofthe armed forces on assignment.
In relation to Canada, the definition comprises different formsof tourism: travel by Canadians within Canada (domestictourism), travel by non-residents to Canada (inboundtourism) and travel by Canadians to another country(outbound tourism). Also, in Canada, the ‘usual environment’is defined as being within 80 kilometres from home. Anytravel by a resident to a Canadian location under thatdistance is not considered ‘tourism’. However, crossing aninternational boundary is generally considered to be traveloutside the ‘usual environment’.
Visitors
The persons undertaking tourism are referred to as eithertourists (those visitors who stay overnight or longer in thelocation visited), or same-day visitors.
Tourism Commodities
A commodity is defined as a good or service which is soldat a price designed to cover the cost of production, e.g., ahotel room, a meal, an airline ticket, a t-shirt. For purposesof tourism, commodities are classified into two categories:tourism commodities and non-tourism commodities.
A commodity is referred to as a tourism commodity if asignificant part of its total demand in Canada comes fromvisitors. Otherwise, it is referred to as a non-tourismcommodity. Thus, accommodation is considered to be atourism commodity, because a substantial proportion of itsdemand is from tourism. However, beer bought in stores isclassified as a non-tourism commodity, since purchasesby visitors represent a small proportion of total sales inCanada.
There are two exceptions to the definition of tourismcommodities: urban transit and parking. These two servicesare considered tourism commodities even though theproportion of total demand due to tourism is not significant.The reason is that many visitors use these services,especially in major urban areas. If these two services werenot available in an area, visitors would be less inclined tovisit or to undertake certain activities once there.
The definition of tourism commodities is based onrecommendations from the National Task Force on TourismData.
Tourism Industries
An industry is defined as a group of operating units orestablishments engaged in the same or similar kind(s) ofeconomic activity, e.g., hotels, restaurants, airlines,department stores. Industries produce commodities, bothtourism and non-tourism.
While the commodities purchased by visitors may besupplied by several industries, the TSA and the NTI focuson industries which are the main producers of the tourismcommodities. Accordingly, a ‘tourism industry’ is soconsidered here if:
a) it provides tourism commodities to visitors, and;b) it would cease to exist without tourism or would
continue to exist only at a significantly reducedlevel of activity.
Statistics Canada - Catalogue no. 87-403 Tourism Statistical Digest 147
Definitions
Air transportation satisfies part a) and the first criterion ofpart b) of the definition, for instance, while food and beverageservices satisfy part a) and the second criterion of part b).An example of a non-tourism industry, one that does notsatisfy either criterion of the second part of the definition, isthe food stores industry, even though purchases by visitorsare important for this industry in certain locations. Anexample of a non-tourism industry, because it does notsatisfy part a), is the steel foundries industry. This industrydoes not sell its products to visitors.
The definition of tourism industries is drawn fromrecommendations by the National Task Force on TourismData.
Domestic Supply
The domestic supply of tourism commodities is defined asthe total production in Canada of the specified commodities.It does not include imports. For example, the sale of a ticketon a non-Canadian airline is excluded from the supply ofpassenger air transport.
Tourism Demand
Tourism demand for tourism commodities is defined asexpenditures made by visitors on the domestically producedtourism goods and services. It includes expenses madebefore and after a trip, such as purchases of vehicle repairsand parts, as well as those incurred during a trip, such aspurchases of accommodation and meals. Tourism demandcomprises three broad categories: tourism demand inCanada, that is, total demand by visitors for Canadianproduced commodities, and its two components, tourismdomestic demand and tourism exports.
• Tourism Domestic Demand consists ofspending by Canadian visitors on domesticallyproduced commodities. It includes purchases ofCanadian commodities which result fromdomestic and outbound tourism. For example, itincludes the purchase of an air fare from aCanadian carrier to a destination outsideCanada.
• Tourism Exports is defined as spending bynon-resident visitors on Canadian producedcommodities. It comprises purchases ofCanadian commodities as a result of inboundtourism, including spending that may take placeoutside of Canada, such as the purchase of anairline ticket from a Canadian international carrier,to travel to Canada.
The entire domestic supply of tourism commodities is notpurchased by visitors. For example, only part of food andbeverage services are purchased by visitors in or to Canada,while most are purchased for local consumption. Therefore,domestic supply is always greater than tourism demand.
Employment
The employment data presented in the TSA and NTI arebenchmarked to the ‘person-year’ concept incorporated inthe I/O (Input-Output) annual estimates used for productivitymeasurement. A person-year so defined can be a personemployed on either a full-time or a part-time basis (that is,in terms of the number of hours worked per day or perweek). A person working for half the months in the year onthe other hand, would be defined as half a person-year.The published annual and quarterly estimates in the NTIcorrespond to the annual or quarterly averages of themonthly estimates provided by the surveys conducted byStatistics Canada. Full-time is defined as usually working aminimum of 30 hours per week. The average full-time hoursper week for a given industry is the average of usual hoursworked by those working a minimum of 30 hours per week.
Note
1 United Nations and World Tourism Organisation,Recommendations on Tourism Statistics, New York, 1994. P.5.
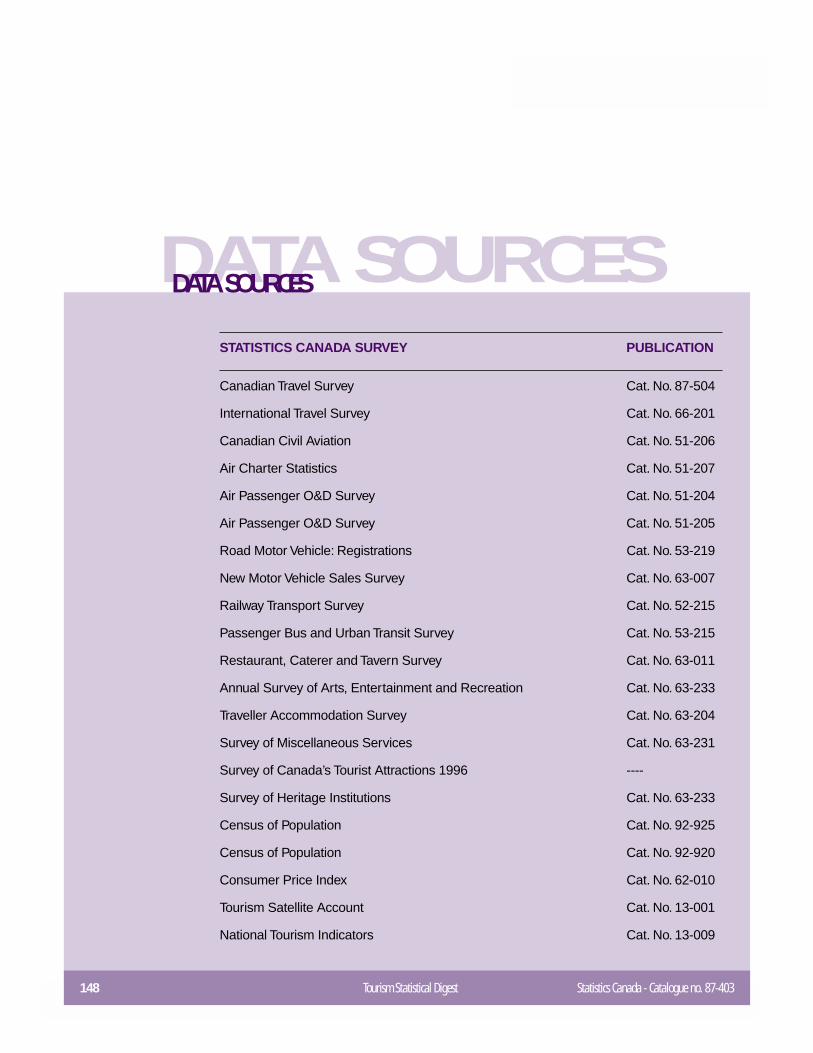
148 Tourism Statistical Digest Statistics Canada - Catalogue no. 87-403
DATA SOURCESDATA SOURCES
STATISTICS CANADA SURVEY PUBLICATION
Canadian Travel Survey Cat. No. 87-504
International Travel Survey Cat. No. 66-201
Canadian Civil Aviation Cat. No. 51-206
Air Charter Statistics Cat. No. 51-207
Air Passenger O&D Survey Cat. No. 51-204
Air Passenger O&D Survey Cat. No. 51-205
Road Motor Vehicle: Registrations Cat. No. 53-219
New Motor Vehicle Sales Survey Cat. No. 63-007
Railway Transport Survey Cat. No. 52-215
Passenger Bus and Urban Transit Survey Cat. No. 53-215
Restaurant, Caterer and Tavern Survey Cat. No. 63-011
Annual Survey of Arts, Entertainment and Recreation Cat. No. 63-233
Traveller Accommodation Survey Cat. No. 63-204
Survey of Miscellaneous Services Cat. No. 63-231
Survey of Canada’s Tourist Attractions 1996 ----
Survey of Heritage Institutions Cat. No. 63-233
Census of Population Cat. No. 92-925
Census of Population Cat. No. 92-920
Consumer Price Index Cat. No. 62-010
Tourism Satellite Account Cat. No. 13-001
National Tourism Indicators Cat. No. 13-009