Embed Size (px)
Citation preview

UMTRI-2010-12 MAY 2010
TOWARD UNDERSTANDING THE RECENT
LARGE REDUCTIONS IN U.S. ROAD
FATALITIES
MICHAEL SIVAK
BRANDON SCHOETTLE
TOWARD UNDERSTANDING THE RECENT LARGE REDUCTIONS
IN U.S. ROAD FATALITIES
Michael Sivak
Brandon Schoettle
The University of Michigan
Transportation Research Institute
Ann Arbor, Michigan 48109-2150
U.S.A.
Report No. UMTRI-2010-12
May 2010
i
Technical Report Documentation Page 1. Report No.
UMTRI-2010-12
2. Government Accession No.
3. Recipient s Catalog No.
5. Report Date
May 2010
4. Title and Subtitle Toward Understanding the Recent Large Reductions in U.S.
Road Fatalities 6. Performing Organization Code
383818
7. Author(s)
Michael Sivak and Brandon Schoettle
8. Performing Organization Report No. UMTRI-2010-12
10. Work Unit no. (TRAIS)
9. Performing Organization Name and Address The University of Michigan
Transportation Research Institute
2901 Baxter Road Ann Arbor, Michigan 48109-2150 U.S.A.
11. Contract or Grant No.
13. Type of Report and Period Covered
12. Sponsoring Agency Name and Address The University of Michigan
Sustainable Worldwide Transportation 14. Sponsoring Agency Code
15. Supplementary Notes The current members of Sustainable Worldwide Transportation include Autoliv
Electronics, Bosch, FIA Foundation for the Automobile and Society, General Motors,
Honda R&D Americas, Nissan Technical Center North America, and Toyota Motor
Engineering and Manufacturing North America. Information about Sustainable
Worldwide Transportation is available at: http://www.umich.edu/~umtriswt
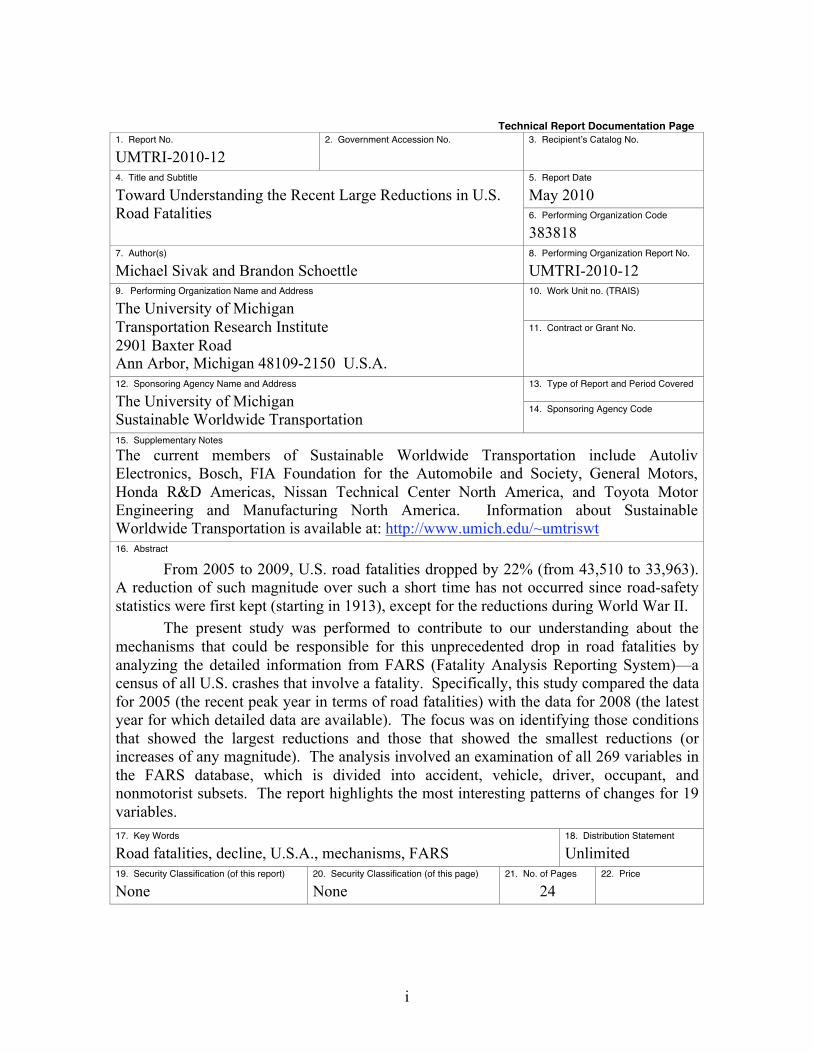
16. Abstract
From 2005 to 2009, U.S. road fatalities dropped by 22% (from 43,510 to 33,963).
A reduction of such magnitude over such a short time has not occurred since road-safety
statistics were first kept (starting in 1913), except for the reductions during World War II.
The present study was performed to contribute to our understanding about the
mechanisms that could be responsible for this unprecedented drop in road fatalities by
analyzing the detailed information from FARS (Fatality Analysis Reporting System)—a
census of all U.S. crashes that involve a fatality. Specifically, this study compared the data
for 2005 (the recent peak year in terms of road fatalities) with the data for 2008 (the latest
year for which detailed data are available). The focus was on identifying those conditions
that showed the largest reductions and those that showed the smallest reductions (or
increases of any magnitude). The analysis involved an examination of all 269 variables in
the FARS database, which is divided into accident, vehicle, driver, occupant, and
nonmotorist subsets. The report highlights the most interesting patterns of changes for 19
variables.
17. Key Words Road fatalities, decline, U.S.A., mechanisms, FARS
18. Distribution Statement Unlimited
19. Security Classification (of this report) None
20. Security Classification (of this page) None
21. No. of Pages 24
22. Price

ii
Acknowledgment
This research was supported by Sustainable Worldwide Transportation
(http://www.umich.edu/~umtriswt). The current members of this research consortium are
Autoliv Electronics, Bosch, FIA Foundation for the Automobile and Society, General
Motors, Honda R&D Americas, Nissan Technical Center North America, and Toyota
Motor Engineering and Manufacturing North America.
We thank our colleague Charlie Compton for his assistance with the FARS
database.

iii
Contents
Acknowledgment ............................................................................................................................ ii
Introduction..................................................................................................................................... 1
Approach......................................................................................................................................... 3
Results............................................................................................................................................. 5
Conclusions................................................................................................................................... 19
References..................................................................................................................................... 21
1
Introduction
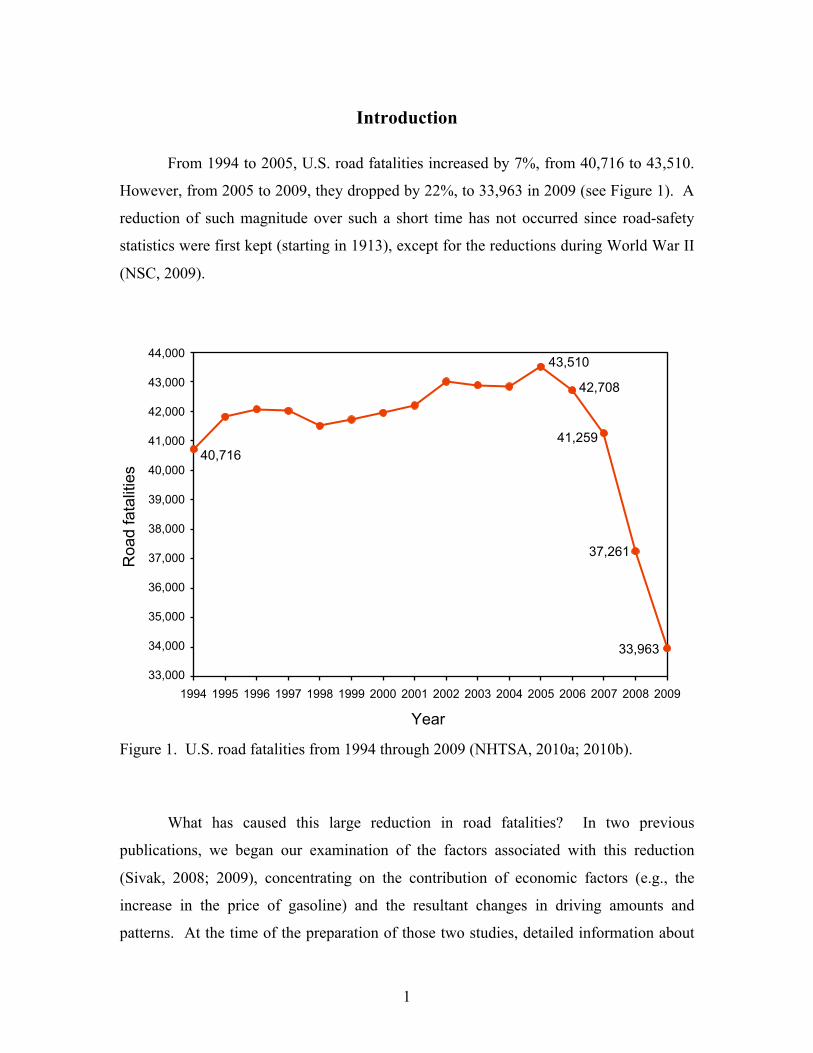
From 1994 to 2005, U.S. road fatalities increased by 7%, from 40,716 to 43,510.
However, from 2005 to 2009, they dropped by 22%, to 33,963 in 2009 (see Figure 1). A
reduction of such magnitude over such a short time has not occurred since road-safety
statistics were first kept (starting in 1913), except for the reductions during World War II
(NSC, 2009).
Figure 1. U.S. road fatalities from 1994 through 2009 (NHTSA, 2010a; 2010b).
What has caused this large reduction in road fatalities? In two previous
publications, we began our examination of the factors associated with this reduction
(Sivak, 2008; 2009), concentrating on the contribution of economic factors (e.g., the
increase in the price of gasoline) and the resultant changes in driving amounts and
patterns. At the time of the preparation of those two studies, detailed information about
2
recent fatal crashes was not yet available. Therefore, those studies relied only on the total
monthly fatality counts. The present study continues that examination of the possible
mechanisms involved in the recent reductions in road fatalities by analyzing the detailed
information from FARS (Fatality Analysis Reporting System)—a census of all U.S.
crashes that involve a fatality. Specifically, this study compared the data for 2005 (the
recent peak year in terms of fatalities) with the data for 2008 (the latest year for which
detailed data are available).
3
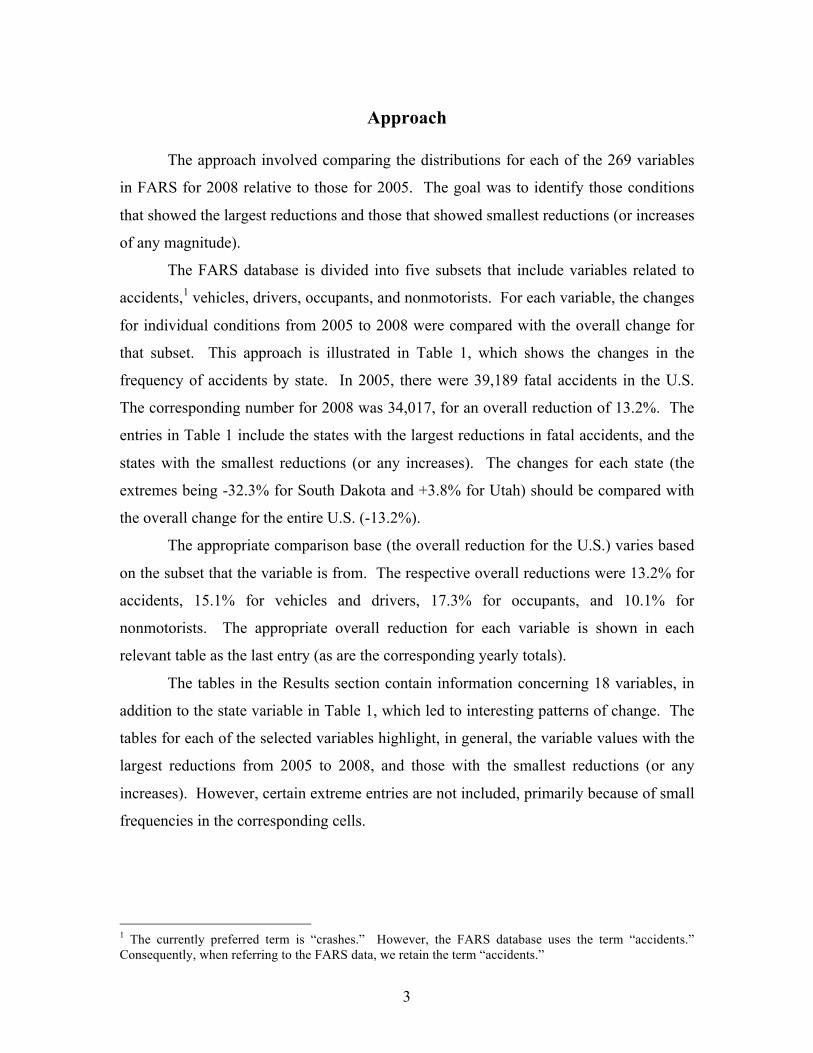
Approach
The approach involved comparing the distributions for each of the 269 variables
in FARS for 2008 relative to those for 2005. The goal was to identify those conditions
that showed the largest reductions and those that showed smallest reductions (or increases
of any magnitude).
The FARS database is divided into five subsets that include variables related to
accidents,1 vehicles, drivers, occupants, and nonmotorists. For each variable, the changes
for individual conditions from 2005 to 2008 were compared with the overall change for
that subset. This approach is illustrated in Table 1, which shows the changes in the
frequency of accidents by state. In 2005, there were 39,189 fatal accidents in the U.S.
The corresponding number for 2008 was 34,017, for an overall reduction of 13.2%. The
entries in Table 1 include the states with the largest reductions in fatal accidents, and the
states with the smallest reductions (or any increases). The changes for each state (the
extremes being -32.3% for South Dakota and +3.8% for Utah) should be compared with
the overall change for the entire U.S. (-13.2%).
The appropriate comparison base (the overall reduction for the U.S.) varies based
on the subset that the variable is from. The respective overall reductions were 13.2% for
accidents, 15.1% for vehicles and drivers, 17.3% for occupants, and 10.1% for
nonmotorists. The appropriate overall reduction for each variable is shown in each
relevant table as the last entry (as are the corresponding yearly totals).
The tables in the Results section contain information concerning 18 variables, in
addition to the state variable in Table 1, which led to interesting patterns of change. The
tables for each of the selected variables highlight, in general, the variable values with the
largest reductions from 2005 to 2008, and those with the smallest reductions (or any
increases). However, certain extreme entries are not included, primarily because of small
frequencies in the corresponding cells.
1 The currently preferred term is “crashes.” However, the FARS database uses the term “accidents.”
Consequently, when referring to the FARS data, we retain the term “accidents.”

4
Table 1
Changes in fatal accidents for selected states.
Year
2005 2008 State
Change
from 2005
to 2008
235 244 Utah +3.8%
3,104 3,031 Texas -2.4%
347 338 West Virginia -2.6%
238 188 Nebraska -21.0%
80 63 Rhode Island -21.3%
714 561 Wisconsin -21.4%
1,230 950 Illinois -22.8%
420 324 New Mexico -22.9%
1,117 845 Missouri -24.4%
44 32 District of Columbia -27.3%
158 107 South Dakota -32.3%
39,189 34,017 Total accidents -13.2%
To assess the potential influence on the overall fatalities, both the frequencies in
the conditions of interest and the changes over time are important to consider. Therefore,
Table 1 (and the tables that follow) presents not only the percentage changes from 2005
to 2008 but also the actual frequencies for both years.
5
Results
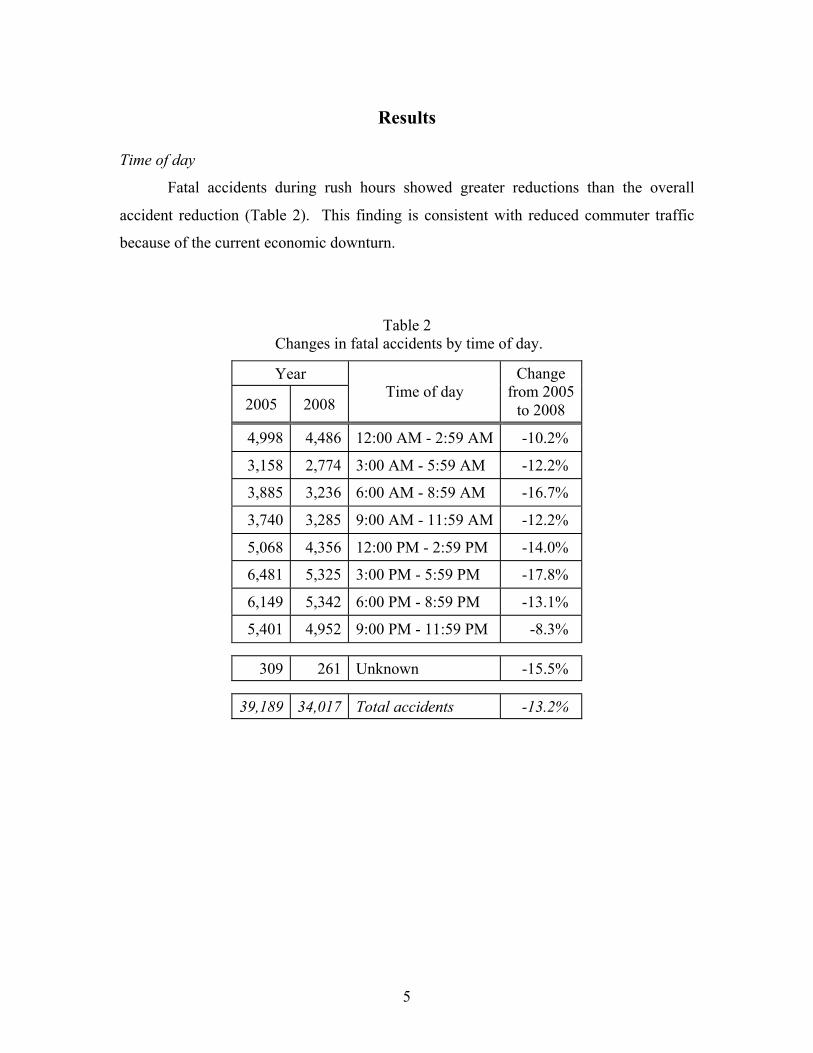
Time of day
Fatal accidents during rush hours showed greater reductions than the overall
accident reduction (Table 2). This finding is consistent with reduced commuter traffic
because of the current economic downturn.
Table 2
Changes in fatal accidents by time of day.
Year
2005 2008 Time of day
Change
from 2005
to 2008
4,998 4,486 12:00 AM - 2:59 AM -10.2%
3,158 2,774 3:00 AM - 5:59 AM -12.2%
3,885 3,236 6:00 AM - 8:59 AM -16.7%
3,740 3,285 9:00 AM - 11:59 AM -12.2%
5,068 4,356 12:00 PM - 2:59 PM -14.0%
6,481 5,325 3:00 PM - 5:59 PM -17.8%
6,149 5,342 6:00 PM - 8:59 PM -13.1%
5,401 4,952 9:00 PM - 11:59 PM -8.3%
309 261 Unknown -15.5%
39,189 34,017 Total accidents -13.2%
6
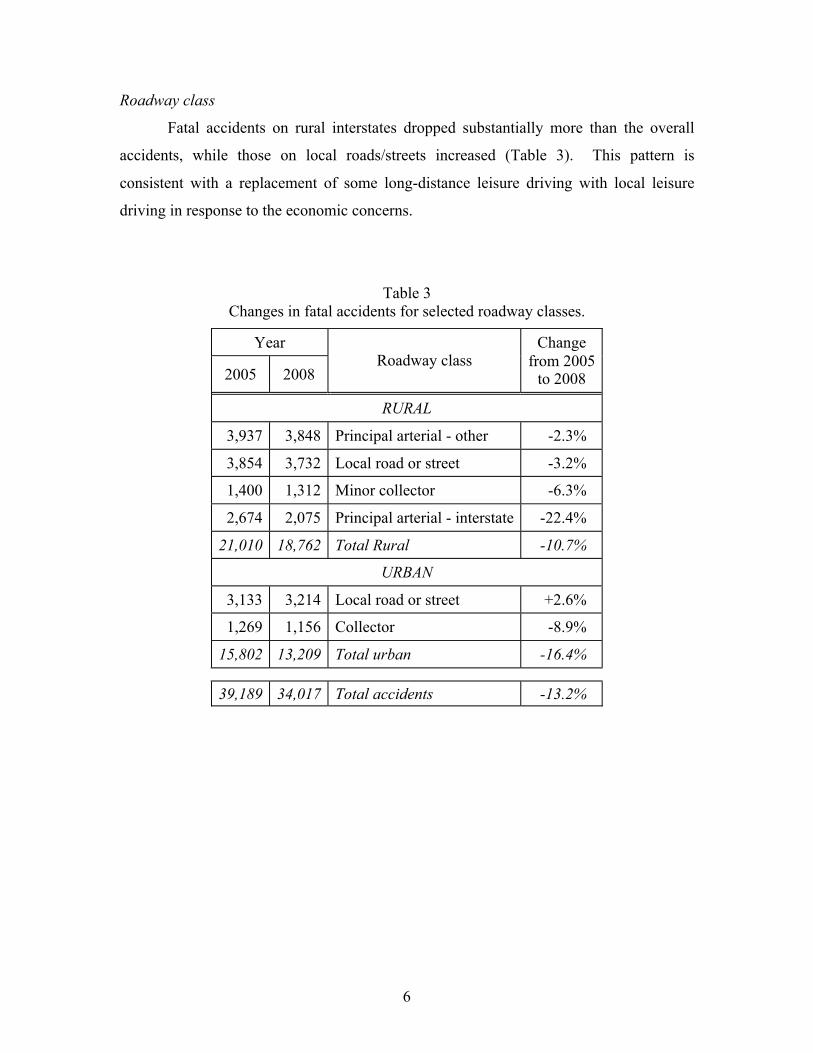
Roadway class
Fatal accidents on rural interstates dropped substantially more than the overall
accidents, while those on local roads/streets increased (Table 3). This pattern is
consistent with a replacement of some long-distance leisure driving with local leisure
driving in response to the economic concerns.
Table 3
Changes in fatal accidents for selected roadway classes.
Year
2005 2008 Roadway class
Change
from 2005 to 2008
RURAL
3,937 3,848 Principal arterial - other -2.3%
3,854 3,732 Local road or street -3.2%
1,400 1,312 Minor collector -6.3%
2,674 2,075 Principal arterial - interstate -22.4%
21,010 18,762 Total Rural -10.7%
URBAN
3,133 3,214 Local road or street +2.6%
1,269 1,156 Collector -8.9%
15,802 13,209 Total urban -16.4%
39,189 34,017 Total accidents -13.2%
7
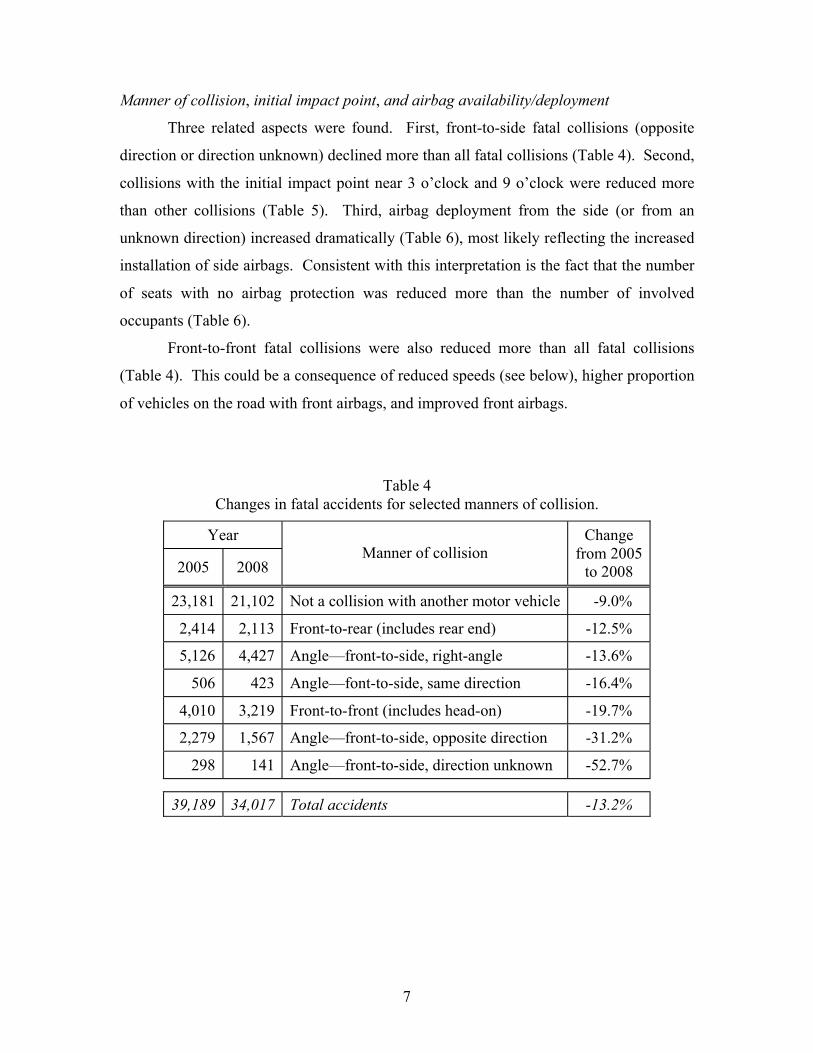
Manner of collision, initial impact point, and airbag availability/deployment
Three related aspects were found. First, front-to-side fatal collisions (opposite
direction or direction unknown) declined more than all fatal collisions (Table 4). Second,
collisions with the initial impact point near 3 o’clock and 9 o’clock were reduced more
than other collisions (Table 5). Third, airbag deployment from the side (or from an
unknown direction) increased dramatically (Table 6), most likely reflecting the increased
installation of side airbags. Consistent with this interpretation is the fact that the number
of seats with no airbag protection was reduced more than the number of involved
occupants (Table 6).
Front-to-front fatal collisions were also reduced more than all fatal collisions
(Table 4). This could be a consequence of reduced speeds (see below), higher proportion
of vehicles on the road with front airbags, and improved front airbags.
Table 4
Changes in fatal accidents for selected manners of collision.
Year
2005 2008 Manner of collision
Change
from 2005
to 2008
23,181 21,102 Not a collision with another motor vehicle -9.0%
2,414 2,113 Front-to-rear (includes rear end) -12.5%
5,126 4,427 Angle—front-to-side, right-angle -13.6%
506 423 Angle—font-to-side, same direction -16.4%
4,010 3,219 Front-to-front (includes head-on) -19.7%
2,279 1,567 Angle—front-to-side, opposite direction -31.2%
298 141 Angle—front-to-side, direction unknown -52.7%
39,189 34,017 Total accidents -13.2%

8
Table 5
Changes in the initial impact point on the vehicles
involved in fatal accidents.
Year
2005 2008 Initial impact point
Change
from 2005
to 2008
3,088 2,477 Noncollision -19.8%
37,194 32,049 11 to 1 o'clock -13.8%
5,416 4,576 2 to 4 o'clock -15.5%
4,284 3,791 5 to 7 o'clock -11.5%
6,390 4,964 8 to 10 o'clock -22.3%
447 393 Top -12.1%
966 928 Undercarriage -3.9%
1,588 1,252 Other/Unknown -21.2%
59,373 50,430 Total vehicles -15.1%
Table 6
Changes in selected conditions of airbag availability and/or deployment.
Year
2005 2008 Airbag availability/deployment
Change
from 2005
to 2008
159 509 Deployed from the side +220.1%
962 2,088 Deployed from unknown direction +117.0%
735 1,052 Deployed from multiple directions +43.1%
21,183 18,421 Deployed from the front -13.0%
45,271 31,995 Not available (for this seat) -29.3%
94,405 78,066 Total occupants -17.3%

9
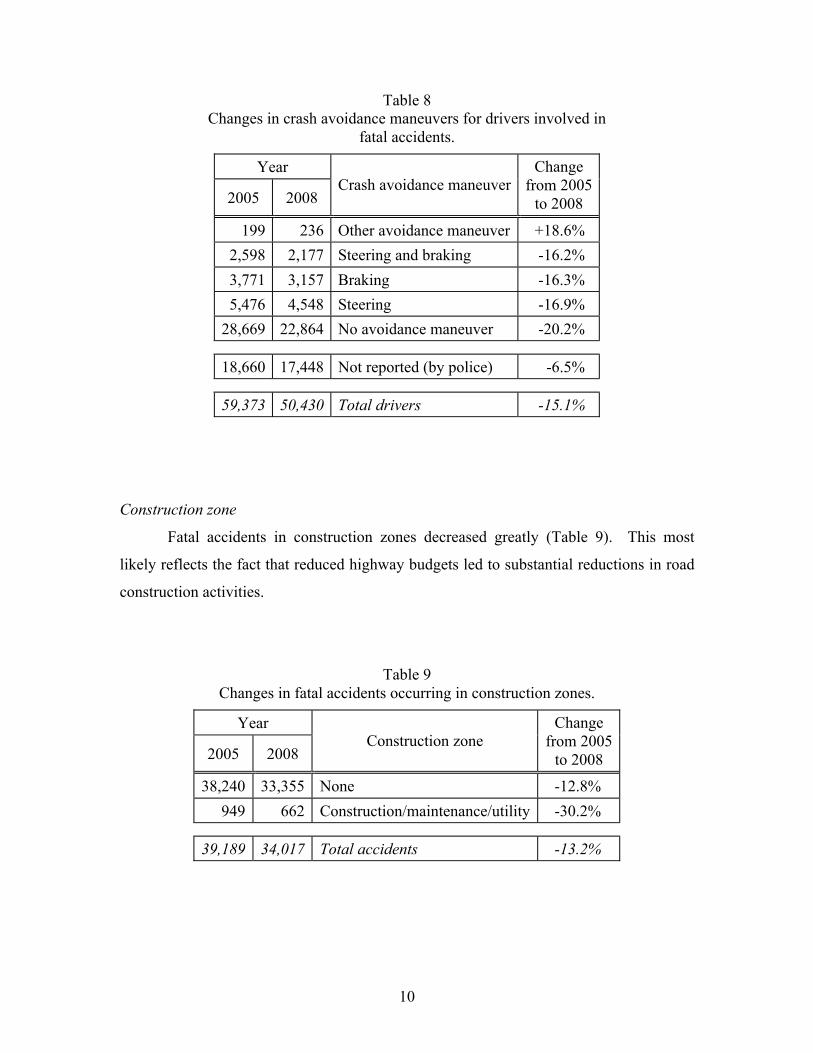
Speed limit and crash avoidance maneuver
Roads with a speed limit of 50 mph or higher showed reductions that were greater
than the overall reductions, while the opposite was the case for roads with speed limits
between 20 and 45 mph (Table 7). (Roads with speed limits between 5 and 15 mph
showed a large increase, but the actual frequencies are small.) This pattern is consistent
with the postulated decrease in speeds as a consequence of drivers’ efforts to improve the
fuel economy of their vehicles (Sivak, 2008). (However, we were unable to find any
quantitative data on changes in actual speeds.)
Supporting the reduction-in-speed hypothesis are the data on crash avoidance
maneuvers (Table 8). Specifically, there was a disproportionate reduction in cases where
no avoidance maneuver was reported. (The slower the speed, the more likely an
avoidance maneuver is possible.)
Table 7
Changes in fatal accidents by posted speed limit.
Year
2005 2008 Speed limit
Change
from 2005
to 2008
120 126 No statutory limit +5.0%
68 92 5-15 mph +35.3%
3,852 3,613 20-30 mph -6.2%
12,484 11,056 35-45 mph -11.4%
14,887 12,524 50-60 mph -15.9%
6,724 5,697 60+ mph -15.5%
1,053 908 Unknown -13.8%
39,189 34,017 Total accidents -13.2%
10
Table 8
Changes in crash avoidance maneuvers for drivers involved in
fatal accidents.
Year
2005 2008 Crash avoidance maneuver
Change
from 2005
to 2008
199 236 Other avoidance maneuver +18.6%
2,598 2,177 Steering and braking -16.2%
3,771 3,157 Braking -16.3%
5,476 4,548 Steering -16.9%
28,669 22,864 No avoidance maneuver -20.2%
18,660 17,448 Not reported (by police) -6.5%
59,373 50,430 Total drivers -15.1%
Construction zone
Fatal accidents in construction zones decreased greatly (Table 9). This most
likely reflects the fact that reduced highway budgets led to substantial reductions in road
construction activities.
Table 9
Changes in fatal accidents occurring in construction zones.
Year
2005 2008 Construction zone
Change
from 2005
to 2008
38,240 33,355 None -12.8%
949 662 Construction/maintenance/utility -30.2%
39,189 34,017 Total accidents -13.2%

11
Number of fatalities per accident and number of fatalities per vehicle
Accidents with multiple fatalities were reduced more than those with a single
fatality (Table 10). The same pattern is also evident in terms of the number of fatalities
per vehicle (Table 11). These findings are consistent with the above-discussed increase
in the availability and deployment of airbags.
Table 10
Changes in the total number of fatalities per accident.
Year
2005 2008 Number of fatalities per accident
Change
from 2005
to 2008
35,803 31,376 1 fatality -12.4%
2,784 2,219 2 fatalities -20.3%
415 311 3 fatalities -25.1%
187 111 4 or more fatalities -40.6%
39,189 34,017 Total accidents -13.2%
Table 11
Changes in the total number of fatalities per vehicle.
Year
2005 2008 Number of fatalities per vehicle
Change
from 2005
to 2008
25,185 21,059 0 fatalities -16.4%
31,417 27,212 1 fatality -13.4%
2,311 1,848 2 fatalities -20.0%
339 230 3 fatalities -32.2%
121 81 4 or more fatalities -33.1%
59,373 50,430 Total vehicles -15.1%

12
Vehicle body type
The number of minivans, hatchbacks, 2-door vehicles, and utility station wagons
in fatal crashes was reduced more than the overall vehicle reduction (Table 12),
presumably reflecting the reduced frequency of these particular vehicles on the road. On
the other hand, the involvement of motorcycles increased. This finding would be
consistent with continuations of (1) an increase in motorcycle ownership by middle-aged
men with little or no prior experience and (2) an increase sale of motorcycles with larger
engine sizes—the trends noted by Shankar and Varghese (2006).
Table 12
Changes in fatalities for selected vehicle body types.
Year
2005 2008 Vehicle body type
Change
from 2005
to 2008
4,492 5,129 Motorcycle +14.2%
16,932 14,355 4 door sedan/hard top -15.2%
2,574 1,967 Minivan -23.6%
1,111 794 3 door/2 door hatchback -28.5%
5,055 3,359 2 door sedan/hard top/coupe -33.6%
464 264 Utility station wagon -43.1%
59,373 50,430 Total vehicles -15.1%

13
VIN truck weight code
The involvement of heavy trucks was reduced more than the involvement of all
vehicles (Table 13). This is consistent with the overall reduction in freight shipments due
to the economic downturn (BTS, 2010).
Table 13
Changes in selected categories of weights for vehicles
involved in fatal accidents.
Year
2005 2008 VIN truck weight code
Change
from 2005
to 2008
1,562 1,251 10,001 – 33,000 lbs. -19.9%
3,780 3,081 33,001 or more lbs. -18.5%
59,373 50,430 Total vehicles -15.1%

14
Driver drinking and previous DWI (driving while intoxicated) convictions
As shown in Table 14, the number of drivers with drinking reported showed a
disproportionately small reduction. (Conversely, the number of drivers with no drinking
reported showed a disproportionately large reduction.) This could be a reflection of the
increased alcohol consumption per capita (of beer, wine, and distilled spirits) from 2005
to 2008 (USDA, 2010), or increased DWI enforcement leading to higher detection.
At the same time, the number of repeat DWI offenders showed a
disproportionately large reduction (Table 15). This may be a consequence of a
disproportionate decrease in driving by repeat DWI offenders due to economic factors,
because drivers from lower socio-economic groups tend to be overrepresented among
repeat DWI offenders (Jones and Lacey, 2000).
Table 14
Changes in reported drinking for drivers involved in
fatal accidents.
Year
2005 2008 Driver drinking
Change
from 2005
to 2008
11,783 11,015 Drinking reported -6.5%
47,590 39,415 No drinking reported -17.2%
59,373 50,430 Total drivers -15.1%
Table 15
Changes in selected categories of previous DWI convictions for
drivers involved in fatal accidents.
Year
2005 2008
Number of previous DWI convictions
per driver
Change
from 2005
to 2008
54,917 46,865 0 DWI convictions -14.7%
1,477 1,222 1 DWI conviction -17.3%
208 157 2 DWI convictions -24.5%
59,373 50,430 Total drivers -15.1%
15
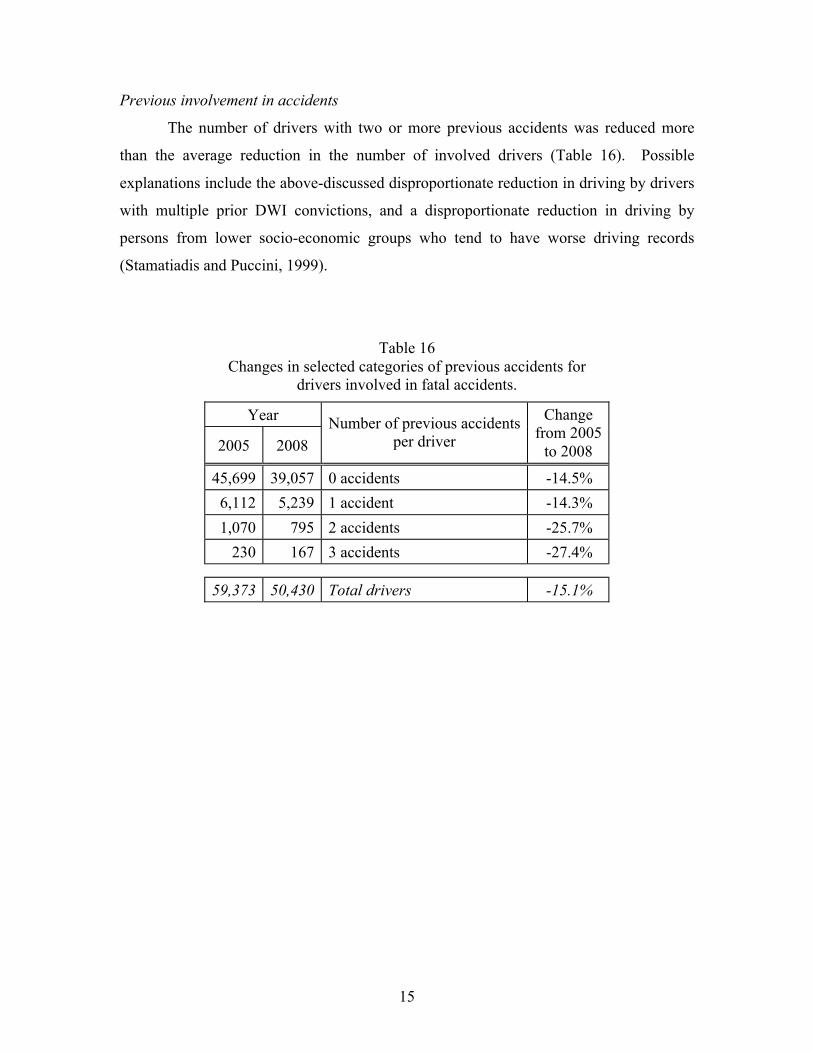
Previous involvement in accidents
The number of drivers with two or more previous accidents was reduced more
than the average reduction in the number of involved drivers (Table 16). Possible
explanations include the above-discussed disproportionate reduction in driving by drivers
with multiple prior DWI convictions, and a disproportionate reduction in driving by
persons from lower socio-economic groups who tend to have worse driving records
(Stamatiadis and Puccini, 1999).
Table 16
Changes in selected categories of previous accidents for
drivers involved in fatal accidents.
Year
2005 2008
Number of previous accidents
per driver
Change
from 2005
to 2008
45,699 39,057 0 accidents -14.5%
6,112 5,239 1 accident -14.3%
1,070 795 2 accidents -25.7%
230 167 3 accidents -27.4%
59,373 50,430 Total drivers -15.1%

16
Driver-related factors2
As shown in Table 17, among driver-related factors that exhibited unusually large
reductions were operating the vehicle in an erratic, reckless, careless, or negligent manner
(possibly due to decreased speeds), as well as being drowsy, sleepy, asleep, or fatigued
(possibly due to a disproportionate reduction in long-distance leisure driving, which more
frequently involves nighttime driving than commuter driving). On the other hand,
inattentive driving (talking, eating, using cell phones, etc.) showed a large increase
(possibly reflecting the increased pace and complexity of daily lives, increased
distractions, or increased sensitivity of coders to the issue of distractions). (The data on
road rage are based on small numbers.)
Table 17
Changes in selected driver-related factors for drivers involved in fatal accidents.
Year
2005 2008 Driver related factors
Change
from 2005
to 2008
189 409 Illegal driving on road shoulder, in ditch, on sidewalk
or on median +116.4%
48 97 Road rage/aggressive driving +102.1%
2,369 3,366 Inattentive (talking, eating, using cell phones, etc.) +42.1%
5,419 5,125 Under the influence of alcohol, drugs or medication -5.4%
21,324 17,437 None -18.2%
8,860 6,323 Failure to keep in proper lane -28.6%
785 477 Drowsy, sleepy, asleep, fatigued -39.2%
176 75 Pedestrian, pedalcyclist, or other nonmotorist -57.4%
1,009 426 Operating the vehicle in an erratic, reckless, careless or
negligent manner -57.8%
59,373 50,430 Total drivers -15.1%
2 The FARS database contains four sets of driver-related factors. Here we report only on the first (primary)
factor.

17
Driver age
Drivers between 16 and 25 years of age showed a disproportionate decrease of
involvement in fatal accidents (Table 18). Possible explanations include a
disproportionate reduction in the amount of driving in this age group because young
drivers are likely to be more affected by economic fluctuations, and the increased
implementation of effective graduated driver licensing.
Table 18
Changes in the ages of drivers involved in fatal accidents.
Year
2005 2008 Driver age
Change
from 2005
to 2008
304 213 15 or younger -29.9%
7,293 5,729 16-20 -21.4%
7,939 6,503 21-25 -18.1%
11,084 9,402 26-35 -15.2%
10,683 8,762 36-45 -18.0%
9,147 8,154 46-55 -10.9%
5,623 5,390 56-65 -4.1%
3,082 2,749 66-75 -10.8%
2,158 1,899 76-85 -12.0%
602 537 86 or older -10.8%
1,458 1,092 Unknown -25.1%
59,373 50,430 Total drivers -15.1%

18
Nonmotorist locations
Table 19 indicates that there was an unusually large drop in pedestrian fatalities
due to jaywalking (being on the roadway away from a designated pedestrian crossing).
This would be consistent with the above-postulated general decrease in driving speeds,
because slower speeds would make jaywalking less dangerous.
Table 19
Changes in selected categories of the locations relative to the roadway for nonmotorists
involved in fatal accidents.
Year
2005 2008 Nonmotorist location
Change
from 2005
to 2008
173 294 Intersection – on roadway, crosswalk availability unknown +69.9%
187 222 Intersection – on roadway, crosswalk not available +18.7%
1,941 2,065 Nonintersection – on roadway, crosswalk not available +6.4%
462 487 Intersection – in crosswalk +5.4%
434 378 Intersection – on roadway, not in crosswalk -12.9%
1,701 1,002 Nonintersection – on roadway, not in crosswalk -41.1%
6,629 5,960 Total nonmotorists -10.1%
19
Conclusions
This study examined the changes in the characteristics of U.S. fatal crashes from
2005 (the recent peak year in terms of fatalities) to 2008 (the latest year for which
detailed data are available). The main findings, and possible explanations, are
summarized in Table 20.

20
Table 20
Summary of the main findings.
Desirable changes are in green and undesirable changes are in red.
Aspect
Change from 2005
to 2008 relative to
the average change
Possible explanation(s)
Rush hours Down Decreased commuter travel
Interstates Down Reduced long-distance leisure travel
Local roads/streets Up Increased local leisure travel
Side crashes Down More side airbags
Deployment of side
airbags Up More side airbags
Seats with no airbags Down More airbags
Frontal crashes Down Decreased speeds; more seats with front
airbags; improved airbags
Roads with higher
speed limits Down Decreased speeds
No avoidance maneuver Down Decreased speeds
Construction zone Down Reduced road construction
Multiple fatalities per
crash and per vehicle Down More airbags
Motorcycles Up Increased ownership (1) by middle-aged
men and (2) of larger motorcycles
Heavy trucks Down Reduced freight shipments
Reported alcohol use Up Increased alcohol consumption;
increased DWI enforcement
Repeat DWI offenders Down Disproportionate reduction in driving by
repeat DWI offenders
Repeat crash
involvement Down
Decreased alcohol involvement; fewer
high-risk drivers on the road
Reckless driving Down Decreased speeds
Drowsy driving Down Disproportionate decrease in long-
distance leisure driving
Inattentive driving Up
Increased complexity of daily lives;
increased distractions; increased coder
sensitivity to the issue of distractions
Young drivers Down Fewer young drivers on the road;
increased use of graduated licensing
Jaywalking Down Decreased speeds
21
References
BTS [Bureau of Transportation Statistics]. (2010). Transportation Services Index.
Available at http://www.bts.gov/xml/tsi/src/index.xml.
Jones, R.K. and Lacey, J.H. (2000). State of knowledge of alcohol-impaired driving:
Research on repeat DWI offenders (Report No. DOT HS 809 027). Washington,
D.C.: National Highway Traffic Safety Administration.
NHTSA [National Highway Traffic Safety Administration]. (2010a). Early estimate of
motor vehicle traffic fatalities in 2009 (Report No. DOT HS 811 291).
Washington, D.C.: Author.
NHTSA [National Highway Traffic Safety Administration]. (2010b). Fatality Analysis
Reporting System. Available at http://www-fars.nhtsa.dot.gov.
NSC [National Safety Council]. (2009). Injury facts (2009 edition). Itasca, IL: Author.
Shankar, U. and Verghese, C. (2006). Recent trends in fatal motorcycle crashes: An
update (Report No. DOT HS 810 606). Washington, D.C.: National Highway
Traffic Safety Administration.
Sivak, M. (2008). Is the U.S. on the path to the lowest motor vehicle fatalities in
decades? (Technical Report No. UMTRI-2008-39.) Ann Arbor: The University
of Michigan Transportation Research Institute.
Sivak, M. (2009). Mechanisms involved in the recent large reductions in U.S. road
fatalities. Injury Prevention, 15, 205-206.
Stamatiadis, N. and Puccini, G. (1999). Fatal crash rates in the Southeastern United
States: Why are they higher? Transportation Research Record, 1665, 118-124.
USDA [U.S. Department of Agriculture]. (2010). U.S. per capita food availability:
Beverages by individual beverage. Available at
http://www.ers.usda.gov/Data/FoodConsumption/app/reports/displayCommoditie
s.aspx?reportName=Beverages%20by%20individual%20beverage&id=42#startFo
rm.