Embed Size (px)
Citation preview

sustainability
Article
Towards an Assessment Methodology to SupportDecision Making for Sustainable Electronic WasteManagement Systems: Automatic Sorting Technology
Ilaria Barletta 1,*, Jon Larborn 1, Mahesh Mani 2 and Björn Johannson 1
Received: 31 October 2015; Accepted: 21 December 2015; Published: 15 January 2016Academic Editor: Vincenzo Torretta
1 Department of Product and Production Development, Chalmers University of Technology, GothenburgSE-41296, Sweden; [email protected] (J.L.); [email protected] (B.J.)
2 Dakota Consulting Inc., Silver Spring, MD 20910, USA; [email protected]* Correspondence: [email protected]; Tel.: +46-317-725-004
Abstract: There is a lack of structured methodologies to support stakeholders in accessing thesustainability aspects for e-waste management. Moreover, the increasing volume of electronicwaste (e-waste) and the availability of automated e-waste treatment solutions demand frequentreconfigurations of facilities for efficient e-waste management. To fill this gap and guide suchongoing developments, this paper proposes a novel methodological framework to enable theassessing, visualizing and comparing of sustainability impacts (economic, environmental and social)resulting from changes applied to a facility for e-waste treatment. The methodology encompassesseveral methods, such as discrete event simulation, life cycle assessment and stakeholder mapping.A newly-developed demonstrator for sorting e-waste is presented to illustrate the application of theframework. Not only did the methodology generate useful information for decision making, but it hasalso helped identify requirements for further assessing the broader impacts on the social landscapein which e-waste management systems operate. These results differ from those of previous studies,which have lacked a holistic approach to addressing sustainability. Such an approach is important totruly measure the efficacy of sustainable e-waste management. Potential future applications of theframework are envisioned in production systems handling other waste streams, besides electronics.
Keywords: assessment; sustainability; e-waste; production system; sorting; key performanceindicators; simulation; life cycle assessment; stakeholder mapping
1. Introduction
The management of used electronics raises serious concerns as global electronic waste (e-waste) isexpected to reach 65.4 million tonnes in 2017, according to forecasts by Solving the E-Waste Problem(StEP) Initiative [1]. In this paper, e-waste has been defined as used electrical and electronic equipmentregulated by the EU Waste Electrical Electronic Equipment (WEEE) Directive 2002/96/EC [2]: this kindof equipment uses a voltage of less than 1000 V for AC and less than 1500 V for DC (includingbattery powered) and falls into one of the ten categories indicated by [2], ranging from largehousehold appliances to automatic dispensers. In this paper, WEEE and e-waste will be considered assynonymous, and the handling and treatment of it along the electronics’ supply chain will be definedas e-waste management.
The goals of this paper are:
‚ to highlight the need to assess the impacts that reconfigurations of e-waste treatment facilities canhave on economic, environmental and social sustainability performances,
Sustainability 2016, 8, 84; doi:10.3390/su8010084 www.mdpi.com/journal/sustainability

Sustainability 2016, 8, 84 2 of 20
‚ to provide the companies working within e-waste management with a decision supportmethodology to assess reconfigured e-waste management systems (EMS), specifically pertainingto the sorting of e-waste, against sustainability criteria.
First, the need to assess the sustainability performances of e-waste treatment facilities arisesfrom the knowledge that there are manifold factors that may prevent e-waste management frombeing truly sustainable, considering the triple-bottom line i.e., economic, environmental and socialaspects [3]. Examples of such factors include the design of certain electronic devices that are notsuitable for disassembly and the difficulty in managing feedstock collection [4]. Not limited to these,Huisman et al. [5] (while focusing on regulations within the European territory) compiled the challengesof the WEEE Directive in addressing sustainability. They advocated a pan-EU legislative frameworkembedding standards and formats, which reports all stakeholder responsibilities. Ongondo et al. [6],critically reviewed the current state of WEEE management practices in various countries around theglobe, and identified four focus areas consisting of take-back strategies, health and environment,resource depletion and ethical concerns.
Proper intervention to solve these kinds of problems within e-waste treatment facilities andwithin the electronics supply chain would result in more sustainable WEEE management strategies.These factors clearly highlight the need for companies to change the way in which e-waste is handled,recycled and disposed. Consequently, from a production system point of view, there is a need toassess whether and how changes should be applied to an e-waste treatment facility at both a facilityplanning and operations management level. Most importantly, there is need to gauge whether theseimplementations produce positive effects for the companies’ overall sustainability performances.
It follows then, that the methodologies which effectively assess and present the outcomes of suchreconfigured e-waste management systems, to the key decision makers, qualify as some of the mostpromising ways to tackle the e-waste problem.
To this end, this paper proposes a decision support methodology to assess reconfigured e-wastemanagement systems.
The paper is structured as follows: Section 2 presents the relevant works on sustainable EMSand related challenges. Section 3 introduces the research approach, including the research question,the scope and the research methodology. Section 4 presents the assessment methodology to supportdecision making for sustainable EMS. Section 5 applies the methodology to a case study. Section 6discusses the results, and Section 7 provides the conclusions and the future developments of this study.
2. Sustainable E-Waste Management Systems
An effective e-waste treatment strategy determines the cost and environmental savingspotential from recovering valuable materials (e.g., gold, copper) and reusing of spare parts (e.g.,cellular components). These strategies help prevent the release of hazardous substances into theenvironment [7,8].
Researchers have looked at this challenge both from a product and a production systemperspective and, as a result, have recommended different solutions. Cui and Forssberg [9] havesuggested the characterization of e-waste streams as one of the solutions to handle the non-homogeneityand complexity of materials and components. In their study, they stated that characterization providesa solid baseline for developing cost-effective and environmentally-friendly separation techniques.
Vongbunyong et al. [10] presented disassembly as the key solution for an efficient treatmentof end-of-life products. They recommended the development of robotic systems as a low-costfully-automated solution to overcome today’s economic challenges of disassembly solutions (mostlydue to the size of labor cost in developed countries). To further validate this concept, they utilizedthe case-study of a liquid crystal display (LCD) screen being automatically disassembled by cognitiverobotics. Schluep et al. [11] focused on the current innovative technologies for the development ofa sustainable recycling sector and distinguished them from technologies not suited to supportingsustainable recycling in developing countries.

Sustainability 2016, 8, 84 3 of 20
The above-mentioned studies suggest the existence of a trend to address the e-waste problemthrough change-oriented approaches, take-back schemes and automated treatment solutions.The underlying hypothesis of this study is that this trend is going to result in changes to theconfiguration of EMS, both in assets and operations. According to this hypothesis, there is a need forkey decision makers to ensure that the reconfigurations being adopted in e-waste treatment facilitieswill positively affect the triple-bottom line performances of sustainability.
In a related study focussing on the sustainable design of e-waste treatment processes (e.g.,disassembly, recycling), Barletta et al. [12] illustrated how the literature reviewed did not completelyaddress the sustainability triple-bottom line within their proposed evaluation framework. Theyhowever observed that the research focusing on evaluating the design of the e-waste supply chainwas moving towards a more holistic framework for sustainability assessment. A further review madewithin this study showed that:
‚ e-waste recycling programs and take-back schemes have been assessed against more than onebottom line of sustainability, such as [13,14]
‚ sustainability-related assessments on e-waste treatment processes found in the literature focusedon environmental assessments or alternatively on social sustainability assessments; the formerhave been primarily delivered through a life-cycle assessment methodology, as in [15,16], whereasthe latter, which focused primarily on health conditions of workers, have been made throughin-depth interviews [17] and reporting of health-related indicators related to human toxicity [18].
The authors reiterate the findings presented in [12] and the need to develop a comprehensivesustainability assessment framework to be applied to EMS. The authors agree that the research overallmade no attempts to evaluate impacts from reconfigured EMS against the triple-bottom line. However,note that the realization of sustainable EMS demands a decision-oriented approach to vet and selectproposals of reconfigured EMS that can ultimately bring about positive impacts from a triple-bottomline perspective.
3. Research Approach
3.1. Research Scope and Question
To fulfil the gap reported in Section 2, this paper proposes an assessment and decision supportmethodology to support such stakeholders as production and environmental engineers and managersin the evaluation of proposals on e-waste treatment facility reconfigurations. These proposals arereferred to as “change proposals” in this study. The scope of the decision support methodology hastwo dimensions, as illustrated in Table 1.
Table 1. Scope of the decision support methodology. EMS, e-waste management system.
Dimension Description and Examples
EMSFacilities and equipment within the whole e-waste supply chain [19],
which are made up of sorting centers, disassembly facilities andrecycling facilities.
Change proposals within the EMS
Middle or long-term changes to EMS configurations, which arelikely to affect company performances of sustainability. They may
consist of new disassembly technologies or new ICT tools fore-waste statistics recording.
Based on the research scope presented, the leading research question of this study is as follows:which framework, steps and methods should the decision support methodology be constituted of inorder to ensure sustainable reconfigurations of EMS?

Sustainability 2016, 8, 84 4 of 20
3.2. Research Methodology
The research methodology followed in this paper is based on the case study approach asdescribed by Yin [20]. The proposed decision support methodology was arrived at from acompilation of established methods to assess the triple-bottom line performances of sustainabilityand their adaptation to a new framework for EMS. The decision support methodology is based on aproblem-solving approach.
Figure 1 presents the five steps of the proposed problem-solving model.
Sustainability 2016, 8, 84
4/20
3.2. Research Methodology
The research methodology followed in this paper is based on the case study approach as
described by Yin [20]. The proposed decision support methodology was arrived at from a
compilation of established methods to assess the triple‐bottom line performances of sustainability
and their adaptation to a new framework for EMS. The decision support methodology is based on a
problem‐solving approach.
Figure 1 presents the five steps of the proposed problem‐solving model.
Figure 1. The problem‐solving model adopted in this study and the contributive role of the
decision support methodology within it.
This framework was partially inspired by the multi‐step problem solving model (reported
in [21], as well as many other publically‐available online sources) and by the decision‐making
framework for the selection of manufacturing automation technologies from Almannai et al. [22].
Figure 1 shows how each of the steps might be undertaken recursively by decision‐making
stakeholders and methodology users.
The methodology was applied to a demonstrator for e‐waste sorting, to evaluate the impacts of
introducing automated sorting equipment within a current sorting facility.
The reason for this choice of case study is that e‐waste items are very different from each other.
To illustrate, batteries can contain different chemicals and materials that demand different types
of sorting.
Private end‐users cannot recognize all of these differences and are usually required to deposit
used batteries in one general bin for batteries, which then needs to be sorted later by collectors
and recyclers.
High volumes and diversity make the sorting process challenging and yet important: evinced
by the increasing number of bins of e‐waste items that collectors receive and the obvious difficulties
for them in sorting products (e.g., batteries) according to the desired sorting criteria.
One of the keys for efficient reuse and recycling of e‐waste is constituted by well‐sorted waste
streams [23]. Consequently, collectors and recyclers could benefit from efficient and high‐quality
automatic sorting [9].
The results from the initial implementation of the decision support methodology in the
demonstrator for e‐waste sorting was vetted through a feedback questionnaire to company
representatives of the e‐waste management market. Inputs from them were intended to help
fine‐tune the decision support methodology and the implementation of it in future case studies.
4. Decision Support Methodology for Sustainable E‐Waste Management Systems
Figure 1. The problem-solving model adopted in this study and the contributive role of the decisionsupport methodology within it.
This framework was partially inspired by the multi-step problem solving model (reported in [21],as well as many other publically-available online sources) and by the decision-making frameworkfor the selection of manufacturing automation technologies from Almannai et al. [22]. Figure 1shows how each of the steps might be undertaken recursively by decision-making stakeholders andmethodology users.
The methodology was applied to a demonstrator for e-waste sorting, to evaluate the impacts ofintroducing automated sorting equipment within a current sorting facility.
The reason for this choice of case study is that e-waste items are very different from each other.To illustrate, batteries can contain different chemicals and materials that demand different typesof sorting.
Private end-users cannot recognize all of these differences and are usually required to deposit usedbatteries in one general bin for batteries, which then needs to be sorted later by collectors and recyclers.
High volumes and diversity make the sorting process challenging and yet important: evinced bythe increasing number of bins of e-waste items that collectors receive and the obvious difficulties forthem in sorting products (e.g., batteries) according to the desired sorting criteria.
One of the keys for efficient reuse and recycling of e-waste is constituted by well-sorted wastestreams [23]. Consequently, collectors and recyclers could benefit from efficient and high-qualityautomatic sorting [9].
The results from the initial implementation of the decision support methodology in thedemonstrator for e-waste sorting was vetted through a feedback questionnaire to companyrepresentatives of the e-waste management market. Inputs from them were intended to help fine-tunethe decision support methodology and the implementation of it in future case studies.
Sustainability 2016, 8, 84 5 of 20
4. Decision Support Methodology for Sustainable E-Waste Management Systems
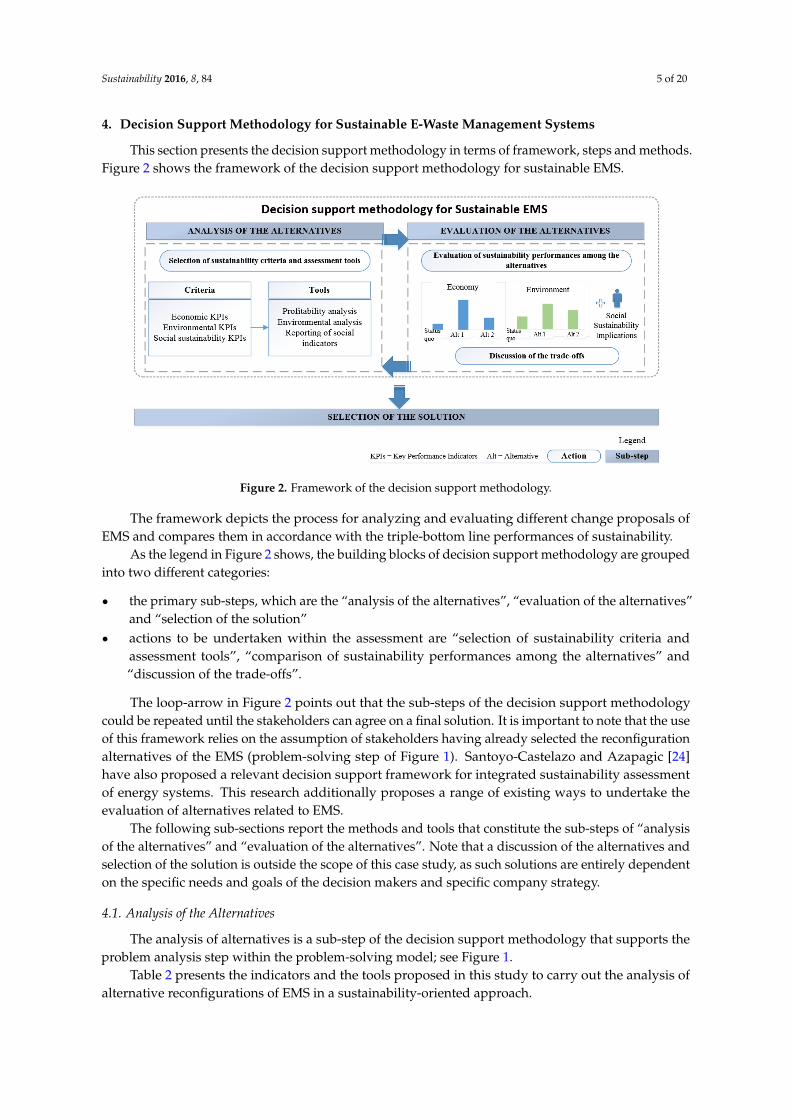
This section presents the decision support methodology in terms of framework, steps and methods.Figure 2 shows the framework of the decision support methodology for sustainable EMS.
Sustainability 2016, 8, 84
5/20
This section presents the decision support methodology in terms of framework, steps and
methods. Figure 2 shows the framework of the decision support methodology for sustainable EMS.
Figure 2. Framework of the decision support methodology.
The framework depicts the process for analyzing and evaluating different change proposals of
EMS and compares them in accordance with the triple‐bottom line performances of sustainability.
As the legend in Figure 2 shows, the building blocks of decision support methodology are
grouped into two different categories:
the primary sub‐steps, which are the “analysis of the alternatives”, “evaluation of the
alternatives” and “selection of the solution”
actions to be undertaken within the assessment are “selection of sustainability criteria and
assessment tools”, “comparison of sustainability performances among the alternatives”
and “discussion of the trade‐offs”.
The loop‐arrow in Figure 2 points out that the sub‐steps of the decision support methodology
could be repeated until the stakeholders can agree on a final solution. It is important to note that the
use of this framework relies on the assumption of stakeholders having already selected the
reconfiguration alternatives of the EMS (problem‐solving step of Figure 1). Santoyo‐Castelazo and
Azapagic [24] have also proposed a relevant decision support framework for integrated
sustainability assessment of energy systems. This research additionally proposes a range of existing
ways to undertake the evaluation of alternatives related to EMS.
The following sub‐sections report the methods and tools that constitute the sub‐steps of
“analysis of the alternatives” and “evaluation of the alternatives”. Note that a discussion of the
alternatives and selection of the solution is outside the scope of this case study, as such solutions are
entirely dependent on the specific needs and goals of the decision makers and specific
company strategy.
4.1. Analysis of the Alternatives
The analysis of alternatives is a sub‐step of the decision support methodology that supports the problem
analysis step within the problem‐solving model; see Figure 1.
Table 2 presents the indicators and the tools proposed in this study to carry out the analysis of alternative
reconfigurations of EMS in a sustainability‐oriented approach.
Figure 2. Framework of the decision support methodology.
The framework depicts the process for analyzing and evaluating different change proposals ofEMS and compares them in accordance with the triple-bottom line performances of sustainability.
As the legend in Figure 2 shows, the building blocks of decision support methodology are groupedinto two different categories:
‚ the primary sub-steps, which are the “analysis of the alternatives”, “evaluation of the alternatives”and “selection of the solution”
‚ actions to be undertaken within the assessment are “selection of sustainability criteria andassessment tools”, “comparison of sustainability performances among the alternatives” and“discussion of the trade-offs”.
The loop-arrow in Figure 2 points out that the sub-steps of the decision support methodologycould be repeated until the stakeholders can agree on a final solution. It is important to note that the useof this framework relies on the assumption of stakeholders having already selected the reconfigurationalternatives of the EMS (problem-solving step of Figure 1). Santoyo-Castelazo and Azapagic [24]have also proposed a relevant decision support framework for integrated sustainability assessmentof energy systems. This research additionally proposes a range of existing ways to undertake theevaluation of alternatives related to EMS.
The following sub-sections report the methods and tools that constitute the sub-steps of “analysisof the alternatives” and “evaluation of the alternatives”. Note that a discussion of the alternatives andselection of the solution is outside the scope of this case study, as such solutions are entirely dependenton the specific needs and goals of the decision makers and specific company strategy.
4.1. Analysis of the Alternatives
The analysis of alternatives is a sub-step of the decision support methodology that supports theproblem analysis step within the problem-solving model; see Figure 1.
Table 2 presents the indicators and the tools proposed in this study to carry out the analysis ofalternative reconfigurations of EMS in a sustainability-oriented approach.

Sustainability 2016, 8, 84 6 of 20
Table 2. Indicators and tools to analyze alternative reconfigurations of EMS with respect to thetriple-bottom line of sustainability.
Sustainability Performance
Sustainability Indicators Sustainability Assessment Tools
Selection Performed by
Decision Makers Decision Support Methodology’s Users
Economic sustainability
Profit margin, revenues,Return of investment (ROI)
Break-even point (BEP)Net present value (NPV)
Payback time
Economic assessments of present and futuree-waste streams [25], material flow analysis to
forecast e-waste streams [26], break-evenanalyses, profitability analyses, analyses of
operations-management performancesthrough discrete event simulation (DES)
Environmental sustainability
Total energy consumption,Global warming potential
Terrestrial ecotoxicityFreshwater ecotoxicity
Metal depletion
Substance flow analysis (SFA), e.g., [27], lifecycle assessment (LCA) [28] and
environmental risk assessment (ERA),e.g., [15]
Social sustainability
Human ecotoxicity,Global reporting initiative (GRI)
social sustainability indicators [29]KPIs of socially-sustainable
operations [30]
Social LCA [31],assessment of implications on social
sustainability from the introduction of a newtechnology into an EMS [30]
Table 2’s second column illustrates a range of possible sustainability indicators suitable to assessthe economic, environmental and social performances of the alternatives. These indicators reflectthe criteria of analysis that are meant to be selected by decision stakeholders. Table 2’s third columnillustrates the sustainability assessment tools useful for evaluating EMS against the selected criteria.
The assessment tools suitable for the analysis of a specific problem need to be selected by the usersof the decision support methodology, from company engineers and analysts to external consultantsand research fellows. The selection of the criteria of analysis and assessment tools provided by Table 2depends on several factors characterizing the case of each company and facility; for instance, dataavailability, goal of the study, company strategy, resources and skills at hand. Nevertheless, it isstill possible to provide an overall recommendation on the use of the decision support methodology.Users and decision makers must select at least one criteria and assessment tool for each of the threedimensions of sustainability: economic, environmental and social. This guarantees that sustainabilityis being addressed more holistically within the decision-making process. Assessments to be carriedout by the decision support methodology can embrace different system boundaries (which do notnecessarily coincide with the boundaries of the e-waste treatment facility).
The decision makers decide on the criteria and the system boundaries of the analysis that theydeem most suitable for the EMS. To that end, Zijp et al. [32] offer an identification key for selectingmethods for sustainability assessments. From the contents of Table 2, it follows that a decision of thisnature has to be done in agreement with the users of the decision support methodology.
The framework assesses the EMS either by carrying out economic, environmental and socialsustainability assessments and eventually combining the results or by carrying out an assessment thatholistically embraces the triple-bottom line. Examples of these kinds of assessments are cost-benefitanalysis, risk analysis, vulnerability analysis and multi-criteria analysis, which are presented byNess et al. [33] as integrated assessments. In their study, Ness et al. have claimed that they can not onlyaddress sustainability issues, but also cover several other problem areas of a multi-disciplinary nature.When adopting an integrated assessment for EMS, the sustainability criteria to be used may, in somecases, coincide with a sub-set of the criteria presented by Table 2.

Sustainability 2016, 8, 84 7 of 20
4.2. Evaluation of the Alternatives
The evaluation of the alternatives is the sub-step of the decision support methodology thatsupports the decision-making step within the problem-solving model (see Figure 1). Here, the resultsfrom the sustainability assessment made within the prior sub-step are presented to the decision makers.
Alenka and Jurij [34] have shown how different qualities and quantities of informationvisualization affected decision making in various situations. Consequently, results from the decisionsupport methodology should be shown in a way that allows a straightforward comparison ofthe different change proposals under a sustainability-oriented perspective. This would facilitatediscussions on possible trade-offs and enable the selection of the most sustainable EMS at hand (whichmight coincide with the as-is system in some cases).
If the results from the decision support methodology are of a quantitative nature, they can bepresented through:
‚ plots of break-even analysis (suitable for both economic and environmental assessments) [35],‚ Key Performance Indicator (KPI) dashboards showcasing the value of each of the triple-bottom
line performances of sustainability [36], or alternatively‚ a unique sustainability index summarizing impacts on profit, planet and people (Salvado et al. [37]
proposed this for the case of the automotive industry),‚ visualization techniques (scatter plots and spider-web charts, among others) being reviewed by
Miettinen [38].
The choice of stakeholder mapping might be considered when proposing assessments of aqualitative nature. This kind of mapping does not convey a holistic comparison among sustainabilitycriteria (as do the methods previously listed), but does support decision making, as it offers a panoramaof influence relationships among the stakeholders. A comparison of different stakeholder analysistechniques has been discussed by Bryson [39].
Dynamic data visualization can increase understanding of the evolution of trends and behaviorsover time better than a static display. An example is the dynamic infographics presentation byH.Rosling, which argues over issues of demographics and public health [40]. Dynamic visualizationsof the modelled EMS can show how operations within a facility or supply chain might look when aspecific scenario is set and provide a picture of the evolution of its performances.
5. Application of Decision Support Methodology to Reconfiguration of Automated SortingEquipment for E-Waste
The EMS demonstrator analyzed as a case study consisted of a sorting system for e-waste to bereconfigured by adding an automated, conveyor-based sorter to the system. Direct observations ofe-waste sorting operations during a study visit and semi-structured interviews of a group of projectpartners and experts provided data inputs for the economic and social assessment of the reconfiguredsorting system.
The methods adopted by the authors for demonstrator development have been grouped accordingto the specific assessment being performed:
‚ static calculation sheets and discrete event simulation (DES) from AnyLogic software(Version 7.1.2–University) were applied to calculate the economic impacts of the new sortingtechnology on the e-waste sorting facility,
‚ a life cycle assessment (LCA) following the standard ISO14044:2006 [28] analysis was applied tocalculate the environmental impact from the building of the sorting technology; to this end, theOpenLCA software (Version 1.4.1) was adopted, which used data from the EcoInvent database(Version 3) as life cycle inventory (LCI) database.

Sustainability 2016, 8, 84 8 of 20
5.1. Demonstrator Setting
The aim of reconfiguring the e-waste system is to develop an intelligent, automated piece ofsorting equipment for used electronics’ segregation and grading. The research project “WEEE ID”(WEEE Identification) [41] put together knowledge and competencies from industries and academia inorder to develop a sorting unit essential for small- and medium-sized recycling plants. This sorting unitaims to prevent operators from being exposed to hazardous substances from segregation processes andenables higher recycling rates within downstream processes, thanks to increased sorting efficiency andaccuracy. The piece of automated sorting and grading equipment for e-waste puts the developmentinto reality in a small-scale demonstrator called e-grader. The CAD representation of the e-graderdemonstrator is represented in Figure 3.
Sustainability 2016, 8, 84
8/20
5.1. Demonstrator Setting
The aim of reconfiguring the e‐waste system is to develop an intelligent, automated piece of
sorting equipment for used electronics’ segregation and grading. The research project “WEEE ID”
(WEEE Identification) [41] put together knowledge and competencies from industries and academia
in order to develop a sorting unit essential for small‐ and medium‐sized recycling plants. This
sorting unit aims to prevent operators from being exposed to hazardous substances from
segregation processes and enables higher recycling rates within downstream processes, thanks to
increased sorting efficiency and accuracy. The piece of automated sorting and grading equipment
for e‐waste puts the development into reality in a small‐scale demonstrator called e‐grader. The
CAD representation of the e‐grader demonstrator is represented in Figure 3.
Figure 3. The e‐grader: an automated piece of sorting equipment for e‐waste being developed as a
demonstrator (courtesy of ReFind technologies AB).
The demonstrator uses sensors and intelligent data processing to detect in real time whether
used electronic products are good for reuse, refurbishment or recycling and sorts them accordingly.
One of the criteria driving this functionality is based on the knowledge that it is possible to obtain
reusable spare parts from a particular model. A whole set of criteria for sorting cellular phones per
optimal downstream use are currently being developed. The demonstrator is programmed to list the
products in optimal fractions by making them instantly available for trading, either directly with
customers or through digital marketplaces.
5.2. Application of Decision Support Methodology in the E‐Grader Demonstrator
The decision support methodology served to support the decision of whether and how to
integrate the new, automated sorting unit (represented by the e‐grader demonstrator) within the
current e‐waste sorting plants, which normally have a high manual, human work content. To that
end, the decision support methodology assessed the economic, environmental and social impacts
that the demonstrator is expected to bring within an existing facility for e‐waste sorting and
recording adopted as a baseline for the case study.
In this case, the problem to be assessed consisted of making e‐waste sorting more sustainable,
from a triple‐bottom‐line perspective, than it is in its present state. The analysis started with the
identification of the stakeholders operating within the system boundaries of the e‐waste
management supply chain, who are:
employees working in the facility, from workers to top managers; employees of the
company owning the facility could also be taken into account,
owners of businesses within end‐of‐life of electronics: producers of electronics, collectors,
recycling companies,
future vendors of the sorting unit,
national and international policy makers,
local communities affected by the life cycle stages of electronics, from raw material mining
activities to both formal and informal recycling of e‐waste spare parts.
Figure 3. The e-grader: an automated piece of sorting equipment for e-waste being developed as ademonstrator (courtesy of ReFind technologies AB).
The demonstrator uses sensors and intelligent data processing to detect in real time whether usedelectronic products are good for reuse, refurbishment or recycling and sorts them accordingly. One ofthe criteria driving this functionality is based on the knowledge that it is possible to obtain reusablespare parts from a particular model. A whole set of criteria for sorting cellular phones per optimaldownstream use are currently being developed. The demonstrator is programmed to list the productsin optimal fractions by making them instantly available for trading, either directly with customers orthrough digital marketplaces.
5.2. Application of Decision Support Methodology in the E-Grader Demonstrator
The decision support methodology served to support the decision of whether and how to integratethe new, automated sorting unit (represented by the e-grader demonstrator) within the current e-wastesorting plants, which normally have a high manual, human work content. To that end, the decisionsupport methodology assessed the economic, environmental and social impacts that the demonstratoris expected to bring within an existing facility for e-waste sorting and recording adopted as a baselinefor the case study.
In this case, the problem to be assessed consisted of making e-waste sorting more sustainable,from a triple-bottom-line perspective, than it is in its present state. The analysis started with theidentification of the stakeholders operating within the system boundaries of the e-waste managementsupply chain, who are:
‚ employees working in the facility, from workers to top managers; employees of the companyowning the facility could also be taken into account,
‚ owners of businesses within end-of-life of electronics: producers of electronics, collectors,recycling companies,
‚ future vendors of the sorting unit,‚ national and international policy makers,

Sustainability 2016, 8, 84 9 of 20
‚ local communities affected by the life cycle stages of electronics, from raw material miningactivities to both formal and informal recycling of e-waste spare parts.
The alternatives being evaluated in this case consisted of the adoption of the sorting unit versusmaintaining the status quo of the facility with manual sorting. Figure 4 shows both the as-is layoutand the layout being reconfigured by means of the implementation of the e-grader.
Sustainability 2016, 8, 84
9/20
The alternatives being evaluated in this case consisted of the adoption of the sorting unit versus
maintaining the status quo of the facility with manual sorting. Figure 4 shows both the as‐is layout
and the layout being reconfigured by means of the implementation of the e‐grader.
Figure 4. As‐is sorting system versus the automated solution being proposed.
As can be deduced from Figure 4, the demonstrator is currently capable of handling a subset of
all possible WEEE items in terms of size and shape constraints. Therefore, from an economic point of
view, it is fundamental to determine if and in what conditions the sorting unit can be integrated into
a facility that handles e‐waste manually, in order to generate positive value. It is reasonable to
assume that when managers of a certain facility evaluate the option of adopting the sorting unit,
they would like to know when and under what conditions the additional costs generated will be
offset by the benefits brought about by the sorting unit. The following three sections will utilize
some of the criteria shown in
Table 2 considering the triple‐bottom line, i.e., economic, environmental and social metrics
instantiated in the e‐grader solution versus the as‐is facility today.
5.2.1. Setting Economic Criteria of the Demonstrator
Measurements to be employed in the economic assessment should be selected according to the
metrics and the time horizon that the stakeholders deem reasonable to evaluate, and these can vary
in different scenarios. The set of indicators used for the analysis of the demonstrator evaluates the
impacts of the new technology adoption at two levels that are tightly connected: facility operations
performances and economic performances. The operational indicators deemed suitable for the
analysis are:
throughput (rate of items being processed),
lead time (from input storage to the end of the line),
utilization of the sorting unit.
The economic indicators deemed suitable for the analysis are:
income (revenues),
Figure 4. As-is sorting system versus the automated solution being proposed.
As can be deduced from Figure 4, the demonstrator is currently capable of handling a subset ofall possible WEEE items in terms of size and shape constraints. Therefore, from an economic pointof view, it is fundamental to determine if and in what conditions the sorting unit can be integratedinto a facility that handles e-waste manually, in order to generate positive value. It is reasonable toassume that when managers of a certain facility evaluate the option of adopting the sorting unit, theywould like to know when and under what conditions the additional costs generated will be offset bythe benefits brought about by the sorting unit. The following three sections will utilize some of thecriteria shown in Table 2 considering the triple-bottom line, i.e., economic, environmental and socialmetrics instantiated in the e-grader solution versus the as-is facility today.
5.2.1. Setting Economic Criteria of the Demonstrator
Measurements to be employed in the economic assessment should be selected according tothe metrics and the time horizon that the stakeholders deem reasonable to evaluate, and thesecan vary in different scenarios. The set of indicators used for the analysis of the demonstratorevaluates the impacts of the new technology adoption at two levels that are tightly connected: facilityoperations performances and economic performances. The operational indicators deemed suitable forthe analysis are:
‚ throughput (rate of items being processed),‚ lead time (from input storage to the end of the line),‚ utilization of the sorting unit.
The economic indicators deemed suitable for the analysis are:
‚ income (revenues),

Sustainability 2016, 8, 84 10 of 20
‚ gross profit margin, which is the percentage of revenue remaining after the cost of goods sold,‚ return of investment (ROI), which measures the amount of return on an investment relative to the
investment’s cost.
Among the operations management performances by which the facility can be economicallyevaluated, throughput is one of the most preferred indicators among top management. It is reasonableto assume that introducing the automatic sorting unit leads to higher overall system throughput, ifthis is properly utilized and placed within the facility. From the total input of WEEE items into thefacility, the higher percentage of WEEE items suitable for processing by the sorting unit, the higher thetotal system throughput will be, which matches the throughput of items being sorted manually andthe items being sorted by the equipment. Capturing the dynamic behavior of the system through DESgives an understanding of the variability embedded within any production system and helps decisionmakers visualize possible system behaviors. Figure 5 shows a snapshot of the DES model being usedin the case study.
Sustainability 2016, 8, 84
10/20
gross profit margin, which is the percentage of revenue remaining after the cost of goods
sold,
return of investment (ROI), which measures the amount of return on an investment
relative to the investment’s cost.
Among the operations management performances by which the facility can be economically
evaluated, throughput is one of the most preferred indicators among top management. It is
reasonable to assume that introducing the automatic sorting unit leads to higher overall system
throughput, if this is properly utilized and placed within the facility. From the total input of WEEE
items into the facility, the higher percentage of WEEE items suitable for processing by the sorting
unit, the higher the total system throughput will be, which matches the throughput of items being
sorted manually and the items being sorted by the equipment. Capturing the dynamic behavior of
the system through DES gives an understanding of the variability embedded within any production
system and helps decision makers visualize possible system behaviors. Figure 5 shows a snapshot of
the DES model being used in the case study.
Figure 5. Snapshot of the DES model of the e‐grader demonstrator in AnyLogic.
A trend describing how system throughput increases when the percentage of input to the
sorting unit increases can be drawn through interpolation techniques applied to the “experiment
points”.
Interpolation functionalities are available in Microsoft Excel and MATLAB [42], among other
software packages.
In this case, the higher the throughput, the higher the possibility to sell the items straight away,
resulting in higher revenue within a given time. The orange bars in Figure 6 represent the possible
increases of income from the adoption of the sorting unit when compared to the as‐is case.
However, several sources of variability can affect the final throughput. When considering a
constant input rate to the facility, the resulting average throughput will vary within a certain range
because of the variabilityin operating conditions. For instance, average throughput of the as‐is
system varies according to the variability of the service time of operators and their available work
time. Average throughput of the sole sorting unit varies according to the availability of
the equipment.
Such variability is expressed by the dotted lines in Figure 6 and should always be a matter for
discussion when evaluating the robustness of the results from the economic assessment. Because the
income is the result of the amount of product types multiplied by the selling price, the variability of
the income reflects the same sources of variability depicted in Figure 6 plus the variability of
sellingprices themselves. This is an important aspect to be considered within a sensitivity analysis of
the income.
Figure 5. Snapshot of the DES model of the e-grader demonstrator in AnyLogic.
A trend describing how system throughput increases when the percentage of input to the sortingunit increases can be drawn through interpolation techniques applied to the “experiment points”.
Interpolation functionalities are available in Microsoft Excel and MATLAB [42], among othersoftware packages.
In this case, the higher the throughput, the higher the possibility to sell the items straight away,resulting in higher revenue within a given time. The orange bars in Figure 6 represent the possibleincreases of income from the adoption of the sorting unit when compared to the as-is case.
However, several sources of variability can affect the final throughput. When considering aconstant input rate to the facility, the resulting average throughput will vary within a certain rangebecause of the variabilityin operating conditions. For instance, average throughput of the as-is systemvaries according to the variability of the service time of operators and their available work time.Average throughput of the sole sorting unit varies according to the availability of the equipment.
Such variability is expressed by the dotted lines in Figure 6 and should always be a matter fordiscussion when evaluating the robustness of the results from the economic assessment. Because theincome is the result of the amount of product types multiplied by the selling price, the variability of theincome reflects the same sources of variability depicted in Figure 6 plus the variability of sellingpricesthemselves. This is an important aspect to be considered within a sensitivity analysis of the income.

Sustainability 2016, 8, 84 11 of 20Sustainability 2016, 8, 84
11/20
Figure 6. Graphical representation of an estimation of the trend of income from the e‐grader
demonstrator as the percentage of WEEE items being processed by the sorting unit increases.
Not only can the prices of metals contained in the WEEE vary significantly over time, but also
the prices for the same items processed on the same shift might vary according to their condition: in
fact, an item suitable for reuse purposes has a higher value than the same item sorted for recycling.
The authors have proposed a way to argue and value sorting unit impacts on throughput and
income. Nevertheless, due to the use of confidential data, Figure 6 will not be numerically fully
solved in this study. The application on the demonstrator occurred at a specific percentage of input
of WEEE items to the sorting unit and aimed at comparing the economic performance gained when
this input “feeds” the as‐is system (orange line in Figure 6) with the e‐grader system (blue line in
Figure 6).
As a result, the value of the three KPIs referring to operations management within the facility
have been calculated and presented in Table 3.
Table 3. Economic assessment: operational outputs.
Indicator Unit Mean Standard Deviation
As‐Is E‐Grader As‐Is E‐Grader
Throughput items/h 205 497 NA 40.2
Lead time workdays 5 3.4 NA 0.31
Utilization of e‐grader ‐ NA 83% NA 6%
Table 3 presents values of the as‐is system from data collection and personal communications in
the sorting facility and shall be used as an indication. Values of the e‐grader system in Table 3 stem
from five DES runs of the factory model shown in Figure 5, and each refers to one year of
production time.
It can be seen that the throughput of the e‐grader case numbers more than doubles the as‐is
case.
From this result, the question becomes: “is a higher throughput worthwhile when compared to
the additional costs of acquisition and operation?” To reply accurately, benefits and costs need to be
considered in parallel. In this application on the demonstrator, cost‐benefit analysis must capture the
differences in performance figuring when comparing the e‐grader and as‐is systems, because the
latter represents a baseline. The gross‐profit‐margin KPI [43] has been selected to this end. The
formula is given by (1):
Figure 6. Graphical representation of an estimation of the trend of income from the e-graderdemonstrator as the percentage of WEEE items being processed by the sorting unit increases.
Not only can the prices of metals contained in the WEEE vary significantly over time, but also theprices for the same items processed on the same shift might vary according to their condition: in fact,an item suitable for reuse purposes has a higher value than the same item sorted for recycling.
The authors have proposed a way to argue and value sorting unit impacts on throughput andincome. Nevertheless, due to the use of confidential data, Figure 6 will not be numerically fully solvedin this study. The application on the demonstrator occurred at a specific percentage of input of WEEEitems to the sorting unit and aimed at comparing the economic performance gained when this input“feeds” the as-is system (orange line in Figure 6) with the e-grader system (blue line in Figure 6).
As a result, the value of the three KPIs referring to operations management within the facilityhave been calculated and presented in Table 3.
Table 3. Economic assessment: operational outputs.
Indicator UnitMean Standard Deviation
As-Is E-Grader As-Is E-Grader
Throughput items/h 205 497 NA 40.2Lead time workdays 5 3.4 NA 0.31
Utilization of e-grader - NA 83% NA 6%
Table 3 presents values of the as-is system from data collection and personal communicationsin the sorting facility and shall be used as an indication. Values of the e-grader system in Table 3stem from five DES runs of the factory model shown in Figure 5, and each refers to one year ofproduction time.
It can be seen that the throughput of the e-grader case numbers more than doubles the as-is case.From this result, the question becomes: “is a higher throughput worthwhile when compared to
the additional costs of acquisition and operation?” To reply accurately, benefits and costs need to beconsidered in parallel. In this application on the demonstrator, cost-benefit analysis must capture thedifferences in performance figuring when comparing the e-grader and as-is systems, because the latterrepresents a baseline. The gross-profit-margin KPI [43] has been selected to this end. The formula isgiven by (1):
Gross pro f it margin “Revenue ´ Cost o f goods sold
Revenue(1)

Sustainability 2016, 8, 84 12 of 20
Revenue is the total amount of income generated by primary operations, which in this casecoincides with recording and sorting, and the cost of goods sold (COGS) includes all expenses ofpurchasing and processing goods to be sold. Gross profit margin is used to compare a company’scurrent state to its past performance or with competitor performance, especially in markets where theprice of goods can fluctuate significantly. This was therefore considered suitable for the demonstratorin this case. Equation (1) shows the gross profit margin is the percentage of revenue remaining afterthe COGS, as defined in [44].
COGS for this demonstrator is expressed by Equation (2):
Cost o f goods sold “ Labor cost` Electricity cost` Sorting service cost` Inventory holding costs (2)
For the application on this demonstrator, the four costs eligible to be calculated by Equation (2)are those spent solely on operational activities and directly linkable to the processing of WEEE items(storing included). Under the hypothesis of using the e-grader as a product service, the sortingservice cost in Equation (2) refers to the fee to be paid for its use. Table 4 shows results from thesimulation experiments.
Table 4. Economic assessment: economic outputs. Components of the gross profit margin. Values areaveraged over one year of production time.
Indicator UnitMean
As-is E-Grader
Electricity costs USD/year 3 14Labor cost USD/year 138,847 138,847
Inventory holding cost USD/year 2065 588Sorting service cost USD/year 27,769Cost of goods sold USD/year 140,915 167,219
Revenues USD/year 885,061 9,790,113Gross profit margin USD/item 0.84 0.98
Tables 3 and 4 report how the modelled e-grader system presented a 19% increase of COGScounterbalanced by more than a double throughput rate, when compared to the as-is case. Ultimately,the case demonstrated represented an increase of the gross profit margin by 17%.
Revenues were calculated on the basis of the yearly throughput, the selling prices of each WEEEitem within the input mix and the percentages of each WEEE item within the input mix. Thesepercentages were retrieved from Swedish recycling of WEEE data and were normalized afterwards.
Moreover, a 35% selling price free of hazardous items was considered within the WEEE inputmix. Note that this case was simplified, and many hidden costs were not captured by the evaluationillustrated above. This could make the gross profit margin lower within a short timeframe.
In addition to this, evaluating the economic impact from a new technology or piece of equipmentrequires more than calculating variations of profit margins. Investment evaluation methods helpstakeholders see the bigger picture and analyze impacts with a longer perspective. The ROI wasproposed for such a purpose [44]. The ROI formula is given by Equation (3):
ROI “Gain por lossq f rom the investment
Cost o f the investment(3)
Gain from the investment results from additional revenues and from the value of the benefitsbrought by the sorting unit. These benefits can be of a tangible or intangible nature. The followingbenefits have been identified in the case of the e-grader demonstrator:
‚ improved facility scheduling thanks to the analysis of statistics,‚ social benefits for operators (reduced health hazards, more fulfilling work tasks),‚ economic and environmental benefits for downstream operations due to more accurate sorting,

Sustainability 2016, 8, 84 13 of 20
‚ improvement of product knowledge leading to a fairer price for the WEEE items.
Losses from the investment are the result of avoidable costs. Avoidable costs are expenses that canbe avoided if a decision is made to alter the course of a project or business. They can also be calculatedfrom Table 4. Nevertheless, other monetary losses have to be estimated and considered. The followingadditional losses have been identified:
‚ installation and maintenance costs of the equipment,‚ training costs for operators,‚ productivity losses for the start-up phase.
An arbitrary estimation of the value of benefits and costs being listed above is reported in Table 5over a horizon of five years. This estimation has been reached in accordance with a life-cycle thinkingapproach. This means that the values of this estimation represent the value of the economic, naturaland social capital affected by the introduction of the e-grader. They refer not only to the facility beinganalyzed, but to the whole electronics supply chain.
Table 5. Estimated benefits and additional costs from the installation and use of the e-grader. Valuesare in million US dollars (MUSD).
Estimated Value (MUSD) Worst Case (WC) Expected Best Case (BC)
Benefits 6 9 15Additional costs 4 2 1
By coupling the values from Table 5 with the revenues and costs from Table 4, the values of ROIover a five-year evaluation period have been calculated for each scenario. The results are the following:
‚ the estimated ROI is equal to 96%,‚ the worst case (WC)-ROI is equal to 91%,‚ the best case (BC)-ROI is equal to 98%.
Another increasingly common KPI, often due to increased kWh price, is the electricity cost.This cost is uniquely linkable to the usage of the e-grader and other equipment for WEEE sorting.
Electricity cost also correlates with environmental KPIs for the e-grader demonstrator due to theenvironmental impact from electricity usage.
5.2.2. Setting Environmental Criteria on the Demonstrator
Following a life-cycle thinking approach, two different components of environmental impact canbe considered for a facility using the proposed e-grader:
(1) the impact from the production of the sorting unit (including the sorting unit’s bill of materials),(2) the impact from the use phase of the sorter within the facility.
The second component does not have any particular relevance in the big picture of theenvironmental impact, which is mostly determined by its first component. In fact, the energyconsumption from the use of the new sorting unit is produced by the electricity spent to run theelectronic equipment and the conveyor belt. They demand low power in comparison to the powerdemanded by the technical building services (TBS) of a facility, such as cooling and ventilation.
With a hypothesis of 50% utilization of the conveyor for the as-is case and considering the 83%utilization for the e-grader demonstrator, average values of electricity consumption per item and CO2
emissions per item are calculated and presented in Table 6.

Sustainability 2016, 8, 84 14 of 20
Table 6. Electric energy consumptions and emissions per item being sorted.
Value Unit As-Is E-Grader
Electricity consumption per item kWh/item 0.001 0.950CO2 emissions per item kg/item 0.0000065 0.009
The energy consumption for the e-grader demonstrator is 1333-times larger than the as-is case.Nevertheless, the absolute amount of energy and emissions caused by sorting activities is relatively
small if compared to the energy spent by TBS. An energy consumption of 250 MWh/month from TBScan be speculated and compared to an energy consumption of 45 MWh/month from the e-grader’suse phase (at the production rate being calculated).
An LCA analysis as defined from the standard ISO14044:2006 [28] has been selected, because itfits well with the purpose of the decision support methodology in the evaluation of the environmentalsustainability’s impact. The functional unit of the LCA is one unit of e-grader, and the goal of theLCA is to assess the environmental impact caused by the building of each component constituting thebill of material of the e-grader. The stages included in the analysis are raw material extraction andmanufacturing of components (cradle-to-gate scope). The geographical system boundaries are global,and impacts from transportation have been included.
The LCA has been performed according to the impact assessment method of ReCiPe midpointaccording to the hierarchist (H) perspective [45]. Table 7 shows the main outputs from the LCA analysis.
Table 7. LCIA ReCiPe midpoint (H) applied to the demonstrator. Characterization factors related totoxicity are expressed through the reference unit kg 1.4-dichlorobenzene equivalent (kg 1.4-DB eq).
Life Cycle Impact Assessment (LCIA) Category Reference Unit Value
Climate change kg CO2 eq 9,039.502Fossil depletion kg oil eq 2,182.532
Freshwater ecotoxicity kg 1.4-DB eq 0.193Freshwater eutrophication kg P eq 10,095.415
Human toxicity kg 1.4-DB eq 706.066Metal depletion kg Fe eq 6,296.526
Terrestrial ecotoxicity kg 1.4-DB eq 0.893Water depletion m3 43,988.726
The indicators shown in Table 7 represent a sub-set of the whole set of the impact categoriesincluded by the ReCiPe midpoint (H). The authors selected those indicators that were deemed mostinteresting for assessment with respect to the type of functional unit at issue. This choice also comesfrom discussions with the engineers of the company using the demonstrator. At this stage, thesefigures cannot be compared to any other type of technology for e-waste sorting, but can still be used asa baseline for future environmental analyses, which may be orientated toward reducing the impactin specific areas. Comments on the implications of the absolute values of Tables 6 and 7 are to beperformed by environmental engineers, as this exceeds the scope of this study. It is possible to arguethat at this stage of the technology development, a reduction in environmental burdens or an increasein environmental benefits from the e-grader life cycle can be pursued. First, the e-grader mightcause less environmental impact than that reported in the LCA analysis by two means: the use ofmaterials that cause less “embedded” resource consumptions and emissions or less component weight.Moreover, if the components are acquired from local suppliers, then the impact from transporting thisequipment from the vendor to the user will be reduced.
In conclusion, the more the WEEE input stream, that is sorted by the sorting unit, containsreusable items, the more the benefits from using the sorting unit for grading purposes increase whencompared to the value provided by grading performed by operators (because in this case, uniformityof grading criteria is not guaranteed).

Sustainability 2016, 8, 84 15 of 20
5.2.3. Reporting Social Considerations on the Demonstrator
The results from the social sustainability assessment within the system boundaries of the sortingfacility have been reported by Taghavi et al. in [30], to which the authors of this paper contributed.
Taghavi et al. used an established framework based on social sustainability indicators in orderto assess the social implications for facility operators from the introduction of the e-grader withinthe sorting facility. These indicators range from labor codes of conduct (e.g., occupational health andsafety), personal development, work design (e.g., participation), work-life balance, employee turnoverand job security. Literature studies, on-site observations, semi- and un-structured interviews wereused in order to collect initial data for the study. A structured interview with a company representativewas carried out using the framework as a question guide. The results from [30] showed that an overallbenefit from the use of the e-grader exists for operators, because it may support some proactive aspectsof social sustainability, such as competence development. Some additional conditions, which thesorting technology itself does not provide, need to be secured by the organization in order to ensure asocially-sustainable implementation:
‚ Education and training must be provided to employees,‚ Workers must be made aware that they have new responsibilities.
These two conditions have been recognized as key to having employees willing to use the e-graderand an important contribution to a positive work environment.
Nevertheless, trade-offs between the number of job opportunities and meaningful work contentmust be managed by companies.
A stakeholder map was drawn to capture the three sustainability assessments from a life-cycleperspective. The influences occurring amongst the stakeholders of the electronics life cycle followingthe introduction of the e-grader are shown in Figure 7. It summarizes the relationships between systemboundaries of the different assessments being performed and the main stakeholders whose activitiesaffect the use or will be affected by the use of the e-grader demonstrator.Sustainability 2016, 8, 84
17/20
Figure 7. Stakeholder map: influences among stakeholders.
In Figure 7, connections represented by arrows were drawn according to the expertise of the
authors and the outcome from discussions held with experts over the CIRP (College International
pour la Recherche en Productique) Life Cycle Engineering Conference 2015 [12]. Grey arrows
represent influences acting within the e‐waste facility, whereas orange arrows represent influences
acting outside the e‐waste facility, which may or may not affect its activities. The width of the arrows
aims at qualitatively representing the strength of the influence from one actor towards another.
From Figure 7, two findings are extracted:
Operations carried out by recyclers, if connected to informal e‐waste treatment activities,
cause huge damage to the communities of developing countries affected by illegal e‐waste
dumping. More accurate sorting and higher reuse initiatives can indirectly reduce the
amount of e‐waste otherwise intended for informal e‐waste recycling.
Policy makers can incentivize the adoption of the e‐grader unit within sorting and
recycling centers through several means, for instance monetary incentives (e.g., tax
reductions).
From the results of the economic, environmental and social assessment and from the
considerations being drawn from the stakeholder map, it can be concluded that the adoption of the
e‐grader in the facility used for the demonstrator will make it more economic and socially
sustainable in comparison with the current state of the facility. Environmental sustainability
performances of the facility grow worse when compared to the as‐is state, when considering the
system boundaries of the sorting facility.
However, this does not hold anymore when the system boundaries of the analysis are
expanded and embrace the whole electronics supply chain, as the cost‐benefit analysis showed.
Therefore, it can be argued that with the introduction of the e‐grader, to that facility, and later on
within the market, positive impacts on sustainability’s triple‐bottom line will ripple throughout the
electronics supply chain.
6. Discussion
Having identified the need for developing a decision support methodology for sustainable
EMS, a research question was formulated to address the framework needs to ensure effective
sustainability‐oriented reconfigurations of EMS.
The proposed decision support methodology consists of the following steps:
Figure 7. Stakeholder map: influences among stakeholders.
In Figure 7, connections represented by arrows were drawn according to the expertise of theauthors and the outcome from discussions held with experts over the CIRP (College International pourla Recherche en Productique) Life Cycle Engineering Conference 2015 [12]. Grey arrows representinfluences acting within the e-waste facility, whereas orange arrows represent influences acting outside

Sustainability 2016, 8, 84 16 of 20
the e-waste facility, which may or may not affect its activities. The width of the arrows aims atqualitatively representing the strength of the influence from one actor towards another. From Figure 7,two findings are extracted:
‚ Operations carried out by recyclers, if connected to informal e-waste treatment activities, causehuge damage to the communities of developing countries affected by illegal e-waste dumping.More accurate sorting and higher reuse initiatives can indirectly reduce the amount of e-wasteotherwise intended for informal e-waste recycling.
‚ Policy makers can incentivize the adoption of the e-grader unit within sorting and recyclingcenters through several means, for instance monetary incentives (e.g., tax reductions).
From the results of the economic, environmental and social assessment and from theconsiderations being drawn from the stakeholder map, it can be concluded that the adoption of thee-grader in the facility used for the demonstrator will make it more economic and socially sustainablein comparison with the current state of the facility. Environmental sustainability performances of thefacility grow worse when compared to the as-is state, when considering the system boundaries of thesorting facility.
However, this does not hold anymore when the system boundaries of the analysis are expandedand embrace the whole electronics supply chain, as the cost-benefit analysis showed. Therefore,it can be argued that with the introduction of the e-grader, to that facility, and later on within themarket, positive impacts on sustainability’s triple-bottom line will ripple throughout the electronicssupply chain.
6. Discussion
Having identified the need for developing a decision support methodology for sustainableEMS, a research question was formulated to address the framework needs to ensure effectivesustainability-oriented reconfigurations of EMS.
The proposed decision support methodology consists of the following steps:
‚ a novel framework containing the steps to be undertaken by decision-making stakeholders andusers of the methodology, in order to evaluate the proposals of reconfigurations of EMS;
‚ a set of sustainability criteria and sustainability assessment tools suitable for applications to EMSthat the authors have retrieved from separated studies; this is one of the first studies to report acompilation of such a nature;
‚ a set of data visualization techniques retrieved from the literature to showcase assessment results.
To validate the first setting of the decision support methodology, the authors briefly presentedit to five company representatives of e-waste management facilities via email. These companyrepresentatives operate at a top-tier management level within their own organization and represent asmall, though valuable, sample of decision stakeholders, which the decision support methodologyaims to support.
Within the emails, the authors have asked for feedback on the projected value that the decisionsupport methodology would bring to their own company. This feedback was unanimously positiveand encouraged further developments and applications of the decision support methodology.
The decision support methodology was applied to a case study on the implementation of anautomated piece of sorting equipment for e-waste. This application revealed new knowledge on thesustainability impacts of adding an automated sorting equipment to an existing sorting facility. Theanalyses were made specifically on the e-grader demonstrator (e.g., through excel-sheets, DES model,documentation).
The results from the case study were validated and approved by the WEEE-ID research projectpartners. These results will contribute to new knowledge about the impacts of adding a new e-graderto an existing sorting facility.

Sustainability 2016, 8, 84 17 of 20
The following limitations of the decision support methodology were identified:
‚ The decision support methodology needs to be tested in other cases in order to validate itsconstituent framework and include additional criteria and tools for sustainability assessments ofEMS that might not have been considered within this paper.
‚ The decision support methodology needs to integrate further sustainability assessment tools,which can include the impacts caused by reconfigurations of EMS throughout the natural andsocial landscapes in which the e-waste management company operates. Maxwell [46] illustratedcase studies of companies that integrated the monetary value of the natural and social capital theydepend on within their traditional decision-making tools. The authors believe that adopting suchan approach within the decision support methodology will guide the decision makers towardschoices reflecting a truly sustainable, life-cycle thinking perspective. This kind of approach couldbe tested in one of the future case studies.
‚ The decision support methodology is not applicable to companies that do not collect the datanecessary for the kind of assessments being proposed (see Table 2). Most of the companiesworking within the e-waste management sector are small- and medium-sized enterprises thatmight not be able to afford the expense of data monitoring and data gathering activities for theimplementation of sustainability assessments.
Visualization of results from the assessments are presently not considered in the case study. In thefuture, the authors intend to collect quantitative measurements as inputs for social sustainabilityassessment once the sorting unit is implemented in a real company. This will provide opportunitesfor the companies to measure the results from the different assessments and pave the way forimprovements in terms of economic, environmental and social sustainability.
From the discussions with the business experts involved in this study, it can be seen that theprofitability of a specific reconfiguration of an EMS is strongly dependent on the type of e-wastestreams that the facility is likely to process. Therefore, the authors recommend that users of thedecision support methodology invest effort in forecasting the volume and mix characteristics ofe-waste streams and include the sources of variability of this forecast within the risk analysis advisedby the framework.
With respect to the case study of this research, the authors noted that previous studies thatcompiled different sorting techniques for solid waste (such as Huang [47], Goodship and Stevels [48],which focused on e-waste specifically) addressed the suitability of each technique to the specific natureof items to be sorted, but did not envision a comparison of the same in terms of sustainability criteria.
This paper conducts a performance evaluation of technological or operational alternatives againstsustainability criteria, whereas previous studies focusing on the processing stages of e-waste treatment(such as disassembly and recycling) used different kinds of criteria: for example, eco-efficiency-relatedcriteria were used by Wath et al. [49] and corporate sustainability performance was used by Yeh and Xu [50].
To conclude, the novelty of this research lies in:
‚ the holistic nature of the assessment indicators and tools to evaluate EMS, which refer to thetriple-bottom line of sustainability. The authors demonstrated that this approach has not beenpursued by previous studies, which looked at only one aspect of the triple-bottom line ofsustainability. Addressing sustainability partially prevents EMS from being truly sustainablewithin the natural and social landscape in which they operate.
‚ the foundation of the decision support methodology on a problem-solving model. Such a foundationcontextualizes the use of the methodology for its users and for the key stakeholders of the EMS.
‚ the application of the decision support methodology to the case study of an innovative piece ofequipment for automatic sorting of e-waste. The results from such a case study pave the way fordiscussions about the benefits and drawbacks of introducing automation and artificial intelligencein processes that are traditionally performed by humans.
Sustainability 2016, 8, 84 18 of 20
7. Conclusions
To maintain competitiveness, e-waste management companies cannot neglect the need topromptly assess possible reconfigurations of EMS and making sure they cause positive impactson the triple-bottom line of sustainability. Research and development supporting e-waste managementdecision makers for the assessment of reconfiguration proposals in accordance with sustainabilitycriteria are needed. The authors have developed a decision support framework and methodologywith clearly-defined steps and analysis tools to evaluate and visualize the impacts caused by changesapplied at a production system level. The decision support methodology was tested in a case studyinvolving the introduction of an automated piece of sorting equipment for e-waste into an existingsorting facility, which uses human labor to deliver sorting activities. Not only did the methodologygenerate useful information for decision making, but also helped identify requirements to furtherassess the broader impacts on the social landscape in which EMS operate.
Potential future applications of the framework are envisioned in production systems handlingother waste streams, besides electronics.
According to the experiences gained from this study, the decision support methodology turnedout to be a suitable tool to foster sustainable e-waste management. In the future, collaborative andmultidisciplinary approaches encompassing product design, production development and sustainableconsumption are needed in order to achieve fully-integrated sustainable e-waste management.
Acknowledgments: This work is funded by VINNOVA (Swedish Agency for Innovation Systems) through theWEEE ID project. The work has been carried out within the Sustainable Production Initiative and the ProductionArea of Advance at Chalmers. The support is gratefully acknowledged. The authors thank the five companyrepresentatives who contributed to this study by providing specific feedback on their perceived usefulnessof the decision support methodology: Björn Hall, Göran Lundholm, Magnus Nilsson, Johanna Reimers andMartin Seeger.
Author Contributions: Ilaria Barletta designed the study, conducted the analyses and wrote the manuscript.Jon Larborn developed the simulation model and its visualization. Mahesh Mani advised on the researchmethodology of the study and improved the quality of the written manuscript. Björn Johansson established theresearch direction and contributed to the writing of the manuscript.
Conflicts of Interest: The authors declare no conflict of interest.
References
1. United Nations University. World E-Waste Map Reveals National Volumes, International Flows. Availableonline: http://unu.edu/media-relations/releases/step-launches-interactive-world-e-waste-map.html#info(accessed on 30 October 2015).
2. European Commission (EC). Waste Electrical and Electronic Equipment Directive 2012/19/EU; EuropeanCommission: Strasbourg, 2003.
3. Slaper, T.F.; Hall, T.J. The triple bottom line: What is it and how does it work? Indiana Bus. Rev. 2011, 86, 4–8.4. The University of Illinois at Urbana-Champaign Sustainable Technology Center. Strategies for Improving the
Sustainability of E-Waste Management Systems. 2009. Available online: http://www.sustainelectronics.illinois.edu/concept_paper.pdf (accessed on 5 December 2015).
5. Huisman, J.; Stevels, A.; Marinelli, T.; Magalini, F. Where did WEEE go wrong in europe? Practical andacademic lessons for the US. In Proceedings of the 2006 IEEE International Symposium on Electronics andthe Environment, Scottsdale, AZ, USA, 8–11 May 2006; IEEE: Scottsdale, AZ, USA, 2006; pp. 83–88.
6. Ongondo, F.O.; Williams, I.D.; Cherrett, T.J. How are weee doing? A global review of the management ofelectrical and electronic wastes. Waste Manag. 2011, 31, 714–730. [CrossRef] [PubMed]
7. Chancerel, P.; Meskers, C.E.; Hagelüken, C.; Rotter, V.S. Assessment of precious metal flows duringpreprocessing of waste electrical and electronic equipment. J. Ind. Ecol. 2009, 13, 791–810. [CrossRef]
8. Tsydenova, O.; Bengtsson, M. Chemical hazards associated with treatment of waste electrical and electronicequipment. Waste Manag. 2011, 31, 45–58. [CrossRef] [PubMed]
9. Cui, J.; Forssberg, E. Mechanical recycling of waste electric and electronic equipment: A review.J. Hazard. Mater. 2003, 99, 243–263. [CrossRef]

Sustainability 2016, 8, 84 19 of 20
10. Vongbunyong, S.; Kara, S.; Pagnucco, M. Learning and revision in cognitive robotics disassembly automation.Robot. Comput. Integr. Manuf. 2015, 34, 79–94. [CrossRef]
11. Schluep, M.; Hagelüken, C.; Meskers, C.; Magalini, F.; Wang, F.; Müller, E.; Kuehr, R.; Maurer, C.;Sonnemann, G. Market potential of innovative e-waste recycling technologies in developing countries.In Proceedings of the R’09 Twin World Congress & World Resources Forum, Davos, Switzerland, 14–16September 2009.
12. Barletta, I.; Johansson, B.; Reimers, J.; Stahre, J.; Berlin, C. Prerequisites for a high-level framework to designsustainable plants in the e-waste supply chain. In Proceedings of the 22nd CIRP Conference on Life CycleEngineering, Sydney, Australia, 7–9 April 2015.
13. Wibowo, S.; Deng, H.; Zhang, X. Evaluating the performance of e-waste recycling programs using fuzzymultiattribute group decision making model. In Proceedings of the 2014 9th IEEE Conference on IndustrialElectronics and Applications ICIEA, Hangzhou, China, 9–11 June 2014; pp. 1989–1994.
14. Wibowo, S.; Deng, H. Multi-criteria group decision making for evaluating the performance of e-wasterecycling programs under uncertainty. Waste Manag. 2015, 40, 127–135. [CrossRef] [PubMed]
15. Song, Q.; Wang, Z.; Li, J. Sustainability evaluation of e-waste treatment based on emergy analysis and the lcamethod: A case study of a trial project in macau. Ecol. Indic. 2013, 30, 138–147. [CrossRef]
16. Hong, J.; Shi, W.; Wang, Y.; Chen, W.; Li, X. Life cycle assessment of electronic waste treatment. Waste Manag.2015, 38, 357–365. [CrossRef] [PubMed]
17. Asampong, E.; Dwuma-Badu, K.; Stephens, J.; Srigboh, R.; Neitzel, R.; Basu, N.; Fobil, J.N. Health seekingbehaviours among electronic waste workers in ghana environmental health. BMC Public Health 2015, 15,1065. [CrossRef] [PubMed]
18. Wittsiepe, J.; Fobil, J.N.; Till, H.; Burchard, G.D.; Wilhelm, M.; Feldt, T. Levels of polychlorinateddibenzo-p-dioxins, dibenzofurans (pcdd/fs) and biphenyls (pcbs) in blood of informal e-waste recyclingworkers from agbogbloshie, ghana, and controls. Environ. Int. 2015, 79, 65–73. [CrossRef] [PubMed]
19. Walther, G.; Spengler, T. Impact of WEEE-directive on reverse logistics in Germany. Int. J. Phys. Distrib.Logist. Manag. 2005, 35, 337–361. [CrossRef]
20. Yin, R. Case Study Research: Design and Methods; Sage publications: Los Angeles, CA, USA, 2013.21. Restructuring Associates Inc.©. Six-Step Problem Solving Model. 2008. Available online:
http://www.yale.edu/bestpractices/resources/docs/problemsolvingmodel.pdf (accessed on 30 October 2015).22. Almannai, B.; Greenough, R.; Kay, J. A decision support tool based on qfd and fmea for the selection of
manufacturing automation technologies. Robot. Comput. Integr. Manuf. 2008, 24, 501–507. [CrossRef]23. Al-Salem, S.M.; Lettieri, P.; Baeyens, J. Recycling and recovery routes of plastic solid waste (psw): A review.
Waste Manag. 2009, 29, 2625–2643. [CrossRef] [PubMed]24. Santoyo-Castelazo, E.; Azapagic, A. Sustainability assessment of energy systems: Integrating environmental,
economic and social aspects. J. Clean. Prod. 2014, 80, 119–138. [CrossRef]25. Cucchiella, F.; D’Adamo, I.; Lenny Koh, S.C.; Rosa, P. Recycling of weees: An economic assessment of present
and future e-waste streams. Renew. Sustain. Energy Rev. 2015, 51, 263–272. [CrossRef]26. Andarani, P.; Goto, N. Potential e-waste generated from households in indonesia using material flow analysis.
J. Mater. Cycles Waste Manag. 2014, 16, 306–320. [CrossRef]27. Babayemi, J.; Sindiku, O.; Osibanjo, O.; Weber, R. Substance flow analysis of polybrominated diphenyl ethers
in plastic from EEE/WEEE in nigeria in the frame of Stockholm convention as a basis for policy advice.Environ. Sci. Pollut. Res. 2015, 22, 14502–14514. [CrossRef] [PubMed]
28. ISO. ISO14044:2006: Environmental Management—life Cycle Assessment—Requirements andGuidelines. Available online: http://www.iso.org/iso/catalogue_detail?csnumber=38498 (accessed on 24December 2015).
29. Global Reporting Initiative (GRI). Sustainability Reporting Guidelines. Available online:https://www.globalreporting.org/resourcelibrary/G3-Guidelines-Incl-Technical-Protocol.pdf (accessedon 24 December 2015).
30. Taghavi, N.; Barletta, I.; Berlin, C. Social implications of introducing innovative technology intoa product-service system: The case of a waste-grading machine in electronic waste management.In Proceedings of the APMS International Conference Advances in Production Management System, Tokyo,Japan, 5–9 September 2015.

Sustainability 2016, 8, 84 20 of 20
31. Jørgensen, A.; Le Bocq, A.; Nazarkina, L.; Hauschild, M. Methodologies for social life cycle assessment. Int. J.Life Cycle Assess. 2008, 13, 96–103. [CrossRef]
32. Zijp, M.; Heijungs, R.; van der Voet, E.; van de Meent, D.; Huijbregts, M.; Hollander, A.; Posthuma, L. Anidentification key for selecting methods for sustainability assessments. Sustainability 2015, 7, 2490–2512.[CrossRef]
33. Ness, B.; Urbel-Piirsalu, E.; Anderberg, S.; Olsson, L. Categorising tools for sustainability assessment.Ecol. Econ. 2007, 60, 498–508. [CrossRef]
34. Alenka, Z.; Jurij, J. The impact of information visualisation on the quality of information in businessdecision-making. Int. J. Technol. Hum. Interact. 2015, 11, 61–79.
35. Blanchard, B.S.; Fabrycky, W.J. Systems Engineering and Analysis, 5th ed.; Prentice Hall: Upper Saddle River,NJ, USA, 2010; pp. 227–231.
36. Finkbeiner, M.; Schau, E.M.; Lehmann, A.; Traverso, M. Towards life cycle sustainability assessment.Sustainability 2010, 2, 3309–3322. [CrossRef]
37. Salvado, M.; Azevedo, S.; Matias, J.; Ferreira, L. Proposal of a sustainability index for the automotive industry.Sustainability 2015, 7, 2113–2144. [CrossRef]
38. Miettinen, K. Survey of methods to visualize alternatives in multiple criteria decision making problems.OR Spectr. 2014, 36, 3–37. [CrossRef]
39. Bryson, J.M. What to do when stakeholders matter: Stakeholder identification and analysis techniques.Public Manag. Rev. 2004, 6, 21–53. [CrossRef]
40. Hans Rosling’s Greatest Hits. The Economist Online 2010, Available online: http://www.economist.com/blogs/babbage/2010/12/data_visualisation (accessed on 30 October 2015).
41. VINNOVA. WEEE ID—Kunskap Och Teknik för Mer Hållbar Återvinning av Elektronikskrot. Availableonline: http://www.vinnova.se/sv/Resultat/Projekt/Effekta/2013-00117/WEEE-ID—kunskap-och-teknik-for-mer-hallbar-atervinning-av-elektronikskrot/ (accessed on 30 October 2015).
42. Hanselman, D.; Littlefield, B. Mastering Matlab 5: A Comprehensive Tutorial and Reference; Englewood Cliffs:Upper Saddle River, NJ, USA, 1998.
43. InvestingAnswers. Gross Profit Margin. Available online: http://www.investinganswers.com/financial-dictionary/ratio-analysis/gross-profit-margin-2076 (accessed on 30 October 2015).
44. Heisinger, K. Essentials of Managerial Accounting; Cengage Learning: Boston, MA, USA, 2009.45. ReCiPe. Recipe. Available online: http://www.lcia-recipe.net/ (accessed on 30 October 2015).46. Maxwell, D. Valuing Natural Capital: Future Proofing Business and Finance; DoShorts: London, UK, 2015.47. Jiu, H.; Pretz, T.; Zhengfu, B. Intelligent solid waste processing using optical sensor based sorting technology.
In Proceedings of the 2010 3rd International Congress on Image and Signal Processing (CISP), Yantai, China,16–18 October 2010; pp. 1657–1661.
48. Goodship, V.; Stevels, A. Waste Electrical and Electronic Equipment (WEEE) Handbook; Woodhead Publishing:Sawston, Cambridge, United Kingdom, 2012; pp. 216–228.
49. Wath, S.B.; Katariya, M.N.; Singh, S.K.; Kanade, G.S.; Vaidya, A.N. Separation of wpcbs by dissolution ofbrominated epoxy resins using dmso and nmp: A comparative study. Chem. Eng. J. 2015, 280, 391–398.[CrossRef]
50. Yeh, C.-H.; Xu, Y. Sustainable planning of e-waste recyclin g activities using fuzzy multicriteria decisionmaking. J. Clean. Prod. 2013, 52, 194–204. [CrossRef]
© 2016 by the authors; licensee MDPI, Basel, Switzerland. This article is an open accessarticle distributed under the terms and conditions of the Creative Commons by Attribution(CC-BY) license (http://creativecommons.org/licenses/by/4.0/).