Embed Size (px)
Citation preview

Towards Global Knowledge Economy:
Recent Achievements and Challenges
Howard ALPERChair of STIC, Canada

International Conditions for strengthening Knowledge Economy
• Gradual easing of global economic and financial crisis: affecting regions and countries proportionately to their knowledge-based competitiveness.
•Technological innovation generation and international transfer of knowledge supported by several factors (protection of IPR, measures against counterfeiting).
• Promotion of democracy, rule of law, accompanied by social innovation, less burdened by ideology.

Global Orientation towards Knowledge Economy
Encouraging outlook at country level: - many countries now realizing: no alternative to knowledge-based international competitiveness:
- long-term visions, projections & foresight: e.g. South Africa 2030 Strategy; Qatar Vision 2030;- KE orientation is usually manifested equally in all domains: e.g. South Korea spending on education over 8% of GDP, and almost 4% on R&D
- improving national coordination between development oriented ministries (e.g.: recently established Korean Ministry for Science, ICT and Future Planning)
-International bodies raising awareness, monitoring and promoting good practice:- OECD annual Forum on KE (just now in Istanbul)- World Bank Institute – providing training, coaching on knowledge economy policies- UN System with its specialized agencies including UNESCO, UNCTAD, WIPO.- G-8, G-20 contributing to global management of resources to address major challenges
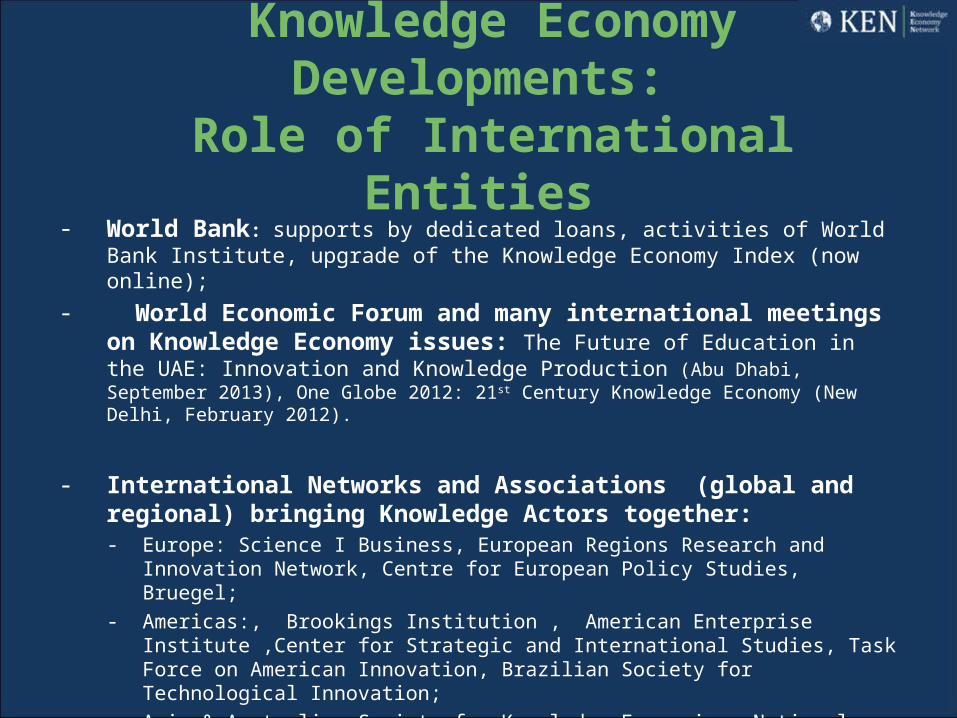
Knowledge Economy Developments: Role of International Entities
- World Bank: supports by dedicated loans, activities of World Bank Institute, upgrade of the Knowledge Economy Index (now online);
- World Economic Forum and many international meetings on Knowledge Economy issues: The Future of Education in the UAE: Innovation and Knowledge Production (Abu Dhabi, September 2013), One Globe 2012: 21st Century Knowledge Economy (New Delhi, February 2012).
- International Networks and Associations (global and regional) bringing Knowledge Actors together: - Europe: Science I Business, European Regions Research and Innovation Network,
Centre for European Policy Studies, Bruegel; - Americas:, Brookings Institution , American Enterprise Institute ,Center for Strategic
and International Studies, Task Force on American Innovation, Brazilian Society for Technological Innovation;
- Asia & Australia: Society for Knowledge Economics, National Research Council for Economics, Humanities and Social Sciences;
- Africa and Middle East: Arabian Knowledge Economy Association.

Linking Four Pillars ofKnowledge Economy
• The four pillars are: education, R&D, innovation, and entrepreneurship.
• Business-Academia Partnerships are growing in most jurisdictions , and slowly overcoming traditional “culture gap” via: university spin-offs, incubators, science and technology parks, clusters, centers of excellence.
• Regional Development Agencies link knowledge actors and facilitate their collaboration, by providing project development and management support, and resolving challenges in project implementation.

A) Education and Training
-- Growing student populations (less in Europe) and posing great challenges: sustainable funding, attracting best staff, influencing student choices, receptor capacity-- Growing realization about needed quicker adjustment of education systems to skill requirements of 21st Century labour market – reforms and adopted strategies, but slow implementation;-- In spite of recent financial crisis most governments maintain public funding of education – but dilemma: across the board or support the best more?;-- Efforts to modernize post-secondary education: improve quality of teaching, emphasis on competence building and pedagogical skills of professors, link with quality research, student’s practical experience, curriculum flexibility;-- Involving stakeholders in curriculum development;-- Rationalisation by merging universities (e.g.: Denmark from 12 to 6-8);
Knowledge Economy Developments: Indications of Progress in the 4 Domains

-- Stronger government commitment to R&D funding (EU member states renewed 3% GERD commitment for 2014-2020 Perspective, but many countries squeezed by budgetary limits ; -- Integrating R&D capabilities through long-term partnerships between corporate R&D units, universities, and research institutes – at national and international level;-- Innovative funding instruments, specially VC facilities;
Knowledge Economy Developments:Indications of Progress in the 4 Domains
B) Research and Development

Percentage of out-of-school children of lower secondary school age by region, 1999 and 2009
In 2009, 67.2 million children of primary school age (31.8 million boys and 35.4 million girls) and 71.6 million children of lower secondary school age (34.2 million boys and 37.4 million girls) were out of school, which means that they were enrolled neither in primary nor secondary education.
These children represent 10% of the global primary school-age population and 17% of the global lower secondary school-age population. The distribution of children who are of lower secondary school age and who are out of school is shown by region.
In 2009, 67.2 million children of primary school age (31.8 million boys and 35.4 million girls) and 71.6 million children of lower secondary school age (34.2 million boys and 37.4 million girls) were out of school, which means that they were enrolled neither in primary nor secondary education. These children represent 10% of the global primary school-age population and 17% of the global lower secondary school-age population. The distribution of children who are of lower secondary school age and who are out of school is shown by region.

-- overall growth of R&D investment (2007-2001 GERD from 1.85 to 2.03%) but 11 countries experiencing decline - but committment to 3% within 2020 Strategy; -- BERD grew in this period from 1.18 to 1.27%;-- important inflow of R&D foreign investment: US companies’ spending in Europe 10 x bigger than in China & India together;-- EU Innovation Union: emphasis on systemic conditions and access to capital in order to have more high-growth,ICT and other technology-based companies
Regional Features - Europe

Regional Features – Asia & Africa
• Research and development spending has risen rapidly in Asia, particularly in China, which is now the world’s second R&D spender behind the United States.
•Asia stands out as the region in which R&D spending has grown faster than GDP, resulting in a greater R&D intensity. China's R&D-to-GDP ratio has more than doubled from 0.8 percent in 1999 to be 1.7 percent in 2009, and is almost on par with other GR7 countries, such as the UK. Another fast Asian riser is South Korea, which, together with Japan, is the GR7 country with the highest R&D-to-GDP ratio, greater than 3 percent.
•South Africa is, perhaps not surprisingly, the African country that devotes most resources to R&D. With GERD of almost five billion PPP$, South Africa spends 8.5 times more on R&D than Africa’s most populous country, Nigeria. On a per capita basis, the gap is 26 times. It should, however, be borne n mind that the Nigerian survey did not cover the business enterprise sector, so the gap is probably smaller. Apart from South Africa, there are two countries that stand out in this comparison: Malawi and Uganda. Both countries have an R&D density (GERD/GDP ratio) of over 1% (1.70% and 1.10%, respectively). For the other countries, the percentages range from 0.20% to 0.48%.

Knowledge Economy Developments: Indications of Progress by 4 Domains
C) Innovation
-- Innovation policies depend on countries’ ability to reform, invest and transform;-- Better understanding of the nature of modern innovation process – non-technical and technical innovation; -- Open and inclusive innovation; involving larger society, addressing employment and social concerns;

Knowledge Economy Developments: Indications of Progress by 4 Domains
C) Innovation
-- Innovation policies depend on countries’ ability to reform, invest and transform (European Commission);-- Economic impact of innovation: index ranges between 0.2 and 0.7 (average EU-27 was 0.61) dividing countries into 4 categories (in the first being: CH, DK, FIN, GER, SWE, IRL, and UK; in the last: POL, GR, LITH, CRO and BUL);
• Asia's increased innovation spending is most prominently related to information and communication technologies. Overall, the Chinese and Korean economies are still not specialised in knowledge-intensive goods and services.Furthermore, China in particular is not (so far) capturing much value from its role as a manufacturer and exporter of high-tech goods; China remains mostly an assembler of goods, the value of which is created elsewhere.
• It would be wrong to ignore China's innovation potential on the basis of its current performance. Its clear innovation ambitions are likely to drive its future growth.
• Europe is struggling much more than the US to retain its place at the global innovation table. The EU should use Asia’s capacity building in innovation as an opportunity for value capture.

Knowledge Economy Developments: Indications of Progress by 4 Domains
D) Entrepreneurship
- Creation of business-friendly political, legal and financial environment; - More elaborate support mechanisms to start-ups, SMEs;- Improved entrepreneurship education, emphasis on values.

Venture Capital as a Percentage of GDP, 2009
Source: State of the Nation 2012, Canada’s Science, Technology and Innovation System: Aspiring to Global Leadership

Educational attainment historic increase – SA well ahead of Brazil, China and India
Average years of schooling attained by young adults aged 25-29 years have increased by about one year every decade since 1960. Between 1960 and 2010, young South Africans have reduced by half the gap vis-à-vis the United States (was 5:11, now 10:13 years).
E-learning is recognized as an invaluable aspect of the modern economy, yet huge disparities with
ICT coverage exist in South Africa. For example, 60% of schools have a computer center in Western Cape, while only 10% in Eastern Cape. The share of capital expenditure in total expenditure on public institutions has continued to rise: from 1.1% in 2003 to 4% in 2009, but OECD countries spent on average 9%, while South Korea (PISA leader) spent 16.8%.

Share of 25-34 year-olds with a tertiary degree across OECD and G20 countries
(excepted 50% growth 2010-2020)
•In 2009, the US established a goal to become the nation with the highest proportion of 25-34 year old university graduates by 2020.•The EU established a goal to increase the percentage of 30-34 year olds who completed tertiary education by at least 40% by 2020. Some countries, such as Sweden, have reached the goal for the larger 25-34 year old population already.•Meanwhile, China – which has quintupled its number of tertiary graduates and doubled its number of tertiary institutions since 2000, is also pursuing ambitious objectives. By 2020, China aims for 20% of its citizens – or 195 million people – to have higher education degrees. That is roughly equal to the entire projected population of 25-64 years olds in the US in 2020.

Education performance of 15 year olds (Pisa Score) – Asia triumphant

Global Enrollment Trends• In Europe, overall participation rates in higher education have increased by 25% on average
between 1998 and 2006 – (in Poland by 90%) – significant differences across countries and disciplines: science & technology losing attractiveness in some jurisdictions
• In 2008, 66 female tertiary students for every 100 male students in Sub-Saharan Africa and 76 in South Asia. Sub-Saharan Africa is the only region where growth in male tertiary enrollment has outpaced female enrollment growth, especially for doctoral degrees. In South Asia, only 82 girls are enrolled for every 100 boys.
• Women participation progressed, with European average 123 women enrolled for every 100 men. In the US and Israel, girls obtain better grades in all major school subjects, including math and science. In France, women are the majority in enrollments at the elite Grandes Ecoles de Commerce (business schools).
• However, in Middle East and North Africa, 91 girls are enrolled for every 100 boys. But current trend continues, gender parity could be achieved by 2015.
• By 2015, it is estimated that the gender parity target will be missed by 6 million girls out of school. Most of them - 3.8 million - will be in Sub-Saharan Africa.
• More and more students choose to continue their academic career in Africa. Three main hubs South Africa for English speaking students, Morocco for Francophone students and Angola for Portuguese speaking.
• South Africa, a regional center for higher education & research, the most popular destination after France, with 57.000 students enrolled in higher education. South Africa accounts for 15.1% of the mobility of students from the African continent.

Enrollment trends, cont‘ed
• Studies have shown that in India, states that have a higher number of women in the work force are precisely those states that are growing faster and lifting people out of poverty.
• Sub-Saharan Africa would have almost doubled its average annual growth between 1960 and 1992 if it had closed the gender gap in schooling at the pace of East Asia.
• East Asia, for example, has closed the gender gap in primary school: fifteen years ago, 93 girls were enrolled for every 100 boys, but already by 2002 no difference!
• In low-income countries, the overall gender gap in primary school completion rates narrowed from 18 percentage points in 1990 to 10 in 2003.
• In North Africa, the literacy rates among women aged 15 to 24 increased by nearly 17% during past decade, from 56 to 73 percent.
• Critically important are available jobs and career advancement. This remains the key problem for many developing countries, and specially Africa is facing serious brain drain.

South Africa’s progress in gender diversity
Fall in Gender gaps in labour force participation
Large increase in parliamentary seats occupied by women - one of the highest proportions (nearly 45%) of female members of parliament worldwide.
Yet women remain underrepresented in senior management in the private sector with only 13% of women on boards in listed companies.

Global Education Trends
• In the past 50 years, college graduation rates in developed countries have increased nearly 200 percent.
Populations (25-34 years) with post-secondary education (top 11):1. Korea: 60 %2. Canada : 55 percent3. Japan: 44 percent4. Russian Federation: 55% 5-7. Ireland, Norway, New Zealand : 47 percent
• 8-11. Luxemburg, UK, Australia,and Denmark: 45%

Structure of Expenditure on core educational services, R&D and ancillary services in tertiary
ed.institutions in 2010 (% GDP)
Countries spending more on R&D: SWE, CAN, FIN, NOR, CH, UK, NL, …

Entrepreneurship Revolution
• It is increasingly understood that the innovation process has changed fundamentally, and unless elements of entrepreneurship and marketing are present from early stages, even highly relevant, new knowledge may remain only an idle invention, isolated from economic processes.
• Even in countries where entrepreneurship used to be poorly understood, now it is appreciated as a principal driver of change and development (e.g.: China). It is taught as part of regular curricula at secondary and tertiary education in many countries of the world. Growth of specialized training of management and innovative entrepreneurship by sectors.

Top 30 in KEN Country Rankings, 2007 – 20132007 Ranking 2007 2008 2009 2012 2013 change 2007-2013 2013 Ranking1.United States 1 1 6 6 6 -5 1. SWITZERLAND2.Denmark 2 3 2 4 9 -7 2. SWEDEN3.Sweden 3 2 1 1 2 1 3. NETHERLANDS4.United Kingdom 4 7 10 13 4 0 4. UK5.Switzerland 5 4 5 3 1 4 5. FINLAND6.Germany 6 9 12 12 13 -7 6. USA7.Netherlands 7 5 4 5 3 4 7. SINGAPORE8.Finland 8 6 3 2 5 3 8. HONG KONG9.Canada 9 8 8 8 10 -1 9. DENMARK10.Taiwan, China 10 16 19 11 NA NA 10. CANADA11.Japan 11 15 16 18 20 -9 11. IRELAND12.Singapore 12 11 9 7 7 5 12. NORWAY13.Norway 13 10 7 9 12 1 13. GERMANY14.Australia 14 12 13 15 16 -2 14. ISRAEL15.Hong Kong SAR 15 14 11 10 8 7 15. NEW ZEALAND16.Austria 16 13 15 16 21 -5 16. AUSTRALIA17.France 17 20 20 21 19 -2 17. BELGIUM18.New Zealand 18 21 14 14 15 3 18. KOREA REP.19.Belgium 19 18 18 19 17 2 19. FRANCE20.Ireland 20 17 17 17 11 9 20. JAPAN21.Korea, Rep. 21 19 21 20 18 3 21. AUSTRIA22.Israel 22 22 23 22 14 8 22. ESTONIA23.Estonia 23 23 22 23 22 1 23. SPAIN24.Spain 24 24 24 24 23 4 24. CZECH REP.25.Italy 25 26 29 29 25 0 25. ITALY26.Slovenia 26 25 25 26 26 0 26. SLOVENIA27.Portugal 27 28 27 27 29 -2 27. HUNGARY28.Czech Republic 28 27 26 25 24 4 28. MALAYSIA29.Hungary 29 30 31 28 27 2 29. PORTUGAL30.Chile 30 32 32 32 34 -4 30. LATVIA