Embed Size (px)
Citation preview
Towards sustainable sugar sourcing in EuropeWater footprint sustainability assessment (WFSA)August 2011
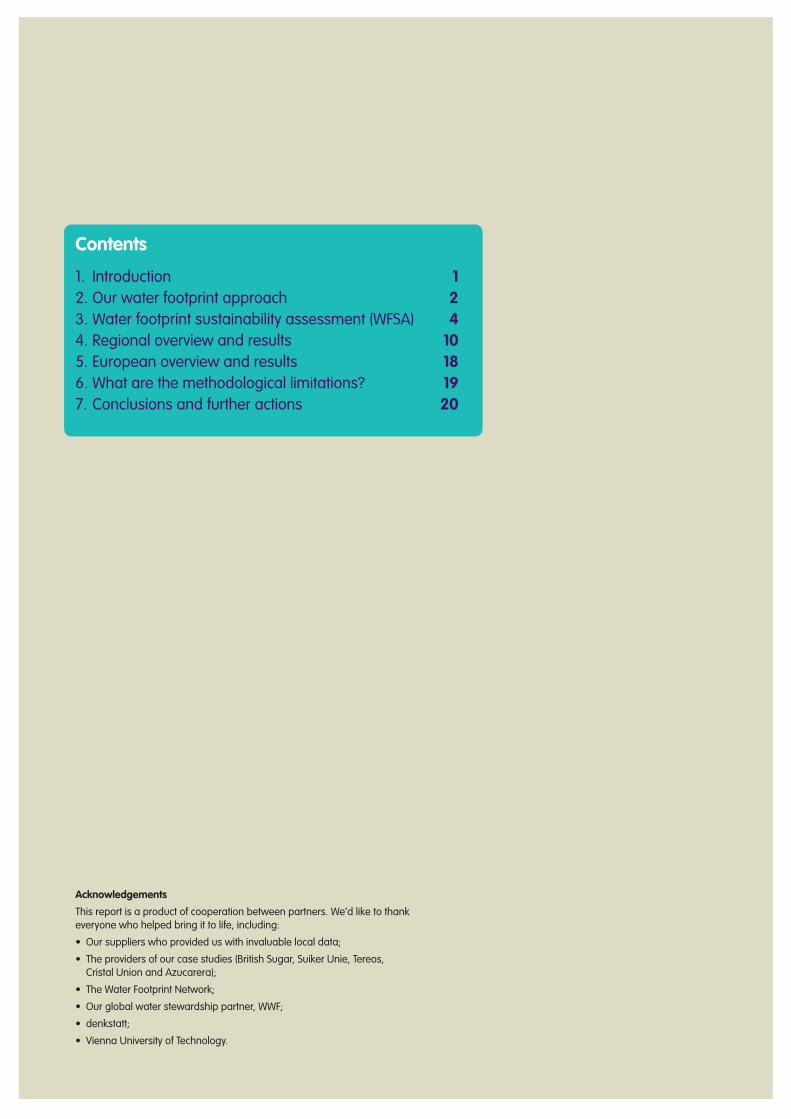
Contents
1. Introduction 12. Our water footprint approach 23. Water footprint sustainability assessment (WFSA) 44. Regional overview and results 105. European overview and results 186. What are the methodological limitations? 197. Conclusions and further actions 20
Acknowledgements
This report is a product of cooperation between partners. We’d like to thank everyone who helped bring it to life, including:
• Our suppliers who provided us with invaluable local data;
• The providers of our case studies (British Sugar, Suiker Unie, Tereos, Cristal Union and Azucarera);
• The Water Footprint Network;
• Our global water stewardship partner, WWF;
• denkstatt;
• Vienna University of Technology.
As a result, we went on to assess the overall water footprint of our sugar use in Europe, which comes to 80% from locally grown beet. In September last year, we published our first summary report, Product Water Footprint Assessments.
Next step: sustainability of our water footprintNow, we are moving to the next stage in our journey, by looking at the sustainability of the water footprint of sugar beet. This is because the key question is not how big is our water footprint, but what is its impact?
Gaining this understanding not only makes environmental sense, but also provides us with clearer guidance on which parts of the supply chain to focus on, and how to prioritise action.
The sustainability of a water footprint entirely depends on local factors: large water footprints can be sustainable in water-rich areas, whereas very small water footprints might compromise sustainability in water-scarce areas.
This report aims to propose a methodology for sustainability impact assessment of water use, and to share key learnings with stakeholders and experts in this field.
There are many challenges ahead. Water footprint analysis and accounting is still an emerging science and intensive cooperation, knowledge-sharing and engagement between all stakeholders is essential if we are to progress.
1The Coca-Cola CompanyWater footprint sustainability assessment (WFSA)
Our global goal is to safely return to nature and to communities an amount of water equivalent to what we use in all of our beverages and their production by 2020. We set this goal for our operations in 2007 and we are making good progress to protect our water resources, reduce our water use ratio, recycle our wastewater and replenish the water use in our finished beverages by participating in locally relevant projects that support communities and nature.
We also aim to actively develop our understanding of water stewardship further, gaining a full picture of the risks facing water resources and the impacts on our business.
Water footprinting is helping us extend our view of how we use water – beyond the gates of the plant and into the entire supply chain. It requires a new way of thinking about water use. Not only what type of water do we use, but when do we use it and where?
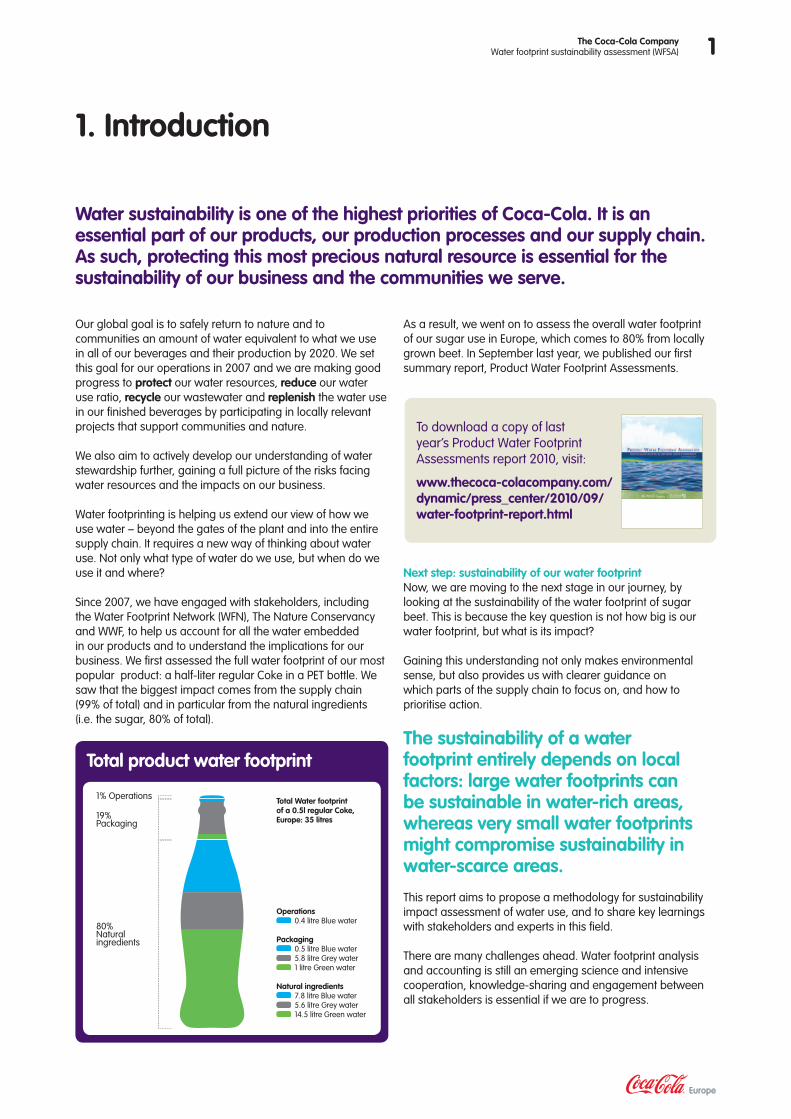
Since 2007, we have engaged with stakeholders, including the Water Footprint Network (WFN), The Nature Conservancy and WWF, to help us account for all the water embedded in our products and to understand the implications for our business. We first assessed the full water footprint of our most popular product: a half-liter regular Coke in a PET bottle. We saw that the biggest impact comes from the supply chain (99% of total) and in particular from the natural ingredients (i.e. the sugar, 80% of total).
1. Introduction
Water sustainability is one of the highest priorities of Coca-Cola. It is an essential part of our products, our production processes and our supply chain. As such, protecting this most precious natural resource is essential for the sustainability of our business and the communities we serve.
To download a copy of last year’s Product Water Footprint Assessments report 2010, visit:
www.thecoca-colacompany.com/dynamic/press_center/2010/09/water-footprint-report.html
80%Natural ingredients
19%Packaging
1% Operations
Operations 0.4 litre Blue water
Packaging 0.5 litre Blue water 5.8 litre Grey water 1 litre Green water
Natural ingredients 7.8 litre Blue water 5.6 litre Grey water 14.5 litre Green water
Total Water footprint of a 0.5l regular Coke, Europe: 35 litres
Total product water footprint
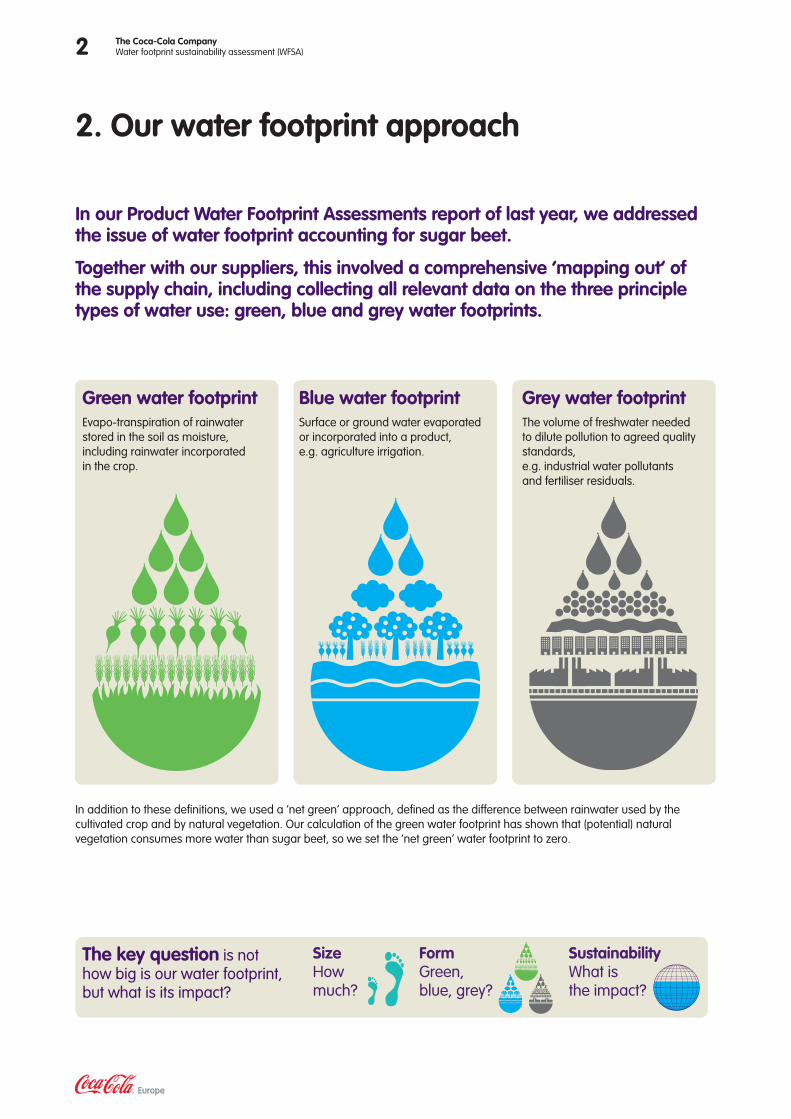
Green water footprintEvapo-transpiration of rainwater stored in the soil as moisture, including rainwater incorporated in the crop.
Grey water footprintThe volume of freshwater needed to dilute pollution to agreed quality standards,e.g. industrial water pollutants and fertiliser residuals.
Blue water footprintSurface or ground water evaporated or incorporated into a product, e.g. agriculture irrigation.
2 The Coca-Cola CompanyWater footprint sustainability assessment (WFSA)
2. Our water footprint approach
In our Product Water Footprint Assessments report of last year, we addressed the issue of water footprint accounting for sugar beet.
Together with our suppliers, this involved a comprehensive ‘mapping out’ of the supply chain, including collecting all relevant data on the three principle types of water use: green, blue and grey water footprints.
In addition to these definitions, we used a ‘net green’ approach, defined as the difference between rainwater used by the cultivated crop and by natural vegetation. Our calculation of the green water footprint has shown that (potential) natural vegetation consumes more water than sugar beet, so we set the ‘net green’ water footprint to zero.
Size How much?
Form Green, blue, grey?
SustainabilityWhat is the impact?
The key question is not how big is our water footprint, but what is its impact?
3The Coca-Cola CompanyWater footprint sustainability assessment (WFSA)
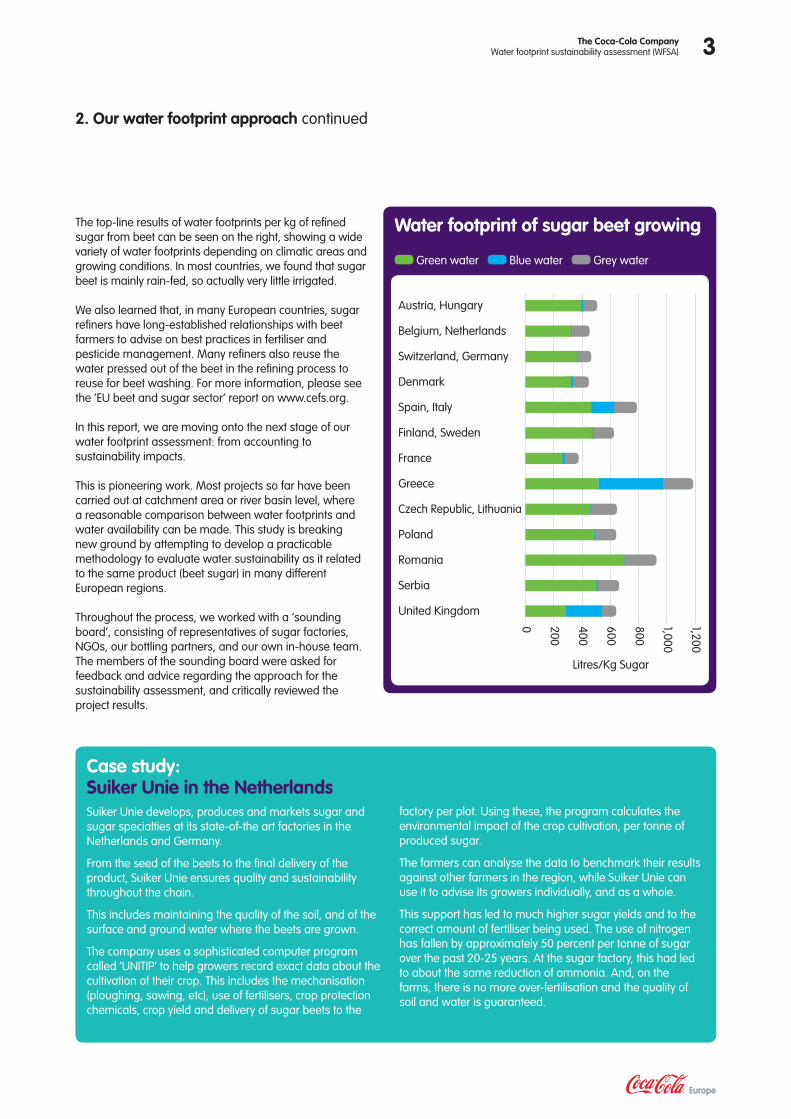
The top-line results of water footprints per kg of refined sugar from beet can be seen on the right, showing a wide variety of water footprints depending on climatic areas and growing conditions. In most countries, we found that sugar beet is mainly rain-fed, so actually very little irrigated.
We also learned that, in many European countries, sugar refiners have long-established relationships with beet farmers to advise on best practices in fertiliser and pesticide management. Many refiners also reuse the water pressed out of the beet in the refining process to reuse for beet washing. For more information, please see the ‘EU beet and sugar sector’ report on www.cefs.org.
In this report, we are moving onto the next stage of our water footprint assessment: from accounting to sustainability impacts.
This is pioneering work. Most projects so far have been carried out at catchment area or river basin level, where a reasonable comparison between water footprints and water availability can be made. This study is breaking new ground by attempting to develop a practicable methodology to evaluate water sustainability as it related to the same product (beet sugar) in many different European regions.
Throughout the process, we worked with a ‘sounding board’, consisting of representatives of sugar factories, NGOs, our bottling partners, and our own in-house team. The members of the sounding board were asked for feedback and advice regarding the approach for the sustainability assessment, and critically reviewed the project results.
2. Our water footprint approach continued
Case study: Suiker Unie in the NetherlandsSuiker Unie develops, produces and markets sugar and sugar specialties at its state-of-the art factories in the Netherlands and Germany.
From the seed of the beets to the final delivery of the product, Suiker Unie ensures quality and sustainability throughout the chain.
This includes maintaining the quality of the soil, and of the surface and ground water where the beets are grown.
The company uses a sophisticated computer program called ‘UNITIP’ to help growers record exact data about the cultivation of their crop. This includes the mechanisation (ploughing, sowing, etc), use of fertilisers, crop protection chemicals, crop yield and delivery of sugar beets to the
factory per plot. Using these, the program calculates the environmental impact of the crop cultivation, per tonne of produced sugar.
The farmers can analyse the data to benchmark their results against other farmers in the region, while Suiker Unie can use it to advise its growers individually, and as a whole.
This support has led to much higher sugar yields and to the correct amount of fertiliser being used. The use of nitrogen has fallen by approximately 50 percent per tonne of sugar over the past 20-25 years. At the sugar factory, this had led to about the same reduction of ammonia. And, on the farms, there is no more over-fertilisation and the quality of soil and water is guaranteed.
Water footprint of sugar beet growing
Green water Blue water Grey water
Litres/Kg Sugar
Austria, Hungary
Belgium, Netherlands
Switzerland, Germany
Denmark
Spain, Italy
Finland, Sweden
France
Greece
Czech Republic, Lithuania
Poland
Romania
Serbia
United Kingdom
0 200
400
600
800
1,000
1,200
4 The Coca-Cola CompanyWater footprint sustainability assessment (WFSA)
A global and local issue Today, nearly one billion people lack access to clean water. If current water consumption patterns continue, two-thirds of the world’s population will live in water-stressed conditions by 2025.
Agriculture plays a fundamental role in the equation. An incredible 70 percent of the total freshwater withdrawn by humans goes to irrigated agricultural use, while agriculture as a whole accounts for 86 percent of worldwide freshwater use.
3. Water footprint sustainability assessment (WFSA)
This makes the ‘embedded water’ of products – the water used in their supply chain and manufacture – all the more important to quantify and control.
Although the limitation of freshwater resources applies at a global level, it varies tremendously at a local level. Therefore, any sustainability assessment of the water footprint of a product such as sugar has to consider the global and local aspects.
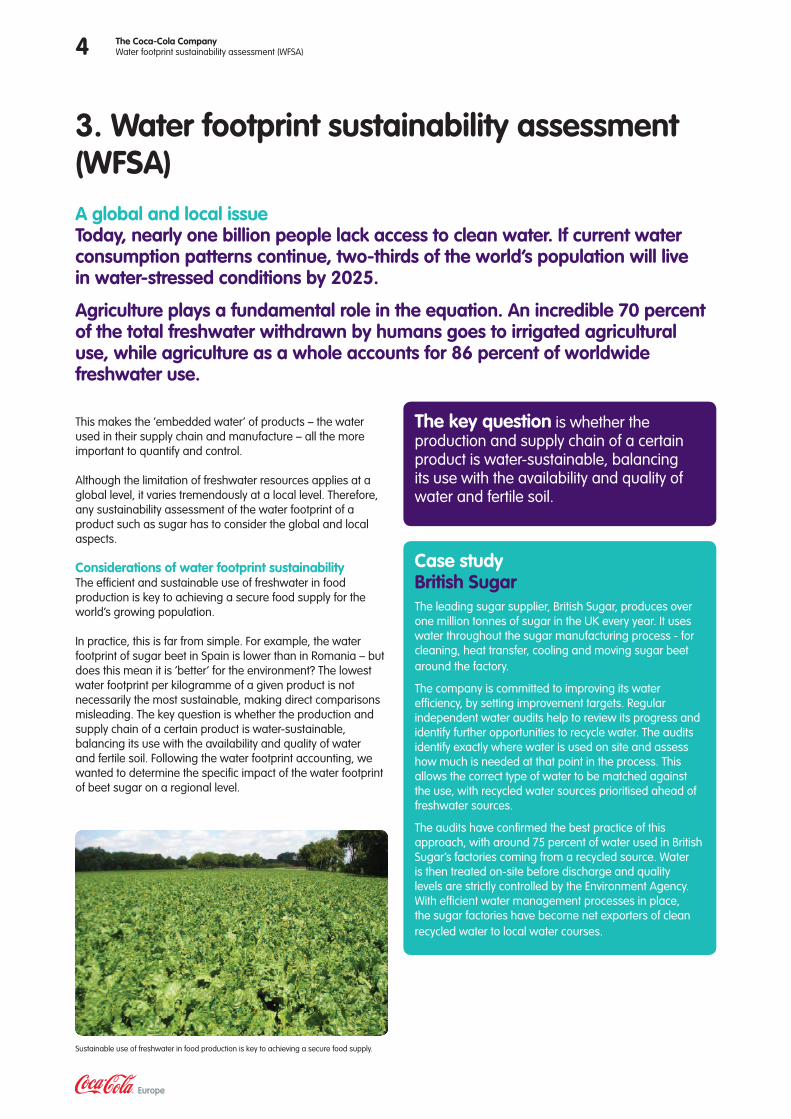
Considerations of water footprint sustainability The efficient and sustainable use of freshwater in food production is key to achieving a secure food supply for the world’s growing population.
In practice, this is far from simple. For example, the water footprint of sugar beet in Spain is lower than in Romania – but does this mean it is ‘better’ for the environment? The lowest water footprint per kilogramme of a given product is not necessarily the most sustainable, making direct comparisons misleading. The key question is whether the production and supply chain of a certain product is water-sustainable, balancing its use with the availability and quality of water and fertile soil. Following the water footprint accounting, we wanted to determine the specific impact of the water footprint of beet sugar on a regional level.
Case study British SugarThe leading sugar supplier, British Sugar, produces over one million tonnes of sugar in the UK every year. It uses water throughout the sugar manufacturing process - for cleaning, heat transfer, cooling and moving sugar beet around the factory.
The company is committed to improving its water efficiency, by setting improvement targets. Regular independent water audits help to review its progress and identify further opportunities to recycle water. The audits identify exactly where water is used on site and assess how much is needed at that point in the process. This allows the correct type of water to be matched against the use, with recycled water sources prioritised ahead of freshwater sources.
The audits have confirmed the best practice of this approach, with around 75 percent of water used in British Sugar’s factories coming from a recycled source. Water is then treated on-site before discharge and quality levels are strictly controlled by the Environment Agency. With efficient water management processes in place, the sugar factories have become net exporters of clean recycled water to local water courses.
Sustainable use of freshwater in food production is key to achieving a secure food supply.
The key question is whether the production and supply chain of a certain product is water-sustainable, balancing its use with the availability and quality of water and fertile soil.
5The Coca-Cola CompanyWater footprint sustainability assessment (WFSA)
3. Water footprint sustainability assessment Selected regions
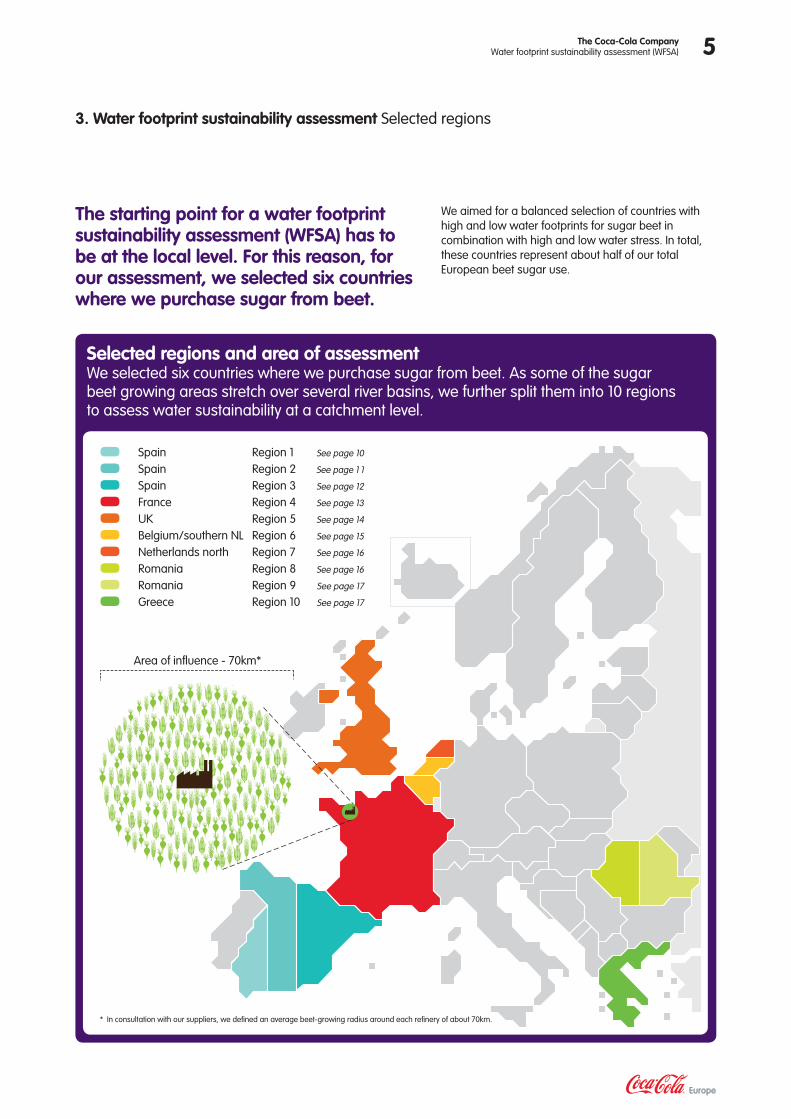
We aimed for a balanced selection of countries with high and low water footprints for sugar beet in combination with high and low water stress. In total, these countries represent about half of our total European beet sugar use.
The starting point for a water footprint sustainability assessment (WFSA) has to be at the local level. For this reason, for our assessment, we selected six countries where we purchase sugar from beet.
Selected regions and area of assessmentWe selected six countries where we purchase sugar from beet. As some of the sugar beet growing areas stretch over several river basins, we further split them into 10 regions to assess water sustainability at a catchment level.
Spain Region 1 See page 10
Spain Region 2 See page 1 1
Spain Region 3 See page 12
France Region 4 See page 13
UK Region 5 See page 14
Belgium/southern NL Region 6 See page 15
Netherlands north Region 7 See page 16
Romania Region 8 See page 16
Romania Region 9 See page 17
Greece Region 10 See page 17
Area of influence - 70km*
* In consultation with our suppliers, we defined an average beet-growing radius around each refinery of about 70km.
6 The Coca-Cola CompanyWater footprint sustainability assessment (WFSA)
3. Water footprint sustainability assessment Considered impacts
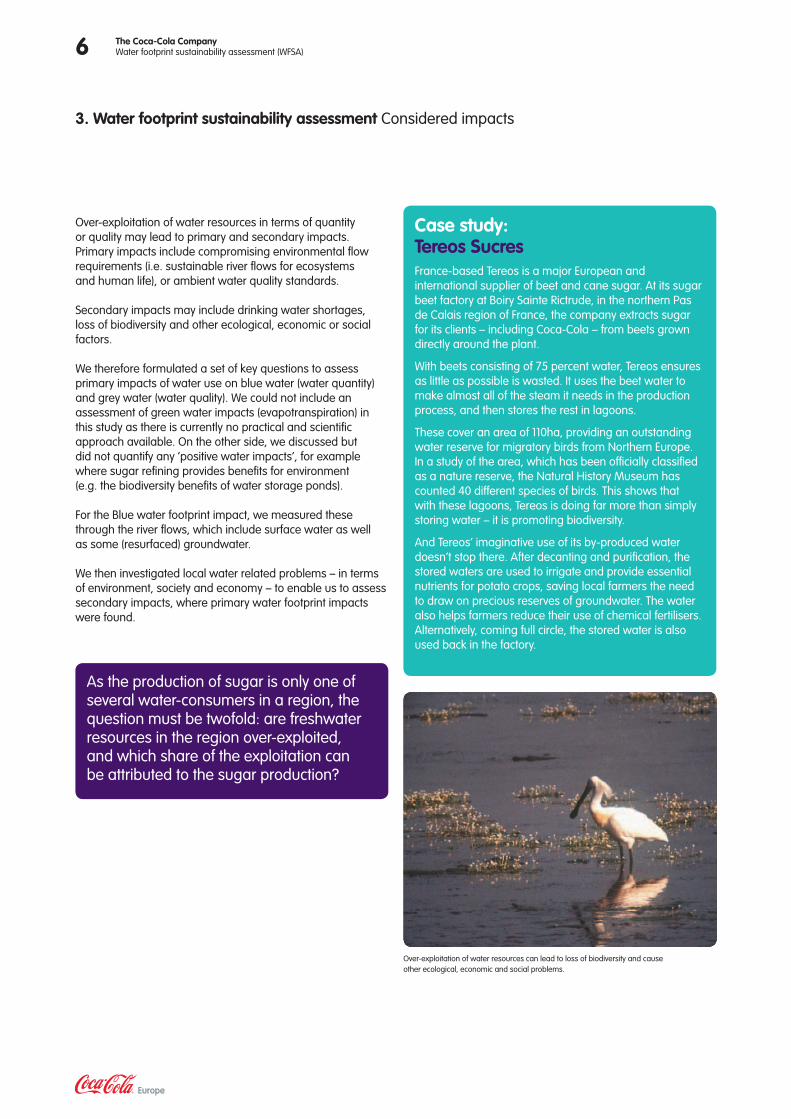
Case study: Tereos SucresFrance-based Tereos is a major European and international supplier of beet and cane sugar. At its sugar beet factory at Boiry Sainte Rictrude, in the northern Pas de Calais region of France, the company extracts sugar for its clients – including Coca-Cola – from beets grown directly around the plant.
With beets consisting of 75 percent water, Tereos ensures as little as possible is wasted. It uses the beet water to make almost all of the steam it needs in the production process, and then stores the rest in lagoons.
These cover an area of 110ha, providing an outstanding water reserve for migratory birds from Northern Europe. In a study of the area, which has been officially classified as a nature reserve, the Natural History Museum has counted 40 different species of birds. This shows that with these lagoons, Tereos is doing far more than simply storing water – it is promoting biodiversity.
And Tereos’ imaginative use of its by-produced water doesn’t stop there. After decanting and purification, the stored waters are used to irrigate and provide essential nutrients for potato crops, saving local farmers the need to draw on precious reserves of groundwater. The water also helps farmers reduce their use of chemical fertilisers. Alternatively, coming full circle, the stored water is also used back in the factory.
Over-exploitation of water resources in terms of quantity or quality may lead to primary and secondary impacts. Primary impacts include compromising environmental flow requirements (i.e. sustainable river flows for ecosystems and human life), or ambient water quality standards.
Secondary impacts may include drinking water shortages, loss of biodiversity and other ecological, economic or social factors.
We therefore formulated a set of key questions to assess primary impacts of water use on blue water (water quantity) and grey water (water quality). We could not include an assessment of green water impacts (evapotranspiration) in this study as there is currently no practical and scientific approach available. On the other side, we discussed but did not quantify any ‘positive water impacts’, for example where sugar refining provides benefits for environment (e.g. the biodiversity benefits of water storage ponds).
For the Blue water footprint impact, we measured these through the river flows, which include surface water as well as some (resurfaced) groundwater.
We then investigated local water related problems – in terms of environment, society and economy – to enable us to assess secondary impacts, where primary water footprint impacts were found.
Over-exploitation of water resources can lead to loss of biodiversity and cause other ecological, economic and social problems.
As the production of sugar is only one of several water-consumers in a region, the question must be twofold: are freshwater resources in the region over-exploited, and which share of the exploitation can be attributed to the sugar production?
7The Coca-Cola CompanyWater footprint sustainability assessment (WFSA)
3. Water footprint sustainability assessment Scope
Case study Cristal UnionCristal Union is a cooperative of French sugar beet growers. Together its members hold about 18 percent of the sugar beet acreage in France and produce around 700,000 tonnes of sugar a year. In addition to producing sugar for its own two popular retail brands, Cristal Union is also a major supplier to the food industry – including Coca-Cola.
To save water and reduce its water footprint, Cristal Union has introduced the agricultural practice of ‘water spreading’ at its sugar plant in Sillery, in France’s Champagne-Ardenne region. This involves collecting run-off from the water used to wash the beets and spreading it across its fields to water the crops.
The local water regulatory authority and ANTEA, an accredited hydro-geological company, helped Cristal Union evaluate the impact of the Sillery plant on local water resources. Working in collaboration with the Water Footprint Network, Cristal Union used scientific data from local
agronomical research and extensive measurements of the water quality to re-calculate the plant’s water footprint. It paid particular attention to the use of water spreading.
The study showed that water spreading, when performed in accordance with the best available technology, can result in a lower water footprint. Unlike fertilisation, which generates a ‘grey’ water footprint by releasing (or leaching) contaminants, water spreading does only partly cause additional leaching. It also replenishes the groundwater, although this effect was not taken into account when the water footprint of the sugar produced at Sillery was re-calculated.
The new water footprint indicates the availability and quality of the local water supply are compatible with Sillery’s sugar-growing activities; and the latest observations show improvements to the local environment.
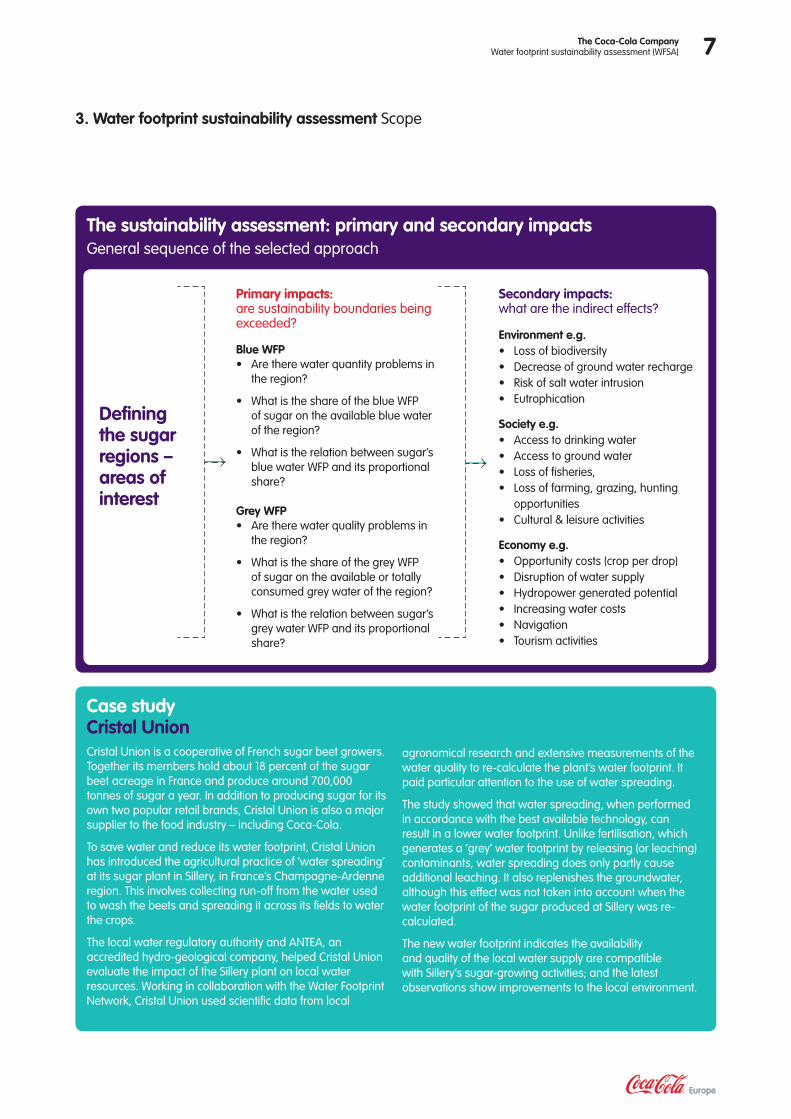
The sustainability assessment: primary and secondary impacts General sequence of the selected approach
Defining the sugar regions – areas of interest
Secondary impacts: what are the indirect effects?
Environment e.g.• Loss of biodiversity• Decrease of ground water recharge• Risk of salt water intrusion• Eutrophication
Society e.g.• Access to drinking water• Access to ground water• Loss of fisheries, • Loss of farming, grazing, hunting
opportunities • Cultural & leisure activities
Economy e.g.• Opportunity costs (crop per drop)• Disruption of water supply• Hydropower generated potential• Increasing water costs• Navigation• Tourism activities
Primary impacts: are sustainability boundaries being exceeded?
Blue WFP• Are there water quantity problems in
the region?
• What is the share of the blue WFP of sugar on the available blue water of the region?
• What is the relation between sugar’s blue water WFP and its proportional share?
Grey WFP • Are there water quality problems in
the region?
• What is the share of the grey WFP of sugar on the available or totally consumed grey water of the region?
• What is the relation between sugar’s grey water WFP and its proportional share?
8 The Coca-Cola CompanyWater footprint sustainability assessment (WFSA)
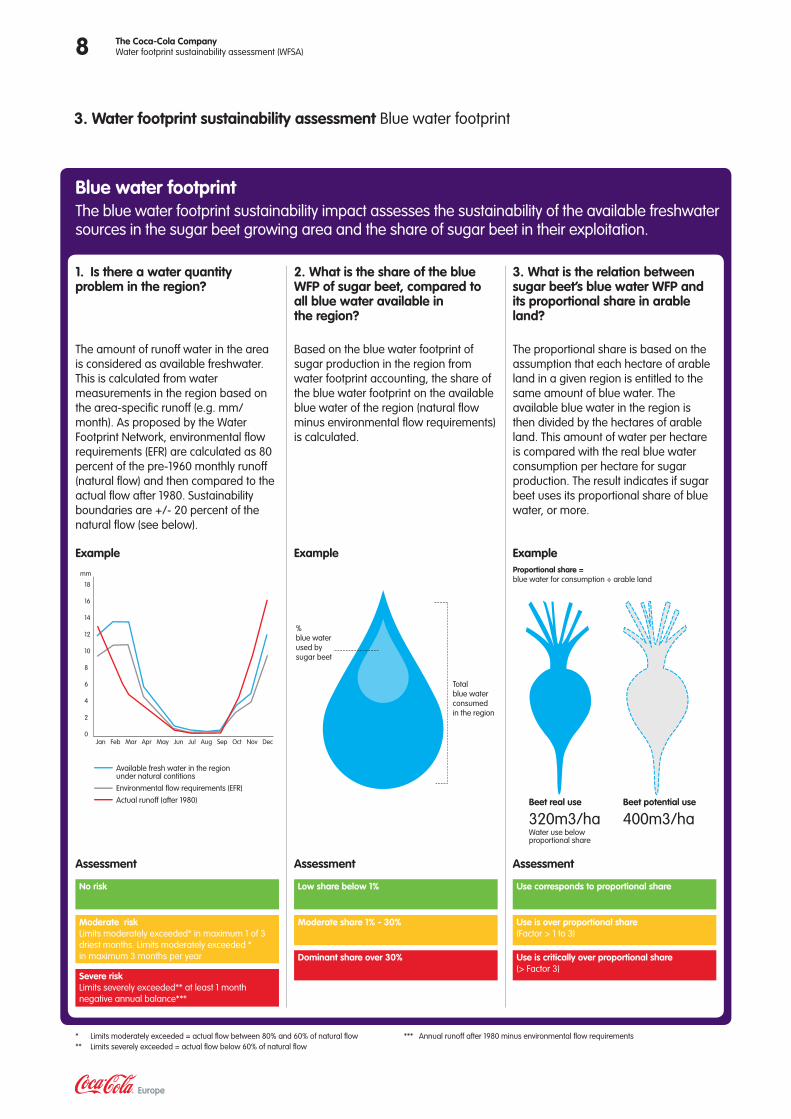
Blue water footprintThe blue water footprint sustainability impact assesses the sustainability of the available freshwater sources in the sugar beet growing area and the share of sugar beet in their exploitation.
3. Water footprint sustainability assessment Blue water footprint
1. Is there a water quantity problem in the region?
The amount of runoff water in the area is considered as available freshwater. This is calculated from water measurements in the region based on the area-specific runoff (e.g. mm/month). As proposed by the Water Footprint Network, environmental flow requirements (EFR) are calculated as 80 percent of the pre-1960 monthly runoff (natural flow) and then compared to the actual flow after 1980. Sustainability boundaries are +/- 20 percent of the natural flow (see below).
3. What is the relation between sugar beet’s blue water WFP and its proportional share in arable land?
The proportional share is based on the assumption that each hectare of arable land in a given region is entitled to the same amount of blue water. The available blue water in the region is then divided by the hectares of arable land. This amount of water per hectare is compared with the real blue water consumption per hectare for sugar production. The result indicates if sugar beet uses its proportional share of blue water, or more.
2. What is the share of the blue WFP of sugar beet, compared to all blue water available in the region?
Based on the blue water footprint of sugar production in the region from water footprint accounting, the share of the blue water footprint on the available blue water of the region (natural flow minus environmental flow requirements) is calculated.
* Limits moderately exceeded = actual flow between 80% and 60% of natural flow** Limits severely exceeded = actual flow below 60% of natural flow
*** Annual runoff after 1980 minus environmental flow requirements
No risk
Moderate riskLimits moderately exceeded* in maximum 1 of 3 driest months. Limits moderately exceeded * in maximum 3 months per year
Severe riskLimits severely exceeded** at least 1 month negative annual balance***
Assessment
Low share below 1%
Moderate share 1% - 30%
Dominant share over 30%
Assessment
Use corresponds to proportional share
Use is over proportional share (Factor > 1 to 3)
Use is critically over proportional share(> Factor 3)
Assessment
Total blue water consumed in the region
% blue water used by sugar beet
Beet real use
320m3/haWater use below proportional share
Beet potential use
400m3/ha
Proportional share = blue water for consumption ÷ arable land
Jan Feb Mar Apr May Jun Jul Aug Sep Oct Nov Dec
18
16
14
12
10
8
6
4
2
0
Available fresh water in the region under natural contitions
Environmental flow requirements (EFR)
Actual runoff (after 1980)
mm
Example Example Example
9The Coca-Cola CompanyWater footprint sustainability assessment (WFSA)
3. Water footprint sustainability assessment Grey water footprint
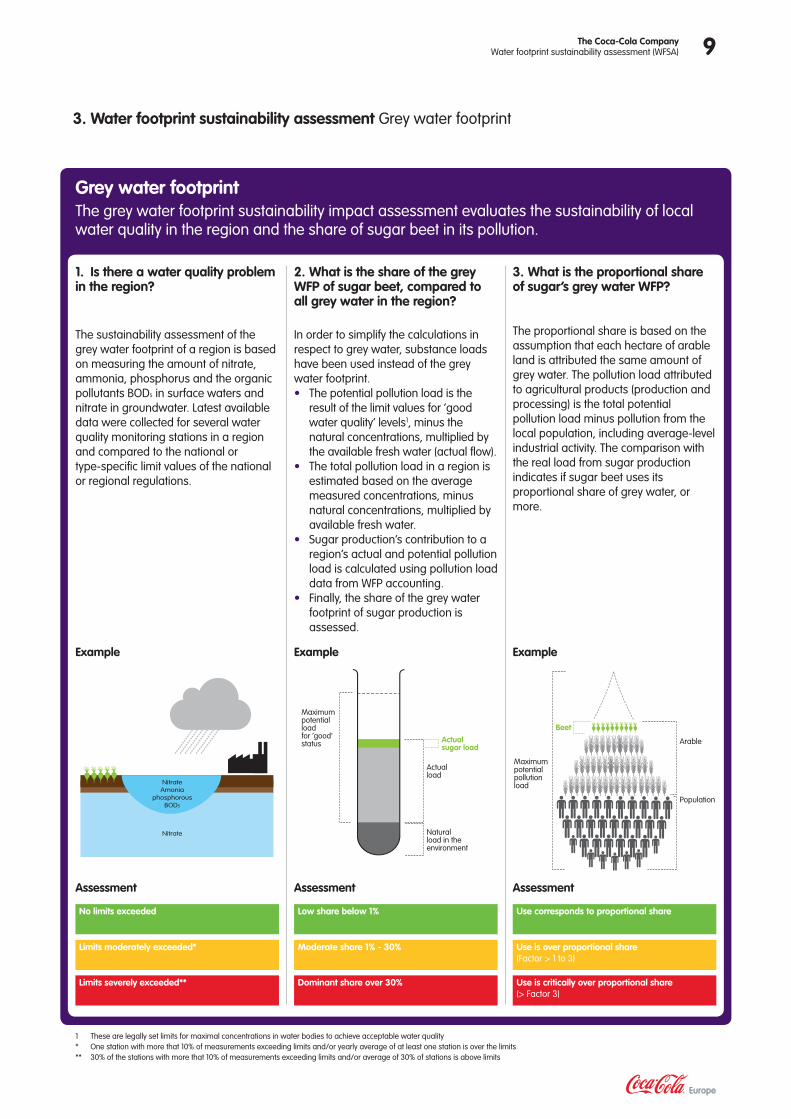
1. Is there a water quality problem in the region?
The sustainability assessment of the grey water footprint of a region is based on measuring the amount of nitrate, ammonia, phosphorus and the organic pollutants BOD5 in surface waters and nitrate in groundwater. Latest available data were collected for several water quality monitoring stations in a region and compared to the national or type-specific limit values of the national or regional regulations.
3. What is the proportional share of sugar’s grey water WFP?
The proportional share is based on the assumption that each hectare of arable land is attributed the same amount of grey water. The pollution load attributed to agricultural products (production and processing) is the total potential pollution load minus pollution from the local population, including average-level industrial activity. The comparison with the real load from sugar production indicates if sugar beet uses its proportional share of grey water, or more.
2. What is the share of the grey WFP of sugar beet, compared to all grey water in the region?
In order to simplify the calculations in respect to grey water, substance loads have been used instead of the grey water footprint. • The potential pollution load is the
result of the limit values for ‘good water quality’ levels1, minus the natural concentrations, multiplied by the available fresh water (actual flow).
• The total pollution load in a region is estimated based on the average measured concentrations, minus natural concentrations, multiplied by available fresh water.
• Sugar production’s contribution to a region’s actual and potential pollution load is calculated using pollution load data from WFP accounting.
• Finally, the share of the grey water footprint of sugar production is assessed.
No limits exceeded
Limits moderately exceeded*
Limits severely exceeded**
Low share below 1%
Moderate share 1% - 30%
Dominant share over 30%
Use corresponds to proportional share
Use is over proportional share (Factor > 1 to 3)
Use is critically over proportional share(> Factor 3)
1 These are legally set limits for maximal concentrations in water bodies to achieve acceptable water quality* One station with more that 10% of measurements exceeding limits and/or yearly average of at least one station is over the limits** 30% of the stations with more that 10% of measurements exceeding limits and/or average of 30% of stations is above limits
Assessment Assessment Assessment
Maximum potential pollutionload
Population
Arable
Beet
Maximum potential loadfor ‘good’ status
Actualload
Actual sugar load
Naturalload in the environment
Nitrate
NitrateAmonia
phosphorousBOD5
Grey water footprintThe grey water footprint sustainability impact assessment evaluates the sustainability of local water quality in the region and the share of sugar beet in its pollution.
Example Example Example
10 The Coca-Cola CompanyWater footprint sustainability assessment (WFSA)
4. Regional overview and results
Using our methodology, we identified a level of risk for each region, based on two main sustainability criteria:
• Is beet sugar production meeting the of environmental flow requirements of surface water (water quantity)?
• Is it meeting the environmental quality standards in surface waters and ground waters?
Regions where sugar production posed a threat to specific sustainability criteria were identified.
These can now serve as models on which we can build detailed investigations, and developing measures to improve the situation.
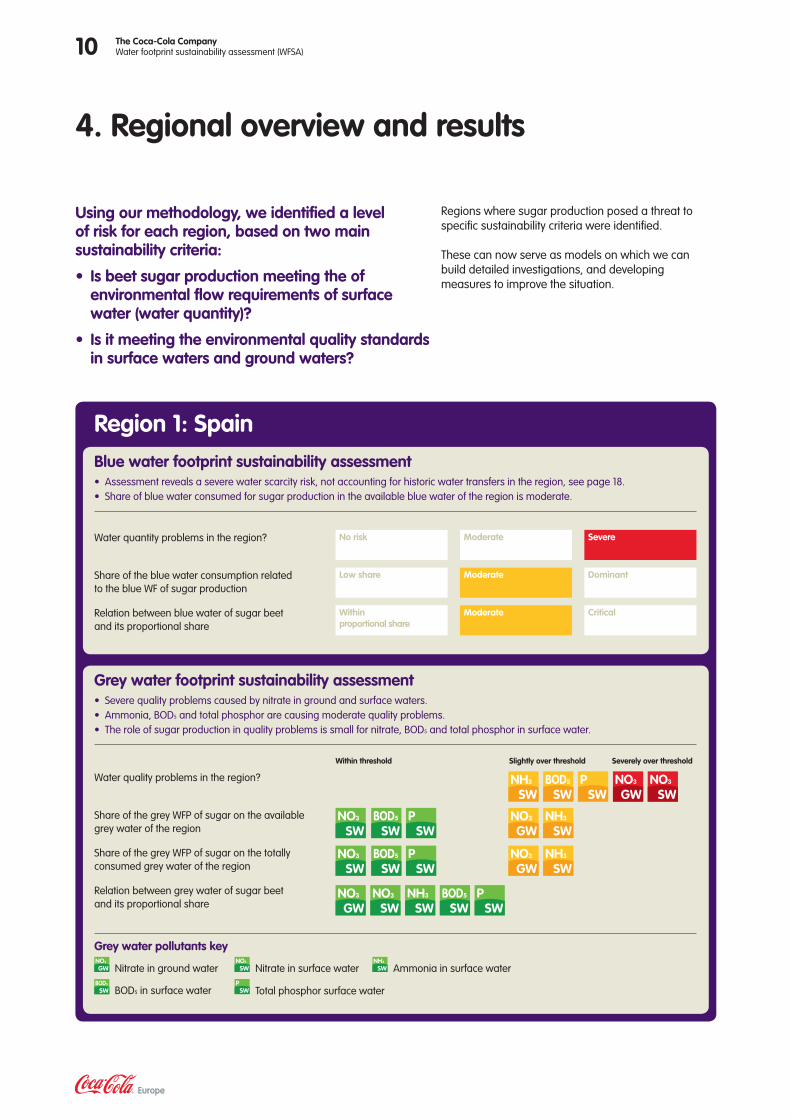
Region 1: Spain
Blue water footprint sustainability assessment• Assessment reveals a severe water scarcity risk, not accounting for historic water transfers in the region, see page 18.• Share of blue water consumed for sugar production in the available blue water of the region is moderate.
Water quantity problems in the region?
Share of the blue water consumption related to the blue WF of sugar production
Relation between blue water of sugar beet and its proportional share
No risk
Low share
Within proportional share
Moderate
Moderate
Moderate
Severe
Dominant
Critical
Grey water footprint sustainability assessment• Severe quality problems caused by nitrate in ground and surface waters. • Ammonia, BOD5 and total phosphor are causing moderate quality problems.• The role of sugar production in quality problems is small for nitrate, BOD5 and total phosphor in surface water.
Within threshold Severely over thresholdSlightly over threshold
Water quality problems in the region?
Share of the grey WFP of sugar on the available grey water of the region
Share of the grey WFP of sugar on the totally consumed grey water of the region
Relation between grey water of sugar beet and its proportional share
NO3
GWNO3
SW
NO3
SWBOD5
SWP
SW
NO3
GWNO3
SWNH3
SWBOD5
SWP
SW
NO3
SWBOD5
SWP
SW
NH3
SWBOD5
SWP
SW
NO3
GWNH3
SW
NO3
GWNH3
SW
Nitrate in ground water Nitrate in surface water Ammonia in surface water
BOD5 in surface water Total phosphor surface water
Grey water pollutants key
11The Coca-Cola CompanyWater footprint sustainability assessment (WFSA)
4. Regional overview and results continued
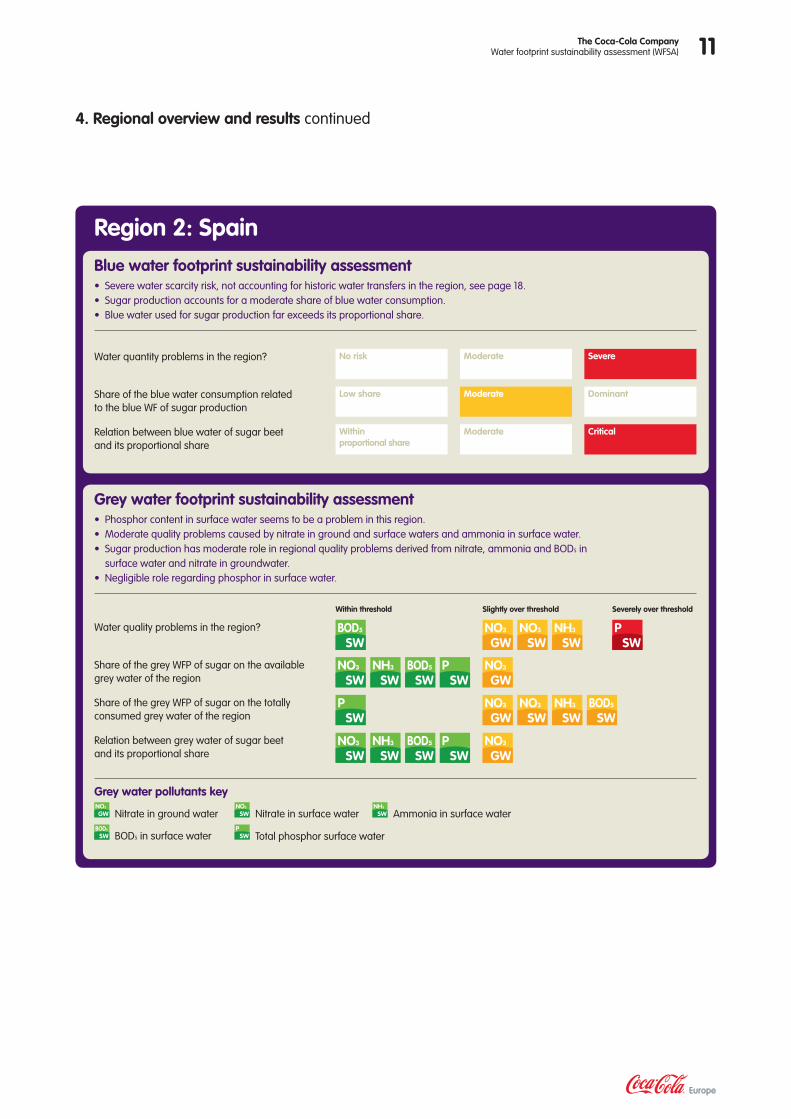
Grey water footprint sustainability assessment• Phosphor content in surface water seems to be a problem in this region. • Moderate quality problems caused by nitrate in ground and surface waters and ammonia in surface water.• Sugar production has moderate role in regional quality problems derived from nitrate, ammonia and BOD5 in
surface water and nitrate in groundwater. • Negligible role regarding phosphor in surface water.
Region 2: Spain
Blue water footprint sustainability assessment• Severe water scarcity risk, not accounting for historic water transfers in the region, see page 18.• Sugar production accounts for a moderate share of blue water consumption. • Blue water used for sugar production far exceeds its proportional share.
Water quantity problems in the region?
Share of the blue water consumption related to the blue WF of sugar production
Relation between blue water of sugar beet and its proportional share
No risk
Low share
Within proportional share
Moderate
Moderate
Moderate
Severe
Dominant
Critical
Water quality problems in the region?
Share of the grey WFP of sugar on the available grey water of the region
Share of the grey WFP of sugar on the totally consumed grey water of the region
Relation between grey water of sugar beet and its proportional share
Within threshold Severely over threshold
BOD5
SWP
SW
NO3
SWNH3
SWBOD5
SWP
SW
PSW
NO3
SWNH3
SWBOD5
SWP
SW
Slightly over threshold
NO3
GWNO3
SWNH3
SW
NO3
GW
NO3
GWNO3
SWNH3
SWBOD5
SW
NO3
GW
Nitrate in ground water Nitrate in surface water Ammonia in surface water
BOD5 in surface water Total phosphor surface water
Grey water pollutants key
12 The Coca-Cola CompanyWater footprint sustainability assessment (WFSA)
4. Regional overview and results continued
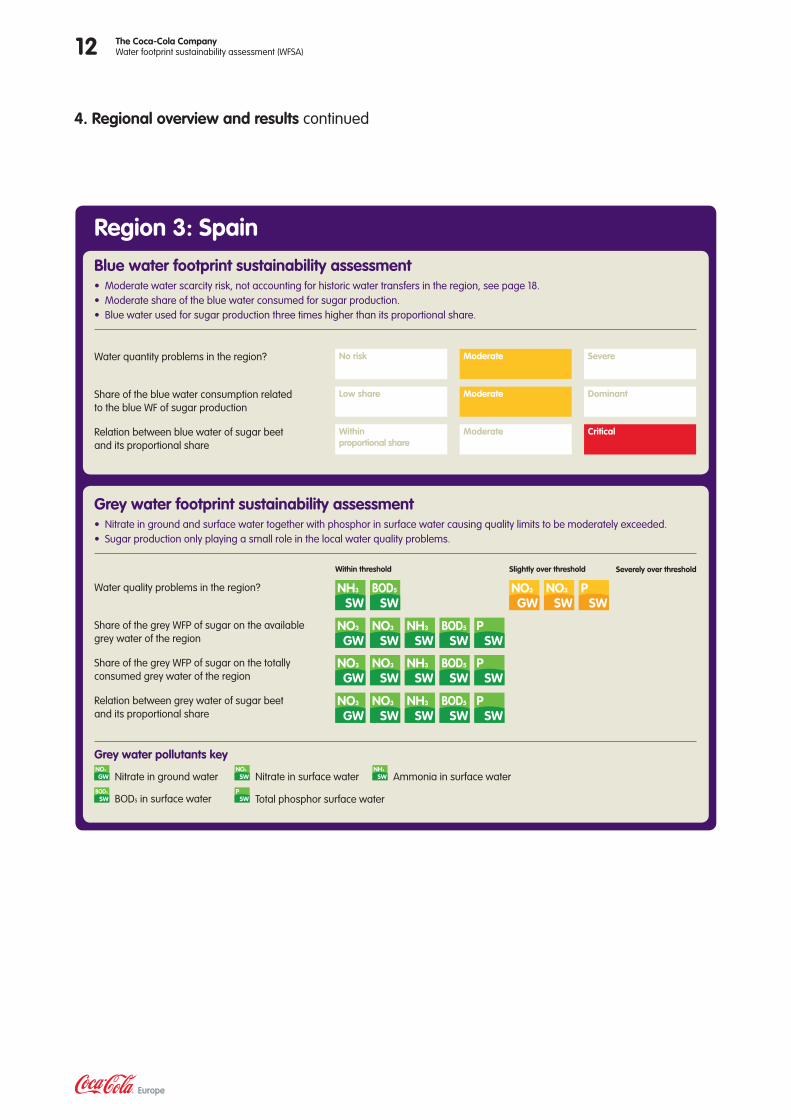
Region 3: Spain
Blue water footprint sustainability assessment• Moderate water scarcity risk, not accounting for historic water transfers in the region, see page 18.• Moderate share of the blue water consumed for sugar production. • Blue water used for sugar production three times higher than its proportional share.
Water quantity problems in the region?
Share of the blue water consumption related to the blue WF of sugar production
Relation between blue water of sugar beet and its proportional share
No risk
Low share
Within proportional share
Moderate
Moderate
Moderate
Severe
Dominant
Critical
Grey water footprint sustainability assessment• Nitrate in ground and surface water together with phosphor in surface water causing quality limits to be moderately exceeded. • Sugar production only playing a small role in the local water quality problems.
Water quality problems in the region?
Share of the grey WFP of sugar on the available grey water of the region
Share of the grey WFP of sugar on the totally consumed grey water of the region
Relation between grey water of sugar beet and its proportional share
Within threshold Slightly over threshold Severely over threshold
BOD5
SWNO3
GWNO3
SWNH3
SWP
SW
NO3
GWNO3
SWNH3
SWBOD5
SWP
SW
NO3
GWNO3
SWNH3
SWBOD5
SWP
SW
NO3
GWNO3
SWNH3
SWBOD5
SWP
SW
Nitrate in ground water Nitrate in surface water Ammonia in surface water
BOD5 in surface water Total phosphor surface water
Grey water pollutants key
13The Coca-Cola CompanyWater footprint sustainability assessment (WFSA)
4. Regional overview and results continued
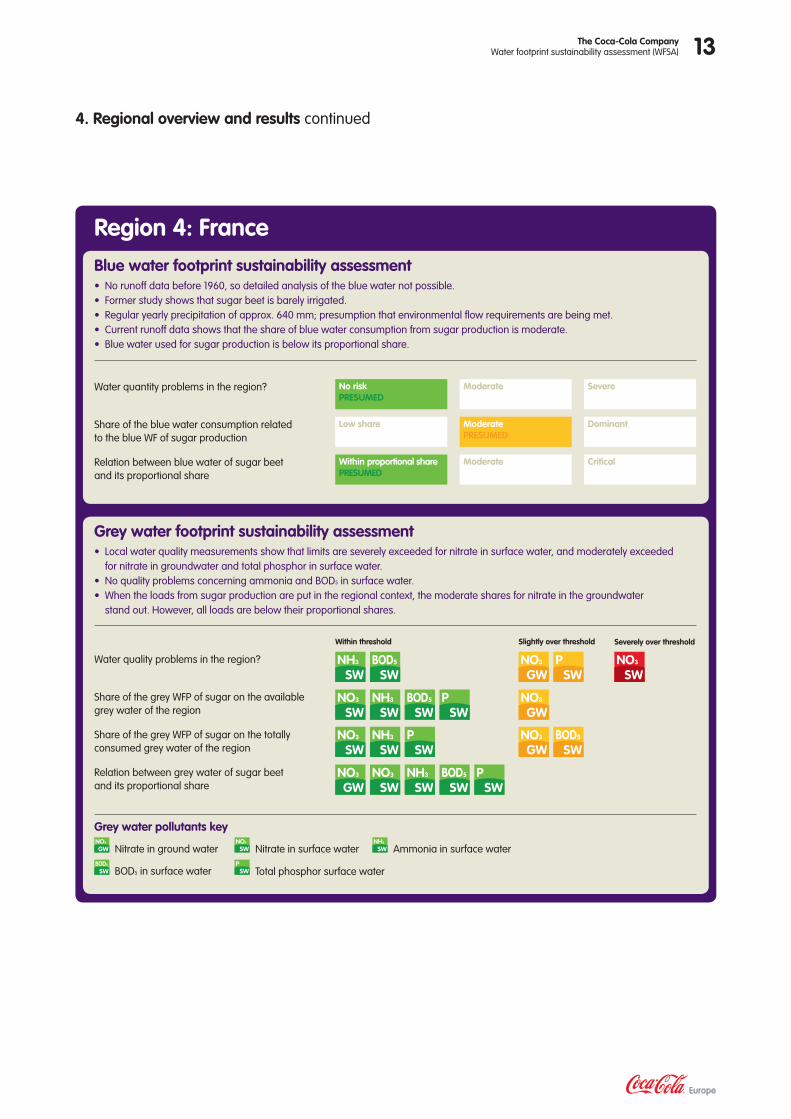
PSW
Grey water footprint sustainability assessment• Local water quality measurements show that limits are severely exceeded for nitrate in surface water, and moderately exceeded
for nitrate in groundwater and total phosphor in surface water. • No quality problems concerning ammonia and BOD5 in surface water.• When the loads from sugar production are put in the regional context, the moderate shares for nitrate in the groundwater
stand out. However, all loads are below their proportional shares.
NH3
SW
Region 4: France
Blue water footprint sustainability assessment• No runoff data before 1960, so detailed analysis of the blue water not possible. • Former study shows that sugar beet is barely irrigated. • Regular yearly precipitation of approx. 640 mm; presumption that environmental flow requirements are being met.• Current runoff data shows that the share of blue water consumption from sugar production is moderate. • Blue water used for sugar production is below its proportional share.
Water quantity problems in the region?
Share of the blue water consumption related to the blue WF of sugar production
Relation between blue water of sugar beet and its proportional share
No risk PRESUMED
Low share
Within proportional share PRESUMED
Moderate
Moderate PRESUMED
Moderate
Severe
Dominant
Critical
Water quality problems in the region?
Share of the grey WFP of sugar on the available grey water of the region
Share of the grey WFP of sugar on the totally consumed grey water of the region
Relation between grey water of sugar beet and its proportional share
Within threshold Slightly over threshold
BOD5
SWNO3
GW
NO3
SWNH3
SWBOD5
SWP
SW
NO3
SWNH3
SWP
SW
NO3
GWNO3
SWNH3
SWBOD5
SWP
SW
Severely over threshold
NO3
SW
NO3
GW
NO3
GWBOD5
SW
Nitrate in ground water Nitrate in surface water Ammonia in surface water
BOD5 in surface water Total phosphor surface water
Grey water pollutants key
14 The Coca-Cola CompanyWater footprint sustainability assessment (WFSA)
4. Regional overview and results continued
NO3
GWNO3
SWBOD5
SWP
SW
NO3
GWNO3
SWNH3
SWBOD5
SWP
SW
NO3
GWNO3
SWNH3
SWBOD5
SWP
SW
NH3
SW
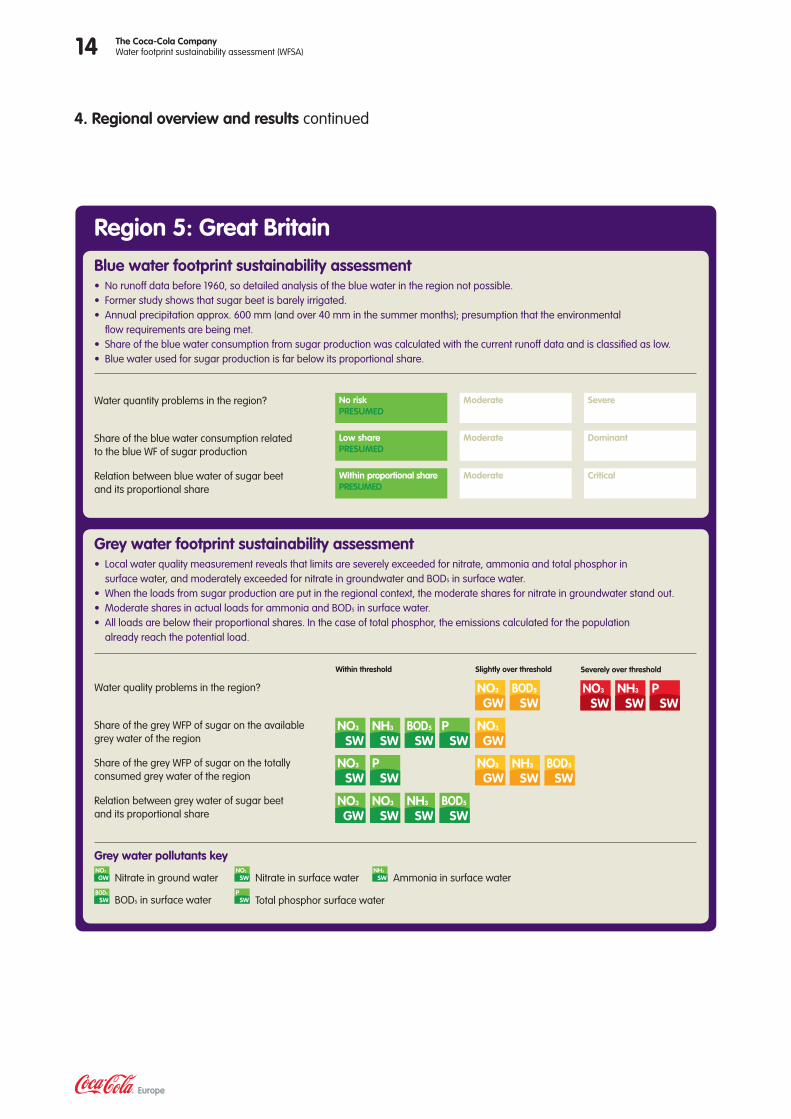
Blue water footprint sustainability assessment• No runoff data before 1960, so detailed analysis of the blue water in the region not possible. • Former study shows that sugar beet is barely irrigated. • Annual precipitation approx. 600 mm (and over 40 mm in the summer months); presumption that the environmental
flow requirements are being met.• Share of the blue water consumption from sugar production was calculated with the current runoff data and is classified as low.• Blue water used for sugar production is far below its proportional share.
Region 5: Great Britain
Water quantity problems in the region?
Share of the blue water consumption related to the blue WF of sugar production
Relation between blue water of sugar beet and its proportional share
No risk PRESUMED
Low sharePRESUMED
Within proportional share PRESUMED
Moderate
Moderate
Moderate
Severe
Dominant
Critical
Grey water footprint sustainability assessment• Local water quality measurement reveals that limits are severely exceeded for nitrate, ammonia and total phosphor in
surface water, and moderately exceeded for nitrate in groundwater and BOD5 in surface water.• When the loads from sugar production are put in the regional context, the moderate shares for nitrate in groundwater stand out. • Moderate shares in actual loads for ammonia and BOD5 in surface water. • All loads are below their proportional shares. In the case of total phosphor, the emissions calculated for the population
already reach the potential load.
Water quality problems in the region?
Share of the grey WFP of sugar on the available grey water of the region
Share of the grey WFP of sugar on the totally consumed grey water of the region
Relation between grey water of sugar beet and its proportional share
Within threshold Slightly over threshold Severely over threshold
NO3
GW
NO3
SWNH3
SWBOD5
SWP
SW
NO3
SWP
SW
NO3
GWNO3
SWNH3
SWBOD5
SW
NO3
GW
NO3
GW
BOD5
SWNO3
SWNH3
SWP
SW
NH3
SWBOD5
SW
Nitrate in ground water Nitrate in surface water Ammonia in surface water
BOD5 in surface water Total phosphor surface water
Grey water pollutants key
15The Coca-Cola CompanyWater footprint sustainability assessment (WFSA)
4. Regional overview and results continued
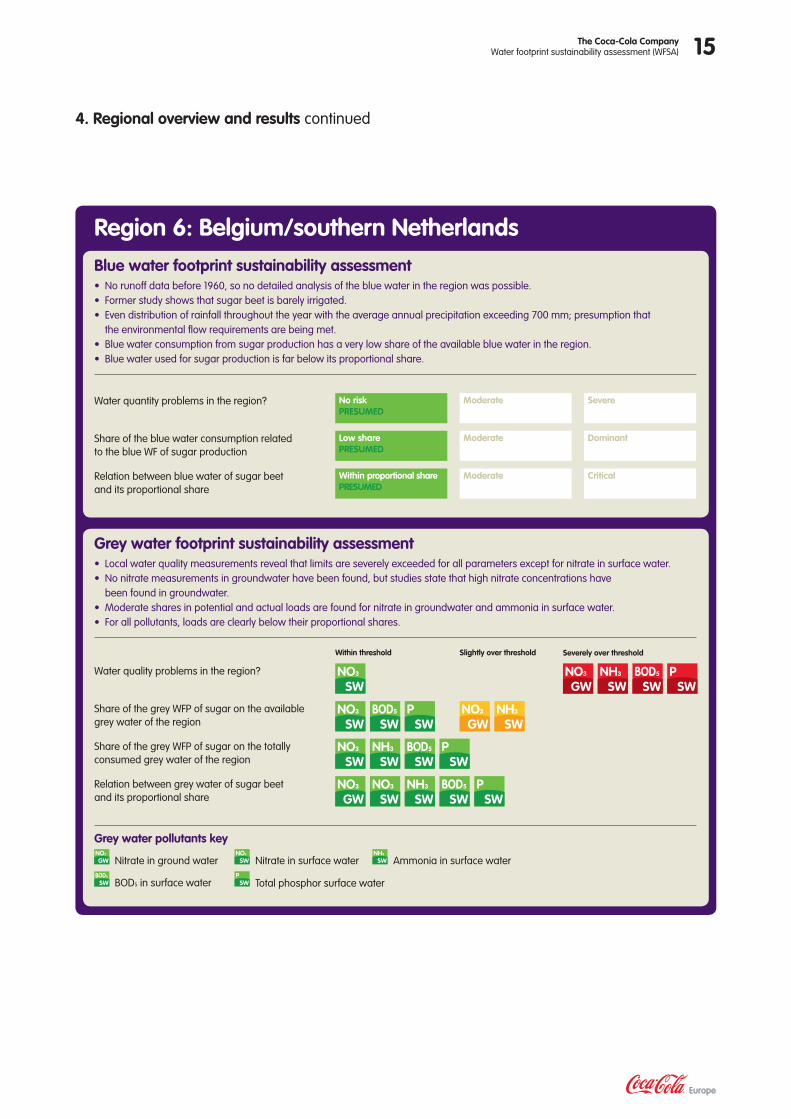
Blue water footprint sustainability assessment• No runoff data before 1960, so no detailed analysis of the blue water in the region was possible. • Former study shows that sugar beet is barely irrigated. • Even distribution of rainfall throughout the year with the average annual precipitation exceeding 700 mm; presumption that
the environmental flow requirements are being met.• Blue water consumption from sugar production has a very low share of the available blue water in the region. • Blue water used for sugar production is far below its proportional share.
Region 6: Belgium/southern Netherlands
Water quantity problems in the region?
Share of the blue water consumption related to the blue WF of sugar production
Relation between blue water of sugar beet and its proportional share
No risk PRESUMED
Low sharePRESUMED
Within proportional share PRESUMED
Moderate
Moderate
Moderate
Severe
Dominant
Critical
Grey water footprint sustainability assessment• Local water quality measurements reveal that limits are severely exceeded for all parameters except for nitrate in surface water. • No nitrate measurements in groundwater have been found, but studies state that high nitrate concentrations have
been found in groundwater. • Moderate shares in potential and actual loads are found for nitrate in groundwater and ammonia in surface water. • For all pollutants, loads are clearly below their proportional shares.
Water quality problems in the region?
Share of the grey WFP of sugar on the available grey water of the region
Share of the grey WFP of sugar on the totally consumed grey water of the region
Relation between grey water of sugar beet and its proportional share
Within threshold Slightly over threshold Severely over threshold
NO3
SWBOD5
SWP
SW
NO3
SW
NO3
SWBOD5
SWP
SWNH3
SW
NO3
GWNO3
SWBOD5
SWP
SWNH3
SW
NO3
GWNH3
SW
NH3
SWBOD5
SWP
SWNO3
GW
Nitrate in ground water Nitrate in surface water Ammonia in surface water
BOD5 in surface water Total phosphor surface water
Grey water pollutants key
16 The Coca-Cola CompanyWater footprint sustainability assessment (WFSA)
4. Regional overview and results continued
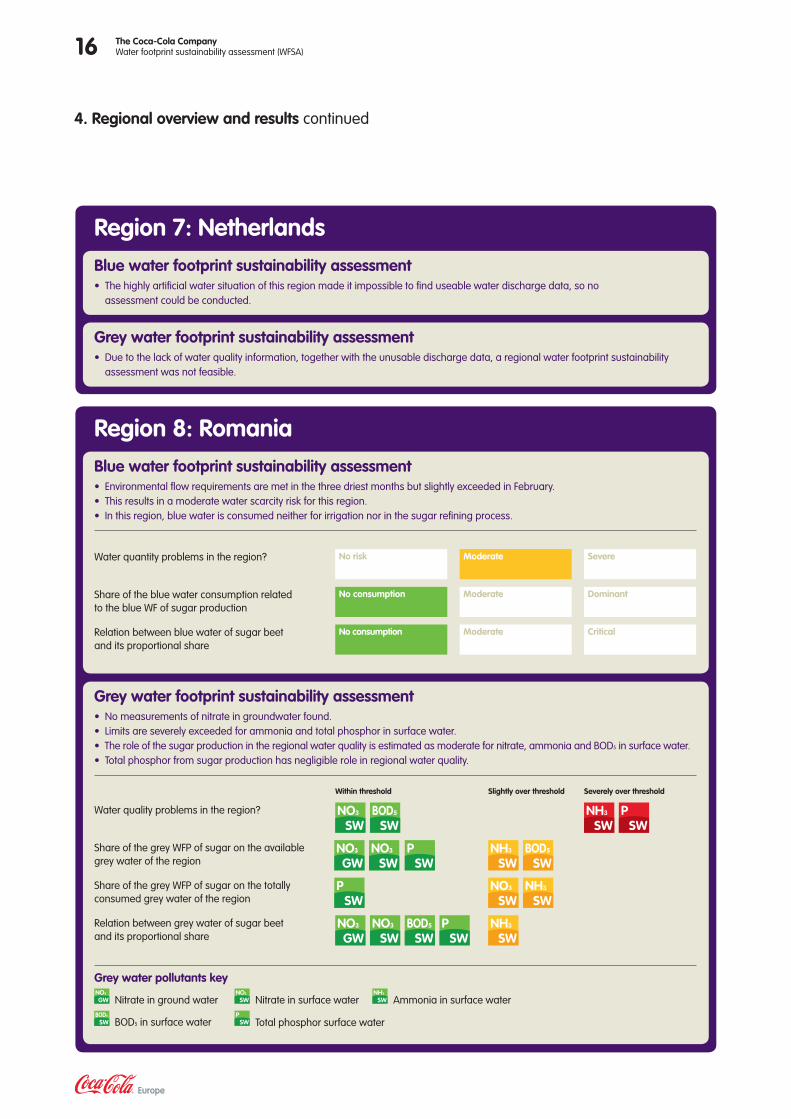
Blue water footprint sustainability assessment• The highly artificial water situation of this region made it impossible to find useable water discharge data, so no
assessment could be conducted.
Region 7: Netherlands
Grey water footprint sustainability assessment• Due to the lack of water quality information, together with the unusable discharge data, a regional water footprint sustainability
assessment was not feasible.
Blue water footprint sustainability assessment• Environmental flow requirements are met in the three driest months but slightly exceeded in February. • This results in a moderate water scarcity risk for this region.• In this region, blue water is consumed neither for irrigation nor in the sugar refining process.
Region 8: Romania
Water quantity problems in the region?
Share of the blue water consumption related to the blue WF of sugar production
Relation between blue water of sugar beet and its proportional share
No risk
No consumption
No consumption
Moderate
Moderate
Moderate
Severe
Dominant
Critical
Grey water footprint sustainability assessment• No measurements of nitrate in groundwater found. • Limits are severely exceeded for ammonia and total phosphor in surface water.• The role of the sugar production in the regional water quality is estimated as moderate for nitrate, ammonia and BOD5 in surface water. • Total phosphor from sugar production has negligible role in regional water quality.
Water quality problems in the region?
Share of the grey WFP of sugar on the available grey water of the region
Share of the grey WFP of sugar on the totally consumed grey water of the region
Relation between grey water of sugar beet and its proportional share
Within threshold Slightly over threshold
NO3
SW
PSW
NO3
GWNO3
SWBOD5
SWP
SW
BOD5
SW
NO3
GWNO3
SWP
SWNH3
SWBOD5
SW
NO3
SWNH3
SW
NH3
SW
Severely over threshold
NH3
SWP
SW
Nitrate in ground water Nitrate in surface water Ammonia in surface water
BOD5 in surface water Total phosphor surface water
Grey water pollutants key
17The Coca-Cola CompanyWater footprint sustainability assessment (WFSA)
4. Regional overview and results continued
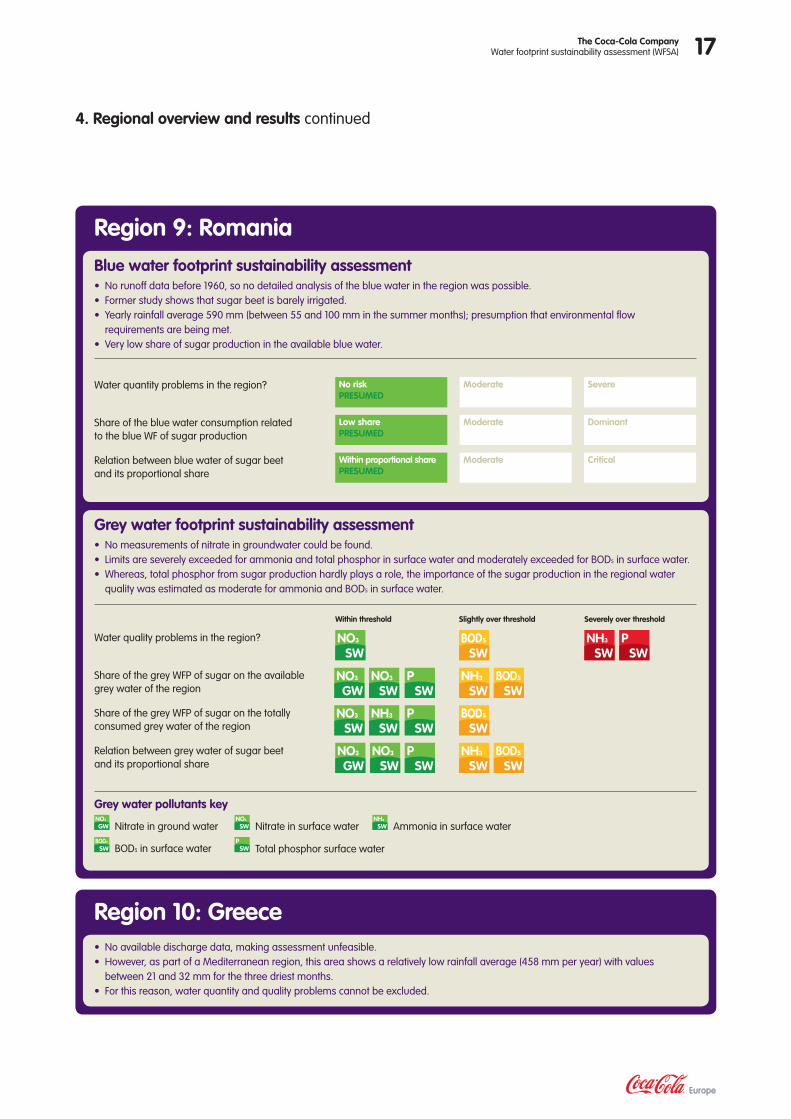
Blue water footprint sustainability assessment• No runoff data before 1960, so no detailed analysis of the blue water in the region was possible. • Former study shows that sugar beet is barely irrigated. • Yearly rainfall average 590 mm (between 55 and 100 mm in the summer months); presumption that environmental flow
requirements are being met.• Very low share of sugar production in the available blue water.
Region 9: Romania
Grey water footprint sustainability assessment• No measurements of nitrate in groundwater could be found. • Limits are severely exceeded for ammonia and total phosphor in surface water and moderately exceeded for BOD5 in surface water.• Whereas, total phosphor from sugar production hardly plays a role, the importance of the sugar production in the regional water
quality was estimated as moderate for ammonia and BOD5 in surface water.
Water quality problems in the region?
Share of the grey WFP of sugar on the available grey water of the region
Share of the grey WFP of sugar on the totally consumed grey water of the region
Relation between grey water of sugar beet and its proportional share
Within threshold Slightly over threshold
NO3
SW
NO3
GWNO3
SWP
SW
NO3
GWNO3
SWP
SWNH3
SWBOD5
SW
Severely over threshold
NH3
SWP
SW
NO3
SWP
SWNH3
SW
BOD5
SW
BOD5
SW
NH3
SWBOD5
SW
Nitrate in ground water Nitrate in surface water Ammonia in surface water
BOD5 in surface water Total phosphor surface water
Grey water pollutants key
Water quantity problems in the region?
Share of the blue water consumption related to the blue WF of sugar production
Relation between blue water of sugar beet and its proportional share
No risk PRESUMED
Low sharePRESUMED
Within proportional sharePRESUMED
Moderate
Moderate
Moderate
Severe
Dominant
Critical
• No available discharge data, making assessment unfeasible. • However, as part of a Mediterranean region, this area shows a relatively low rainfall average (458 mm per year) with values
between 21 and 32 mm for the three driest months. • For this reason, water quantity and quality problems cannot be excluded.
Region 10: Greece
18 The Coca-Cola CompanyWater footprint sustainability assessment (WFSA)
5. European overview and results
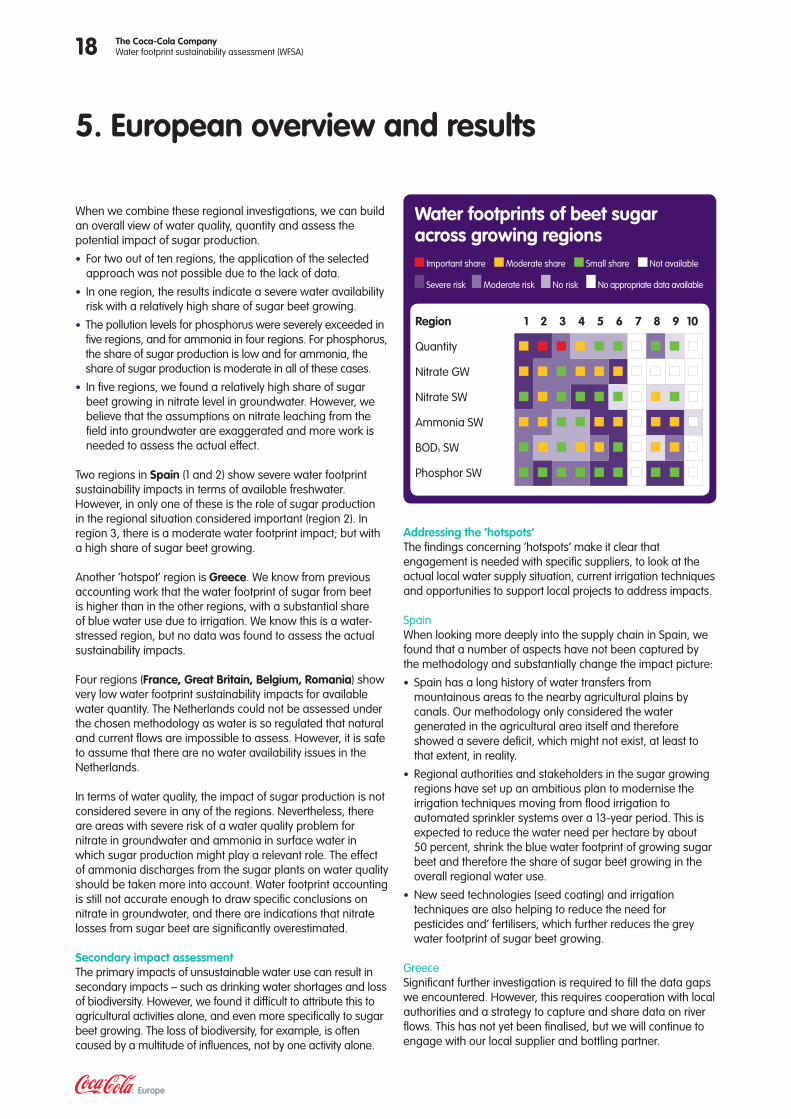
When we combine these regional investigations, we can build an overall view of water quality, quantity and assess the potential impact of sugar production.
• For two out of ten regions, the application of the selected approach was not possible due to the lack of data.
• In one region, the results indicate a severe water availability risk with a relatively high share of sugar beet growing.
• The pollution levels for phosphorus were severely exceeded in five regions, and for ammonia in four regions. For phosphorus, the share of sugar production is low and for ammonia, the share of sugar production is moderate in all of these cases.
• In five regions, we found a relatively high share of sugar beet growing in nitrate level in groundwater. However, we believe that the assumptions on nitrate leaching from the field into groundwater are exaggerated and more work is needed to assess the actual effect.
Two regions in Spain (1 and 2) show severe water footprint sustainability impacts in terms of available freshwater. However, in only one of these is the role of sugar production in the regional situation considered important (region 2). In region 3, there is a moderate water footprint impact; but with a high share of sugar beet growing.
Another ‘hotspot’ region is Greece. We know from previous accounting work that the water footprint of sugar from beet is higher than in the other regions, with a substantial share of blue water use due to irrigation. We know this is a water-stressed region, but no data was found to assess the actual sustainability impacts.
Four regions (France, Great Britain, Belgium, Romania) show very low water footprint sustainability impacts for available water quantity. The Netherlands could not be assessed under the chosen methodology as water is so regulated that natural and current flows are impossible to assess. However, it is safe to assume that there are no water availability issues in the Netherlands.
In terms of water quality, the impact of sugar production is not considered severe in any of the regions. Nevertheless, there are areas with severe risk of a water quality problem for nitrate in groundwater and ammonia in surface water in which sugar production might play a relevant role. The effect of ammonia discharges from the sugar plants on water quality should be taken more into account. Water footprint accounting is still not accurate enough to draw specific conclusions on nitrate in groundwater, and there are indications that nitrate losses from sugar beet are significantly overestimated.
Secondary impact assessmentThe primary impacts of unsustainable water use can result in secondary impacts – such as drinking water shortages and loss of biodiversity. However, we found it difficult to attribute this to agricultural activities alone, and even more specifically to sugar beet growing. The loss of biodiversity, for example, is often caused by a multitude of influences, not by one activity alone.
Addressing the ‘hotspots’The findings concerning ‘hotspots’ make it clear that engagement is needed with specific suppliers, to look at the actual local water supply situation, current irrigation techniques and opportunities to support local projects to address impacts.
SpainWhen looking more deeply into the supply chain in Spain, we found that a number of aspects have not been captured by the methodology and substantially change the impact picture:
• Spain has a long history of water transfers from mountainous areas to the nearby agricultural plains by canals. Our methodology only considered the water generated in the agricultural area itself and therefore showed a severe deficit, which might not exist, at least to that extent, in reality.
• Regional authorities and stakeholders in the sugar growing regions have set up an ambitious plan to modernise the irrigation techniques moving from flood irrigation to automated sprinkler systems over a 13-year period. This is expected to reduce the water need per hectare by about 50 percent, shrink the blue water footprint of growing sugar beet and therefore the share of sugar beet growing in the overall regional water use.
• New seed technologies (seed coating) and irrigation techniques are also helping to reduce the need for pesticides and’ fertilisers, which further reduces the grey water footprint of sugar beet growing.
GreeceSignificant further investigation is required to fill the data gaps we encountered. However, this requires cooperation with local authorities and a strategy to capture and share data on river flows. This has not yet been finalised, but we will continue to engage with our local supplier and bottling partner.
Water footprints of beet sugar across growing regions
Important share Moderate share Small share Not available
Severe risk Moderate risk No risk No appropriate data available
Region 1 2 3 4 5 6 7 8 9 10
Quantity
Nitrate GW
Nitrate SW
Ammonia SW
BOD5 SW
Phosphor SW
19The Coca-Cola CompanyWater footprint sustainability assessment (WFSA)
6. What are the methodological limitations?
A methodology always needs to be based on a uniform approach and standardised requirements, consistent across all areas.
As we found out when looking deeper into the actual situation on the ground in Spain, local variability (for example historic local water transfers) is not captured and can distort the final picture.
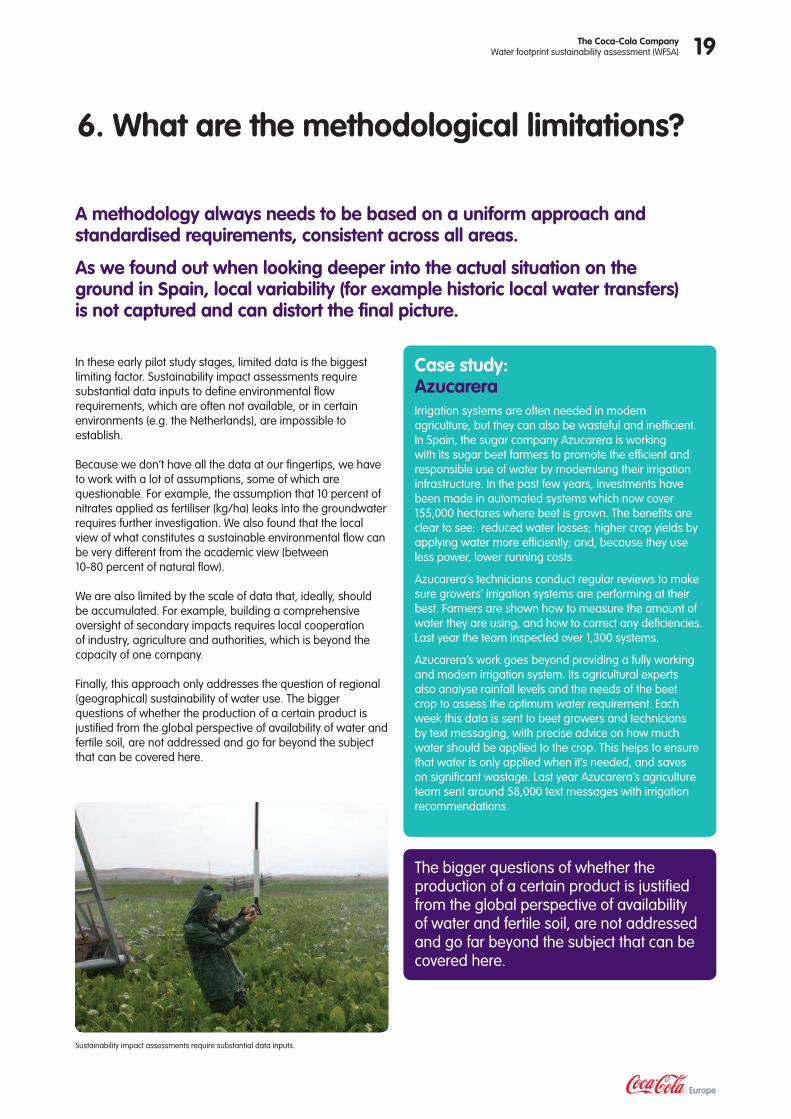
In these early pilot study stages, limited data is the biggest limiting factor. Sustainability impact assessments require substantial data inputs to define environmental flow requirements, which are often not available, or in certain environments (e.g. the Netherlands), are impossible to establish.
Because we don’t have all the data at our fingertips, we have to work with a lot of assumptions, some of which are questionable. For example, the assumption that 10 percent of nitrates applied as fertiliser (kg/ha) leaks into the groundwater requires further investigation. We also found that the local view of what constitutes a sustainable environmental flow can be very different from the academic view (between 10-80 percent of natural flow).
We are also limited by the scale of data that, ideally, should be accumulated. For example, building a comprehensive oversight of secondary impacts requires local cooperation of industry, agriculture and authorities, which is beyond the capacity of one company.
Finally, this approach only addresses the question of regional (geographical) sustainability of water use. The bigger questions of whether the production of a certain product is justified from the global perspective of availability of water and fertile soil, are not addressed and go far beyond the subject that can be covered here.
Case study: AzucareraIrrigation systems are often needed in modern agriculture, but they can also be wasteful and inefficient. In Spain, the sugar company Azucarera is working with its sugar beet farmers to promote the efficient and responsible use of water by modernising their irrigation infrastructure. In the past few years, investments have been made in automated systems which now cover 155,000 hectares where beet is grown. The benefits are clear to see: reduced water losses; higher crop yields by applying water more efficiently; and, because they use less power, lower running costs.
Azucarera’s technicians conduct regular reviews to make sure growers’ irrigation systems are performing at their best. Farmers are shown how to measure the amount of water they are using, and how to correct any deficiencies. Last year the team inspected over 1,300 systems.
Azucarera’s work goes beyond providing a fully working and modern irrigation system. Its agricultural experts also analyse rainfall levels and the needs of the beet crop to assess the optimum water requirement. Each week this data is sent to beet growers and technicians by text messaging, with precise advice on how much water should be applied to the crop. This helps to ensure that water is only applied when it’s needed, and saves on significant wastage. Last year Azucarera’s agriculture team sent around 58,000 text messages with irrigation recommendations.
Sustainability impact assessments require substantial data inputs.
The bigger questions of whether the production of a certain product is justified from the global perspective of availability of water and fertile soil, are not addressed and go far beyond the subject that can be covered here.
This document proposes an approach for assessing water footprint sustainability and to help businesses define their responses. It is far from being the final answer – it is more the starting point for a wider discussion.
It provides ideas and guidance, but also raises questions - not least, what are we going to do as a result?
20 The Coca-Cola CompanyWater footprint sustainability assessment (WFSA)
7. Conclusions and further actions
Take ActionFor any company concerned with long-term supply security, ignoring water footprinting is not an option. Whilst this proposed methodology for water footprint sustainability assessments is far from being perfect, it helps direct attention to areas and issues in the supply chain, where it really matters and opens the opportunity to engage with suppliers on improving the water footprint sustainability of the supply chain.
Close data gaps Lack of available data means that a water footprint sustainability assessment of the regional crop production is not possible in some countries. Further research should be conducted in cooperation with national partners, industry and authorities in order to gain an overview of the local water situation and also to assess the water footprint impacts of agricultural commodities at a river basin level.
Address hotspot areas through joint projects So far, we only have a basic assessment of environmental, economic and social impacts within a region’s catchment area. Therefore, a better understanding of the hotspot areas, along with partnership projects that address specific local impacts, should be developed in conjunction with local industry and supply chain partners.
Share best practice There seem to be further opportunities to increase cooperation to boost best practice and share experiences on water management between agriculture and industry, in and outside of Europe. Issues such as efficient irrigation, or plant-specific use of fertilisers in the field, can help to reduce local impacts. Our case studies show this best practice and willingness to share knowledge already in action. Some suppliers are starting their own investigations to further reduce water footprint impacts.
Engage the wider industryAgricultural commodities are often closely interlinked. Sugar beet is a rotational crop, used to help the soil recover and break up every three to four years. In other years, the same field will grow corn, potatoes or wheat, which means a sensible long-term sustainability strategy for sugar beet needs to work at a farm level and across the wider food industry.
Boost transparency and communicationIncreased transparency and communication of water sustainability in the sugar supply chain drives improvements in the industry. The involvement of other stakeholders in our sounding board showed this to be true, adding impetus for our study.
Glossary of terms
Blue water footprint Volume of surface and groundwater consumed as a result of the production of a good or service. Consumption refers to the volume of freshwater used and then evaporated, or incorporated into a product. It also includes water abstracted from surface or groundwater in a catchment and returned to another catchment or the sea. It is the amount of water abstracted from ground or surface water that does not return to the catchment from which it was withdrawn.
Catchment area Area of land where surface water from rain and melting snow or ice converges to a single point, usually the exit of the basin, where the waters join another waterbody, such as a river, lake, reservoir, estuary, wetland, sea, or ocean. Similar terms are drainage basin, river basin and watershed.
Environmental flow requirementsThe quantity and timing of water flows required to sustain freshwater and estuarine ecosystems and the human livelihoods and well-being that depend on these ecosystems.
Green water footprintVolume of rainwater consumed during the production process. This is particularly relevant for agricultural and forestry products (products based on crops or wood), where it refers to the total rainwater evapotranspiration (from fields and plantations) plus the water incorporated into the harvested crop or wood.
Grey water footprintThe grey water footprint of a product is an indicator of freshwater pollution that can be associated with the production of a product over its full supply chain. It is defined as the volume of freshwater that is required to assimilate the load of pollutants based on existing ambient water quality standards. It is calculated as the volume of water that is required to dilute pollutants to such an extent that the quality of the water remains above agreed water quality standards.
LeachingLeaching of soil occurs naturally and is part of the process of soil formation. When soil becomes saturated with rainwater water travels downward into groundwater and eventually rivers or lakes. In the process, substances such as iron, aluminum, calcium and organic matter are carried into the soil or washed away. Leaching becomes a problem when pesticides and fertilisers from the soil are leached into water supplies.
RegionIn this study, a region is where the water footprint of sugar production occurs. It includes the sugar factory and the sugar beet growing areas, assuming that a sugar factory is mainly supplied by surrounding beet-growing areas within an approximate 70km radius. Where regions of sugar factories overlap, all overlapping areas were considered as one region in the sustainability assessment.
Water footprintThe water footprint is an indicator of freshwater use that looks at both direct and indirect water use of a consumer or producer. The water footprint of an individual, community or business is defined as the total volume of freshwater that is used to produce the goods and services consumed by the individual or community, or produced by the business. Water use is measured in terms of water volumes consumed (evaporated) and/or polluted per unit of time. A water footprint can be calculated for a particular product, for any well-defined group of consumers (e.g. an individual, family, village, city, province, state or nation) or producers (e.g. a public organisation, private enterprise or economic sector). The water footprint is a geographically explicit indicator, not only showing volumes of water use and pollution, but also the locations.
Water footprint accountingThe step in a water footprint assessment that refers to collecting factual empirical data on water footprints with a scope and depth as per the defined methodology.
Water footprint assessment Quantifying a water footprint, assessing its impacts and formulating a response. The assessment includes four phases: setting goals and scope; water footprint accounting; water footprint sustainability assessment; and water footprint response formulation.
Water footprint sustainability assessmentAssessing the sustainability of a water footprint from an environmental, social and economic perspective, at local, river basin, and global level. For this study, only local and partly river basin perspectives were investigated.
Further information, please contact:
Ulrike SapiroEnvironmental Sustainability Director
S.A. Coca-Cola Services N.V. Chaussee de Mons 1424 Steenweg op Bergen 1070 Brussels Belgium
Email: [email protected]