Embed Size (px)
Citation preview

ASIA-PACIFIC RESEARCH AND TRAINING NETWORK ON TRADE
Working Paper
NO. 150 | 2015
Marko Javorsek
Ignacio Camacho
Trade in Value Added:
Concepts, Estimation
and Analysis

The Asia-Pacific Research and Training Network on Trade (ARTNeT) is an open regional
network of research and academic institutions specializing in international trade policy and
facilitation issues. IDRC, UNCTAD, UNDP, ESCAP and WTO, as core network partners,
provide substantive and/or financial support to the network. The Trade and Investment
Division of ESCAP, the regional branch of the United Nations for Asia and the Pacific,
provides the Secretariat of the network and a direct regional link to trade policymakers and
other international organizations.
The ARTNeT Working Paper Series disseminates the findings of work in progress to
encourage the exchange of ideas about trade issues. An objective of the series is to publish
the findings quickly, even if the presentations are less than fully polished. ARTNeT Working
Papers are available online at www.artnetontrade.org. All material in the Working Papers
may be freely quoted or reprinted, but acknowledgment is requested, together with a copy
of the publication containing the quotation or reprint. The use of the working papers for any
commercial purpose, including resale, is prohibited.
Disclaimer:
The designations employed and the presentation of the material in this Working Paper do
not imply the expression of any opinion whatsoever on the part of the Secretariat of the
United Nations concerning the legal status of any country, territory, city or area, or of its
authorities, or concerning the delimitation of its frontiers or boundaries. Where the
designation “country or area” appears, it covers countries, territories, cities or areas.
Bibliographical and other references have, wherever possible, been verified. The United
Nations bears no responsibility for the availability or functioning of URLs. The views
expressed in this publication are those of the author(s) and do not necessarily reflect the
views of the United Nations. The opinions, figures and estimates set forth in this publication
are the responsibility of the author(s), and should not necessarily be considered as reflecting
the views or carrying the endorsement of the United Nations. Any errors are the
responsibility of the author(s). Mention of firm names and commercial products does not
imply the endorsement of the United Nations.
ARTNeT 2015

Trade in Value Added:
Concepts, Estimation and Analysis#
Marko Javorsek* and Ignacio Camacho**
* Marko Javorsek is an Associate Statistician at ESCAP Statistics Division. Ignacio Camacho was an intern at ESCAP Statistics Division between June and August 2014. The authors would like to express their gratitude for comments received from Anis Chowdhury, Rikke Munk Hansen, and Zeynep Girard Orhun from Statistics Division; and Mia Mikic from Trade and Investment Division. The authors are also grateful to the ARTNeT Secretariat for technical support in disseminating this paper. Any errors that remain are sole responsibility of the authors who could be contacted through [email protected].
Please cite this paper as: Marko Javorsek and Ignacio Camacho (2015), Trade in
Value Added: Concepts, Estimation and Analysis
ARTNeT Working Paper Series No. 150, 2015, Bangkok, ESCAP.
Available at www.artnetontrade.org
# This paper is also posted in the Working Paper Series of ESCAP Statistics Division SD/WP/01/May 2015 under the same title.
WORKING PAPER ASIA-PACIFIC RESEARCH AND TRAINING NETWORK ON TRADE
NO. 150 | 2015
Abstract
This working paper introduces the concept of Trade in Value Added (TiVA) and presents an
initial analysis of TiVA for selected regional ESCAP economies. The paper introduces Global
Value Chains (GVCs) and issues for the measurement of trade statistics due to proliferation
of GVCs. It further presents the TiVA estimation methodology, as defined in the literature, and
provides an overview of the data requirements for estimation. The paper reviews current
initiatives on regional / international input-output tables (IOTs) and TiVA analysis, and
availability of data in the Asia-Pacific region. The paper concludes with a TiVA analysis of
selected regional ESCAP economies that are available in the current data sources. The paper
has been prepared under the Regional Programme on Economic Statistics (PRES) and we
hope it will support the efforts of statistical offices in the region to improve related statistics.
Keywords: international trade statistics, trade in value added, global value chains, Asia and
the Pacific, input-output, supply-use,
JEL classification: C67, D57, F13, F14, F15, F23, O19, O24
Contents
1. Introduction………………………………………………………………………………………...1
2. Understanding international trade statistics………………………………………………........2
2.1. Global Value Chains (GVCs)………………………………………………………………..2
2.2. Trade statistics………………………………………………………………………………..4
2.3. Measurement of trade………………………………………………………………………..5
2.4. Trade in Value Added (TiVA)………………………………………………………………..6
2.5. The TiVA framework of indicators…………………………………………………………..8
2.5.1. TiVA and trade in services……………………………………………………………9
2.5.2. GVC participation……………………………………………………………………10
3. Estimating Trade in Value Added (TiVA)………………………………………………………11
3.1. International input-output tables ............................................................................... 11
3.1.1. Basic assumptions…………………………………………………………………..14
3.2. Estimating TiVA……………………………………………………………………………...16
4. Current initiatives in TiVA analysis………………………………………………………………21
4.1. OECD and WTO…………………………………………………………………………….23
4.2. UNCTAD and Eora MRIO ......................................................................................... 23
4.3. Other initiatives………………………………………………………………………………25
5. TiVA analysis for selected ESCAP economies…………………………………………….....26
5.1. Description of the data sources ................................................................................ 26
5.2. Regional TiVA........................................................................................................... 27
5.3. TiVA by industry……………………………………………………………………………..30
5.4. TiVA analysis of services contribution to exports ...................................................... 33
5.5. Participation in GVCs................................................................................................ 34
Conclusion.............................................................................................................................37
References…………………………………………………………………………………………..39
Figures
Figure 1: An illustration of a GVC .......................................................................................... 2
Figure 2: Trade in value added, an illustration ....................................................................... 6
Figure 3: Decomposition of gross exports: concepts ............................................................. 9
Figure 4: Simplified supply and use table ............................................................................ 12
Figure 5: Simplified input-output table ................................................................................. 13
Figure 6: Simplified international IOT with two countries and one industry .......................... 14
Figure 7: Disaggregation of gross exports for 17 ESCAP economies in Asia-Pacific, 2009 in
trillion US$ .......................................................................................................................... 27
Figure 8: Shares of domestic value added in gross exports, 2009....................................... 28
Figure 9: Values of the domestic and foreign value added embodied in gross exports, 2009
in billion US$ ....................................................................................................................... 29
Figure 10: Domestic value added (DVA) and gross exports (GE) as a percentage of GDP,
2009 .................................................................................................................................... 30
Figure 11: Total domestic value added of services and indirect domestic services as a share
of gross exports, 2009 ......................................................................................................... 34
Figure 12: Forward and backward GVC participation indices, 2009 .................................... 36
Tables
Table 1: 2009 US trade balance in iPhones (million dollars).................................................. 7
Table 2: List of international IOT databases ........................................................................ 22
Table 3: List of TiVA databases .......................................................................................... 22
Table 4: Domestic value added in gross exports ratios by industry, 2009 ............................ 30
Table 5: Each industry as a percentage of gross exports (GE) and their domestic value
added (DVA) to gross exports (GE) ratios for Australia and China, 2009 ............................ 32
1
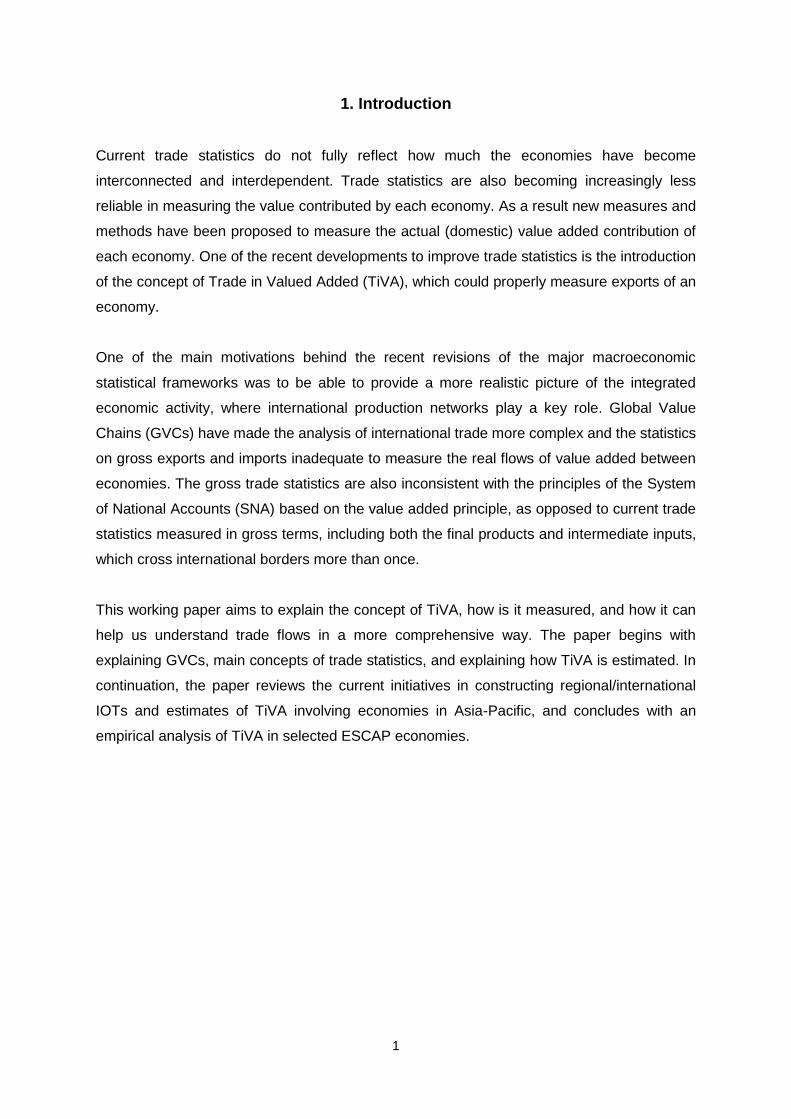
1. Introduction
Current trade statistics do not fully reflect how much the economies have become
interconnected and interdependent. Trade statistics are also becoming increasingly less
reliable in measuring the value contributed by each economy. As a result new measures and
methods have been proposed to measure the actual (domestic) value added contribution of
each economy. One of the recent developments to improve trade statistics is the introduction
of the concept of Trade in Valued Added (TiVA), which could properly measure exports of an
economy.
One of the main motivations behind the recent revisions of the major macroeconomic
statistical frameworks was to be able to provide a more realistic picture of the integrated
economic activity, where international production networks play a key role. Global Value
Chains (GVCs) have made the analysis of international trade more complex and the statistics
on gross exports and imports inadequate to measure the real flows of value added between
economies. The gross trade statistics are also inconsistent with the principles of the System
of National Accounts (SNA) based on the value added principle, as opposed to current trade
statistics measured in gross terms, including both the final products and intermediate inputs,
which cross international borders more than once.
This working paper aims to explain the concept of TiVA, how is it measured, and how it can
help us understand trade flows in a more comprehensive way. The paper begins with
explaining GVCs, main concepts of trade statistics, and explaining how TiVA is estimated. In
continuation, the paper reviews the current initiatives in constructing regional/international
IOTs and estimates of TiVA involving economies in Asia-Pacific, and concludes with an
empirical analysis of TiVA in selected ESCAP economies.
2
2. Understanding international trade statistics
This section introduces the basic concepts of GVCs and trade statistics, from the traditional
way of measurement to explaining the main concepts of TiVA. The aim of this section is to
motivate the interest in this area and provide the necessary background information about the
basic concepts.
2.1. Global Value Chains (GVCs)
Global Value Chains (GVCs) is a phenomenon where the making of a product is spread across
countries, regions and continents benefiting from comparative local cost advantages to
become globally competitive. GVCs are value chains, which are activities that companies
engage in to bring a product from development all the way to the final consumer, and that are
global in a way that are spread over several countries (Gereffi and Fernandez-Stark, 2011).
GVCs depend on fragmentation of production and trade of intermediate products in order to
exploit cost advantage of each location/stage in the chain, up to the assembly stage. GVCs
are typically used by transnational companies and have become increasingly important.
Figure 1 illustrates flows in a GVC.1
Figure 1: An illustration of a GVC
Source: OECD, 2013.
1 For an overview on GVCs see Gereffi and Fernandez-Stark, 2011; or De Backer and Miroudot, 2013; of OECD-WTO-WB, 2014.
3
The development of GVCs has been mainly driven by multinational companies in their pursuit
of competitive advantage and profits. By carrying out specific parts of the production process
in certain countries, costs are minimized through economies of scale as well as specialization
in addition to local cost advantages. Furthermore, the international movements of intermediate
products are facilitated by trade liberalization and decline of transport and ICT costs. The
concept “Made in...” becomes blurred as many products are, actually, “Made in the World”. In
fact, according to UNCTAD (2013b), 80% of gross exports are currently linked to international
production networks of transnational companies.
GVCs are an important phenomenon in Asia-Pacific, initially spearheaded by Japanese
investors who took their production bases to several countries in East Asia and later also to
South-East Asia in order to access location advantages and develop export platforms to avoid
adverse exchange rate developments.2 The assembly of final products was carried out in a
third country upon which the products were exported back to Japan or onto the global markets.
Due to increasing levels of foreign direct investment, GVCs in Asia are now connected to most
countries and sub-regions; in fact, East and South-East Asia are leading the developing world
in terms of integration into GVCs (UNCTAD, 2013b). In particular, China has become world’s
factory with transnational companies relocating their production platform in the country.3
Due to their increasing importance it is fundamental to include GVCs in the recording and
analysis of the trade flows. This will, however, demand significant changes to the analysis of
trade statistics and statistical standards. In this regard, efforts have been made to revise the
major macroeconomic statistical frameworks (e.g. the 2008 System of National Accounts –
SNA– and the 2009 Sixth Edition of the Balance of Payments and International Investment
Position Manual –BPM6) in order to give a more realistic picture of national and international
economic activities.
The SNA has been revised replacing the “cross border recording of goods and services” with
“transfer of economic ownership” in order to delineate trade activity, and the BPM6 has been
harmonized with the 2008 SNA. To address challenges, among others, related to
2 The Japanese production moved off-shore (particularly to South-East Asia) in a big way following the Plaza Accord in 1985 when Japan was forced to revalue its currency against the US dollar (ESCAP, 2014b). 3 Facilitated by low labour cost, favourable exchange rates and policies such as the export tax rebate policy, initiated in 1985 as a way to boost the competitiveness of its exports by abolishing double taxation on exported goods. Exported goods are subject to zero per cent value added tax (VAT), meaning they enjoy a VAT exemption or rebate policy. China also has developed manufacturing ecosystems where a network of suppliers that provide parts to the final assembly factory and are essential for efficient and low cost production to attract foreign investment (ESCAP, 2014b; Economist, 2012; and ADB, 2013).
4
implementing these revisions, the following groups have been established to provide input:
Inter-secretariat Working Group on National Accounts (ISWGNA), and Eurostat Task Force on
Goods sent abroad for Processing. As a result the following manuals have been prepared:
The Impact of Globalization on National Accounts (UNECE, 2011), Guide to Measuring Global
Production (UNECE, 2015), and Guidelines on Integrated Economic Statistics (UNSD, 2013).
Various international organizations, universities, independent researchers, and international
think tanks have suggested that the measurement of international trade using a value added
approach could provide better statistics and allow more meaningful analysis of the impact of
international trade on growth and economic development. It would also address the problem
of double counting and improve evidence-based policy making worldwide.
2.2. Trade statistics
On a global level, trade4 statistics are gathered by different international organizations, among
others, the International Monetary Fund (IMF), the World Trade Organization (WTO) and the
United Nations Statistics Division (UNSD). Trade statistics are collected from various national
agencies, such as the national statistical office (NSO), the national customs agency, or central
bank, as well as supranational institutions, such as the European Commission or Organization
of Economic Co-operation and Development (OECD).
Trade is composed of trade in merchandise and trade in services. In this paper we are mainly
concerned with trade in merchandise. One of the primary sources of trade in merchandise
statistics is the Commodity Trade Statistics Database (UN Comtrade).5 Comtrade collects
trade statistics from national institutions on trade in merchandise at disaggregated levels,
including information about the type of goods, the country of origin for imports and the country
of last known destination for exports. Imports are recorded at transaction value, including cost,
insurance and freight (CIF), whereas exports are recorded at free on board (FOB) prices (i.e.,
cost, insurance and fright are not considered in the price). Data at the product level is classified
using the Harmonized Commodity Description and Coding System (Harmonized System or
HS), as well as the Standard International Trade Classification (SITC), which assigns
commodities according to their stage of production.
4 In this paper “trade” implies international trade, if the trade would refer to domestic trade it would be specified. 5 For more information see: http://comtrade.un.org/db/mr/rfGlossaryList.aspx.
5
In the case of Asia-Pacific, ESCAP statistical database compiles statistics on trade for
countries in the ESCAP region from the United Nations Conference on Trade and
Development (UNCTAD), the WTO, and UN Comtrade. For calculation of regional and
subregional aggregates ESCAP imputes missing values, but the imputed values are not
presented in the database. Some inconsistencies between trade data sources occur mainly
due to different national sources used, translation of currencies, and differences in standards.
2.3. Measurement of trade
Trade statistics are produced based on recording of products' crossing the national customs
borders. This process disregards the fact that intermediate inputs used to produce the product
exported from one country may be imported from several other countries. For example, if
China exports a microwave oven to the United States the total export value of the microwave
oven is considered as Chinese export and recorded as such in the trade account by national
authorities; and from the United States perspective, the microwave oven is recorded as an
import from China (and will probably require a tag “Made in China”). However, some of inputs
into the production of the microwave oven might have been produced in and imported from
different countries, for example Thailand, Malaysia or even the United States. The value of
these intermediates has been recorded as Chinese imports from Malaysia, Thailand, or the
United States, but not linked with the exportable final product.
At present, trade statistics does not differentiate whether the intermediate products in the
production of the microwave oven were produced in China or not; thus possibly inflating the
role of exports for China. Furthermore, this recording of trade creates double, triple or multiple
counting in international trade. The total value of the microwave oven was counted as a final
export of China, but so were the inputs and parts exported from the other countries, which
quite likely also had imported inputs which in turn were recorded as exports by countries where
those originated. Hence, the total exports are over-estimated at the global level, as well as in
many countries making current measures of rations of exports to GDP inadequate. At the
extreme in economies where re-exports are significant, such as in Singapore and Hong Kong,
China, this could mean exports exceeding the total value of GDP.
Due to the increasingly interlinked global production networks, double counting of international
trade has been estimated at around $5 trillion or 28% of the $19 trillion of global gross exports
in 2010 (UNCTAD, 2013a). The increasing importance of global value chains has significantly
aggravated this problem. In a GVC multinational companies aim to fragment the production of
6
products in the most optimal location, which means that products are rarely produced
completely in a single country.
2.4. Trade in Value Added (TiVA)
Trade in Value Added (TiVA) is a concept of measuring trade based on the value added at
each stage of production. As a result, only the amount of value added by a particular country
in the production of a particular exportable product will be recoded as exports of this country.
This means that in the above example of the microwave oven exported from China to the
United States, only the value added produced by Chinese manufacturers in the total value of
the oven will be recorded as the Chinese export to the United States.
As such, TiVA addresses the double counting implicit in current gross trade data by measuring
flows in terms of the value that is added by a country in the production of goods and services.
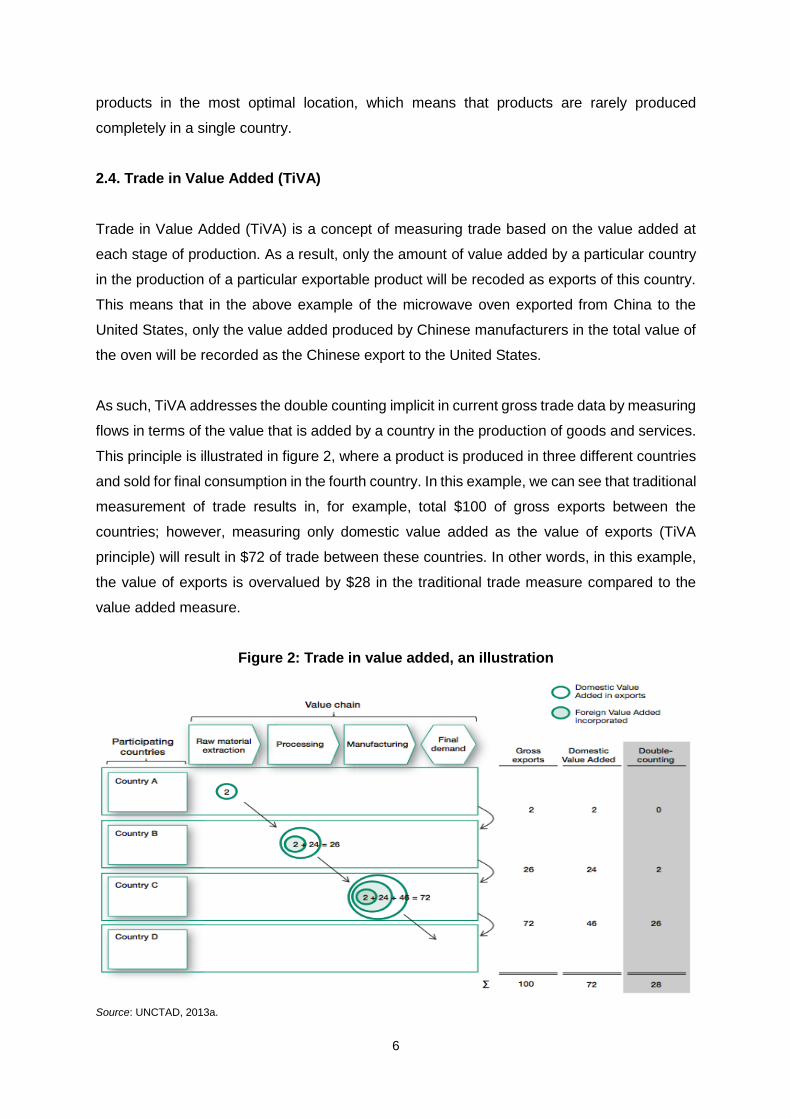
This principle is illustrated in figure 2, where a product is produced in three different countries
and sold for final consumption in the fourth country. In this example, we can see that traditional
measurement of trade results in, for example, total $100 of gross exports between the
countries; however, measuring only domestic value added as the value of exports (TiVA
principle) will result in $72 of trade between these countries. In other words, in this example,
the value of exports is overvalued by $28 in the traditional trade measure compared to the
value added measure.
Figure 2: Trade in value added, an illustration
Source: UNCTAD, 2013a.
7
By recording trade in value added, the overall trade balance of a country with the rest of the
world will not change; however, bilateral trade balances may change significantly. For
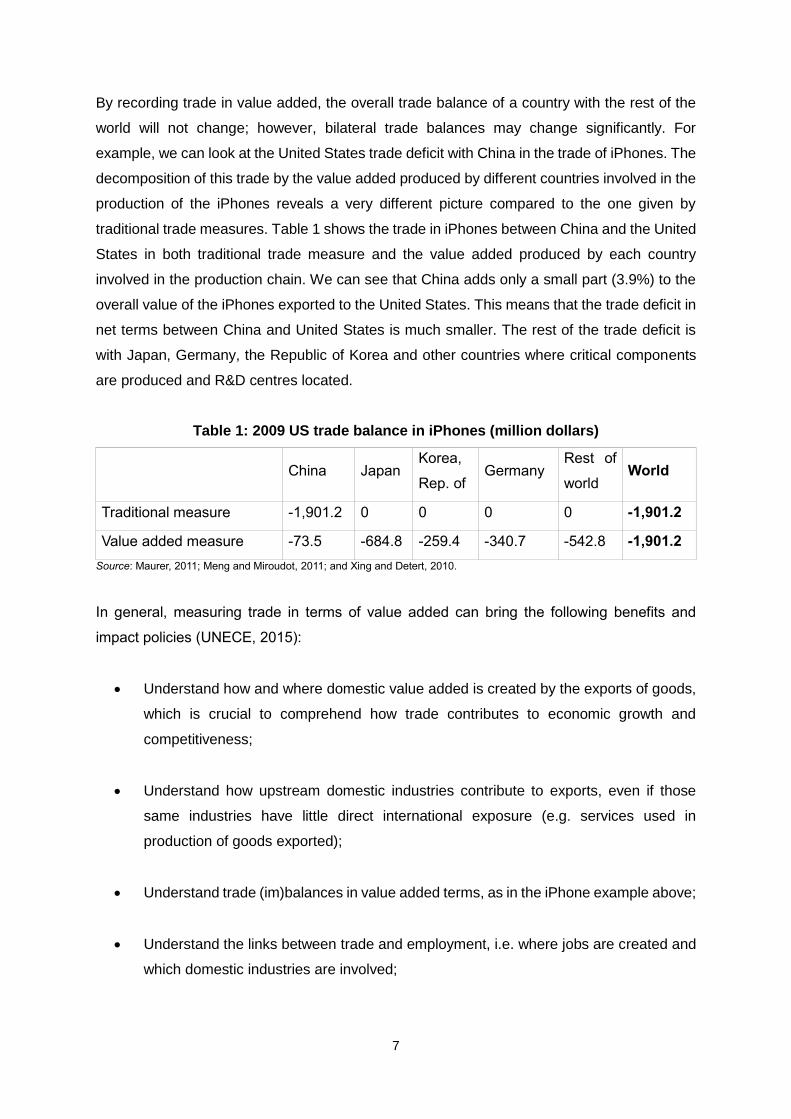
example, we can look at the United States trade deficit with China in the trade of iPhones. The
decomposition of this trade by the value added produced by different countries involved in the
production of the iPhones reveals a very different picture compared to the one given by
traditional trade measures. Table 1 shows the trade in iPhones between China and the United
States in both traditional trade measure and the value added produced by each country
involved in the production chain. We can see that China adds only a small part (3.9%) to the
overall value of the iPhones exported to the United States. This means that the trade deficit in
net terms between China and United States is much smaller. The rest of the trade deficit is
with Japan, Germany, the Republic of Korea and other countries where critical components
are produced and R&D centres located.
Table 1: 2009 US trade balance in iPhones (million dollars)
China Japan Korea,
Rep. of Germany
Rest of
world World
Traditional measure -1,901.2 0 0 0 0 -1,901.2
Value added measure -73.5 -684.8 -259.4 -340.7 -542.8 -1,901.2
Source: Maurer, 2011; Meng and Miroudot, 2011; and Xing and Detert, 2010.
In general, measuring trade in terms of value added can bring the following benefits and
impact policies (UNECE, 2015):
Understand how and where domestic value added is created by the exports of goods,
which is crucial to comprehend how trade contributes to economic growth and
competitiveness;
Understand how upstream domestic industries contribute to exports, even if those
same industries have little direct international exposure (e.g. services used in
production of goods exported);
Understand trade (im)balances in value added terms, as in the iPhone example above;
Understand the links between trade and employment, i.e. where jobs are created and
which domestic industries are involved;
8
Provide policy makers a better understanding of potential impacts of macroeconomic
shocks on trade (e.g. the 2008/09 financial crisis);
Understand the environmental impact of trade, the potential impact of trade on climate
change, and how trade affects greenhouse gas emissions.
2.5. The TiVA framework of indicators
The concept of TiVA refers to a series of different indicators of domestic and foreign value
added embodied in imports and exports. The following two are the most commonly used
indicators and form the basis of gross export (GE) disaggregation in value added terms
(OECD-WTO, 2013b):
Domestic value added embodied in gross exports (DVA): refers to the value added
generated by the domestic economy in the production (direct and indirect) of goods
and services for export. It includes the value added embodied in all exported goods
and services produced by national industries, including the domestic value added that
was previously exported and the re-imported to be used in production of intermediates.
Foreign value added embodied in gross exports (FVA): refers to the value added of
foreign goods and services that are used as intermediates to produce goods and
services for export. FVA is usually analysed by the country of origin.
Additionally, when speaking of the domestic value added embodied in gross exports (DVA),
we also need to define the portion of this domestic value added used as inputs by industries
in other countries, which produce goods or services for export to third countries, this is also
referred to as the indirect value added exports (DVX).
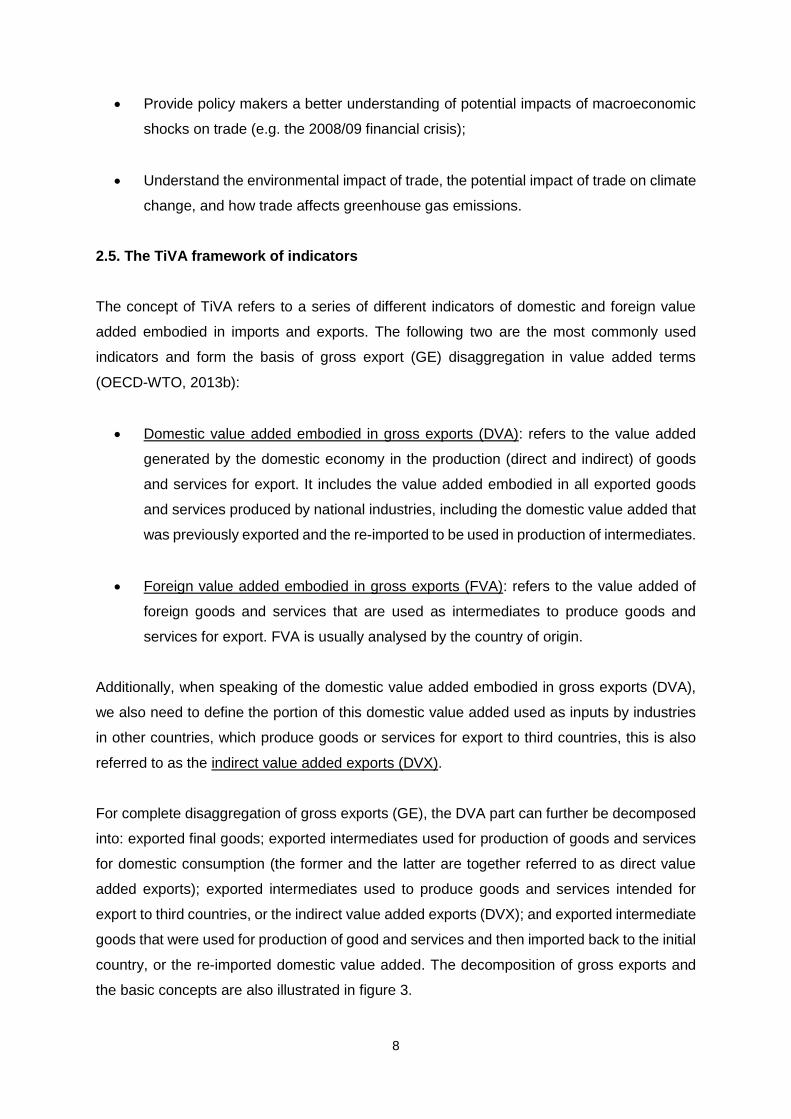
For complete disaggregation of gross exports (GE), the DVA part can further be decomposed
into: exported final goods; exported intermediates used for production of goods and services
for domestic consumption (the former and the latter are together referred to as direct value
added exports); exported intermediates used to produce goods and services intended for
export to third countries, or the indirect value added exports (DVX); and exported intermediate
goods that were used for production of good and services and then imported back to the initial
country, or the re-imported domestic value added. The decomposition of gross exports and
the basic concepts are also illustrated in figure 3.
9
Figure 3: Decomposition of gross exports: concepts
Source: Koopman et al, 2010.
2.5.1. TiVA and trade in services
The increased use of services in manufacturing has resulted in a phenomenon called
‘servicification,’ which recognizes the direct and indirect value created by services in the
process of manufacturing, distribution, or marketing of goods (ESCAP, 2013). Traditionally we
value goods disregarding how upstream domestic economic activities (industries), those in
the initial stages of production, contribute to their creation.6 Therefore, we underestimate the
weight of services used in the design and commercialization of such goods.7
Analysis of TiVA is especially helpful as it allows us to understand the contribution of services
in domestic production and their value added contribution to trade. TiVA framework identifies
two indicators that allow for the analysis of the value added of the services industry (OECD-
WTO, 2013b):
6 A more thorough definition of upstream and downstream activities is provided below. 7 For further discussion on servicification and industrial exports see ESCAP, 2014a; and Anukoonwattaka et al, 2015.
10
Total domestic value added of the services embodied in gross exports (SDVA): reflects
the (direct and indirect) value added contributions of domestic services supplied in
producing a good or service for exports, including the domestic services value added
that was previously exported in goods and services used to produce the intermediate
products. By definition, it will be zero for all non-service industries.
Foreign services value added share of gross exports (SFVA): refers to the foreign
services value added of foreign intermediate goods and services used by the exporting
economy, usually analysed by country of origin.
2.5.2. GVC participation
We can analyse the countries’ and industries’ participation in GVCs from two different
perspectives:
Forward linkages or downstream participation: is created between a supplying industry
and a purchasing industry that uses the supplier’s output as input. Internationally, it
can be understood as the linkages between an exporting economy and an importing
economy whose industries use the exports (supply) as inputs to generate output for
exports. In other words, the industries of the exporting country provide inputs into
exports of the industries in the importing country.
Backward linkages or upstream participation: is created between a purchasing industry
and a supplying industry. Internationally, it can be understood as the linkages between
an importing country and an exporting country. In other words, the industries in the
importing country import intermediate products to be used in its exports.
The above concepts will allow us to measure the GVC participation, which indicates a
country’s integration into the GVCs. It is calculated by adding the foreign value added in the
county’s exports (FVA) – backward linkage – and the domestic value added embedded in
exports of other counties (DVX) – forward linkage. Consequently, the GVC participation index
is the sum of the forward linkage (downstream participation, DVX) and the backward linkage
(upstream participation, DVA) divided by total gross exports (GE), as proposed by Koopman
et al (2010):
GVCParticipation = DVX+FVA
GE (1)
11
Forward and backward linkages are useful in understanding the impact of trade on economic
growth and development. In this regard, a country which exports high levels of final goods that
use few domestic intermediates (i.e. a country with weak domestic backward linkages in its
exporting sector) will generate little domestic value added and little economic growth when
increasing its exports; as opposed to a country with high levels of integration between its
domestic and export industries (i.e. strong domestic backward linkages). It is important to note
that, in our example, weak domestic backward linkages may imply strong international
backward linkages, i.e. high levels of imports of intermediate goods (UNCTAD, 2013a).
Normally, countries with weak domestic backward linkages in their exporting sectors also have
weak international forward linkages (with the exception of countries whose main exports are
natural resources). In this regard, an economy specializing in the assembly of final goods that
imports high levels of intermediates will itself produce few intermediates destined to exports.
Given that the final stages of production (i.e. assembly) usually carry the lowest levels of value
added, achieving economic development would require that countries develop both strong
domestic backward linkages and strong international forward linkages (UNCTAD, 2013a).
3. Estimating Trade in Value Added (TiVA)
This section presents the process of estimating TiVA. The process consists of two stages; the
first one is to construct an international/regional input-output table (IOT), which in itself
requires several steps, significant amounts of data, and making some assumptions. This will,
in turn, feed into the TiVA estimation in the second stage.
3.1. International input-output tables
In brief, the supply and use tables (SUTs) show the whole economy, providing data on the
supply of goods and services produced domestically or imported, and the use of goods and
services as intermediates in production or as final products (Eurostat, 2008). Hence, the SUTs
give us the detailed view on the entire economy through the production processes, their
interactions, how goods and services are used and how they generate income; in effect they
link industries, products and sectors. On the other hand, the IOTs are a transformation of the
SUTs and provide aggregated data on production and consumption by sectors/industries
(UNSD, 2013).

12
Figure 4 is a simplified presentation of an SUT at a national level. The SUT is divided into a
supply side and a use side. The supply side provides information on the origin of goods and
services and consists of both domestic production and imports. The use side contains
information about how each good or service is utilized, either by other producers (intermediate
consumption), by final consumers (final consumption), as investment (capital formation), or by
consumers from other countries (exports). Total supply must equal total use.
Figure 4: Simplified supply and use table
Source: ADB, 2012.
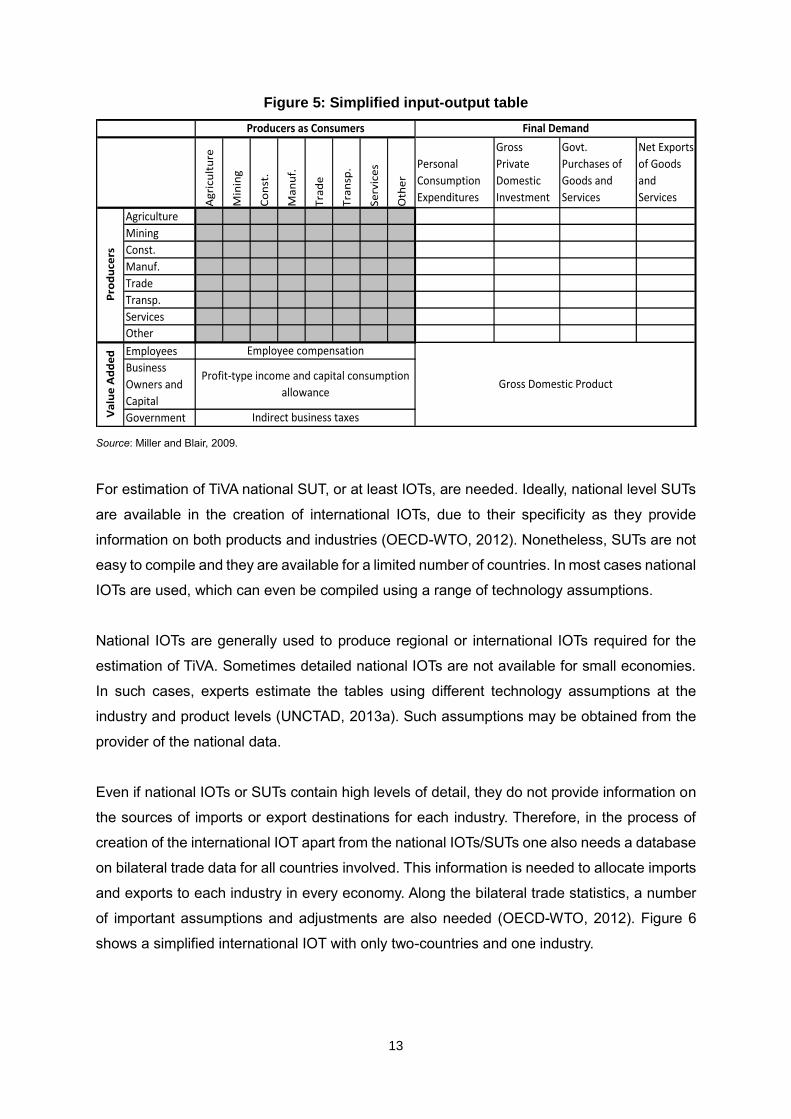
Figure 5 in turn presents a national IOT in a simple way by aggregating all industries into 8
sectors. In the rows we can see the distribution of each sector’s output (the inter-industry
transactions and sales to final consumers). In the columns we can see the inputs required in
production by each sector, plus the value added generated domestically, which is reflected in
the employees’ compensation, capital income, and indirect business taxes. National IOTs
allow us to understand the interaction between domestic industries.
Gov
ernm
ent
Hou
seho
lds
Non
prof
it in
stitu
tions
Serv
ing
Hou
seho
lds
Gro
ss F
ixed
Cap
ital
Form
atio
n
Cha
nges
in
Inve
ntor
ies
Goods
1
2
Services
1
2
Total
Goo
ds a
nd s
ervi
ces
SupplyTo
tal s
uppl
y =
tota
l use
Use
Final Consumption
Expenditure
Capital
Formation
Expo
rts
Inte
rmed
iate
Con
sum
ptio
n
Dom
estic
Pro
duct
ion
Impo
rts
13
Figure 5: Simplified input-output table
Source: Miller and Blair, 2009.
For estimation of TiVA national SUT, or at least IOTs, are needed. Ideally, national level SUTs
are available in the creation of international IOTs, due to their specificity as they provide
information on both products and industries (OECD-WTO, 2012). Nonetheless, SUTs are not
easy to compile and they are available for a limited number of countries. In most cases national
IOTs are used, which can even be compiled using a range of technology assumptions.
National IOTs are generally used to produce regional or international IOTs required for the
estimation of TiVA. Sometimes detailed national IOTs are not available for small economies.
In such cases, experts estimate the tables using different technology assumptions at the
industry and product levels (UNCTAD, 2013a). Such assumptions may be obtained from the
provider of the national data.
Even if national IOTs or SUTs contain high levels of detail, they do not provide information on
the sources of imports or export destinations for each industry. Therefore, in the process of
creation of the international IOT apart from the national IOTs/SUTs one also needs a database
on bilateral trade data for all countries involved. This information is needed to allocate imports
and exports to each industry in every economy. Along the bilateral trade statistics, a number
of important assumptions and adjustments are also needed (OECD-WTO, 2012). Figure 6
shows a simplified international IOT with only two-countries and one industry.
Ag
ricu
ltu
re
Min
ing
Co
nst
.
Ma
nu
f.
Tra
de
Tra
nsp
.
Se
rvic
es
Oth
er
Personal
Consumption
Expenditures
Gross
Private
Domestic
Investment
Govt.
Purchases of
Goods and
Services
Net Exports
of Goods
and
Services
Agriculture
Mining
Const.
Manuf.
Trade
Transp.
Services
Other
Employees
Business
Owners and
Capital
Government
Pro
du
cers
Va
lue
Ad
de
d
Final DemandProducers as Consumers
Employee compensation
Profit-type income and capital consumption
allowance
Indirect business taxes
Gross Domestic Product

14
Figure 6: Simplified international IOT with two countries and one industry
Source: UNCTAD, 2013a.
3.1.1. Basic assumptions
Usually, the proportionality assumption is used to allocate imports and exports between the
concerned countries. It assumes that the share of imported components in any product
intended for domestic consumption as an intermediate product or as part of final demand is
the same. Even if it is crucial in construction of an international IOT, the proportionality
assumption might be too far from reality for many developing countries, where products
destined to export usually contain a higher proportion of imported inputs than those destined
for domestic consumption (OECD-WTO, 2012).
According to Koopman et al (2008), this generates a significant overestimation of the domestic
value added embodied in exports for countries like China. In order to improve accuracy and
reduce the drawbacks associated with the proportionality assumption, researchers at the
World Input Output Database8 first allocate imports according to the categories, i.e.
intermediates, final consumption, and investment; and only then they use the proportionality
assumption within each category (Timmer, ed, 2012).
Another fundamental assumption used is that the coefficients between the inputs and outputs
in the production process are fixed and are referred to as the ‘technical coefficients’ (Miller and
Blair, 2009). For example, if the production of cars worth $10 billion requires $1 billion worth
8 http://www.wiod.org/new_site/home.htm
Country A Country B Country A Country B
Industry Industry Industry Industry
Contry A Industry
Intermediate use
of domestic
output
Intermediate use
of B of exports
from A
Final use of
domesic output
Final use by B of
exports from AXa
Country B Industry
Intermediate use
of A of exports
from B
Intermediate use
of domestic
output
Final use by A of
exports from B
Final use of
domesic outputXb
Va Vb
Xa Xb
Gross output
Value added
Gross input
Intermediate use Final demand
15
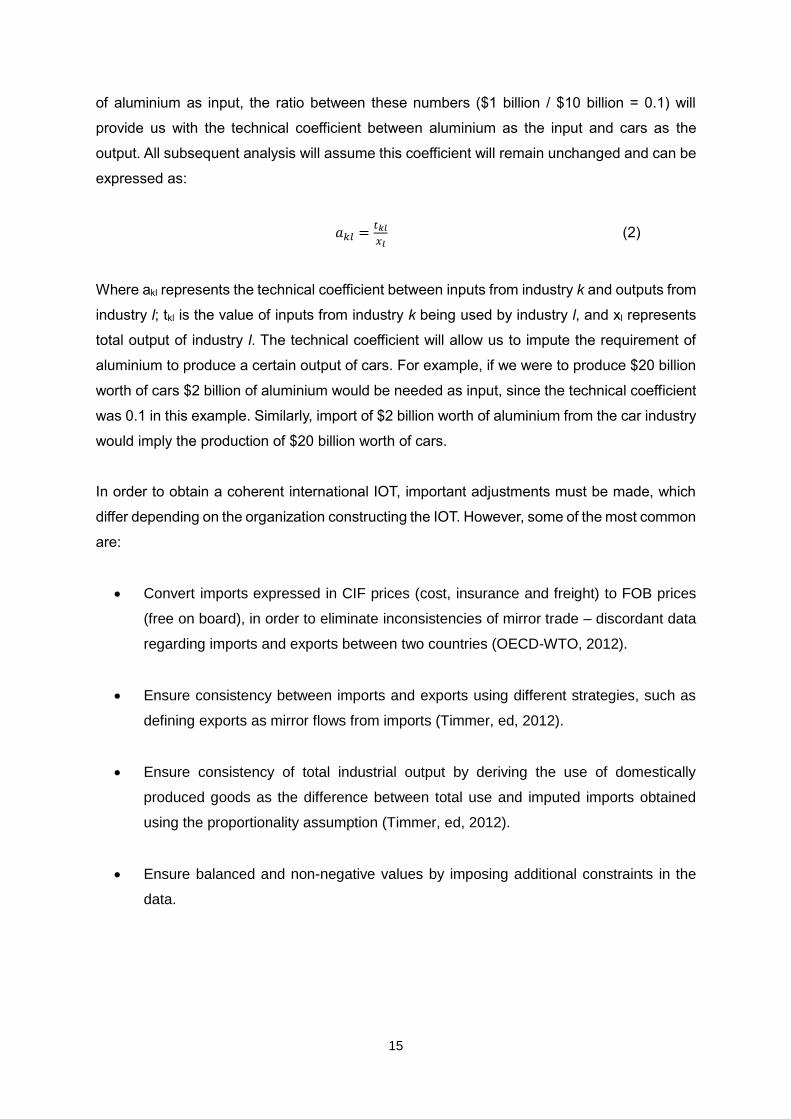
of aluminium as input, the ratio between these numbers ($1 billion / $10 billion = 0.1) will
provide us with the technical coefficient between aluminium as the input and cars as the
output. All subsequent analysis will assume this coefficient will remain unchanged and can be
expressed as:
𝑎𝑘𝑙 =𝑡𝑘𝑙
𝑥𝑙 (2)
Where akl represents the technical coefficient between inputs from industry k and outputs from
industry l; tkl is the value of inputs from industry k being used by industry l, and xl represents
total output of industry l. The technical coefficient will allow us to impute the requirement of
aluminium to produce a certain output of cars. For example, if we were to produce $20 billion
worth of cars $2 billion of aluminium would be needed as input, since the technical coefficient
was 0.1 in this example. Similarly, import of $2 billion worth of aluminium from the car industry
would imply the production of $20 billion worth of cars.
In order to obtain a coherent international IOT, important adjustments must be made, which
differ depending on the organization constructing the IOT. However, some of the most common
are:
Convert imports expressed in CIF prices (cost, insurance and freight) to FOB prices
(free on board), in order to eliminate inconsistencies of mirror trade – discordant data
regarding imports and exports between two countries (OECD-WTO, 2012).
Ensure consistency between imports and exports using different strategies, such as
defining exports as mirror flows from imports (Timmer, ed, 2012).
Ensure consistency of total industrial output by deriving the use of domestically
produced goods as the difference between total use and imputed imports obtained
using the proportionality assumption (Timmer, ed, 2012).
Ensure balanced and non-negative values by imposing additional constraints in the
data.
16
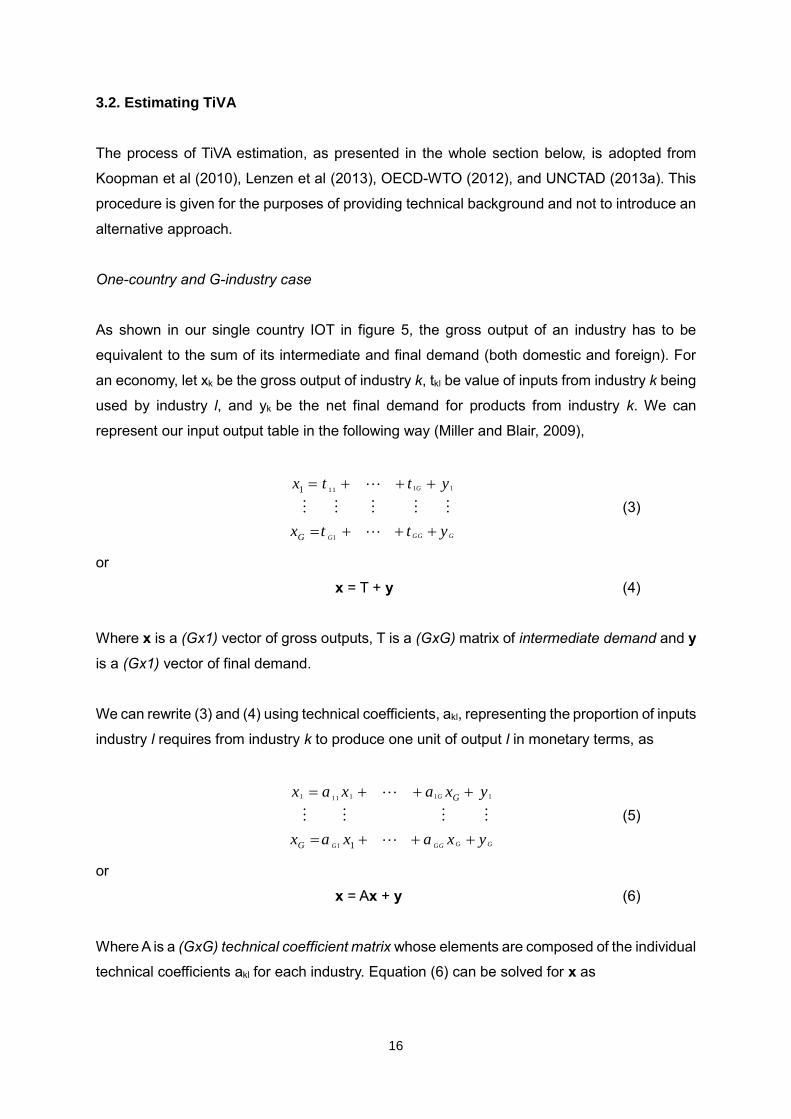
3.2. Estimating TiVA
The process of TiVA estimation, as presented in the whole section below, is adopted from
Koopman et al (2010), Lenzen et al (2013), OECD-WTO (2012), and UNCTAD (2013a). This
procedure is given for the purposes of providing technical background and not to introduce an
alternative approach.
One-country and G-industry case
As shown in our single country IOT in figure 5, the gross output of an industry has to be
equivalent to the sum of its intermediate and final demand (both domestic and foreign). For
an economy, let xk be the gross output of industry k, tkl be value of inputs from industry k being
used by industry l, and yk be the net final demand for products from industry k. We can
represent our input output table in the following way (Miller and Blair, 2009),
GGGG
G
y
y
tt
tt
x
x
G
1
1
1111
(3)
or
x = T + y (4)
Where x is a (Gx1) vector of gross outputs, T is a (GxG) matrix of intermediate demand and y
is a (Gx1) vector of final demand.
We can rewrite (3) and (4) using technical coefficients, akl, representing the proportion of inputs
industry l requires from industry k to produce one unit of output l in monetary terms, as
GGGGG
G
y
y
xaxa
xaxa
x
x G
G
1
1
11111
1
(5)
or
x = Ax + y (6)
Where A is a (GxG) technical coefficient matrix whose elements are composed of the individual
technical coefficients akl for each industry. Equation (6) can be solved for x as
17
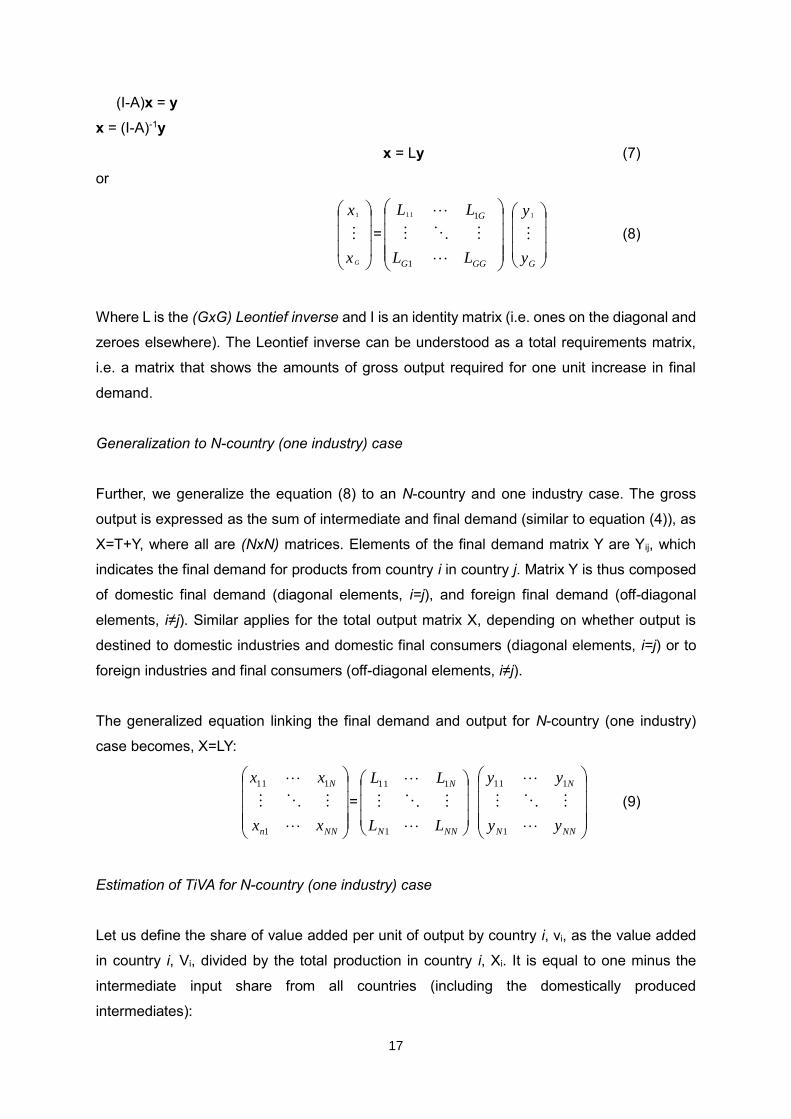
(I-A)x = y
x = (I-A)-1y
x = Ly (7)
or
Gx
x
1
=
GGG
G
LL
LL
1
111
Gy
y
1
(8)
Where L is the (GxG) Leontief inverse and I is an identity matrix (i.e. ones on the diagonal and
zeroes elsewhere). The Leontief inverse can be understood as a total requirements matrix,
i.e. a matrix that shows the amounts of gross output required for one unit increase in final
demand.
Generalization to N-country (one industry) case
Further, we generalize the equation (8) to an N-country and one industry case. The gross
output is expressed as the sum of intermediate and final demand (similar to equation (4)), as
X=T+Y, where all are (NxN) matrices. Elements of the final demand matrix Y are Yij, which
indicates the final demand for products from country i in country j. Matrix Y is thus composed
of domestic final demand (diagonal elements, i=j), and foreign final demand (off-diagonal
elements, i≠j). Similar applies for the total output matrix X, depending on whether output is
destined to domestic industries and domestic final consumers (diagonal elements, i=j) or to
foreign industries and final consumers (off-diagonal elements, i≠j).
The generalized equation linking the final demand and output for N-country (one industry)
case becomes, X=LY:
NNn
N
xx
xx
1
111
=
NNN
N
LL
LL
1
111
NNN
N
yy
yy
1
111
(9)
Estimation of TiVA for N-country (one industry) case
Let us define the share of value added per unit of output by country i, vi, as the value added
in country i, Vi, divided by the total production in country i, Xi. It is equal to one minus the
intermediate input share from all countries (including the domestically produced
intermediates):

18
𝑣𝑖 = 𝑉𝑖
𝑋𝑖= 1 − ∑ 𝐴𝑖𝑠𝑠 (10)
Where Vi is the (domestic) value added in country i, and Xi is the total output in country i (both
shown in the IOT, see figure 6). Let us place the individual shares of value added vi as diagonal
elements in a (NxN) matrix to obtain the value added matrix, V, of direct domestic value added
for all countries (remember that in this case we only have one industry per country).
𝑉 = (𝑣1 ⋯ 0⋮ ⋱ ⋮0 ⋯ 𝑣𝑁
) (11)
Multiplying the value added matrix V with the Leontief inverse L will give us the information on
how much value added each country needs from its own production and how much from others
to reach its current levels of output. The resulting value added share matrix, M = VL, will
express the value added requirements in proportional terms. This means, that the underlying
international production structure helps us to understand how the value added of all countries
is being used.
In the value added share matrix the diagonal elements denote the domestic value added share
of domestically produced products; whereas the off-diagonal elements denote the share of
foreign value added in production of these same goods. This matrix also contains all the
information on how to allocate the domestic share in production and the foreign component.
This is then carried out using the gross exports.
Let eij be the value of gross exports from county i to country j, and ei* the aggregated gross
exports from country i to all its partners. Then, we can construct the exports matrix, E, by
placing the values of exports of country i, ei*, on its diagonal and zeroes off the diagonal:
𝑒𝑖∗ = ∑ 𝑒𝑖𝑗𝑖≠𝑗
(12)
𝐸 = (𝑒1∗ ⋯ 0
⋮ ⋱ ⋮0 ⋯ 𝑒𝑁∗
)
(13)

19
By multiplying the value added share matrix and the exports matrix we obtain the actual
domestic and foreign value added embodied in gross exports, ie. TiVA, as:
�̂� = 𝑉𝐿𝐸
(14)
or
*
*1
1
1111
1
111
0
0
0
0
ˆˆ
ˆˆ
NNNN
N
NNNN
N
e
e
LL
LL
v
v
TT
TT
(15)
The elements in the TiVA matrix – �̂� – can be interpreted as follows:
The diagonal elements show the domestic value added embodied in exports (DVA).
For example, �̂�11 = v1L11𝑒1∗, represents the value that country 1 needs from itself to
produce its exports.
The off-diagonal column elements represent the foreign value added embodied in
exports (FVA). That is, �̂�𝑘1 (where k≠1, i.e. �̂�21 to �̂�𝑁1), as so �̂�𝑘1 = v𝑘Lk1𝑒1∗, denotes
the value added that country 1 must import from country k to generate its exports. By
adding all off-diagonal column elements for country 1, �̂�𝑘1 (for k≠1, that is excluding
�̂�11), we obtain the total foreign value added (FVA) content of exports of country 1.
The off-diagonal row elements represent the indirect value added exports (DVX). For
example, �̂�1𝑘 = v1L1ke𝑘∗, represents the value added exported by country 1 to country
k and used by country k to produce its exports. By adding all these elements �̂�1𝑘 (for
k≠1, that is excluding �̂�11) we can understand how much of country 1’s exports enter
as intermediates into third countries’ exports.
The above TiVA matrix shows how value added is generated (columns) – domestic (DVA) and
foreign value added (FVA) – and how it is distributed (rows) – indirect value added exports
(DVX). Since value can only flow between countries, the total value of what each country
sources from other countries has to be equal to the total level of value added in exports of
other countries, that means that FVA = DVX on a global level.
20
The TiVA matrix also links to the total gross exports. The sum of column k will give the gross
exports of country k; whereas, the sum of row l (excluding the diagonal element) will give us
the total indirect value added exports (DVX) of country l, and as such gives a rough estimation
for the double counting embedded in the gross trade.
It is worth noting that this estimation shows the content of exports, i.e. domestic/foreign value
added embodied in gross exports, and is independent of how the value is used by importers;
as opposed to the value added trade, which depends on how a country's exports are used by
importers. In order to estimate the latter we would need to balance the value added share
matrix with a matrix of final demand, i.e. VLY, where Y is the final demand matrix.
Generalization to N-country and G-industry case
The above equation (14) can easily be generalized for N-country and G-industry case.
Whereby, for each country we have G industries, resulting in (GxG) matrices, which will, in
turn, be stacked in block matrices for the N-country system.
In general, vector and matrix dimensions will change as follows: x and y become a (NGx1)
vectors; the share of value added per unit of output, vi becomes a (1xG) row vector, which is
put in the diagonal to obtain Vi as (GxG) matrix for each country i, and hence the value added
matrix V becomes (NxNG) matrix; the Leontief inverse for each country pair is Lij a (GxG)
matrix, and for the whole system L is a (NGxNG) block matrix; and the export matrix for each
country pair is Eij a (GxG) matrix and for the whole system E becomes a (NGxNG) block matrix.
Hence, the TiVA estimate in the case of N-countries and G-industries will be a (NxNG) matrix,
as �̂� = 𝑉𝐿𝐸.
Decomposition of gross exports (GE)
Gross exports Eij of country i to country j, can be decomposed into the export of intermediates
(AijXj) and the export of final demand (Yij). Intermediates can further be decomposed into
intermediates processed and absorbed for final consumption in country j (AijXjj), intermediates
processed in country j and exported to any third country t (AijXjt), and intermediates processed
in country j and exported back to country i (AijXji), obtaining the following decomposition of
gross exports:
21
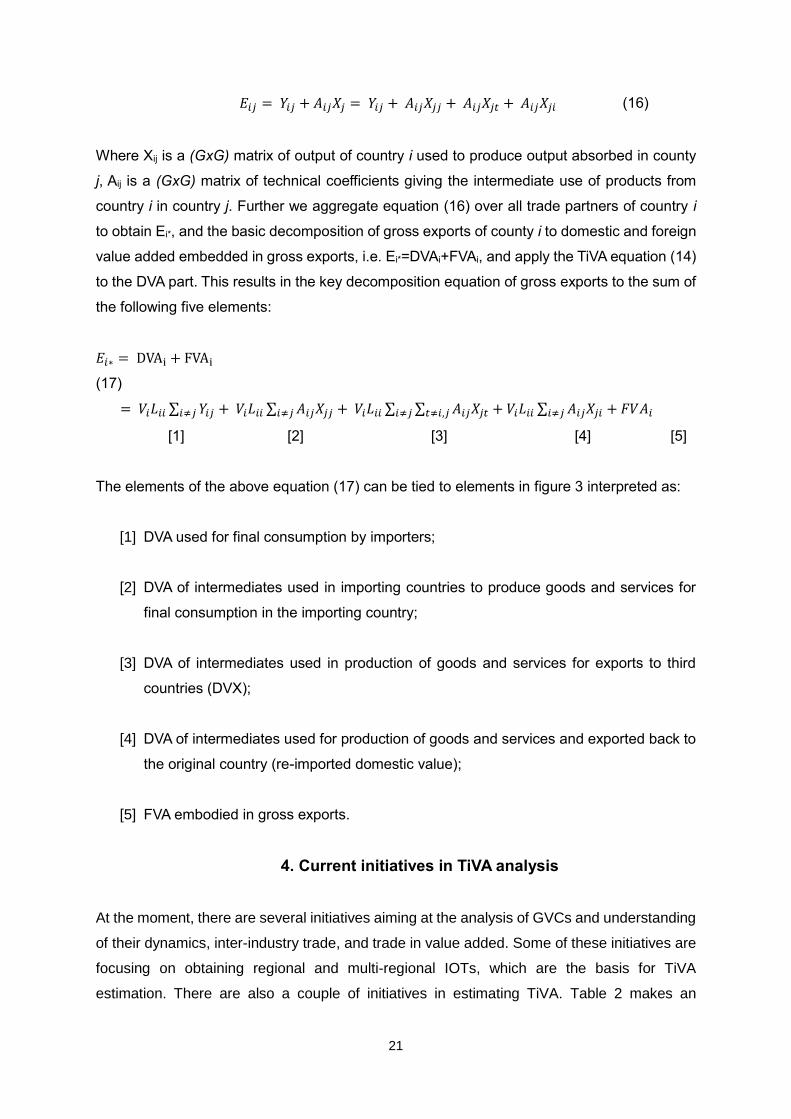
𝐸𝑖𝑗 = 𝑌𝑖𝑗 + 𝐴𝑖𝑗𝑋𝑗 = 𝑌𝑖𝑗 + 𝐴𝑖𝑗𝑋𝑗𝑗 + 𝐴𝑖𝑗𝑋𝑗𝑡 + 𝐴𝑖𝑗𝑋𝑗𝑖 (16)
Where Xij is a (GxG) matrix of output of country i used to produce output absorbed in county
j, Aij is a (GxG) matrix of technical coefficients giving the intermediate use of products from
country i in country j. Further we aggregate equation (16) over all trade partners of country i
to obtain Ei*, and the basic decomposition of gross exports of county i to domestic and foreign
value added embedded in gross exports, i.e. Ei*=DVAi+FVAi, and apply the TiVA equation (14)
to the DVA part. This results in the key decomposition equation of gross exports to the sum of
the following five elements:
𝐸𝑖∗ = DVAi + FVAi
(17)
= 𝑉𝑖𝐿𝑖𝑖 ∑ 𝑌𝑖𝑗𝑖≠𝑗 + 𝑉𝑖𝐿𝑖𝑖 ∑ 𝐴𝑖𝑗𝑋𝑗𝑗𝑖≠𝑗 + 𝑉𝑖𝐿𝑖𝑖 ∑ ∑ 𝐴𝑖𝑗𝑋𝑗𝑡𝑡≠𝑖,𝑗𝑖≠𝑗 + 𝑉𝑖𝐿𝑖𝑖 ∑ 𝐴𝑖𝑗𝑋𝑗𝑖𝑖≠𝑗 + 𝐹𝑉𝐴𝑖
[1] [2] [3] [4] [5]
The elements of the above equation (17) can be tied to elements in figure 3 interpreted as:
[1] DVA used for final consumption by importers;
[2] DVA of intermediates used in importing countries to produce goods and services for
final consumption in the importing country;
[3] DVA of intermediates used in production of goods and services for exports to third
countries (DVX);
[4] DVA of intermediates used for production of goods and services and exported back to
the original country (re-imported domestic value);
[5] FVA embodied in gross exports.
4. Current initiatives in TiVA analysis
At the moment, there are several initiatives aiming at the analysis of GVCs and understanding
of their dynamics, inter-industry trade, and trade in value added. Some of these initiatives are
focusing on obtaining regional and multi-regional IOTs, which are the basis for TiVA
estimation. There are also a couple of initiatives in estimating TiVA. Table 2 makes an
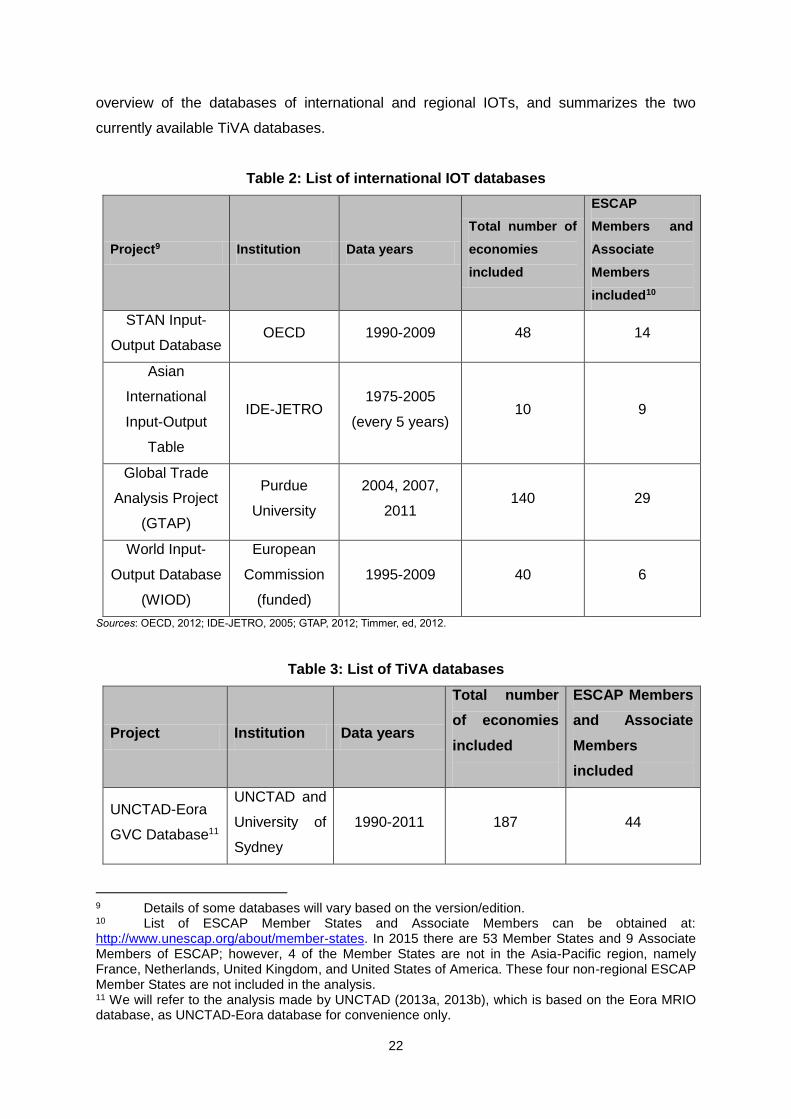
22
overview of the databases of international and regional IOTs, and summarizes the two
currently available TiVA databases.
Table 2: List of international IOT databases
Project9 Institution Data years
Total number of
economies
included
ESCAP
Members and
Associate
Members
included10
STAN Input-
Output Database OECD 1990-2009 48 14
Asian
International
Input-Output
Table
IDE-JETRO 1975-2005
(every 5 years) 10 9
Global Trade
Analysis Project
(GTAP)
Purdue
University
2004, 2007,
2011 140 29
World Input-
Output Database
(WIOD)
European
Commission
(funded)
1995-2009 40 6
Sources: OECD, 2012; IDE-JETRO, 2005; GTAP, 2012; Timmer, ed, 2012.
Table 3: List of TiVA databases
Project Institution Data years
Total number
of economies
included
ESCAP Members
and Associate
Members
included
UNCTAD-Eora
GVC Database11
UNCTAD and
University of
Sydney
1990-2011 187 44
9 Details of some databases will vary based on the version/edition. 10 List of ESCAP Member States and Associate Members can be obtained at: http://www.unescap.org/about/member-states. In 2015 there are 53 Member States and 9 Associate Members of ESCAP; however, 4 of the Member States are not in the Asia-Pacific region, namely France, Netherlands, United Kingdom, and United States of America. These four non-regional ESCAP Member States are not included in the analysis. 11 We will refer to the analysis made by UNCTAD (2013a, 2013b), which is based on the Eora MRIO database, as UNCTAD-Eora database for convenience only.
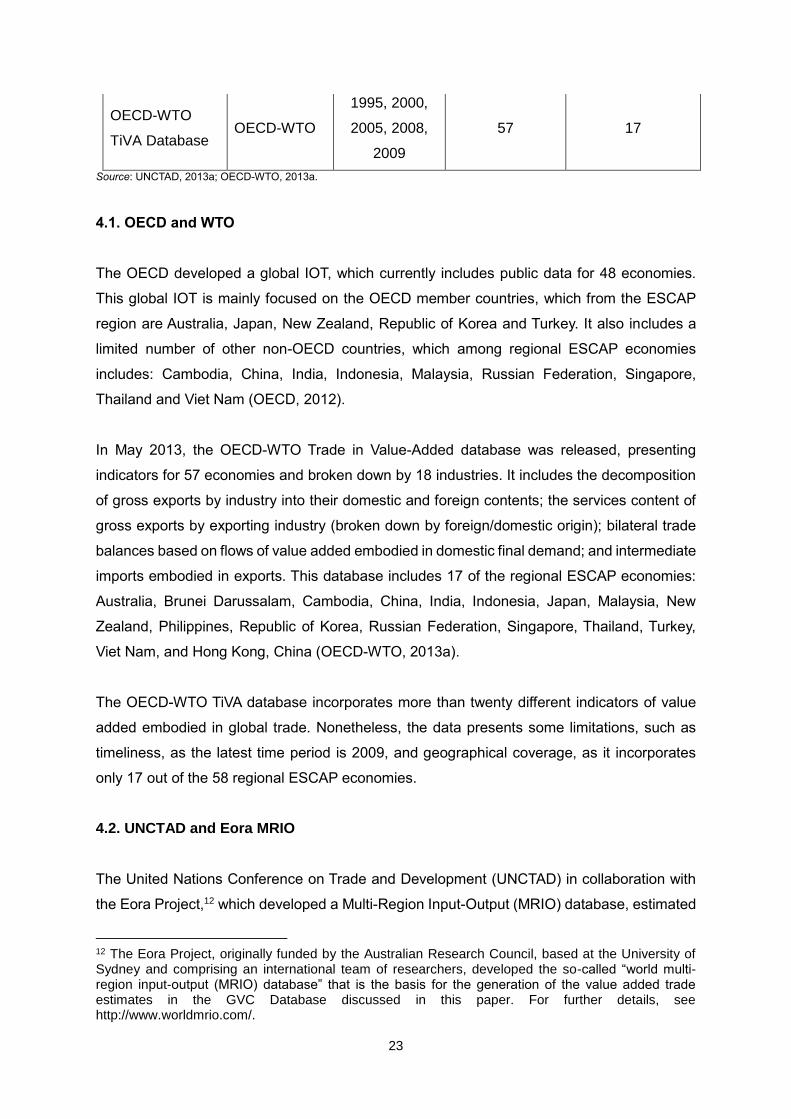
23
OECD-WTO
TiVA Database OECD-WTO
1995, 2000,
2005, 2008,
2009
57 17
Source: UNCTAD, 2013a; OECD-WTO, 2013a.
4.1. OECD and WTO
The OECD developed a global IOT, which currently includes public data for 48 economies.
This global IOT is mainly focused on the OECD member countries, which from the ESCAP
region are Australia, Japan, New Zealand, Republic of Korea and Turkey. It also includes a
limited number of other non-OECD countries, which among regional ESCAP economies
includes: Cambodia, China, India, Indonesia, Malaysia, Russian Federation, Singapore,
Thailand and Viet Nam (OECD, 2012).
In May 2013, the OECD-WTO Trade in Value-Added database was released, presenting
indicators for 57 economies and broken down by 18 industries. It includes the decomposition
of gross exports by industry into their domestic and foreign contents; the services content of
gross exports by exporting industry (broken down by foreign/domestic origin); bilateral trade
balances based on flows of value added embodied in domestic final demand; and intermediate
imports embodied in exports. This database includes 17 of the regional ESCAP economies:
Australia, Brunei Darussalam, Cambodia, China, India, Indonesia, Japan, Malaysia, New
Zealand, Philippines, Republic of Korea, Russian Federation, Singapore, Thailand, Turkey,
Viet Nam, and Hong Kong, China (OECD-WTO, 2013a).
The OECD-WTO TiVA database incorporates more than twenty different indicators of value
added embodied in global trade. Nonetheless, the data presents some limitations, such as
timeliness, as the latest time period is 2009, and geographical coverage, as it incorporates
only 17 out of the 58 regional ESCAP economies.
4.2. UNCTAD and Eora MRIO
The United Nations Conference on Trade and Development (UNCTAD) in collaboration with
the Eora Project,12 which developed a Multi-Region Input-Output (MRIO) database, estimated
12 The Eora Project, originally funded by the Australian Research Council, based at the University of Sydney and comprising an international team of researchers, developed the so-called “world multi-region input-output (MRIO) database” that is the basis for the generation of the value added trade estimates in the GVC Database discussed in this paper. For further details, see http://www.worldmrio.com/.

24
TiVA indicators for most economies in the world (Lenzen et al, 2012, Lenzen et al, 2013). This
database was first published in the “Global Value Chains and Development” report (UNCTAD,
2013a), which introduced some initial findings with regards to participation in GVCs;
subsequently it was also referred to in the 2013 World Investment Report (UNCTAD, 2013b).13
The Eora dataset provides input-output tables for 187 individual economies and 15,909
sectors; it has a continuous coverage for 22 years (from 1990 to 2011) and it provides a series
of indicators on trade an environment issues (Lenzen et al, 2013). The dataset fully covers 4
out of 5 ESCAP sub-regions (East and North-East Asia, South-East Asia, South and South-
West Asia and North and Central Asia), with some gaps in the Pacific subregion. Out of
ESCAP's 58 regional Members and Associate Members, 44 are covered. The 14 economies
not considered all belong to the Pacific subregion.
In order to estimate the Eora MRIO, researchers from the University of Sydney followed the
procedure shown below (Lenzen et al, 2012, Lenzen et al, 2013):
1. Collection of national supply and use tables or national input-output tables when the
former were not available. The aim was to obtain information on the goods and services
produced by each domestic industry and their use by another industries or a final user.
2. Link SUTs or IOTs through international trade statistics using import tables to obtain a
MRIO table.
3. Balance the MRIO such that the total output produced by each industry equals the sum
of inputs (including value added).
The creators of the Eora MRIO faced many challenges, the most important being the lack of
information from small economies. In order to deal with this issue, different assumptions were
used to impute the missing data. However, balancing the information for 187 economies
signified an additional burden that was dealt with by using refined econometric models.
13 UNCTAD does not release the database. The Eora MRIO project make the database free for academic (university or grant-funded) work at degree-granting institutions. All other uses require a data license before the results are shared (http://worldmrio.com/license.jsp).
25
4.3. Other initiatives
The World Input-Output Database (WIOD) is one of the initiatives to obtain international IOTs.
It is funded by the Research Directorate General of the European Commission and covers 27
EU countries and 13 other economies from 1995 to 2009 (Timmer, ed, 2012). However, only
six regional ESCAP economies are covered, i.e. Australia, China, India, Indonesia, Republic
of Korea and the Russian Federation. The WIOD does not estimate TiVA, but the intentional
IOT could be used for its estimation.
Recently, IDE-JETRO released their 2005 Asian IOT, which includes nine regional ESCAP
countries, i.e. China, Indonesia, Japan, Malaysia, the Philippines, Republic of Korea,
Singapore, and Thailand. It gives a picture of input composition and output distribution of each
domestic industry vis-à-vis home and foreign industries. Note that many less developed and
smaller economies in the region are left out. IDE-JETRO also does not provide estimates of
TiVA, but it could be estimated from the IOT (IDE-JETRO, 2005).
The Global Trade Analysis Project (GTAP), coordinated by the Centre for Global Trade
Analysis at Purdue University, focuses on bilateral trade, production, consumption and use of
intermediate goods and services. The different versions of the GTAP database are considered
consistent representations of the world economy; they are created using national IOTs as well
as trade data from other sources. The latest version, GTAP data base 9, includes 29 of the
regional ESCAP economies. TiVA is not estimated but could be obtained using this database
(GTAP, 2012).
Working with national statistical offices and developing their capacity in the construction of
SUTs and/or IOTs may be the best approach to improve the measurement of trade in value
added. In this regard, the ADB started a regional technical assistance program (RETA) at the
end of 2008.14 They worked with 18 economies in the Asia-Pacific region to develop sufficient
technical assistance, appropriate methodology, and specific solutions for each economy, and
resulted that all economies successfully completed their SUTs. To build on the outcomes of
the previous project and to update the SUTs of the participating economies, ADB initiated a
new technical assistance project in 2014.15
14 For more information see: http://www.adb.org/data/icp/reta-6483. 15 For more information see: http://www.adb.org/sites/default/files/project-document/152171/48387-001-tar.pdf
26
The Asia-Pacific Economic Cooperation (APEC) has a project entitled Strategic Framework
on Measurement of APEC TiVA under GVCs. It aims at measuring TiVA and understanding its
policy implications with regards to trade, investment, employment, etc. The enhanced
measurements would be used to facilitate the implementation of APEC Recommendations on
Promoting GVCs Development and Cooperation, encouraging the liberalization of trade and
investment. They will closely work with other international organizations and the exiting
databases, mainly the OECD-WTO database. During 2015-2017, APEC will prepare and unify
standards and work on training and capacity building to start the compilation of APEC IOTs.
The compilation process will be undertaken in collaboration with the OECD-WTO and is
expected to be finalized by 2018 (APEC, 2014).
5. TiVA analysis for selected ESCAP economies
In this section we present an initial TiVA analysis for the regional ESCAP Members States and
Associate Members16 that are included in the two main data sources available.
5.1. Description of the data sources
In this analysis we use data from the OECD-WTO TiVA database17 and analysis made by
UNCTAD (2013a, 2013b), which is based on the Eora MRIO database (Lenzen et al, 2012
and Lenzen et al, 2013), to which we will refer as the UNCTAD-Eora database for convenience
only.
Out of the 58 regional ESCAP economies, 17 are included18 in the OECD-WTO TiVA
database, which represent approximately 95% of both the region’s GDP and total exports of
merchandise in 2009. On the other hand, the UNCTAD-Eora database includes 44 of the
regional ESCAP economies. However, the detailed datasets for individual economies of only
OECD-WTO are available to ESCAP so the extent to which we can compare information
between the sources is limited.
16 List of ESCAP Member States and Associate Members can be obtained at: http://www.unescap.org/about/member-states. In 2015 there are 53 Member States and 9 Associate Members of ESCAP; however, 4 of the Member States are not in the Asia-Pacific region, namely France, Netherlands, United Kingdom, and United States of America. These four non-regional ESCAP Member States are not included in the analysis. 17 Accessible at: https://stats.oecd.org/index.aspx?queryid=47807 18 The 17 economies included are: Australia, Brunei Darussalam, Cambodia, China, India, Indonesia, Japan, Malaysia, New Zealand, Philippines, Republic of Korea, Russian Federation, Singapore, Thailand, Turkey, Viet Nam, and Hong Kong, China.
27
Fourteen of the economies analysed are included in both of the sources. An initial comparison
of the results obtained from these databases in terms of the shares of domestic value added
in gross exports shows a high similarity between the results. The OECD-WTO and UNCTAD-
Eora results are similar for most economies, with two important exceptions: Singapore and
Hong Kong, China. The OECD-WTO database estimates Hong Kong, China’s share of
domestic value added in gross exports to be 72%, whereas the UNCTAD-Eora database
estimates it to be only 46%; in the case of Singapore the OECD-WTO estimates the share of
domestic value added of 50%, compared to 36% estimated by UNCTAD-Eora. The significant
differences with respect to the domestic value added in the cases of Hong Kong, China and
Singapore could be due to the measurement of value added of services. Both economies are
traditional places for trade (i.e. economies where merchandise is imported and then re-
exported at higher prices) and the extent to which this importing and re-exporting is accounted
as a services value added could make a significant difference in the results.
5.2. Regional TiVA
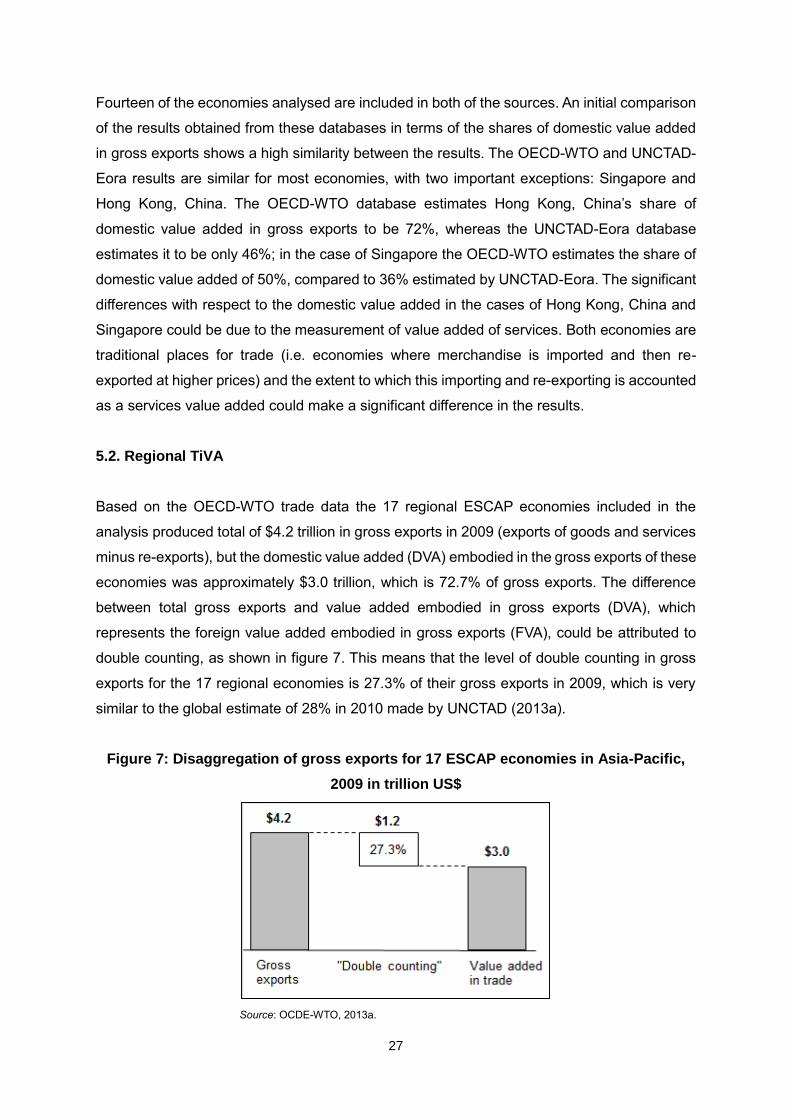
Based on the OECD-WTO trade data the 17 regional ESCAP economies included in the
analysis produced total of $4.2 trillion in gross exports in 2009 (exports of goods and services
minus re-exports), but the domestic value added (DVA) embodied in the gross exports of these
economies was approximately $3.0 trillion, which is 72.7% of gross exports. The difference
between total gross exports and value added embodied in gross exports (DVA), which
represents the foreign value added embodied in gross exports (FVA), could be attributed to
double counting, as shown in figure 7. This means that the level of double counting in gross
exports for the 17 regional economies is 27.3% of their gross exports in 2009, which is very
similar to the global estimate of 28% in 2010 made by UNCTAD (2013a).
Figure 7: Disaggregation of gross exports for 17 ESCAP economies in Asia-Pacific,
2009 in trillion US$
Source: OCDE-WTO, 2013a.

28
Detailed analysis reveals large variation between individual economies. The domestic value
added in gross exports ratio, also referred to as the “export ratio,” shows the percentage of
domestic value added embodied in gross exports as a share of total gross exports of that
economy. It is expected that the size of the economy, the composition of its exports, and its
economic structure and export model determine the domestic value added in gross exports
(UNCTAD, 2013a).
Larger economies tend to have longer national value chains and thus present higher levels of
domestic value added; exporters of services and commodities/raw materials need few foreign
inputs and thus present higher share of domestic value added in gross exports. This is further
supported with data as shown in figure 8. We can see that economies exporting large amounts
of natural resources, such as Australia, Brunei Darussalam and Russian Federation, exhibit
higher domestic value in gross exports. Larger economies with developed internal value
chains, such as Japan, and economies that rely mostly on services, such as India, also exhibit
high levels of domestic value added relative to gross exports. On the other hand, economies
which are heavily involved in global value chains and require high imports of intermediate
goods and services, such as Singapore, present lower shares of domestic value added in their
gross exports. China is clearly the largest merchandise exporter in the region, but a significant
share of its exports depends on imported intermediates and raw materials from abroad. The
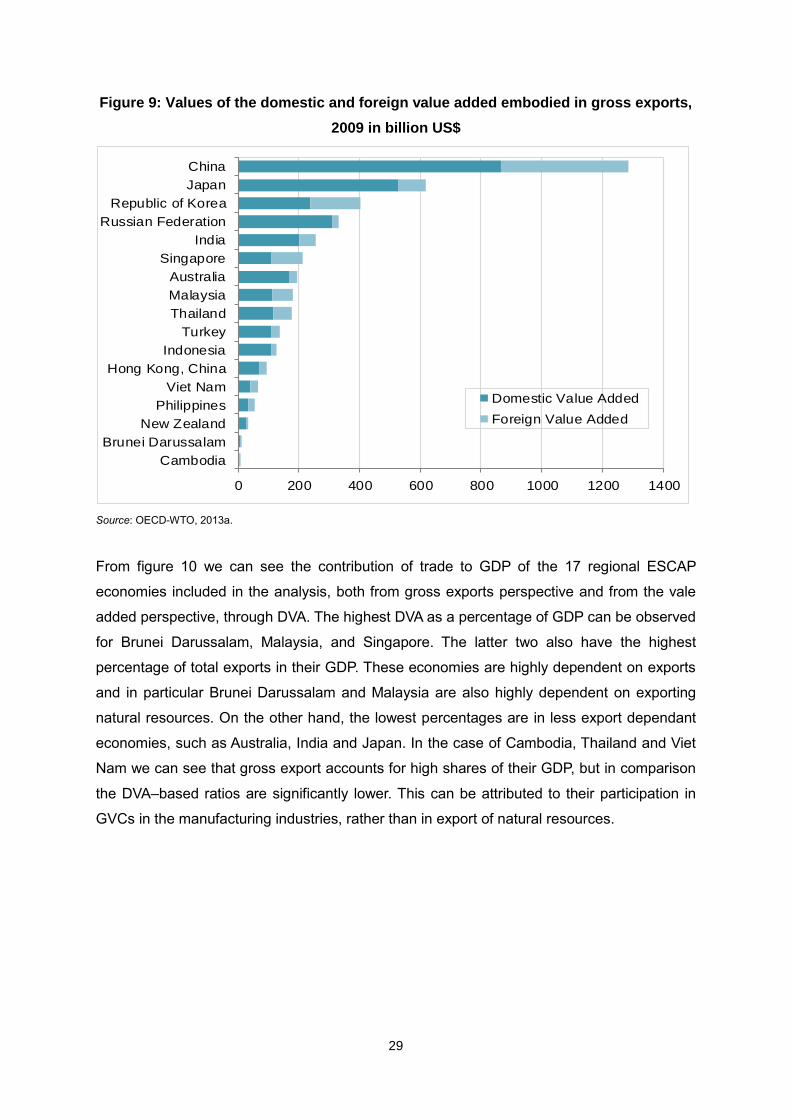
disaggregation of gross exports for the economies analysed can be seen from figure 9, which
shows the values of the domestic and foreign value added embodied in gross exports.
Figure 8: Shares of domestic value added in gross exports, 2009
Source: OECD-WTO, 2013a.
93.1%88.7% 87.5% 85.6% 85.2%
81.6%78.2% 78.1%
71.5%67.4% 65.9% 65.5%
63.4% 62.1% 61.6%59.4%
50.1%
Russia
n F
ede
ration
Bru
nei D
aru
ssala
m
Austr
alia
Indo
nesia
Jap
an
New
Ze
ala
nd
Turk
ey
India
Hong K
ong,
Chin
a
Chin
a
Cam
bodia
Thailand
Vie
t N
am
Mala
ysia
Phili
ppin
es
Republic o
f K
ore
a
Sin
ga
pore
29
Figure 9: Values of the domestic and foreign value added embodied in gross exports,
2009 in billion US$
Source: OECD-WTO, 2013a.
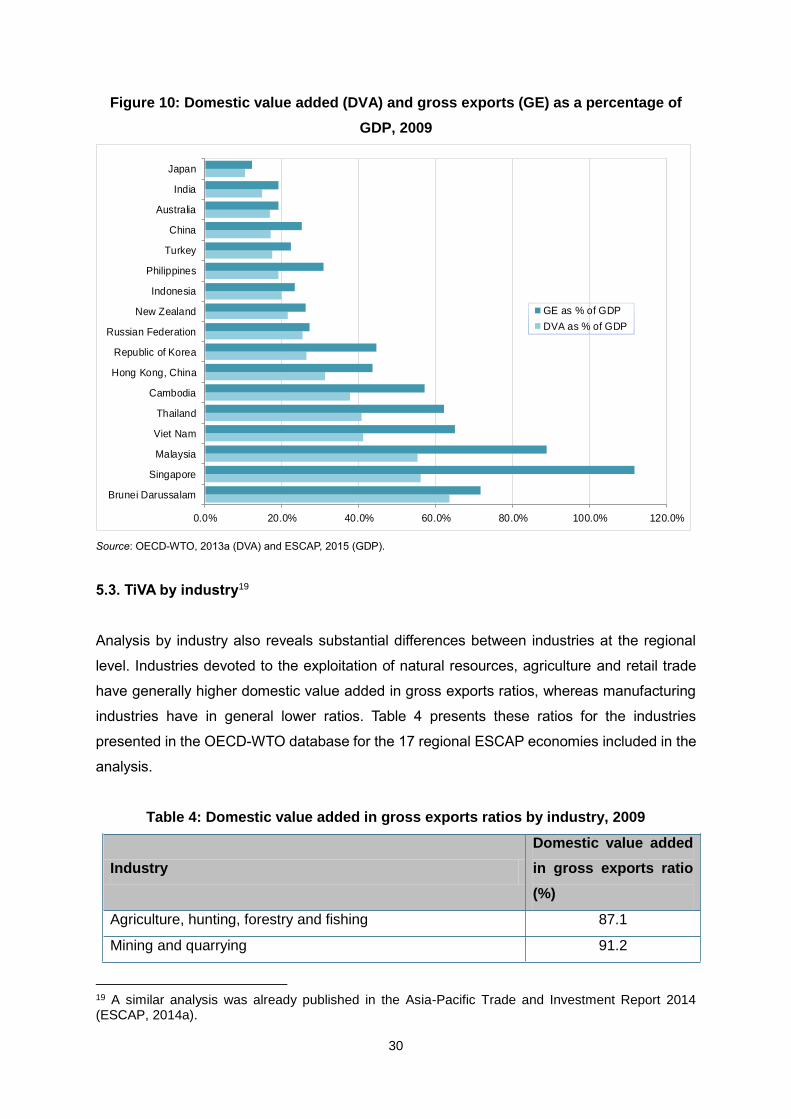
From figure 10 we can see the contribution of trade to GDP of the 17 regional ESCAP
economies included in the analysis, both from gross exports perspective and from the vale
added perspective, through DVA. The highest DVA as a percentage of GDP can be observed
for Brunei Darussalam, Malaysia, and Singapore. The latter two also have the highest
percentage of total exports in their GDP. These economies are highly dependent on exports
and in particular Brunei Darussalam and Malaysia are also highly dependent on exporting
natural resources. On the other hand, the lowest percentages are in less export dependant
economies, such as Australia, India and Japan. In the case of Cambodia, Thailand and Viet
Nam we can see that gross export accounts for high shares of their GDP, but in comparison
the DVA–based ratios are significantly lower. This can be attributed to their participation in
GVCs in the manufacturing industries, rather than in export of natural resources.
0 200 400 600 800 1000 1200 1400
Cambodia
Brunei Darussalam
New Zealand
Philippines
Viet Nam
Hong Kong, China
Indonesia
Turkey
Thailand
Malaysia
Australia
Singapore
India
Russian Federation
Republic of Korea
Japan
China
Domestic Value Added
Foreign Value Added
30
Figure 10: Domestic value added (DVA) and gross exports (GE) as a percentage of
GDP, 2009
Source: OECD-WTO, 2013a (DVA) and ESCAP, 2015 (GDP).
5.3. TiVA by industry19
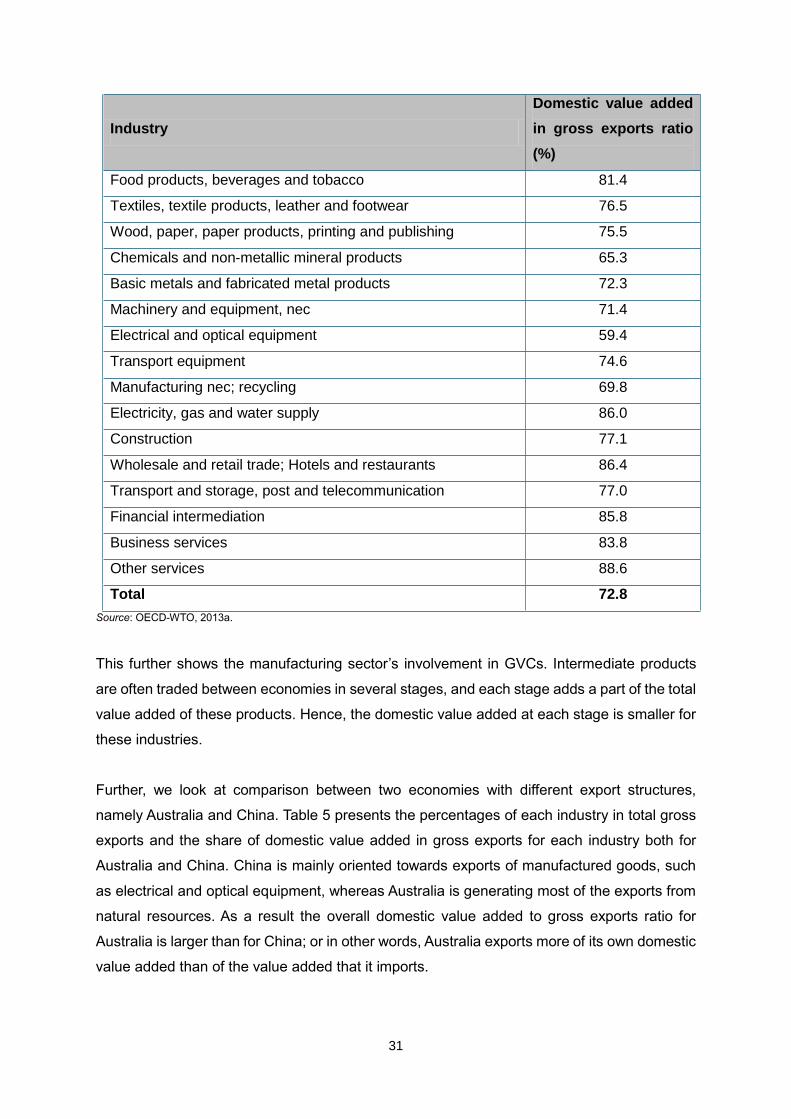
Analysis by industry also reveals substantial differences between industries at the regional
level. Industries devoted to the exploitation of natural resources, agriculture and retail trade
have generally higher domestic value added in gross exports ratios, whereas manufacturing
industries have in general lower ratios. Table 4 presents these ratios for the industries
presented in the OECD-WTO database for the 17 regional ESCAP economies included in the
analysis.
Table 4: Domestic value added in gross exports ratios by industry, 2009
Industry
Domestic value added
in gross exports ratio
(%)
Agriculture, hunting, forestry and fishing 87.1
Mining and quarrying 91.2
19 A similar analysis was already published in the Asia-Pacific Trade and Investment Report 2014 (ESCAP, 2014a).
0.0% 20.0% 40.0% 60.0% 80.0% 100.0% 120.0%
Brunei Darussalam
Singapore
Malaysia
Viet Nam
Thailand
Cambodia
Hong Kong, China
Republic of Korea
Russian Federation
New Zealand
Indonesia
Philippines
Turkey
China
Australia
India
Japan
GE as % of GDP
DVA as % of GDP
31
Industry
Domestic value added
in gross exports ratio
(%)
Food products, beverages and tobacco 81.4
Textiles, textile products, leather and footwear 76.5
Wood, paper, paper products, printing and publishing 75.5
Chemicals and non-metallic mineral products 65.3
Basic metals and fabricated metal products 72.3
Machinery and equipment, nec 71.4
Electrical and optical equipment 59.4
Transport equipment 74.6
Manufacturing nec; recycling 69.8
Electricity, gas and water supply 86.0
Construction 77.1
Wholesale and retail trade; Hotels and restaurants 86.4
Transport and storage, post and telecommunication 77.0
Financial intermediation 85.8
Business services 83.8
Other services 88.6
Total 72.8
Source: OECD-WTO, 2013a.
This further shows the manufacturing sector’s involvement in GVCs. Intermediate products
are often traded between economies in several stages, and each stage adds a part of the total
value added of these products. Hence, the domestic value added at each stage is smaller for
these industries.
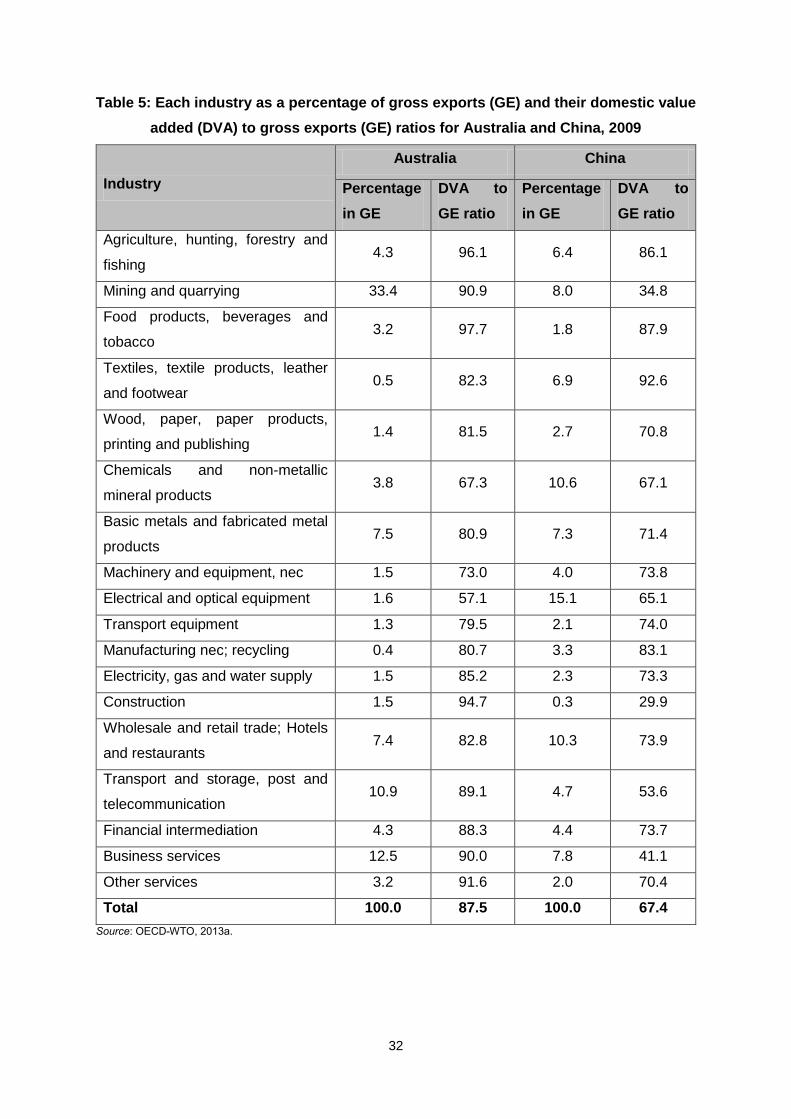
Further, we look at comparison between two economies with different export structures,
namely Australia and China. Table 5 presents the percentages of each industry in total gross
exports and the share of domestic value added in gross exports for each industry both for
Australia and China. China is mainly oriented towards exports of manufactured goods, such
as electrical and optical equipment, whereas Australia is generating most of the exports from
natural resources. As a result the overall domestic value added to gross exports ratio for
Australia is larger than for China; or in other words, Australia exports more of its own domestic
value added than of the value added that it imports.
32
Table 5: Each industry as a percentage of gross exports (GE) and their domestic value
added (DVA) to gross exports (GE) ratios for Australia and China, 2009
Industry
Australia China
Percentage
in GE
DVA to
GE ratio
Percentage
in GE
DVA to
GE ratio
Agriculture, hunting, forestry and
fishing 4.3 96.1 6.4 86.1
Mining and quarrying 33.4 90.9 8.0 34.8
Food products, beverages and
tobacco 3.2 97.7 1.8 87.9
Textiles, textile products, leather
and footwear 0.5 82.3 6.9 92.6
Wood, paper, paper products,
printing and publishing 1.4 81.5 2.7 70.8
Chemicals and non-metallic
mineral products 3.8 67.3 10.6 67.1
Basic metals and fabricated metal
products 7.5 80.9 7.3 71.4
Machinery and equipment, nec 1.5 73.0 4.0 73.8
Electrical and optical equipment 1.6 57.1 15.1 65.1
Transport equipment 1.3 79.5 2.1 74.0
Manufacturing nec; recycling 0.4 80.7 3.3 83.1
Electricity, gas and water supply 1.5 85.2 2.3 73.3
Construction 1.5 94.7 0.3 29.9
Wholesale and retail trade; Hotels
and restaurants 7.4 82.8 10.3 73.9
Transport and storage, post and
telecommunication 10.9 89.1 4.7 53.6
Financial intermediation 4.3 88.3 4.4 73.7
Business services 12.5 90.0 7.8 41.1
Other services 3.2 91.6 2.0 70.4
Total 100.0 87.5 100.0 67.4
Source: OECD-WTO, 2013a.

33
From this we can also conclude that Australia participates much more in the early stages of
GVCs and that much of the value added is generated from activities that are at the beginning
of the value chain, i.e. mining and quarrying activities. On the other hand, China participates
in the middle or late stages of GVCs, which means that it imports significant proportion of
foreign value added for further processing. Hence, the domestic value added in China’s
exports in percentage terms will be lower.
5.4. TiVA analysis of services contribution to exports20
One of the advantages of the TiVA analysis is that it allows us to estimate the role of services
in trade. Such analysis might be important due to the effect of servicification, which has not
been properly addressed in the policy discussions due to the lack of data. In this regard, the
shares of domestic and foreign value added from services in gross exports are important
indicators.
Services are an important part of trade. In 2009, the total domestic value added of services
represented 27.0% of the gross exports of the 17 regional ESCAP economies included in the
OECD-WTO analysis and the total value added trade in services (domestic plus foreign value
added embodied in exports) accounted for 37.4% of gross exports. In general, the share of
services trade in total trade is relatively higher when measuring in value added terms
compared to traditional measure (Johnson, 2014). This is mainly due to two reasons, gross
exports of merchandise includes value added from services sector, which is stripped out in
value added terms; and trade in services is less vertically specialized, which means that export
of services includes less imported foreign value added.
GVCs in Asia-Pacific have significantly contributed to an increased servicification among the
developing economies in the region. In general, domestic sourcing of services remains
dominant, especially in agricultural and mining sectors; however, the shares of imported
services in industrial exports have been rising, particularly in the case of business services.
The shares of intraregional imports of services have also seen an increase (Anukoonwattaka
et al, 2015).
In figure 11 we can see both shares of total domestic services and the share of indirect
domestic services in gross exports. High percentage of the indirect contribution of domestic
service suppliers reflect that service industries participate through domestic (upstream)
20 For a more detailed analysis on services see Anukoonwattaka et al, 2015; and ESCAP, 2014a.

34
transactions in exports of that economy, and under traditional measurement of trade this would
show as export of merchandise. The shares of indirect domestic services value added in gross
exports are large in comparison to the total percentage of services in gross exports especially
for large manufacturing economies, such as China and Japan, as much of domestic services
industries are supporting manufacturing of goods for export. On the other hand, for economies
that reply on export of services, such as the Philippines, Singapore, and Hong Kong, China,
the percentage of direct services value added in exports is much larger.
Figure 11: Total domestic value added of services and indirect domestic services as a
share of gross exports, 2009
Source: OECD-WTO, 2013a.
5.5. Participation in GVCs
The UNCTAD (2013a) analysis shows that the East and Southeast Asia (as defined by
UNCTAD) is the subregion21 with the highest levels of participation in GVCs due to its important
share in manufacturing and processing activities. South Asia, on the other hand, appears as
the lowest ranked subregion in terms of GVC participation.
As introduced in section 0, GVC participation is calculated as the sum of foreign value added
embodied in gross exports (upstream component) and the domestic value added embodied
21 This UNCTAD subregion covers two ESCAP subregions: East and North-East Asia and South-East Asia.
66.8%
43.1%
37.8% 37.8%35.7% 35.1%
30.0% 29.0% 28.0%
24.4% 24.1%21.5%
18.1% 17.4%15.9%
14.0% 13.7%
24.0%
19.7%
25.5%22.7%
26.5%24.0%
12.0%
15.8%
20.7%
14.7%
6.1%
13.2% 12.9%
8.3%10.6%
4.8%
8.3%
Hong
Ko
ng
, C
hin
a
Ind
ia
New
Zeala
nd
Tu
rkey
Japa
n
Austr
alia
Sin
gap
ore
Phili
ppin
es
Russi
an F
ed
era
tion
Repu
blic
of K
ore
a
Cam
bodia
Ma
laysi
a
Chin
a
Th
aila
nd
Ind
one
sia
Bru
ne
i Daru
ssa
lam
Vie
t N
am
Share of total domestic services VA in total gross exports
Share of indirect domestic services VA in total gross exports
35
in other economies’ exports (downstream component). Therefore, two regions with similar
levels of GVC participation may present very different trade dynamics, depending of the size
of their upstream and downstream components.
As a subregion, East and South-East Asia exhibits a very balanced upstream versus
downstream participation. Economies in the region are both importing and exporting
intermediate goods, and they are developing strong regional and global value-chains. In
contrast, South Asia shows a stronger downstream component in their GVCs (UNCTAD,
2013a).
Countries, such as China, Philippines, and Thailand, all have both increased their involvement
in GVCs and reduced their dependence on foreign inputs, thus raising the value added of their
exports. These countries increased their integration into GVCs by participating in industries
that allow for separate components to be easily traded, such as the automotive and the
electronics industries, and at the same time they developed national production chains that
increased the value of national components in their exports (UNCTAD, 2013a).
From figure 12 we can see the backward and forward GVC participation indices for the 17
ESCAP economies included in the OECD-WTO dataset. Malaysia, Philippines, Republic of
Korea, and Singapore have the highest GVC participation rates; however, they also have
higher proportion of backward participation (upstream component). This means that their
participation in GVCs results in proportionately large import of foreign value added.
Conversely, Australia, Brunei Darussalam and the Russian Federation have a proportionately
high forward participation, resulting in exports of domestic value added being dominant. The
latter can be attributed to the exports of natural resources, which have large amounts of
domestic value added components.
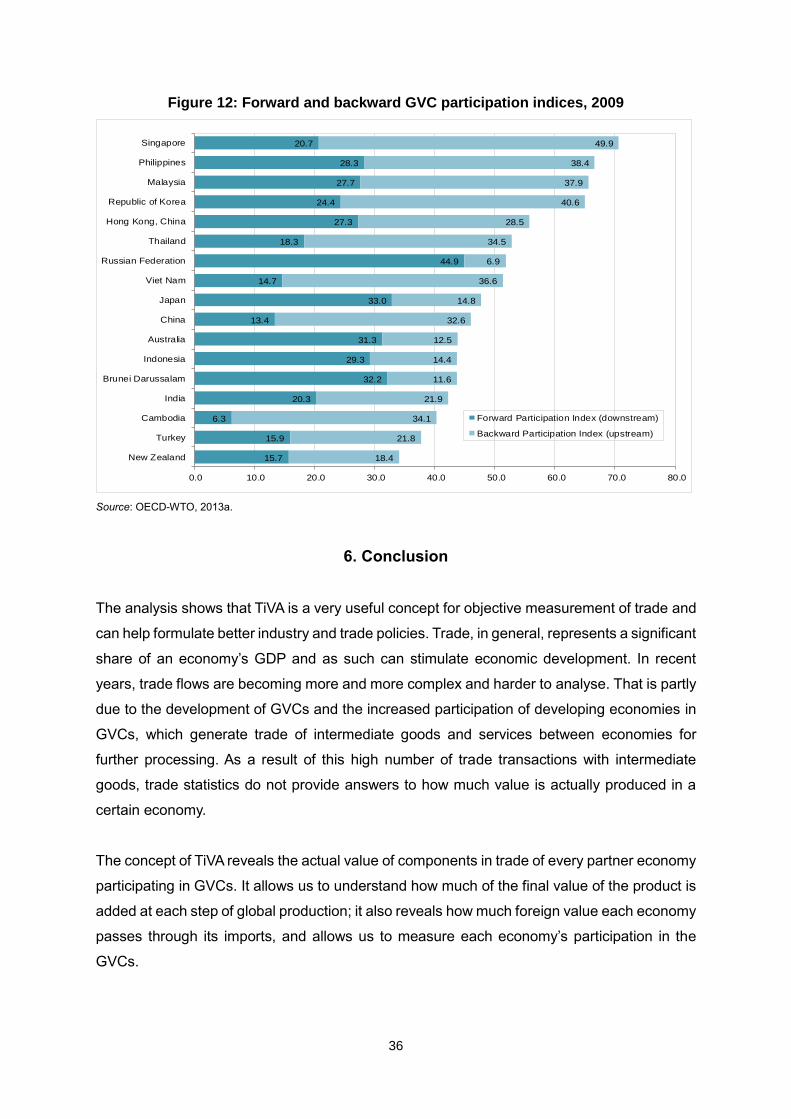
36
Figure 12: Forward and backward GVC participation indices, 2009
Source: OECD-WTO, 2013a.
6. Conclusion
The analysis shows that TiVA is a very useful concept for objective measurement of trade and
can help formulate better industry and trade policies. Trade, in general, represents a significant
share of an economy’s GDP and as such can stimulate economic development. In recent
years, trade flows are becoming more and more complex and harder to analyse. That is partly
due to the development of GVCs and the increased participation of developing economies in
GVCs, which generate trade of intermediate goods and services between economies for
further processing. As a result of this high number of trade transactions with intermediate
goods, trade statistics do not provide answers to how much value is actually produced in a
certain economy.
The concept of TiVA reveals the actual value of components in trade of every partner economy
participating in GVCs. It allows us to understand how much of the final value of the product is
added at each step of global production; it also reveals how much foreign value each economy
passes through its imports, and allows us to measure each economy’s participation in the
GVCs.
15.7
15.9
6.3
20.3
32.2
29.3
31.3
13.4
33.0
14.7
44.9
18.3
27.3
24.4
27.7
28.3
20.7
18.4
21.8
34.1
21.9
11.6
14.4
12.5
32.6
14.8
36.6
6.9
34.5
28.5
40.6
37.9
38.4
49.9
0.0 10.0 20.0 30.0 40.0 50.0 60.0 70.0 80.0
New Zealand
Turkey
Cambodia
India
Brunei Darussalam
Indonesia
Australia
China
Japan
Viet Nam
Russian Federation
Thailand
Hong Kong, China
Republic of Korea
Malaysia
Philippines
Singapore
Forward Participation Index (downstream)
Backward Participation Index (upstream)
37
Basic analysis for the selected ESCAP economies shows that the shares of domestic value
added in gross exports are between 50% and 95%, and that in general the domestic value
added as a percentage of gross exports in manufacturing industries is lower than the one in
service industries. Economies that rely on trade in natural resources or agricultural products
have higher domestic value added in their exports, whereas economies engaging in
production and processing activities import a significant proportion of the value added for
further processing; hence, the domestic value added by these economies is lower in
proportion. Such information is crucial for policy makers to decide on policies to stimulate trade
and industries which have the highest potential to stimulate domestic production and generate
employment.
There are several challenges that persist in the measurement of TiVA. The absence of
adequate SUTs and/or IOTs severely limits the availability and accuracy of value added
estimates. Additionally, it is worth mentioning some of the other challenges in measurement
of TiVA:
Lack of statistical capacity: Constructing and updating SUTs/IOTs is resource
demanding on the national statistical system and many economies in the region do not
have the statistical capacity to produce these tables. Hence, significant investment still
needs to be made in statistical capacity before TiVA estimates become more inclusive.
Inclusiveness: Many economies in Asia-Pacific are not included in the current
regional/international IOTs. In order to have a comprehensive TiVA estimate, we need
to make sure all economies and trading partners are included.
Timeliness: In many cases the SUTs/IOTs might not be updated very regularly,
therefore, TiVA estimates may be outdated by the time they are released. For example,
the last time period available in the OECD-WTO database is 2009, but between 2009
and 2015 exports of merchandise by the regional ESCAP economies grew by 62%
and Asia-Pacific became the world’s largest trading region.
Validity of assumptions: Estimation of the TiVA, as described above, requires several
assumptions. As a result, these assumptions may not necessarily reflect the real
structures of their industrial and services sectors, or might be wrong.
38
Procedure standardization: At the moment there is no internationally agreed standard
for estimating TiVA. There are several procedures developed by researchers, but
development of an international standard would help the reliability and comparability
of estimates.
Open data: Allowing public access to tables and databases should help increase
confidence and usability of TiVA estimates.
39
References
Anukoonwattaka W., Scaglisui M., and Mikic M. (2015). ESCAP Trade Insights Series, Issue
10: Servicification and Industrial Exports from Asia and the Pacific, May 2015.
Available at:
http://www.unescap.org/sites/default/files/Trade%20Insights%20Issue%20No.%2010
Asian Development Bank (ADB) (2012). Supply and Use Tables for Selected Economies in
Asia and the Pacific: A Research Study.
______(2013). Beyond Factory Asia: Fuelling growth in a changing world. Available at:
http://adb.org/sites/default/files/pub/2013/beyond-factory-asia.pdf
Asia-Pacific Economic Cooperation (APEC) (2014). Strategic Framework on Measurement of
APEC TiVA under GVCs. Second Senior Officials’ Meeting, Qingdao, China, 14-15
May, 2014. Available at:
http://mddb.apec.org/Documents/2014/SOM/SOM2/14_som2_049anx05.pdf
De Backer K. and Miroudot S. (2013). Mapping Global Value Chains, OECD Trade Policy
Papers, No. 159, OECD Publishing. Available at:
http://dx.doi.org/10.1787/5k3v1trgnbr4-en
Eurostat (2008). Eurostat Manual of Supply, Use and Input-Output Tables. Eurostat
Methodologies and Working papers, Luxembourg.
Gereffi G. and Fernandez-Stark K. (2011). Global Value Chain Analysis: A Primer. Center on
Globalization, Governance & Competitiveness (CGGC), Duke University Durham,
North Carolina, USA. Available at: http://www.cggc.duke.edu/pdfs/2011-05-
31_GVC_analysis_a_primer.pdf
Global Trade Analysis Project (GTAP) (2012). GTAP 8 Data Base. Available at:
https://www.gtap.agecon.purdue.edu/databases/default.asp
40
Institute of Developing Economies, Japan External Trade Organization (IDE-JETRO) (2005).
Asian International Input-Output Table. Available at:
http://www.ide.go.jp/English/Data/Io/index.html
Johnson R.C. (2014). Five Facts about Value-Added Exports and Implications for
Macroeconomics and Trade Research. Journal of Economic Perspectives, 28(2): 119-
42. Available at: https://www.aeaweb.org/articles.php?doi=10.1257/jep.28.2.119
Koopman R., Powers W., Wang Z., and Wei S.-J. (2010). Give Credit Where Credit Is Due:
Tracing Value Added in Global Production Chains. NBER Working Paper No. 16426,
September 2010, Revised September 2011. Available at:
http://www.nber.org/papers/w16426
Koopman R., Wang Z., and Wei S.-J. (2008). How much Chinese exports is really made in
China –Assessing foreign and domestic value-added in gross exports. NBER Working
Paper No. 14109.
Lenzen M., Kanemoto K., Moran D., and Geschke A. (2012). Mapping the structure of the
world economy. Environmental Science & Technology, 46(15), pp 8374-8381.
______(2013). Building Eora: A Global Multi-regional Input-Output Database at High Country
and Sector Resolution. Economic Systems Research, 25:1, 20-49.
Maurer A. (2011). Trade in value added: what is the country of origin in an interconnected
world?, WTO. Available at:
https://www.wto.org/english/res_e/statis_e/miwi_e/background_paper_e.htm#_ftn8
Meng B. and Miroudot S. (2011). Towards measuring trade in value-added and other
indicators of global value chains: Current OECD work using I/O tables. Presentation
delivered by S. Miroudot at the Global Forum on Trade Statistics, 2-4 February 2011,
Geneva. Available at:
http://unstats.un.org/unsd/trade/s_geneva2011/geneva2011.htm
Miller R., and Blair P. (2009). Input-Output Analysis, Foundations and Extensions, Second
Edition. Cambridge University Press, New York.
41
Organization of Economic Co-operation (OECD) (2012). STAN Input-Output Database.
Available at:
http://stats.oecd.org/Index.aspx?DataSetCode=STAN_IO_TOT_DOM_IMP
______(OECD) (2013). Interconnected Economies, Benefiting from Global Value Chains.
OECD Publishing.
Organization of Economic Co-operation and Development and World Trade Organization
(OECD-WTO) (2012). Trade in Value-Added: Concepts, Methodologies and
Challenges (Joint OECD-WTO Note). Available at:
http://www.oecd.org/sti/ind/49894138.pdf
______(2013a). OECD-WTO Trade in Value Added (TiVA) database. Available at:
https://stats.oecd.org/index.aspx?queryid=47807
______(2013b). OECD-WTO Trade in Value Added (TiVA) database, FAQs: Background
Note. Available at: http://www.oecd.org/sti/ind/TIVA_FAQ_Final.pdf
Organization of Economic Co-operation and Development, World Trade Organization and the
World Bank Group (OECD-WTO-WB) (2014). Global Value Chains: Challenges,
Opportunities, and Implications for Policy. Report prepared for submission to the G20
Trade Ministers Meeting Sydney, Australia, 19 July 2014 Available at:
http://www.oecd.org/tad/gvc_report_g20_july_2014.pdf
The Economist (2012). The end of cheap China, Mar 10th 2012. Available at:
http://www.economist.com/node/21549956
Timmer M. (ed) (2012). The World Input-Output Database (WIOD): Contents, Sources and
Methods. WIOD Working Paper Number 10. Available at:
http://www.wiod.org/publications/papers/wiod10.pdf.
United Nations Conference on Trade and Development (UNCTAD) (2013a). Global Value
Chains and Development: Investment and Value Added Trade in Global Economy, A
Preliminary Analysis. Available at:
http://unctad.org/en/publicationslibrary/diae2013d1_en.pdf
42
______(2013b). World Investment Report 2013, Global Value Chains: Investment and Trade
for Development. United Nations Publications.
United Nations Economic and Social Commission for Asia and the Pacific (ESCAP), (2013).
Asia-Pacific Trade and Investment Report (APTIR) 2013: Turning the Tide: Towards
Inclusive Trade and Development. Available at:
http://www.unescap.org/resources/asia-pacific-trade-and-investment-report-2013-
turning-tide-towards-inclusive-trade-and
______(2014a). Asia-Pacific Trade and Investment Report (APTIR) 2014: Recent Trends and
Developments. Available at: http://www.unescap.org/resources/asia-pacific-trade-
and-investment-report-2014-recent-trends-and-developments
______(2014b). Asia and the Pacific: A Story of Transformation and Resurgence (Economic
and Social Survey of Asia and the Pacific: 1947-2014). Available at:
http://www.unescap.org/sites/default/files/Asia%20and%20the%20Pacific-
A%20Story%20of%20Transformation%20and%20Resurgence.pdf
______(ESCAP). 2015. Statistical Database, accessible at:
http://www.unescap.org/stat/data/statdb/DataExplorer.aspx, (accessed 4 May 2015).
United Nations Economic Commission for Europe (UNECE) (2011). The Impact of
Globalization on National Accounts. United Nations, New York and Geneva, 2011.
______(2014). Guide to measuring global production. Conference of European Statisticians
document ECE/CES/2015/2/Add.1, for discussion at the sixty-third plenary session in
June 2015. Available at:
http://www.unece.org/fileadmin/DAM/stats/documents/ece/ces/2015/2Add1-
Guide_to_Measuring_Global_Production.pdf
United Nations Statistics Division (UNSD) (2013). Guidelines on Integrated Economic
Statistics. Series F, No. 108.
43
Xing Y. and Detert N. (2010). How the iPhone widens the United States Trade Deficit with the
People’s Republic of China. ADBI Working Paper 257. Tokyo: Asian Development
Bank Institute. Available at:
http://www.adbi.org/workingpaper/2010/12/14/4236.iphone.widens.us.trade.deficit.prc
/

The Asia-Pacific Research and Training Network on Trade-
ARTNeT - is an open network of research and academic
institutions and think-tanks in the Asia-Pacific region, supported
by core partners IDRC, ESCAP, UNCTAD, UNDP and WTO.
ARTNeT aims to increase the amount of high quality, topical
and applied research in the region by harnessing existent
research capacity and developing new capacities. ARTNeT also
focuses on communicating these research outputs for
policymaking in the region including through the ARTNeT
Working Paper Series which provide new and policy–relevant
research on topics related to trade, investment and
development. The views expressed in this publication are those
of the author and do not necessarily reflect the views of the
United Nations and ARTNeT secretariats or ARTNeT members.
Readers are encouraged to quote or reproduce material from
ARTNeT Working Papers for their own publications, but as the
copyright holder, ARTNeT requests due acknowledgement and
a copy of the publication.
This and other ARTNeT publications are available from
www.artnetontrade.org
ARTNeTonline
@ARTNeTontrade
ARTNeT Group
ARTNeT Secretariat, United Nations ESCAP
Rajadamnern Nok Avenue
Bangkok 10200, Thailand
Tel: +66(0) 22881410
Fax: +66(0) 22881027