Embed Size (px)
Citation preview
Full Terms & Conditions of access and use can be found athttp://www.tandfonline.com/action/journalInformation?journalCode=tcmt20
Download by: [Tran Thu Trang] Date: 24 June 2016, At: 01:12
Carbon Management
ISSN: 1758-3004 (Print) 1758-3012 (Online) Journal homepage: http://www.tandfonline.com/loi/tcmt20
Traffic emission inventory for estimation of airquality and climate co-benefits of faster vehicletechnology intrusion in Hanoi, Vietnam
Tran Thu Trang, Huynh Hai Van & Nguyen Thi Kim Oanh
To cite this article: Tran Thu Trang, Huynh Hai Van & Nguyen Thi Kim Oanh (2015) Trafficemission inventory for estimation of air quality and climate co-benefits of faster vehicletechnology intrusion in Hanoi, Vietnam, Carbon Management, 6:3-4, 117-128, DOI:10.1080/17583004.2015.1093694
To link to this article: http://dx.doi.org/10.1080/17583004.2015.1093694
View supplementary material
Published online: 27 Oct 2015.
Submit your article to this journal
Article views: 55
View related articles
View Crossmark data

Traffic emission inventory for estimation of air quality and climate co-benefitsof faster vehicle technology intrusion in Hanoi, Vietnam
Tran Thu Trang†, Huynh Hai Van and Nguyen Thi Kim Oanh
Environmental Engineering and Management, Asian Institute of Technology (AIT), Pathumthani 12120, Thailand
ABSTRACTTraffic emission contributes significantly to air pollution in Hanoi. This study estimatedemissions from passenger fleets of cars, taxis and buses in Hanoi in 2010 using InternationalVehicle Emission (IVE) model for 14 species of air pollutants and greenhouse gases (GHGs).Surveys were conducted to gather information on fleet technology distribution and drivingactivities. Results showed that the 2010 annual emission from three fleets for CO, volatileorganic compounds (VOC), NOx, SOx and particulate matter (PM) were 39.5, 5.9, 3.8, 0.6 and0.22 Gg, respectively. Gasoline-fueled taxis and cars had the major shares of CO and VOC, whilediesel-fueled buses contributed mainly to PM and black carbon (BC) emissions. If all vehicles ofthree fleets conformed to Euro3 and Euro4, air pollution emissions would collectively reduce by85 and 88%, respectively. Concurrently, emissions of climate forcing agents, both GHGs andshort-lived climate pollutants, in CO2 eq. would reduce by 28 and 12%, respectively.Incorporation of emission from motorcycles (MC), vans and trucks showed that MC contributedthe highest shares in total emission of every species, from 36% for CO2 to above 90% for airtoxics. The MC fleet should be prioritized for traffic emission control. Faster Euro technologyintrusion in Hanoi would bring in significant co-benefits.
KEYWORDSroad traffic; emissioninventory; short-lived climatepollutants; co-benefits; Hanoi
Introduction
Traffic air pollution is a serious challenge for environ-mental quality management in Hanoi, the capital cityof Vietnam. Rapid urbanization and economic develop-ment in the city are accompanied by a fast increase inthe vehicle fleet to meet the increasing transportdemand of the growing population. Motorcycles (MC)dominate the urban traffic fleet population in Hanoi. Asurvey conducted in 2008 showed a 2 million MC fleetoperating in Hanoi, and 35% of the fleet did not meetany Euro emission standards [1]. In 2013, the MC fleetin the Hanoi Capital Region reached 4.7 million [2] andthis large increase was caused by both the physicalexpansion of the Hanoi territory that took place in2008 [3] and the annual growth rate of the MC fleet ofaround 16%. Other on-road vehicle types, such as bus,taxi and personal car, have also significantly grown innumbers in recent years. For example, the averageannual growth rate for the personal car fleet was about20% during the 2001�2012 period, as seen from theregistration data provided by the Vietnam Register [2].The number of taxis increased fast; hence, the densityof taxis in the Hanoi streets was high: on average,about 20 taxis per kilometer on a total of 600 kilo-meters of six urban districts in Hanoi [101]. Publicbuses, which are recently becoming a popular means
of mass transport in Hanoi, increased by nearly2.5 times during the period from 2001 to 2009, andthis trend is expected to continue in accordance withthe policy supporting the public transport system [4].By 2012, the number of public buses in Hanoi hadreached 1425 vehicles [102].
Road traffic was reported to be the largest air pollu-tion source in cities of Vietnam including Hanoi [103].Traffic jams are often observed in the city, especiallyduring rush hours, and cause serious air pollution prob-lems. Low speeds and the stop-and-go driving modelead to huge emission amounts from the traffic inHanoi, in particular toxic air pollutants such as fine par-ticles, volatile organic compounds (VOC) and carbonmonoxide (CO). These toxic exhaust fumes are releasedat the breathing level and in populated urban areas,and therefore can lead to a high risk of human expo-sure. The vehicles also emit greenhouse gases (GHGs)including carbon dioxide (CO2), methane (CH4), andnitrous oxide (N2O), along with acid rain precursors(SO2 and NOx).
Presently, short-lived climate pollutants (SLCPs)attract wide attention because of their multiple adverseeffects. Emission control for SLCPs would bring in co-benefits in improving air quality and reducing the rateof climate warming in the near term [106]. The most
CONTACT Nguyen Thi Kim Oanh [email protected]† Current address: Department of Environmental Technology and Management, Van Lang University, Ho Chi Minh City, Vietnam
Supplementary information for this article can be accessed at http://dx.doi.org/10.1080/17583004.2015.1093694
© 2015 Taylor & Francis
CARBON MANAGEMENT, 2015VOL. 6, NOS. 3�4, 117�128http://dx.doi.org/10.1080/17583004.2015.1093694
Dow
nloa
ded
by [
Tra
n T
hu T
rang
] at
01:
12 2
4 Ju
ne 2
016

important SLCP is black carbon (BC) particles, whichhave recently been considered the second largestwarming agent after CO2 [5]. About 20% of the globallyemitted BC is generated by diesel-powered vehicles,on-road and off-road, including trucks, buses, ships, con-struction machinery and so on [5]; hence, a cleaner die-sel fleet can reduce BC emissions substantially. Forillustration, Bahner et al. [6] projected that the BC emis-sions in the United States would be reduced by 42%from 2001 to 2020, primarily as a result of diesel vehicleregulations. Tropospheric ozone, being a strong GHGand a toxic pollutant to both human health and theecosystem, is another important SLCP. Measures thatlower tropospheric ozone levels would bring in multiplebenefits to climate, human health and crop production[104]. Ozone is not directly released from a source butis formed in the atmosphere through photochemicalreactions involving precursors of NOx, VOC and CO,which are released in large amounts from traffic fleets.Therefore, measures for emission reduction of vehiclefleets are expected to provide win�win solutions. How-ever, to assess the effectiveness of these measures, adetailed analysis of emission of current fleets and pro-jection of emission according to various emission con-trol strategies is required.
This study was designed to provide an emissioninventory (EI) for the passenger transport fleet inHanoi, and assess the benefits of scenarios of a fasterintrusion of the Euro3 and Euro4 vehicle technologiesin the city. The EI was done using the InternationalVehicle Emission (IVE) model which was developedjointly by the University of California at Riverside, Col-lege of Engineering � Center for EnvironmentalResearch and Technology (CE-CERT), Global Sustain-able System Research and the International SustainableSystem Research Center [105]. Using the input filesgenerated from survey data, the IVE model producesthe pollutant emission factors (EFs) that are relevant tothe local driving conditions and local fleet composi-tion. IVE has been successfully used to generate emis-sion data for several cities in developing countries[105]. It was also previously applied for estimating EIfor the MC fleet in Hanoi for the year of 2009 by ourresearch group [1]. The present study focused on othertypes of passenger vehicles, including personal cars,taxis and buses, that were surveyed in Hanoi in 2010.Our results were compiled with the MC emission pro-duced for Hanoi [1] and rough estimates of emissionsfor other on-road fleets of vans and trucks to developan EI for the entire on-road vehicle fleet in the city.
Methodology
Research design
IVE modeling requires a large amount of local data togenerate the input files for producing relevant EFs forthe driving conditions in each study area. IVE has three
types of input files of which two files, the location andfleet files, are mandatory. The third file, the base adjust-ment, is an optional file and is prepared only when thelocal measurement data for EFs are available. Suchmeasurement data was not sufficiently available forthe considered vehicle fleets of Hanoi in 2010; hence,the base adjustment file was not used in this study.
In principle, with the location and fleet files pre-pared from the local survey data, the IVE model produ-ces EFs for Hanoi by using a range of correction factorsapplied to adjust the base EFs for every identified vehi-cle technology index. The resulting EFs are usedtogether with vehicle driving activities (driving dis-tance and number of starts) to produce the emission �for example, the annual emission in Hanoi for 2010.This study covered the following emission species: CO,VOC (exhaust and evaporative), NOx, SO2, PM10, CO2,N2O, CH4, 1,3-Butadiene, acetaldehyde, formaldehyde,ammonia (NH3) and benzene. Lead (Pb) was excludedfrom this EI study because the leaded gasoline hasbeen successfully phased out in Vietnam since July2001 [106].
The data collection generally followed the IVEmethod as described in IVE field data collection activi-ties documents [105], This study included three roadtypes, namely highways, and arterial and residentialroads, that run through three zones representing theHanoi urban area � higher income (zone A, city cen-ter), commercial (zone B, city center) and lower income(zone C, peri-urban) � as shown in Figure S1 of theSupplementary information.
Data collection and processing
The data collection was done in Hanoi during theperiod from July 2010 to January 2011. A summary ofprimary and secondary data collected for the IVEmodeling in this study is shown in Table S1. Therequired data were collected following the IVE data col-lection method and are detailed below.
Questionnaire surveyThe survey for three passenger transport fleets (bus,taxi and personal car) was conducted at parking lots,gasoline refilling stations and bus terminals (for buses)in all three zones (A, B, C) of the city. As of 2009, therewere 1020 buses, 11,533 taxis and 84,578 personal carsin Hanoi [4]. The sample size, estimated using the TaroYamane table for the acceptable error of 0.10, was 94for buses, 99 for taxis and 100 for personal cars; hence,the final survey was done for 100 vehicles of each vehi-cle fleet. The questionnaire survey was done in July-�August 2010 which provided data on the vehicletypes, model years, vehicle sizes, fuel types, fuel deliv-ery systems, exhaust control devices and evaporativecontrol systems. The collected information was used toidentify the vehicle technologies to match with the IVEdefault technology indexes.
118 T. T. TRANG ET AL.
Dow
nloa
ded
by [
Tra
n T
hu T
rang
] at
01:
12 2
4 Ju
ne 2
016

Estimation of vehicle kilometers traveledThis study estimated the annual average vehicle kilo-meters traveled (VKT) using the relationship betweenodometer readings and vehicle ages [7], which wasalso used in our earlier studies [1,8]. A regression equa-tion between the vehicle age (years) and the vehicleodometer reading (km), both collected in the question-naire survey, was developed for the three consideredfleets (bus, taxi, personal car). The average VKT for agiven fleet was then calculated using Equation S1.
Vehicle flow monitoringVehicle counting was done manually at nine selectedroads, one location per road (Figure S1), for three timeperiods in a monitoring day: 07:00�09:00 and17:00�19:00 to cover rush hours, and 10:00�11:00 and13:00�15:00 to cover normal hours. The counting wasdone for 1 day at each road in December 2010. Thus,for every selected road, a total of 180 minutes of vehiclecounting was obtained (continuously counting over 15minutes followed by a 10-minute break) which yieldeda total of 9 £ 180 D 1620 minutes of vehicle data.
Global positioning system surveyThis survey was conducted to obtain the vehicle driv-ing and startup patterns. A global positioning system(GPS; GlobalSat DG-100 model) was attached on eachsurveyed vehicle on every monitoring day. The GPShad an accuracy in velocity recording of 0.1 m/sec, andof 1�5 m in horizontal position. The longitude, alti-tude, latitude, speed and time were recorded secondby second. The Hanoi urban area is quite flat; hence,information on altitude was not necessary as the roadgrade was close to zero. The GPS survey was done onboth weekdays and weekends. In total, six buses ontwo fixed routes in Hanoi (in their normal operatingperiod), six taxis (non-fixed routes) and six personalcars of office workers were monitored (Table S2), withthe routes shown in Figure S1.
Vehicular tailpipe emissions are affected by a num-ber of factors, such as driving speed, acceleration anddeceleration. In the IVE model, driving patterns arecharacterized by two parameters: vehicle specificpower (VSP) and engine stress. The obtained second-by-second GPS data were used to calculate VSP usingEquation S2, while the engine stress was calculatedusing Equation S3 [105]. There are 20 VSP categoriesand three engine stress categories which yield a totalof 60 VSP bins for every monitoring hour.
The GPS data were also used to determine the vehi-cle startup pattern. A cold start generates high exhaustemission; hence, the predominant factor is the soakperiod before an engine starts. In IVE, the term “enginesoak” is defined as the length of time that an enginehas been shut off before starting again [105]. A coldstart is referred to as a start when the engine has beencompletely cooled off � that is, after resting for
18 hours or more. A completely warm start is when awarm engine is shut off for 5 minutes or less beforestarting again. In this study, a stop of a monitored vehi-cle was recognized if its speed (shown by GPS data)was less than 1 km/h for more than 4 minutes and astart was then counted after the stop.
Secondary data collectionHourly temperature and humidity in Hanoi were col-lected from the Weather Underground website www.wunderground.com [107]. The data on fuel characteris-tics were extracted from the information by the stand-ards, metrology and quality of Viet Nam (STAMEQ)[108] and the Vietnam National Petroleum Corporation(VNPC) [109]. All of the data were used in the locationinput file of IVE.
Emission reduction scenario and co-benefitquantification
The EI for the three passenger vehicle fleets was pro-duced for the base case of 2010. Further, two optimis-tic, faster technology-intrusion scenarios wereconsidered which assumed that all buses, taxis andcars in Hanoi would at least conform to Euro3 (Scenario 1)and Euro4 (Scenario 2), respectively. These scenarioswere intended to provide a simple image of whatcould have happened in 2010 had there been a greaterpenetration level of Euro3 and Euro4, whereas the driv-ing activities of these passenger vehicle fleetsremained unchanged. To construct the scenarios, thisstudy simply assumed that all vehicles with lowerengine standards than Euro3 and Euro4, respectively,presented in the 2010 fleets would be scrapped andtheir VKT would be provided by new Euro3 and Euro4vehicles, respectively. The emissions of toxic air pollu-tants and associated global warming potential (GWP)in CO2 equivalent (CO2 eq.) under these scenarios andthe base case were compared. The CO2 equivalent ofan emission was calculated using Equation (1):
GWP of a scenario ðCO2 eq:ÞDX
Ei£GWPi (1)
where Ei D emission amount of species i (mass, tonne/year) and GWPi D global warming (C) or cooling (�)potential of species i.
Only GWP for the 20-year horizon was estimatedbecause the impacts of SLCPs should be more pro-nounced over this shorter period. The GWPs for GHGsand SLCPs used in this study are those considered rele-vant for Southeast Asia (SEA), and listed in Table S3.Most of the species in Table S3 have warming effects,except for OC and sulfates (transformed particulateproducts of SOx in the atmosphere) which have coolingeffects. Because the IVE model does not produce OCand BC emissions directly, this study estimated the OC
CARBON MANAGEMENT 119
Dow
nloa
ded
by [
Tra
n T
hu T
rang
] at
01:
12 2
4 Ju
ne 2
016

and elemental carbon (EC) emissions as the fractions ofexhaust PM emitted from diesel and gasoline vehicles.For diesel vehicles, the values used in this study werebased on the measurements for the diesel fleet in Bang-kok, Thailand [9]: EC D 0.46 PM and OC D 0.2 PM. TheOC and BC fractions in the PM emission from gasolinevehicle exhaust were estimated using the data providedby the United States Environmental Protection Agency(US EPA) [110]: OC D 0.78 PM and BC D 0.19 PM.
Results and discussion
Vehicle fleet and driving activities in Hanoi
Vehicle flowThe results (detailed in Table S4) show that the hourlyaverage flow on each road of a particular type of vehicledid not vary much during a day (small standard devia-tions, SD). However, the fluctuations between the roadtypes and zones were significant, which is seen in thelarge SD of average hourly flows in the city: 74 § 44buses, 463 § 343 taxis and 768 § 527 personal cars. Infact, the shares of bus, taxi and personal car fleets werequite small in the active traffic fleet in Hanoi as com-pared to motorcycles. Using the data from the VehicleRegistration (VR) office [4] and with the assumption of aretirement rate of 2% per year of buses and cars and12% of the taxi fleet, the share of the active fleets wasestimated at 0.04% for buses, 0.47% for cars and 3.44%for taxis (Table S4). The MC had the predominant propor-tion in the operating traffic fleet in Hanoi � that is, ashare of 93�97% [10] with an average hourly flow of8000 in 2009 [1]. The results of hourly vehicle counts onnine roads for weekdays and weekends obtained in thisstudy were used in the IVE location files for the EI of bus,taxi and car fleets on the respective roads.
Vehicle technology distributionThe questionnaire survey results are summarized inTable 1, and show that diesel and gasoline were theonly two fuel types used for on-road transportation inHanoi during the study period (2009�2010). Othertypes of cleaner fuels, such as compressed natural gas
(CNG) and liquefied petroleum gas (LPG), were notobserved. The bus fleet was 100% diesel powered,while the taxi fleet was 100% gasoline powered. Only asmall portion of the personal car fleet, about 7% (e.g.,Ford Everest brand), used diesel. This finding agreeswith Tung et al. [11] who reported that 95% of thelight-duty vehicles in Hanoi in 2008�2009 were gaso-line powered.
Our study also showed that Euro3 was the mostadvanced engine standard observed in Hanoi as of2010, and it was only seen in the car fleet (34%). Themost advanced technologies found in the bus and taxifleets only conformed to Euro2 (74 and 80%, respec-tively). Substantial shares of pre-Euro vehicles were stillobserved in these fleets: 16�26%. Most vehicles wererelatively new; the weighted average age was about2 years for taxis and personal cars but was 6.3 years forbuses.
The vehicle technologies obtained in the surveywere matched with the default IVE indexes, and resultsare presented in Table S5. The bus fleet had four IVEtechnology indexes, with index number 1130 beingthe most popular at 53% (diesel fuel, Euro2, mileage>161,000 km). The taxi fleet was matched with five IVEtechnology indexes, with index number 182 havingthe highest share at 38% (petrol fuel, Euro2, >161,000km). The personal car fleet was matched with sevenIVE indexes, with index number 183 being the mostpopular at 31% (petrol fuel, Euro2, <71,000 km).
Vehicle kilometers traveledThe non-linear regression equations between theodometer readings (km) and vehicle ages (years) pro-duced higher coefficients of determination � R2 D 0.93for buses, 0.99 for taxis and 0.99 for the personal carfleet (Figure S2) � than the linear ones. The averageannual VKT of a vehicle was calculated as the differencein odometer readings (DY) for X § 0.5 years (X D fleetaverage age, given in Table 1). The annual usage of avehicle was 77,380 km/yr for buses, 57,305 km/yr fortaxis and 15,330 km/yr for personal cars.
As a way of checking, the daily VKT was also deter-mined using the GPS survey data, and the results are
Table 1. Summary of vehicle questionnaire survey and GPS survey.
Parameters Bus Taxi Personal car
Accumulative fleet, 2010y 1020 13,850 101,500Number of IVE technology indexes 4 5 7Average age (span), years 6.3 (1�11) 2.4 (1�6) 2.1 (1�8)Fuel used Diesel: 100% Petrol: 100% Diesel: 7%
Petrol: 93%Engine standards (%) Euro2: 74%
Pre-Euro: 26%Euro2: 80%Pre-Euro: 20%
Euro3: 34%Euro2: 50%
Pre-Euro: 16%Number of startups per day (based on GPS survey) 16.6 26 6.9Daily VKT (km) GPS survey 239 § 10 227 § 41 52 §12
Odometer regression 212 157 42
ySource: [4].Note: GPS - global positioning system; IVE - international vehicle emission; VKT - vehicle kilometers traveled.
120 T. T. TRANG ET AL.
Dow
nloa
ded
by [
Tra
n T
hu T
rang
] at
01:
12 2
4 Ju
ne 2
016
mostly comparable, better for buses and cars (Table 1).For taxis, the GPS survey showed a higher daily VKT,which may reflect the fact that in the past people usedtaxi services less than during the survey period. How-ever, due to a smaller number of taxis covered by theGPS survey (six vehicles) as compared to the parkinglot survey (100 vehicles), the VKT for taxis was also esti-mated using the regression equation.
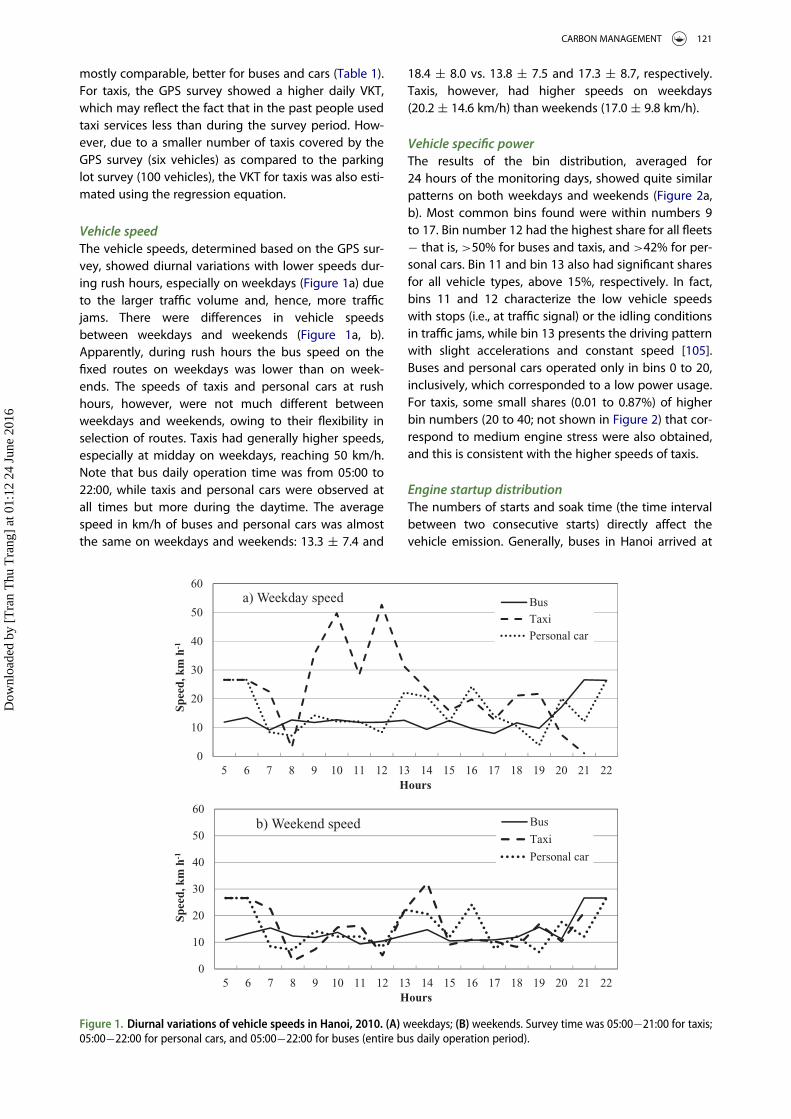
Vehicle speedThe vehicle speeds, determined based on the GPS sur-vey, showed diurnal variations with lower speeds dur-ing rush hours, especially on weekdays (Figure 1a) dueto the larger traffic volume and, hence, more trafficjams. There were differences in vehicle speedsbetween weekdays and weekends (Figure 1a, b).Apparently, during rush hours the bus speed on thefixed routes on weekdays was lower than on week-ends. The speeds of taxis and personal cars at rushhours, however, were not much different betweenweekdays and weekends, owing to their flexibility inselection of routes. Taxis had generally higher speeds,especially at midday on weekdays, reaching 50 km/h.Note that bus daily operation time was from 05:00 to22:00, while taxis and personal cars were observed atall times but more during the daytime. The averagespeed in km/h of buses and personal cars was almostthe same on weekdays and weekends: 13.3 § 7.4 and
18.4 § 8.0 vs. 13.8 § 7.5 and 17.3 § 8.7, respectively.Taxis, however, had higher speeds on weekdays(20.2 § 14.6 km/h) than weekends (17.0 § 9.8 km/h).
Vehicle specific powerThe results of the bin distribution, averaged for24 hours of the monitoring days, showed quite similarpatterns on both weekdays and weekends (Figure 2a,b). Most common bins found were within numbers 9to 17. Bin number 12 had the highest share for all fleets� that is, >50% for buses and taxis, and >42% for per-sonal cars. Bin 11 and bin 13 also had significant sharesfor all vehicle types, above 15%, respectively. In fact,bins 11 and 12 characterize the low vehicle speedswith stops (i.e., at traffic signal) or the idling conditionsin traffic jams, while bin 13 presents the driving patternwith slight accelerations and constant speed [105].Buses and personal cars operated only in bins 0 to 20,inclusively, which corresponded to a low power usage.For taxis, some small shares (0.01 to 0.87%) of higherbin numbers (20 to 40; not shown in Figure 2) that cor-respond to medium engine stress were also obtained,and this is consistent with the higher speeds of taxis.
Engine startup distributionThe numbers of starts and soak time (the time intervalbetween two consecutive starts) directly affect thevehicle emission. Generally, buses in Hanoi arrived at
0
10
20
30
40
50
60
5 6 7 8 9 10 11 12 13 14 15 16 17 18 19 20 21 22
Spee
d, k
m h
-1
Hours
a) Weekday speed Bus
Taxi
Personal car
0
10
20
30
40
50
60
5 6 7 8 9 10 11 12 13 14 15 16 17 18 19 20 21 22
Sp
eed
, km
h-1
Hours
b) Weekend speed Bus
Taxi
Personal car
Figure 1. Diurnal variations of vehicle speeds in Hanoi, 2010. (A) weekdays; (B) weekends. Survey time was 05:00�21:00 for taxis;05:00�22:00 for personal cars, and 05:00�22:00 for buses (entire bus daily operation period).
CARBON MANAGEMENT 121
Dow
nloa
ded
by [
Tra
n T
hu T
rang
] at
01:
12 2
4 Ju
ne 2
016

terminal depots when finished a service round, and thedrivers stopped the engine before continuing on thenext service. The taxi engine was stopped while wait-ing for customers. Private cars normally stopped at thefinal destination of a trip, for example office or home.The number of engine starts in a day of each vehicletype was obtained from the GPS survey and alsochecked by direct observations. On average, a bus had16 starts on a weekday and 18 starts on weekend(more service rounds because of fewer traffic jams),which corresponds to a weighted average of 16.6 timesper day. The daily number of startups for a taxi was 30on a weekday and 16 on weekend day, yielding aweighted average of 26 times per day. Likewise, thedaily number of startups for a personal car was eighton a weekday and four on a weekend; hence, theweighted average was 6.9 times per day (Table 1).
The startup distribution patterns of three vehicletypes are shown in Figure 3a�c. The soak time bins onthe x-axis indicate the time period between two conse-cutive engine starts. The “15 min” bin means the soakswere between 0 and 15 minutes, whereas “30 min”means the soaks were between 16 and 30 minutes,and so on [105]. For buses, the 15-minute soak bin wasthe most predominant (85�95%), which correspondsto the short stop at depots. The second most commonsoak bin was 12 hours (engine rest time for 8�12
hours), reflecting the bus daily operation period whichended at 22:00 and started at 05:00 the next day. Fortaxis, the 15-minute soak bin was also the most com-mon, 72% on weekday and >50% on weekend, butother soak bins from 30 minutes to 18C hours werealso observed with a share of <10% each. The longsoak periods of taxis, 12 or 18C hours, were the resttime between two consecutive working days. The soakbin distribution for personal cars was markedly differ-ent from buses and taxis with the bins distributedrather evenly, each generally having a share of <15%.There were also differences in the soak bin distributionbetween weekdays and weekends for cars, with week-days having a higher share of 15-minute bins andweekends having more shares of 2-hour and 18-hoursoak bins. This reflected the fact that on weekdays thecars were mainly used by owners to go to work, whileon weekends other driving activities (for shopping,sightseeing, etc.) were involved.
Emission factors
Emission factors by vehicle typeIVE was run to provide hourly emissions from eachvehicle fleet on a considered road, separately on week-days and weekends. The emission results were pro-duced for every technology index (of bus, taxi or car
Figure 2. Daily average power bin distribution. (a) Weekdays and (b) weekends. Bins are used to characterize driving patterns. Intotal there are 60 bins, which combine 20 categories of the Vehicle Specific Power (VSP) and three engine stress categories. Binnumbers 21�60 are not shown because they had minor shares (0.01 to 0.87%) for taxis and were not observed for buses and per-sonal cars.
122 T. T. TRANG ET AL.
Dow
nloa
ded
by [
Tra
n T
hu T
rang
] at
01:
12 2
4 Ju
ne 2
016

fleet), which were used to calculate the correspondingrunning EF (g/km) and startup EF (g/start). SO2 emis-sion produced by IVE is for a range of S content (notfor a specific S value); hence, SO2 emission results inthis study are only indicative. For example, the S con-tent in diesel and gasoline of 0.05% in Vietnam [109]belonged to the S input range of 350�600 ppm of IVE.
Details of running and startup EFs for differentvehicle technology indexes in Hanoi are given inTable S6 for all pollutants, while Figure S3 visuallyillustrates EFs for selected pollutants. The resultsshow that the indexes of old technologies, i.e. pre-Euro, and high mileage (>161,000 km), had higherEFs in every fleet � that is, index 1076 for buses,indexes 100 and 101 for taxis, and indexes 99, 100and 101 for personal cars. The EFs from these pollut-ing vehicles were generally several times (2�10 ormore) higher than the corresponding Euro2 vehiclesin the same fleet type.
IVE emission results for a fleet (with the observedshares of technology indexes) were used to calculatethe fleet composite EFs (for all road types in threezones of Hanoi). The average EFs of selected pollutantsare presented in Table 2, separately for weekdays andweekends, while for other pollutants, weighted aver-age EFs (5 weekdays and 2 weekend days) are pre-sented in Table S6. The EFs of toxic pollutants for thetaxi fleet were higher than those for the car fleet, whichmay be explained by the higher mileage and lessadvanced engine technologies � that is, no Euro3 wasobserved for taxis (Table 1). Buses, all diesel powered,as expected released larger amounts of NOx and PMthan the gasoline-powered taxis and cars. It is notedthat the startup EFs of all vehicle types were also con-siderable, especially for the products of incompletecombustion � that is, CO, PM and air toxics. The EFswere comparable between weekdays and weekendsfor buses and cars. For taxis, however, running EFs on
0%
20%
40%
60%
80%
100%
Shar
e
Soak time
a) Bus
weekday weekend
0%
5%
10%
15%
20%
25%
Shar
e
Soak time
b) Car
weekday weekend
0%10%20%30%40%50%60%70%80%
Shar
e
Soak time
c) Taxi
weekday weekend
Figure 3. Daily distribution of soak times. (a) Buses; (b) personal cars; (c) taxis.
CARBON MANAGEMENT 123
Dow
nloa
ded
by [
Tra
n T
hu T
rang
] at
01:
12 2
4 Ju
ne 2
016

weekends were higher, which may be explained bytheir lower speeds as compared to weekdays, dis-cussed above.
A comparison between EFs produced in this studyand other studies for Hanoi and several other Asian cit-ies is presented in Table S7. Hung et al. [10] appliedthe back calculation method using the OperationalStreet Pollution Model (OSPM) to produce running EFs(g/km) for buses in Hanoi, and the results were quiteclose to ours for PM. EFs of taxis in Hanoi were in simi-lar ranges to those reported for Shanghai [111]. InKathmandu, however, higher EFs for buses and taxiswere obtained, which is explained by the extremelylow vehicle speeds in the city as well as the high mile-age of the bus fleet [8]. The EFs determined, using thechassis dynamometer method, for four light-dutyvehicles in Hanoi [13] were similar to our results forNOx but lower for CO. However, the small number ofvehicles tested and the narrow span of age (3�7 years)in their study may not have yet produced EF results tobe fully comparable to the fleet composite valuesobtained in our study.
Annual emission of vehicle fleets in Hanoi
Annual emission by vehicle typesThe daily vehicle activities (Table 3) and the fleet com-posite EFs were used to produce the 2010 annual emis-sions of bus, taxi and car fleets, respectively. Therunning and startup emissions were calculated sepa-rately and summed up to produce the total annualemission for each of 14 considered species.
In order to get a more comprehensive overview ofthe traffic emission in Hanoi, we also present in thissection the emissions estimated for other vehicle typesin the city. The MC annual emission for 2010 was calcu-lated using the EFs produced by IVE based on surveydata of 2009 [1] and the active MC population of 2010.The emissions by the van and truck fleets in Hanoi
were roughly estimated using the survey data availablein Bangkok for vans and in Ho Chi Minh City (HCMC) fortrucks. First, based on the survey results for vans inHCMC [14], the van fleet in Hanoi was assumed to be50% gasoline fueled and 50% diesel fueled. The EFs forvans were roughly estimated as the average of EFs forgasoline and diesel vans produced by IVE for Bangkok[15]. The number of startups and daily VKT of vanswere assumed to be the same as those obtained bysurvey for Bangkok � startups of 20.3 times per day[15], and a VKT of 89 km per day [16]. For trucks, thesurvey results in HCMC reported by Van [17] wereused: 7% gasoline fueled (mainly light duty) and 93%diesel fueled; 6.9 startups per day and 31.4 km per dayof VKT. The EFs used for emission estimation of all vehi-cle types considered in this study are shown in TableS8. Further studies should conduct a detailed surveyfor van and truck fleets in Hanoi to gather local datafor IVE modeling to produce relevant EFs.
The large MC fleet in Hanoi contributed predomi-nantly to the driving activities (VKT) and startupnumber (Table 3) which explain its predominantcontribution to the overall traffic emission (Figure 4;Table S9). The MC fleet shared 35�47% of SOx, NOxand CO2, while for other pollutants its proportionswere above 70%. The total traffic CO emission inHanoi in 2010 was 221 Gg, of which 77% was fromMC and about 9% each from taxi and car fleet,while the other fleets collectively contributed about5%. MC also contributed over 88% of the total VOCemission (62.4 Gg) and above 80% of air toxicsemissions. The large MC fleet also contributed pre-dominantly to PM, about 70% of the total emissionof 3.7 Gg/year. It is noted that the PM EFs from MC,0.094 g/km and 0.23 g/start [1], were higher thanthose from other gasoline-fueled vehicles of per-sonal cars (PC) and taxis obtained in this study,but as expected were lower than the EFs ofdiesel-powered vehicles (Table S8). The diesel fleets,
Table 2. Emission factors of selected pollutants for vehicles in Hanoi, 2010.
Vehicle types States CO VOC VOC evap. NOx Benzene PM10
Bus Weekday Start (g/start) 0.628 0.054 � 0.791 0.001 1.133Running (g/km) 7.031 1.764 � 17.266 0.019 2.118
Weekend Start (g/start) 0.622 0.053 � 0.787 0.001 1.121Running (g/km) 6.592 1.644 � 16.173 0.017 1.986
Average Start (g/start) 0.626 0.053 � 0.790 0.001 1.129Running (g/km) 6.905 1.730 � 16.954 0.018 2.080
Taxi Weekday Start (g/start) 23.947 1.981 0.403 0.553 0.005 0.013Running (g/km) 20.842 1.715 0.380 0.798 0.047 0.009
Weekend Start (g/start) 23.621 1.850 0.316 0.521 0.005 0.011Running (g/km) 32.661 5.584 1.365 1.249 0.132 0.020
Average Start (g/start) 23.854 1.944 0.378 0.544 0.005 0.012Running (g/km) 24.219 2.820 0.661 0.927 0.071 0.012
Car Weekday Start (g/start) 10.445 0.998 0.066 0.606 0.005 0.011Running (g/km) 9.825 1.448 0.179 0.871 0.083 0.011
Weekend Start (g/start) 11.614 1.113 0.073 0.617 0.007 0.013Running (g/km) 13.296 2.004 0.245 1.130 0.113 0.015
Average Start (g/start) 10.779 1.031 0.068 0.610 0.006 0.012Running (g/km) 10.816 1.607 0.198 0.945 0.092 0.012
Note: VOC - volatile organic compounds; PM - particulate matter.
124 T. T. TRANG ET AL.
Dow
nloa
ded
by [
Tra
n T
hu T
rang
] at
01:
12 2
4 Ju
ne 2
016
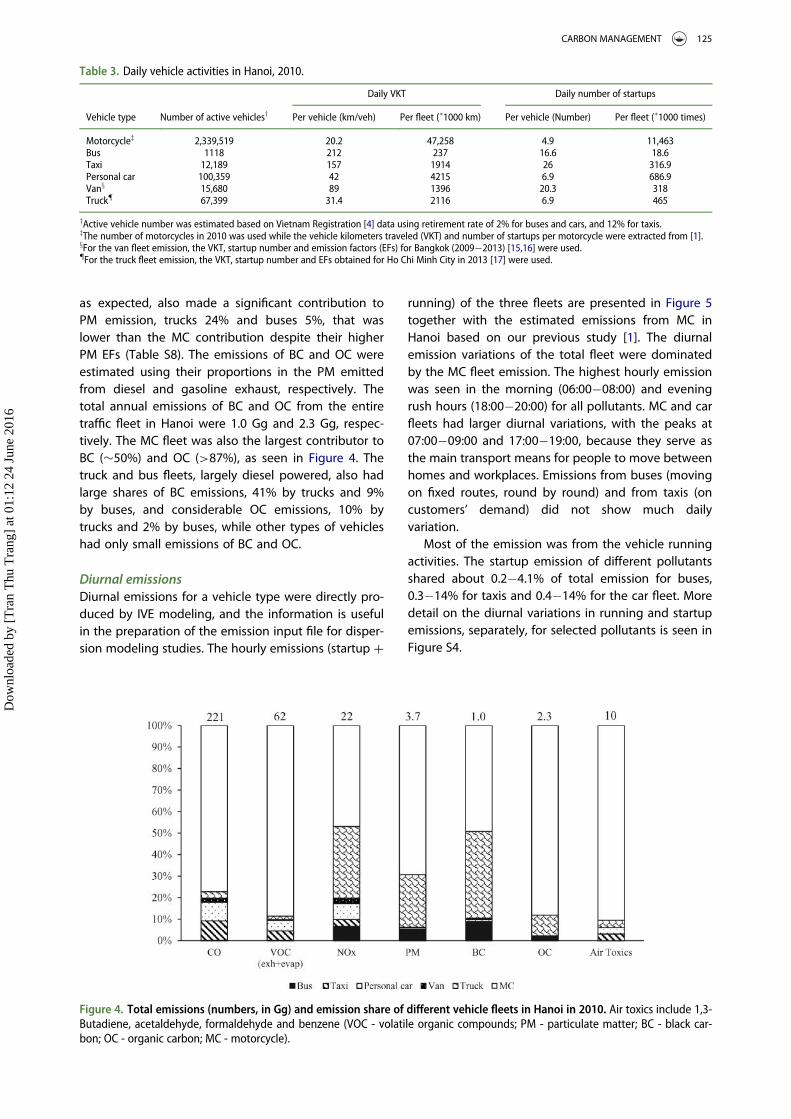
as expected, also made a significant contribution toPM emission, trucks 24% and buses 5%, that waslower than the MC contribution despite their higherPM EFs (Table S8). The emissions of BC and OC wereestimated using their proportions in the PM emittedfrom diesel and gasoline exhaust, respectively. Thetotal annual emissions of BC and OC from the entiretraffic fleet in Hanoi were 1.0 Gg and 2.3 Gg, respec-tively. The MC fleet was also the largest contributor toBC (»50%) and OC (>87%), as seen in Figure 4. Thetruck and bus fleets, largely diesel powered, also hadlarge shares of BC emissions, 41% by trucks and 9%by buses, and considerable OC emissions, 10% bytrucks and 2% by buses, while other types of vehicleshad only small emissions of BC and OC.
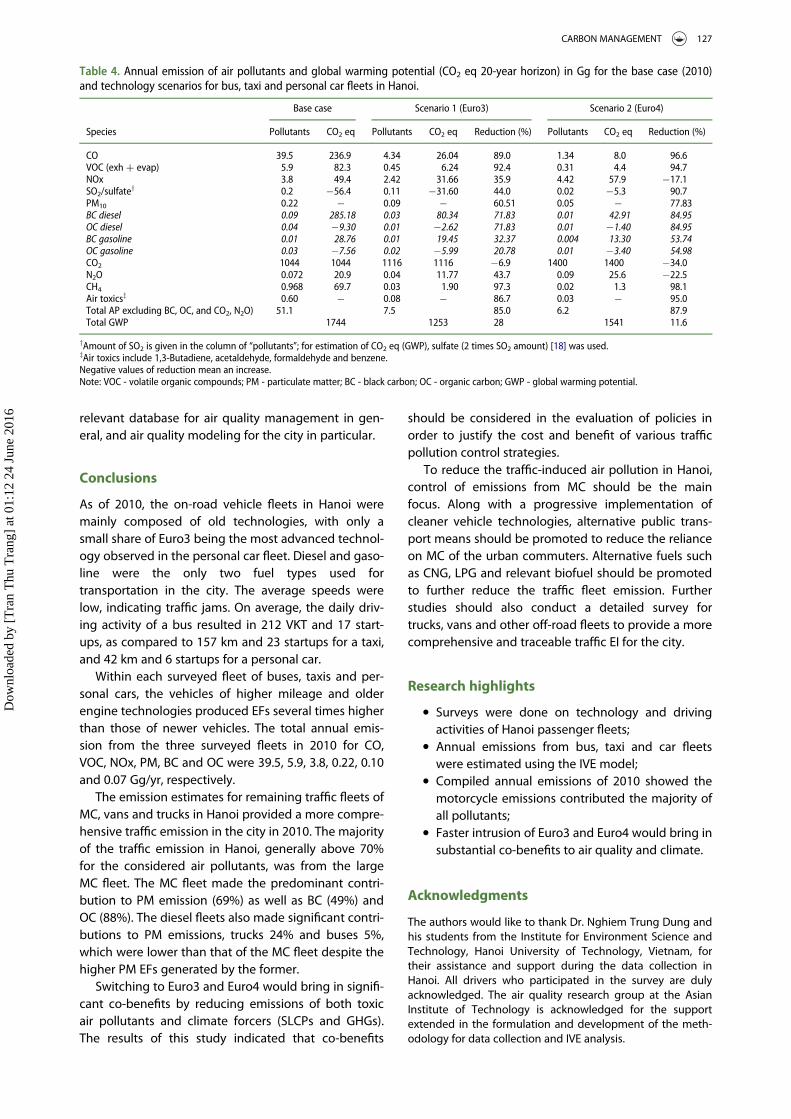
Diurnal emissionsDiurnal emissions for a vehicle type were directly pro-duced by IVE modeling, and the information is usefulin the preparation of the emission input file for disper-sion modeling studies. The hourly emissions (startup C
running) of the three fleets are presented in Figure 5together with the estimated emissions from MC inHanoi based on our previous study [1]. The diurnalemission variations of the total fleet were dominatedby the MC fleet emission. The highest hourly emissionwas seen in the morning (06:00�08:00) and eveningrush hours (18:00�20:00) for all pollutants. MC and carfleets had larger diurnal variations, with the peaks at07:00�09:00 and 17:00�19:00, because they serve asthe main transport means for people to move betweenhomes and workplaces. Emissions from buses (movingon fixed routes, round by round) and from taxis (oncustomers’ demand) did not show much dailyvariation.
Most of the emission was from the vehicle runningactivities. The startup emission of different pollutantsshared about 0.2�4.1% of total emission for buses,0.3�14% for taxis and 0.4�14% for the car fleet. Moredetail on the diurnal variations in running and startupemissions, separately, for selected pollutants is seen inFigure S4.
Table 3. Daily vehicle activities in Hanoi, 2010.
Daily VKT Daily number of startups
Vehicle type Number of active vehiclesy Per vehicle (km/veh) Per fleet (�1000 km) Per vehicle (Number) Per fleet (�1000 times)
Motorcyclez 2,339,519 20.2 47,258 4.9 11,463Bus 1118 212 237 16.6 18.6Taxi 12,189 157 1914 26 316.9Personal car 100,359 42 4215 6.9 686.9Vanx 15,680 89 1396 20.3 318Truck{ 67,399 31.4 2116 6.9 465
yActive vehicle number was estimated based on Vietnam Registration [4] data using retirement rate of 2% for buses and cars, and 12% for taxis.zThe number of motorcycles in 2010 was used while the vehicle kilometers traveled (VKT) and number of startups per motorcycle were extracted from [1].xFor the van fleet emission, the VKT, startup number and emission factors (EFs) for Bangkok (2009�2013) [15,16] were used.{For the truck fleet emission, the VKT, startup number and EFs obtained for Ho Chi Minh City in 2013 [17] were used.
Figure 4. Total emissions (numbers, in Gg) and emission share of different vehicle fleets in Hanoi in 2010. Air toxics include 1,3-Butadiene, acetaldehyde, formaldehyde and benzene (VOC - volatile organic compounds; PM - particulate matter; BC - black car-bon; OC - organic carbon; MC - motorcycle).
CARBON MANAGEMENT 125
Dow
nloa
ded
by [
Tra
n T
hu T
rang
] at
01:
12 2
4 Ju
ne 2
016

Air quality and climate co-benefits of faster vehicletechnology intrusion
The survey results showed that as of 2010, most of thebus, car and taxi fleets in Hanoi did not comply withEuro3 (Table 1). The current policy of Vietnam is tohave the vehicle fleet conform to Euro4 by 2017 [112].This study attempted to estimate how much emissionof air pollution and climate forcers could be preventedif Euro standards, Euro3 and Euro4 respectively, couldhave been implemented as soon as 2010. As men-tioned above, the Euro3 and Euro4 scenarios were con-structed by assuming that all vehicles of lower enginestandards would be scrapped and their VKT would beprovided by new Euro3 and Euro4 vehicles, respec-tively (Table S5).
Table 4 presents a summary of the results of theemissions and emission reductions for bus, taxi and carfleets under the two Euro scenarios. Scenario 1 (Euro3)would induce significant reductions in emissions ascompared to the base case � that is, by above 60% formost toxic air pollutants, with higher reductions seenfor VOC (92%), CO (89%) and air toxics (87%). The PMemission reduction would be 61%, while NOx and SOxemission reductions would be 36 and 44%, respec-tively. The emission of GHGs N2O and CH4 wouldreduce while CO2 would increase (by 6.9%), which maybe explained by better combustion, hence CO2 insteadof CO or VOC would be emitted. Collectively, under
Scenario 1, the emission reduction for the air pollutants(excluding BC/OC to avoid double counting with PM10)would be 85% while that of GWP (20-year horizon)would be 28%.
Further improvement of the vehicle technology toEuro4 under Scenario 2 would bring in additional emis-sion reductions of all pollutants, but increases in emis-sions of NOx, CO2 and N2O (Table 4). Note that SOxemission reduction under Scenario 2 is more significantthan under Scenario 1 because a lower S content wasused in IVE to satisfy the requirements of Euro4vehicles. The overall emission reduction of air pollu-tants under the Euro4 scenario, compared to the basecase, would be 87.9%, while the GWP of the emissionswould reduce by 11.6%.
Our previous study for MC [1] also showed that if allMC in Hanoi conformed to Euro3 then the emissionreduction, as compared to the base case of 2008,would be 70% for air pollutants and 16% for CO2, whilethe 20-year GWP of the emissions would reduce by58.8%. Thus, faster technology intrusion for the vehiclefleets would bring in large co-benefits in air qualityimprovement and mitigation of climate forcer emis-sions in Hanoi.
Further studies should conduct comprehensive sur-veys for the van and truck fleets together with off-roadvehicles to provide more detailed vehicle EI for Hanoi.Such EI should be regularly updated to provide a
0
10
20
30
40
50
60
0 1 2 3 4 5 6 7 8 9 1011121314151617181920212223
Hours
CO (t h-1) MC Personal car*10 Taxi*10 Bus*10
0
2
4
6
8
10
12
14
16
0 1 2 3 4 5 6 7 8 9 1011121314151617181920212223
Hours
VOC (t h-1) MC Personal car*10 Taxi*10 Bus*10
0
0.5
1
1.5
2
2.5
3
1 2 3 4 5 6 7 8 9 1011121314151617181920212223
Hours
NOx (t h-1) MC Personal car*10 Taxi*10 Bus*10
0
0.1
0.2
0.3
0.4
0.5
0.6
0.7
0.8
0 1 2 3 4 5 6 7 8 9 10 11 12 13 14 15 16 17 18 19 20 21 22 23
Hours
PM (t h-1) MC Personal car*10 Taxi*10 Bus*10
Figure 5. Diurnal variations of traffic emissions in Hanoi for motorcycles (MC), personal cars, taxis and buses (excluding vansand trucks). Values for other fleets are scaled up 10 times to be visible along with those for MC (VOC - volatile organic compounds;PM - particulate matter).
126 T. T. TRANG ET AL.
Dow
nloa
ded
by [
Tra
n T
hu T
rang
] at
01:
12 2
4 Ju
ne 2
016
relevant database for air quality management in gen-eral, and air quality modeling for the city in particular.
Conclusions
As of 2010, the on-road vehicle fleets in Hanoi weremainly composed of old technologies, with only asmall share of Euro3 being the most advanced technol-ogy observed in the personal car fleet. Diesel and gaso-line were the only two fuel types used fortransportation in the city. The average speeds werelow, indicating traffic jams. On average, the daily driv-ing activity of a bus resulted in 212 VKT and 17 start-ups, as compared to 157 km and 23 startups for a taxi,and 42 km and 6 startups for a personal car.
Within each surveyed fleet of buses, taxis and per-sonal cars, the vehicles of higher mileage and olderengine technologies produced EFs several times higherthan those of newer vehicles. The total annual emis-sion from the three surveyed fleets in 2010 for CO,VOC, NOx, PM, BC and OC were 39.5, 5.9, 3.8, 0.22, 0.10and 0.07 Gg/yr, respectively.
The emission estimates for remaining traffic fleets ofMC, vans and trucks in Hanoi provided a more compre-hensive traffic emission in the city in 2010. The majorityof the traffic emission in Hanoi, generally above 70%for the considered air pollutants, was from the largeMC fleet. The MC fleet made the predominant contri-bution to PM emission (69%) as well as BC (49%) andOC (88%). The diesel fleets also made significant contri-butions to PM emissions, trucks 24% and buses 5%,which were lower than that of the MC fleet despite thehigher PM EFs generated by the former.
Switching to Euro3 and Euro4 would bring in signifi-cant co-benefits by reducing emissions of both toxicair pollutants and climate forcers (SLCPs and GHGs).The results of this study indicated that co-benefits
should be considered in the evaluation of policies inorder to justify the cost and benefit of various trafficpollution control strategies.
To reduce the traffic-induced air pollution in Hanoi,control of emissions from MC should be the mainfocus. Along with a progressive implementation ofcleaner vehicle technologies, alternative public trans-port means should be promoted to reduce the relianceon MC of the urban commuters. Alternative fuels suchas CNG, LPG and relevant biofuel should be promotedto further reduce the traffic fleet emission. Furtherstudies should also conduct a detailed survey fortrucks, vans and other off-road fleets to provide a morecomprehensive and traceable traffic EI for the city.
Research highlights
� Surveys were done on technology and drivingactivities of Hanoi passenger fleets;
� Annual emissions from bus, taxi and car fleetswere estimated using the IVE model;
� Compiled annual emissions of 2010 showed themotorcycle emissions contributed the majority ofall pollutants;
� Faster intrusion of Euro3 and Euro4 would bring insubstantial co-benefits to air quality and climate.
Acknowledgments
The authors would like to thank Dr. Nghiem Trung Dung andhis students from the Institute for Environment Science andTechnology, Hanoi University of Technology, Vietnam, fortheir assistance and support during the data collection inHanoi. All drivers who participated in the survey are dulyacknowledged. The air quality research group at the AsianInstitute of Technology is acknowledged for the supportextended in the formulation and development of the meth-odology for data collection and IVE analysis.
Table 4. Annual emission of air pollutants and global warming potential (CO2 eq 20-year horizon) in Gg for the base case (2010)and technology scenarios for bus, taxi and personal car fleets in Hanoi.
Base case Scenario 1 (Euro3) Scenario 2 (Euro4)
Species Pollutants CO2 eq Pollutants CO2 eq Reduction (%) Pollutants CO2 eq Reduction (%)
CO 39.5 236.9 4.34 26.04 89.0 1.34 8.0 96.6VOC (exh C evap) 5.9 82.3 0.45 6.24 92.4 0.31 4.4 94.7NOx 3.8 49.4 2.42 31.66 35.9 4.42 57.9 �17.1SO2/sulfate
y 0.2 �56.4 0.11 �31.60 44.0 0.02 �5.3 90.7PM10 0.22 � 0.09 � 60.51 0.05 � 77.83BC diesel 0.09 285.18 0.03 80.34 71.83 0.01 42.91 84.95OC diesel 0.04 �9.30 0.01 �2.62 71.83 0.01 �1.40 84.95BC gasoline 0.01 28.76 0.01 19.45 32.37 0.004 13.30 53.74OC gasoline 0.03 �7.56 0.02 �5.99 20.78 0.01 �3.40 54.98CO2 1044 1044 1116 1116 �6.9 1400 1400 �34.0N2O 0.072 20.9 0.04 11.77 43.7 0.09 25.6 �22.5CH4 0.968 69.7 0.03 1.90 97.3 0.02 1.3 98.1Air toxicsz 0.60 � 0.08 � 86.7 0.03 � 95.0Total AP excluding BC, OC, and CO2, N2O) 51.1 7.5 85.0 6.2 87.9Total GWP 1744 1253 28 1541 11.6
yAmount of SO2 is given in the column of “pollutants”; for estimation of CO2 eq (GWP), sulfate (2 times SO2 amount) [18] was used.zAir toxics include 1,3-Butadiene, acetaldehyde, formaldehyde and benzene.Negative values of reduction mean an increase.Note: VOC - volatile organic compounds; PM - particulate matter; BC - black carbon; OC - organic carbon; GWP - global warming potential.
CARBON MANAGEMENT 127
Dow
nloa
ded
by [
Tra
n T
hu T
rang
] at
01:
12 2
4 Ju
ne 2
016

References
1. Kim Oanh NT, Thuy Phuong MT, Permadi DA. Analysis ofmotorcycle fleet in Hanoi for estimation of air pollutionemission and climate mitigation co-benefit of technologyimplementation. Atmos. Environ. 59(0), 438�448, doi:http://dx.doi.org/10.1016/j.atmosenv.2012.04.057 (2012).
2. Vietnam Register (VR). Vietnam Transportation StatisticalBook. Vietnam Register, Hanoi, Vietnam (2013).
3. Co HX, Nghiem TD, Phuc NH, Kim Oanh NT. Chapter 7: airquality management in Hanoi, Vietnam. In: Improving AirQuality in Asian Developing Countries. Compilation ofResearch Findings. Kim Oanh NT (Ed.). NARENCA, Hanoi,Vietnam, 113�134 (2014).
4. Vietnam Register (VR). Vietnam Transportation StatisticalBook. Vietnam Register, Hanoi, Vietnam (2010).
5. Bond TC, Doherty SJ, Fahey DW et al. Bounding the roleof black carbon in the climate system: a scientific assess-ment. J. Geophys. Res. Atmos. 118, 5380�5552,doi:10.1002/jgrd.50171 (2013).
6. Bahner MA, Weitz KA, Zapata A, DeAngelo BJ. Use ofblack carbon and organic carbon inventories for projec-tions and mitigation analysis. Presented at: 16th AnnualInternational Emission Inventory Conference, EmissionInventories: Integration, Analysis, and Communications,Raleigh, North Carolina, USA 14�17, May 2007.
7. Wang H, Chen C, Huang C, Fu L. On-road vehicle emis-sion inventory and its uncertainty analysis for Shanghai,China. Sci. Total Environ. 398(1�3), 60�67 (2007).
8. Shrestha SR, Kim Oanh NT, Xu Q, Rupakheti M, LawrenceMG. Analysis of the vehicle fleet in the Kathmandu Valleyfor estimation of environment and climate co-benefits oftechnology intrusions. Atmos. Environ. 81(0), 579�590,doi:http://dx.doi.org/10.1016/j.atmosenv.2013.09.050(2013).
9. Kim Oanh NT, Thiansathit W, Bond TC, Subramanian R,Ekbordin W, Pawarmart I. Compositional characterizationof PM2.5 emitted from in-use diesel vehicles. Atmos. Envi-ron. 44(1), 15�22, doi:http://dx.doi.org/10.1016/j.atmosenv.2009.10.005 (2009).
10. Truc VTQ, Kim Oanh NT. Roadside BTEX and other gas-eous air pollutants in relation to emission sources. Atmos.Environ. 41, 7685�7697 (2007).
11. Tung HY, Hung WT. A framework for developing drivingcycles with on�road driving data. Sci. Total Environ. 409,2761�2767 (2010).
12. Hung NT, Ketzel M, Jensen SS, Kim Oanh NT. Air pollutionmodeling at road sides using the operational street pol-lution model � a case study in Hanoi, Vietnam. J. AirWaste Manage. Assoc. 60(11), 1315�1326 (2010).
13. Tung HY, Tong HY, Hung WT, Anh NTN. Development ofemission factors and emission inventories for motor-cycles and light duty vehicles in the urban region in Viet-nam. Transp. Rev. 30(5), 589�615 (2011).
14. Giang NTH, Kim Oanh NT. Roadside levels and trafficemission rates of PM2.5 and BTEX in Ho Chi Minh City,Vietnam. Atmos. Environ. 94, 806�816, doi:10.1016/j.atmosenv.2014.05.074 (2014).
15. Vilaiphorn AE. Assessment of air quality and climate co-benefit for urban public transport: case study in BangkokMetropolitan Region [Master’s thesis]. Asian Institute ofTechnology, Thailand (2010).
16. Limanond T, Pongthanaisawan J, Watthanaklang D,Sangphong O. An analysis of vehicle kilometers oftravel of major cities in Thailand. In: ATRANS (Asian Trans-portation Research Society, Thailand) Final Report 2009(2009).
17. Van HH. Development of emission inventory for vehiclefleet in Ho Chi Minh City to estimate environment and cli-mate co-benefit of faster technology intrusion [Master’sthesis]. Asian Institute of Technology, Thailand (2014).
18. Fuglestvedt JS, Shine KP, Berntsen T et al. Transportimpacts on atmosphere and climate: metrics. Atmos.Environ. 44, 4648�4677 (2010).
Websites
101. Hanoi Transport Department (HTD). (2009). www.mt.gov.vn/vn/Pages/Trangchu.aspx
102. Hanoi Urban Transport Management and OperationCenter (TRAMOC). Bus Network in Hanoi (2013). http://tramoc.com.vn/modules.php?name=Content&opcase=viewcontent&mcid=155
103. National State of Environment. Vietnam urban air envi-ronment (2007). http://cem.gov.vn/BAOCAO_Content/tabid/356/cat/175/nfriend/3742098/language/vi-VN/Default.aspx
104. United Nations Environment Programme (UNEP),World Meteorological Organization (WMO). Integratedassessment of black carbon and tropospheric ozone.Narobi, Kenya (2011). www.unep.org/dewa/Portals/67/pdf/BlackCarbon_report.pdf
105. The Information Systems Security Research Center(ISSRC). IVE Model User’s Manual Version 2.0 (2008).www.issrc.org/ive/
106. World Bank. Transport in East Asia and Pacific: Trans-port in Vietnam (2006). www.worldbank.org/transport/transportresults/regions/eap.html
107. Weather underground. Weather History for Hanoi,Vietnam (2010). http://www.wunderground.com/history/airport/VVNB/2010/7/5/MonthlyCalendar.html?req_city=Hanoi&req_state=&req_statename=Viet%20Nam&reqdb.zip=00000&reqdb.magic=1&reqdb.wmo=48819
108. Directorate for Standards and Quality (STAMEQ). TCVN6776:2005, TCVN 6438:2005, TCVN 5689:2005, TCVN7358:2003, TCVN 7357:2003, TCVN 6776:2000. STAMEQOnline. (2000�2005). http://tcvn.gov.vn
109. Vietnam National Petroleum Corporation (VNPC).Information on petrolimex (2009). http://www.petrolimex.com.vn/tn/tu-lieu/information-on-petrolimex.html
110. United States Environmental Protection Agency (USEPA). Chapter 4: emissions of black carbon. In: Reportof Congress on Black Carbon (2012). www.epa.gov/blackcarbon/2012report/Chapter4.pdf
111. Huang C, Pan H, Lents J, Davis N, Osses M, Nikkila N.Shanghai Vehicle Activity Study (2005). www.issrc.org/iveGssr.html
112. Vietnam Government Portal. Decision 49/2011/QD-TTG on vehicle standard in Vietnam (2011). www.customs.gov.vn/Lists/EnglishDocuments/ViewDetails.aspx?IDD1163&languageDen-US
128 T. T. TRANG ET AL.
Dow
nloa
ded
by [
Tra
n T
hu T
rang
] at
01:
12 2
4 Ju
ne 2
016