Embed Size (px)
DESCRIPTION
transformer cooling improvement
Citation preview
Technical Report
Transformer Cooling SystemsImprovementsAnalysis and Recommendations
Effective December 6, 2006, this report has been made publicly available in accordance with Section 734.3(b)(3) and published in accordance with Section 734.7 of the U.S. Export Administration Regulations. As a result of this publication, this report is subject to only copyright protection and does not require any license agreement from EPRI. This notice supersedes the export control restrictions and any proprietary licensed material notices embedded in the document prior to publication.

EPRI Project Manager B. Ward
ELECTRIC POWER RESEARCH INSTITUTE 3420 Hillview Avenue, Palo Alto, California 94304-1395 • PO Box 10412, Palo Alto, California 94303-0813 • USA
800.313.3774 • 650.855.2121 • [email protected] • www.epri.com
Transformer Cooling System Improvements Analysis and Recommendations
1010585
Final Report, December 2005
DISCLAIMER OF WARRANTIES AND LIMITATION OF LIABILITIES
THIS DOCUMENT WAS PREPARED BY THE ORGANIZATION(S) NAMED BELOW AS AN ACCOUNT OF WORK SPONSORED OR COSPONSORED BY THE ELECTRIC POWER RESEARCH INSTITUTE, INC. (EPRI). NEITHER EPRI, ANY MEMBER OF EPRI, ANY COSPONSOR, THE ORGANIZATION(S) BELOW, NOR ANY PERSON ACTING ON BEHALF OF ANY OF THEM:
(A) MAKES ANY WARRANTY OR REPRESENTATION WHATSOEVER, EXPRESS OR IMPLIED, (I) WITH RESPECT TO THE USE OF ANY INFORMATION, APPARATUS, METHOD, PROCESS, OR SIMILAR ITEM DISCLOSED IN THIS DOCUMENT, INCLUDING MERCHANTABILITY AND FITNESS FOR A PARTICULAR PURPOSE, OR (II) THAT SUCH USE DOES NOT INFRINGE ON OR INTERFERE WITH PRIVATELY OWNED RIGHTS, INCLUDING ANY PARTY'S INTELLECTUAL PROPERTY, OR (III) THAT THIS DOCUMENT IS SUITABLE TO ANY PARTICULAR USER'S CIRCUMSTANCE; OR
(B) ASSUMES RESPONSIBILITY FOR ANY DAMAGES OR OTHER LIABILITY WHATSOEVER (INCLUDING ANY CONSEQUENTIAL DAMAGES, EVEN IF EPRI OR ANY EPRI REPRESENTATIVE HAS BEEN ADVISED OF THE POSSIBILITY OF SUCH DAMAGES) RESULTING FROM YOUR SELECTION OR USE OF THIS DOCUMENT OR ANY INFORMATION, APPARATUS, METHOD, PROCESS, OR SIMILAR ITEM DISCLOSED IN THIS DOCUMENT.
ORGANIZATION(S) THAT PREPARED THIS DOCUMENT
Power Delivery Consultants, Inc.
NOTE
For further information about EPRI, call the EPRI Customer Assistance Center at (800) 313-3774 or email [email protected]
Electric Power Research Institute and EPRI are registered service marks of the Electric Power Research Institute, Inc.
Copyright © 2005 Electric Power Research Institute, Inc. All rights reserved.
CITATIONS
This report was prepared by
Power Delivery Consultants, Inc. 28 Lundy Lane, Suite 102 Ballston Lake, NY 12019
Principal Investigator T. Raymond
This report describes research sponsored by the Electric Power Research Institute (EPRI).
The report is a corporate document that should be cited in the literature in the following manner:
Transformer Cooling System Improvements: Analysis and Recommendations. EPRI, Palo Alto, CA: 2005. 1010585.
iii

v
PRODUCT DESCRIPTION
As system loads increase, equipment owners are looking to more innovative ways to safely increase the capacity of existing equipment. There are several options available for overhead lines and underground cables. The options are limited for power transformers, however. Short of replacement or a total redesign and rewind, only the external cooling equipment can be augmented or upgraded. This equipment includes fans, pumps, radiators and heat exchangers.
Realizing the market potential, several heat exchanger and cooling equipment suppliers are advertising products for aftermarket cooling upgrades. Some cooling equipment manufacturers make broad claims of capacity gains that are difficult to verify. In addition, little practical experience is available to provide sufficient guidance in the application of these devices to transformers operating in the field, where no detailed information of the internal design of the transformer is available.
Results & Findings This report provides an overview of commercially available options for upgraded cooling. The report outlines the potential advantages and disadvantages of each option and provides general application guidance, including an approximate method to assess the increased capacity following installation.
Challenges & Objectives This report is intended to provide power engineers responsible for transformer operation and maintenance with practical information concerning the benefits and concerns associated with the application of aftermarket cooling upgrades. Any modification to the original cooling system brings a unique set of difficulties. Unless detailed thermal design information of the transformer is available, determining operating temperatures with the modified cooling system requires making additional assumptions regarding the thermal behavior of the transformer beyond the assumptions already made in traditional operating thermal calculations. In addition, little may be known about potential constraints, including internal leads, current transformers, load tap changers, and series transformers. While it is highly recommended that the user consult the original manufacturer when applying any additional cooling, some guidance is provided for cases where this is not possible.
Applications, Values & Use Many new devices for power transformer supplemental cooling are emerging as the motivation to delay capital investments remains. Utilities experiencing rapid load growth or unexpected long-term emergency conditions are left with few options and are turning to these cooling upgrades as a solution. However, very little information is available giving users guidance in the application of these devices. This report is intended to fill some of this gap.
vi
EPRI Perspective Very little guidance is available to users in the application of power transformer supplemental cooling options. Cooling equipment manufacturers are marketing more devices expressly for the purpose of aftermarket cooling upgrades. Occasionally, the user is provided with incomplete or misleading information on the performance and application of these devices. While consultation with the original transformer manufacturer is always the best policy, this is not always possible. For this reason, the information contained in this report will be invaluable to users investigating or considering the use of any cooling modifications or upgrades.
Approach This project was approached both anecdotally and academically. The project team requested information from cooling equipment manufacturers on equipment marketed as a cooling upgrade. In addition, the team contacted several utility engineers to solicit their experiences with cooling upgrades. Where possible, field data was utilized to evaluate the performance of these devices. However, little data is available at this time. To augment the field data, the project team developed a basic detailed thermal model to assess the impact of external cooling upgrades on the internal winding temperatures. This information was then used to present some practical guidelines for the selection and application of supplemental cooling options.
Keywords Power transformers Supplemental cooling Auxiliary cooling Cooling upgrades Uprating
ACKNOWLEDGEMENTS
This report is largely the result of discussions with many individuals and companies who provided invaluable information and experience. These included:
John Haufler – Consolidated Edison Company of New York
Mike Lau – British Columbia Transmission Company
Bob Perlicheck – Public Service of New Mexico
Dick Amos – Unifin
Cam Young – California Turbo
Nino Pedone – General Electric
vii

CONTENTS
1 SUPPLEMENTAL COOLING ANALYSIS..............................................................................1-1 General Discussion of Transformer Temperature Relationships ..........................................1-2 Initial Analysis........................................................................................................................1-5 Fans ......................................................................................................................................1-7 Pumps ...................................................................................................................................1-8 Radiators...............................................................................................................................1-9 Heat Exchangers...................................................................................................................1-9 Spray Cooling......................................................................................................................1-10 Determining Load Capability Post-Upgrade........................................................................1-11 Difficulties............................................................................................................................1-13
General Concerns ..........................................................................................................1-13 Bushings.........................................................................................................................1-13 Load Tap Changers........................................................................................................1-13 Leads..............................................................................................................................1-13
Radiator Model ....................................................................................................................1-14 Natural Convection .........................................................................................................1-15 Forced Convection .........................................................................................................1-16
Winding Model ....................................................................................................................1-17
2 REFERENCES .......................................................................................................................2-1
ix

LIST OF FIGURES
Figure 1-1 Diagram Depicting Relationship of the Temperatures of Various Components .......1-3 Figure 1-2 Plot of % Rating Increase vs. Reduction in Oil Temperature ...................................1-5 Figure 1-3 Plot of Rating Increase vs. Additional Heat Dissipated ............................................1-7 Figure 1-4 Radiator/Fan Model ................................................................................................1-14 Figure 1-5 Winding/Duct Model ...............................................................................................1-17
xi

LIST OF TABLES
Table 1-1 Example of Gains from Addition of Fans ...................................................................1-8
xiii

1 SUPPLEMENTAL COOLING ANALYSIS
As system loads increase, equipment owners are looking to more innovative ways to safely increase the capacity of existing equipment. There are several options available for overhead lines and underground cables. The options are limited for power transformers, however. Short of replacement or a total redesign and rewind, only the external cooling equipment can be augmented or upgraded. This includes fans, pumps, radiators and heat exchangers.
Realizing the market potential, several heat exchanger and cooling equipment suppliers are advertising products for aftermarket cooling upgrades. Some cooling equipment manufacturers make broad claims of capacity gains that are difficult to verify. In addition, little practical experience is available to provide sufficient guidance in the application of these devices to transformers operating in the field, where no detailed information of the internal design of the transformer is available.
This report is an attempt to discuss the currently available options, the benefits that can or cannot be gained by their employment and the proper application of these devices. This report is the result of discussions with cooling equipment manufacturers, transformer service providers and end users. The current body of knowledge on this subject is fairly slim. While transformer loading has been a topic of discussion for 100 years, the addition of cooling or modification of cooling has been less thoroughly considered. The level of experience with supplemental cooling, particularly with the newer devices, is low. Therefore, an increased level of caution or conservatism is warranted at this point.
Before discussing the available supplemental cooling options, it is appropriate to discuss some of the reasonable motivations for adding cooling capacity. Supplemental cooling may be applied as a temporary means to increase the thermal capacity of a power transformer during heavy loading or contingency conditions. These units have become system constraints as area load has grown or system reconfigurations have resulted in higher normal load levels. The supplemental cooling in these cases should be viewed as a transitional solution until additional capacity can be installed. Supplemental cooling may delay new transformer procurement by a few years, but should not postpone it indefinitely.
It is important to preface this discussion of supplemental cooling with a few words of caution. The addition of supplemental cooling is relatively unstudied. The body of knowledge and experience is not that extensive. In addition, information is often not available to assist the user in proper application. Only the original manufacturer has all of the information and experience to make a definitive judgment call on the load capability of the transformer following an upgrade or change to the cooling configuration, and even this decision is not made without some broad assumptions regarding the current condition of the transformer. The reliance upon additional thermal capacity provided by external cooling is not without risk. While the risk is lower than
1-1
Supplemental Cooling Analysis
overloading and operating at higher temperature, the risk is higher than maintaining load levels below the original nameplate.
The selection of candidate transformers for supplemental cooling should be made only after reviewing the current condition of the transformer. The increased load levels will exacerbate any stray flux heating problems, lead or winding conductor overheating or bad joints that may exist. If there are any signs of potential overheating, including any increasing trends in the key heating gases, supplemental cooling should not be considered to increase load capability. It may be beneficial to apply supplemental cooling in the case of moderate overheating problems in an attempt to alleviate some of the underlying condition and reduce the failure risk.
Discussion of the available cooling upgrade options will focus mostly on transformers with non-directed oil flow. The upgrade options for directed flow (ODAF) transformers are limited to replacement of the existing heat exchangers with more efficient, higher capacity heat exchangers. For non-directed oil flow transformers, the options are more numerous. These options are as follows:
• Additional Fans
• Dual Speed Fans
• Higher Flow-Rate Pumps
• Larger Radiators
• External Heat Exchangers
– Oil-to-Air
– Oil-to-Water
– “Exotics”
• Spray Cooling
General Discussion of Transformer Temperature Relationships
The two critical temperatures for transformer load capability are the winding hottest spot temperature and the top bulk oil temperature. The winding hottest spot temperature governs the maximum rate of the loss of insulation life and also is the most likely spot for gas evolution at high temperatures. The bulk top oil temperature governs oil expansion and, to some extent, the thermal capacity of ancillary components. The bulk oil temperatures can be measured in the field. The winding hot spot temperature can not be measured in the field unless fiber optic temperature probes have been installed. Therefore, the hot spot temperature must be estimated in some fashion. For this reason, it is important to have a feel for how the winding hot spot temperature is governed by the bulk oil temperatures and the load current in the winding.
1-2
Supplemental Cooling Analysis
T T OT B OT WDG
T HS
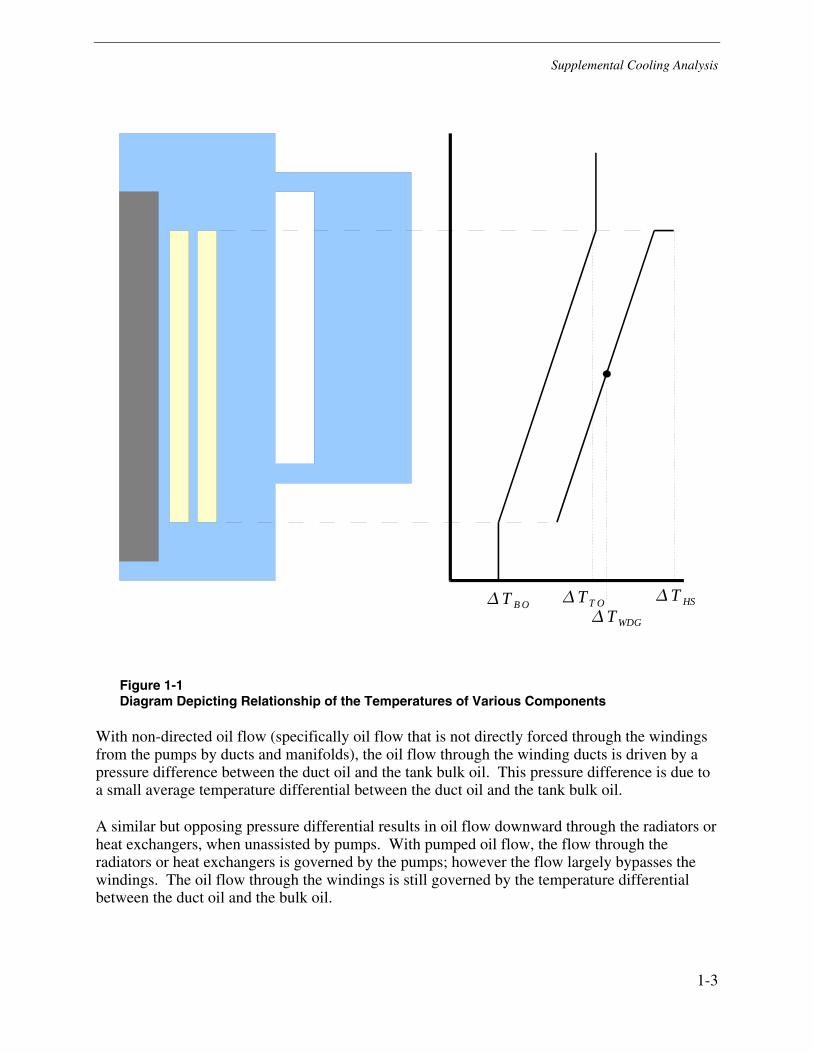
Figure 1-1 Diagram Depicting Relationship of the Temperatures of Various Components
With non-directed oil flow (specifically oil flow that is not directly forced through the windings from the pumps by ducts and manifolds), the oil flow through the winding ducts is driven by a pressure difference between the duct oil and the tank bulk oil. This pressure difference is due to a small average temperature differential between the duct oil and the tank bulk oil.
A similar but opposing pressure differential results in oil flow downward through the radiators or heat exchangers, when unassisted by pumps. With pumped oil flow, the flow through the radiators or heat exchangers is governed by the pumps; however the flow largely bypasses the windings. The oil flow through the windings is still governed by the temperature differential between the duct oil and the bulk oil.
1-3
Supplemental Cooling Analysis
Therefore, there can be envisioned two separate oil flow paths, one up through the windings and down through the bulk oil and the other up through the bulk oil and down through the radiators or heat exchangers. At steady-state, the two opposing flows in the bulk oil are equal and cancel.
In order to simplify the complexities of oil flow and temperature distribution in power transformers, some simplifying assumptions are made. The temperature at the radiator exit and at the bottom of the windings is assumed to be at the same temperature, TBO. The oil is heated evenly along the height of the windings, giving a linear distribution in duct oil temperature along the height of the duct, exiting at a maximum top-of-duct oil temperature, TTDO. The oil temperature is constant for the remainder of the oil height.
Depending upon the oil flow rate through the windings and the degree of mixing of the bulk oil, the top bulk oil temperature, TTO, is equal to or less than the temperature of the oil at the top of the duct. The oil entering the top inlet of the radiator is then at this top oil temperature. The oil is then cooled more or less linearly from the top oil temperature, TTO, to the bottom oil temperature, TBO.
The difference in the average duct oil temperature and the average bulk oil temperature drives the convective heat transfer in the windings. Therefore, the average bulk oil temperature governs the temperature rise of the duct oil as it moves upward through the duct. In addition, the top-of-duct oil temperature is a function of the heat flux along the duct walls, which in turn is directly related to the current density in the winding conductors. As load increases, more heat is generated in the windings which must be carried away by the duct oil. Summarizing, the duct oil gradient (top-of-duct oil temperature minus bottom oil temperature) is a function of the average bulk oil temperature and the load current.
The bottom bulk oil temperature is generally a function of the amount of external cooling and the speed at which the oil flows through the external coolers. The same amount of heat energy must be dissipated by the external cooling, equal to the total heat generated in the transformer. If the mass flow rate of oil is increased through the coolers, the difference between the oil temperature at the top of the cooler and the oil temperature at the bottom of the cooler decreases. If the average oil temperature remained constant, the bottom oil temperature would increase and the top oil temperature would decrease. The increased bottom oil temperature plus a constant duct oil gradient gives an increased top-of-duct oil temperature.
The winding temperature, in an ideal case, varies linearly along the winding height and is parallel to the duct oil temperature. The winding is hotter than the duct oil by a constant amount along the height of the winding. Because this is not completely true, as losses vary along the height of the winding and because the winding conductors and duct sizes can vary along the height of the winding, an additional increment is added above the average winding-to-average duct oil gradient. Generally, this increment is selected to be conservative and is roughly 0.2 or 0.3 times the average winding-to-average oil gradient. The total hot spot temperature is then equal to the bottom oil temperature plus the top-of-duct to bottom oil gradient plus 1.3 times the average winding-to-average oil gradient.
1-4
Supplemental Cooling Analysis
Initial Analysis
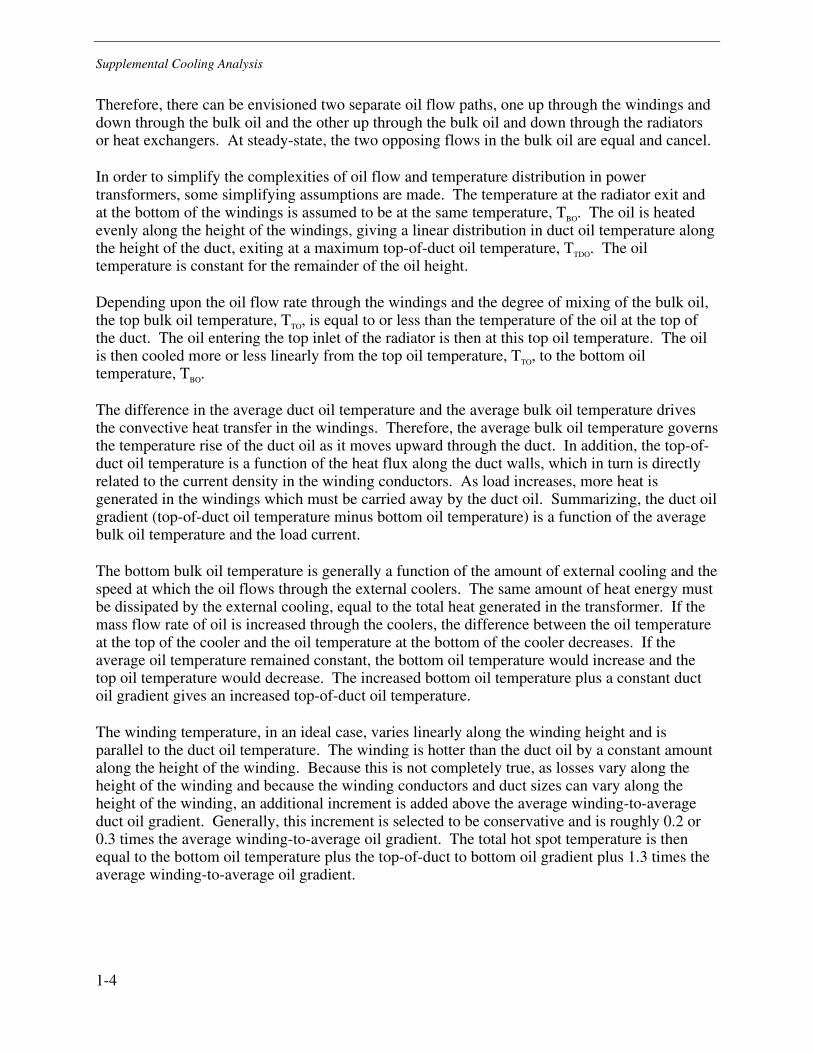
The decision to upgrade or augment the cooling of a power transformer is ultimately an economic decision, as most engineering decisions are. In order to decide which options warrant further investigation, a quick initial estimate of potential benefits and costs is necessary. The following discussion is intended to provide a feel for the potential benefits without a large amount of engineering effort. The conclusions drawn from this analysis should be used to decide where further analysis is justified. It should not be used to draw any final conclusions on load capability.
The rating increase can be roughly estimated from the decrease in top oil temperature as follows:
8.11
8080% ⎟⎟
⎠
⎞⎜⎜⎝
⎛−
=TOT
increaseδ
where δTTO is the change in top oil temperature due to the addition of supplemental cooling.
% Rating Increase
0
2
4
6
8
10
12
14
16
18
20
0 2 4 6 8 10 12 14 16 18 2
Reduction in Top Oil Temperature (deg C)
% In
crea
se in
Rat
ing
0
Figure 1-2 Plot of % Rating Increase vs. Reduction in Oil Temperature
Note that this essentially ignores that the oil rise will increase with load and may understate the rating increase by a few percent. However, the result is close enough for initial evaluation purposes. The decrease in top oil temperature can be estimated from the increase in total heat dissipated as follows:
1-5
Supplemental Cooling Analysis
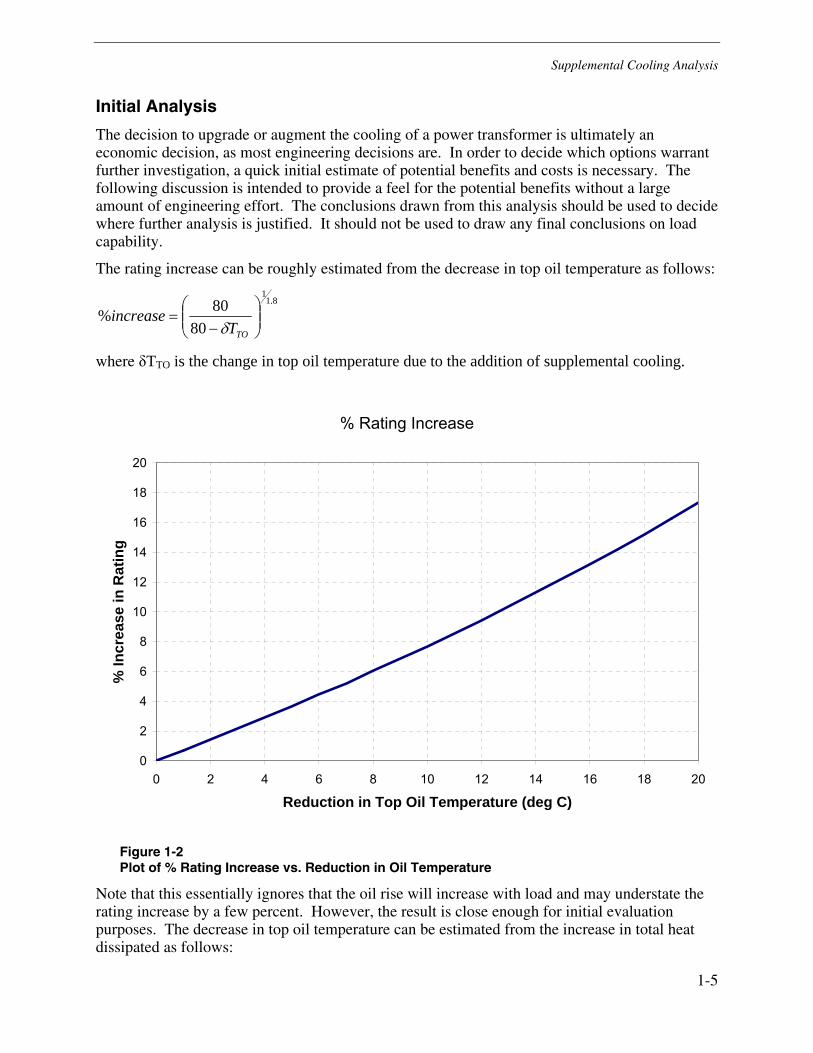
m
T
DissTOTO P
PTT ⎟⎟
⎠
⎞⎜⎜⎝
⎛−∆= 1δ
Where,
∆TTO is the original rated top oil rise
PDiss is the additional heat dissipated by the supplemental cooling
PT is the original rated total loss
m is the oil rise exponent (0.8-0.9)
While this is not exact and does not properly account for changes in convective heat transfer, the approximation is sufficient for a rough initial investigation into the feasibility of cooling augmentation or upgrade in a particular application. Taking this one step further, the percentage rating increase can be estimated as a function of the percent increase in total heat dissipation by combining the equations above:
8.11
8.0
180
80%
⎟⎟⎟⎟⎟
⎠
⎞
⎜⎜⎜⎜⎜
⎝
⎛
⎟⎟⎠
⎞⎜⎜⎝
⎛−∆−
=
T
DissTO P
PT
increase
1-6
Supplemental Cooling Analysis
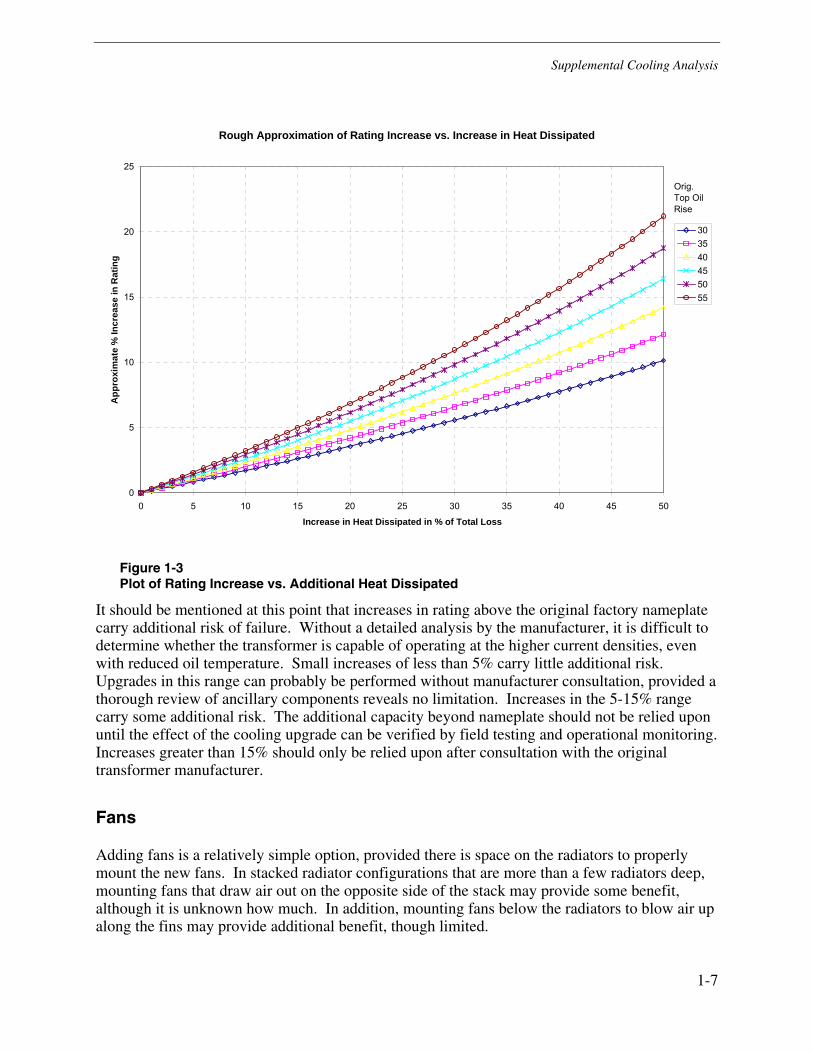
Rough Approximation of Rating Increase vs. Increase in Heat Dissipated
0
5
10
15
20
25
0 5 10 15 20 25 30 35 40 45 50
Increase in Heat Dissipated in % of Total Loss
App
roxi
mat
e %
Incr
ease
in R
atin
g
30
35
40
45
50
55
Orig. Top Oil Rise
Figure 1-3 Plot of Rating Increase vs. Additional Heat Dissipated
It should be mentioned at this point that increases in rating above the original factory nameplate carry additional risk of failure. Without a detailed analysis by the manufacturer, it is difficult to determine whether the transformer is capable of operating at the higher current densities, even with reduced oil temperature. Small increases of less than 5% carry little additional risk. Upgrades in this range can probably be performed without manufacturer consultation, provided a thorough review of ancillary components reveals no limitation. Increases in the 5-15% range carry some additional risk. The additional capacity beyond nameplate should not be relied upon until the effect of the cooling upgrade can be verified by field testing and operational monitoring. Increases greater than 15% should only be relied upon after consultation with the original transformer manufacturer.
Fans
Adding fans is a relatively simple option, provided there is space on the radiators to properly mount the new fans. In stacked radiator configurations that are more than a few radiators deep, mounting fans that draw air out on the opposite side of the stack may provide some benefit, although it is unknown how much. In addition, mounting fans below the radiators to blow air up along the fins may provide additional benefit, though limited.
1-7
Supplemental Cooling Analysis
1-8
Existing fans may be replaced altogether with larger, higher speed fans. If cooling equipment power losses or noise is a concern, dual speed fans can be used to allow a lower speed, quieter operation at low transformer load levels. In addition, specially designed low noise fans could provide some relief from noise constraints for a slightly increased cost.
The addition of fans will of course require additional power to supply the new fans. This will often mean replacing or rewiring the control cabinet or supplying a new control cabinet and rewiring all fans. The majority of costs associated with adding or replacing fans is often in labor and materials required to replace the fan supply feeds and controls.
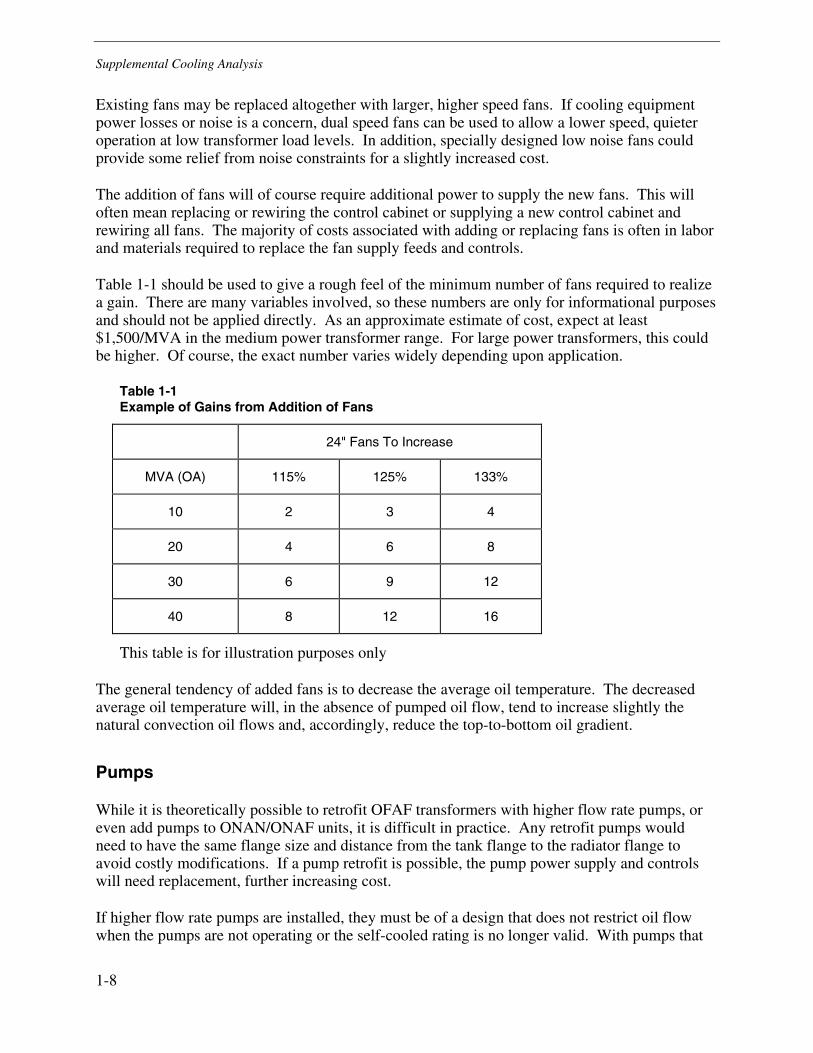
Table 1-1 should be used to give a rough feel of the minimum number of fans required to realize a gain. There are many variables involved, so these numbers are only for informational purposes and should not be applied directly. As an approximate estimate of cost, expect at least $1,500/MVA in the medium power transformer range. For large power transformers, this could be higher. Of course, the exact number varies widely depending upon application.
Table 1-1 Example of Gains from Addition of Fans
24" Fans To Increase
MVA (OA) 115% 125% 133%
10 2 3 4
20 4 6 8
30 6 9 12
40 8 12 16
This table is for illustration purposes only
The general tendency of added fans is to decrease the average oil temperature. The decreased average oil temperature will, in the absence of pumped oil flow, tend to increase slightly the natural convection oil flows and, accordingly, reduce the top-to-bottom oil gradient.
Pumps
While it is theoretically possible to retrofit OFAF transformers with higher flow rate pumps, or even add pumps to ONAN/ONAF units, it is difficult in practice. Any retrofit pumps would need to have the same flange size and distance from the tank flange to the radiator flange to avoid costly modifications. If a pump retrofit is possible, the pump power supply and controls will need replacement, further increasing cost.
If higher flow rate pumps are installed, they must be of a design that does not restrict oil flow when the pumps are not operating or the self-cooled rating is no longer valid. With pumps that
Supplemental Cooling Analysis
restrict oil flow when stopped, the flow through the radiators or heat exchangers is limited and the self-cooled rating is only a small fraction of the rating without the restriction. In the case of restricted oil flow, the failure of the pumps should result in immediate removal from service.
The general tendency of pumped oil flow is to reduce the top-to-bottom oil temperature gradient. The average oil temperature may also decrease slightly. The decreased oil gradient results in cooler oil entering the winding ducts at the bottom of the winding, increasing heat transformer from winding to duct oil and decreasing the top-of-duct oil temperature.
Radiators
Larger radiators or radiators of a more efficient design may be use to replace existing radiators. The replacement radiators must have the same centerline-to-centerline distance between inlet and outlet flanges and flange size. If equipped with fans, the old fans can be reused, possibly augmented with more fans as space permits, or new larger or higher speed fans can be used. Clearance to firewalls or other equipment may be an issue.
The increase in rating by additional radiator area is roughly proportional to the added area. For example, if the total radiator area (2 * height * fin depth * # fins/radiator * # radiators) is increased by 5%, the heat transfer increase will be of the same order of magnitude as 5% of the total losses. A more thorough analysis can be performed using the radiator calculation model described later in this report.
The economical gains from additional radiator area will be modest at best. Keep in mind that the larger radiator must replace an existing radiator. For large power transformers, the cost of cooling equipment can be as much as 20% of the total cost. Therefore, only a handful of radiators can be replaced without other options becoming more attractive.
Increased heat transfer from radiators will tend to mainly decrease the average oil temperature. If the oil flow is not pumped, the top-to-bottom oil gradient will also decrease slightly.
Heat Exchangers
There are several options available for supplemental cooling or cooling retrofits with heat exchangers. It is possible to retrofit units with radiators, replacing some or all of the radiators with heat exchangers. Heat exchangers general utilize higher flow rate pumps and fans, so noise may be an issue. Cost is also a large constraint, as heat exchangers tend to be costly. A total replacement of all radiators with heat exchangers would not be practical. Large increases in oil cooling will not translate into corresponding increases in rating.
A popular option is to utilize self-contained heat exchangers designed especially for field retrofit. These heat exchangers are relatively efficient in terms of heat removal vs. space and require little modification to the existing unit. These heat exchanger units are furnished complete with oil pump, fans and cooling controls. The inlet and outlet oil hoses can be connected to top and bottom fill/drain valves and connected to the flanges vacated by a removed radiator. Heat
1-9
Supplemental Cooling Analysis
dissipation of these units appears to be on the order of 100-150kW at a cost of roughly $50,000USD, or $300-500/kW, at the time of this writing.
As an option to the self-contained heat exchangers, a radiator replacement could be fabricated for radiators with direct oil flow to the tank (not through a header with multiple radiators. While more costly, this option could provide heat transfer in the 250-500 kW range per exchanger combined with a high flow rate pump. A rough estimate of the cost of this option may be on the order of $750/kW. However, given the installation, this option may be more attractive, particular if the solution is intended to be long term.
It is worth noting that some have suggested that these self-contained coolers can be installed with the transformer energized via a vacuum filling procedure. This is highly inadvisable and is a dangerous practice at best. While preparations for installation can proceed with the unit energized if proper precautions for working with energized equipment are taking, it is not safe to open any valves to the bulk oil circulation loop with the transformer energized. A single bubble of air could result in catastrophic failure and death or injury to nearby personnel.
In addition to the typical oil-air heat exchangers, some more “exotic” options have recently been introduced or are undergoing final product testing. These include oil-water heat exchangers and heat exchangers that utilized some more advanced cooling mediums that are capable of dissipated larger amounts of heat. One technique used is to utilize a phase change material whereby the cooling medium changes from liquid to gaseous phase, absorbing large amounts of heat in the process. Another uses a double heat-exchanger design with an evaporative water cooler. With the exception of oil-water heat exchangers, these more complex heat exchangers are largely untested. In addition, these units are more costly in terms of both initial costs and operating and maintenance expenses. The actual price of some of these units is unclear, as the manufacturers appear to be proposing a “revenue sharing” cost scheme rather than flat purchase.
In terms of the transformer itself, however, all of these devices act in a similar manner by reducing average oil temperature and top-to-bottom oil gradients. This in turn increases the buoyancy of the oil in the winding ducts, resulting in greater oil flow and more heat transfer from the winding to the duct oil. In addition, the decrease in bulk oil gradients results in cooler oil exiting the radiator or heat exchanger and entering the winding ducts at the bottom of the windings.
Some of the self-contained heat exchangers on the market utilize low flow pumps (<40 gpm). With lower oil flows and large oil volumes, it is entirely possible that large gradients will exist between horizontal points in the tank. While one side of the winding may see cooler oil from the heat exchanger, the opposing side could remain in hotter oil. The hot spot temperature would be that of the portion of the winding in the hotter oil. If the oil temperature were measured in the vicinity of the heat exchanger, the results could be misleading. If multiple units are utilized it would be advisable to place the units on opposing side of the tank where possible.
Spray Cooling
For many years, spray cooling has been used as a method to temporarily increase the load capability of transformers. Some utilities have even installed permanent equipment for the
1-10
Supplemental Cooling Analysis
purposes of spray cooling. While effective in reducing oil temperatures, this method should be avoided except in the direst of emergencies. It should not be used more than a few days per year. As the water evaporates from the radiators and tank surfaces, tenacious mineral deposits are left behind. These deposits are nearly impossible to remove and can diminish the heat transfer capability of these surfaces. In addition, it is theoretically possible that steam or water mist can cause external flashover.
Determining Load Capability Post-Upgrade
In order to estimate the winding temperatures following a cooling modification or upgrade with any reasonable reliability, it is necessary to measure top and bottom oil temperatures at or near rated load (above 70% of the original nameplate). The load should be fairly constant to allow the oil temperatures to stabilize. If system configuration prevents this, a reasonable approximation of the steady state top and bottom oil temperatures at some load level must be made.
Throughout the field test, the ambient air temperature should be measured at two or more points near the transformer using thermocouples or thermometers immersed in small cans of oil that are shaded from the sun. Measurement of oil temperatures, particularly top oil temperatures, is extremely difficult, even in a controlled factory setting. Therefore, the oil temperatures should be measured at several points around the periphery of the tank. The top oil gauge can be used for one point. Ideally, another point would include a thermocouple or other temperature measuring device placed on the underside of a radiator inlet at the top of the tank. The bottom oil temperature should also be measured at the underside of a radiator outlet at the bottom of the tank. If a self-contained heat exchanger is used, the temperature measurements should be on the opposite side of the tank as the heat exchanger.
From original test report:
TBO at rated MVA (bottom oil rise)
∆TTO at rated MVA (top oil rise)
∆TWDG at rated MVA (average winding rise)
∆THS at rated MVA (hot spot rise)
PNL (no-load loss)
PLL at a given MVA (load loss)
Often, the bottom oil rise at rated load is not given on the test report. This is true of most transformers built more than 5 years ago. In these cases, the bottom oil rise must be estimated given the size of the unit and type of cooling. While this introduces some error, it is still less error than using top oil temperature alone. In addition, the hot spot rise is rarely given. This can be conservatively estimated by adding 15C to the average winding rise for 65C rise transformer or 10C for 55C transformers.
1-11
Supplemental Cooling Analysis
First, the load losses, PLL, must be corrected from the test MVA (usually the self-cooled rating) to the rated MVA of the highest cooling stage:
2
,, ⎟⎟⎠
⎞⎜⎜⎝
⎛=
Test
RatedTestLLRatedLL L
LPP
From the field test:
∆TBO at test MVA
∆TTO at test MVA
LTest
The top and bottom oil rise measured during the field test with the auxiliary cooling added is then corrected to the rated load:
x
LLNL
LLTest
RatedNL
TestBOSuppBO PP
PLL
PTT
⎟⎟⎟⎟⎟⎟
⎠
⎞
⎜⎜⎜⎜⎜⎜
⎝
⎛
+
⎟⎟⎠
⎞⎜⎜⎝
⎛+
∆=∆
2
,,
x
LLNL
LLTest
RatedNL
TestTOSuppTO PP
PLL
PTT
⎟⎟⎟⎟⎟⎟
⎠
⎞
⎜⎜⎜⎜⎜⎜
⎝
⎛
+
⎟⎟⎠
⎞⎜⎜⎝
⎛+
∆=∆
2
,,
The average winding gradient is then added to the new average oil temperature with the supplemental cooling.
( )OldAOWNewAONewW TTTT ,,, ∆−∆+∆=∆
The hot spot temperature is then calculated by:
( )OldTOHSNewTONewHS TTkTT ,,, ∆−∆+∆=∆
where k is a factor depending upon the reduction in average oil temperature and the bulk oil gradient to account for increasing winding gradients. This number is probably in the range of 1.2 for a 10C drop in top oil temperature.
1-12
Supplemental Cooling Analysis
Difficulties
The following discussion is an attempt to outline some of the specific areas of concern that the user must be aware of prior to the application of supplemental cooling. This list should not be considered exhaustive.
General Concerns
Predicting the load capability of transformers is an imprecise science at best. Very little is known about the inner design of a particular transformer in the field. This is further complicated by the fact that transformers are largely hand crafted and not always built exactly as specified by the designer. In addition, problems that are a result of manufacturing or design defect and conditions that have developed over years of service in the field can be exacerbated by increased load levels. This is particularly a concern when considering supplemental cooling options, as the increased loads are expected to be more frequent. For example, a lead joint that is near thermal runaway could be induced into a runaway condition by increased loading despite reduced ambient oil temperatures. For this reason, any addition of supplemental cooling should be followed by a period of cautious load increase with frequent oil sampling and monitoring.
Bushings
All bushings must be capable of operating at the anticipated increased current loadings. Only the lower end of the bushing is immersed in oil. The hottest portion of the bushing, around the tank penetration, is not immersed in oil and does not gain much, benefit from reduced oil temperatures. Therefore, the nameplate current of the bushing should be adhered to, particularly for higher BIL bushings.
Load Tap Changers
Load tap changers will not receive much benefit, if any, from reduced oil temperatures resulting from the addition of external cooling. LTCs are limited in their ability to make or break current. Higher current levels will, at minimum, cause increased contact wear, higher contact temperatures and an increased tendency to coke. While LTCs can generally make or break currents as high as twice the nameplate rating, operations at this current level must be infrequent. Everyday loading above the nameplate current of the LTC will result in premature failure of the tap changer and possible failure of the transformer.
Leads
Leads may be a limiting factor. Although lead temperatures will be reduced by the reduced oil temperatures, the amount of insulation on the leads will result in less benefit from reduced oil temperatures than the generally more lightly insulated windings. In addition, it is impossible to accurately determine the oil flow in the vicinity of the leads and, therefore, any change in the oil flow due to the addition of supplemental cooling. DGA monitoring should be performed
1-13
Supplemental Cooling Analysis
following the upgrade to attempt to spot any lead heating problems, although this may prove futile.
Radiator Model
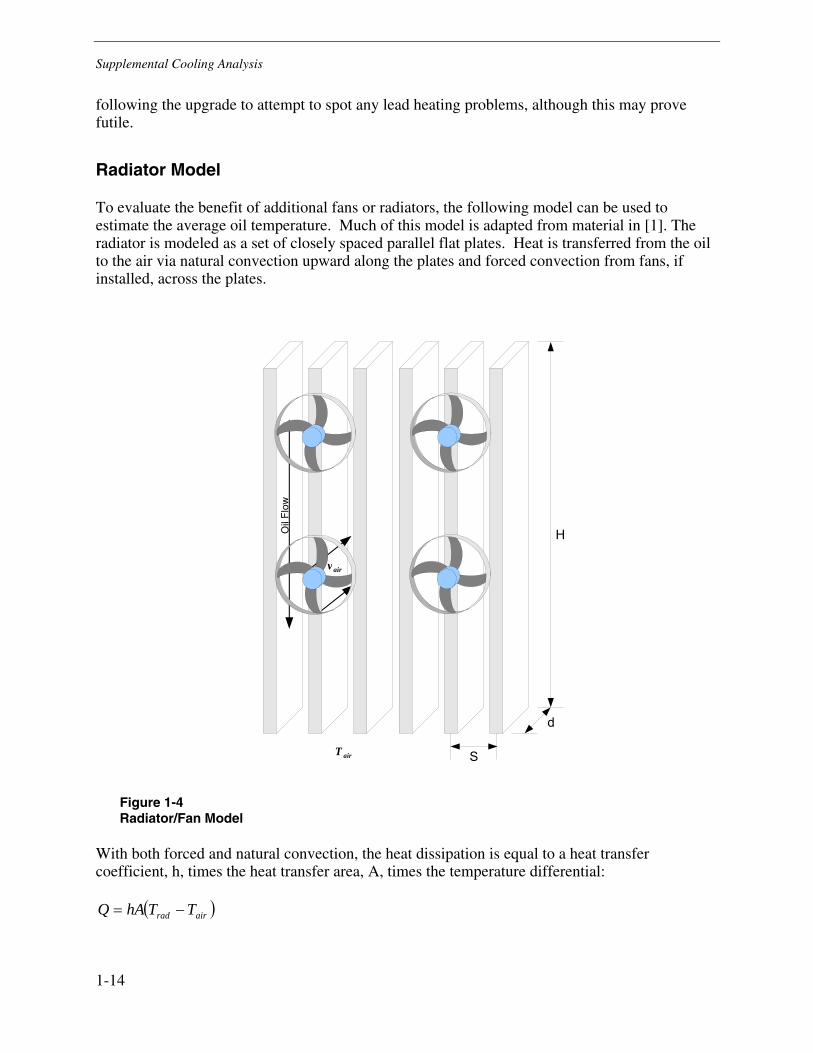
To evaluate the benefit of additional fans or radiators, the following model can be used to estimate the average oil temperature. Much of this model is adapted from material in [1]. The radiator is modeled as a set of closely spaced parallel flat plates. Heat is transferred from the oil to the air via natural convection upward along the plates and forced convection from fans, if installed, across the plates.
vair
T air
Oil
Flo
w
S
d
H
Figure 1-4 Radiator/Fan Model
With both forced and natural convection, the heat dissipation is equal to a heat transfer coefficient, h, times the heat transfer area, A, times the temperature differential:
( )airrad TThAQ −=
1-14
Supplemental Cooling Analysis
where,
Q is the heat dissipation (W)
h is an empirical constant
A is the heat transfer surface area (m2)
Trad is the radiator surface temperature (deg C)
Tair is the ambient air temperature (deg C)
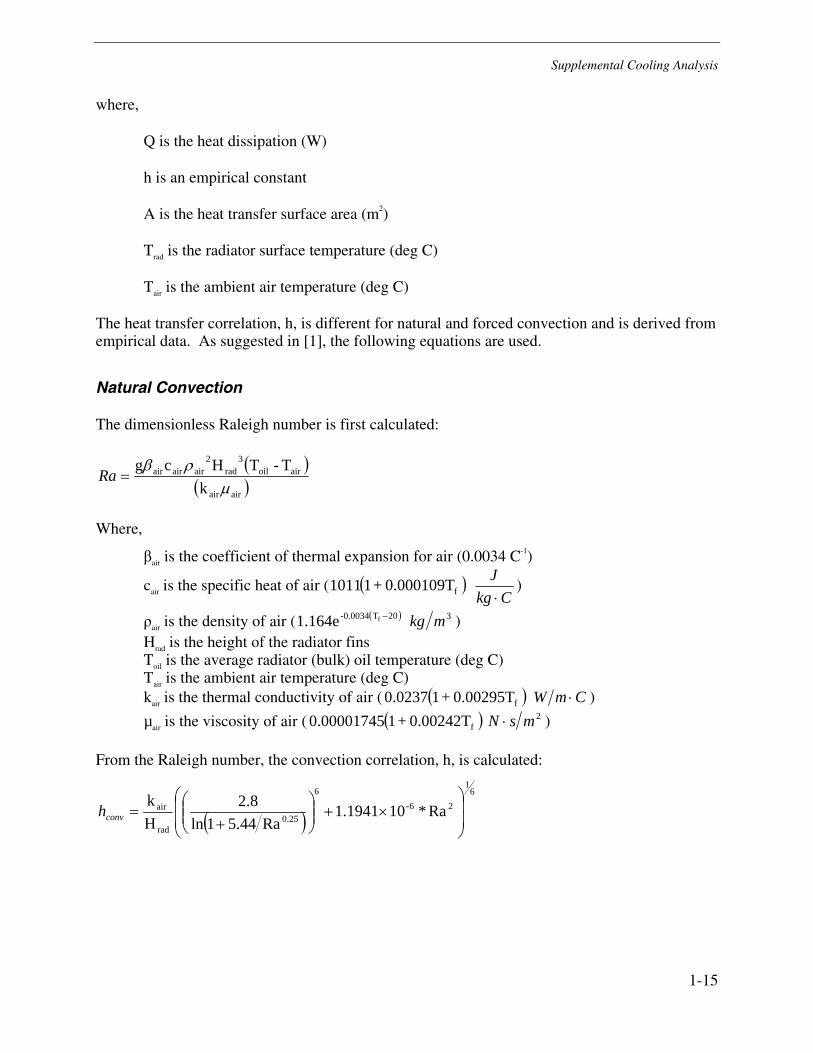
The heat transfer correlation, h, is different for natural and forced convection and is derived from empirical data. As suggested in [1], the following equations are used.
Natural Convection
The dimensionless Raleigh number is first calculated:
( )( )airair
airoil3
rad2
airairair
kT-THcg
µρβ
=Ra
Where,
βair is the coefficient of thermal expansion for air (0.0034 C-1)
cair is the specific heat of air ( ( )f0.000109T+11011 Ckg
J⋅
)
ρair is the density of air ( ( )20T-0.0034 f1.164e − 3mkg ) Hrad is the height of the radiator fins Toil is the average radiator (bulk) oil temperature (deg C) Tair is the ambient air temperature (deg C) kair is the thermal conductivity of air ( ( )f0.00295T+10.0237 CmW ⋅ )
µair is the viscosity of air ( ( )f0.00242T+10.00001745 2msN ⋅ ) From the Raleigh number, the convection correlation, h, is calculated:
( )6
1
26-6
0.25rad
air Ra*101.1941Ra5.441ln
2.8Hk
⎟⎟
⎠
⎞
⎜⎜
⎝
⎛×+⎟⎟
⎠
⎞⎜⎜⎝
⎛+
=convh
1-15
Supplemental Cooling Analysis
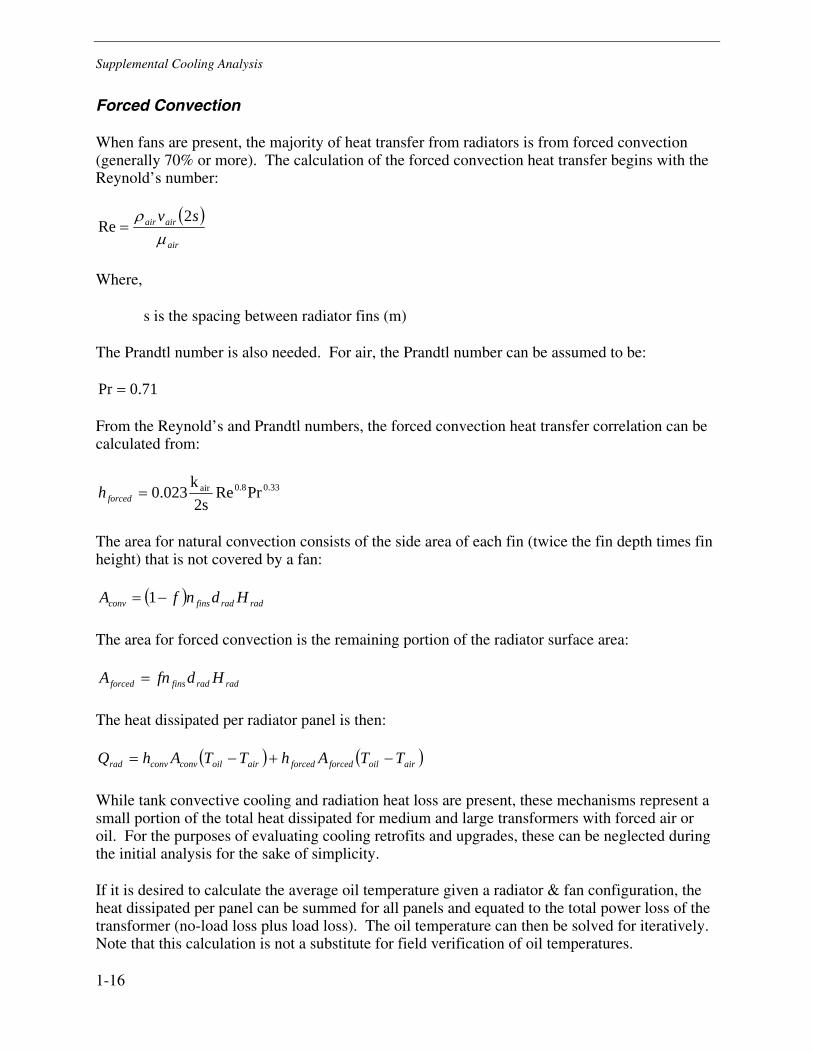
Forced Convection
When fans are present, the majority of heat transfer from radiators is from forced convection (generally 70% or more). The calculation of the forced convection heat transfer begins with the Reynold’s number:
( )air
airair svµ
ρ 2Re =
Where,
s is the spacing between radiator fins (m)
The Prandtl number is also needed. For air, the Prandtl number can be assumed to be:
71.0Pr =
From the Reynold’s and Prandtl numbers, the forced convection heat transfer correlation can be calculated from:
0.330.8air PrRe2sk
0.023=forcedh
The area for natural convection consists of the side area of each fin (twice the fin depth times fin height) that is not covered by a fan:
( ) radradfinsconv HdnfA −= 1
The area for forced convection is the remaining portion of the radiator surface area:
radradfinsforced HdfnA =
The heat dissipated per radiator panel is then:
( ) ( )airoilforcedforcedairoilconvconvrad TTAhTTAhQ −+−=
While tank convective cooling and radiation heat loss are present, these mechanisms represent a small portion of the total heat dissipated for medium and large transformers with forced air or oil. For the purposes of evaluating cooling retrofits and upgrades, these can be neglected during the initial analysis for the sake of simplicity.
If it is desired to calculate the average oil temperature given a radiator & fan configuration, the heat dissipated per panel can be summed for all panels and equated to the total power loss of the transformer (no-load loss plus load loss). The oil temperature can then be solved for iteratively. Note that this calculation is not a substitute for field verification of oil temperatures.
1-16
Supplemental Cooling Analysis
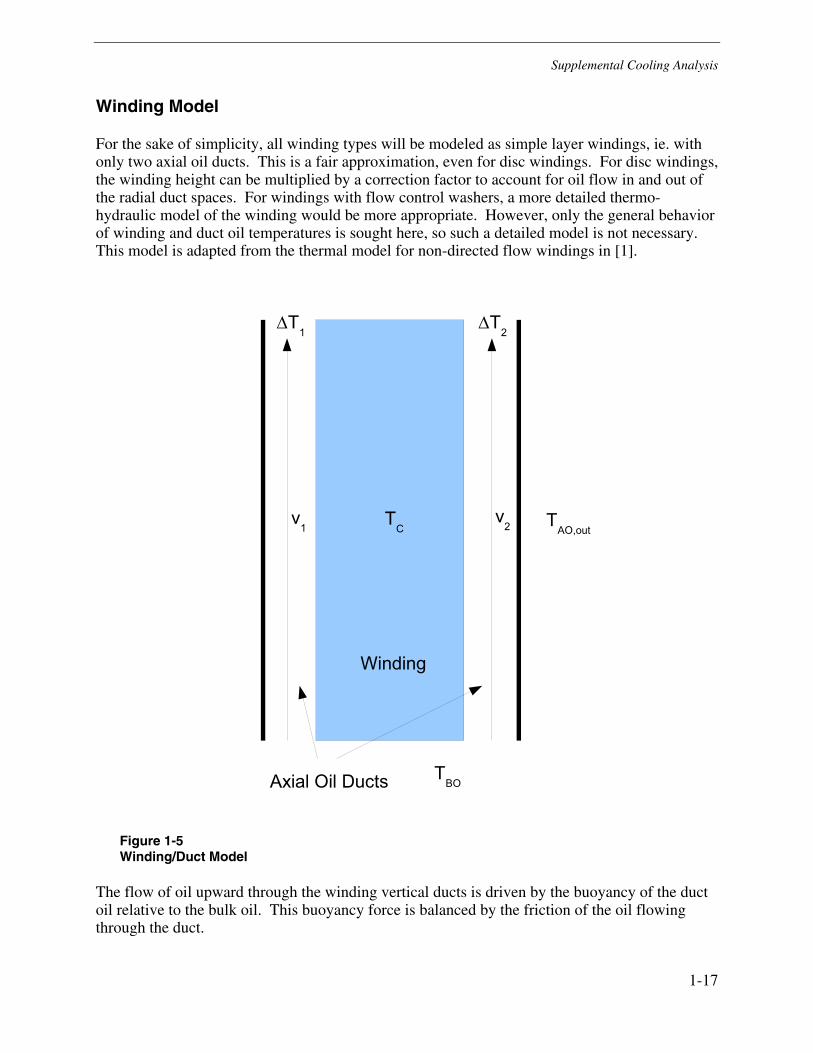
Winding Model
For the sake of simplicity, all winding types will be modeled as simple layer windings, ie. with only two axial oil ducts. This is a fair approximation, even for disc windings. For disc windings, the winding height can be multiplied by a correction factor to account for oil flow in and out of the radial duct spaces. For windings with flow control washers, a more detailed thermo-hydraulic model of the winding would be more appropriate. However, only the general behavior of winding and duct oil temperatures is sought here, so such a detailed model is not necessary. This model is adapted from the thermal model for non-directed flow windings in [1].
TC
v1
v2
TBO
TAO,out
∆T1
∆T2
Winding
Axial Oil Ducts
Figure 1-5 Winding/Duct Model
The flow of oil upward through the winding vertical ducts is driven by the buoyancy of the duct oil relative to the bulk oil. This buoyancy force is balanced by the friction of the oil flowing through the duct.
1-17
Supplemental Cooling Analysis
( ) 121
11,1 2
12 vD
HKTTTgH outAOBOµ
βρ =−∆+
( ) 222
22,2 2
12 vD
HKTTTgH outAOBOµ
βρ =−∆+
Where,
β is the coefficient of thermal expansion of oil (0.00068 C-1) ρ is the density of oil (867 kg/m3) H is the winding height (m) TBO is the bottom oil temperature (deg C) ∆T is the top-to-bottom duct oil gradient for duct (deg C) TAO,out is the average bulk oil temperature (deg C) µ1 is the oil viscosity at the average oil temperature of duct (see below, Ns/m) K is a correction factor for non-circular ducts (see below) D is the hydraulic diameter of the duct (4 * area / wetted perimeter) v is the oil velocity in the duct (m/s)
( )3506900+
=T
µ
⎟⎠⎞⎜
⎝⎛ −+=
− 0302.031.4091.56 5.3 ba
eK
Where,
a is the duct thickness (m) b is the distance between axial spacers strips (m)
In addition, the difference in heat energy flowing in to the winding ducts must differ from the heat flowing out by the heat generated in the winding at steady-state:
02222111 =−∆+∆ RITAcvTAcv ρρ
Where,
c is the specific heat of oil (1880 kg/J-C) A1 is the total duct area (m2) I is the current in the winding (A) R is the total AC resistance of the winding, including eddy losses (Ohms), corrected for
temperature Tc
Finally, the heat transfer from each side of the winding to the adjacent duct must equal the total change in heat energy from the oil flowing in the bottom of the winding and the oil flowing out of the top of the winding:
1-18
Supplemental Cooling Analysis
1
111,Re
µρ Dv
D =
kcbµ=Pr
Where,
µb is the oil viscosity at the average bulk oil temperature
14.033.01
1,1
1, PrRe86.1 ⎟⎟⎠
⎞⎜⎜⎝
⎛⎟⎠⎞
⎜⎝⎛=
s
bDconv H
DDkh
µµ
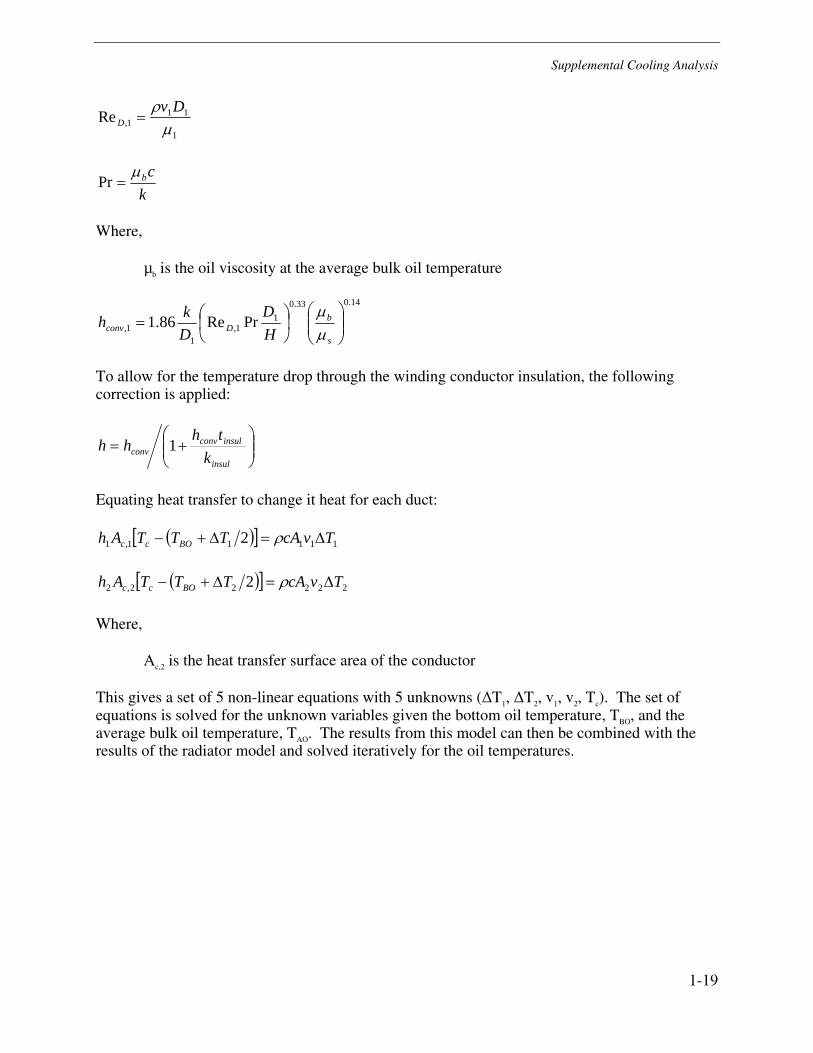
To allow for the temperature drop through the winding conductor insulation, the following correction is applied:
⎟⎟⎠
⎞⎜⎜⎝
⎛+=
insul
insulconvconv k
thhh 1
Equating heat transfer to change it heat for each duct:
( )[ ] 11111,1 2 TvcATTTAh BOcc ∆=∆+− ρ
( )[ ] 22222,2 2 TvcATTTAh BOcc ∆=∆+− ρ
Where,
Ac,2 is the heat transfer surface area of the conductor
This gives a set of 5 non-linear equations with 5 unknowns (∆T1, ∆T2, v1, v2, Tc). The set of equations is solved for the unknown variables given the bottom oil temperature, TBO, and the average bulk oil temperature, TAO. The results from this model can then be combined with the results of the radiator model and solved iteratively for the oil temperatures.
1-19

2 REFERENCES
[1] Robert M. Del Vecchio, Bertrand Poulin, Pierre T. Feghali, Dilipkumar M. Shah, Rajendra Ahuja, Transformer Design Principles - With Application to Core-Form Power Transformers, Gordon and Breach Science Publishers, Canada, 2001.
[2] R. L. Bean, N. Chacken, Jr, H. R. Moore, E. C. Wentz, Transformers for the Electric Power Industry, McGraw-Hill Book Company, New York, 1959.
[3] Young, C. ([email protected]), 12 October 2005. Re: Transformer cooling upgrades. Email to T. Raymond ([email protected]).
[4] Amos, R. ([email protected]), 6 October 2005. Re: Transformer cooling upgrades. Email to T. Raymond ([email protected]).
2-1


© 2005 Electric Power Research Institute (EPRI), Inc. All rights reserved.Electric Power Research Institute and EPRI are registered service marks ofthe Electric Power Research Institute, Inc.
Printed on recycled paper in the United States of America
Program:Substations
1010585
Export Control Restrictions
Access to and use of EPRI Intellectual Property is granted with
the specific understanding and requirement that responsibility
for ensuring full compliance with all applicable U.S. and
foreign export laws and regulations is being undertaken by
you and your company. This includes an obligation to ensure
that any individual receiving access hereunder who is not a
U.S. citizen or permanent U.S. resident is permitted access
under applicable U.S. and foreign export laws and
regulations. In the event you are uncertain whether you or
your company may lawfully obtain access to this EPRI
Intellectual Property, you acknowledge that it is your
obligation to consult with your company’s legal counsel to
determine whether this access is lawful. Although EPRI may
make available on a case-by-case basis an informal
assessment of the applicable U.S. export classification for
specific EPRI Intellectual Property, you and your company
acknowledge that this assessment is solely for informational
purposes and not for reliance purposes. You and your
company acknowledge that it is still the obligation of you and
your company to make your own assessment of the applicable
U.S. export classification and ensure compliance accordingly.
You and your company understand and acknowledge your
obligations to make a prompt report to EPRI and the
appropriate authorities regarding any access to or use of EPRI
Intellectual Property hereunder that may be in violation of
applicable U.S. or foreign export laws or regulations.
The Electric Power Research Institute (EPRI)
The Electric Power Research Institute (EPRI), with major locations in
Palo Alto, California, and Charlotte, North Carolina, was established
in 1973 as an independent, nonprofit center for public interest
energy and environmental research. EPRI brings together members,
participants, the Institute’s scientists and engineers, and other leading
experts to work collaboratively on solutions to the challenges of electric
power. These solutions span nearly every area of electricity generation,
delivery, and use, including health, safety, and environment. EPRI’s
members represent over 90% of the electricity generated in the
United States. International participation represents nearly 15% of
EPRI’s total research, development, and demonstration program.
Together...Shaping the Future of Electricity
ELECTRIC POWER RESEARCH INSTITUTE3420 Hillview Avenue, Palo Alto, California 94304-1395 • PO Box 10412, Palo Alto, California 94303-0813 USA
800.313.3774 • 650.855.2121 • [email protected] • www.epri.com


![Installer Guide...Hydronic Heat / 1 Cool Set System Type to 11HD Rh24 Volt AC Power (heating transformer) [note 2] Rc24 Volt AC Power (cooling transformer) [note 2] W1Zone Valve Power](https://img.pdfslide.net/doc/110x75/60a8bbfdfdd4ff156f5aa72e/installer-hydronic-heat-1-cool-set-system-type-to-11hd-rh24-volt-ac-power.jpg)