Embed Size (px)
Citation preview
1
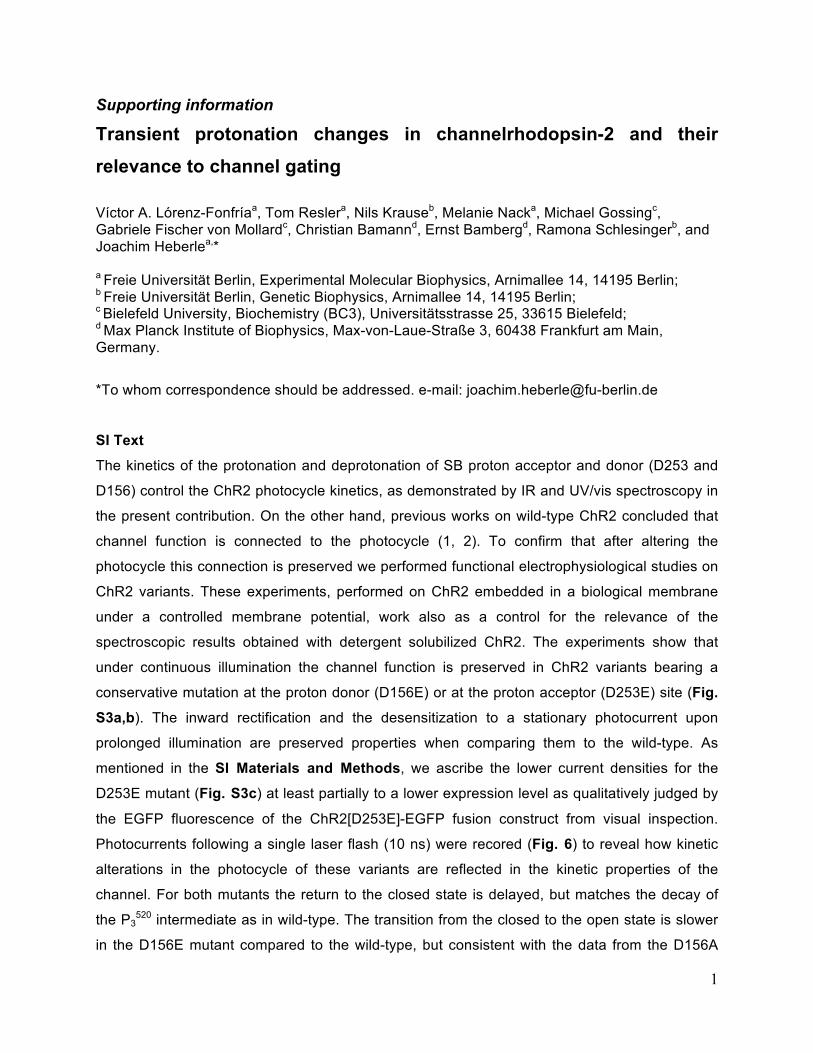
Supporting information
Transient protonation changes in channelrhodopsin-2 and their relevance to channel gating
Víctor A. Lórenz-Fonfríaa, Tom Reslera, Nils Krauseb, Melanie Nacka, Michael Gossingc, Gabriele Fischer von Mollardc, Christian Bamannd, Ernst Bambergd, Ramona Schlesingerb, and Joachim Heberlea,* a Freie Universität Berlin, Experimental Molecular Biophysics, Arnimallee 14, 14195 Berlin; b Freie Universität Berlin, Genetic Biophysics, Arnimallee 14, 14195 Berlin; c Bielefeld University, Biochemistry (BC3), Universitätsstrasse 25, 33615 Bielefeld; d Max Planck Institute of Biophysics, Max-von-Laue-Straße 3, 60438 Frankfurt am Main, Germany.
*To whom correspondence should be addressed. e-mail: [email protected]
SI Text
The kinetics of the protonation and deprotonation of SB proton acceptor and donor (D253 and
D156) control the ChR2 photocycle kinetics, as demonstrated by IR and UV/vis spectroscopy in
the present contribution. On the other hand, previous works on wild-type ChR2 concluded that
channel function is connected to the photocycle (1, 2). To confirm that after altering the
photocycle this connection is preserved we performed functional electrophysiological studies on
ChR2 variants. These experiments, performed on ChR2 embedded in a biological membrane
under a controlled membrane potential, work also as a control for the relevance of the
spectroscopic results obtained with detergent solubilized ChR2. The experiments show that
under continuous illumination the channel function is preserved in ChR2 variants bearing a
conservative mutation at the proton donor (D156E) or at the proton acceptor (D253E) site (Fig.
S3a,b). The inward rectification and the desensitization to a stationary photocurrent upon
prolonged illumination are preserved properties when comparing them to the wild-type. As
mentioned in the SI Materials and Methods, we ascribe the lower current densities for the
D253E mutant (Fig. S3c) at least partially to a lower expression level as qualitatively judged by
the EGFP fluorescence of the ChR2[D253E]-EGFP fusion construct from visual inspection.
Photocurrents following a single laser flash (10 ns) were recored (Fig. 6) to reveal how kinetic
alterations in the photocycle of these variants are reflected in the kinetic properties of the
channel. For both mutants the return to the closed state is delayed, but matches the decay of
the P3520 intermediate as in wild-type. The transition from the closed to the open state is slower
in the D156E mutant compared to the wild-type, but consistent with the data from the D156A
2
mutant (3). For the D253E variant the formation of P2390 is 50-fold accelerated and occurs within
sub-microseconds (Fig. 5a). However the possible fast opening of the channel in the D253E
variant could not be confirmed due to the overlap with a fast electrogenic event, distorted in
shape by the the limited time resolution of the electrophysiological recordings, controlled by the
passive electrical properties of the cell (τRC ∼ 50-100 µs). This electrogenic event is insensitive
to the holding potential and thus does not originate from ion permeation. It might be tentatively
ascribed, at least partially, to the very fast proton transfer (t1/2 ∼ 100 ns) from the SB to E253 in
the D253E variant, explaining the fast and voltage-independent intense positive photocurrent.
SI Materials and Methods
Sample preparation for FT-IR spectroscopy. Approximately 8 µl of ChR2 (WT, E90A, E123T,
D156E, D156A, D253E and D253N) solubilized in DM was dried on top of a BaF2 window
covering an 8 mm diameter area. The protein film was rehydrated with the saturated vapor
phase of a 3/7 w/w glycerol/water mixture (4), tightly closed with a second BaF2 window using a
silicone O-ring of 1 mm width, and fitted into a holder connected to a thermostatic bath (Julabo)
set to 25.0 oC. Sample hydration was sufficient as deduced from the absorption spectrum (Fig.
S9), a conclusion further supported by the similar (although slightly delayed) time constants of
the photocycle kinetics when compared with experiments in solution (Table S2). Lack of
preferential orientation of the sample with respect the surface of the IR window was confirmed
performing polarization experiments tilting the sample window normal by 30o to respect the IR
beam (Fig. S14). This prevents us from using polarized experiments to directly detect tilts in
transmembrane helices during the ChR2 photocycle.
Time-resolved FT-IR data acquisition. The sample holder was placed into a Vertex 80v FT-IR
spectrometer (Bruker), standing atop a vibrational decoupled table, which is equipped with a
liquid N2-cooled photovoltaic MCT detector and an external globar IR source. The sample
window normal was slightly tilted (10o) with respect to the IR beam. The sample chamber was
purged by dry air while the other compartments of the spectrometer were evacuated to 6 mbar
using a membrane pump. The pulsed laser used to induce the ChR2 phtotocycle was of 10 ns,
450 nm wavelength (470 nm for E123T), and 3 mJ/cm2 at the sample, forming a ∼30o angle with
the IR beam. The laser energy density was chosen to lead to photoisomerization of 10% of
ChR2 per pulse, as deduced from flash-photolysis UV/Vis experiments recorded under the
same excitation conditions. The laser was delivered by an OPO (OPTA) driven by the third
harmonic of a Nd:YAG laser (Spectra-Physics). Time-resolved FT-IR experiments were
3
collected at 8 cm-1 spectral resolution. In step-scan mode, the DC channel of the detector was
measured at 160 kHz sampling rate for each mirror position, from 1.25 ms before to 125 ms
after laser excitation. Time-resolved interferograms were recorded by inducing the reaction at
500 mirror positions (corresponding spectral range from 1975-0 cm-1) and averaging two
transients per mirror position. Total recording time was 67 min at a laser excitation rate of 0.25
Hz (1 Hz for E123T, and experiment not performed for D156A due to its extremely long
photocycle). Additional averaging was performed by collecting time-resolved interferograms on
a single sample for 20-60 h. Further averaging was accomplished by using three independent
samples, giving finally 208 co-additions accumulated per mirror position for wild-type (but in
general less extensive averaging was performed for the other variants). Sample integrity during
the long measurements was confirmed by monitoring the intensity of the induced spectral
changes, and samples were discarded before reaching 70% of their initial intensity. In rapid-
scan, individual interferograms were measured from milliseconds until 92 s following laser
excitation at a 100 s repetition (or every 600 s for the slow D156A mutant). For data averaging,
the process was repeated 600 times on a single sample, requiring 17 hours to be completed.
Additional rapid-scan experiments where performed at faster rates of laser excitation: 1 Hz, 0.5
Hz, 0.25 Hz, 0.125 Hz, and 0.033 Hz. Negligible changes in the spectrum at 300 ms were
observed when excitation rates of 0.25 Hz or slower were used (Fig. S11), supporting the use of
a 0.25 Hz excitation rate for the step-scan experiments. This can be rationalized by the fact that
although the ground-state recovery at 4 s is only 80% (Fig. 6d), only 10% of ChR2 molecules
run into the photocycle per laser pulse, and thus 98% of the ChR2 molecules are in the ground-
state 4 s after laser excitation.
Post-processing of the time-resolved FT-IR data. The time-resolved interferograms were
converted into time-resolved single beam spectra in Opus software (Bruker). The resulting data
was transferred to Matlab for further processing. First, the single beams following laser
excitation were quasi-logarithmic averaged to 20 spectra/decade. The region between 600-100
cm-1, below the detector cut-off, was used to estimate the noise standard deviation dependence
on time. For step-scan data, twenty single beams preceding the laser were averaged, and used
to convert the time-resolved single beams into time-resolved difference absorbance spectra. For
rapid-scan data, the last single-beams (92 s after the laser) were used as a reference instead.
The noise standard deviation dependence on wavenumber was estimated using error
propagation considering it to be uniform in the single beam spectra. The resulting step and
rapid-scan spectra were offset in the 1820-1780 cm-1 range and processed jointly by SVD (Fig.
4
S12), taking into account the noise standard deviation dependence on time and wavenumber
and using derivatives to reduce baseline fluctuations as described earlier (5), but with some
improvements that will be described elsewhere. The abstract time traces from step-scan and
rapid-scan experiments merged well, except for a discontinuity in the second component (Fig.
S11b, see U2). This discontinuity was not observed when merging the step-scan data with rapid-
scan data acquired both at 0.25 Hz laser excitation rate (Fig. S11a, see U2), and, thus, it is due
to the premature excitation of a small fraction of the ChR2 molecules before ground-state
recovery at 0.25 Hz laser excitation. This effect was corrected by manually shifting the second
component of the step-scan time-trace to match the rapid-scan time-trace recorded at 0.01 Hz
laser excitation (Fig. S11b, orange trace in U2). The corrected data was obtained by
reconstructing the data using all singular values. SVD was also used to reduce the noise of the
data, reconstructing the data retaining only the first five main SVD components. Five
components were sufficient to describe the data within the noise (Fig. S13). Spectra were band-
narrowing by Fourier self-deconvolution (6), using a Lorentzian band-shape of 12 cm-1 full width
at half height, a narrowing factor of 1.5, and a Bessel filter (7). Deconvolution by the maximum
entropy method (8), was performed using a Lorentzian band-shape of 8 cm-1 full width at half
height at taking into account the instrumental resolution of the spectra.
Global exponential fitting of time-resolved UV/Vis and FT-IR data. Was performed using the
Levenberg-Marquard algorithm implemented in Matlab (9). Time-resolved absorption
differences, either UV/Vis or FT-IR, were first subjected to SVD. The first four abstract time
traces were globally fitted to a sum of exponentials plus an offset (Fig. S10), taking into account
the singular value associated to each component and the noise standard deviation dependence
on time (10). The time-resolved UV/Vis data was fitted to a sum of exponentials with a number
and starting values for the time-constants based on lifetime distribution analysis by the
maximum entropy method (9). The estimated time-constants from the UV/Vis data were then
used as starting values when fitting the time-resolved FT-IR data. The estimated time constants
with their 96% confidence interval, obtained from the asymptotic errors of the time-constants in
logarithmic scale, are presented in Table S2.
Electrophysiological recordings. HEK293 cells were cultivated in Dulbecco’s Modified Eagle
Medium (PAA; high-glucose, with GlutaMax) supplemented with 10% FCS, 10 U/ml penicillin
and 100 µg/ml streptomycin. The cells were transfected 48h-72h before electrophysiological
experiments with Effectene (Qiagen) with a pcDNA3.1X::chop2[XXX]-egfp plasmid. Here, XXX
5
denotes the region encoding for amino acids 1 to 315 either for the wild-type ChR2 or the point
mutants. Expression of the constructs was checked by the EGFP fluorescence of the fusion
proteins. It was considerably lower for the D253E variant compared to the other variants as
judged qualitatively by visual inspection. Whole cell patch-clamp recordings were measured at
either an Axopatch 200A or 200B amplifier on an inverse microscope (Zeiss Axiovert 25).
Electrode resistances were between 3 to 5 MΩ and the series resistance was usually
compensated to 90%. The pipette solution was composed of 10 mM HEPES, pH 7.4, 10 mM
Na2-EGTA, 110 mM NaCl, 2 mM MgCl2. As bath solution we used 10 mM HEPES; pH 7.4, 140
mM NaCl, 2 mM CaCl2 and 2 mM MgCl2. Light-induced currents were triggered by a 10 ns laser
flash from an excimer laser pumped dye laser (Coumarin 2, λ = 450 nm, E = 80-300 µJ/mm2) or
from a diode-pumped solid state cw laser (λ = 473 nm, P=10 mW/mm2). Two electrode voltage
clamp measurements on the D253N mutant were recorded in frog oocytes from Xenopus laevis
3-5 days after injection of 30 ng cRNA. Light-induced currents from a 75 W Xenon arc lamp
filtered by a bandpass from 400 nm to 500 nm were examined in Ringer’s solution (110 mM Na
Cl, 5 mM KCl, 2 mM CaCl2, 1 mM MgCl2, pH 7.6).
Supplementary References 1. Bamann C, Kirsch T, Nagel G, & Bamberg E (2008) Spectral characteristics of the photocycle of
channelrhodopsin-2 and its implication for channel function. J Mol Biol 375(3):686-694. 2. Ritter E, Stehfest K, Berndt A, Hegemann P, & Bartl FJ (2008) Monitoring light-induced structural
changes of Channelrhodopsin-2 by UV-visible and Fourier transform infrared spectroscopy. J. Biol. Chem. 283(50):35033-35041.
3. Bamann C, Gueta R, Kleinlogel S, Nagel G, & Bamberg E (2010) Structural guidance of the photocycle of channelrhodopsin-2 by an interhelical hydrogen bond. Biochemistry 49(2):267-278.
4. Noguchi T & Sugiura M (2002) Flash-induced FTIR difference spectra of the water oxidizing complex in moderately hydrated photosystem II core films: effect of hydration extent on S-state transitions. Biochemistry 41(7):2322-2330.
5. Lórenz-Fonfría VA & Kandori H (2009) Spectroscopic and kinetic evidence on how bacteriorhodopsin accomplishes vectorial proton transport under functional conditions. J. Am. Chem. Soc. 131(16):5891-5901.
6. Kauppinen JK, Moffatt DJ, Mantsch HH, & Cameron DG (1981) Fourier self-deconvolution: a method for resolving intrinsically overlapped bands. Appl. Spectrosc. 35:271-276.
7. Lórenz-Fonfría VA, Kandori H, & Padrós E (2011) Probing specific molecular processes and intermediates by time-resolved Fourier transform infrared spectroscopy: application to the bacteriorhodopsin photocycle. J. Phys. Chem. B 115(24):7972-7985.
8. Lórenz-Fonfría VA & Padrós E (2005) Maximum entropy deconvolution of infrared spectra: use of a novel entropy expression without sign restriction. Appl. Spectrosc. 59(4):474-486.
9. Lórenz-Fonfría VA & Kandori H (2007) Bayesian maximum entropy (2D) lifetime distribution reconstruction from time-resolved spectroscopic data. Appl. Spectrosc. 61(4):428-443.
6
10. Shrager RI & Hendler RW (1998) Some pitfalls in curve-fitting and how to avoid them: a case in point. J. Biochem. Biophys. Methods 36(2-3):157-173.
11. Kleinlogel S, et al. (2011) Ultra light-sensitive and fast neuronal activation with the Ca2+-permeable channelrhodopsin CatCh. Nat. Neurosci. 14(4):513-518.
12. Nack M, et al. (2012) Kinetics of proton release and uptake by channelrhodopsin-2. FEBS Lett 586(9):1344-1348.
13. Dioumaev AK (2001) Infrared methods for monitoring the protonation state of carboxylic amino acids in the photocycle of bacteriorhodopsin. Biochemistry (Mosc) 66(11):1269-1276.
14. Bergo V, Spudich EN, Scott KL, Spudich JL, & Rothschild KJ (2000) FTIR analysis of the SII540 intermediate of sensory rhodopsin II: Asp73 is the Schiff base proton acceptor. Biochemistry 39(11):2823-2830.
15. Engelhard M, Scharf B, & Siebert F (1996) Protonation changes during the photocycle of sensory rhodopsin II from Natronobacterium pharaonis. FEBS Lett. 395(2-3):195-198.
16. Dioumaev AK, et al. (2002) Proton transfers in the photochemical reaction cycle of proteorhodopsin. Biochemistry 41(17):5348-5358.
17. Friedrich T, et al. (2002) Proteorhodopsin is a light-driven proton pump with variable vectoriality. J. Mol. Biol. 321(5):821-838.
18. Kawanabe A, Furutani Y, Jung KH, & Kandori H (2009) Engineering an inward proton transport from a bacterial sensor rhodopsin. J. Am. Chem. Soc. 131(45):16439-16444.
19. Miranda MR, et al. (2009) The photocycle and proton translocation pathway in a cyanobacterial ion-pumping rhodopsin. Biophys. J. 96(4):1471-1481.
20. Waschuk SA, Bezerra AG, Jr., Shi L, & Brown LS (2005) Leptosphaeria rhodopsin: bacteriorhodopsin-like proton pump from a eukaryote. Proc. Natl. Acad. Sci. U. S. A. 102(19):6879-6883.
21. Brown LS, Dioumaev AK, Lanyi JK, Spudich EN, & Spudich JL (2001) Photochemical reaction cycle and proton transfers in Neurospora rhodopsin. J. Biol. Chem. 276(35):32495-32505.
22. Jäger F, Fahmy K, Sakmar TP, & Siebert F (1994) Identification of glutamic acid 113 as the Schiff base proton acceptor in the metarhodopsin II photointermediate of rhodopsin. Biochemistry 33(36):10878-10882.
23. Verhoefen MK, et al. (2010) The photocycle of channelrhodopsin-2: ultrafast reaction dynamics and subsequent reaction steps. Chemphyschem 11(14):3113-3122.
7
Figures
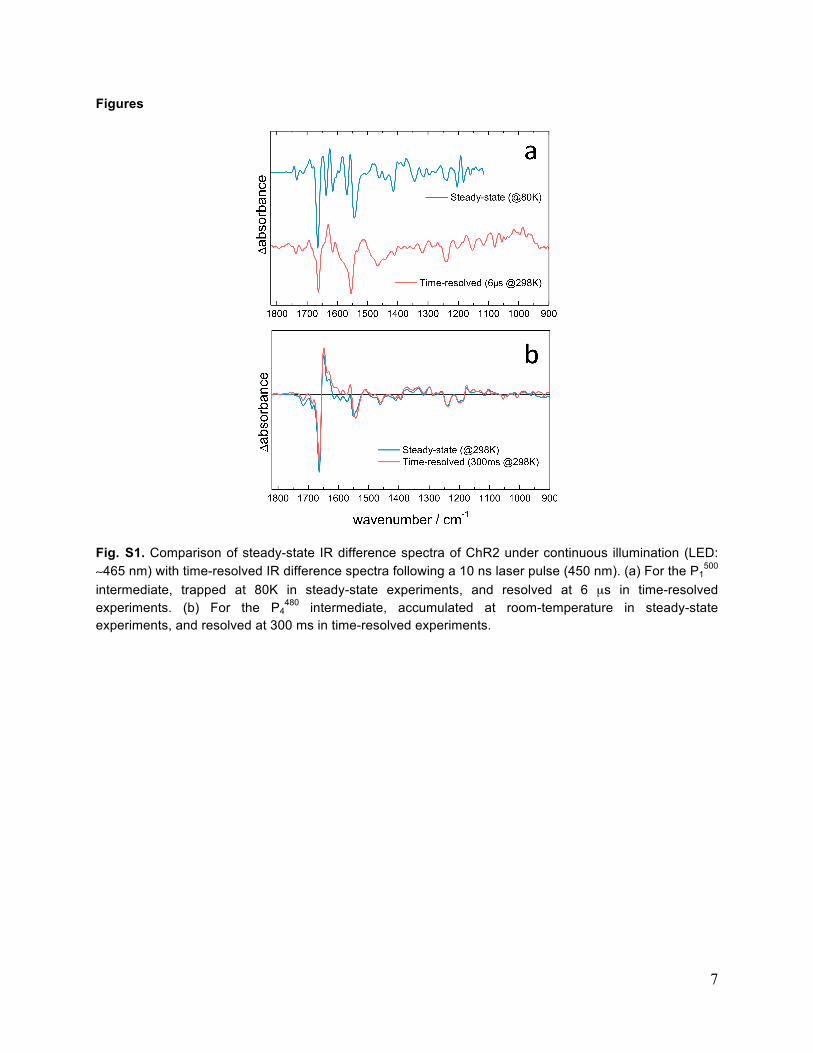
Fig. S1. Comparison of steady-state IR difference spectra of ChR2 under continuous illumination (LED: ∼465 nm) with time-resolved IR difference spectra following a 10 ns laser pulse (450 nm). (a) For the P1
500 intermediate, trapped at 80K in steady-state experiments, and resolved at 6 µs in time-resolved experiments. (b) For the P4
480 intermediate, accumulated at room-temperature in steady-state experiments, and resolved at 300 ms in time-resolved experiments.
8
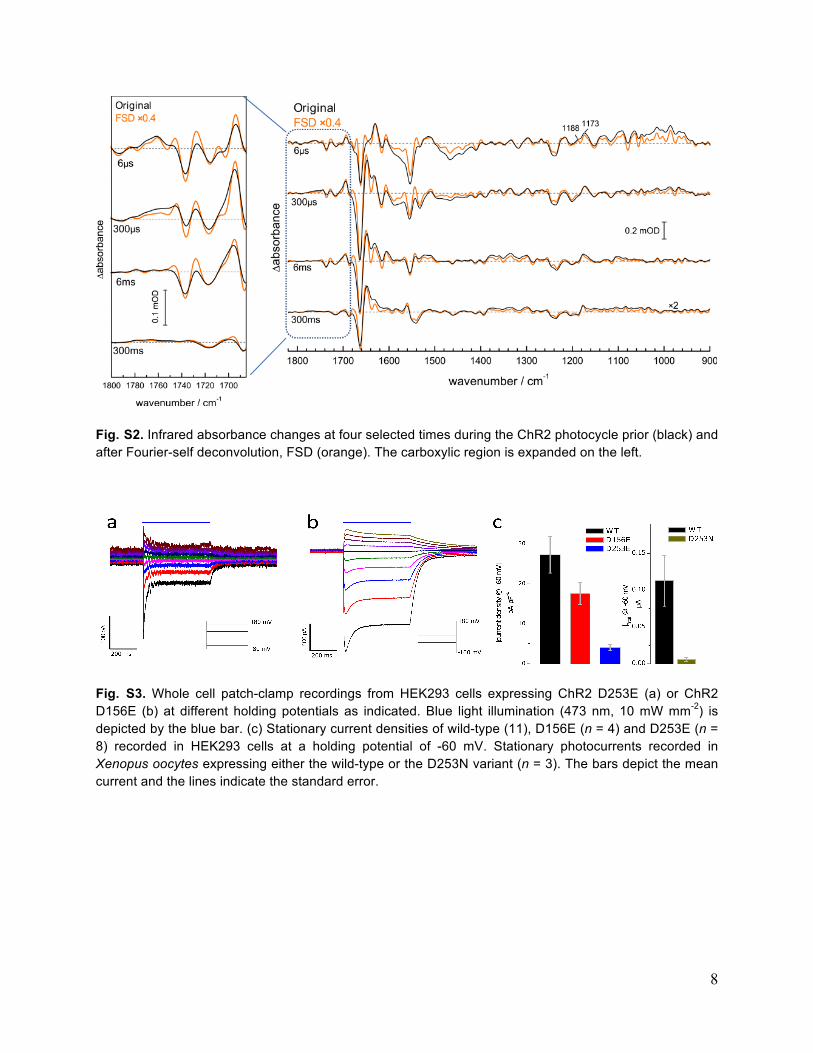
Fig. S2. Infrared absorbance changes at four selected times during the ChR2 photocycle prior (black) and after Fourier-self deconvolution, FSD (orange). The carboxylic region is expanded on the left.
Fig. S3. Whole cell patch-clamp recordings from HEK293 cells expressing ChR2 D253E (a) or ChR2 D156E (b) at different holding potentials as indicated. Blue light illumination (473 nm, 10 mW mm-2) is depicted by the blue bar. (c) Stationary current densities of wild-type (11), D156E (n = 4) and D253E (n = 8) recorded in HEK293 cells at a holding potential of -60 mV. Stationary photocurrents recorded in Xenopus oocytes expressing either the wild-type or the D253N variant (n = 3). The bars depict the mean current and the lines indicate the standard error.
9
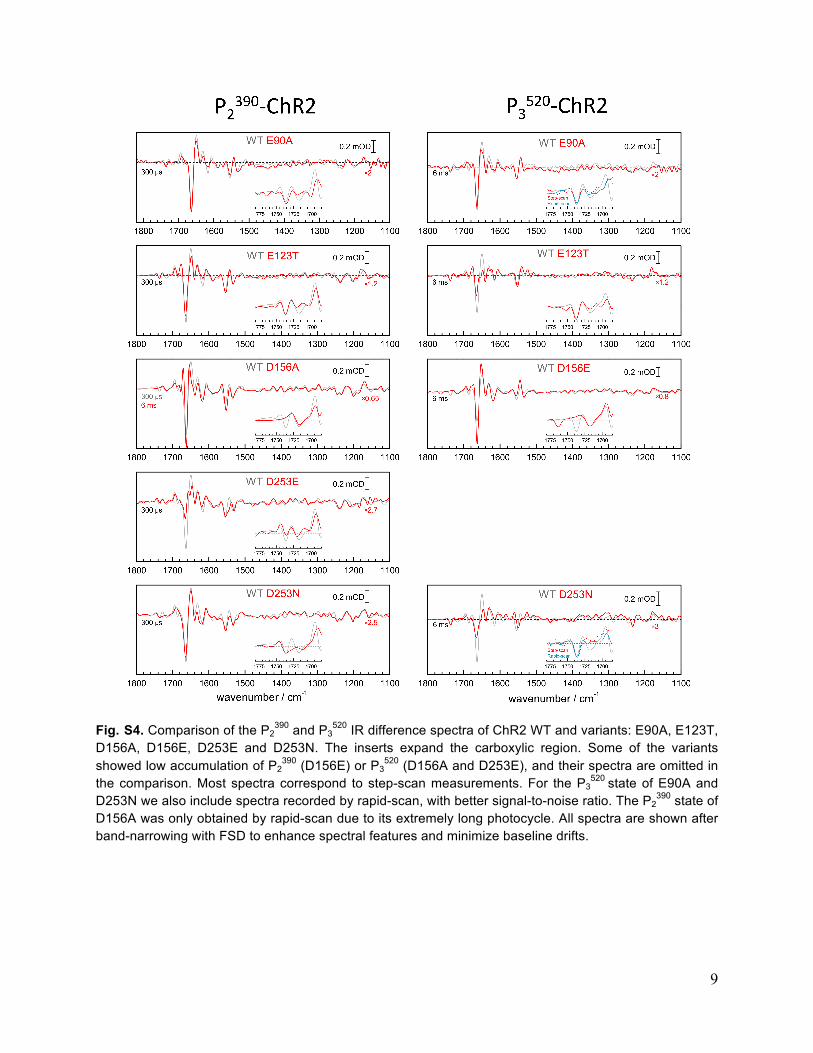
Fig. S4. Comparison of the P2
390 and P3520 IR difference spectra of ChR2 WT and variants: E90A, E123T,
D156A, D156E, D253E and D253N. The inserts expand the carboxylic region. Some of the variants showed low accumulation of P2
390 (D156E) or P3520 (D156A and D253E), and their spectra are omitted in
the comparison. Most spectra correspond to step-scan measurements. For the P3520 state of E90A and
D253N we also include spectra recorded by rapid-scan, with better signal-to-noise ratio. The P2390 state of
D156A was only obtained by rapid-scan due to its extremely long photocycle. All spectra are shown after band-narrowing with FSD to enhance spectral features and minimize baseline drifts.
10
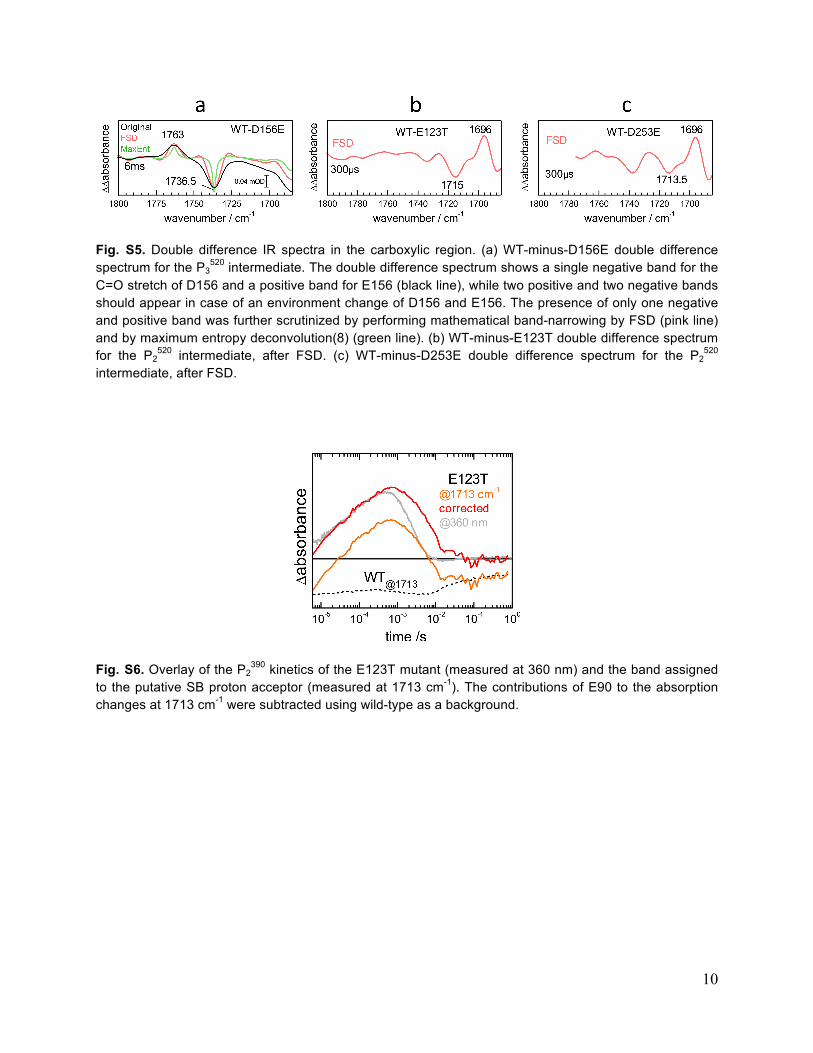
Fig. S5. Double difference IR spectra in the carboxylic region. (a) WT-minus-D156E double difference spectrum for the P3
520 intermediate. The double difference spectrum shows a single negative band for the C=O stretch of D156 and a positive band for E156 (black line), while two positive and two negative bands should appear in case of an environment change of D156 and E156. The presence of only one negative and positive band was further scrutinized by performing mathematical band-narrowing by FSD (pink line) and by maximum entropy deconvolution(8) (green line). (b) WT-minus-E123T double difference spectrum for the P2
520 intermediate, after FSD. (c) WT-minus-D253E double difference spectrum for the P2520
intermediate, after FSD.
Fig. S6. Overlay of the P2
390 kinetics of the E123T mutant (measured at 360 nm) and the band assigned to the putative SB proton acceptor (measured at 1713 cm-1). The contributions of E90 to the absorption changes at 1713 cm-1 were subtracted using wild-type as a background.
11
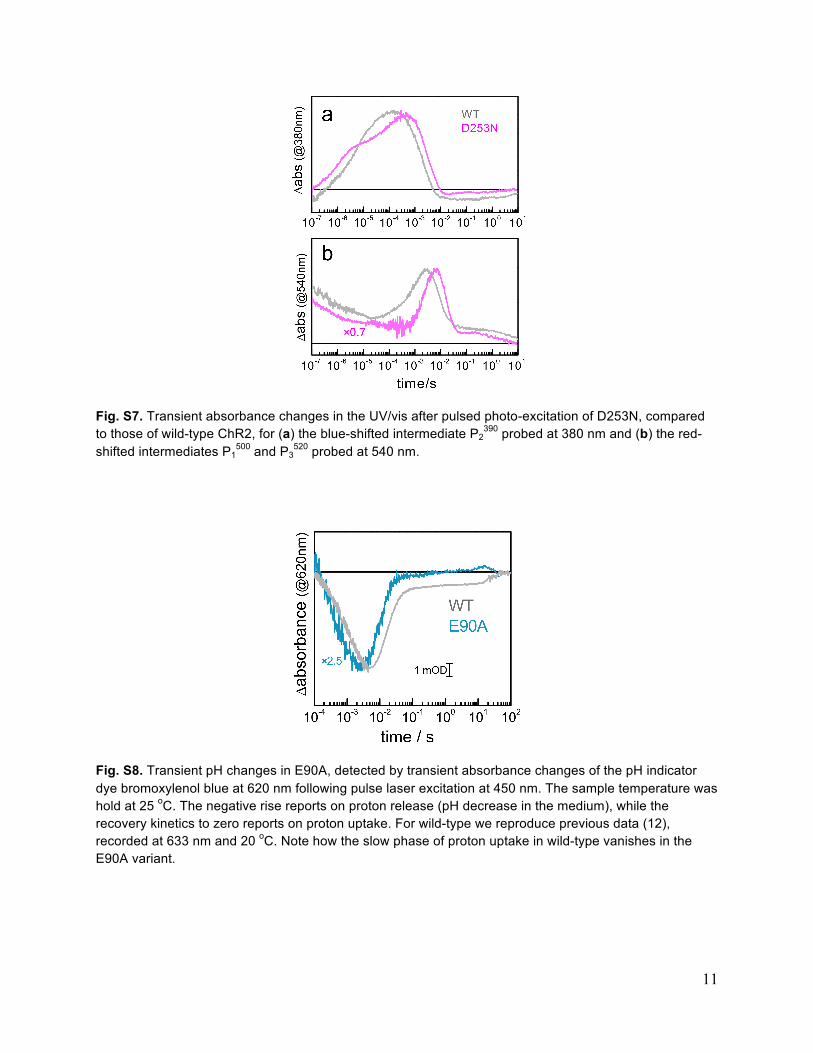
Fig. S7. Transient absorbance changes in the UV/vis after pulsed photo-excitation of D253N, compared to those of wild-type ChR2, for (a) the blue-shifted intermediate P2
390 probed at 380 nm and (b) the red-shifted intermediates P1
500 and P3520 probed at 540 nm.
Fig. S8. Transient pH changes in E90A, detected by transient absorbance changes of the pH indicator dye bromoxylenol blue at 620 nm following pulse laser excitation at 450 nm. The sample temperature was hold at 25 oC. The negative rise reports on proton release (pH decrease in the medium), while the recovery kinetics to zero reports on proton uptake. For wild-type we reproduce previous data (12), recorded at 633 nm and 20 oC. Note how the slow phase of proton uptake in wild-type vanishes in the E90A variant.
12
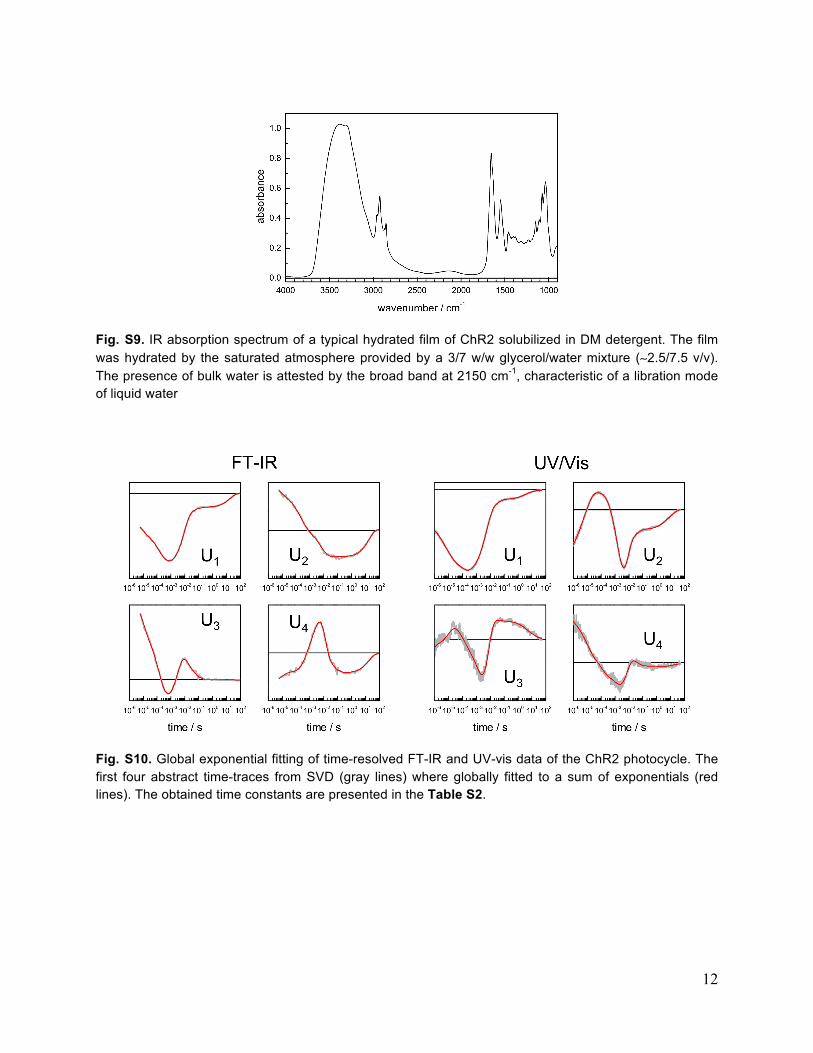
Fig. S9. IR absorption spectrum of a typical hydrated film of ChR2 solubilized in DM detergent. The film was hydrated by the saturated atmosphere provided by a 3/7 w/w glycerol/water mixture (∼2.5/7.5 v/v). The presence of bulk water is attested by the broad band at 2150 cm-1, characteristic of a libration mode of liquid water
Fig. S10. Global exponential fitting of time-resolved FT-IR and UV-vis data of the ChR2 photocycle. The first four abstract time-traces from SVD (gray lines) where globally fitted to a sum of exponentials (red lines). The obtained time constants are presented in the Table S2.
13
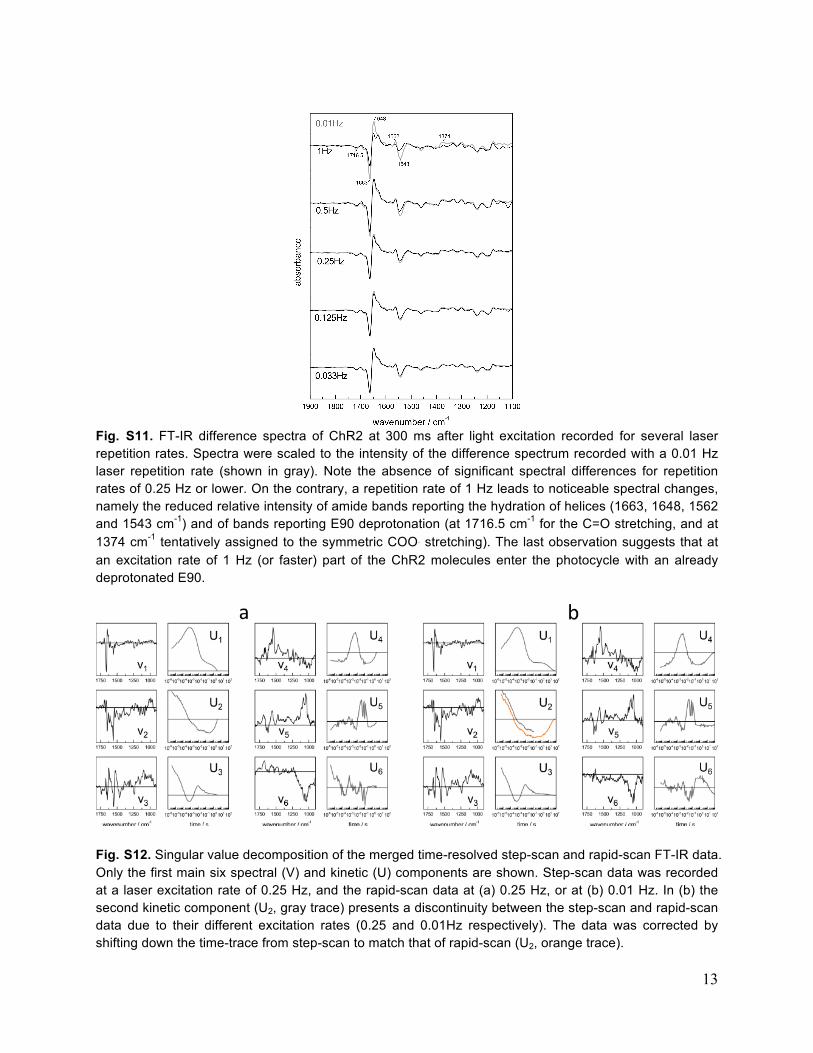
Fig. S11. FT-IR difference spectra of ChR2 at 300 ms after light excitation recorded for several laser repetition rates. Spectra were scaled to the intensity of the difference spectrum recorded with a 0.01 Hz laser repetition rate (shown in gray). Note the absence of significant spectral differences for repetition rates of 0.25 Hz or lower. On the contrary, a repetition rate of 1 Hz leads to noticeable spectral changes, namely the reduced relative intensity of amide bands reporting the hydration of helices (1663, 1648, 1562 and 1543 cm-1) and of bands reporting E90 deprotonation (at 1716.5 cm-1 for the C=O stretching, and at 1374 cm-1 tentatively assigned to the symmetric COO− stretching). The last observation suggests that at an excitation rate of 1 Hz (or faster) part of the ChR2 molecules enter the photocycle with an already deprotonated E90.
Fig. S12. Singular value decomposition of the merged time-resolved step-scan and rapid-scan FT-IR data. Only the first main six spectral (V) and kinetic (U) components are shown. Step-scan data was recorded at a laser excitation rate of 0.25 Hz, and the rapid-scan data at (a) 0.25 Hz, or at (b) 0.01 Hz. In (b) the second kinetic component (U2, gray trace) presents a discontinuity between the step-scan and rapid-scan data due to their different excitation rates (0.25 and 0.01Hz respectively). The data was corrected by shifting down the time-trace from step-scan to match that of rapid-scan (U2, orange trace).
14
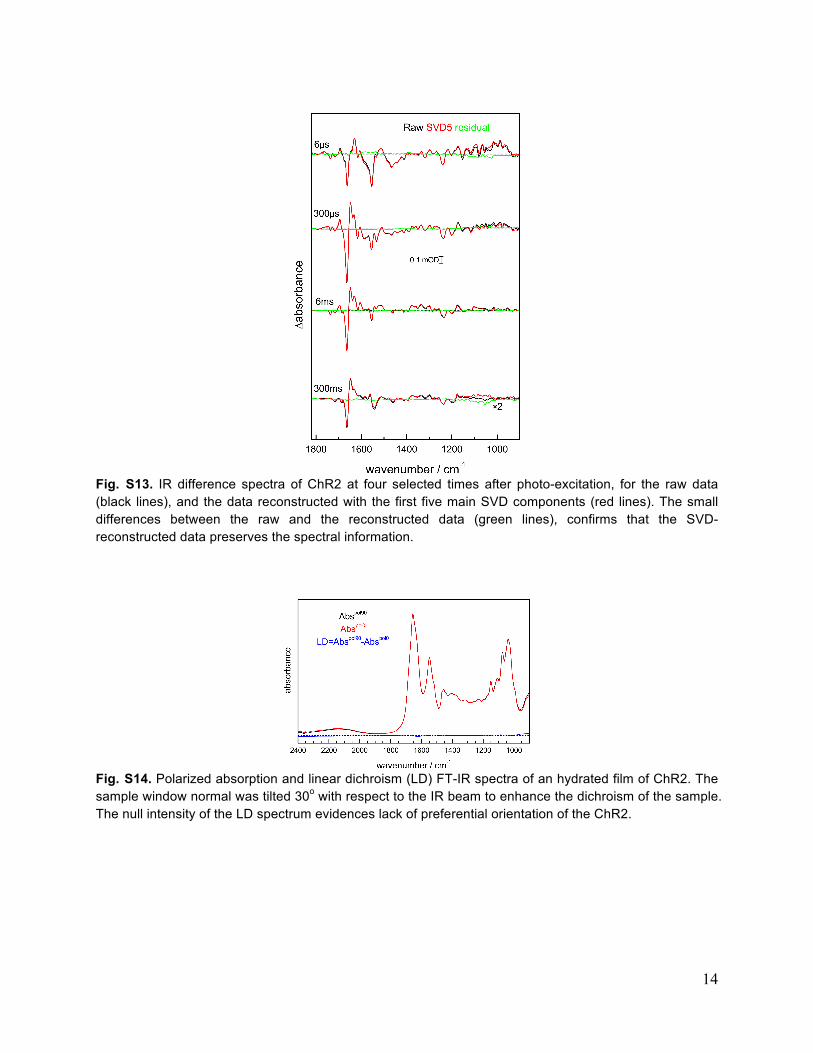
Fig. S13. IR difference spectra of ChR2 at four selected times after photo-excitation, for the raw data (black lines), and the data reconstructed with the first five main SVD components (red lines). The small differences between the raw and the reconstructed data (green lines), confirms that the SVD-reconstructed data preserves the spectral information.
Fig. S14. Polarized absorption and linear dichroism (LD) FT-IR spectra of an hydrated film of ChR2. The sample window normal was tilted 30o with respect to the IR beam to enhance the dichroism of the sample. The null intensity of the LD spectrum evidences lack of preferential orientation of the ChR2.
15
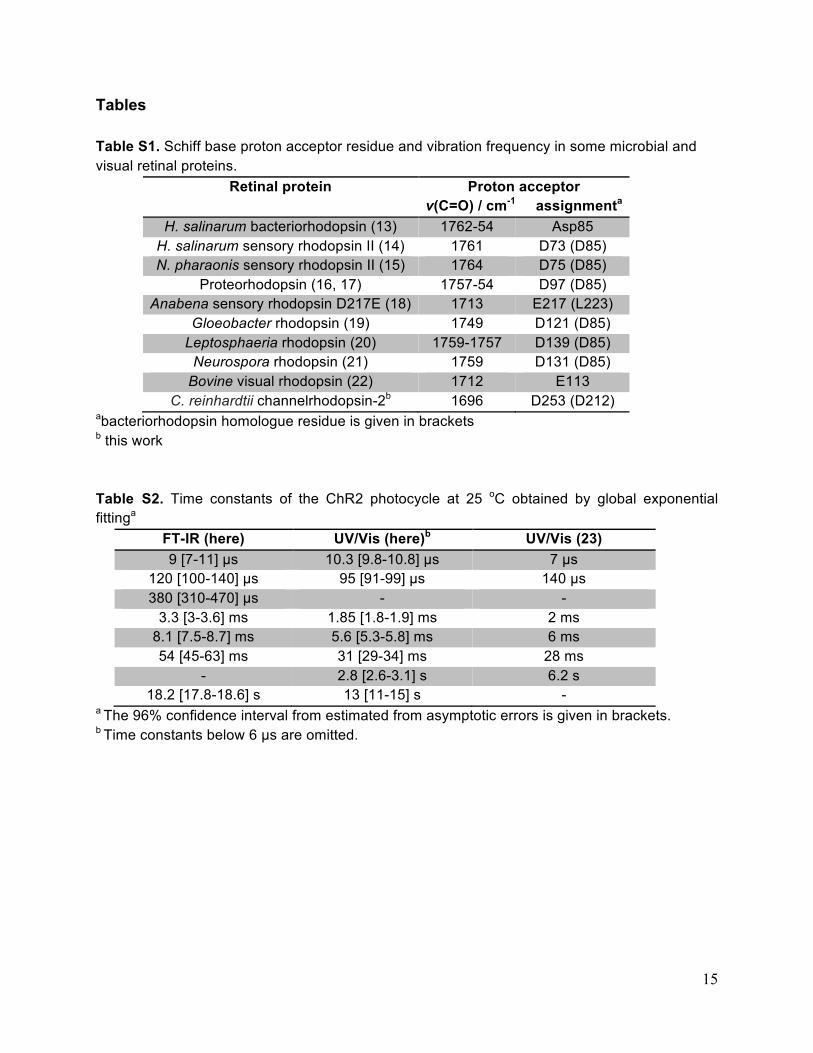
Tables Table S1. Schiff base proton acceptor residue and vibration frequency in some microbial and visual retinal proteins.
Retinal protein Proton acceptor v(C=O) / cm-1 assignmenta
H. salinarum bacteriorhodopsin (13) 1762-54 Asp85 H. salinarum sensory rhodopsin II (14) 1761 D73 (D85) N. pharaonis sensory rhodopsin II (15) 1764 D75 (D85)
Proteorhodopsin (16, 17) 1757-54 D97 (D85) Anabena sensory rhodopsin D217E (18) 1713 E217 (L223)
Gloeobacter rhodopsin (19) 1749 D121 (D85) Leptosphaeria rhodopsin (20) 1759-1757 D139 (D85)
Neurospora rhodopsin (21) 1759 D131 (D85) Bovine visual rhodopsin (22) 1712 E113
C. reinhardtii channelrhodopsin-2b 1696 D253 (D212) abacteriorhodopsin homologue residue is given in brackets b this work Table S2. Time constants of the ChR2 photocycle at 25 oC obtained by global exponential fittinga
FT-IR (here) UV/Vis (here)b UV/Vis (23) 9 [7-11] µs 10.3 [9.8-10.8] µs 7 µs
120 [100-140] µs 95 [91-99] µs 140 µs 380 [310-470] µs - -
3.3 [3-3.6] ms 1.85 [1.8-1.9] ms 2 ms 8.1 [7.5-8.7] ms 5.6 [5.3-5.8] ms 6 ms 54 [45-63] ms 31 [29-34] ms 28 ms
- 2.8 [2.6-3.1] s 6.2 s 18.2 [17.8-18.6] s 13 [11-15] s -
a The 96% confidence interval from estimated from asymptotic errors is given in brackets. b Time constants below 6 µs are omitted.


![Protonation and solvent effects on a resorcin[4]arene](https://img.pdfslide.net/doc/110x75/625e5da6d862740eeb16be8d/protonation-and-solvent-effects-on-a-resorcin4arene-.jpg)