Embed Size (px)
Citation preview
TRANSMISSION
DEVELOPMENT PLAN
2019 to 2028
(Public Version)
Transmission Development Plan 2019 to 2028 i
FOREWORD BY GROUP EXECUTIVE
Electricity is the lifeblood of the 21st-century lifestyle in ways many of us take for granted.
People whose homes, workplaces, schools, and clinics are connected to the grid for the first
time find their lives transformed for the better in ways they could previously only dream of.
Electricity is generated in power stations all over South Africa. The bulk of South Africa’s
electricity is still produced by coal-fired power stations located on the coalfields of the
Mpumalanga Highveld and near Lephalale. The renewable energy independent power
producer (REIPP) programme of the Department of Energy (DoE) has resulted in increasing
amounts of electricity produced from renewable sources, mainly wind and solar, located
primarily in the Eastern Cape, Western Cape, and Northern Cape. To date, the REIPP
programme has procured around 6 400 MW of energy from 106 independent power
producers (IPP) projects, with about 4 000 MW already in commercial operation. It is
anticipated that the transformation of the South African energy mix will continue over the
next 10-year period, as more electricity from renewable sources is integrated into the
national grid in accordance with the Integrated Resource Plan (IRP).
The transmission system’s primary role is to transport electricity in bulk from wherever it is
generated to load centres throughout South Africa and the region. From there, distribution
networks owned by Eskom, the metros, and municipalities deliver electricity to individual end
users. The system requires augmentation and reinforcement to connect new loads and
sources of generation to the grid, as well as to meet the changing needs of customers, both
with regard to load and generation. The transmission system also requires regular planned
maintenance, as well as refurbishment or replacement of plant that has reached the end of
its operational lifespan, to ensure that it performs its role safely and efficiently. Accordingly,
the plans outlined in this document constitute the minimum transmission infrastructure
development requirements in South Africa over the next 10-year period.
There are also cross-border transmission lines to Namibia, Botswana, Zimbabwe,
Mozambique, Swaziland, and Lesotho, allowing electricity to be traded with the rest of
Southern Africa. It is one of the Eskom Transmission Group’s strategic objectives to increase
the capacity of these interconnections to allow for greater volumes of electricity to be traded
to improve efficiency and security of electricity supply in South Africa in the longer term.
The benefits of a reliable and secure electricity supply to South Africa must be weighed
against the associated costs to ensure that electricity consumers, who ultimately fund the
Transmission Development Plan 2019 to 2028 ii
investments through tariffs, receive fair value for money. I hope that this document will assist
in this dialogue, and I welcome comments and queries on the content and format.
I would also like to take this opportunity to thank the team that contributed to the
development and publication of this report. It is a difficult and complex process, requiring
extensive consultation and multiple iterations.
Regards
Willy Majola
GROUP EXECUTIVE: TRANSMISSION (ACTING)
October 2018
Transmission Development Plan 2019 to 2028 iii
DISCLAIMER
The purpose of publishing the Transmission Development Plan (TDP) is to inform
stakeholders about the proposed developments in the Eskom Transmission network. These
plans are subject to change as and when better technical solutions are identified or when
more accurate developmental information becomes available. The information contained in
the TDP should, therefore, not be used for any purpose other than for sharing this
information.
The contents of this document do not constitute advice and Eskom makes no
representations regarding the suitability of using the information contained in this document
for any purpose. All such information is provided “as is” without warranty of any kind and is
subject to change without notice. The entire risk arising from its use remains with the
recipient. In no event shall Eskom be liable for any direct, consequential, incidental, special,
punitive, or any other damages whatsoever, including, but not limited to, damages for loss of
business profits, business interruption, or loss of business information.
Although the TDP is updated periodically, Eskom makes no representation or warranty as to
the accuracy, reliability, validity, or completeness of the information contained in this
document. Eskom does, however, endeavour to release plans based on the best available
information at its disposal at all times to ensure that stakeholders are kept informed about
developments in the transmission network. Therefore, the information contained in this
document represents the most up-to-date information that was available at the time it was
released.
Transmission Development Plan 2019 to 2028 iv
EXECUTIVE SUMMARY
This publication contains information about projects intended to extend or augment the
transmission system that have been completed in the past year as well as about projects
that are planned for the next 10 years. The transmission network (220 kV to 765 kV lines
and substations) is the primary network of interest covered in this publication, with a few
sub-transmission networks (88 kV and 132 kV lines and substations) included due to their
strategic nature.
The projects covered in this document include the generation integration projects required to
ensure that the network is adequate to evacuate and dispatch power to the load centres
from the new power stations (conventional and renewable) connecting to the grid. This
document also contains the reliability projects required to ensure that the levels of reliability
and adequacy of the transmission network as prescribed by the grid code are sustained as
load demand increases and new sources of generation are connected to the network. The
final group of projects comprises network expansions needed to connect new and growing
loads and load centres to the network.
Eskom’s current liquidity position will impact the execution of the TDP. NERSA is assessing
Eskom funding and revenue requirements for 2019/20 to 2021/22 and is expected to
announce Eskom’s tariff determination for MYPD4 (fourth multi-year price determination) by
1 March 2019. The plan will have to be revised to fit in with the available budget by
reprioritising projects to minimise the impact on customers and the national economy of any
delays arising from a shortage of funding or delays in obtaining sites and servitudes and
environmental and other statutory approvals.
It is regrettable, but unavoidable, that the funding constraints will result in it taking a longer
period of time to bring the transmission system into compliance with the reliability and
redundancy requirements prescribed by the grid code. The effects on customers and the
national economy will be minimised through consultation with customers and activation of
risk mitigation measures. A public forum was held with identified stakeholders to disseminate
the content of this plan and get feedback on it. Some of these comments were incorporated
into this final report where possible, while the rest of the comments will be taken into account
when the plan is revised.
Transmission Development Plan 2019 to 2028 v
During the second quarter of 2015, customers (load and generation) were offered the self-
build option, in terms of which they could elect to design, procure, and construct their own
connection to the transmission system instead of Eskom providing the network connection
and charging the customer a connection charge. The self-build option was introduced by
Eskom in order to give customers greater control over risk factors affecting their network
connection. The self-build option has since been expanded to allow customers to also self-
build associated works that will be shared with other customers, subject to approval by
Eskom based on an assessment of associated risks to the system and other customers. The
option of Eskom constructing the customer’s network connection and the customer paying a
connection charge remains available to the customer as before, since the self-build option is
purely voluntary.
The costs given in the document are, in general, high-level estimates and can change as
global economic conditions change. That is, costs are sensitive to fluctuations in foreign
exchange and commodity prices and to global demand. In general, the impact of reliability
projects on the customers is to improve availability of supply under normal and contingency
operating conditions, whereas load customer and generation integration projects allow
generating plant and the load to be optimally connected to the network.
Eskom Transmission also undertakes capital expenditure in respect of the refurbishment of
ageing infrastructure, strategic projects (including facilities), production equipment and
strategic capital spares. Strategic projects include the upgrading of the EMS (energy
management system) used by the System Operator to control the system and respond to
emergencies, as well as security measures to combat criminal activity, such as theft and
vandalism. Acquisition of sites and servitudes and associated EIAs (environmental impact
assessments) and other statutory approvals for the construction of transmission
infrastructure are also defined in the grid code as strategic projects. Facilities consist of
buildings and associated works located at sites other than substations that Transmission
uses for offices, for the operation and control of the system, or as maintenance depots and
workshops. Production equipment consists of office furniture and equipment, computer
hardware and software, tools and other equipment used by maintenance staff, and vehicles.
Strategic capital spares are items not available from suppliers ex stock, for example, large
power transformers, circuit-breakers, etc., which are kept as strategic stock to allow units
that fail in service and cannot be repaired on site to be replaced as soon as possible,
thereby minimising the risk that customers experience a lengthy outage. Projects dealing
with the refurbishment of ageing infrastructure, facilities, production equipment, and strategic
Transmission Development Plan 2019 to 2028 vi
capital spares are not explained in greater detail in this document, but a summary of their
costs appears in the chapter dealing with capital expenditure.
Transmission Development Plan 2019 to 2028 vii
CONTENTS
FOREWORD BY GROUP EXECUTIVE ................................................................................. i
EXECUTIVE SUMMARY ..................................................................................................... iv
CONTENTS ........................................................................................................................ vii
LIST OF FIGURES .............................................................................................................. xi
LIST OF TABLES .................................... .......................................................................... xiii
ABBREVIATIONS AND DEFINITIONS ..................... ........................................................ xiv
1 INTRODUCTION ......................................................................................................... 17
1.1 CONTEXT OF THE TDP ....................................................................................... 17
1.2 MAJOR CHANGES FROM THE 2017 TDP ................... ....................................... 18
1.2.1 Capital constraints ......................................................................................................... 18
1.2.2 Land and servitudes acquisition .................................................................................... 18
1.2.3 REIPP rounds 4 and 4B connection assumptions ........................................................ 19
1.3 STRUCTURE OF THE DOCUMENT .................................................................... 19
2 GENERATION ASSUMPTIONS ............................ ...................................................... 21
2.1 Generation forecast ............................... ............................................................. 22
2.2 DoE OCGT power stations ........................... ...................................................... 23
2.3 Ingula Pumped Storage ............................. ......................................................... 23
2.4 Coal generation ................................... ................................................................ 23
2.5 Coal IPP projects ................................. ............................................................... 24
2.6 Nuclear generation ................................ ............................................................. 25
2.7 Future OCGT and CCGT stations ..................... ................................................. 25
2.8 Imported hydropower ............................... .......................................................... 25
2.9 REIPP generation .................................. .............................................................. 26
2.10 Successful and shortlisted RE bidders ............. ................................................ 26
2.11 Future RE generation .............................. ........................................................... 26
2.11.1 Wind generation ............................................................................................................ 27
2.11.2 PV solar generation ....................................................................................................... 28
Transmission Development Plan 2019 to 2028 viii
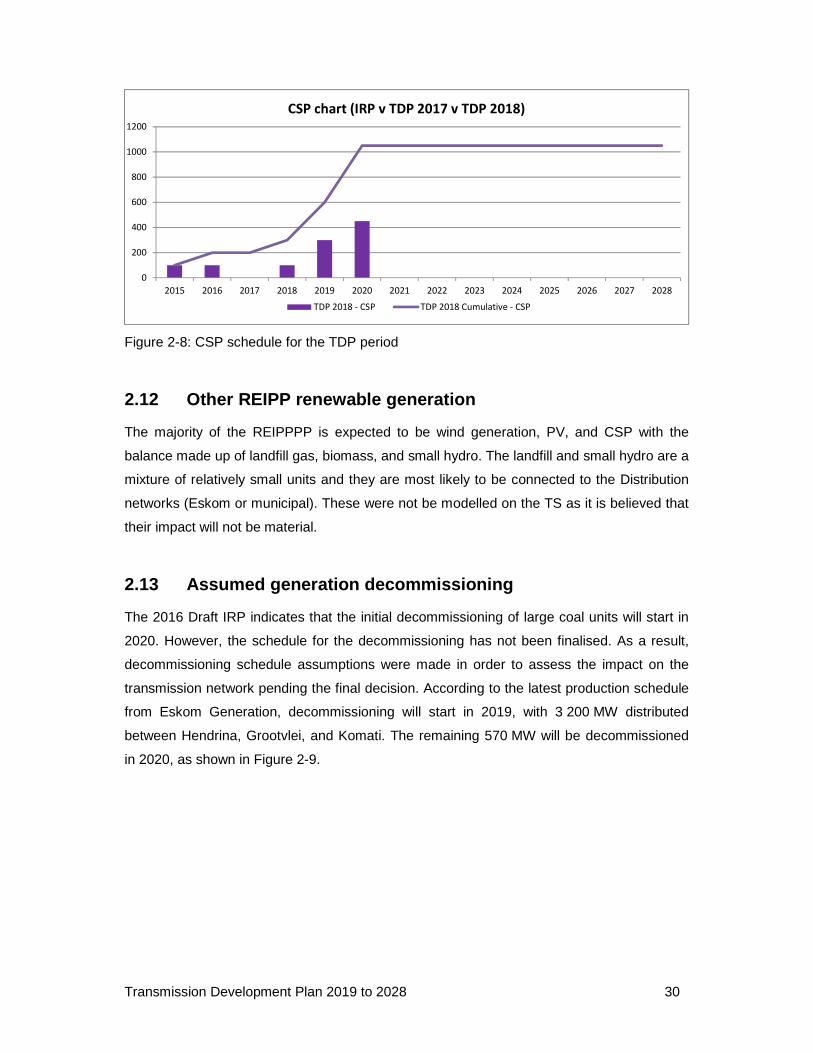
2.11.3 Concentrated solar power (CSP) generation ................................................................ 29
2.12 Other REIPP renewable generation .................. ................................................. 30
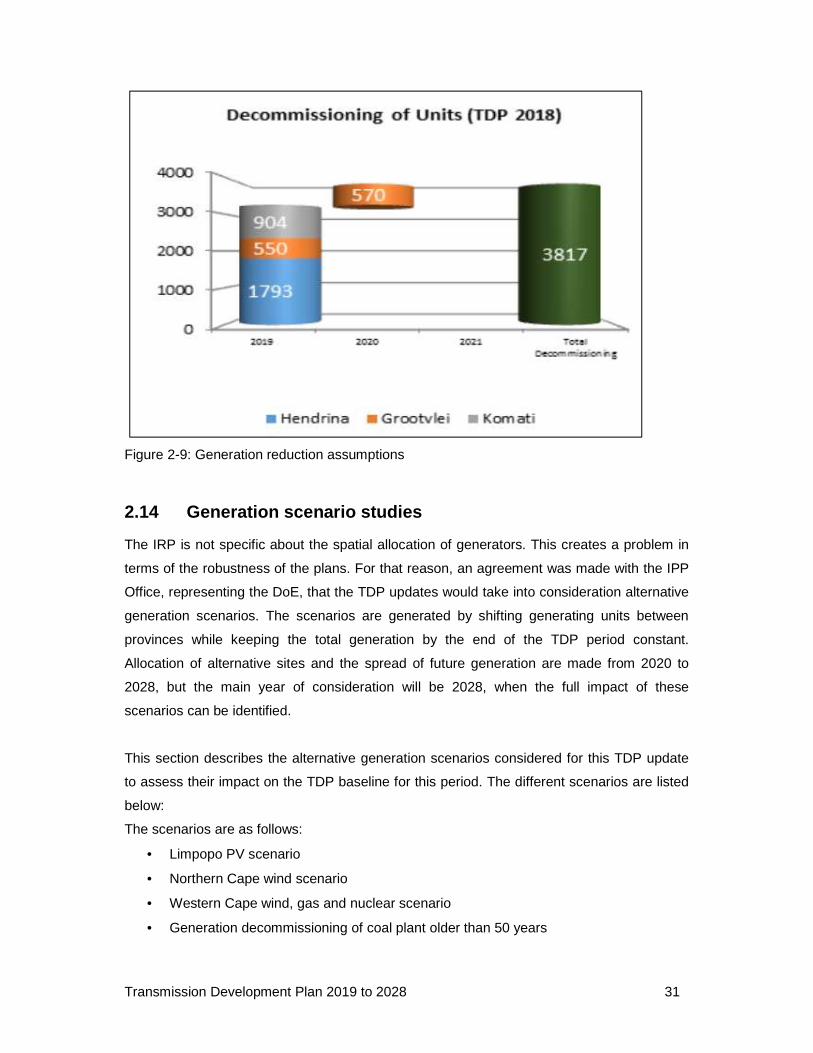
2.13 Assumed generation decommissioning................. ........................................... 30
2.14 Generation scenario studies ....................... ....................................................... 31
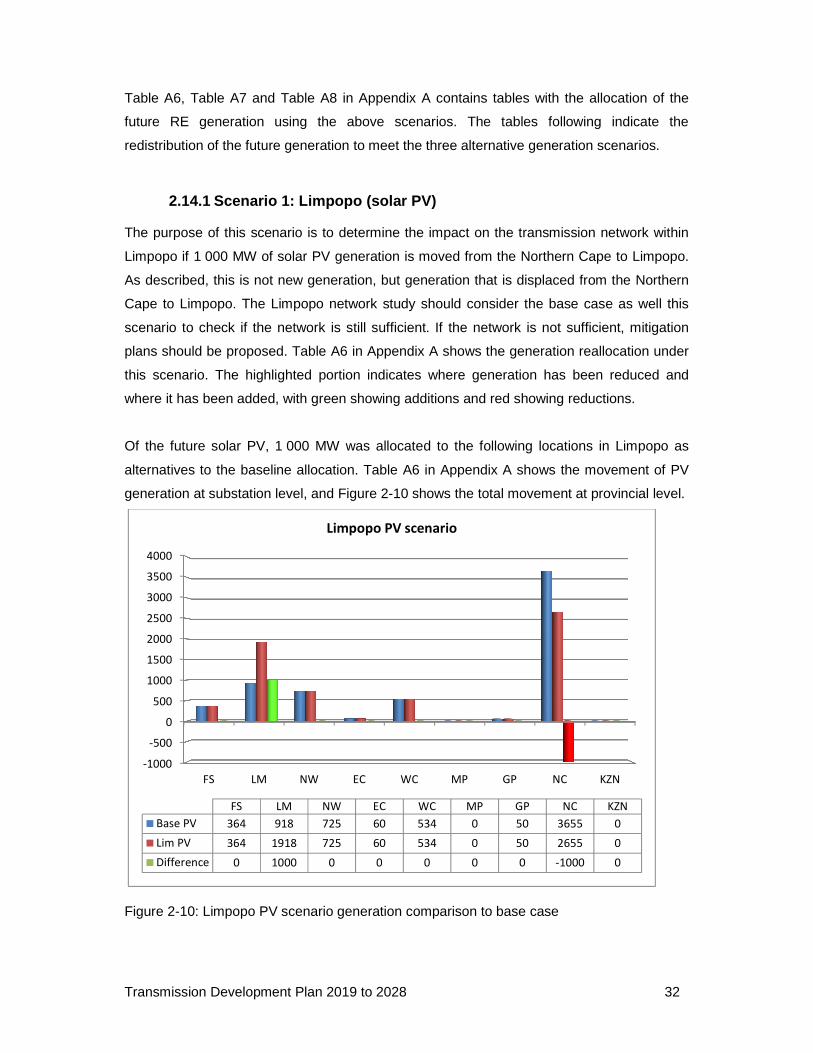
2.14.1 Scenario 1: Limpopo (solar PV) .................................................................................... 32
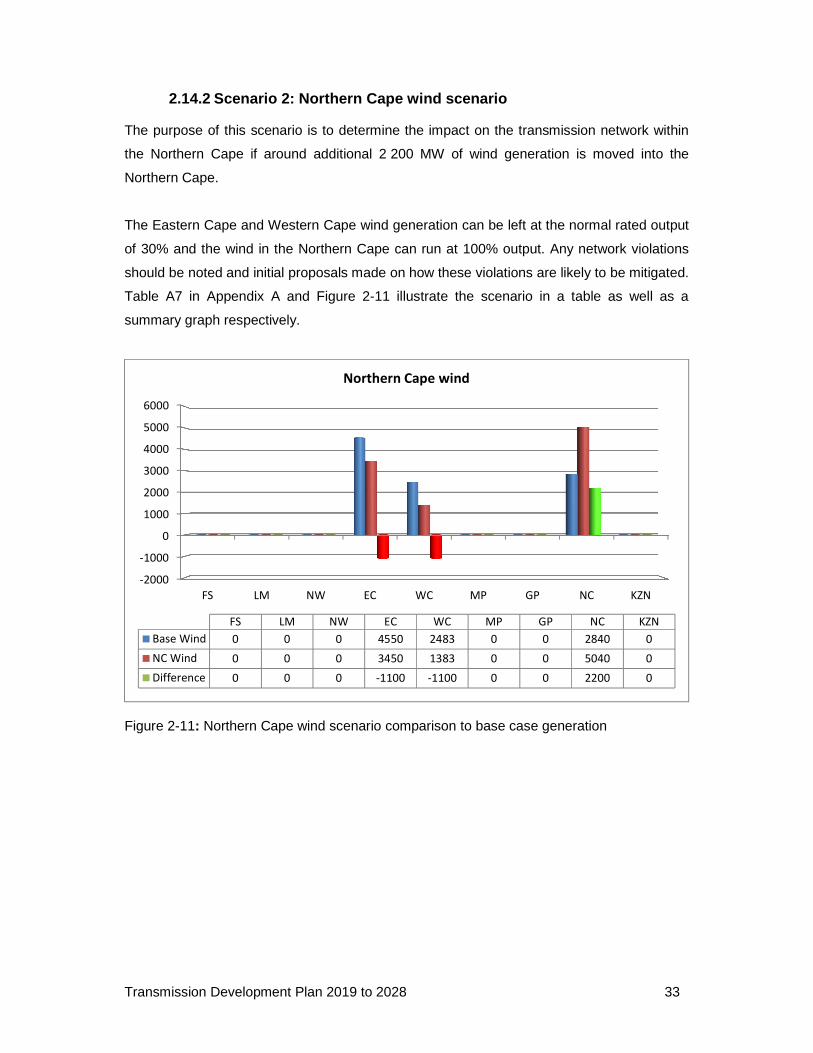
2.14.2 Scenario 2: Northern Cape wind scenario .................................................................... 33
2.14.3 Scenario 3: Western Cape wind, gas and nuclear ........................................................ 34
2.14.4 Scenario 4: Generation decommissioning of coal plant older than 50 years ................ 35
3 DEMAND FORECAST ................................... .............................................................. 36
4 TRANSMISSION EXPANSION PROJECTS UPDATES ........... ................................... 39
4.1 TRANSMISSION RELIABILITY PROJECTS ................. ....................................... 39
4.2 GRID CONNECTION APPLICATIONS ...................... ........................................... 40
5 NATIONAL OVERVIEW ................................. ............................................................. 41
6 BREAKDOWN OF THE TDP PROJECTS BY PROVINCE.......... ................................ 44
6.1 GAUTENG ............................................................................................................ 44
6.1.1 Background ................................................................................................................... 44
6.1.2 Generation ..................................................................................................................... 45
6.1.3 Load forecast ................................................................................................................. 46
6.1.4 Major schemes .............................................................................................................. 47
6.1.5 New substations ............................................................................................................ 49
6.1.6 Reactive power compensation ...................................................................................... 50
6.1.7 Provincial summary ....................................................................................................... 50
6.2 KWAZULU-NATAL (KZN) ............................... ..................................................... 52
6.2.1 Background ................................................................................................................... 52
6.2.2 Generation ..................................................................................................................... 53
6.2.3 Load forecast ................................................................................................................. 53
6.2.4 Major schemes .............................................................................................................. 54
6.2.5 Reactive power compensation ...................................................................................... 56
6.2.6 Provincial summary ....................................................................................................... 57
6.3 LIMPOPO ............................................................................................................. 58
6.3.1 Background ................................................................................................................... 58
6.3.2 Generation ..................................................................................................................... 59
6.3.3 Renewable generation .................................................................................................. 60
6.3.4 Load forecast ................................................................................................................. 60
6.3.5 Major schemes .............................................................................................................. 62
Transmission Development Plan 2019 to 2028 ix
6.3.6 New substations ............................................................................................................ 64
6.3.7 Reactive power compensation ...................................................................................... 64
6.3.8 Provincial summary ....................................................................................................... 64
6.4 MPUMALANGA ........................................ ........................................................... 66
6.4.1 Background ................................................................................................................... 66
6.4.2 Generation ..................................................................................................................... 67
6.4.3 Load forecast ................................................................................................................. 69
6.4.4 Major schemes .............................................................................................................. 70
6.4.5 New substations ............................................................................................................ 72
6.4.6 Reactive power compensation ...................................................................................... 73
6.4.7 Provincial summary ....................................................................................................... 73
6.5 NORTH WEST ...................................................................................................... 74
6.5.1 Background ................................................................................................................... 74
6.5.2 Generation ..................................................................................................................... 75
6.5.3 Load forecast ................................................................................................................. 76
6.5.4 Major schemes .............................................................................................................. 77
6.5.5 New substations ............................................................................................................ 79
6.5.6 Reactive power compensation ...................................................................................... 79
6.5.7 Provincial summary ....................................................................................................... 79
6.6 FREE STATE ....................................................................................................... 81
6.6.1 Background ................................................................................................................... 81
6.6.2 Generation ..................................................................................................................... 82
6.6.3 Load forecast ................................................................................................................. 83
6.6.4 Major schemes .............................................................................................................. 83
6.6.5 New substations ............................................................................................................ 85
6.6.6 Reactive power compensation ...................................................................................... 85
6.6.7 Provincial summary ....................................................................................................... 85
6.7 NORTHERN CAPE ............................................................................................... 87
6.7.1 Background ................................................................................................................... 87
6.7.2 Generation ..................................................................................................................... 88
6.7.3 Load forecast ................................................................................................................. 89
6.7.4 Major schemes .............................................................................................................. 89
6.7.5 Major schemes under NC wind scenario ...................................................................... 91
6.7.6 New substations ............................................................................................................ 92
6.7.7 Reactive power compensation ...................................................................................... 92
6.7.1 Provincial summary ....................................................................................................... 92
6.8 EASTERN CAPE ...................................... ............................................................ 94
6.8.1 Background ................................................................................................................... 94
Transmission Development Plan 2019 to 2028 x
6.8.2 Generation ..................................................................................................................... 95
6.8.3 Load forecast ................................................................................................................. 96
6.8.4 Major transmission development schemes ................................................................... 97
6.8.5 New substations ............................................................................................................ 98
6.8.6 Reactive power compensation ...................................................................................... 98
6.8.7 Provincial summary ....................................................................................................... 99
6.9 WESTERN CAPE ............................................................................................... 100
6.9.1 Background ................................................................................................................. 100
6.9.2 Generation ................................................................................................................... 101
6.9.3 Load forecast ............................................................................................................... 105
6.9.4 Major schemes ............................................................................................................ 106
6.9.5 New substations .......................................................................................................... 108
6.9.6 Reactive power compensation .................................................................................... 109
6.9.7 Provincial summary ..................................................................................................... 110
7 INDEPENDENT POWER PRODUCER PROGRAMME ............................................. 112
7.1 DEVELOPMENT PLANS TO ENABLE APPROVED IPPs ......... ........................ 113
7.2 DEVELOPMENTS PLANS TO ENABLE FUTURE IPPs .......... .......................... 114
7.2.1 Potential locations for future IPPs ............................................................................... 116
7.2.2 Transmission expansion plans for future REIPPs up to 2028 .................................... 118
7.2.3 Transmission expansion plans for future OCGT and CCGT IPPs up to 2028 ............ 119
7.2.4 Transmission expansion plans for future IPPs beyond 2028 ...................................... 120
7.3 IMPACT OF THE DOE GENERATION SCENARIOS ............................ ............. 121
7.3.1 Limpopo PV scenario .................................................................................................. 121
7.3.2 Northern Cape wind scenario ...................................................................................... 122
7.3.3 Western Cape wind, gas and nuclear scenario .......................................................... 123
7.3.4 Generation Decommissioning of coal Plant older than 50 years ................................ 124
8 CAPITAL EXPENDITURE PLAN .......................... .................................................... 125
9 CONCLUSION ........................................................................................................... 127
APPENDIX A: GENERATION ASSUMPTIONS ................ ............................................... 129
APPENDIX B: PUBLICATION TEAM ...................... ......................................................... 140
APPENDIX C: CONTACT DETAILS ....................... ......................................................... 141
Transmission Development Plan 2019 to 2028 xi
LIST OF FIGURES
Figure 2-1: TDP base case generation ................................................................................ 21
Figure 2-2: Generation forecast for the TDP period ............................................................. 22
Figure 2-3: Current and future generation spatial footprint .................................................. 23
Figure 2-4: Completion schedules for Medupi and Kusile .................................................... 24
Figure 2-5: OCGT and CCGT schedules in the TDP period ................................................ 25
Figure 2-6: Wind schedule in the TDP period ...................................................................... 27
Figure 2-7: PV schedule in the TDP period ......................................................................... 28
Figure 2-8: CSP schedule for the TDP period ..................................................................... 30
Figure 2-9: Generation reduction assumptions .................................................................... 31
Figure 2-10: Limpopo PV scenario generation comparison to base case ............................ 32
Figure 2-11: Northern Cape wind scenario comparison to base case generation ................ 33
Figure 2-12: Western Cape wind-nuclear scenario comparison to base case generation .... 35
Figure 3-1: Transmission forecast scenarios for TDP period 2019-2028 ............................. 38
Figure 3-2: The Eskom TS demand forecast ....................................................................... 39
Figure 5-1: Map showing relative location of the major TDP scheme projects ..................... 43
Figure 6-1: Current Gauteng network diagram .................................................................... 45
Figure 6-2: Gauteng load forecast ....................................................................................... 46
Figure 6-3: Future Gauteng network diagram ...................................................................... 49
Figure 6-4: Current KZN transmission network.................................................................... 53
Figure 6-5: KZN load forecast ............................................................................................. 54
Figure 6-6: Future KZN network diagram ............................................................................ 56
Figure 6-7: Current Limpopo network diagram .................................................................... 59
Figure 6-8: Limpopo load forecast ....................................................................................... 61
Figure 6-9: Future Limpopo network diagram ...................................................................... 63
Figure 6-10: Current Mpumalanga network diagram ........................................................... 67
Figure 6-11: Kusile Power Station integration SLD .............................................................. 68
Figure 6-12: Mpumalanga load forecast .............................................................................. 70
Figure 6-13: Future Mpumalanga network diagram ............................................................. 72
Figure 6-14: Current North West network diagram .............................................................. 75
Figure 6-15: North West load forecast ................................................................................. 77
Figure 6-16: Future North West network diagram ................................................................ 78
Figure 6-17: Current Free State network diagram ............................................................... 82
Figure 6-18: Free State load forecast .................................................................................. 83
Figure 6-19: Future Free State network diagram ................................................................. 85
Transmission Development Plan 2019 to 2028 xii
Figure 6-20: Current Northern Cape network diagram......................................................... 88
Figure 6-21: Northern Cape load forecast ........................................................................... 89
Figure 6-22: Future Northern Cape network diagram .......................................................... 91
Figure 6-23: Current Eastern Cape network diagram .......................................................... 95
Figure 6-24: Eastern Cape load forecast ............................................................................. 97
Figure 6-25: Future Eastern Cape network diagram ............................................................ 98
Figure 6-26: Current Western Cape network diagram ....................................................... 101
Figure 6-27: Load forecast for the Western Cape .............................................................. 106
Figure 6-28: Future Western Cape Transmission network diagram ................................... 108
Figure 7-1: IPP procurement programmes in MW per technology ..................................... 112
Figure 7-2: REIPP bid window 1 – 4B projects by technology ........................................... 117
Figure 7-3: Medium to long-term transmission network to enable IPP integration ............. 120
Transmission Development Plan 2019 to 2028 xiii
LIST OF TABLES
Table 4-1: Completed projects since publication of 2017 TDP ............................................ 39
Table 4-2: Projects in execution and planned to be completed by FY2023/24 ..................... 40
Table 4-3: Connection applications received/issued and accepted in the FY2017/18 .......... 40
Table 5-1: Major TDP transmission assets expected to be installed .................................... 44
Table 6-1: Gauteng– summary of projects and timelines ..................................................... 50
Table 6-2: KZN– summary of projects and timelines ........................................................... 57
Table 6-3: Generation capacity for Limpopo ........................................................................ 60
Table 6-4: Limpopo– summary of projects and timelines ..................................................... 64
Table 6-5: Kusile Power Station schedule ........................................................................... 67
Table 6-6: Ageing generators decommissioning schedule .................................................. 69
Table 6-7: Mpumalanga– summary of projects and timelines .............................................. 73
Table 6-8: Approved REIPPPP bid 4B projects in North West ............................................. 76
Table 6-9: North West– summary of projects and timelines................................................. 80
Table 6-10: Free State– summary of projects and timelines ................................................ 86
Table 6-11: Approved projects under the REIPPPP in the Northern Cape .......................... 88
Table 6-12: Northern Cape– summary of projects and timelines ......................................... 92
Table 6-13: Approved projects in the Eastern Cape under the REIPPPP ............................ 96
Table 6-14: Summary of Eastern Cape projects and timelines ............................................ 99
Table 6-15: Commissioned projects in the Western Cape under the REIPPPP ................. 104
Table 6-16: Future shunt capacitor banks in the Western Cape ........................................ 109
Table 6-17: Western Cape– summary of projects and timelines ........................................ 110
Table 7-1: Approved IPP project list .................................................................................. 114
Table 7-2: Flexible generation (OGCT and CCGT) allocation per substation .................... 119
Table 8-1: Capital expenditure per category of projects during FY2019 to FY2028 ........... 125
Table 8-2: Capital expenditure per province for expansion projects during FY2019 to FY2028
.................................................................................................................................. 126
Transmission Development Plan 2019 to 2028 xiv
ABBREVIATIONS AND DEFINITIONS
BQ – budget quote
Quotation giving customers costs and scope at 85% accuracy level.
CCGT – combined-cycle gas turbine
Open-cycle gas turbine (OCGT) fitted with a waste heat recovery boiler and steam turbines
to increase electricity output by using the exhaust gases of the combustion turbine to raise
steam.
CoCT – City of Cape Town
CLN – customer load network
The network within a specific geographical area which, in turn, is a subdivision of a grid; for
example, Johannesburg CLN falls within the Central Grid in Gauteng.
DEA – Department of Environmental Affairs
DoE – Department of Energy
EHV – extra-high voltage
EIA – environmental impact assessment
GAU – grid access unit
GCCA – grid connection capacity assessment
GDP – gross domestic product
GUMP – gas utilisation master plan
HVDC – high-voltage direct current
ICE – indicative cost estimate
Cost estimate giving a non-binding indication of the order of magnitude costs.
Transmission Development Plan 2019 to 2028 xv
IDZ – industrial development zone
IPP – independent power producer
These are power stations owned by independent parties other than Eskom.
IRP – integrated resource plan
MTPPP – medium-term power purchase programme
MVA – megavolt-ampere
A million volt-amperes of apparent power, being the vector sum of real power (MW) and
reactive power (MVar).
MVar – megavolt-ampere reactive
A million volt-amperes reactive – a volt-ampere reactive is a unit of the electrical power
required to maintain electromagnetic fields.
MW – megawatt
A million watts – a watt is a unit of electrical power production or demand.
MYPD3 – multi-year price determination 3
The third multi-year price determination for tariff increases awarded to Eskom by NERSA,
being 8% per annum over the period 1 April 2013 to 31 March 2018.
MYPD4 – multi-year price determination 4
The fourth multi-year price determination for tariff increases awarded to Eskom by NERSA.
The annual price increase and period duration will be decided by NERSA by 31 March 2019
and will come into effect from 1 April 2019.
MTS – main transmission system
These are substations owned and operated by a TNSP.
NERSA – National Energy Regulator of South Africa
The body established by an Act of Parliament to regulate the production, sale and pricing of
electricity, liquid fuels, and fuel gas in South Africa.
Transmission Development Plan 2019 to 2028 xvi
NTC – National Transmission Company
The body that is licensed as the national provider of transmission services.
OCGT – open-cycle gas turbine
Combustion turbine fuelled by liquid fuel or gas, used to drive a generator.
PPA – power purchase agreement
RE – renewable energy
REBID – renewable energy bids programme
REDZ – renewable energy development zones
REIPP – renewable energy independent power producer
REIPPPP – renewable energy independent power produc ers procurement programme
RTS – return to service
A previously mothballed power station undergoing recommissioning.
SEA – strategic environmental assessment
TDP – transmission development plan
A development plan produced annually by Eskom Transmission detailing how the network
will develop in the next 10 years. This comprises the proposed new projects listed in this
document as well as the customer projects omitted from this document owing to their
commercial sensitivity.
TNSP – transmission network service provider
A legal entity that is licensed to own, operate and maintain a transmission network.
TOSP – time of system peak
TS – transmission system
Transmission Development Plan 2019 to 2028 17
1 INTRODUCTION
1.1 CONTEXT OF THE TDP
Eskom Holdings is the major producer of electricity in South Africa. It also transmits
electricity via the transmission network, which supplies electricity at high voltages to a
number of key customers and distributors. Eskom is a vertically integrated company licensed
to generate, transmit, and distribute electricity. The transmission licence is held by Eskom
Transmission, which is the National Transmission Company (NTC). Planning augmentation
of the transmission network is the responsibility of the Grid Planning Department in the
Transmission Group. According to the grid code, NERSA requires the NTC to publish a
minimum five-year-ahead transmission system (TS) annually, indicating the major capital
investments planned (but not yet necessarily approved). This plan covers a 10-year window.
The requirements, furthermore, stipulate that the plans should include at least:
• the acquisition of servitudes for strategic purposes;
• a list of planned investments, including costs;
• diagrams displaying the planned changes to the TS;
• an indication of the impact on customers in terms of service quality and cost; and
• any other information as specified by NERSA from time to time.
A further requirement is that the NTC should annually host a public forum to disseminate the
intended TS development plan in order to facilitate a joint planning process. The eighth TDP
was published in October 2017. This is the ninth publication based on the TDP for the period
2019 to 2028.
The 10-year TDP seeks to meet the long-term requirements of the electricity consumers in
South Africa by maintaining the legislated adequacy and reliability of the transmission grid.
The objective is to produce a plan containing the expected development projects for the TS
for this 10-year period. These expected projects consist of the approved projects that are
currently in execution, the projects that are in business case development phase and the
projects that are based on a desktop assessment of the transmission requirements with
further engineering feasibility assessment to be conducted at a later stage.
In order to undertake the system adequacy studies to determine the weakness in the
system, a number of assumptions need to be made. These assumptions are required in
Transmission Development Plan 2019 to 2028 18
order to assure consistency in the network studies and analysis as well as to inform the
organisation of the basis of the TDP for the defined period.
1.2 MAJOR CHANGES FROM THE 2017 TDP
There have been minor changes in the input assumptions from the previous TDP, which was
published in 2017. As a result, the 2018 revision of the TDP has not resulted in significant
changes in the transmission network requirements and associated development plans. The
bulk of the changes in this version of the TDP are attributed to two main factors, namely
capital constraints and protracted land acquisition processes. These factors necessitated the
reprioritisation of the plan based on need criticality assessment and readiness to implement.
The IPPs that have been assigned preferred bidder status in rounds 4 and 4B of the
renewable energy independent power producer procurement programme (REIPPPP) are
expected to be connected to the national grid within this TDP period. The connection dates
for these IPPs have been adjusted in accordance with the realistic project execution
timelines, resulting in minor deferment of the associated integration plans.
1.2.1 Capital constraints
Due to capital constraints emanating from Eskom’s liquidity position, projects had to be
reprioritised to fit in with the available budget. The reprioritised projects maximise the
benefits accruing from the available capital investment budget, while minimising the risks to
security and reliability of supply. The high-priority projects were accelerated, provided that
the enabling factors are in place.
The reprioritisation process will be repeated after each tariff increase ruling by NERSA and
Eskom’s Corporate Plan approval to ensure optimal use of the available budget.
1.2.2 Land and servitudes acquisition
The procurement of land and servitudes for substation and line construction projects is one
of the essential transmission infrastructure development enablers. The projects affected by
Transmission Development Plan 2019 to 2028 19
challenges in the land acquisition process were mainly deferred in line with the revised
project schedule.
1.2.3 REIPP rounds 4 and 4B connection assumptions
The 26 preferred bidder projects in REIPPPP bid windows 4 and 4B were assumed to be
integrated into the national grid by 2019 in the previous version of the TDP. The connection
dates have now been adjusted in line with the realistic connection schedule following the
acceptance of the budget quotations in 2018 and advancement to financial closure.
1.3 STRUCTURE OF THE DOCUMENT
The document is structured in the following manner:
Chapter 2, GENERATION ASSUMPTIONS, outlines generation assumptions for the 2018
revision of the TDP. These generation assumptions are the key driving factor for
infrastructure development to transmit electricity from Eskom and IPP generation to the
distributors or large energy users. Due to the level of anticipated generation integration, a
significant expansion of the transmission network has been identified to evacuate power
from the power stations to the load during this TDP period.
Chapter 3, DEMAND FORECAST, provides the location and magnitude of electricity
demand forecast (MW) to be supplied within the TDP period. The demand forecast gives
context to the planning activity by determining how the supply network is planned in
accordance with the applicable reliability criteria.
Chapter 4, TRANSMISSION EXPANSION PROJECTS UPDATES, provides a summary of
the progress made in executing transmission expansion projects since the 2017 revision of
the TDP was published. It also provides a list of transmission projects expected to be
commissioned in the first half of the 2018 TDP period, based on the latest available
information. The major changes between the information published in the 2017 TDP and this
update was mainly due to the reprioritisation of projects in line with the capital constraints
and land acquisition challenges. This chapter also focuses on the grid connection
applications processed by Eskom.
Transmission Development Plan 2019 to 2028 20
Chapter 5, NATIONAL OVERVIEW, deals with the national overview, which gives a high-
level explanation of the planned transmission infrastructure. This is intended to give a
snapshot of the major projects that are planned for the entire period of the TDP and a high-
level summary of the installed transmission infrastructure.
Chapter 6, BREAKDOWN OF THE TDP PROJECTS BY PROVINCE, focuses in detail on
the planned projects and the impact they will have on the network. Generation integration
and reliability projects are discussed per province. In both instances, sites and servitudes
are required to accommodate substations and lines, respectively. In either case, the National
Environmental Management Act requires Eskom to conduct an EIA and obtain
environmental approval, which includes consultation with affected stakeholders, prior to
construction.
Chapter 7, INDEPENDENT POWER PRODUCER PROGRAMME, deals with the
transmission plans to enable connection of the IPPs in the medium to long term. These
plans are predominantly made up of transmission infrastructure upgrades in the Northern
Cape, Eastern Cape and Western Cape, which are projected to be the hub of future
generation in South Africa.
Chapter 8, CAPITAL EXPENDITURE PLAN, outlines the forecasted costs of implementing
the TDP. The costs provided in this publication are high-level costs intended to illustrate the
financial requirements of the current revision of the TDP. The actual costs per individual
project in the TDP will be refined subsequent to feasibility assessment, and followed by
approval of the associated business case before projects advance to execution.
Chapter 9, CONCLUSION, provides the conclusion of the 2018 version of the TDP.
Transmission Development Plan 2019 to 2028 21
2 GENERATION ASSUMPTIONS
The generation assumptions discussed in this section were used as a supply-side input to
the TDP. The generation assumptions are based the IRP, which is released by the DoE. The
IRP is intended to drive all new generation capacity development for South Africa. These
generation assumptions are based on the official 2010 IRP as well as the revised draft
version released in 2016. Consideration has also been given to the proposed IPP
programmes of the DoE, such as future REIPPPP bid windows for renewables, a coal IPP
programme and a gas-generation programme (to be based on the gas utilisation master plan
[GUMP] proposals).
Starting from the 2017 version of the TDP, alternative generation scenarios have been
included in the TDP. This was after an agreement was reached with the DoE IPP Office to
include such scenarios to cater for spatial uncertainty since areas where REIPPPP bids will
be accepted are not known upfront. The scenarios have been revised in this version of the
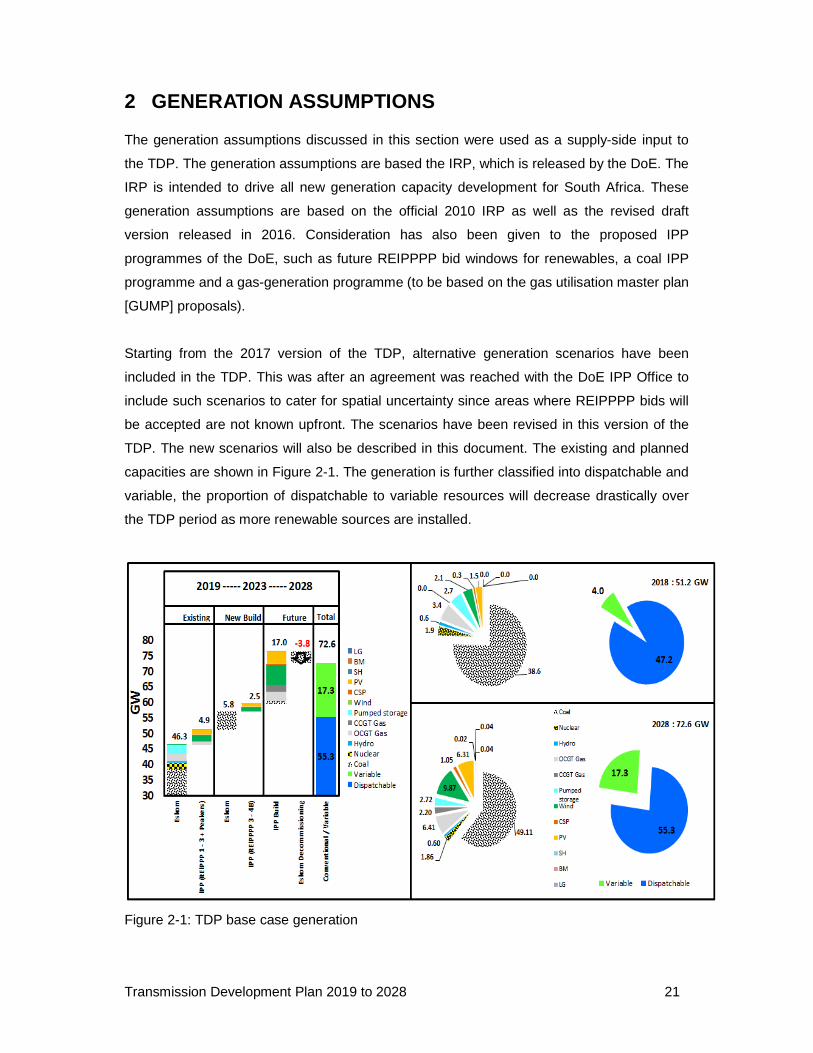
TDP. The new scenarios will also be described in this document. The existing and planned
capacities are shown in Figure 2-1. The generation is further classified into dispatchable and
variable, the proportion of dispatchable to variable resources will decrease drastically over
the TDP period as more renewable sources are installed.
Figure 2-1: TDP base case generation
Transmission Development Plan 2019 to 2028 22
In order to achieve the proposed IRP 2010, a number of assumptions regarding size and
location of the future planned generation plant had to be made. These assumptions are
discussed in detail in the sections that follow. The generation assumptions for the TDP
period were fixed in February 2018 based on what was known and expected at the time,
guided by the IRP 2010 and the 2016 Draft IRP.
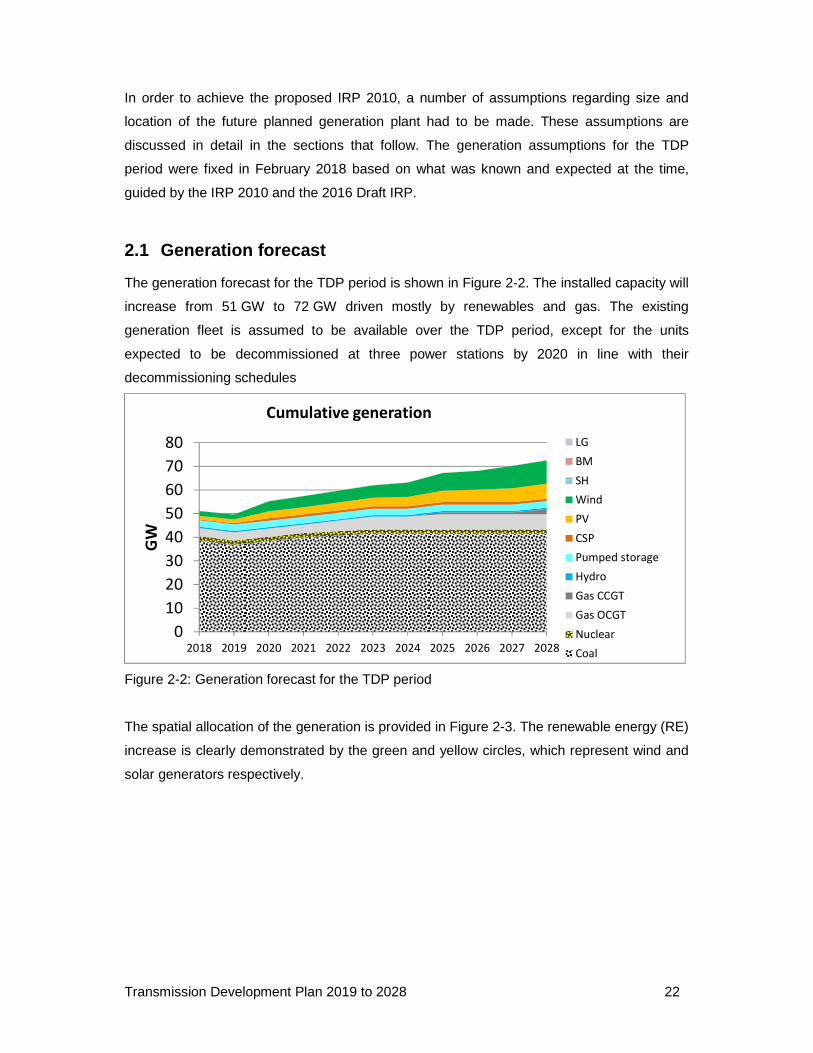
2.1 Generation forecast
The generation forecast for the TDP period is shown in Figure 2-2. The installed capacity will
increase from 51 GW to 72 GW driven mostly by renewables and gas. The existing
generation fleet is assumed to be available over the TDP period, except for the units
expected to be decommissioned at three power stations by 2020 in line with their
decommissioning schedules
Figure 2-2: Generation forecast for the TDP period
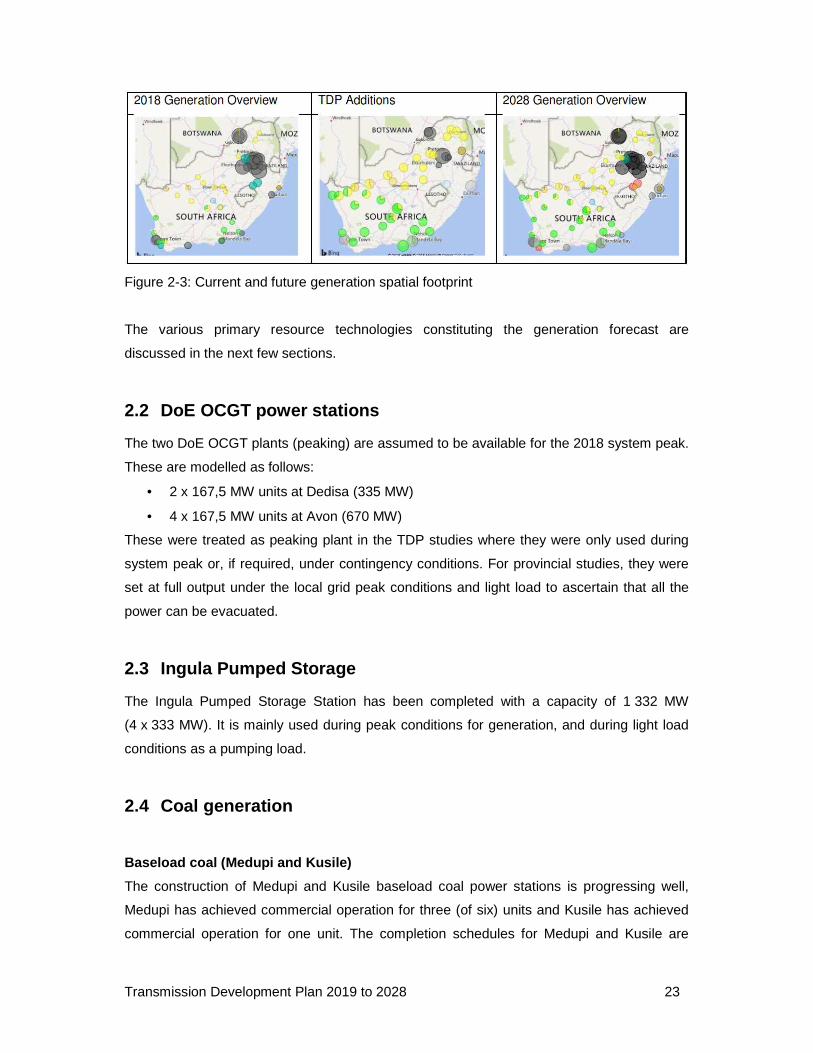
The spatial allocation of the generation is provided in Figure 2-3. The renewable energy (RE)
increase is clearly demonstrated by the green and yellow circles, which represent wind and
solar generators respectively.
0
10
20
30
40
50
60
70
80
2018 2019 2020 2021 2022 2023 2024 2025 2026 2027 2028
GW
Cumulative generation
LG
BM
SH
Wind
PV
CSP
Pumped storage
Hydro
Gas CCGT
Gas OCGT
Nuclear
Coal
Transmission Development Plan 2019 to 2028 23
Figure 2-3: Current and future generation spatial footprint
The various primary resource technologies constituting the generation forecast are
discussed in the next few sections.
2.2 DoE OCGT power stations
The two DoE OCGT plants (peaking) are assumed to be available for the 2018 system peak.
These are modelled as follows:
• 2 x 167,5 MW units at Dedisa (335 MW)
• 4 x 167,5 MW units at Avon (670 MW)
These were treated as peaking plant in the TDP studies where they were only used during
system peak or, if required, under contingency conditions. For provincial studies, they were
set at full output under the local grid peak conditions and light load to ascertain that all the
power can be evacuated.
2.3 Ingula Pumped Storage
The Ingula Pumped Storage Station has been completed with a capacity of 1 332 MW
(4 x 333 MW). It is mainly used during peak conditions for generation, and during light load
conditions as a pumping load.
2.4 Coal generation
Baseload coal (Medupi and Kusile)
The construction of Medupi and Kusile baseload coal power stations is progressing well,
Medupi has achieved commercial operation for three (of six) units and Kusile has achieved
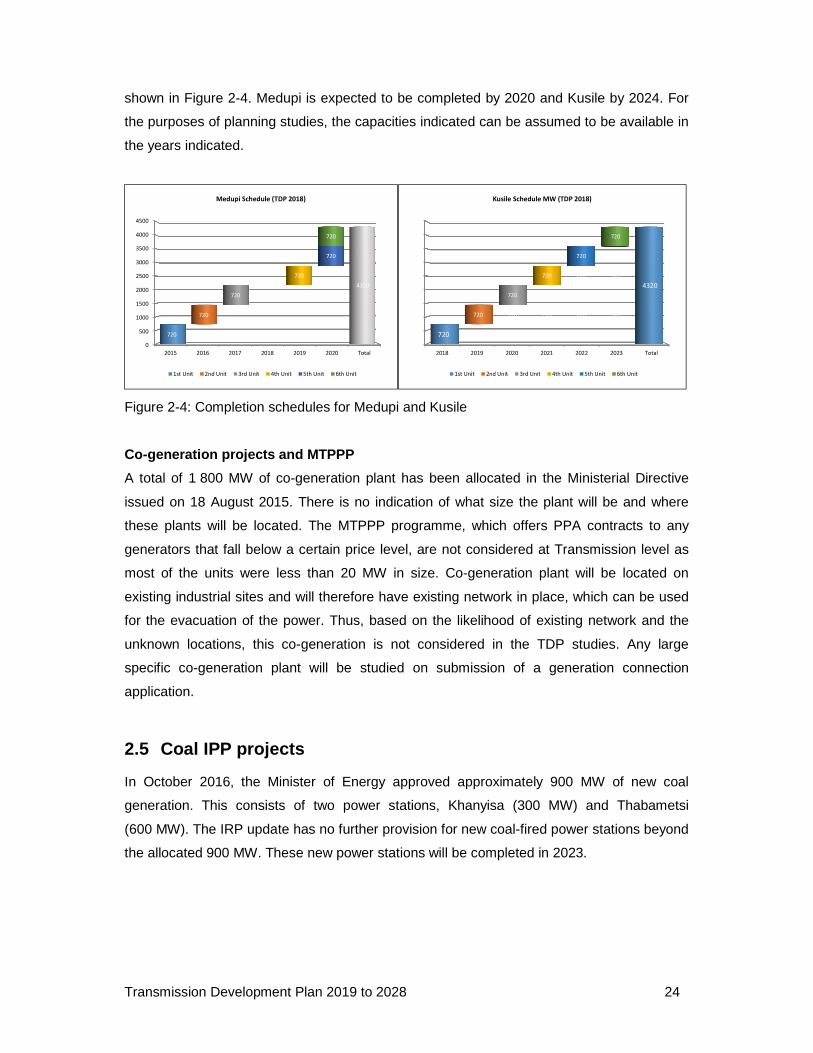
commercial operation for one unit. The completion schedules for Medupi and Kusile are
Transmission Development Plan 2019 to 2028 24
shown in Figure 2-4. Medupi is expected to be completed by 2020 and Kusile by 2024. For
the purposes of planning studies, the capacities indicated can be assumed to be available in
the years indicated.
Figure 2-4: Completion schedules for Medupi and Kusile
Co-generation projects and MTPPP
A total of 1 800 MW of co-generation plant has been allocated in the Ministerial Directive
issued on 18 August 2015. There is no indication of what size the plant will be and where
these plants will be located. The MTPPP programme, which offers PPA contracts to any
generators that fall below a certain price level, are not considered at Transmission level as
most of the units were less than 20 MW in size. Co-generation plant will be located on
existing industrial sites and will therefore have existing network in place, which can be used
for the evacuation of the power. Thus, based on the likelihood of existing network and the
unknown locations, this co-generation is not considered in the TDP studies. Any large
specific co-generation plant will be studied on submission of a generation connection
application.
2.5 Coal IPP projects
In October 2016, the Minister of Energy approved approximately 900 MW of new coal
generation. This consists of two power stations, Khanyisa (300 MW) and Thabametsi
(600 MW). The IRP update has no further provision for new coal-fired power stations beyond
the allocated 900 MW. These new power stations will be completed in 2023.
0
500
1000
1500
2000
2500
3000
3500
4000
4500
2015 2016 2017 2018 2019 2020 Total
720
4320
720
720
720
720
720
Medupi Schedule (TDP 2018)
1st Unit 2nd Unit 3rd Unit 4th Unit 5th Unit 6th Unit
0
500
1000
1500
2000
2500
3000
3500
4000
4500
2018 2019 2020 2021 2022 2023 Total
720 720
4320
720 720 720 720 720
720 720 720 720
720 720 720
720 720
720
Kusile Schedule MW (TDP 2018)
1st Unit 2nd Unit 3rd Unit 4th Unit 5th Unit 6th Unit
Transmission Development Plan 2019 to 2028 25
2.6 Nuclear generation
Nuclear generation has been completely removed from the generation assumptions. This is
because of the amount of time it takes to construct a nuclear power station and the fact that
at the time of the assumptions paper, there was yet no decision on nuclear. There is enough
wind generation in the vicinity of Thyspunt and gas generation in the Cape to enable Grid
Planning to test the network and cater for the remote eventuality of nuclear being included.
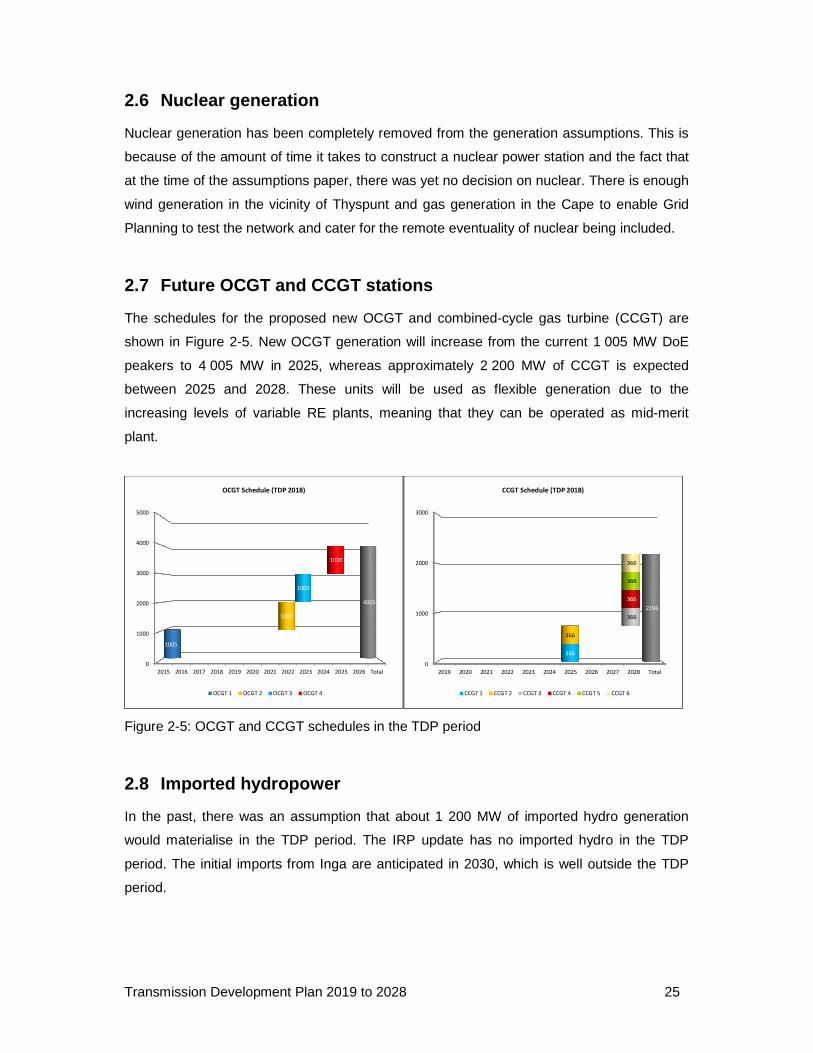
2.7 Future OCGT and CCGT stations
The schedules for the proposed new OCGT and combined-cycle gas turbine (CCGT) are
shown in Figure 2-5. New OCGT generation will increase from the current 1 005 MW DoE
peakers to 4 005 MW in 2025, whereas approximately 2 200 MW of CCGT is expected
between 2025 and 2028. These units will be used as flexible generation due to the
increasing levels of variable RE plants, meaning that they can be operated as mid-merit
plant.
Figure 2-5: OCGT and CCGT schedules in the TDP period
2.8 Imported hydropower
In the past, there was an assumption that about 1 200 MW of imported hydro generation
would materialise in the TDP period. The IRP update has no imported hydro in the TDP
period. The initial imports from Inga are anticipated in 2030, which is well outside the TDP
period.
0
1000
2000
3000
4000
5000
2015 2016 2017 2018 2019 2020 2021 2022 2023 2024 2025 2026 Total
1005
4005
1000
1000
1000
OCGT Schedule (TDP 2018)
OCGT 1 OCGT 2 OCGT 3 OCGT 4
0
1000
2000
3000
2019 2020 2021 2022 2023 2024 2025 2026 2027 2028 Total
366
2196
366
366
366
366
366
CCGT Schedule (TDP 2018)
CCGT 1 CCGT 2 CCGT 3 CCGT 4 CCGT 5 CCGT 6
Transmission Development Plan 2019 to 2028 26
2.9 REIPP generation
The Government REIPPPP (also known as the REBID programme) has gone out for
procurement with windows 1; 2; 3; 3,5; 4; and 4B completed and the successful bidders
confirmed or shortlisted. The REBID allows IPPs to bid tariffs within maximum tariff limits for
the following renewables:
• Wind
• Biomass
• Small hydro
• Landfill gas
• Concentrated solar
• Photovoltaic (PV)
2.10 Successful and shortlisted RE bidders
For the purposes of the TDP planning studies it is assumed that the successful and
shortlisted IPPs for windows 1 to 4B will be in place in the year according to their submission
up until 2020.
The renewable generators were modelled as discrete generators per project on the LV
busbars (132 kV, 88 kV, or 66 kV) of the MTS substation that either supplies the distribution
network that they are connected to or is the point of connection, as the case may be. The
purpose is to determine how much the renewable generators offset the load being supplied
by the MTS transformers. This modelling philosophy applies to all the types of RE plants that
are greater than 5 MW. Each different IPP unit is identified by the unique IPP ID number
allocated by the DoE REBID process and grouped into the different types of generation.
2.11 Future RE generation
From 2020 to 2028, RE plants have been allocated at various transmission substations to
determine the overall impact on the transmission power flows. The minimum size of plant for
PV and wind has been set at 100 MW and multiple units have been placed at some of the
substations where more than 100 MW is anticipated.
Transmission Development Plan 2019 to 2028 27
2.11.1 Wind generation
In order to investigate the potential impact of wind generation, the successful wind plants
from windows 1 to 4B of the REBID programme are modelled for 2018 to 2019 as well as
proxy wind generators at the assumed allocation of future wind plants for 2020 to 2028.
The future wind generation has been assumed based on, among others:
• the proposed REDZ areas from the Government SIP 8 project
• the Eskom study to map and quantify RE developer interest
• the Eskom proposals to DoE for phased transmission projects to increase grid
connection capacity for RE generators
• assessment of RE generation connection applications received by Eskom for the
various REIPPPP bid windows
• discussions with the IPP Office on potential sites and their report on IPP generation
forecast input for the TDP process
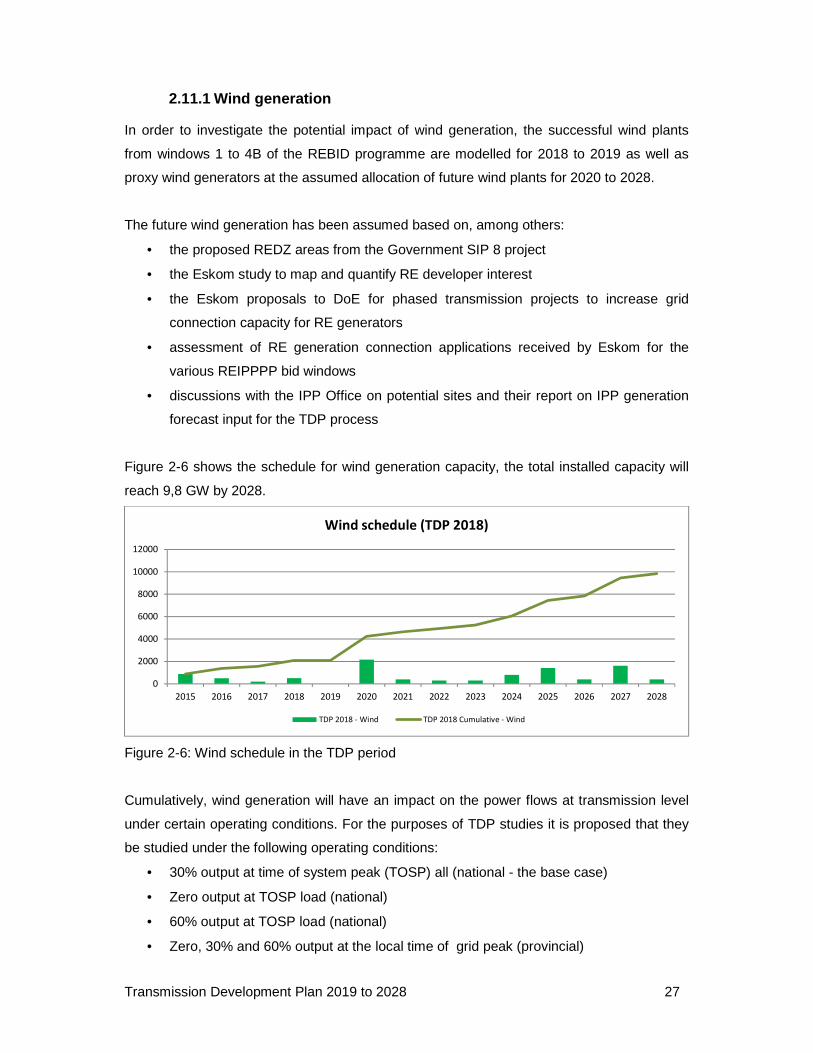
Figure 2-6 shows the schedule for wind generation capacity, the total installed capacity will
reach 9,8 GW by 2028.
Figure 2-6: Wind schedule in the TDP period
Cumulatively, wind generation will have an impact on the power flows at transmission level
under certain operating conditions. For the purposes of TDP studies it is proposed that they
be studied under the following operating conditions:
• 30% output at time of system peak (TOSP) all (national - the base case)
• Zero output at TOSP load (national)
• 60% output at TOSP load (national)
• Zero, 30% and 60% output at the local time of grid peak (provincial)
0
2000
4000
6000
8000
10000
12000
2015 2016 2017 2018 2019 2020 2021 2022 2023 2024 2025 2026 2027 2028
Wind schedule (TDP 2018)
TDP 2018 - Wind TDP 2018 Cumulative - Wind
Transmission Development Plan 2019 to 2028 28
• Zero, 30% and 60% output at system low load (national)
• Full 100% output at the local low load (provincial)
• Zero and 30% output at the local low load (provincial)
• Zero, 30% and 60% output at midday load high (national and provincial)
• Zero, 30% and 0% output at local midday load low (national and provincial)
This is to determine the capacity and potential weakness under extreme generation
conditions based on the assumed connection at the MTS substations. For the normal TOSP
modelling, the wind generation is set at 30% of rated output, in line with the assumptions
utilised for the 2010 IRP studies and recommendations.
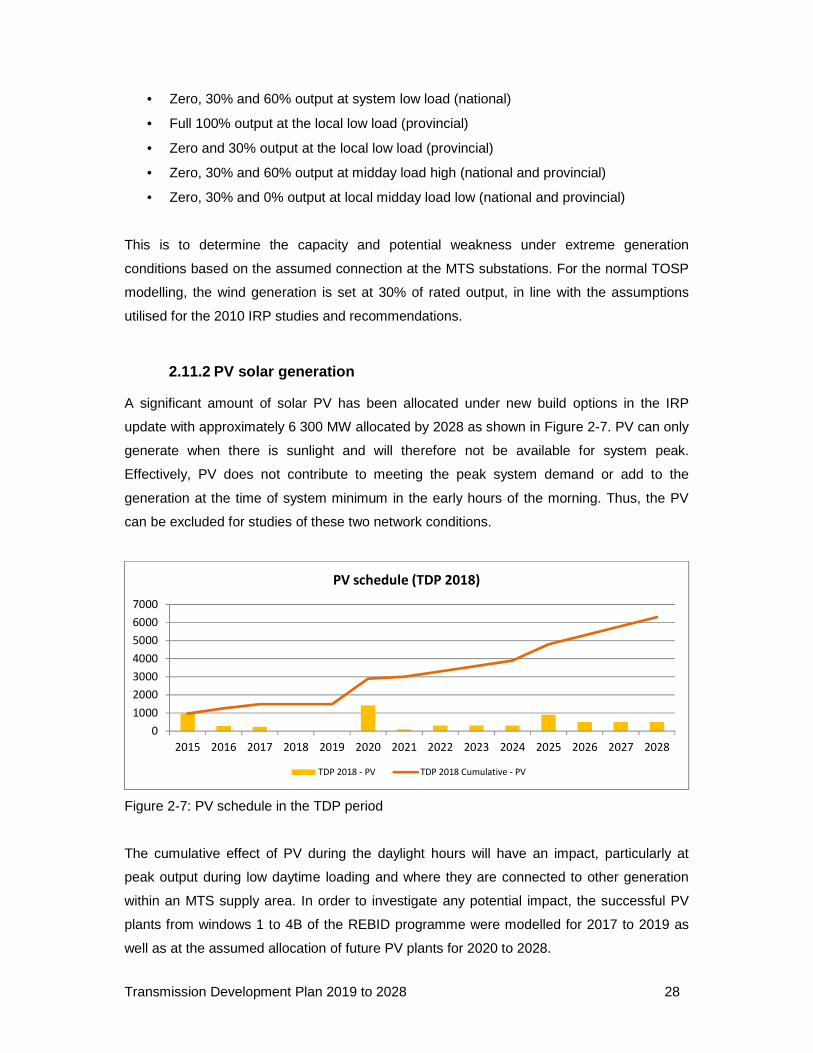
2.11.2 PV solar generation
A significant amount of solar PV has been allocated under new build options in the IRP
update with approximately 6 300 MW allocated by 2028 as shown in Figure 2-7. PV can only
generate when there is sunlight and will therefore not be available for system peak.
Effectively, PV does not contribute to meeting the peak system demand or add to the
generation at the time of system minimum in the early hours of the morning. Thus, the PV
can be excluded for studies of these two network conditions.
Figure 2-7: PV schedule in the TDP period
The cumulative effect of PV during the daylight hours will have an impact, particularly at
peak output during low daytime loading and where they are connected to other generation
within an MTS supply area. In order to investigate any potential impact, the successful PV
plants from windows 1 to 4B of the REBID programme were modelled for 2017 to 2019 as
well as at the assumed allocation of future PV plants for 2020 to 2028.
0
1000
2000
3000
4000
5000
6000
7000
2015 2016 2017 2018 2019 2020 2021 2022 2023 2024 2025 2026 2027 2028
PV schedule (TDP 2018)
TDP 2018 - PV TDP 2018 Cumulative - PV
Transmission Development Plan 2019 to 2028 29
These generators were switched off during normal studies for the peak load and low load
cases and only used when studying the daytime network condition. The following network
conditions and PV output were studied:
2.11.2.1 System-wide
Midday load high with PV at 95% output (weekday)
Midday load low with PV set at 95% output (weekend)
2.11.2.2 Province-wide
Midday load high with PV at 100% output (weekday)
Midday load low with PV set at 100% output (weekend)
The objective is to identify the risk of network violations for high PV output, the magnitude of
impact and whether new transmission lines or transformers would be required, especially for
the assumed PV distribution after 2020.
2.11.3 Concentrated solar power (CSP) generation
The total CSP generation has been set at 1 050 MW in the IRP update. For the purposes of
the TDP studies, the seven successful CSP projects amounting to 600 MW from the REBID
programme have been allocated as follows:
• Ferrum 100 MW
• Garona 50 MW x 2
• Olien 100 MW
• Paulputs 100 MW x 2
• Upington 100 MW
It is assumed that the balance of the IRP allocation for CSP will be in the year 2020 based
on 150 MW plants. The capacity has been allocated at Ferrum (150 MW) and Upington
(300 MW). These units will be run at maximum output during both the system peak and the
local (provincial) peak as well as for the midday load conditions. They will not be run during
the low load conditions at night. The CSP schedule is shown in Figure 2-8, the total CSP
allocation will be capped at 1 050 MW.
Transmission Development Plan 2019 to 2028 30
Figure 2-8: CSP schedule for the TDP period
2.12 Other REIPP renewable generation
The majority of the REIPPPP is expected to be wind generation, PV, and CSP with the
balance made up of landfill gas, biomass, and small hydro. The landfill and small hydro are a
mixture of relatively small units and they are most likely to be connected to the Distribution
networks (Eskom or municipal). These were not be modelled on the TS as it is believed that
their impact will not be material.
2.13 Assumed generation decommissioning
The 2016 Draft IRP indicates that the initial decommissioning of large coal units will start in
2020. However, the schedule for the decommissioning has not been finalised. As a result,
decommissioning schedule assumptions were made in order to assess the impact on the
transmission network pending the final decision. According to the latest production schedule
from Eskom Generation, decommissioning will start in 2019, with 3 200 MW distributed
between Hendrina, Grootvlei, and Komati. The remaining 570 MW will be decommissioned
in 2020, as shown in Figure 2-9.
0
200
400
600
800
1000
1200
2015 2016 2017 2018 2019 2020 2021 2022 2023 2024 2025 2026 2027 2028
CSP chart (IRP v TDP 2017 v TDP 2018)
TDP 2018 - CSP TDP 2018 Cumulative - CSP
Transmission Development Plan 2019 to 2028 31
Figure 2-9: Generation reduction assumptions
2.14 Generation scenario studies
The IRP is not specific about the spatial allocation of generators. This creates a problem in
terms of the robustness of the plans. For that reason, an agreement was made with the IPP
Office, representing the DoE, that the TDP updates would take into consideration alternative
generation scenarios. The scenarios are generated by shifting generating units between
provinces while keeping the total generation by the end of the TDP period constant.
Allocation of alternative sites and the spread of future generation are made from 2020 to
2028, but the main year of consideration will be 2028, when the full impact of these
scenarios can be identified.
This section describes the alternative generation scenarios considered for this TDP update
to assess their impact on the TDP baseline for this period. The different scenarios are listed
below:
The scenarios are as follows:
• Limpopo PV scenario
• Northern Cape wind scenario
• Western Cape wind, gas and nuclear scenario
• Generation decommissioning of coal plant older than 50 years
Transmission Development Plan 2019 to 2028 32
Table A6, Table A7 and Table A8 in Appendix A contains tables with the allocation of the
future RE generation using the above scenarios. The tables following indicate the
redistribution of the future generation to meet the three alternative generation scenarios.
2.14.1 Scenario 1: Limpopo (solar PV)
The purpose of this scenario is to determine the impact on the transmission network within
Limpopo if 1 000 MW of solar PV generation is moved from the Northern Cape to Limpopo.
As described, this is not new generation, but generation that is displaced from the Northern
Cape to Limpopo. The Limpopo network study should consider the base case as well this
scenario to check if the network is still sufficient. If the network is not sufficient, mitigation
plans should be proposed. Table A6 in Appendix A shows the generation reallocation under
this scenario. The highlighted portion indicates where generation has been reduced and
where it has been added, with green showing additions and red showing reductions.
Of the future solar PV, 1 000 MW was allocated to the following locations in Limpopo as
alternatives to the baseline allocation. Table A6 in Appendix A shows the movement of PV
generation at substation level, and Figure 2-10 shows the total movement at provincial level.
Figure 2-10: Limpopo PV scenario generation comparison to base case
-1000
-500
0
500
1000
1500
2000
2500
3000
3500
4000
FS LM NW EC WC MP GP NC KZN
FS LM NW EC WC MP GP NC KZN
Base PV 364 918 725 60 534 0 50 3655 0
Lim PV 364 1918 725 60 534 0 50 2655 0
Difference 0 1000 0 0 0 0 0 -1000 0
Limpopo PV scenario
Transmission Development Plan 2019 to 2028 33
2.14.2 Scenario 2: Northern Cape wind scenario
The purpose of this scenario is to determine the impact on the transmission network within
the Northern Cape if around additional 2 200 MW of wind generation is moved into the
Northern Cape.
The Eastern Cape and Western Cape wind generation can be left at the normal rated output
of 30% and the wind in the Northern Cape can run at 100% output. Any network violations
should be noted and initial proposals made on how these violations are likely to be mitigated.
Table A7 in Appendix A and Figure 2-11 illustrate the scenario in a table as well as a
summary graph respectively.
Figure 2-11: Northern Cape wind scenario comparison to base case generation
-2000
-1000
0
1000
2000
3000
4000
5000
6000
FS LM NW EC WC MP GP NC KZN
FS LM NW EC WC MP GP NC KZN
Base Wind 0 0 0 4550 2483 0 0 2840 0
NC Wind 0 0 0 3450 1383 0 0 5040 0
Difference 0 0 0 -1100 -1100 0 0 2200 0
Northern Cape wind
Transmission Development Plan 2019 to 2028 34
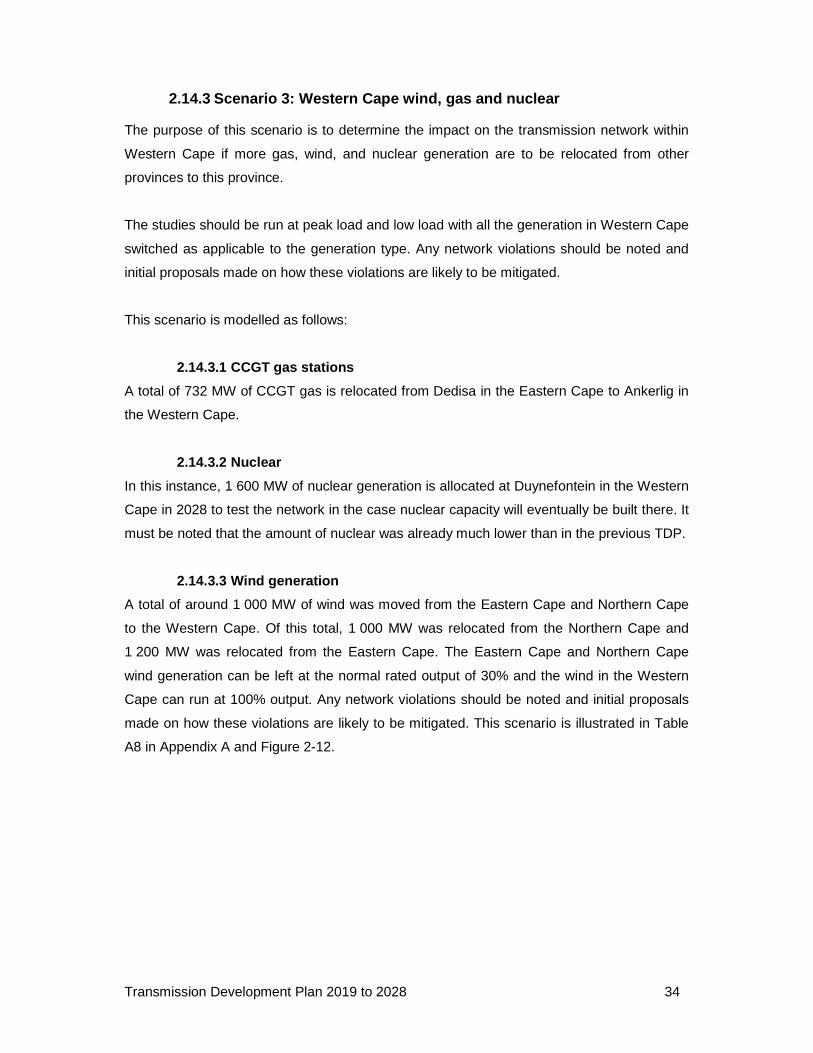
2.14.3 Scenario 3: Western Cape wind, gas and nucle ar
The purpose of this scenario is to determine the impact on the transmission network within
Western Cape if more gas, wind, and nuclear generation are to be relocated from other
provinces to this province.
The studies should be run at peak load and low load with all the generation in Western Cape
switched as applicable to the generation type. Any network violations should be noted and
initial proposals made on how these violations are likely to be mitigated.
This scenario is modelled as follows:
2.14.3.1 CCGT gas stations
A total of 732 MW of CCGT gas is relocated from Dedisa in the Eastern Cape to Ankerlig in
the Western Cape.
2.14.3.2 Nuclear
In this instance, 1 600 MW of nuclear generation is allocated at Duynefontein in the Western
Cape in 2028 to test the network in the case nuclear capacity will eventually be built there. It
must be noted that the amount of nuclear was already much lower than in the previous TDP.
2.14.3.3 Wind generation
A total of around 1 000 MW of wind was moved from the Eastern Cape and Northern Cape
to the Western Cape. Of this total, 1 000 MW was relocated from the Northern Cape and
1 200 MW was relocated from the Eastern Cape. The Eastern Cape and Northern Cape
wind generation can be left at the normal rated output of 30% and the wind in the Western
Cape can run at 100% output. Any network violations should be noted and initial proposals
made on how these violations are likely to be mitigated. This scenario is illustrated in Table
A8 in Appendix A and Figure 2-12.
Transmission Development Plan 2019 to 2028 35
Figure 2-12: Western Cape wind-nuclear scenario com parison to base case
generation
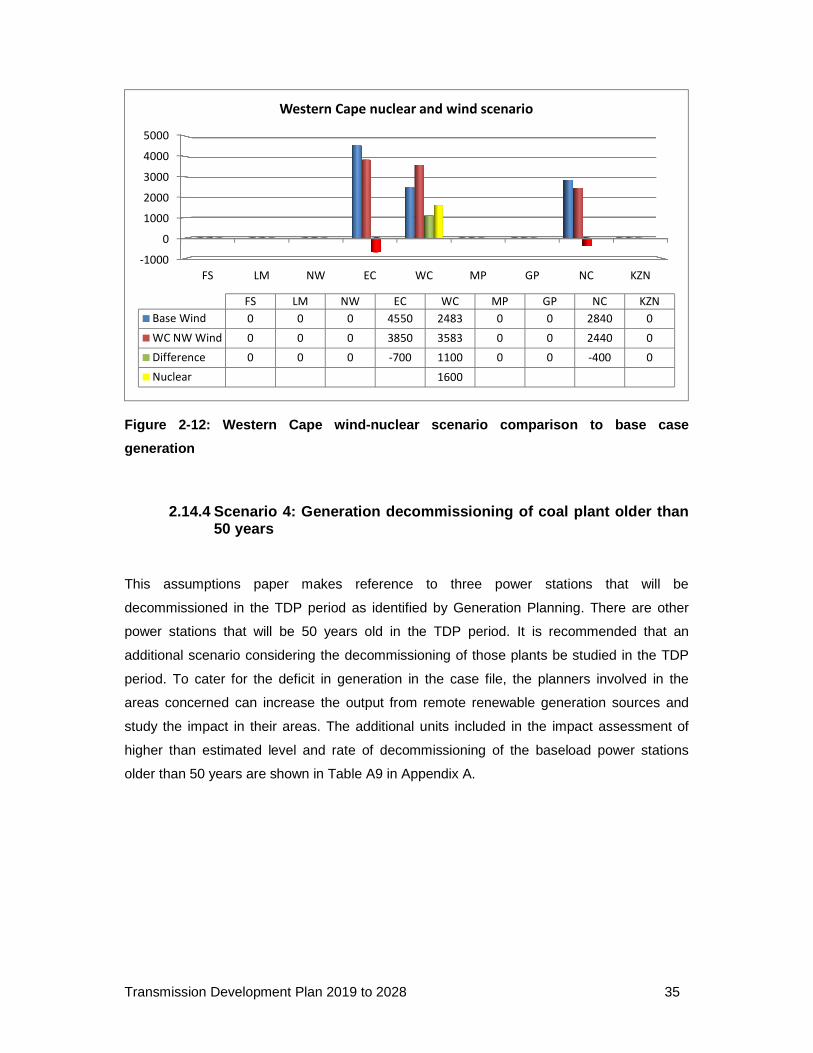
2.14.4 Scenario 4: Generation decommissioning of co al plant older than 50 years
This assumptions paper makes reference to three power stations that will be
decommissioned in the TDP period as identified by Generation Planning. There are other
power stations that will be 50 years old in the TDP period. It is recommended that an
additional scenario considering the decommissioning of those plants be studied in the TDP
period. To cater for the deficit in generation in the case file, the planners involved in the
areas concerned can increase the output from remote renewable generation sources and
study the impact in their areas. The additional units included in the impact assessment of
higher than estimated level and rate of decommissioning of the baseload power stations
older than 50 years are shown in Table A9 in Appendix A.
-1000
0
1000
2000
3000
4000
5000
FS LM NW EC WC MP GP NC KZN
FS LM NW EC WC MP GP NC KZN
Base Wind 0 0 0 4550 2483 0 0 2840 0
WC NW Wind 0 0 0 3850 3583 0 0 2440 0
Difference 0 0 0 -700 1100 0 0 -400 0
Nuclear 1600
Western Cape nuclear and wind scenario
Transmission Development Plan 2019 to 2028 36
3 DEMAND FORECAST
Demand forecasting is a fundamental requirement in the Transmission planning cycle. The
availability of sufficient transmission network capacity in any country is important to enable
economic growth. Eskom’s Grid Planning Department, in consultation with the relevant
Distribution operating units, metros and municipalities, compiles a forecast per point of
supply for the network model.
A double S-curve methodology, combined with normative quantitative and qualitative
techniques is used to produce the national forecast scenarios. A balancing algorithm method
is then applied to balance the national forecast from the top down to create a forecast per
main transmission supply point. This year, the forecast was improved by creating three
distinct national scenarios each with its own set of assumptions. A transmission high
scenario, a moderate scenario and a low scenario was developed and will now be briefly
discussed.
Transmission high scenario
The transmission high scenario (Tx high) is based on assumptions that will take South Africa
from a developing country to a developed country and therefore indicates optimistic growth
figures in line with the ambitions set by the current National Development Plan (NDP). This
high scenario is in line with the projected 3% GDP and GVA-R average year-on-year growth
expected for the TDP period 2019 to 2028 with a target network of 65 GW at year 2040. The
nominal value of 65 GW was taken from the NDP with an assumption that the past 10 years
caused a lag in development rate and therefore the target network was postponed to 2040
from 2030 as stipulated by the NDP document created in 2010. This scenario is optimistic
and assumes the return of current suppressed industries due to world economic conditions,
and trade contracts influencing imports, exports and local production. The Tx high forecast
assumes a national value of 51 GW at TOSP in year 2028, at the end of the TDP period.
Transmission moderate scenario
The transmission moderate scenario (Tx Mid) is based on a network scenario where the
increase in uptake on alternative energy generation associated with the increase in energy
efficiency and decrease in energy intensity are the main determinants in the use of electricity
from the Eskom grid. This scenario speaks to phenomena where technology advances in
storage and alternative energy generation solutions become increasingly affordable and may
surpass the rising cost of electricity. Assumptions were made towards this scenario,
incorporating the TDP generation assumptions report as published in March 2017 and
Transmission Development Plan 2019 to 2028 37
regression analysis done on the combined contribution at TOSP by renewable and co-
generation sources to simulate the expected growth of technological advanced energy
generation and storage sources.
The main assumption of this scenario is that renewable technology and alternative energy
generation methods should be taken into account when considering planning for the future. It
is assumed that a variable amount of demand in the country will be excluded from the
Transmission grid either by the effect of grid defection and thereby off-grid facilitation, smart
grid technology and renewable capacity linked up to distribution networks that may take
strain off the conventional supply. It is, however, recognised that a main capacity of
transmission network is still needed as alternative generation sources but that it may also be
facilitated back into the transmission network from generation connection points on either the
transmission grid or the distribution grid and should be considered for transfer capacities.
The calculations and assumptions lead to a 6% difference in the value of the national system
forecast for the end of the TDP at year 2028, with a capacity value of 48 GW at TOSP.
Transmission low scenario
The transmission low scenario is based on assumptions that there will be a continued
suppressed development rate in the country and most of the industries will not return to their
original status. This is a pessimistic view in line with the recent junk status economic
scenarios. It has also been investigated by the CSIR and the Energy Forecasting
Department and has a nominal capacity of 50 GW at the year 2040. This scenario assumes
correlation with a low overall economic average growth of 0,7%, lower than the projected
GDP and GVA-R Total industry figures. A summary of the three scenarios is shown in
Figure 3-1.
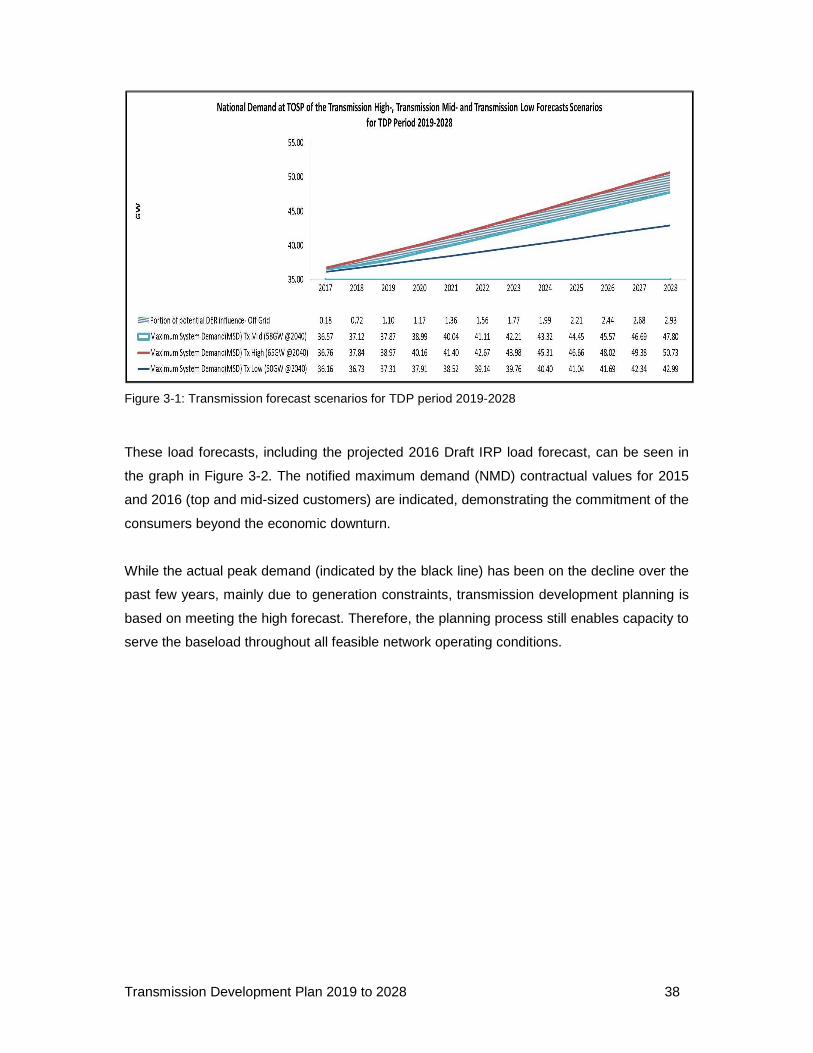
Transmission Development Plan 2019 to 2028 38
Figure 3-1: Transmission forecast scenarios for TDP period 2019-2028
These load forecasts, including the projected 2016 Draft IRP load forecast, can be seen in
the graph in Figure 3-2. The notified maximum demand (NMD) contractual values for 2015
and 2016 (top and mid-sized customers) are indicated, demonstrating the commitment of the
consumers beyond the economic downturn.
While the actual peak demand (indicated by the black line) has been on the decline over the
past few years, mainly due to generation constraints, transmission development planning is
based on meeting the high forecast. Therefore, the planning process still enables capacity to
serve the baseload throughout all feasible network operating conditions.
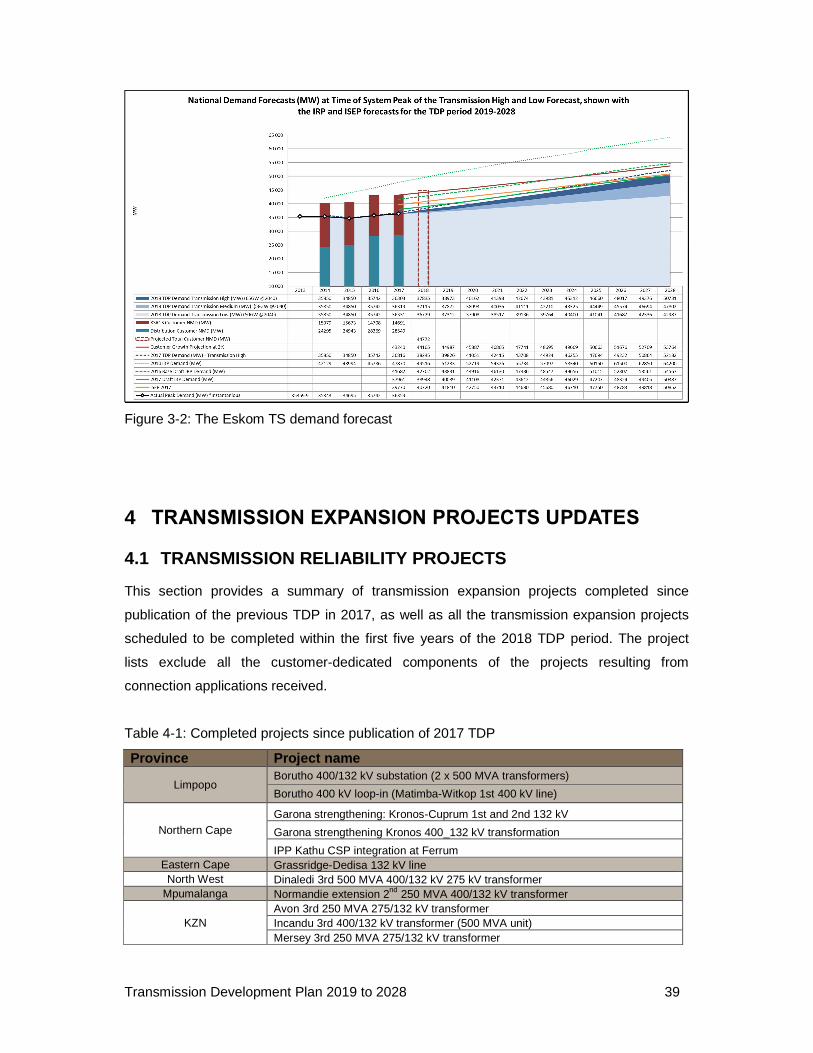
Transmission Development Plan 2019 to 2028 39
Figure 3-2: The Eskom TS demand forecast
4 TRANSMISSION EXPANSION PROJECTS UPDATES
4.1 TRANSMISSION RELIABILITY PROJECTS
This section provides a summary of transmission expansion projects completed since
publication of the previous TDP in 2017, as well as all the transmission expansion projects
scheduled to be completed within the first five years of the 2018 TDP period. The project
lists exclude all the customer-dedicated components of the projects resulting from
connection applications received.
Table 4-1: Completed projects since publication of 2017 TDP
Province Project name
Limpopo Borutho 400/132 kV substation (2 x 500 MVA transformers)
Borutho 400 kV loop-in (Matimba-Witkop 1st 400 kV line)
Northern Cape Garona strengthening: Kronos-Cuprum 1st and 2nd 132 kV
Garona strengthening Kronos 400_132 kV transformation
IPP Kathu CSP integration at Ferrum Eastern Cape Grassridge-Dedisa 132 kV line North West Dinaledi 3rd 500 MVA 400/132 kV 275 kV transformer
Mpumalanga Normandie extension 2nd 250 MVA 400/132 kV transformer
KZN Avon 3rd 250 MVA 275/132 kV transformer Incandu 3rd 400/132 kV transformer (500 MVA unit) Mersey 3rd 250 MVA 275/132 kV transformer
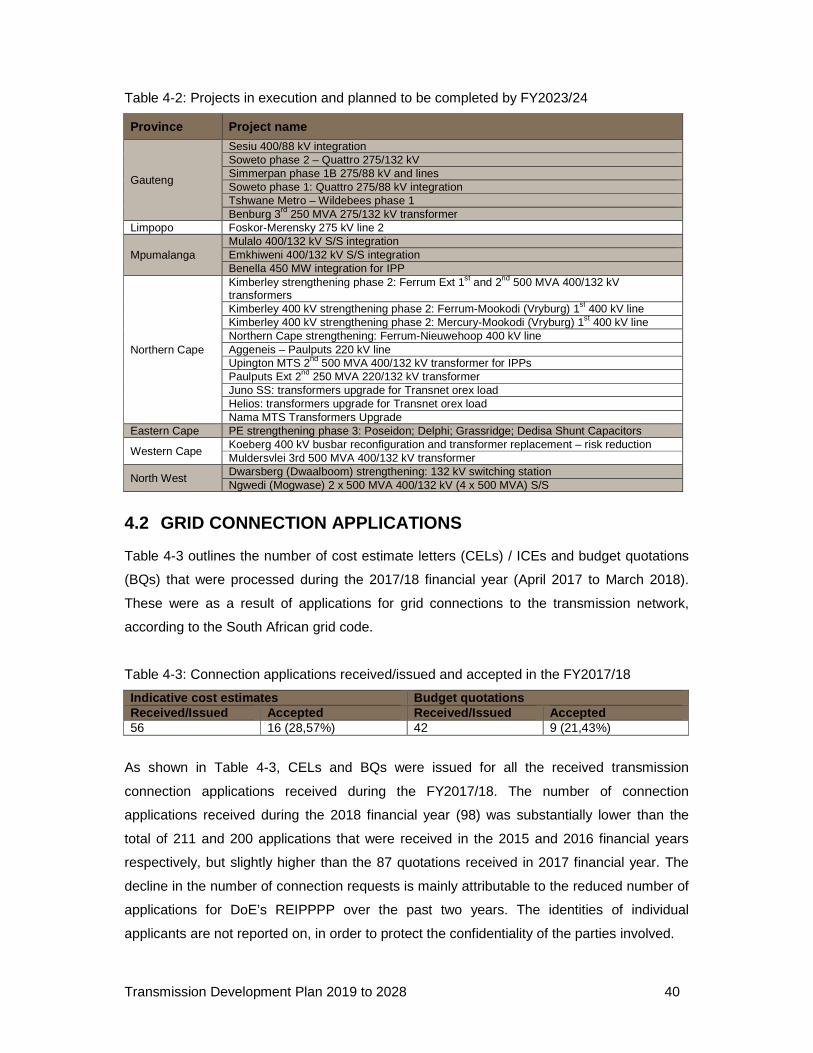
Transmission Development Plan 2019 to 2028 40
Table 4-2: Projects in execution and planned to be completed by FY2023/24
Province Project name
Gauteng
Sesiu 400/88 kV integration Soweto phase 2 – Quattro 275/132 kV Simmerpan phase 1B 275/88 kV and lines Soweto phase 1: Quattro 275/88 kV integration Tshwane Metro – Wildebees phase 1 Benburg 3rd 250 MVA 275/132 kV transformer
Limpopo Foskor-Merensky 275 kV line 2
Mpumalanga Mulalo 400/132 kV S/S integration Emkhiweni 400/132 kV S/S integration Benella 450 MW integration for IPP
Northern Cape
Kimberley strengthening phase 2: Ferrum Ext 1st and 2nd 500 MVA 400/132 kV transformers Kimberley 400 kV strengthening phase 2: Ferrum-Mookodi (Vryburg) 1st 400 kV line Kimberley 400 kV strengthening phase 2: Mercury-Mookodi (Vryburg) 1st 400 kV line Northern Cape strengthening: Ferrum-Nieuwehoop 400 kV line Aggeneis – Paulputs 220 kV line Upington MTS 2nd 500 MVA 400/132 kV transformer for IPPs Paulputs Ext 2nd 250 MVA 220/132 kV transformer Juno SS: transformers upgrade for Transnet orex load Helios: transformers upgrade for Transnet orex load Nama MTS Transformers Upgrade
Eastern Cape PE strengthening phase 3: Poseidon; Delphi; Grassridge; Dedisa Shunt Capacitors
Western Cape Koeberg 400 kV busbar reconfiguration and transformer replacement – risk reduction Muldersvlei 3rd 500 MVA 400/132 kV transformer
North West Dwarsberg (Dwaalboom) strengthening: 132 kV switching station Ngwedi (Mogwase) 2 x 500 MVA 400/132 kV (4 x 500 MVA) S/S
4.2 GRID CONNECTION APPLICATIONS
Table 4-3 outlines the number of cost estimate letters (CELs) / ICEs and budget quotations
(BQs) that were processed during the 2017/18 financial year (April 2017 to March 2018).
These were as a result of applications for grid connections to the transmission network,
according to the South African grid code.
Table 4-3: Connection applications received/issued and accepted in the FY2017/18
Indicative cost es timates Budget quotations Received/Issued Accepted Received/Issued Accepted 56 16 (28,57%) 42 9 (21,43%)
As shown in Table 4-3, CELs and BQs were issued for all the received transmission
connection applications received during the FY2017/18. The number of connection
applications received during the 2018 financial year (98) was substantially lower than the
total of 211 and 200 applications that were received in the 2015 and 2016 financial years
respectively, but slightly higher than the 87 quotations received in 2017 financial year. The
decline in the number of connection requests is mainly attributable to the reduced number of
applications for DoE’s REIPPPP over the past two years. The identities of individual
applicants are not reported on, in order to protect the confidentiality of the parties involved.
Transmission Development Plan 2019 to 2028 41
5 NATIONAL OVERVIEW
Significant lengths of new transmission lines and associated substations and substation
equipment are being added to the system. These additions are mainly due to the major
765 kV network reinforcements required for the supply to the Cape and KwaZulu-Natal. The
integration of the new Medupi Power Station in the developing Limpopo West Power Pool
requires significant additional lengths of transmission line.
The establishment of large-scale RE generation is becoming the primary driver of network
development in the three Cape provinces, apart from the Cape Corridor projects, the base
metals mining area in the Northern Cape and the established metropolitan load centres of
Cape Town, Port Elizabeth, and East London. These new transmission lines form part of the
long-term strategy to develop a main transmission backbone from which regional power
corridors can be supported. These power corridors will connect generation pools to one
another and to the major load centres in the country. This backbone and regional power
corridor structure will allow the increasing system demand to be supplied and the power from
new power stations to be integrated more efficiently into the transmission network and
distributed where required, both under conditions where the system is healthy and is
experiencing contingency conditions.
The development of the transmission backbone and the associated regional power corridors
was reviewed as part of the Strategic Grid Study, which considered the potential
development scenarios beyond the 10-year horizon of the TDP. The objective of this
strategic study was to align the transmission network with the requirements of the generation
future options and those of the growing and future load centres. This Strategic Grid Study
has enabled the 10-year TDP to be aligned with the future long-term development of the
whole Eskom system. It also ensures that the most appropriate technologies are used for
this purpose by testing whether other technologies (for example, HVDC) would likely yield
better, more practical, and more cost-effective solutions.
The additional transformer capacity added to the TS is an indication of the increase in load
demand and in the firm capacity requirements of the customers, as well as what is required
to achieve compliance with the minimum N-1 redundancy requirements contained in the grid
code.
Additional capacitive support is required to support areas of the network under contingency
conditions to ensure that the required voltage levels are maintained and enable more
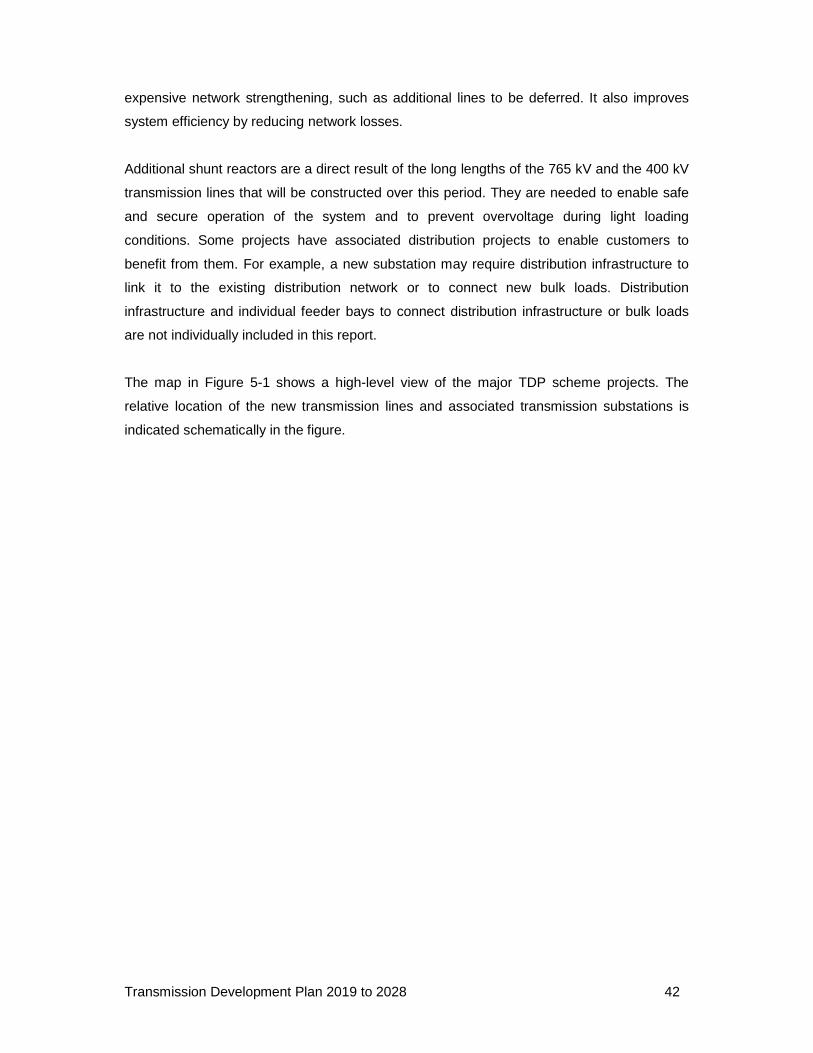
Transmission Development Plan 2019 to 2028 42
expensive network strengthening, such as additional lines to be deferred. It also improves
system efficiency by reducing network losses.
Additional shunt reactors are a direct result of the long lengths of the 765 kV and the 400 kV
transmission lines that will be constructed over this period. They are needed to enable safe
and secure operation of the system and to prevent overvoltage during light loading
conditions. Some projects have associated distribution projects to enable customers to
benefit from them. For example, a new substation may require distribution infrastructure to
link it to the existing distribution network or to connect new bulk loads. Distribution
infrastructure and individual feeder bays to connect distribution infrastructure or bulk loads
are not individually included in this report.
The map in Figure 5-1 shows a high-level view of the major TDP scheme projects. The
relative location of the new transmission lines and associated transmission substations is
indicated schematically in the figure.
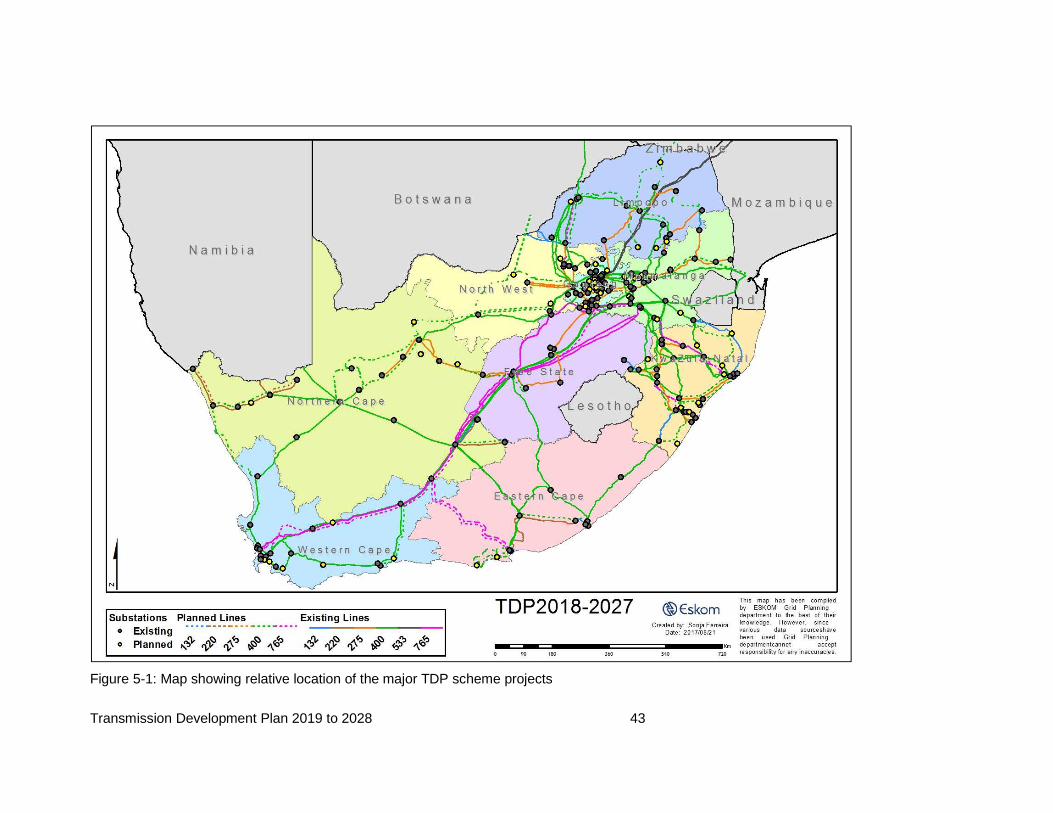
Transmission Development Plan 2019 to 2028 43
Figure 5-1: Map showing relative location of the major TDP scheme projects
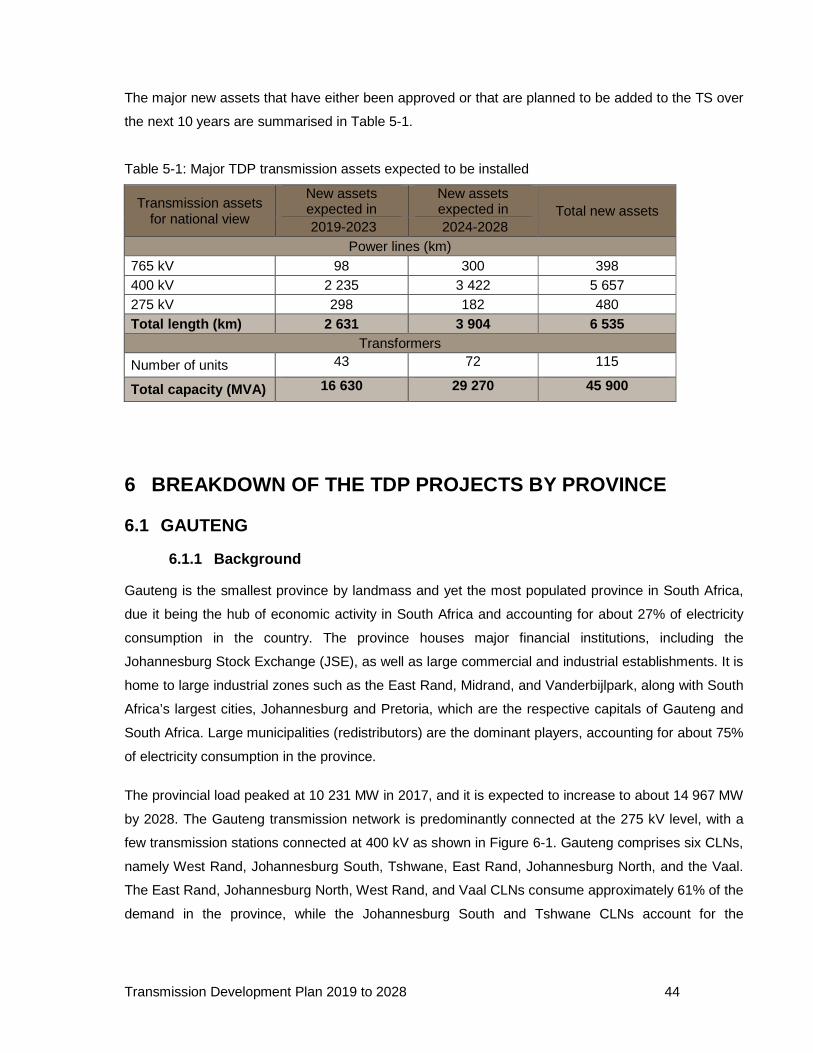
Transmission Development Plan 2019 to 2028 44
The major new assets that have either been approved or that are planned to be added to the TS over
the next 10 years are summarised in Table 5-1.
Table 5-1: Major TDP transmission assets expected to be installed
Transmission assets for national view
New assets expected in
New assets expected in Total new assets
2019-2023 2024-2028 Power lines (km)
765 kV 98 300 398 400 kV 2 235 3 422 5 657 275 kV 298 182 480 Total length (km) 2 631 3 904 6 535
Transformers
Number of units 43 72 115
Total capacity (MVA) 16 630 29 270 45 900
6 BREAKDOWN OF THE TDP PROJECTS BY PROVINCE
6.1 GAUTENG
6.1.1 Background
Gauteng is the smallest province by landmass and yet the most populated province in South Africa,
due it being the hub of economic activity in South Africa and accounting for about 27% of electricity
consumption in the country. The province houses major financial institutions, including the
Johannesburg Stock Exchange (JSE), as well as large commercial and industrial establishments. It is
home to large industrial zones such as the East Rand, Midrand, and Vanderbijlpark, along with South
Africa’s largest cities, Johannesburg and Pretoria, which are the respective capitals of Gauteng and
South Africa. Large municipalities (redistributors) are the dominant players, accounting for about 75%
of electricity consumption in the province.
The provincial load peaked at 10 231 MW in 2017, and it is expected to increase to about 14 967 MW
by 2028. The Gauteng transmission network is predominantly connected at the 275 kV level, with a
few transmission stations connected at 400 kV as shown in Figure 6-1. Gauteng comprises six CLNs,
namely West Rand, Johannesburg South, Tshwane, East Rand, Johannesburg North, and the Vaal.
The East Rand, Johannesburg North, West Rand, and Vaal CLNs consume approximately 61% of the
demand in the province, while the Johannesburg South and Tshwane CLNs account for the
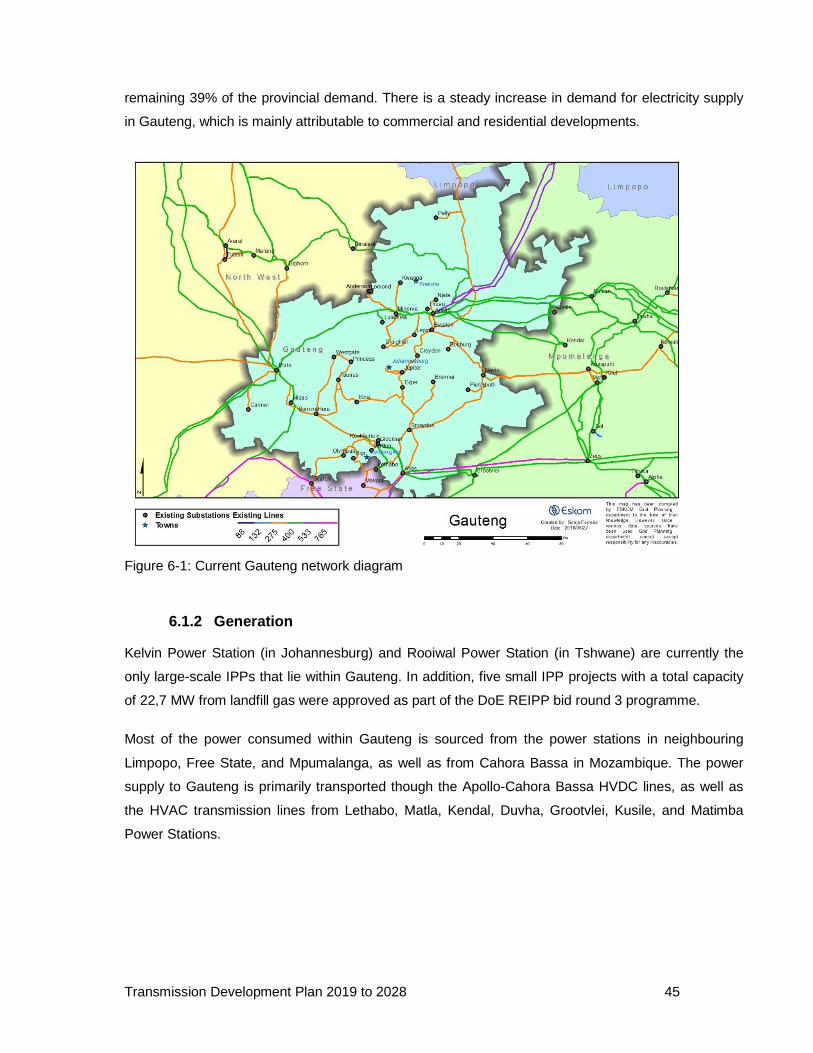
Transmission Development Plan 2019 to 2028 45
remaining 39% of the provincial demand. There is a steady increase in demand for electricity supply
in Gauteng, which is mainly attributable to commercial and residential developments.
Figure 6-1: Current Gauteng network diagram
6.1.2 Generation
Kelvin Power Station (in Johannesburg) and Rooiwal Power Station (in Tshwane) are currently the
only large-scale IPPs that lie within Gauteng. In addition, five small IPP projects with a total capacity
of 22,7 MW from landfill gas were approved as part of the DoE REIPP bid round 3 programme.
Most of the power consumed within Gauteng is sourced from the power stations in neighbouring
Limpopo, Free State, and Mpumalanga, as well as from Cahora Bassa in Mozambique. The power
supply to Gauteng is primarily transported though the Apollo-Cahora Bassa HVDC lines, as well as
the HVAC transmission lines from Lethabo, Matla, Kendal, Duvha, Grootvlei, Kusile, and Matimba
Power Stations.
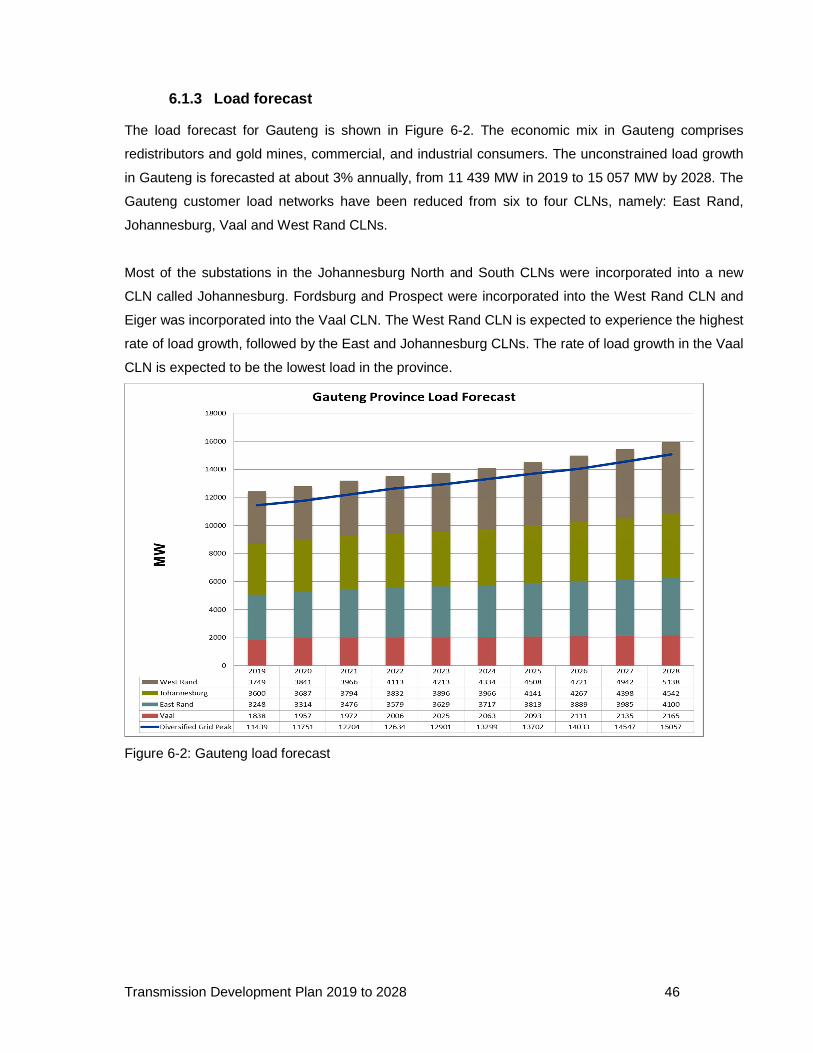
Transmission Development Plan 2019 to 2028 46
6.1.3 Load forecast
The load forecast for Gauteng is shown in Figure 6-2. The economic mix in Gauteng comprises
redistributors and gold mines, commercial, and industrial consumers. The unconstrained load growth
in Gauteng is forecasted at about 3% annually, from 11 439 MW in 2019 to 15 057 MW by 2028. The
Gauteng customer load networks have been reduced from six to four CLNs, namely: East Rand,
Johannesburg, Vaal and West Rand CLNs.
Most of the substations in the Johannesburg North and South CLNs were incorporated into a new
CLN called Johannesburg. Fordsburg and Prospect were incorporated into the West Rand CLN and
Eiger was incorporated into the Vaal CLN. The West Rand CLN is expected to experience the highest
rate of load growth, followed by the East and Johannesburg CLNs. The rate of load growth in the Vaal
CLN is expected to be the lowest load in the province.
Figure 6-2: Gauteng load forecast
Transmission Development Plan 2019 to 2028 47
6.1.4 Major schemes
The major TDP schemes planned in Gauteng are as follows:
Johannesburg North strengthening
The scheme is required to resolve the thermal and voltage constraints in the Johannesburg North
CLN and supports future loads in the Midrand and Tembisa areas. Currently two 150 MVar capacitor
banks are being installed at the Lepini Substation 275 kV busbar, and this will be followed by
construction of the Apollo-Lepini 275 kV line to increase capacity.
Johannesburg East strengthening: Jupiter B integrat ion
This scheme provides a new power corridor into the Johannesburg CLN and entails construction of
the 2 x 400 kV lines (operated at 275 kV) from Matla Power Station to the new transmission switching
station in the Germiston area, named Jupiter B (near the existing Jupiter Transmission Substation). At
least five transmission lines will be connected to the Jupiter B station, which will increase thermal
capacity in the Johannesburg South area.
Johannesburg East strengthening: Mesong (North Rand ) integration
This scheme addresses network constraints in the East Rand CLN. The planned upgrade of the
existing North Rand Distribution Substation into a transmission substation (named Mesong) and the
looping in of the Apollo-Croydon 275 kV line plus terminal equipment upgrades will result in increased
transfer limits in the East Rand and Johannesburg CLNs. The Sebenza-Mesong corridor comprising
two 400 kV lines (energised at 275 kV) might be developed through the looping in of the Esselen-
Jupiter 275 kV line into the new Sebenza MTS. Furthermore, the Sebenza Substation that City Power
is building will deload Prospect Substation and create more capacity in the East Rand.
Simmerpan strengthening: Sisimuka (Simmerpan) 275 k V integration
Simmerpan strengthening addresses unfirm transformation at the Jupiter Substation in the Germiston
area and alleviates constraints at the Simmerpan 88 kV Distribution Substation, which are attributed
to load growth in the Ekurhuleni and East Rand area. Sisimuka 275/88 kV Substation will be
energised from the planned new switching substation, Jupiter B, via the existing 1x Jupiter-
Simmerpan 275 kV line (currently energised at 88 kV). The 2nd Jupiter-Sisimuka 275 kV line will
continue to run at 88 kV until Sisimuka load reaches threshold levels to trigger a second 275/88 kV
transformer (expected after 2030). A provision will be made during construction for potential future
expansion of the Simmerpan Substation to accommodate 2 x 250 MVA 275/132 kV transformers,
subject to load growth in the Croydon 132 kV network.
Transmission Development Plan 2019 to 2028 48
Vaal strengthening
The scheme entails the construction of two Glockner-Etna 400 kV lines and the uprating of
underrated terminal equipment in order to deload the overloaded lines in the Vaal and West Rand
CLNs. These lines will be energised at 275 kV voltage level until the need for integrating a 400 kV line
at Etna Substation materialises.
Johannesburg Central strengthening
The main purpose of this transmission infrastructure investment scheme is to ensure grid code
compliance for the Taunus and Fordsburg Substations, as well as to address the expected thermal
constraints in the distribution network. The scope of work includes establishing the new Quattro
Substation, which will cater for four 315 MVA 275/88 kV transformers belonging to City Power and
two 500 MVA 275/132 kV transformers belonging to Eskom. Two 400 kV lines, energised at 275 kV,
will also be built from Etna to Quattro.
West Rand strengthening
This scheme addresses future thermal and voltage constraints of the transmission network, as well as
the distribution network constraints in the West Rand area. The project entails establishing a 400 kV
line at Westgate, building the Hera-Westgate 400 kV line and installing a 500 MVA 400/132 kV
transformer at Westgate.
Tshwane reinforcement
The Tshwane reinforcement schemes address the transmission substation’s firm capacity constraints
due to load increases in the Tshwane CLN. The project entails establishing two new transmission
substations in Tshwane CLN; one to the north (near Soshanguve) and the other east of Tshwane
(near Mamelodi).
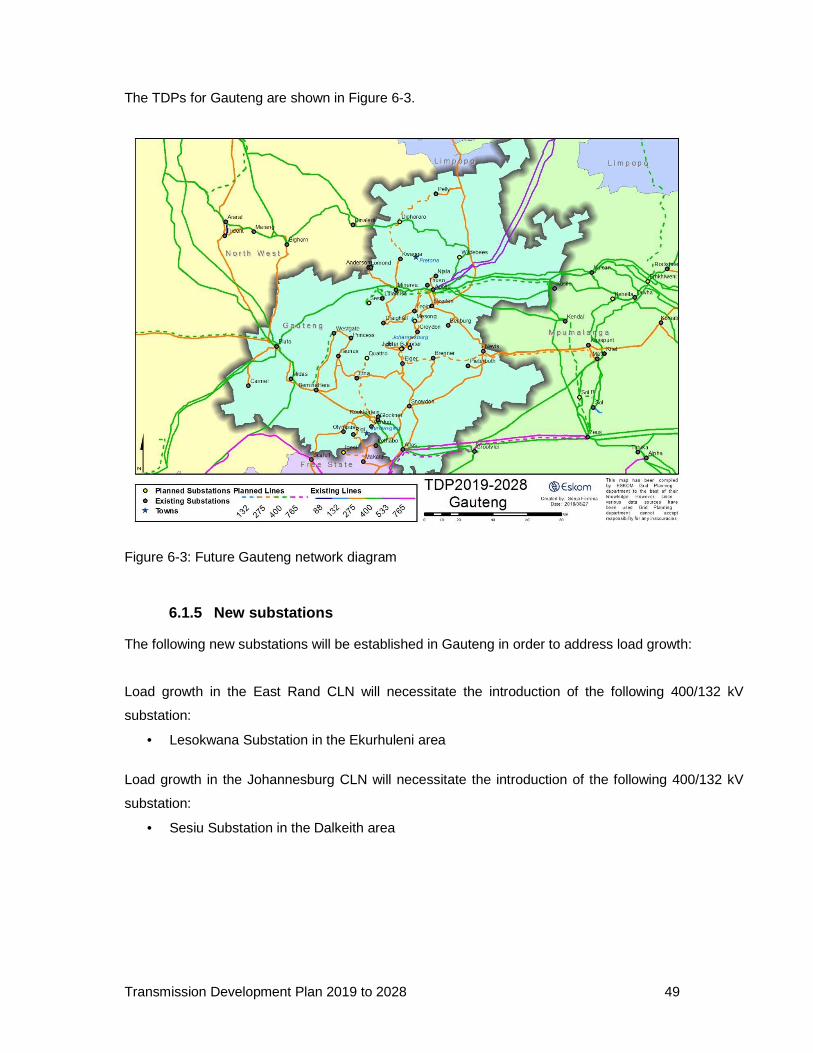
Transmission Development Plan 2019 to 2028 49
The TDPs for Gauteng are shown in Figure 6-3.
Figure 6-3: Future Gauteng network diagram
6.1.5 New substations
The following new substations will be established in Gauteng in order to address load growth:
Load growth in the East Rand CLN will necessitate the introduction of the following 400/132 kV
substation:
• Lesokwana Substation in the Ekurhuleni area
Load growth in the Johannesburg CLN will necessitate the introduction of the following 400/132 kV
substation:
• Sesiu Substation in the Dalkeith area
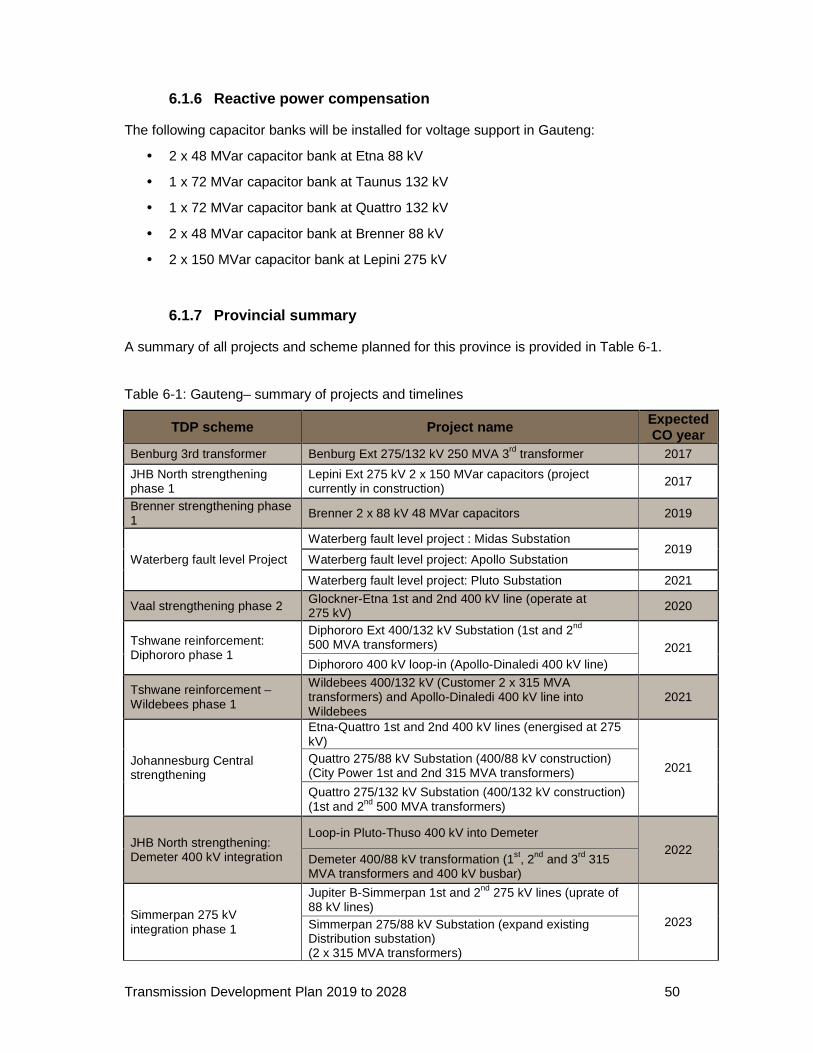
Transmission Development Plan 2019 to 2028 50
6.1.6 Reactive power compensation
The following capacitor banks will be installed for voltage support in Gauteng:
• 2 x 48 MVar capacitor bank at Etna 88 kV
• 1 x 72 MVar capacitor bank at Taunus 132 kV
• 1 x 72 MVar capacitor bank at Quattro 132 kV
• 2 x 48 MVar capacitor bank at Brenner 88 kV
• 2 x 150 MVar capacitor bank at Lepini 275 kV
6.1.7 Provincial summary
A summary of all projects and scheme planned for this province is provided in Table 6-1.
Table 6-1: Gauteng– summary of projects and timelines
TDP scheme Project name Expected CO year
Benburg 3rd transformer Benburg Ext 275/132 kV 250 MVA 3rd transformer 2017
JHB North strengthening phase 1
Lepini Ext 275 kV 2 x 150 MVar capacitors (project currently in construction) 2017
Brenner strengthening phase 1 Brenner 2 x 88 kV 48 MVar capacitors 2019
Waterberg fault level Project
Waterberg fault level project : Midas Substation 2019
Waterberg fault level project: Apollo Substation
Waterberg fault level project: Pluto Substation 2021
Vaal strengthening phase 2 Glockner-Etna 1st and 2nd 400 kV line (operate at 275 kV) 2020
Tshwane reinforcement: Diphororo phase 1
Diphororo Ext 400/132 kV Substation (1st and 2nd 500 MVA transformers) 2021 Diphororo 400 kV loop-in (Apollo-Dinaledi 400 kV line)
Tshwane reinforcement – Wildebees phase 1
Wildebees 400/132 kV (Customer 2 x 315 MVA transformers) and Apollo-Dinaledi 400 kV line into Wildebees
2021
Johannesburg Central strengthening
Etna-Quattro 1st and 2nd 400 kV lines (energised at 275 kV)
2021 Quattro 275/88 kV Substation (400/88 kV construction) (City Power 1st and 2nd 315 MVA transformers)
Quattro 275/132 kV Substation (400/132 kV construction) (1st and 2nd 500 MVA transformers)
JHB North strengthening: Demeter 400 kV integration
Loop-in Pluto-Thuso 400 kV into Demeter 2022
Demeter 400/88 kV transformation (1st, 2nd and 3rd 315 MVA transformers and 400 kV busbar)
Simmerpan 275 kV integration phase 1
Jupiter B-Simmerpan 1st and 2nd 275 kV lines (uprate of 88 kV lines)
2023 Simmerpan 275/88 kV Substation (expand existing Distribution substation) (2 x 315 MVA transformers)
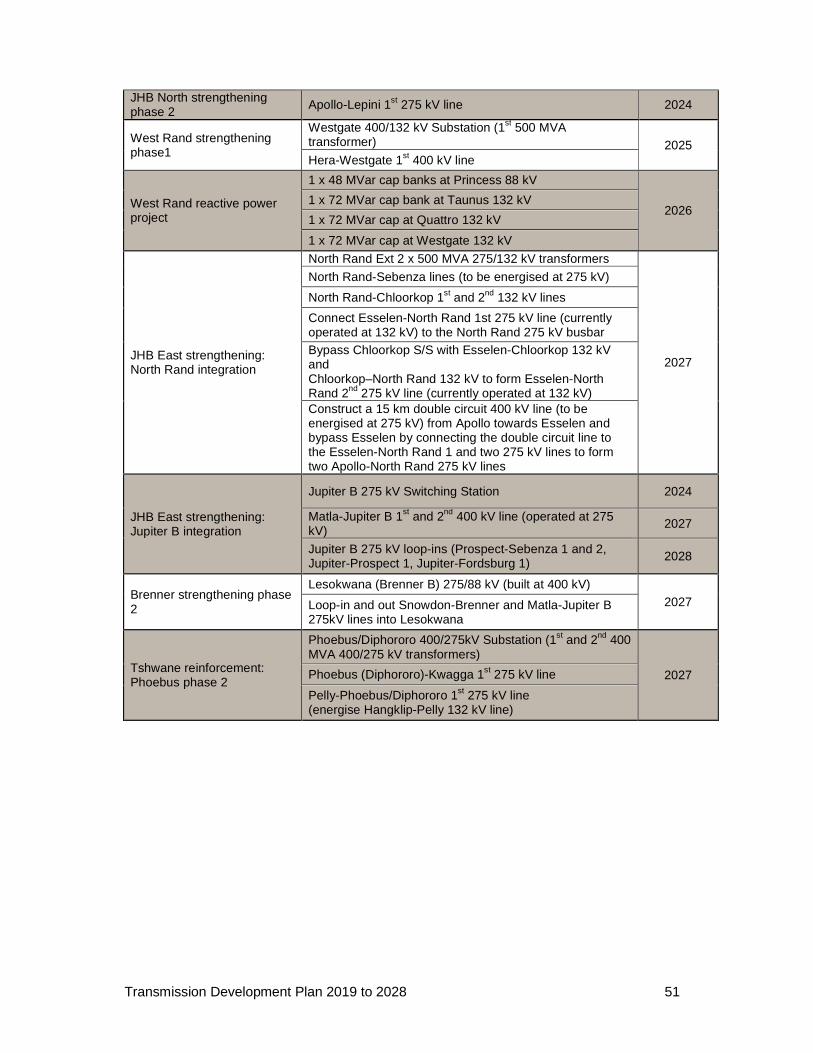
Transmission Development Plan 2019 to 2028 51
JHB North strengthening phase 2 Apollo-Lepini 1st 275 kV line 2024
West Rand strengthening phase1
Westgate 400/132 kV Substation (1st 500 MVA transformer) 2025 Hera-Westgate 1st 400 kV line
West Rand reactive power project
1 x 48 MVar cap banks at Princess 88 kV
2026 1 x 72 MVar cap bank at Taunus 132 kV
1 x 72 MVar cap at Quattro 132 kV
1 x 72 MVar cap at Westgate 132 kV
JHB East strengthening: North Rand integration
North Rand Ext 2 x 500 MVA 275/132 kV transformers
2027
North Rand-Sebenza lines (to be energised at 275 kV)
North Rand-Chloorkop 1st and 2nd 132 kV lines
Connect Esselen-North Rand 1st 275 kV line (currently operated at 132 kV) to the North Rand 275 kV busbar Bypass Chloorkop S/S with Esselen-Chloorkop 132 kV and Chloorkop–North Rand 132 kV to form Esselen-North Rand 2nd 275 kV line (currently operated at 132 kV) Construct a 15 km double circuit 400 kV line (to be energised at 275 kV) from Apollo towards Esselen and bypass Esselen by connecting the double circuit line to the Esselen-North Rand 1 and two 275 kV lines to form two Apollo-North Rand 275 kV lines
JHB East strengthening: Jupiter B integration
Jupiter B 275 kV Switching Station 2024
Matla-Jupiter B 1st and 2nd 400 kV line (operated at 275 kV) 2027
Jupiter B 275 kV loop-ins (Prospect-Sebenza 1 and 2, Jupiter-Prospect 1, Jupiter-Fordsburg 1) 2028
Brenner strengthening phase 2
Lesokwana (Brenner B) 275/88 kV (built at 400 kV) 2027 Loop-in and out Snowdon-Brenner and Matla-Jupiter B
275kV lines into Lesokwana
Tshwane reinforcement: Phoebus phase 2
Phoebus/Diphororo 400/275kV Substation (1st and 2nd 400 MVA 400/275 kV transformers)
2027 Phoebus (Diphororo)-Kwagga 1st 275 kV line
Pelly-Phoebus/Diphororo 1st 275 kV line (energise Hangklip-Pelly 132 kV line)
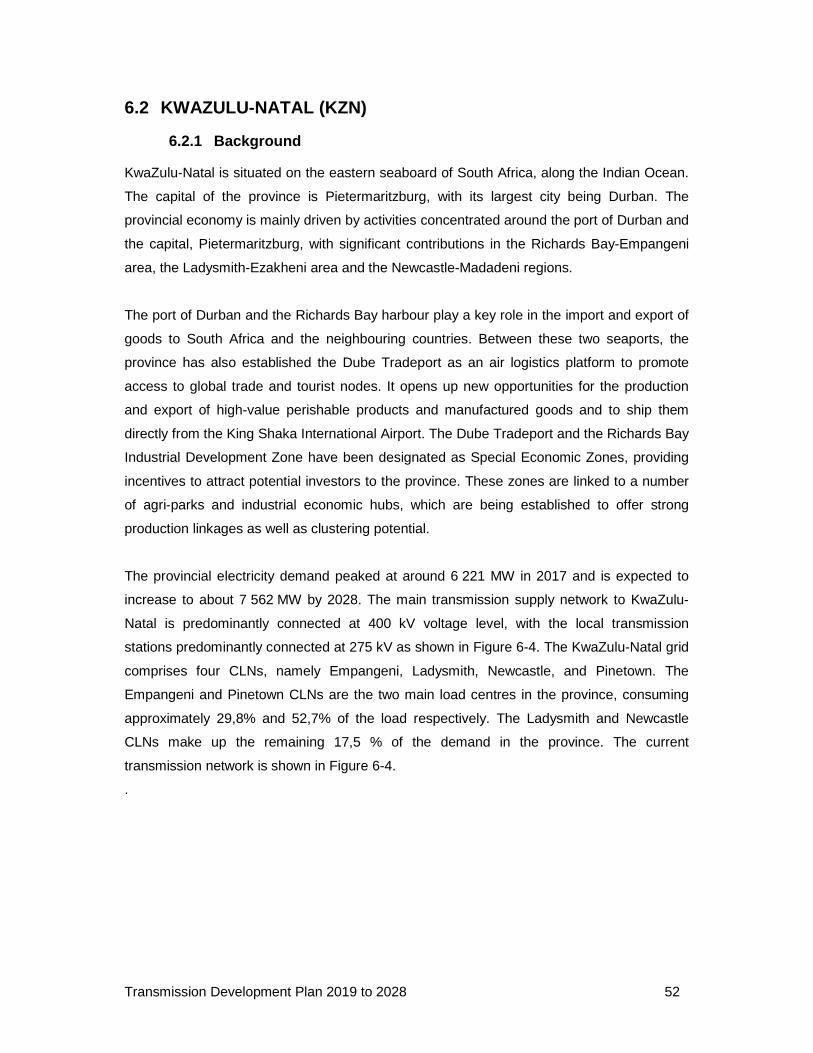
Transmission Development Plan 2019 to 2028 52
6.2 KWAZULU-NATAL (KZN)
6.2.1 Background
KwaZulu-Natal is situated on the eastern seaboard of South Africa, along the Indian Ocean.
The capital of the province is Pietermaritzburg, with its largest city being Durban. The
provincial economy is mainly driven by activities concentrated around the port of Durban and
the capital, Pietermaritzburg, with significant contributions in the Richards Bay-Empangeni
area, the Ladysmith-Ezakheni area and the Newcastle-Madadeni regions.
The port of Durban and the Richards Bay harbour play a key role in the import and export of
goods to South Africa and the neighbouring countries. Between these two seaports, the
province has also established the Dube Tradeport as an air logistics platform to promote
access to global trade and tourist nodes. It opens up new opportunities for the production
and export of high-value perishable products and manufactured goods and to ship them
directly from the King Shaka International Airport. The Dube Tradeport and the Richards Bay
Industrial Development Zone have been designated as Special Economic Zones, providing
incentives to attract potential investors to the province. These zones are linked to a number
of agri-parks and industrial economic hubs, which are being established to offer strong
production linkages as well as clustering potential.
The provincial electricity demand peaked at around 6 221 MW in 2017 and is expected to
increase to about 7 562 MW by 2028. The main transmission supply network to KwaZulu-
Natal is predominantly connected at 400 kV voltage level, with the local transmission
stations predominantly connected at 275 kV as shown in Figure 6-4. The KwaZulu-Natal grid
comprises four CLNs, namely Empangeni, Ladysmith, Newcastle, and Pinetown. The
Empangeni and Pinetown CLNs are the two main load centres in the province, consuming
approximately 29,8% and 52,7% of the load respectively. The Ladysmith and Newcastle
CLNs make up the remaining 17,5 % of the demand in the province. The current
transmission network is shown in Figure 6-4.
.
Transmission Development Plan 2019 to 2028 53
Figure 6-4: Current KZN transmission network
6.2.2 Generation
Drakensberg and Ingula Pumped Storage Schemes are the only power stations that lie
within the defined KwaZulu-Natal borders. Most of the power consumed within this province
is sourced from the power stations in Mpumalanga.
The 2016 Draft IRP has allocated approximately 2 000 MW of gas plant around the Richards
Bay harbour. It is part of the 3 000 MW gas-to-power initiative.
6.2.3 Load forecast
The economic mix in KwaZulu-Natal comprises redistributors, commercial customers, and
industrial customers. The load in KwaZulu-Natal is forecasted to grow steadily at about 2%
annually, from 6 281 MW in 2018 to 7 562 MW by 2028. The highest provincial load growth
is expected in the Pinetown and Empangeni CLNs due to industrial, commercial, and
residential developments. The load forecast for the KwaZulu-Natal is shown in Figure 6-5.
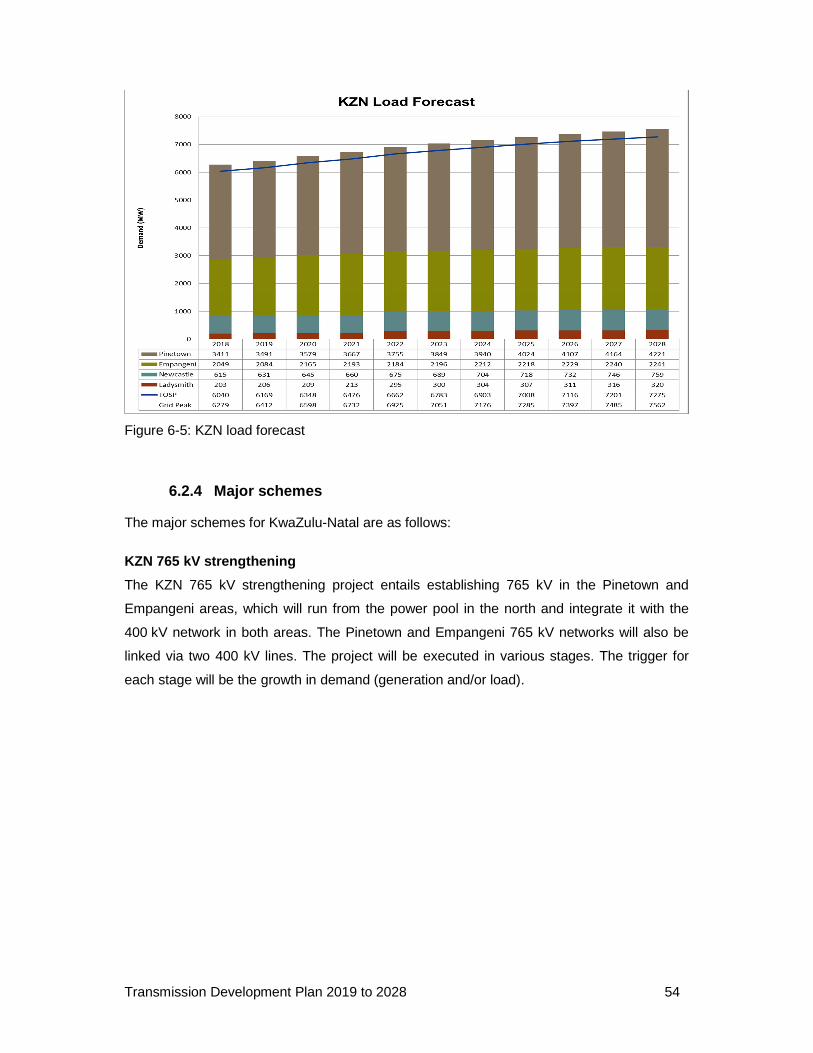
Transmission Development Plan 2019 to 2028 54
Figure 6-5: KZN load forecast
6.2.4 Major schemes
The major schemes for KwaZulu-Natal are as follows:
KZN 765 kV strengthening
The KZN 765 kV strengthening project entails establishing 765 kV in the Pinetown and
Empangeni areas, which will run from the power pool in the north and integrate it with the
400 kV network in both areas. The Pinetown and Empangeni 765 kV networks will also be
linked via two 400 kV lines. The project will be executed in various stages. The trigger for
each stage will be the growth in demand (generation and/or load).
Transmission Development Plan 2019 to 2028 55
South Coast strengthening: St. Faiths 2 x 500 MVA 4 00/132 kV Substation
This includes construction of the second Ariadne-Eros 400 kV 132 kV multi-circuit line and
establishment of St. Faiths 400/132 kV Substation near Port Shepstone. The trigger for St.
Faiths Substation will be demand growth along the South Coast.
eThekwini Electricity Network strengthening (GP_14/ 15) – This project involves:
• The establishment of Shongweni 2 x 500 MVA 400/132 kV Substation and the
construction of two 400 kV lines from Hector to the proposed Shongweni Substation to
deload the Hector 400/275 kV transformers, the Hector-Klaarwater 275 kV lines and the
Klaarwater Substation. It will also cater for the planned developments west of the
eThekwini metropolitan.
• The establishment of Inyaninga 2 x 500 MVA 400/132 kV Substation by looping into one
of the planned Isundu-Mbewu 400 kV lines to form Isundu-Inyaninga 400 kV line and
Inyaninga-Mbewu 400 kV line. This substation will deload the Mersey-Avon 275 kV
system and provide supply to the Dube Tradeport development.
NKZN strengthening: Iphiva 2 x 500 MVA 400/132 kV S ubstation
This project involves the establishment of Iphiva 400/132 kV Substation around Candover-
Mkuze to address supply constraints around Pongola, Makhatini Flats, and iSimangaliso
(Greater St. Lucia) Wetland Park. The planned Iphiva Substation will be supplied by two
400 kV lines, namely Normandie-Iphiva and Duma-Iphiva 400 kV lines. The Duma
Substation is part of the planned Ermelo-Richards Bay coal link upgrade.
Ariadne Substation strengthening
Grid Planning is currently investigating options either to increase the transformation capacity
at Ariadne Substation or to strengthen the 132 kV interconnection between Mersey
Substation and Ariadne Substation to provide backup for transformer outages at the Ariadne
Substation.
The TDPs for KwaZulu-Natal are shown in Figure 6-6.
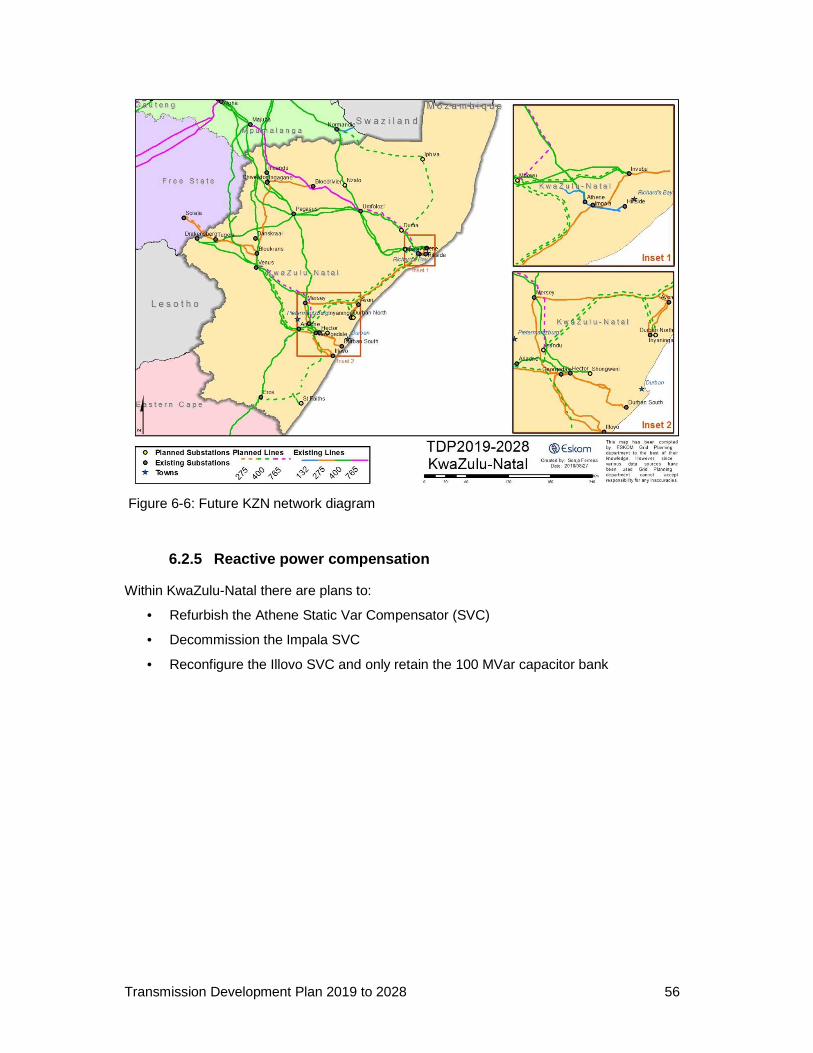
Transmission Development Plan 2019 to 2028 56
Figure 6-6: Future KZN network diagram
6.2.5 Reactive power compensation
Within KwaZulu-Natal there are plans to:
• Refurbish the Athene Static Var Compensator (SVC)
• Decommission the Impala SVC
• Reconfigure the Illovo SVC and only retain the 100 MVar capacitor bank
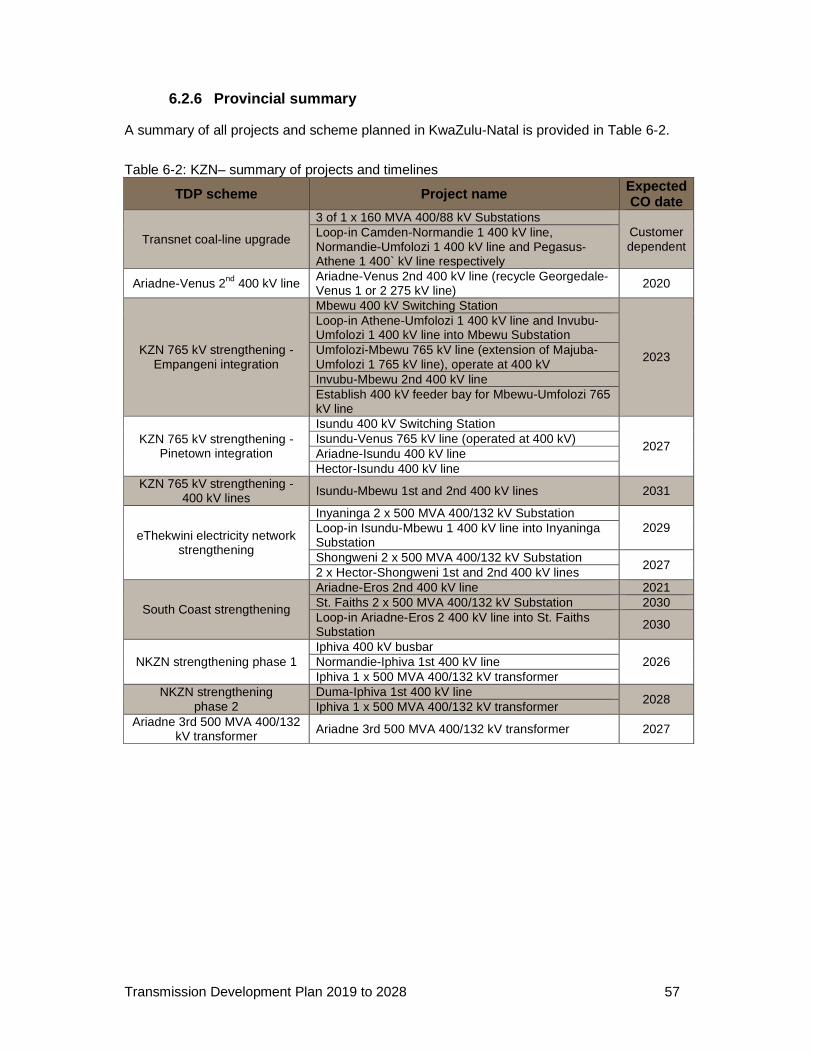
Transmission Development Plan 2019 to 2028 57
6.2.6 Provincial summary
A summary of all projects and scheme planned in KwaZulu-Natal is provided in Table 6-2.
Table 6-2: KZN– summary of projects and timelines
TDP scheme Project name Expected CO date
Transnet coal-line upgrade
3 of 1 x 160 MVA 400/88 kV Substations Customer dependent
Loop-in Camden-Normandie 1 400 kV line, Normandie-Umfolozi 1 400 kV line and Pegasus-Athene 1 400` kV line respectively
Ariadne-Venus 2nd 400 kV line Ariadne-Venus 2nd 400 kV line (recycle Georgedale-Venus 1 or 2 275 kV line) 2020
KZN 765 kV strengthening - Empangeni integration
Mbewu 400 kV Switching Station
2023
Loop-in Athene-Umfolozi 1 400 kV line and Invubu-Umfolozi 1 400 kV line into Mbewu Substation Umfolozi-Mbewu 765 kV line (extension of Majuba-Umfolozi 1 765 kV line), operate at 400 kV Invubu-Mbewu 2nd 400 kV line Establish 400 kV feeder bay for Mbewu-Umfolozi 765 kV line
KZN 765 kV strengthening -Pinetown integration
Isundu 400 kV Switching Station
2027 Isundu-Venus 765 kV line (operated at 400 kV) Ariadne-Isundu 400 kV line Hector-Isundu 400 kV line
KZN 765 kV strengthening - 400 kV lines Isundu-Mbewu 1st and 2nd 400 kV lines 2031
eThekwini electricity network strengthening
Inyaninga 2 x 500 MVA 400/132 kV Substation 2029 Loop-in Isundu-Mbewu 1 400 kV line into Inyaninga
Substation Shongweni 2 x 500 MVA 400/132 kV Substation
2027 2 x Hector-Shongweni 1st and 2nd 400 kV lines
South Coast strengthening
Ariadne-Eros 2nd 400 kV line 2021 St. Faiths 2 x 500 MVA 400/132 kV Substation 2030 Loop-in Ariadne-Eros 2 400 kV line into St. Faiths Substation
2030
NKZN strengthening phase 1 Iphiva 400 kV busbar
2026 Normandie-Iphiva 1st 400 kV line Iphiva 1 x 500 MVA 400/132 kV transformer
NKZN strengthening phase 2
Duma-Iphiva 1st 400 kV line 2028
Iphiva 1 x 500 MVA 400/132 kV transformer Ariadne 3rd 500 MVA 400/132
kV transformer Ariadne 3rd 500 MVA 400/132 kV transformer 2027
Transmission Development Plan 2019 to 2028 58
6.3 LIMPOPO
6.3.1 Background
Limpopo is situated on the most northern part of South Africa and is named after the
Limpopo River. The largest city in the province is Polokwane, and the province shares
international borders with Botswana, Mozambique and Zimbabwe. The provincial economy
is mainly driven by mining, exporting primary products, and importing manufactured goods.
The Northern Grid consists of three CLNs, namely Lephalale, Polokwane, and Phalaborwa.
Each CLN is made up of a number of main transmission substations (MTS). The MTS are
interconnected through 400 kV, 275 kV as well as through the 132 kV underlying distribution
network. The Polokwane and Phalaborwa CLNs consume approximately 38% of the total
load in Limpopo each, while the Lephalale CLN consumes the remaining 24%.
The Lephalale CLN is the only CLN that experienced load growth in this period. The load
increased by 30,5% when compared to last year’s CLN peak. This was due to the new
Borutho Substation taking load on 21 March 2017, which peaked at 196 MW during this
period, deloading Polokwane CLN. Polokwane CLN peaked at 1 158 MW. This was only 22
MW less than last year’s peak of 1 180 MW. The Phalaborwa CLN’s peak loading increased
from 1 135 MW to 1 136 MW, a total increase of 0,09%.
Growth in Limpopo is primarily due to the platinum group metals (PGMs), ferrochrome
mining and processing activities, located in the Polokwane and Steelpoort areas. The
establishment of coal mines is a key driver for expansion in the Lephalale area. There are
also large electrification projects underway throughout Limpopo.
Figure 6-7 shows the geographical diagram of the existing Northern Grid transmission
network.
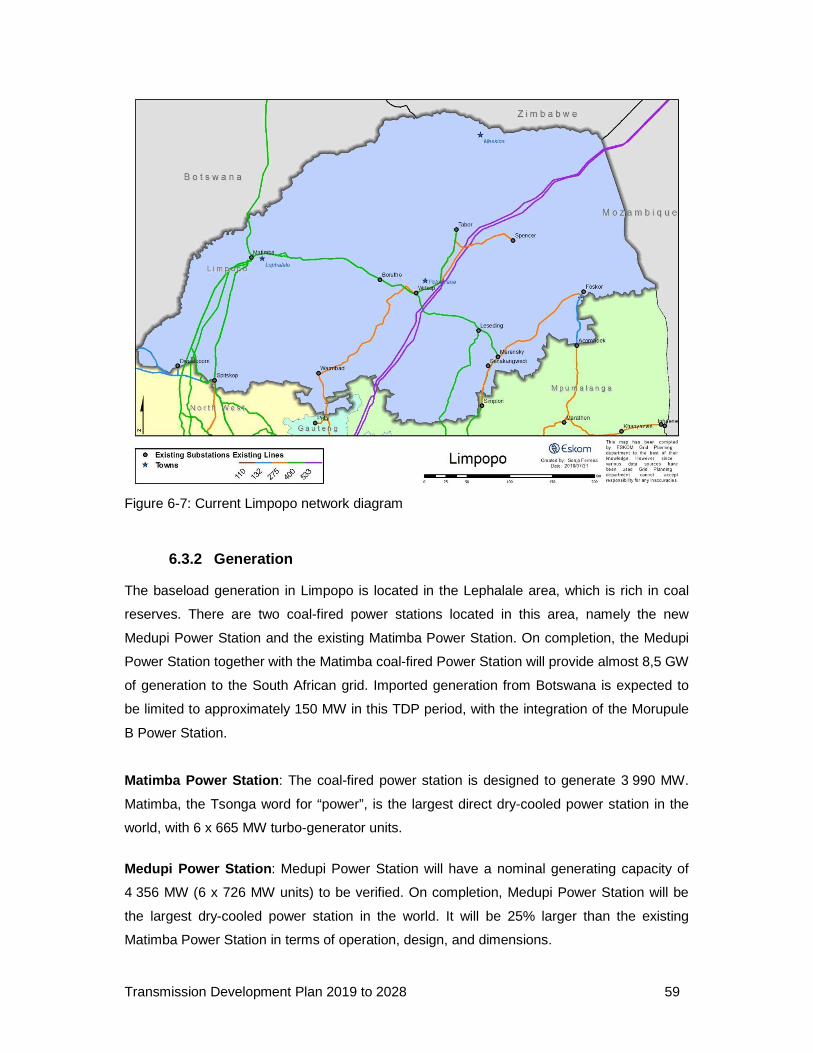
Transmission Development Plan 2019 to 2028 59
Figure 6-7: Current Limpopo network diagram
6.3.2 Generation
The baseload generation in Limpopo is located in the Lephalale area, which is rich in coal
reserves. There are two coal-fired power stations located in this area, namely the new
Medupi Power Station and the existing Matimba Power Station. On completion, the Medupi
Power Station together with the Matimba coal-fired Power Station will provide almost 8,5 GW
of generation to the South African grid. Imported generation from Botswana is expected to
be limited to approximately 150 MW in this TDP period, with the integration of the Morupule
B Power Station.
Matimba Power Station : The coal-fired power station is designed to generate 3 990 MW.
Matimba, the Tsonga word for “power”, is the largest direct dry-cooled power station in the
world, with 6 x 665 MW turbo-generator units.
Medupi Power Station : Medupi Power Station will have a nominal generating capacity of
4 356 MW (6 x 726 MW units) to be verified. On completion, Medupi Power Station will be
the largest dry-cooled power station in the world. It will be 25% larger than the existing
Matimba Power Station in terms of operation, design, and dimensions.
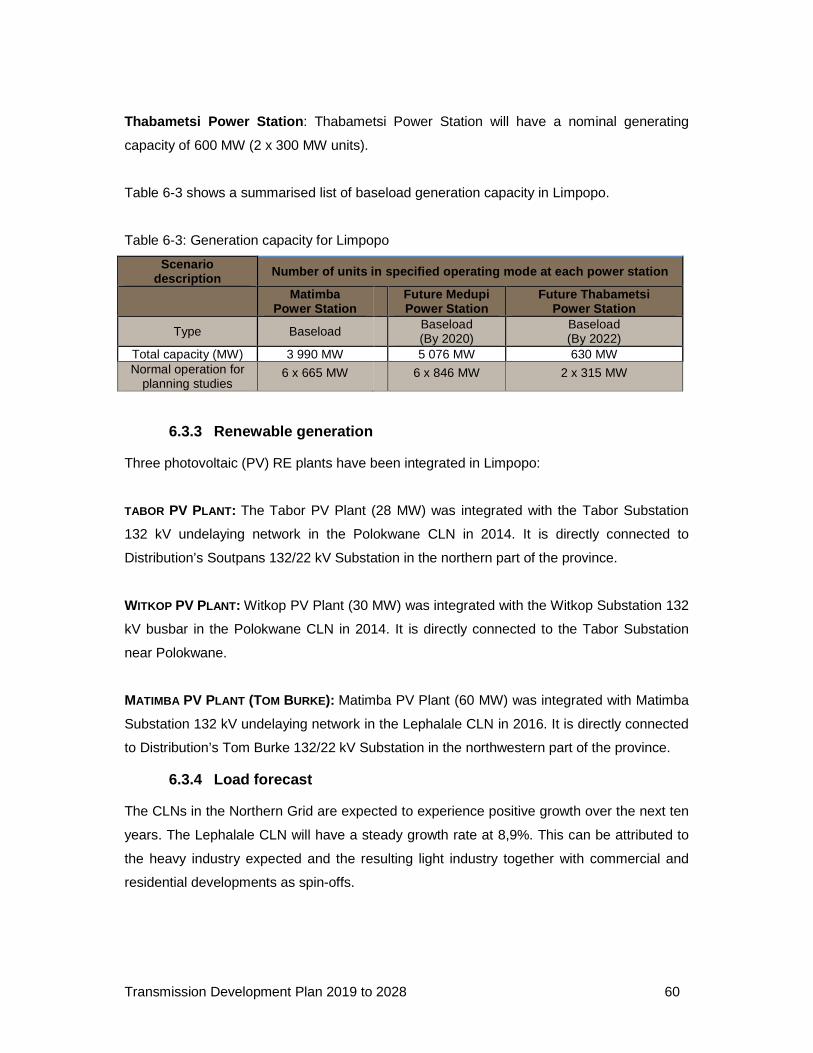
Transmission Development Plan 2019 to 2028 60
Thabametsi Power Station : Thabametsi Power Station will have a nominal generating
capacity of 600 MW (2 x 300 MW units).
Table 6-3 shows a summarised list of baseload generation capacity in Limpopo.
Table 6-3: Generation capacity for Limpopo
Scenario description Number of units in specified operating mode at each power station
Matimba Power Station
Future Medupi Power Station
Future Thabametsi Power Station
Type Baseload
Baseload (By 2020)
Baseload (By 2022)
Total capacity (MW) 3 990 MW 5 076 MW 630 MW Normal operation for
planning studies 6 x 665 MW 6 x 846 MW 2 x 315 MW
6.3.3 Renewable generation
Three photovoltaic (PV) RE plants have been integrated in Limpopo:
TABOR PV PLANT : The Tabor PV Plant (28 MW) was integrated with the Tabor Substation
132 kV undelaying network in the Polokwane CLN in 2014. It is directly connected to
Distribution’s Soutpans 132/22 kV Substation in the northern part of the province.
WITKOP PV PLANT : Witkop PV Plant (30 MW) was integrated with the Witkop Substation 132
kV busbar in the Polokwane CLN in 2014. It is directly connected to the Tabor Substation
near Polokwane.
MATIMBA PV PLANT (TOM BURKE): Matimba PV Plant (60 MW) was integrated with Matimba
Substation 132 kV undelaying network in the Lephalale CLN in 2016. It is directly connected
to Distribution’s Tom Burke 132/22 kV Substation in the northwestern part of the province.
6.3.4 Load forecast
The CLNs in the Northern Grid are expected to experience positive growth over the next ten
years. The Lephalale CLN will have a steady growth rate at 8,9%. This can be attributed to
the heavy industry expected and the resulting light industry together with commercial and
residential developments as spin-offs.
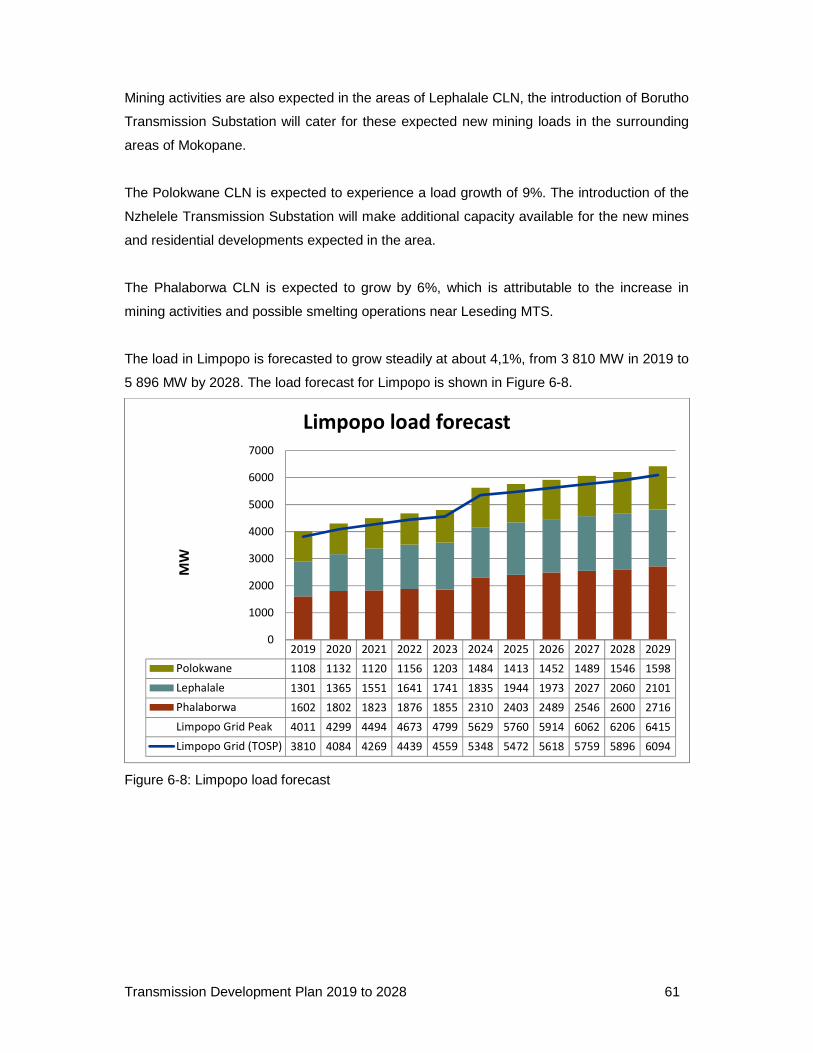
Transmission Development Plan 2019 to 2028 61
Mining activities are also expected in the areas of Lephalale CLN, the introduction of Borutho
Transmission Substation will cater for these expected new mining loads in the surrounding
areas of Mokopane.
The Polokwane CLN is expected to experience a load growth of 9%. The introduction of the
Nzhelele Transmission Substation will make additional capacity available for the new mines
and residential developments expected in the area.
The Phalaborwa CLN is expected to grow by 6%, which is attributable to the increase in
mining activities and possible smelting operations near Leseding MTS.
The load in Limpopo is forecasted to grow steadily at about 4,1%, from 3 810 MW in 2019 to
5 896 MW by 2028. The load forecast for Limpopo is shown in Figure 6-8.
Figure 6-8: Limpopo load forecast
2019 2020 2021 2022 2023 2024 2025 2026 2027 2028 2029
Polokwane 1108 1132 1120 1156 1203 1484 1413 1452 1489 1546 1598
Lephalale 1301 1365 1551 1641 1741 1835 1944 1973 2027 2060 2101
Phalaborwa 1602 1802 1823 1876 1855 2310 2403 2489 2546 2600 2716
Limpopo Grid Peak 4011 4299 4494 4673 4799 5629 5760 5914 6062 6206 6415
Limpopo Grid (TOSP) 3810 4084 4269 4439 4559 5348 5472 5618 5759 5896 6094
0
1000
2000
3000
4000
5000
6000
7000
MW
Limpopo load forecast
Transmission Development Plan 2019 to 2028 62
6.3.5 Major schemes
The TDP scheme projects for the province involves the integration of the Medupi Power
Station and extension of the 400 kV and 275 kV networks, which entails installation of
additional transformers at existing and new substations. The main schemes in Limpopo are
as follows:
Medupi transmission integration (400 kV and 765 kV)
The project is part of the original scope for Medupi Power Station integration into the grid. It
entails the construction of the following 400 kV and 765 kV lines from the vicinity of Medupi
Power Station to bulk power evacuation points in Polokwane CLN and North West.
Waterberg generation 400 kV stability enhancement
The following projects were later recommended due to future planned generation projects
around the Waterberg area. The projects were raised to ensure compliance with the grid
code in terms of transient stability.
• Construct 1 x 400 kV line from Medupi to Witkop (~200 km)
• Construct 1 x 400 kV line from Borutho to Silimela (~100 km)
Nzhelele 400 kV integration
The integration of 400 kV into Nzhelele is required to deload the Tabor and Spencer
Substations. The 400 kV supply to enable this project will be sourced from the Tabor and
Borutho Substations through two 400 kV lines.
Limpopo East corridor strengthening
The project entails building a new 110 km 400 kV line from the Foskor Substation to the
Spencer Substation and the establishment of 400/132 kV transformation at the Spencer
Substation. The project will also require the second Merensky-Foskor 275 kV line to be
operated at 400 kV. A new 400/275 kV transformation will be established at the Foskor
Substation.
Silimela Transmission Substation
A new transmission substation will be constructed next to the existing Wolwekraal
Distribution Substation to mitigate network constraints in the Mapoch and Kwaggafontein
areas beyond 2019. This new transmission substation will deload the Simplon Substation
and also supply the long-term future load growth in the south-western part of the Phalaborwa
CLN.
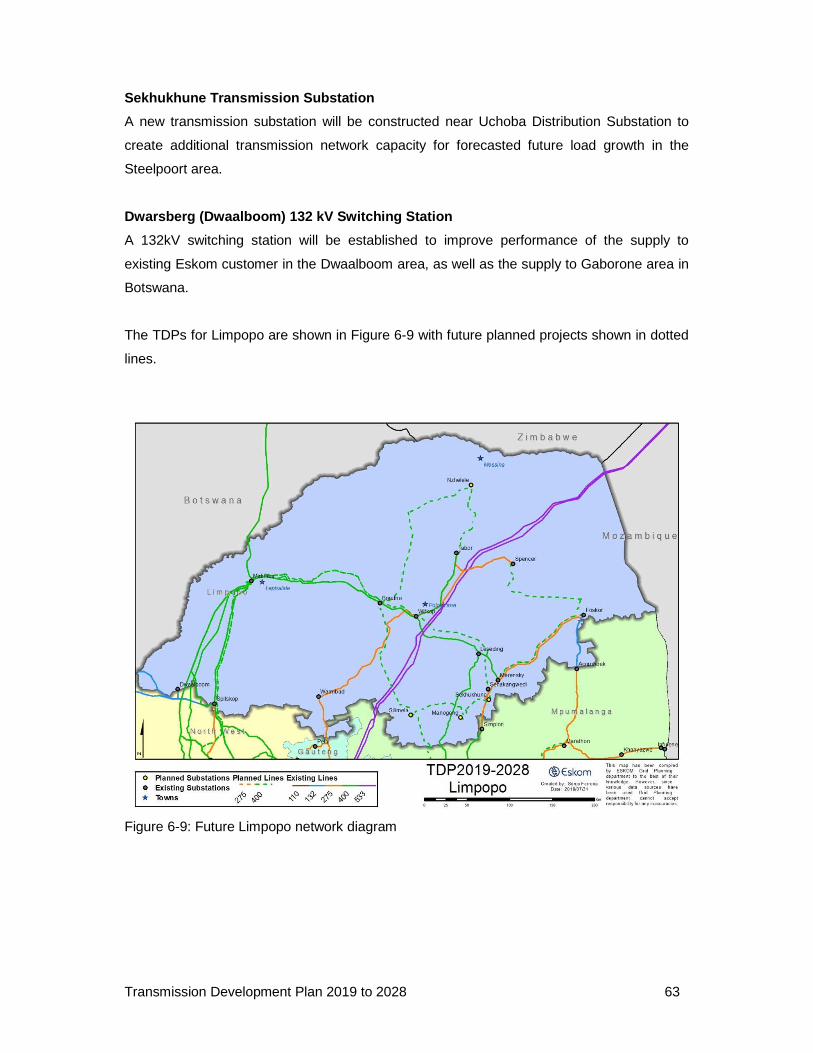
Transmission Development Plan 2019 to 2028 63
Sekhukhune Transmission Substation
A new transmission substation will be constructed near Uchoba Distribution Substation to
create additional transmission network capacity for forecasted future load growth in the
Steelpoort area.
Dwarsberg (Dwaalboom) 132 kV Switching Station
A 132kV switching station will be established to improve performance of the supply to
existing Eskom customer in the Dwaalboom area, as well as the supply to Gaborone area in
Botswana.
The TDPs for Limpopo are shown in Figure 6-9 with future planned projects shown in dotted
lines.
Figure 6-9: Future Limpopo network diagram
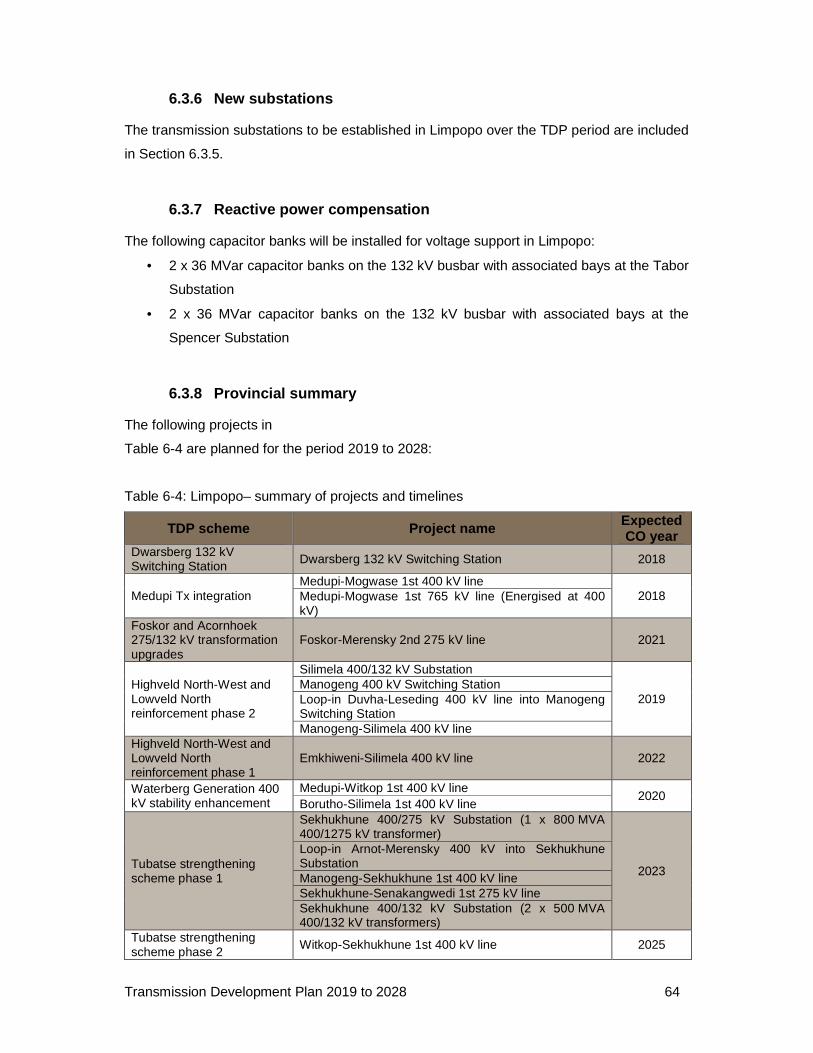
Transmission Development Plan 2019 to 2028 64
6.3.6 New substations
The transmission substations to be established in Limpopo over the TDP period are included
in Section 6.3.5.
6.3.7 Reactive power compensation
The following capacitor banks will be installed for voltage support in Limpopo:
• 2 x 36 MVar capacitor banks on the 132 kV busbar with associated bays at the Tabor
Substation
• 2 x 36 MVar capacitor banks on the 132 kV busbar with associated bays at the
Spencer Substation
6.3.8 Provincial summary
The following projects in
Table 6-4 are planned for the period 2019 to 2028:
Table 6-4: Limpopo– summary of projects and timelines
TDP scheme Project name Expected CO year
Dwarsberg 132 kV Switching Station Dwarsberg 132 kV Switching Station 2018
Medupi Tx integration Medupi-Mogwase 1st 400 kV line
2018 Medupi-Mogwase 1st 765 kV line (Energised at 400 kV)
Foskor and Acornhoek 275/132 kV transformation upgrades
Foskor-Merensky 2nd 275 kV line 2021
Highveld North-West and Lowveld North reinforcement phase 2
Silimela 400/132 kV Substation
2019 Manogeng 400 kV Switching Station Loop-in Duvha-Leseding 400 kV line into Manogeng Switching Station Manogeng-Silimela 400 kV line
Highveld North-West and Lowveld North reinforcement phase 1
Emkhiweni-Silimela 400 kV line 2022
Waterberg Generation 400 kV stability enhancement
Medupi-Witkop 1st 400 kV line 2020
Borutho-Silimela 1st 400 kV line
Tubatse strengthening scheme phase 1
Sekhukhune 400/275 kV Substation (1 x 800 MVA 400/1275 kV transformer)
2023
Loop-in Arnot-Merensky 400 kV into Sekhukhune Substation Manogeng-Sekhukhune 1st 400 kV line Sekhukhune-Senakangwedi 1st 275 kV line Sekhukhune 400/132 kV Substation (2 x 500 MVA 400/132 kV transformers)
Tubatse strengthening scheme phase 2
Witkop-Sekhukhune 1st 400 kV line 2025
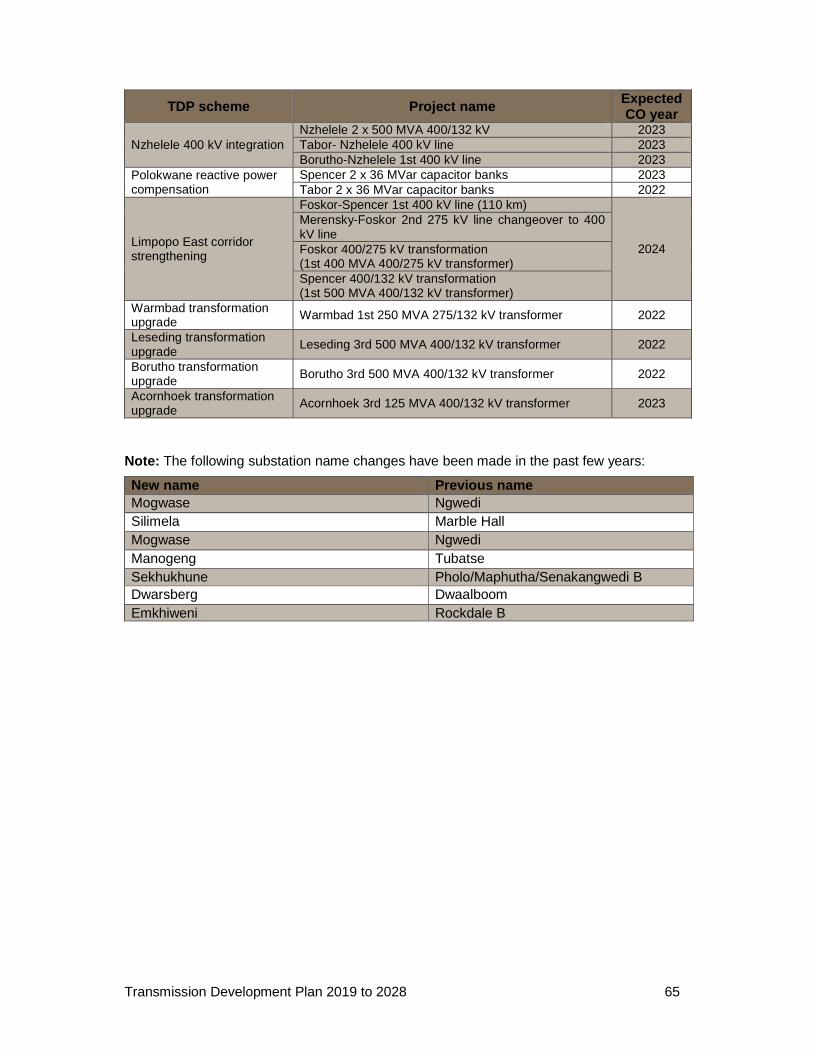
Transmission Development Plan 2019 to 2028 65
TDP scheme Project name Expected CO year
Nzhelele 400 kV integration Nzhelele 2 x 500 MVA 400/132 kV 2023 Tabor- Nzhelele 400 kV line 2023 Borutho-Nzhelele 1st 400 kV line 2023
Polokwane reactive power compensation
Spencer 2 x 36 MVar capacitor banks 2023 Tabor 2 x 36 MVar capacitor banks 2022
Limpopo East corridor strengthening
Foskor-Spencer 1st 400 kV line (110 km)
2024
Merensky-Foskor 2nd 275 kV line changeover to 400 kV line Foskor 400/275 kV transformation (1st 400 MVA 400/275 kV transformer) Spencer 400/132 kV transformation (1st 500 MVA 400/132 kV transformer)
Warmbad transformation upgrade Warmbad 1st 250 MVA 275/132 kV transformer 2022
Leseding transformation upgrade
Leseding 3rd 500 MVA 400/132 kV transformer 2022
Borutho transformation upgrade Borutho 3rd 500 MVA 400/132 kV transformer 2022
Acornhoek transformation upgrade Acornhoek 3rd 125 MVA 400/132 kV transformer 2023
Note: The following substation name changes have been made in the past few years:
New name Previous name Mogwase Ngwedi Silimela Marble Hall Mogwase Ngwedi Manogeng Tubatse Sekhukhune Pholo/Maphutha/Senakangwedi B Dwarsberg Dwaalboom Emkhiweni Rockdale B
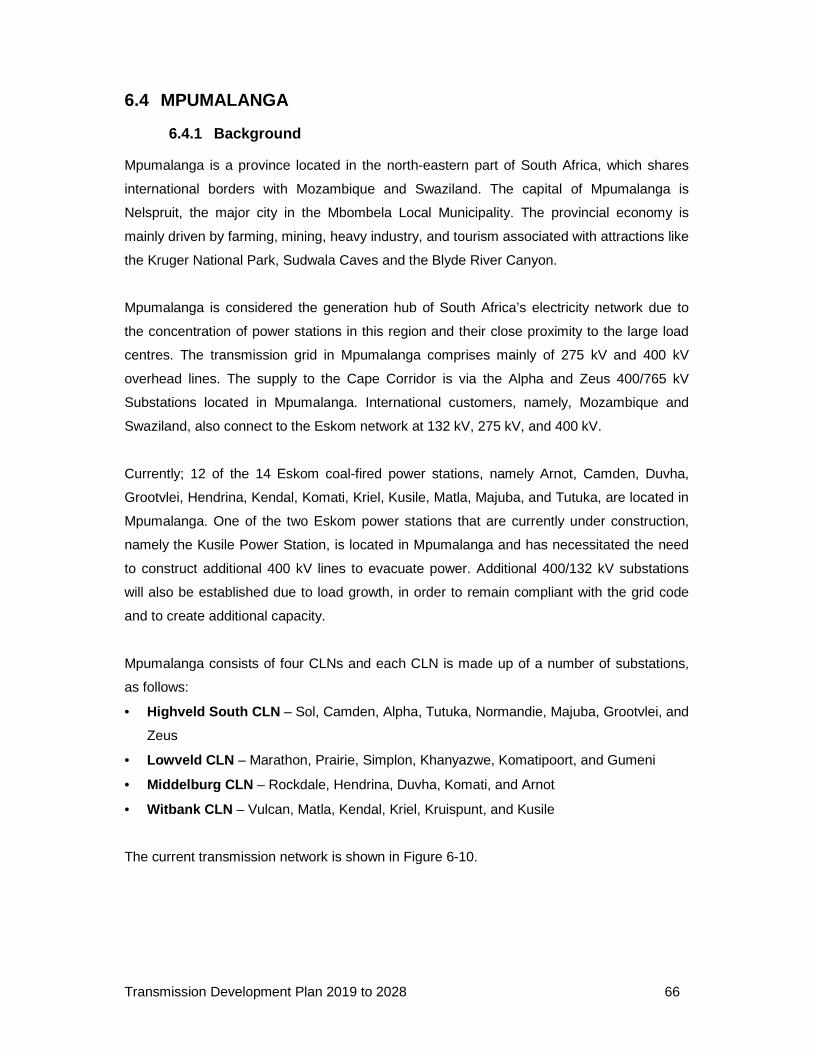
Transmission Development Plan 2019 to 2028 66
6.4 MPUMALANGA
6.4.1 Background
Mpumalanga is a province located in the north-eastern part of South Africa, which shares
international borders with Mozambique and Swaziland. The capital of Mpumalanga is
Nelspruit, the major city in the Mbombela Local Municipality. The provincial economy is
mainly driven by farming, mining, heavy industry, and tourism associated with attractions like
the Kruger National Park, Sudwala Caves and the Blyde River Canyon.
Mpumalanga is considered the generation hub of South Africa’s electricity network due to
the concentration of power stations in this region and their close proximity to the large load
centres. The transmission grid in Mpumalanga comprises mainly of 275 kV and 400 kV
overhead lines. The supply to the Cape Corridor is via the Alpha and Zeus 400/765 kV
Substations located in Mpumalanga. International customers, namely, Mozambique and
Swaziland, also connect to the Eskom network at 132 kV, 275 kV, and 400 kV.
Currently; 12 of the 14 Eskom coal-fired power stations, namely Arnot, Camden, Duvha,
Grootvlei, Hendrina, Kendal, Komati, Kriel, Kusile, Matla, Majuba, and Tutuka, are located in
Mpumalanga. One of the two Eskom power stations that are currently under construction,
namely the Kusile Power Station, is located in Mpumalanga and has necessitated the need
to construct additional 400 kV lines to evacuate power. Additional 400/132 kV substations
will also be established due to load growth, in order to remain compliant with the grid code
and to create additional capacity.
Mpumalanga consists of four CLNs and each CLN is made up of a number of substations,
as follows:
• Highveld South CLN – Sol, Camden, Alpha, Tutuka, Normandie, Majuba, Grootvlei, and
Zeus
• Lowveld CLN – Marathon, Prairie, Simplon, Khanyazwe, Komatipoort, and Gumeni
• Middelburg CLN – Rockdale, Hendrina, Duvha, Komati, and Arnot
• Witbank CLN – Vulcan, Matla, Kendal, Kriel, Kruispunt, and Kusile
The current transmission network is shown in Figure 6-10.
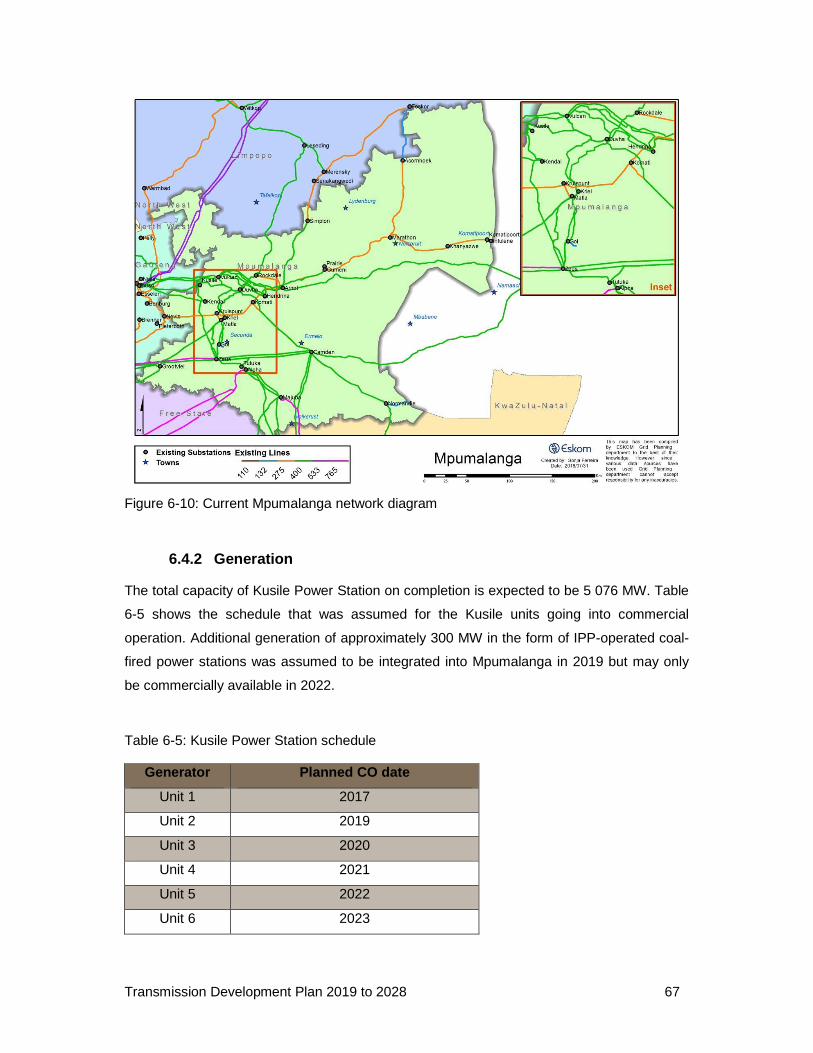
Transmission Development Plan 2019 to 2028 67
Figure 6-10: Current Mpumalanga network diagram
6.4.2 Generation
The total capacity of Kusile Power Station on completion is expected to be 5 076 MW. Table
6-5 shows the schedule that was assumed for the Kusile units going into commercial
operation. Additional generation of approximately 300 MW in the form of IPP-operated coal-
fired power stations was assumed to be integrated into Mpumalanga in 2019 but may only
be commercially available in 2022.
Table 6-5: Kusile Power Station schedule
Generator Planned CO date
Unit 1 2017
Unit 2 2019
Unit 3 2020
Unit 4 2021
Unit 5 2022
Unit 6 2023
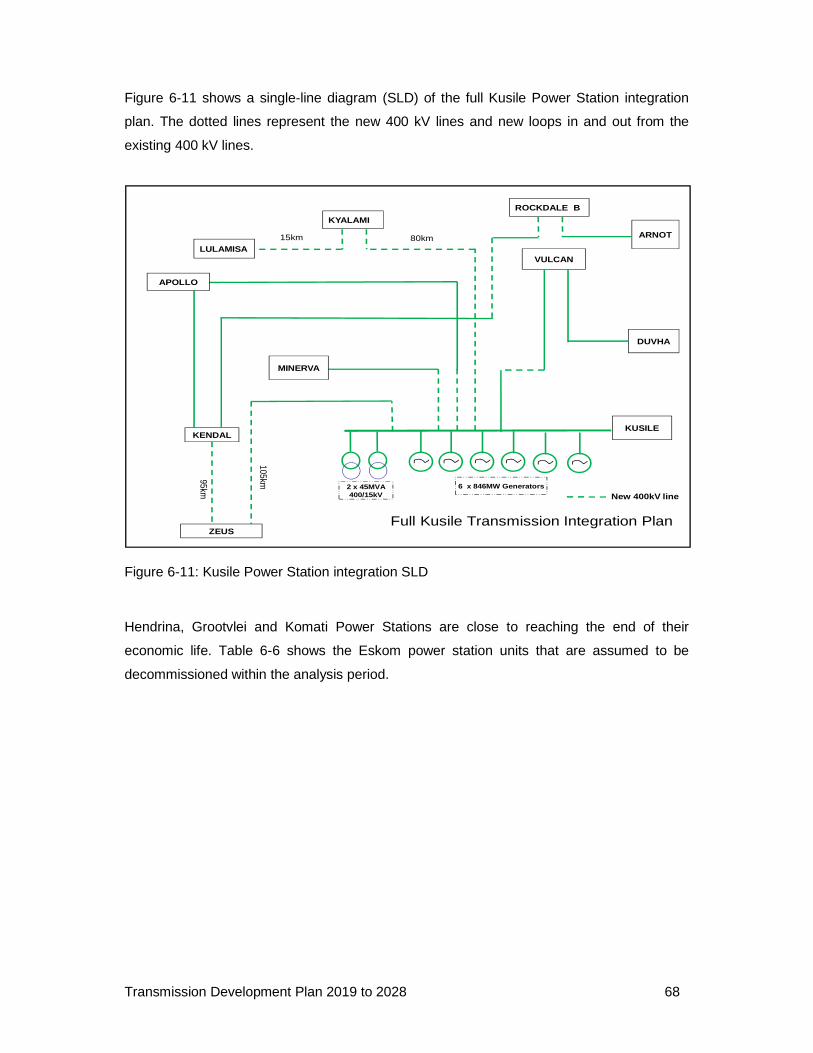
Transmission Development Plan 2019 to 2028 68
Figure 6-11 shows a single-line diagram (SLD) of the full Kusile Power Station integration
plan. The dotted lines represent the new 400 kV lines and new loops in and out from the
existing 400 kV lines.
Figure 6-11: Kusile Power Station integration SLD
Hendrina, Grootvlei and Komati Power Stations are close to reaching the end of their
economic life. Table 6-6 shows the Eskom power station units that are assumed to be
decommissioned within the analysis period.
MINERVA
2 x 45MVA400/15kV
KENDAL
VULCAN
DUVHA
ARNOT
LULAMISA
105km95km
ZEUS
APOLLO
Full Kusile Transmission Integration Plan
KYALAMI
KUSILE
ROCKDALE B
New 400kV line
80km15km
6 x 846MW Generators
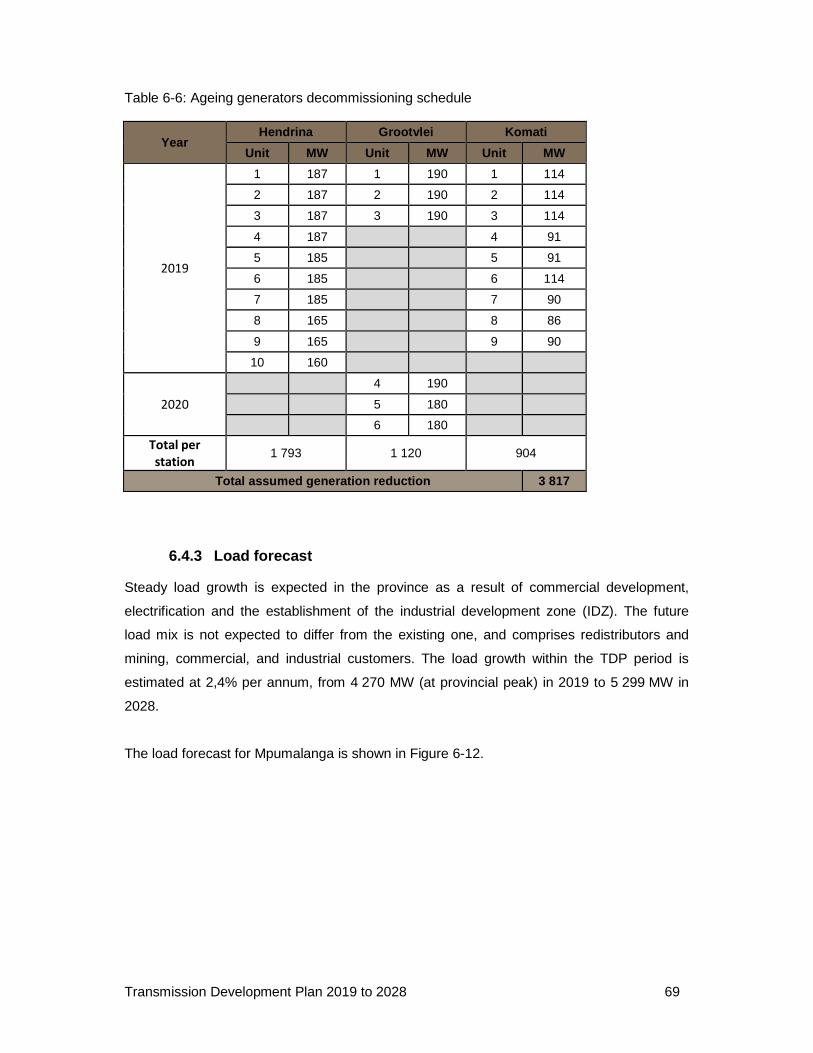
Transmission Development Plan 2019 to 2028 69
Table 6-6: Ageing generators decommissioning schedule
Year Hendrina Grootvlei Komati
Unit MW Unit MW Unit MW
2019
1 187 1 190 1 114
2 187 2 190 2 114
3 187 3 190 3 114
4 187 4 91
5 185 5 91
6 185 6 114
7 185 7 90
8 165 8 86
9 165 9 90
10 160
2020
4 190
5 180
6 180
Total per
station 1 793 1 120 904
Total assumed generation reduction 3 817
6.4.3 Load forecast
Steady load growth is expected in the province as a result of commercial development,
electrification and the establishment of the industrial development zone (IDZ). The future
load mix is not expected to differ from the existing one, and comprises redistributors and
mining, commercial, and industrial customers. The load growth within the TDP period is
estimated at 2,4% per annum, from 4 270 MW (at provincial peak) in 2019 to 5 299 MW in
2028.
The load forecast for Mpumalanga is shown in Figure 6-12.
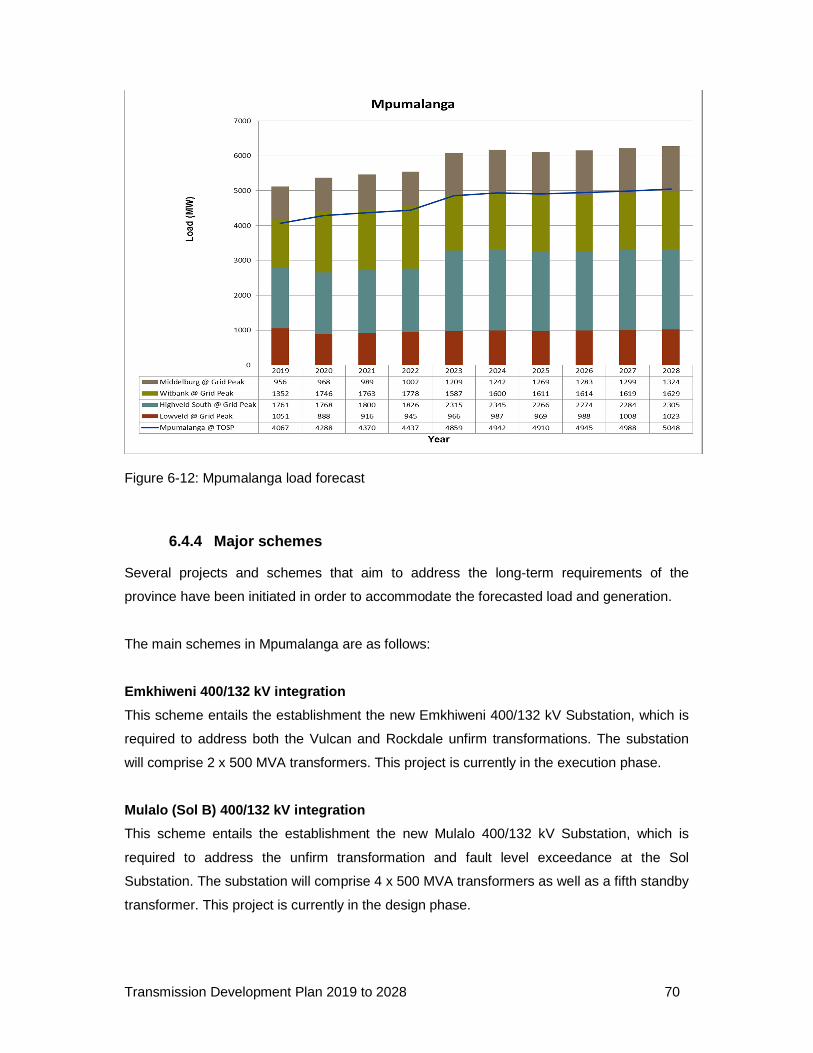
Transmission Development Plan 2019 to 2028 70
Figure 6-12: Mpumalanga load forecast
6.4.4 Major schemes
Several projects and schemes that aim to address the long-term requirements of the
province have been initiated in order to accommodate the forecasted load and generation.
The main schemes in Mpumalanga are as follows:
Emkhiweni 400/132 kV integration
This scheme entails the establishment the new Emkhiweni 400/132 kV Substation, which is
required to address both the Vulcan and Rockdale unfirm transformations. The substation
will comprise 2 x 500 MVA transformers. This project is currently in the execution phase.
Mulalo (Sol B) 400/132 kV integration
This scheme entails the establishment the new Mulalo 400/132 kV Substation, which is
required to address the unfirm transformation and fault level exceedance at the Sol
Substation. The substation will comprise 4 x 500 MVA transformers as well as a fifth standby
transformer. This project is currently in the design phase.
Transmission Development Plan 2019 to 2028 71
Marathon 400/132 kV integration
This project is required to address the low voltages under the loss of any 275 kV line in that
corridor. The scope of work for this phase is the following:
• Marathon 400/132 kV Substation (1st 500 MVA 400/132 kV transformer)
• Marathon-Gumeni 400 kV line
Underrated equipment
The underrated equipment at the transmission substations in Mpumalanga will be addressed
as follows:
Mpumalanga underrated equipment upgrade phase 1
• Equipment replacement at both ends of the following lines to ensure alignment with line
capacity:
o Apollo-Kendal 1 and 2 400 kV line
o Duvha-Minerva 400 kV line
o Duvha-Matla 400 kV line
o Kendal-Minerva 400 kV line
o Kriel-Zeus 400 kV line
Mpumalanga underrated equipment upgrade phase 2
• Upgrade of underrated equipment at the following substations:
o Vulcan 400 kV
o Rockdale 132 kV
o Hendrina 400 kV
o Kruispunt 132 kV
o Komati 275 kV
o Zeus 400 kV
o Arnot 400 kV and 275 kV
o Marathon 275 kV and 132 kV
Mpumalanga underrated equipment upgrade phase 3
• Equipment upgrades involving the following substations:
o Tutuka 400 kV
o Alpha 400 kV
o Majuba 400 kV
o Matla 275 kV, as well as FCLRs
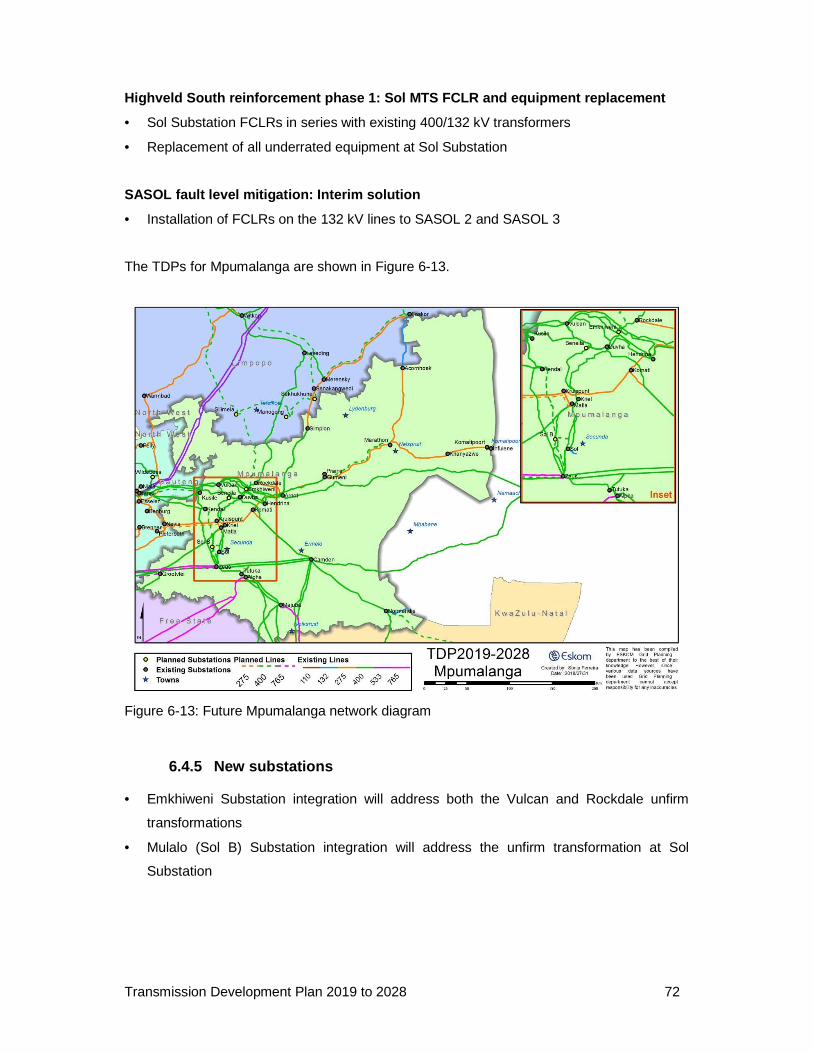
Transmission Development Plan 2019 to 2028 72
Highveld South reinforcement phase 1: Sol MTS FCLR and equipment replacement
• Sol Substation FCLRs in series with existing 400/132 kV transformers
• Replacement of all underrated equipment at Sol Substation
SASOL fault level mitigation: Interim solution
• Installation of FCLRs on the 132 kV lines to SASOL 2 and SASOL 3
The TDPs for Mpumalanga are shown in Figure 6-13.
Figure 6-13: Future Mpumalanga network diagram
6.4.5 New substations
• Emkhiweni Substation integration will address both the Vulcan and Rockdale unfirm
transformations
• Mulalo (Sol B) Substation integration will address the unfirm transformation at Sol
Substation
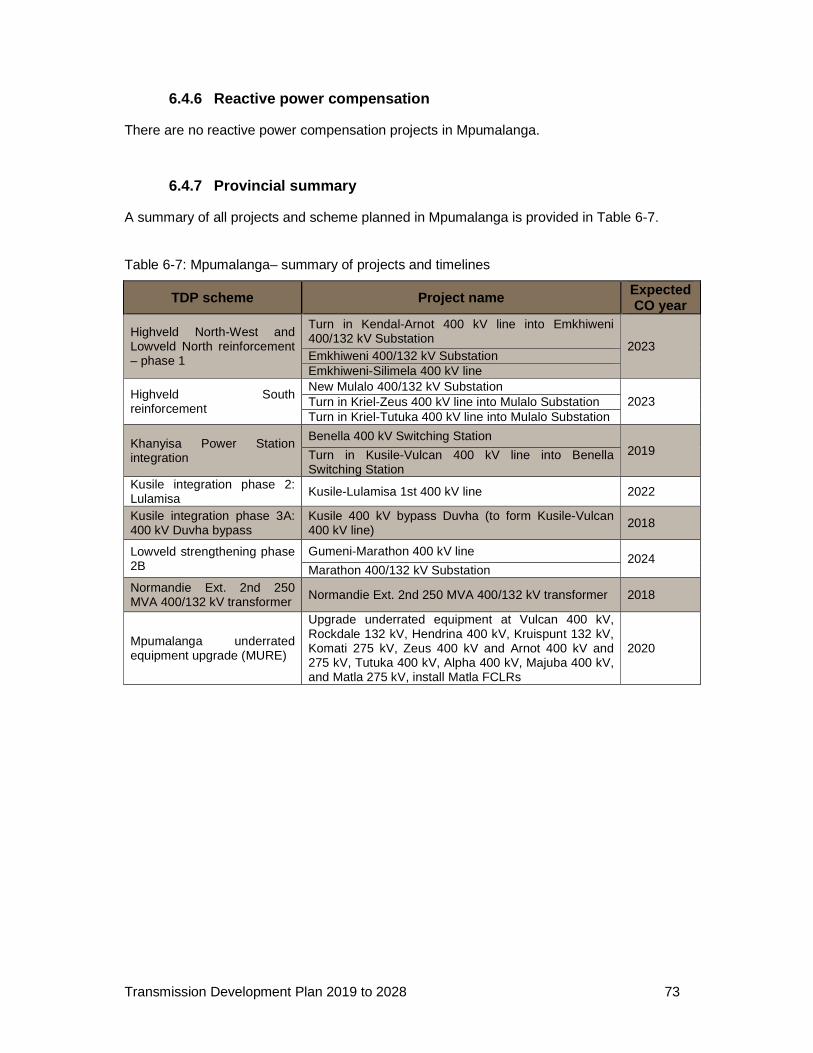
Transmission Development Plan 2019 to 2028 73
6.4.6 Reactive power compensation
There are no reactive power compensation projects in Mpumalanga.
6.4.7 Provincial summary
A summary of all projects and scheme planned in Mpumalanga is provided in Table 6-7.
Table 6-7: Mpumalanga– summary of projects and timelines
TDP scheme Project name Expected CO year
Highveld North-West and Lowveld North reinforcement – phase 1
Turn in Kendal-Arnot 400 kV line into Emkhiweni 400/132 kV Substation
2023 Emkhiweni 400/132 kV Substation Emkhiweni-Silimela 400 kV line
Highveld South reinforcement
New Mulalo 400/132 kV Substation 2023 Turn in Kriel-Zeus 400 kV line into Mulalo Substation
Turn in Kriel-Tutuka 400 kV line into Mulalo Substation
Khanyisa Power Station integration
Benella 400 kV Switching Station 2019 Turn in Kusile-Vulcan 400 kV line into Benella
Switching Station Kusile integration phase 2: Lulamisa Kusile-Lulamisa 1st 400 kV line 2022
Kusile integration phase 3A: 400 kV Duvha bypass
Kusile 400 kV bypass Duvha (to form Kusile-Vulcan 400 kV line) 2018
Lowveld strengthening phase 2B
Gumeni-Marathon 400 kV line 2024
Marathon 400/132 kV Substation Normandie Ext. 2nd 250 MVA 400/132 kV transformer Normandie Ext. 2nd 250 MVA 400/132 kV transformer 2018
Mpumalanga underrated equipment upgrade (MURE)
Upgrade underrated equipment at Vulcan 400 kV, Rockdale 132 kV, Hendrina 400 kV, Kruispunt 132 kV, Komati 275 kV, Zeus 400 kV and Arnot 400 kV and 275 kV, Tutuka 400 kV, Alpha 400 kV, Majuba 400 kV, and Matla 275 kV, install Matla FCLRs
2020
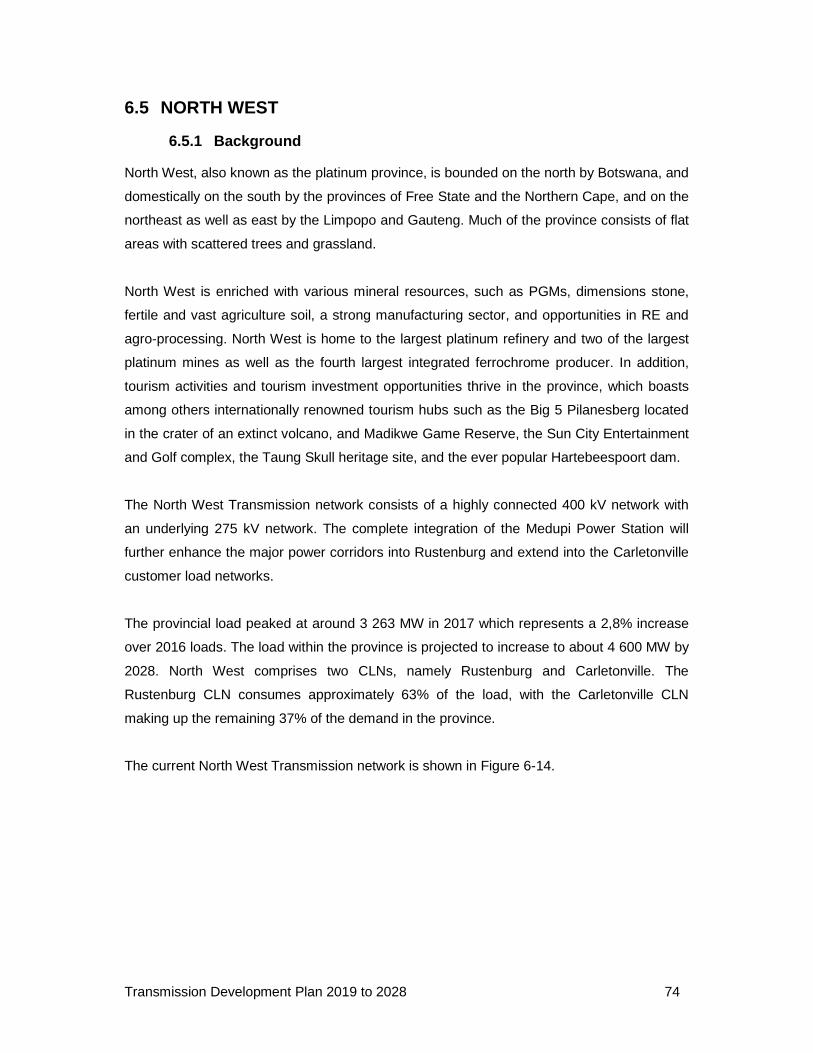
Transmission Development Plan 2019 to 2028 74
6.5 NORTH WEST
6.5.1 Background
North West, also known as the platinum province, is bounded on the north by Botswana, and
domestically on the south by the provinces of Free State and the Northern Cape, and on the
northeast as well as east by the Limpopo and Gauteng. Much of the province consists of flat
areas with scattered trees and grassland.
North West is enriched with various mineral resources, such as PGMs, dimensions stone,
fertile and vast agriculture soil, a strong manufacturing sector, and opportunities in RE and
agro-processing. North West is home to the largest platinum refinery and two of the largest
platinum mines as well as the fourth largest integrated ferrochrome producer. In addition,
tourism activities and tourism investment opportunities thrive in the province, which boasts
among others internationally renowned tourism hubs such as the Big 5 Pilanesberg located
in the crater of an extinct volcano, and Madikwe Game Reserve, the Sun City Entertainment
and Golf complex, the Taung Skull heritage site, and the ever popular Hartebeespoort dam.
The North West Transmission network consists of a highly connected 400 kV network with
an underlying 275 kV network. The complete integration of the Medupi Power Station will
further enhance the major power corridors into Rustenburg and extend into the Carletonville
customer load networks.
The provincial load peaked at around 3 263 MW in 2017 which represents a 2,8% increase
over 2016 loads. The load within the province is projected to increase to about 4 600 MW by
2028. North West comprises two CLNs, namely Rustenburg and Carletonville. The
Rustenburg CLN consumes approximately 63% of the load, with the Carletonville CLN
making up the remaining 37% of the demand in the province.
The current North West Transmission network is shown in Figure 6-14.
Transmission Development Plan 2019 to 2028 75
Figure 6-14: Current North West network diagram
6.5.2 Generati on
There are no power stations within North West. All the power consumed within this province
is sourced from power stations in Limpopo and Mpumalanga. The load flows will change
after the integration of the Medupi Power Station and most of the power into North West will
be supplied from Limpopo.
6.5.2.1 RE generation
There are no major RE generation plants in North West. As of 30 June 2018, only 7 MW of
PV power generation was integrated into North West. There are four RE projects that were
signed as part of the REIPPPP bid 4B. These projects will result in an additional 268 MW of
PV generation in North West. Table 6-8 shows the approved projects in North West under
REIPPPP bid 4B.
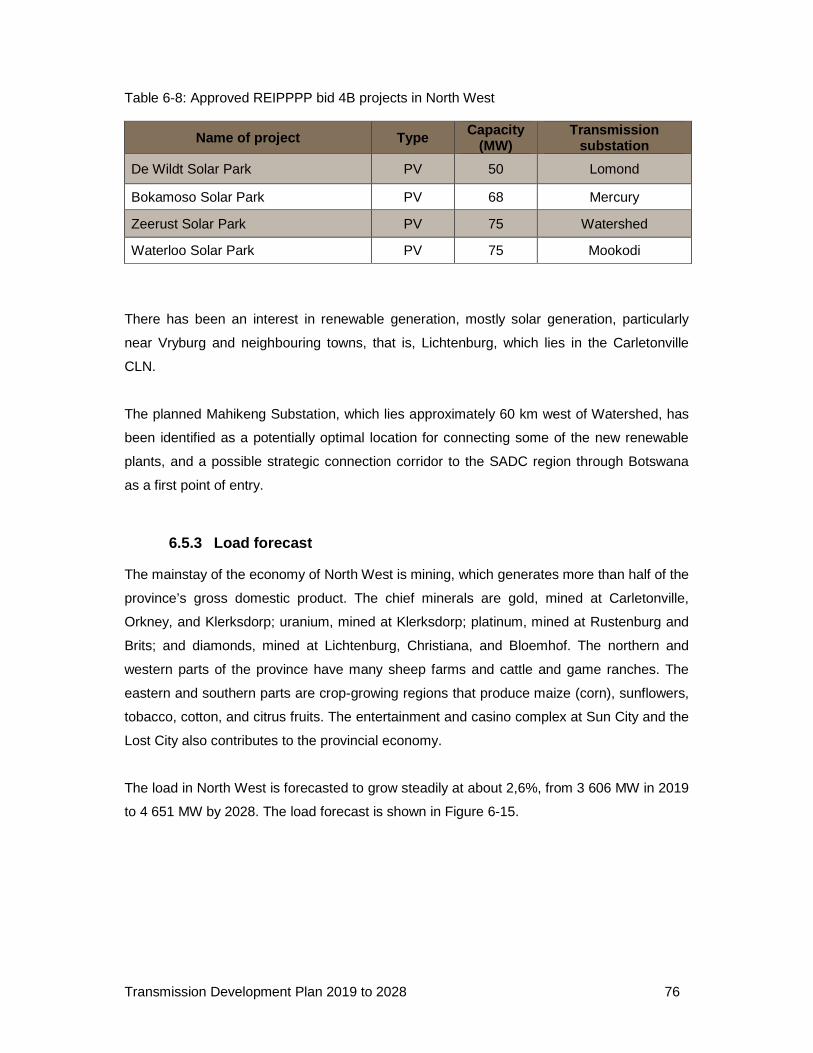
Transmission Development Plan 2019 to 2028 76
Table 6-8: Approved REIPPPP bid 4B projects in North West
Name of project Type Capacity (MW)
Transmission substation
De Wildt Solar Park PV 50 Lomond
Bokamoso Solar Park PV 68 Mercury
Zeerust Solar Park PV 75 Watershed
Waterloo Solar Park PV 75 Mookodi
There has been an interest in renewable generation, mostly solar generation, particularly
near Vryburg and neighbouring towns, that is, Lichtenburg, which lies in the Carletonville
CLN.
The planned Mahikeng Substation, which lies approximately 60 km west of Watershed, has
been identified as a potentially optimal location for connecting some of the new renewable
plants, and a possible strategic connection corridor to the SADC region through Botswana
as a first point of entry.
6.5.3 Load forecast
The mainstay of the economy of North West is mining, which generates more than half of the
province’s gross domestic product. The chief minerals are gold, mined at Carletonville,
Orkney, and Klerksdorp; uranium, mined at Klerksdorp; platinum, mined at Rustenburg and
Brits; and diamonds, mined at Lichtenburg, Christiana, and Bloemhof. The northern and
western parts of the province have many sheep farms and cattle and game ranches. The
eastern and southern parts are crop-growing regions that produce maize (corn), sunflowers,
tobacco, cotton, and citrus fruits. The entertainment and casino complex at Sun City and the
Lost City also contributes to the provincial economy.
The load in North West is forecasted to grow steadily at about 2,6%, from 3 606 MW in 2019
to 4 651 MW by 2028. The load forecast is shown in Figure 6-15.

Transmission Development Plan 2019 to 2028 77
Figure 6-15: North West load forecast
6.5.4 Major schemes
Several projects and schemes have been initiated to meet and cater for the forecasted load
demand and generation integration in the province. The following major schemes are
planned for the 2019 to 2028 period:
Rustenburg strengthening phase 2
Rustenburg strengthening phase 2 refers to the extension of Marang Substation, which will
introduce a 132 kV voltage level at the Marang Substation. The Distribution network will also
be upgraded from 88 kV to 132 kV in conjunction with the introduction of a 132 kV line at the
Marang Substation.
Rustenburg strengthening phase 3
The scheme is expected to address low voltages in the Rustenburg CLN under the N-1 loss
of the Medupi-Marang 400 kV line. The low voltages at Marang, Bighorn and Dinaledi
Substations will be addressed by installing shunt capacitors at those respective substations
that will also provide reactive power support in the Rustenburg CLN.
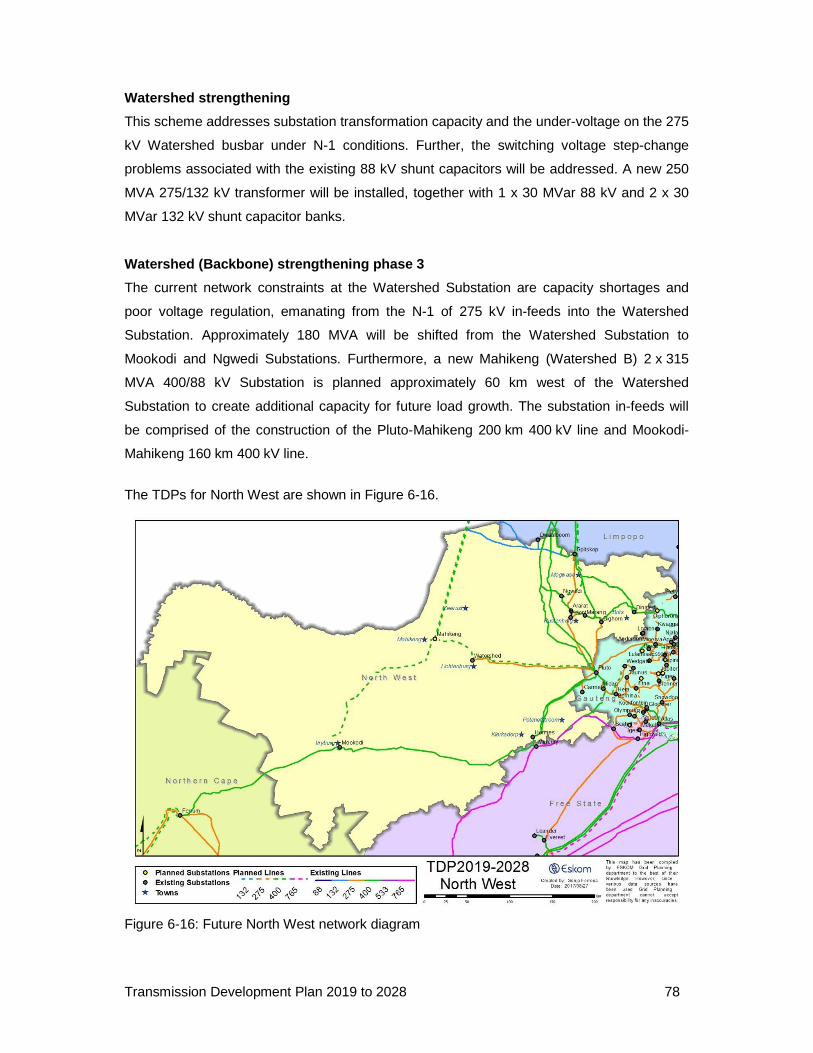
Transmission Development Plan 2019 to 2028 78
Watershed strengthening
This scheme addresses substation transformation capacity and the under-voltage on the 275
kV Watershed busbar under N-1 conditions. Further, the switching voltage step-change
problems associated with the existing 88 kV shunt capacitors will be addressed. A new 250
MVA 275/132 kV transformer will be installed, together with 1 x 30 MVar 88 kV and 2 x 30
MVar 132 kV shunt capacitor banks.
Watershed (Backbone) strengthening phase 3
The current network constraints at the Watershed Substation are capacity shortages and
poor voltage regulation, emanating from the N-1 of 275 kV in-feeds into the Watershed
Substation. Approximately 180 MVA will be shifted from the Watershed Substation to
Mookodi and Ngwedi Substations. Furthermore, a new Mahikeng (Watershed B) 2 x 315
MVA 400/88 kV Substation is planned approximately 60 km west of the Watershed
Substation to create additional capacity for future load growth. The substation in-feeds will
be comprised of the construction of the Pluto-Mahikeng 200 km 400 kV line and Mookodi-
Mahikeng 160 km 400 kV line.
The TDPs for North West are shown in Figure 6-16.
Figure 6-16: Future North West network diagram
Transmission Development Plan 2019 to 2028 79
6.5.5 New substations
Load growth in Mahikeng will necessitate introduction of the new Mahikeng 400/88 kV
Substation to create additional capacity for future load growth:
6.5.6 Reactive power compensation
The following capacitor banks will be installed for voltage support in North West:
• Watershed Substation 88 kV reactive power compensation (1 x 30 MVar shunt
capacitor bank)
• Watershed Substation 132 kV reactive power compensation (2 x 30 MVar shunt
capacitor banks)
• Bighorn reactive power compensation (2 x 72 MVar 132 kV and 3 x 48 MVar 88 kV
shunt capacitor banks)
• Marang reactive power compensation (5 x 48 MVar 88 kV shunt capacitor banks)
• Dinaledi reactive power compensation (3 x 72 MVar 88 kV shunt capacitor banks)
6.5.7 Provincial summary
A summary of all projects and scheme planned in North West is provided in Table 6-9.
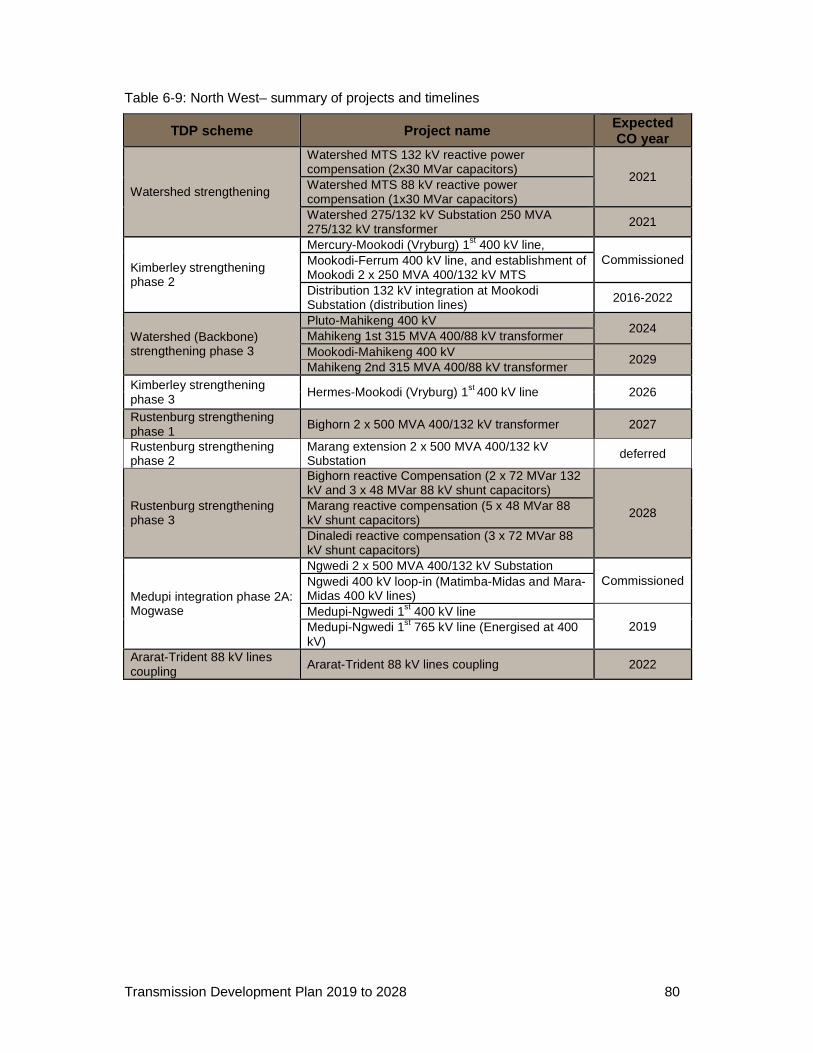
Transmission Development Plan 2019 to 2028 80
Table 6-9: North West– summary of projects and timelines
TDP scheme Project name Expected CO year
Watershed strengthening
Watershed MTS 132 kV reactive power compensation (2x30 MVar capacitors)
2021 Watershed MTS 88 kV reactive power compensation (1x30 MVar capacitors) Watershed 275/132 kV Substation 250 MVA 275/132 kV transformer
2021
Kimberley strengthening phase 2
Mercury-Mookodi (Vryburg) 1st 400 kV line, Commissioned Mookodi-Ferrum 400 kV line, and establishment of
Mookodi 2 x 250 MVA 400/132 kV MTS Distribution 132 kV integration at Mookodi Substation (distribution lines) 2016-2022
Watershed (Backbone) strengthening phase 3
Pluto-Mahikeng 400 kV 2024
Mahikeng 1st 315 MVA 400/88 kV transformer Mookodi-Mahikeng 400 kV
2029 Mahikeng 2nd 315 MVA 400/88 kV transformer
Kimberley strengthening phase 3
Hermes-Mookodi (Vryburg) 1st 400 kV line 2026
Rustenburg strengthening phase 1 Bighorn 2 x 500 MVA 400/132 kV transformer 2027
Rustenburg strengthening phase 2
Marang extension 2 x 500 MVA 400/132 kV Substation deferred
Rustenburg strengthening phase 3
Bighorn reactive Compensation (2 x 72 MVar 132 kV and 3 x 48 MVar 88 kV shunt capacitors)
2028 Marang reactive compensation (5 x 48 MVar 88 kV shunt capacitors) Dinaledi reactive compensation (3 x 72 MVar 88 kV shunt capacitors)
Medupi integration phase 2A: Mogwase
Ngwedi 2 x 500 MVA 400/132 kV Substation Commissioned Ngwedi 400 kV loop-in (Matimba-Midas and Mara-
Midas 400 kV lines) Medupi-Ngwedi 1st 400 kV line
2019 Medupi-Ngwedi 1st 765 kV line (Energised at 400 kV)
Ararat-Trident 88 kV lines coupling Ararat-Trident 88 kV lines coupling 2022
Transmission Development Plan 2019 to 2028 81
6.6 FREE STATE
6.6.1 Background
Free State is South Africa’s most centrally located province and has Bloemfontein as its
capital. It has borders with most other provinces and has Lesotho as its eastern neighbour.
For many decades, mining and agriculture were the bedrock of the economy in the province,
but the mining sector’s productivity has been on a steady decline. This has a negative
impact on the economy and the employment numbers.
Important road and rail links traverse the province, including two of the busiest national
highways, the N1 (Cape Town-Johannesburg) and the N3 (Durban-Johannesburg). There
are plans to leverage this advantage through the creation of development corridors, the
promotion of manufacturing, warehousing, and storage opportunities. The Harrismith
Logistics Hub (HLH) on the N3 is at the centre of these plans. The Free State Development
Corporation (FDC) is actively searching for investors in areas such as Harrismith and
Botshabelo.
The provincial load peaked at around 1 524 MW in 2017, and it is expected to increase to
about 2 298 MW by 2029. Free State comprises three CLNs, namely Sasolburg,
Bloemfontein, and Welkom. The Welkom CLN consumes approximately 47% of the load.
The Sasolburg and Bloemfontein CLNs make up the remaining 53% of the demand in the
province. The province has a number of development plans, including a number of public
infrastructure delivery projects. These programmes will not only improve services, but will
also benefit local suppliers and boost the construction sector. The current transmission
network is shown in
Figure 6-17.
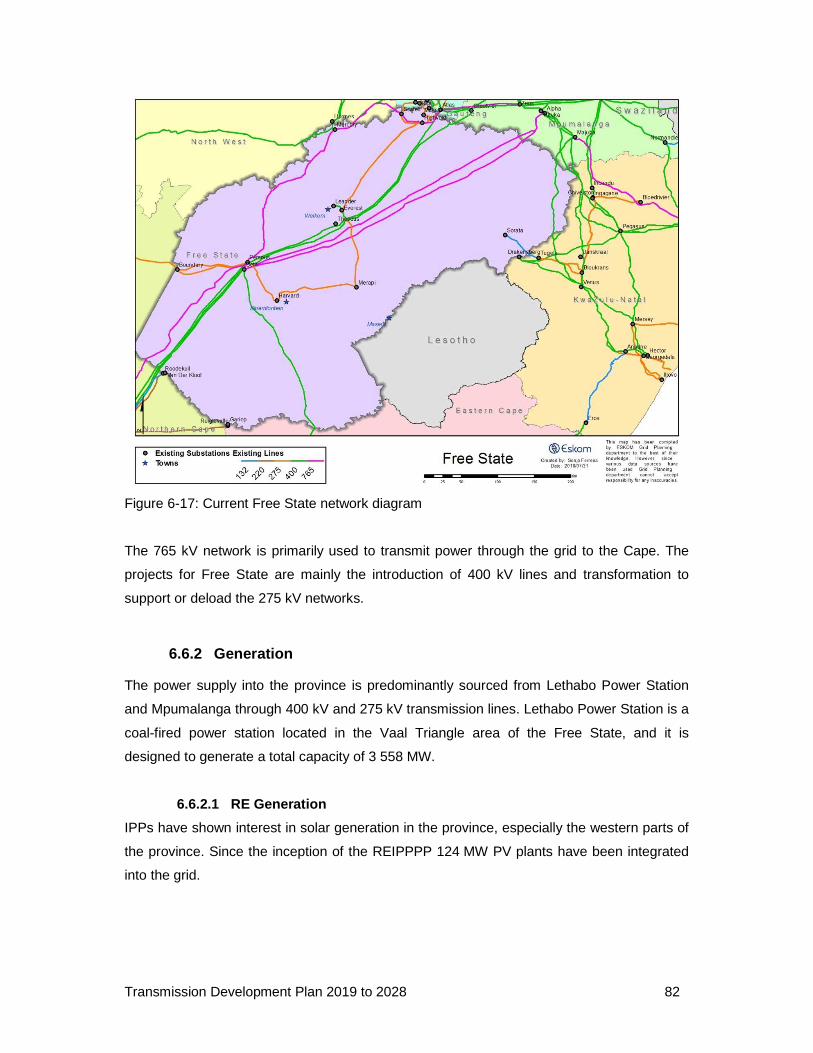
Transmission Development Plan 2019 to 2028 82
Figure 6-17: Current Free State network diagram
The 765 kV network is primarily used to transmit power through the grid to the Cape. The
projects for Free State are mainly the introduction of 400 kV lines and transformation to
support or deload the 275 kV networks.
6.6.2 Generation
The power supply into the province is predominantly sourced from Lethabo Power Station
and Mpumalanga through 400 kV and 275 kV transmission lines. Lethabo Power Station is a
coal-fired power station located in the Vaal Triangle area of the Free State, and it is
designed to generate a total capacity of 3 558 MW.
6.6.2.1 RE Generation
IPPs have shown interest in solar generation in the province, especially the western parts of
the province. Since the inception of the REIPPPP 124 MW PV plants have been integrated
into the grid.
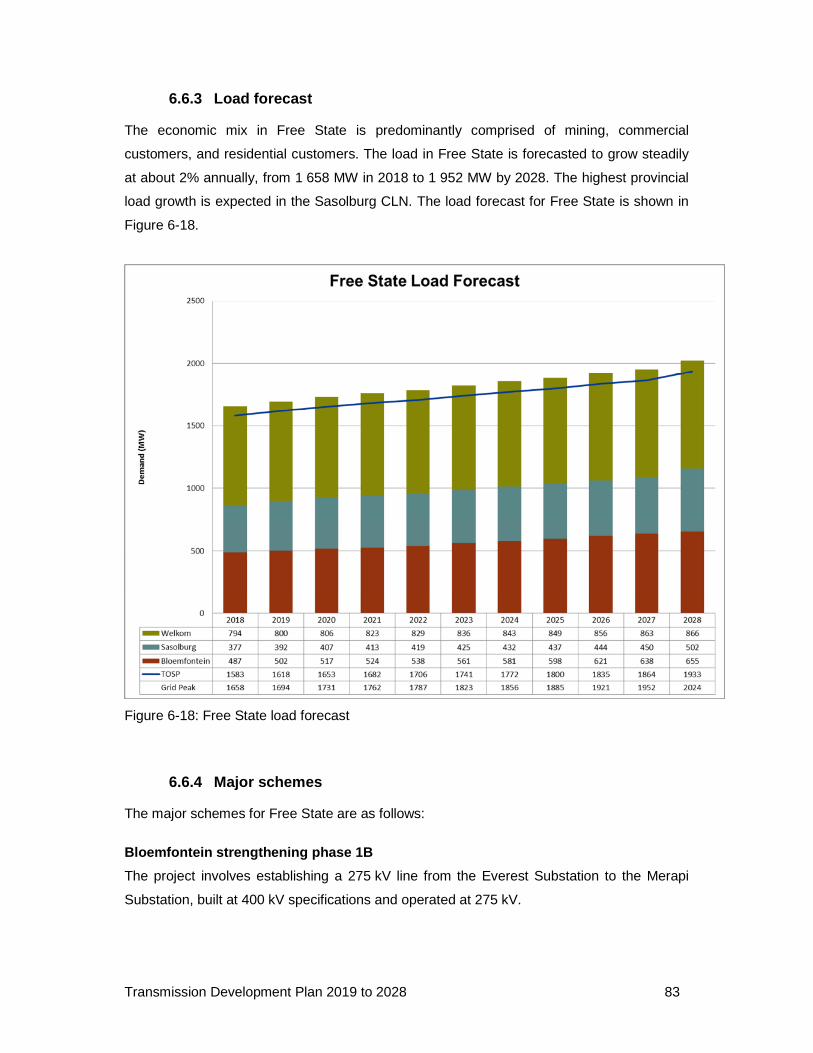
Transmission Development Plan 2019 to 2028 83
6.6.3 Load forecast
The economic mix in Free State is predominantly comprised of mining, commercial
customers, and residential customers. The load in Free State is forecasted to grow steadily
at about 2% annually, from 1 658 MW in 2018 to 1 952 MW by 2028. The highest provincial
load growth is expected in the Sasolburg CLN. The load forecast for Free State is shown in
Figure 6-18.
Figure 6-18: Free State load forecast
6.6.4 Major schemes
The major schemes for Free State are as follows:
Bloemfontein strengthening phase 1B
The project involves establishing a 275 kV line from the Everest Substation to the Merapi
Substation, built at 400 kV specifications and operated at 275 kV.
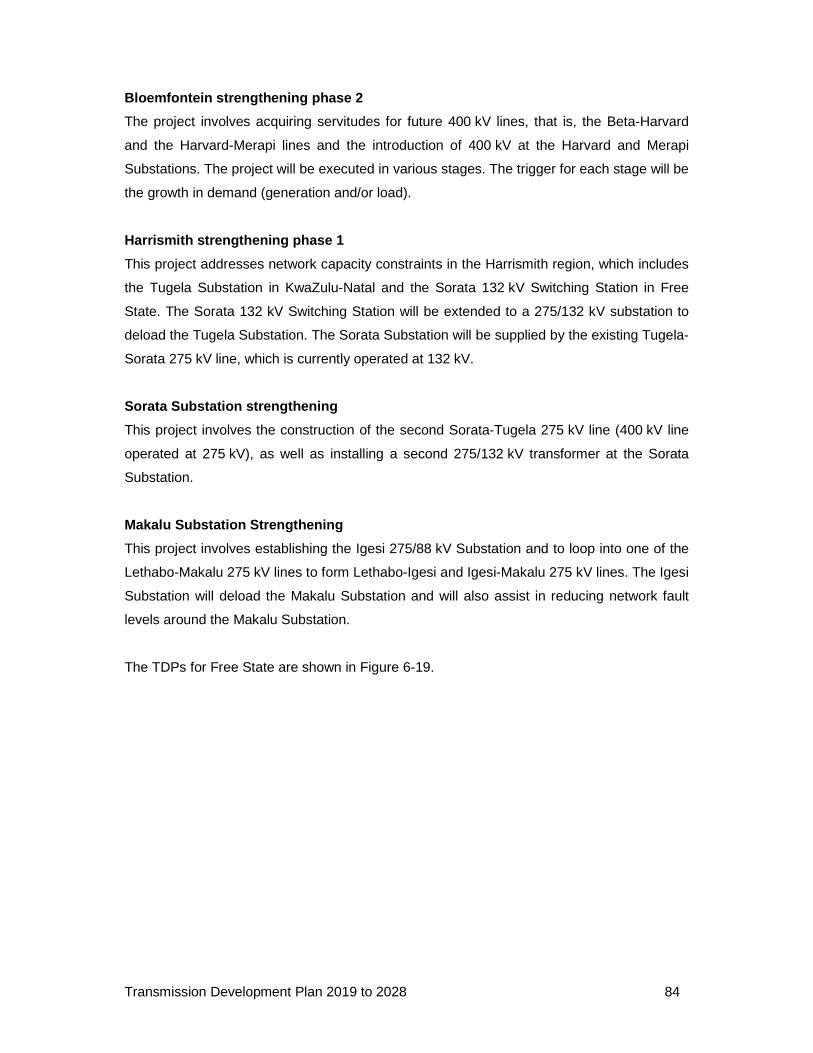
Transmission Development Plan 2019 to 2028 84
Bloemfontein strengthening phase 2
The project involves acquiring servitudes for future 400 kV lines, that is, the Beta-Harvard
and the Harvard-Merapi lines and the introduction of 400 kV at the Harvard and Merapi
Substations. The project will be executed in various stages. The trigger for each stage will be
the growth in demand (generation and/or load).
Harrismith strengthening phase 1
This project addresses network capacity constraints in the Harrismith region, which includes
the Tugela Substation in KwaZulu-Natal and the Sorata 132 kV Switching Station in Free
State. The Sorata 132 kV Switching Station will be extended to a 275/132 kV substation to
deload the Tugela Substation. The Sorata Substation will be supplied by the existing Tugela-
Sorata 275 kV line, which is currently operated at 132 kV.
Sorata Substation strengthening
This project involves the construction of the second Sorata-Tugela 275 kV line (400 kV line
operated at 275 kV), as well as installing a second 275/132 kV transformer at the Sorata
Substation.
Makalu Substation Strengthening
This project involves establishing the Igesi 275/88 kV Substation and to loop into one of the
Lethabo-Makalu 275 kV lines to form Lethabo-Igesi and Igesi-Makalu 275 kV lines. The Igesi
Substation will deload the Makalu Substation and will also assist in reducing network fault
levels around the Makalu Substation.
The TDPs for Free State are shown in Figure 6-19.
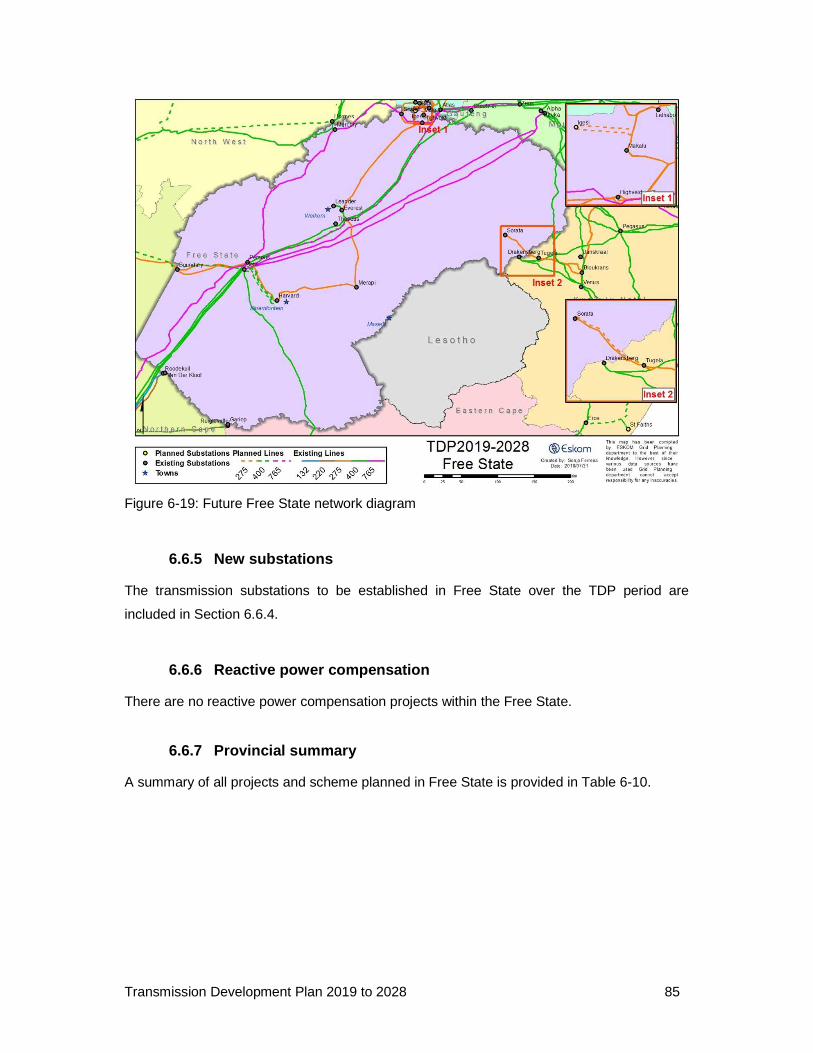
Transmission Development Plan 2019 to 2028 85
Figure 6-19: Future Free State network diagram
6.6.5 New substations
The transmission substations to be established in Free State over the TDP period are
included in Section 6.6.4.
6.6.6 Reactive power compensation
There are no reactive power compensation projects within the Free State.
6.6.7 Provincial summary
A summary of all projects and scheme planned in Free State is provided in Table 6-10.
Transmission Development Plan 2019 to 2028 86
Table 6-10: Free State– summary of projects and timelines
TDP scheme Project name Expected CO year
Bloemfontein strengthening phase 1B • Everest-Merapi 400 kV line (operated at 275 kV) 2020
Bloemfontein strengthening phase 2
• 2 x Beta-Harvard 400 kV lines • 2 x 500 MVA 400/132 kV Harvard Substation • Harvard–Merapi 400 kV line • 2 x 500 MVA 400/132 kV Merapi Substation
2028
Harrismith strengthening phase 1
• Sorata 1st 275/132 kV 250 MVA transformer, operate Tugela-Sorata at 275 kV
• Sorata 400 kV busbar (operated at 275 kV) 2021
Makalu strengthening
• Establish 2 x 315 MVA 275/88 kV Igesi Substation • Loop-in one of Lethabo-Makalu 275 kV lines into
Igesi Substation • Refurbishment of existing Makalu Substation
2024
Sorata Substation strengthening
• Recycle Groenkop-Tugela 132 kV line 1 and construct Sorata-Tugela 400 kV line (operated at 275 kV). Estimated line length is 60 km
• Sorata 2nd 275/132 kV 250 MVA transformer
2028
Transmission Development Plan 2019 to 2028 87
6.7 NORTHERN CAPE
6.7.1 Background
Northern Cape is situated in the northwest part of South Africa and is the largest province by
landmass as well as being the most sparsely populated province in South Africa. It has
Kimberley as its capital. The majority of economic activity is concentrated in Kimberley and
Upington, which are located to the east and northern region of the province respectively. The
landscape of the Northern Cape provides the perfect environment for the high- and medium-
frequency arrays, which has made it the preferred location for the world’s largest telescope,
the Square Kilometre Array (SKA). It also consists of vast tracts of land with good sunshine.
For that reason, it has attracted the most solar PV and CSP projects of all the provinces in
South Africa. Furthermore, the increased interest in mining operations in the Kimberley area
is expected to increase the demand for electricity in the province.
The provincial load peaked at 980 MW in 2019 and it is expected to increase to about
1 479 MW by 2028. The Northern Cape comprises four CLNs, namely Kimberley, Karoo,
Namaqualand, and West Coast. Kimberley CLN is the main load centre in the province,
consuming approximately 52 % of the load. Karoo, Namaqualand, and West Coast CLNs
make up the remaining 48% of the demand in the province. Kimberley is supplied by means
of the 275 kV network at Ferrum and Namaqualand by a radial 275 kV network supported by
the 400 kV line from North West. The traditionally weak radial transmission network, high
demand growth together with the high potential for the development of generation from
Renewable Energy Sources (RES) makes Northern Cape the centre of network
development activities within this planning horizon. The introduction of tie Nieuwehoop
Substation will link the Aries and Ferrum 400 kV networks in order to strengthen the TS in
the province.
The current transmission network is shown in Figure 6-20.
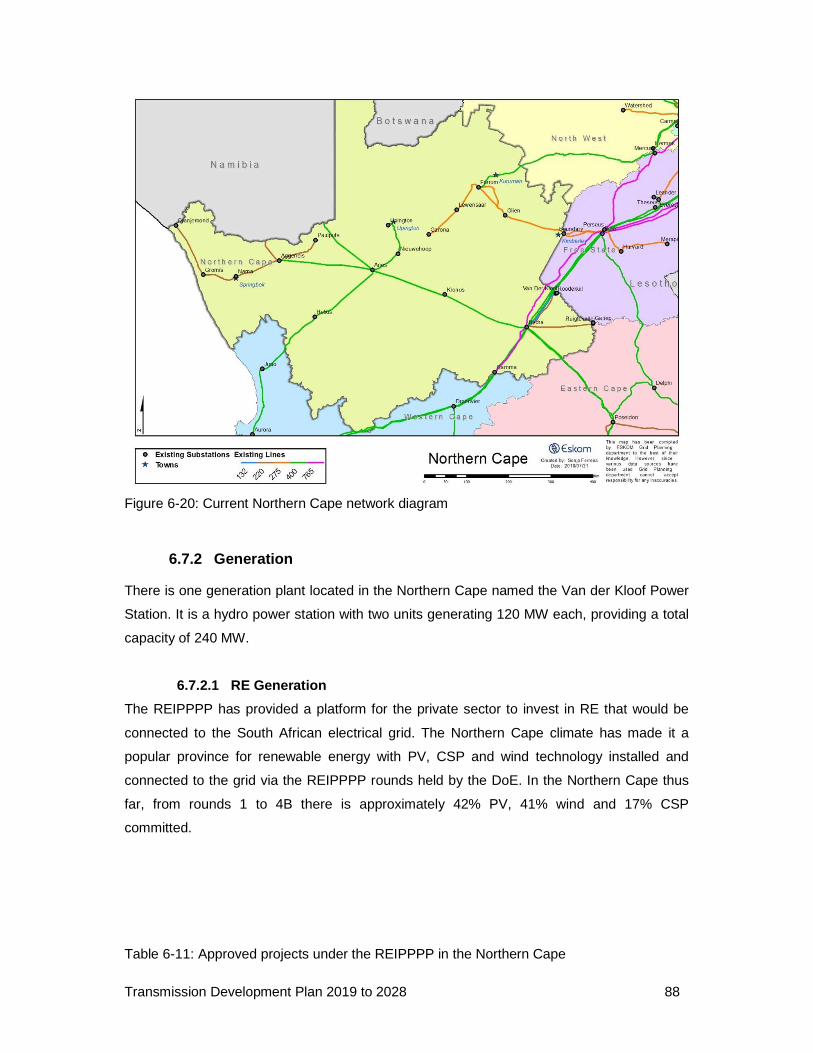
Transmission Development Plan 2019 to 2028 88
Figure 6-20: Current Northern Cape network diagram
6.7.2 Generation
There is one generation plant located in the Northern Cape named the Van der Kloof Power
Station. It is a hydro power station with two units generating 120 MW each, providing a total
capacity of 240 MW.
6.7.2.1 RE Generation
The REIPPPP has provided a platform for the private sector to invest in RE that would be
connected to the South African electrical grid. The Northern Cape climate has made it a
popular province for renewable energy with PV, CSP and wind technology installed and
connected to the grid via the REIPPPP rounds held by the DoE. In the Northern Cape thus
far, from rounds 1 to 4B there is approximately 42% PV, 41% wind and 17% CSP
committed.
Table 6-11: Approved projects under the REIPPPP in the Northern Cape
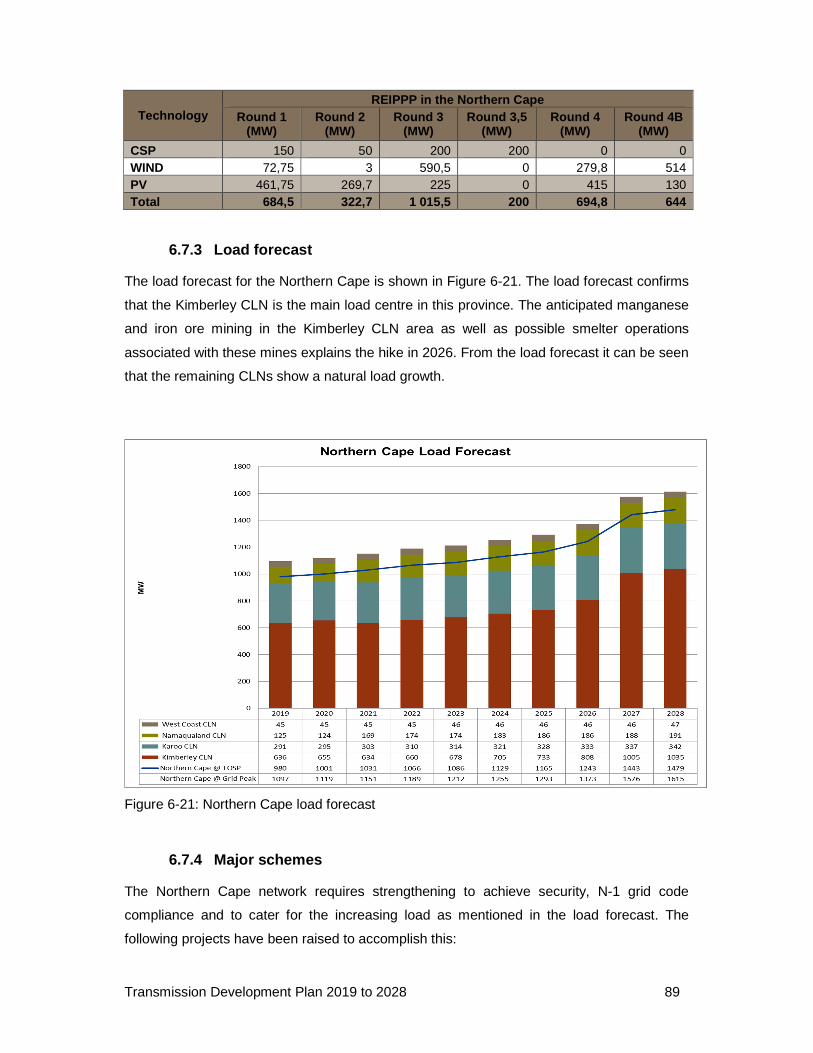
Transmission Development Plan 2019 to 2028 89
Technology REIPPP in the Northern Cape
Round 1 (MW)
Round 2 (MW)
Round 3 (MW)
Round 3,5 (MW)
Round 4 (MW)
Round 4B (MW)
CSP 150 50 200 200 0 0 WIND 72,75 3 590,5 0 279,8 514 PV 461,75 269,7 225 0 415 130 Total 684,5 322,7 1 015,5 200 694,8 644
6.7.3 Load forecast
The load forecast for the Northern Cape is shown in Figure 6-21. The load forecast confirms
that the Kimberley CLN is the main load centre in this province. The anticipated manganese
and iron ore mining in the Kimberley CLN area as well as possible smelter operations
associated with these mines explains the hike in 2026. From the load forecast it can be seen
that the remaining CLNs show a natural load growth.
Figure 6-21: Northern Cape load forecast
6.7.4 Major schemes
The Northern Cape network requires strengthening to achieve security, N-1 grid code
compliance and to cater for the increasing load as mentioned in the load forecast. The
following projects have been raised to accomplish this:
Transmission Development Plan 2019 to 2028 90
• Namaqualand redundancy project – The Namaqualand redundancy evaluation project
introduces redundancy into the Namaqualand CLN. The project entails building the Juno-
Gromis 400 kV line banked at the Gromis Substation to 220 kV and the Gromis-
Oranjemund 220 kV line (constructed at 400 kV).
• Namaqualand strengthening: Aggeneis-Paulputs second 220 kV and Paulputs
transformation framework – This project introduces the second Aggeneis-Paulputs 220
kV line built at 400 kV to meet the N-1 security standard for Paulputs area.
• Kimberley strengthening phase 3 – This strengthening entails the construction of
Hermes (later Selemo)–Mookodi, Mookodi-Hotazel and Hotazel-Ferrum 400 kV lines,
which is to cater for the increasing load in the area.
• Upington integration – The integration includes the construction of two Upington-Aries
400 kV lines, Upington-Niewehoop and Upington-Ferrum 400 kV lines.
• Kimberley strengthening phase 4 – Part A – This is a strategic project to enable the
evacuation of potential renewable generation in the Kimberley area.
Since the introduction of renewable generation within the Northern Cape it was understood
that the network will need to be strengthened to evacuate the renewable power out of
Northern Cape to other parts of the country. The projects below have been raised to achieve
such.
• Aries and Aggeneis IPP integration (GP Report_15/60 ) – In the Namaqualand CLN,
the introduction of 400/132 kV with the first 500 MVA transformer at the Aries and
Aggeneis Transmission Substation is recommended.
• Garona strengthening for RE IPP (GP Report_15/58) – The project entails the
introduction of 400 kV at Garona existing transmission station by looping in and out of
the newly built Nieuwehoop-Ferrum 400 kV line.
• Helios transformation strengthening for RE IPP (GP Report_15/59) - The installation
of the second 500 MVA 400/132 kV transformer at the Helios Transmission Substation.
While Northern Cape has become the most popular province for PV and CSP (59%) there
has been some wind generation (42%) connected to the grid. The Namaqualand
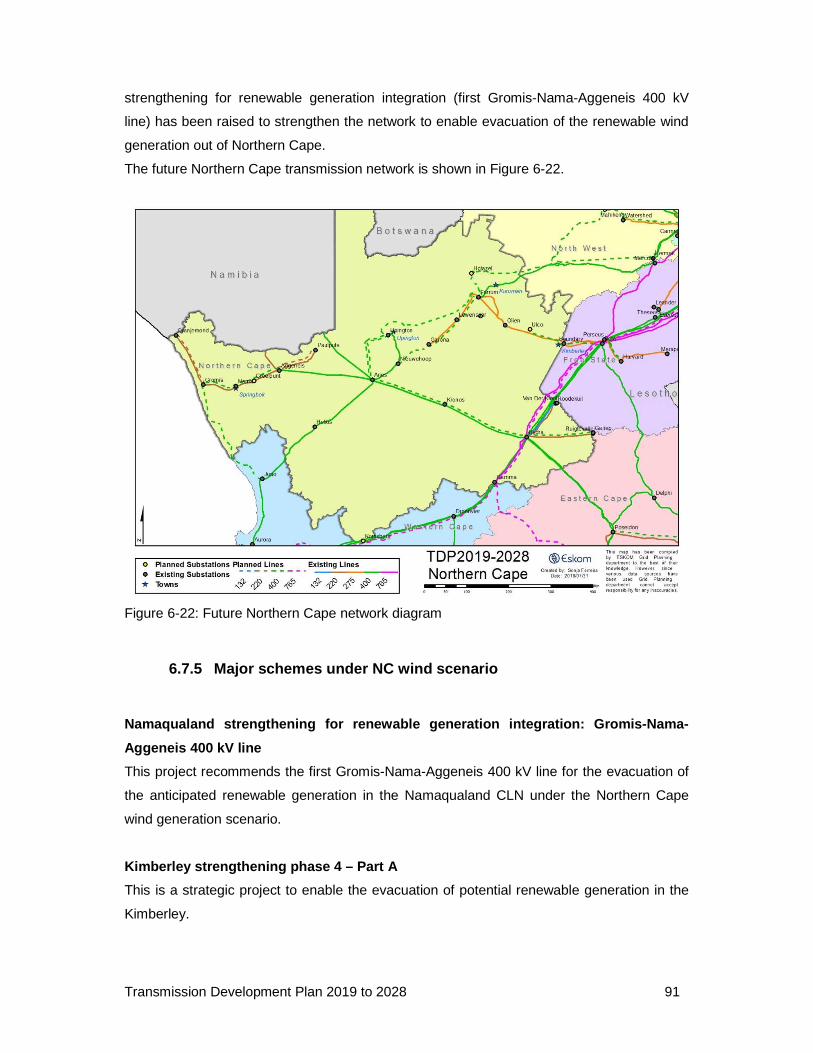
Transmission Development Plan 2019 to 2028 91
strengthening for renewable generation integration (first Gromis-Nama-Aggeneis 400 kV
line) has been raised to strengthen the network to enable evacuation of the renewable wind
generation out of Northern Cape.
The future Northern Cape transmission network is shown in Figure 6-22.
Figure 6-22: Future Northern Cape network diagram
6.7.5 Major schemes under NC wind scenario
Namaqualand strengthening for renewable generation integration: Gromis-Nama-
Aggeneis 400 kV line
This project recommends the first Gromis-Nama-Aggeneis 400 kV line for the evacuation of
the anticipated renewable generation in the Namaqualand CLN under the Northern Cape
wind generation scenario.
Kimberley strengthening phase 4 – Part A
This is a strategic project to enable the evacuation of potential renewable generation in the
Kimberley.
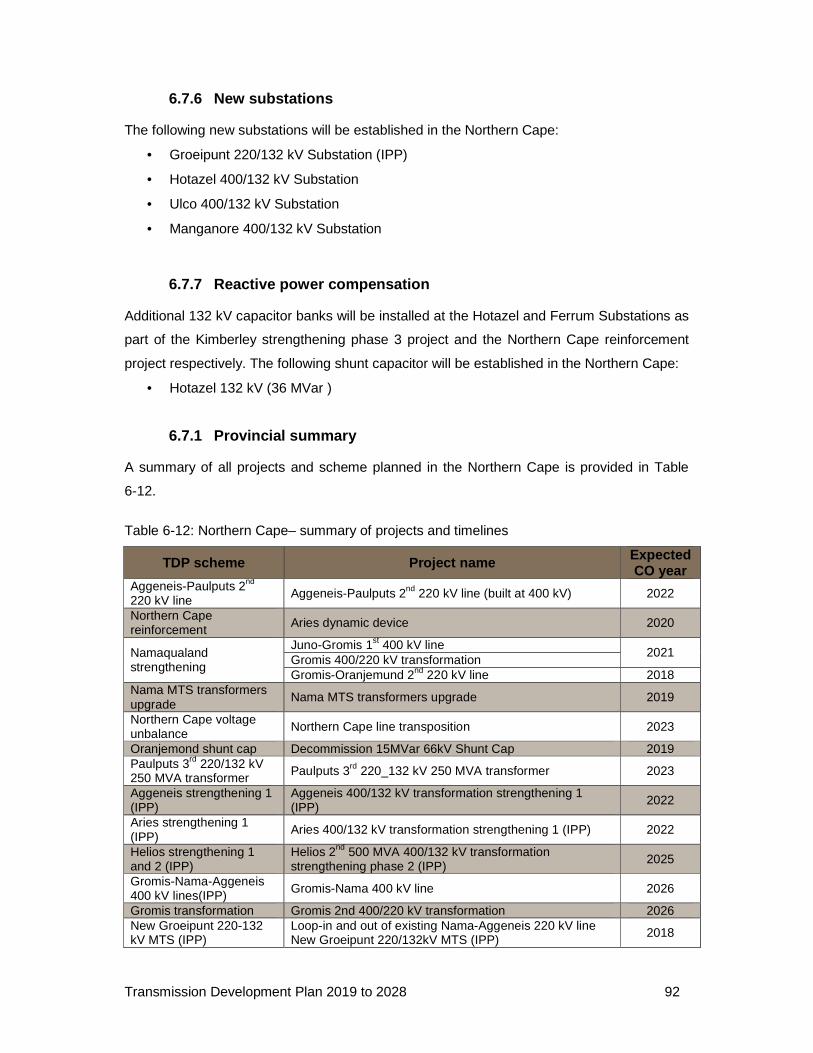
Transmission Development Plan 2019 to 2028 92
6.7.6 New substations
The following new substations will be established in the Northern Cape:
• Groeipunt 220/132 kV Substation (IPP)
• Hotazel 400/132 kV Substation
• Ulco 400/132 kV Substation
• Manganore 400/132 kV Substation
6.7.7 Reactive power compensation
Additional 132 kV capacitor banks will be installed at the Hotazel and Ferrum Substations as
part of the Kimberley strengthening phase 3 project and the Northern Cape reinforcement
project respectively. The following shunt capacitor will be established in the Northern Cape:
• Hotazel 132 kV (36 MVar )
6.7.1 Provincial summary
A summary of all projects and scheme planned in the Northern Cape is provided in Table
6-12.
Table 6-12: Northern Cape– summary of projects and timelines
TDP scheme Project name Expected CO year
Aggeneis-Paulputs 2nd 220 kV line Aggeneis-Paulputs 2nd 220 kV line (built at 400 kV) 2022
Northern Cape reinforcement Aries dynamic device 2020
Namaqualand strengthening
Juno-Gromis 1st 400 kV line 2021
Gromis 400/220 kV transformation Gromis-Oranjemund 2nd 220 kV line 2018
Nama MTS transformers upgrade
Nama MTS transformers upgrade 2019
Northern Cape voltage unbalance Northern Cape line transposition 2023
Oranjemond shunt cap Decommission 15MVar 66kV Shunt Cap 2019 Paulputs 3rd 220/132 kV 250 MVA transformer Paulputs 3rd 220_132 kV 250 MVA transformer 2023
Aggeneis strengthening 1 (IPP)
Aggeneis 400/132 kV transformation strengthening 1 (IPP) 2022
Aries strengthening 1 (IPP)
Aries 400/132 kV transformation strengthening 1 (IPP) 2022
Helios strengthening 1 and 2 (IPP)
Helios 2nd 500 MVA 400/132 kV transformation strengthening phase 2 (IPP) 2025
Gromis-Nama-Aggeneis 400 kV lines(IPP) Gromis-Nama 400 kV line 2026
Gromis transformation Gromis 2nd 400/220 kV transformation 2026 New Groeipunt 220-132 kV MTS (IPP)
Loop-in and out of existing Nama-Aggeneis 220 kV line New Groeipunt 220/132kV MTS (IPP) 2018
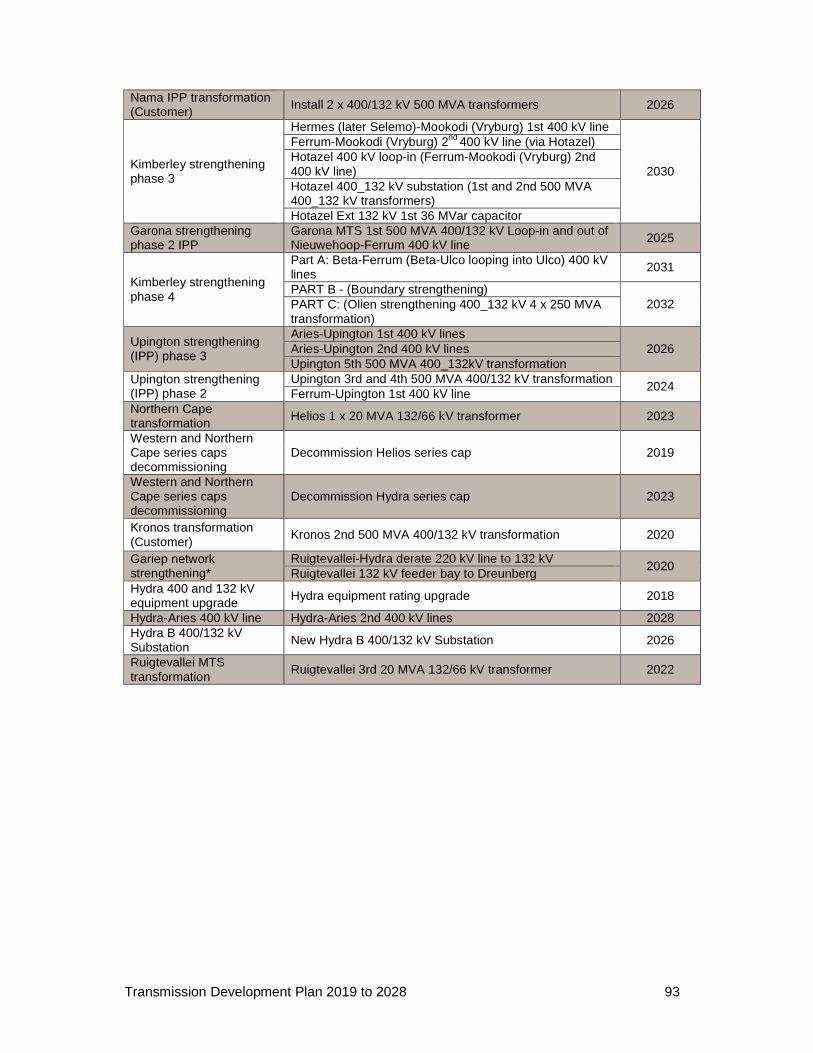
Transmission Development Plan 2019 to 2028 93
Nama IPP transformation (Customer) Install 2 x 400/132 kV 500 MVA transformers 2026
Kimberley strengthening phase 3
Hermes (later Selemo)-Mookodi (Vryburg) 1st 400 kV line
2030
Ferrum-Mookodi (Vryburg) 2nd 400 kV line (via Hotazel) Hotazel 400 kV loop-in (Ferrum-Mookodi (Vryburg) 2nd 400 kV line) Hotazel 400_132 kV substation (1st and 2nd 500 MVA 400_132 kV transformers) Hotazel Ext 132 kV 1st 36 MVar capacitor
Garona strengthening phase 2 IPP
Garona MTS 1st 500 MVA 400/132 kV Loop-in and out of Nieuwehoop-Ferrum 400 kV line 2025
Kimberley strengthening phase 4
Part A: Beta-Ferrum (Beta-Ulco looping into Ulco) 400 kV lines 2031
PART B - (Boundary strengthening) 2032 PART C: (Olien strengthening 400_132 kV 4 x 250 MVA
transformation)
Upington strengthening (IPP) phase 3
Aries-Upington 1st 400 kV lines 2026 Aries-Upington 2nd 400 kV lines
Upington 5th 500 MVA 400_132kV transformation Upington strengthening (IPP) phase 2
Upington 3rd and 4th 500 MVA 400/132 kV transformation 2024
Ferrum-Upington 1st 400 kV line Northern Cape transformation Helios 1 x 20 MVA 132/66 kV transformer 2023
Western and Northern Cape series caps decommissioning
Decommission Helios series cap 2019
Western and Northern Cape series caps decommissioning
Decommission Hydra series cap 2023
Kronos transformation (Customer)
Kronos 2nd 500 MVA 400/132 kV transformation 2020
Gariep network strengthening*
Ruigtevallei-Hydra derate 220 kV line to 132 kV 2020
Ruigtevallei 132 kV feeder bay to Dreunberg Hydra 400 and 132 kV equipment upgrade Hydra equipment rating upgrade 2018
Hydra-Aries 400 kV line Hydra-Aries 2nd 400 kV lines 2028 Hydra B 400/132 kV Substation New Hydra B 400/132 kV Substation 2026
Ruigtevallei MTS transformation
Ruigtevallei 3rd 20 MVA 132/66 kV transformer 2022
Transmission Development Plan 2019 to 2028 94
6.8 EASTERN CAPE
6.8.1 Background
Eastern Cape is South Africa’s second largest province by landmass and is located on the
south-eastern coast of South Africa. The capital city of Eastern Cape is Bhisho, which is
derived from the Xhosa word for buffalo. The two largest cities in the province are Port
Elizabeth and East London. The provincial economy is mainly driven by the automotive
sector, which is the biggest manufacturing sector in the urban areas of the Eastern Cape.
Nelson Mandela Bay Metro in Port Elizabeth as well as Buffalo City Metro in East London
are the two major motor manufacturing hubs in the province. Due to its excellent wind
energy resource, the Eastern Cape has attracted a significant share of the RE projects
procured to date. It is also expected that the majority of future generation from wind energy
will be located in the Eastern Cape.
The provincial load for the Eastern Cape peaked at 1 716 MW in 2017, and it is expected to
increase to about 2 620 MW by 2028. There is a high potential for developments in the
Nelson Mandela Bay Metro in the Port of Ngqura, as it is popularly known. As a result, the
peak demand for electricity in the Port Elizabeth area is forecasted to increase from
1 086 MW to about 1 604 MW in the next 10 years. The bulk of expected load increase in
the CLN is attributable to the industrial development at Coega. The Port Elizabeth area is
supplied by means of three 400 kV transmission lines and a single 220 kV line, which also
supports the manganese traction line.
The East London area has a mixture of rural and urban loads. Most of the rural electrification
is anticipated in the northern parts of East London CLN, in and around the Mthatha area.
The Vuyani Substation and associated 400 kV supply lines are expected to unlock future
electrification in the Mthatha area. The capacity of Vuyani Substation has the potential of
unlocking the electrification of more than 125 000 homes currently. The number of in-feeds
into East London consists of three 400 kV lines and a single 220 kV line to Bhisho.
The current transmission network is shown in Figure 6-23.
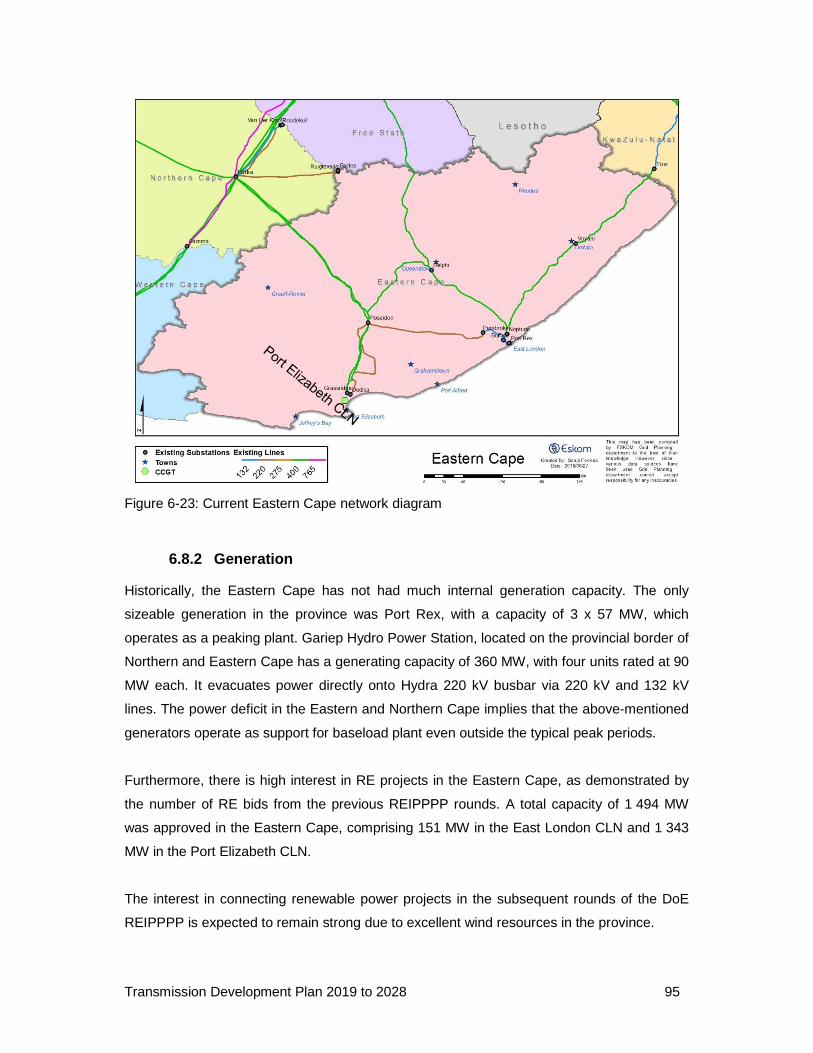
Transmission Development Plan 2019 to 2028 95
Figure 6-23: Current Eastern Cape network diagram
6.8.2 Generation
Historically, the Eastern Cape has not had much internal generation capacity. The only
sizeable generation in the province was Port Rex, with a capacity of 3 x 57 MW, which
operates as a peaking plant. Gariep Hydro Power Station, located on the provincial border of
Northern and Eastern Cape has a generating capacity of 360 MW, with four units rated at 90
MW each. It evacuates power directly onto Hydra 220 kV busbar via 220 kV and 132 kV
lines. The power deficit in the Eastern and Northern Cape implies that the above-mentioned
generators operate as support for baseload plant even outside the typical peak periods.
Furthermore, there is high interest in RE projects in the Eastern Cape, as demonstrated by
the number of RE bids from the previous REIPPPP rounds. A total capacity of 1 494 MW
was approved in the Eastern Cape, comprising 151 MW in the East London CLN and 1 343
MW in the Port Elizabeth CLN.
The interest in connecting renewable power projects in the subsequent rounds of the DoE
REIPPPP is expected to remain strong due to excellent wind resources in the province.
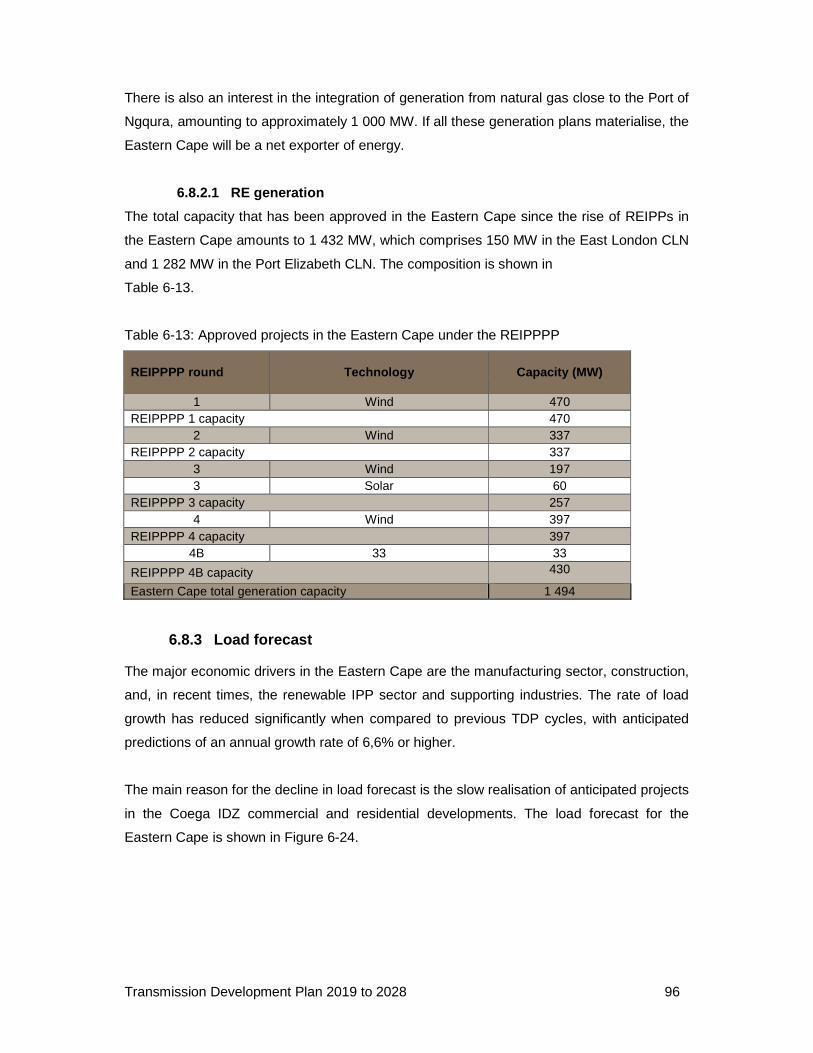
Transmission Development Plan 2019 to 2028 96
There is also an interest in the integration of generation from natural gas close to the Port of
Ngqura, amounting to approximately 1 000 MW. If all these generation plans materialise, the
Eastern Cape will be a net exporter of energy.
6.8.2.1 RE generation
The total capacity that has been approved in the Eastern Cape since the rise of REIPPs in
the Eastern Cape amounts to 1 432 MW, which comprises 150 MW in the East London CLN
and 1 282 MW in the Port Elizabeth CLN. The composition is shown in
Table 6-13.
Table 6-13: Approved projects in the Eastern Cape under the REIPPPP
REIPPPP round Technology Capacity (MW)
1 Wind 470 REIPPPP 1 capacity 470
2 Wind 337 REIPPPP 2 capacity 337
3 Wind 197 3 Solar 60
REIPPPP 3 capacity 257 4 Wind 397
REIPPPP 4 capacity 397 4B 33 33
REIPPPP 4B capacity 430
Eastern Cape total generation capacity 1 494
6.8.3 Load forecast
The major economic drivers in the Eastern Cape are the manufacturing sector, construction,
and, in recent times, the renewable IPP sector and supporting industries. The rate of load
growth has reduced significantly when compared to previous TDP cycles, with anticipated
predictions of an annual growth rate of 6,6% or higher.
The main reason for the decline in load forecast is the slow realisation of anticipated projects
in the Coega IDZ commercial and residential developments. The load forecast for the
Eastern Cape is shown in Figure 6-24.
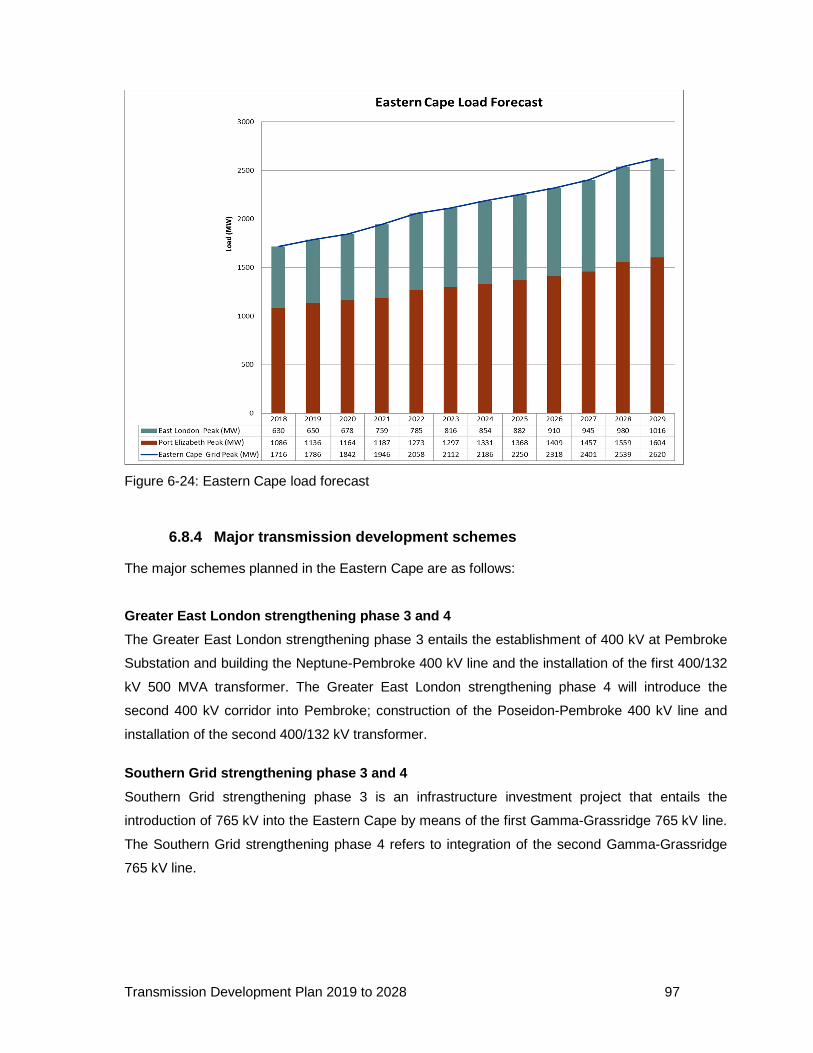
Transmission Development Plan 2019 to 2028 97
Figure 6-24: Eastern Cape load forecast
6.8.4 Major transmission development schemes
The major schemes planned in the Eastern Cape are as follows:
Greater East London strengthening phase 3 and 4
The Greater East London strengthening phase 3 entails the establishment of 400 kV at Pembroke
Substation and building the Neptune-Pembroke 400 kV line and the installation of the first 400/132
kV 500 MVA transformer. The Greater East London strengthening phase 4 will introduce the
second 400 kV corridor into Pembroke; construction of the Poseidon-Pembroke 400 kV line and
installation of the second 400/132 kV transformer.
Southern Grid strengthening phase 3 and 4
Southern Grid strengthening phase 3 is an infrastructure investment project that entails the
introduction of 765 kV into the Eastern Cape by means of the first Gamma-Grassridge 765 kV line.
The Southern Grid strengthening phase 4 refers to integration of the second Gamma-Grassridge
765 kV line.
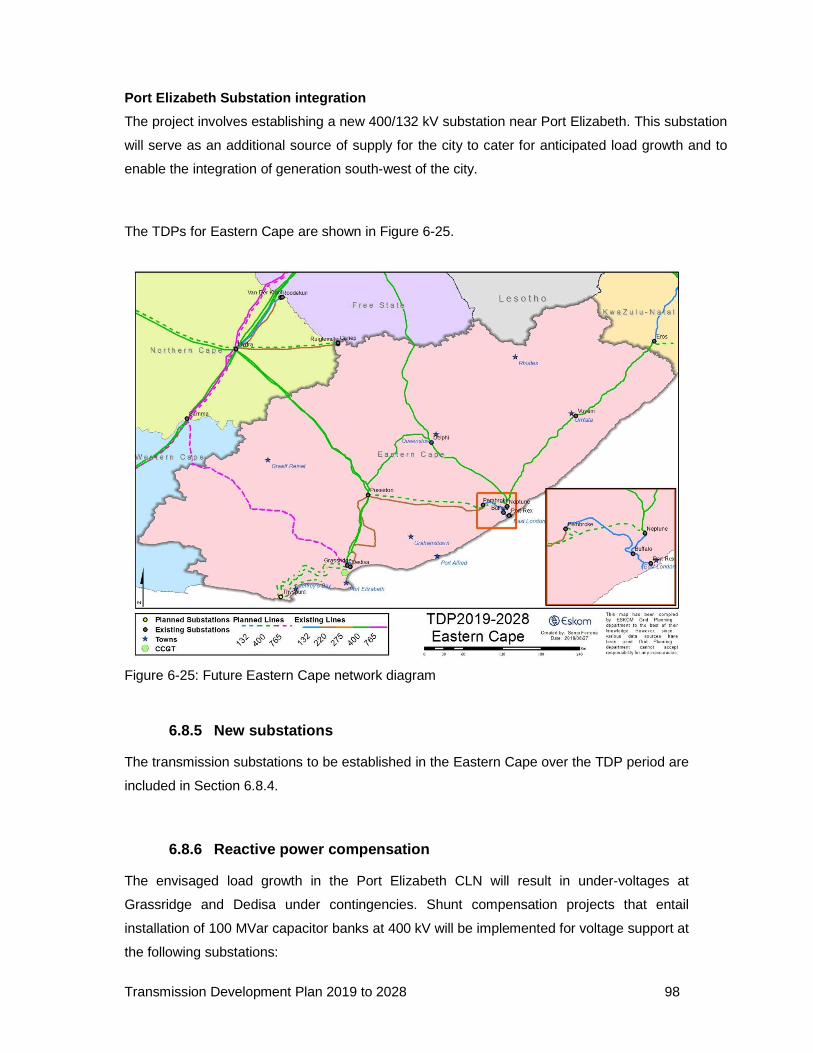
Transmission Development Plan 2019 to 2028 98
Port Elizabeth Substation integration
The project involves establishing a new 400/132 kV substation near Port Elizabeth. This substation
will serve as an additional source of supply for the city to cater for anticipated load growth and to
enable the integration of generation south-west of the city.
The TDPs for Eastern Cape are shown in Figure 6-25.
Figure 6-25: Future Eastern Cape network diagram
6.8.5 New substations
The transmission substations to be established in the Eastern Cape over the TDP period are
included in Section 6.8.4.
6.8.6 Reactive power compensation
The envisaged load growth in the Port Elizabeth CLN will result in under-voltages at
Grassridge and Dedisa under contingencies. Shunt compensation projects that entail
installation of 100 MVar capacitor banks at 400 kV will be implemented for voltage support at
the following substations:
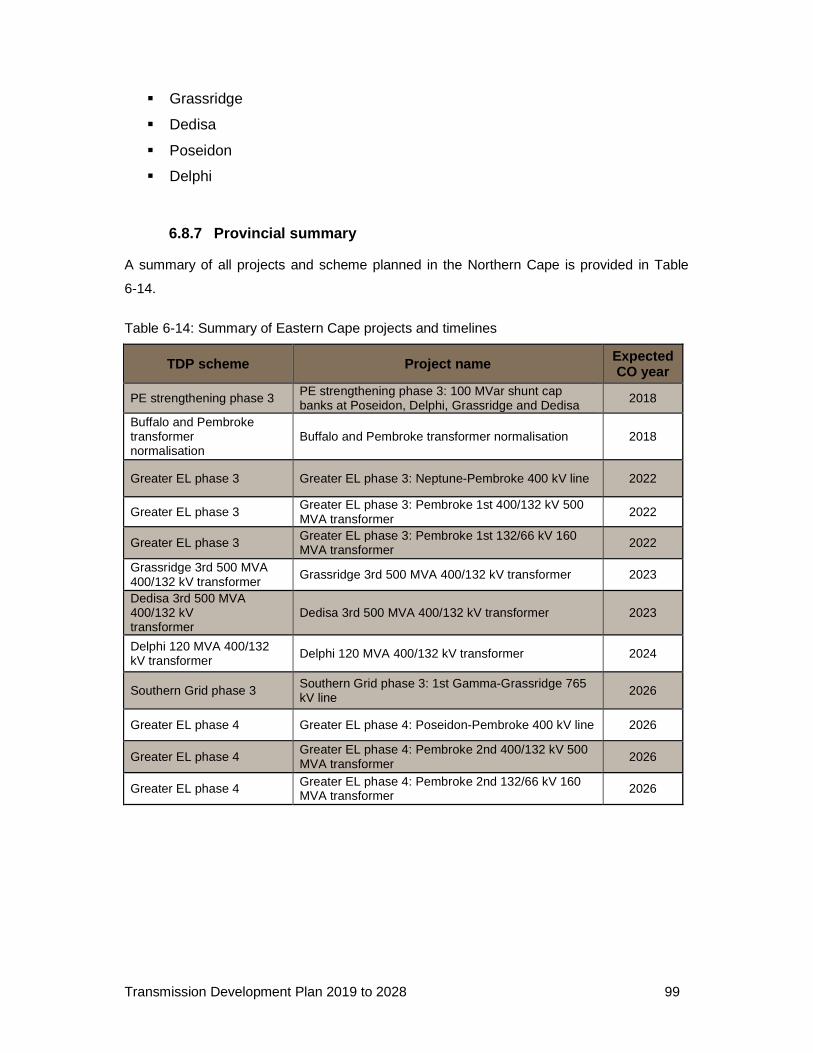
Transmission Development Plan 2019 to 2028 99
� Grassridge
� Dedisa
� Poseidon
� Delphi
6.8.7 Provincial summary
A summary of all projects and scheme planned in the Northern Cape is provided in Table
6-14.
Table 6-14: Summary of Eastern Cape projects and timelines
TDP scheme Project name Expected CO year
PE strengthening phase 3 PE strengthening phase 3: 100 MVar shunt cap banks at Poseidon, Delphi, Grassridge and Dedisa 2018
Buffalo and Pembroke transformer normalisation
Buffalo and Pembroke transformer normalisation 2018
Greater EL phase 3 Greater EL phase 3: Neptune-Pembroke 400 kV line 2022
Greater EL phase 3 Greater EL phase 3: Pembroke 1st 400/132 kV 500 MVA transformer 2022
Greater EL phase 3 Greater EL phase 3: Pembroke 1st 132/66 kV 160 MVA transformer 2022
Grassridge 3rd 500 MVA 400/132 kV transformer
Grassridge 3rd 500 MVA 400/132 kV transformer 2023
Dedisa 3rd 500 MVA 400/132 kV transformer
Dedisa 3rd 500 MVA 400/132 kV transformer 2023
Delphi 120 MVA 400/132 kV transformer Delphi 120 MVA 400/132 kV transformer 2024
Southern Grid phase 3 Southern Grid phase 3: 1st Gamma-Grassridge 765 kV line 2026
Greater EL phase 4 Greater EL phase 4: Poseidon-Pembroke 400 kV line 2026
Greater EL phase 4 Greater EL phase 4: Pembroke 2nd 400/132 kV 500 MVA transformer 2026
Greater EL phase 4 Greater EL phase 4: Pembroke 2nd 132/66 kV 160 MVA transformer 2026
Transmission Development Plan 2019 to 2028 100
6.9 WESTERN CAPE
6.9.1 Background
The Western Cape is situated in the south-western part of South Africa and has Cape Town
as its capital. The provincial economy is mainly driven by the tourism, financial services,
business services, real estate, agriculture, and manufacturing sectors. Cape Town is the
economic hub of the province, with a robust clothing and textile industry that provides
significant employment opportunities in the province.
The Western Cape region of South Africa is also noted for its abundance of wind resources,
which makes it one of South Africa’s ideal locations for wind energy projects, a number of
which are already in operation. To date, 550 MW of RE plants have been integrated in the
Western Cape, one of which is Sere Wind Farm, a 100 MW Eskom wind generating facility,
which was completed in January 2015. There has also been considerable interest in gas and
oil imports as well as gas generation.
The provincial load peaked at around 3 900 MW in 2017 and it is expected to increase to
about 4 500 MW by 2028. The Western Cape comprises three CLNs, namely the Peninsula,
Southern Cape and West Coast. The Peninsula CLN is the main load centre in the province,
consuming approximately 67% of the load. Southern Cape and West Coast CLNs make up
the remaining 33% of the demand in the province.
The Western Cape Transmission network consists mostly of 400 kV lines. It stretches over a
distance of about 550 km from the Gamma Substation (near Victoria West) to the Philippi
Substation (near Cape Town).
Local strengthening is planned across the province, mainly comprising new 400/132 kV
substations. Additional 400 kV line infrastructure is also required, primarily to integrate these
substations and to assist with power evacuation from the existing power stations.
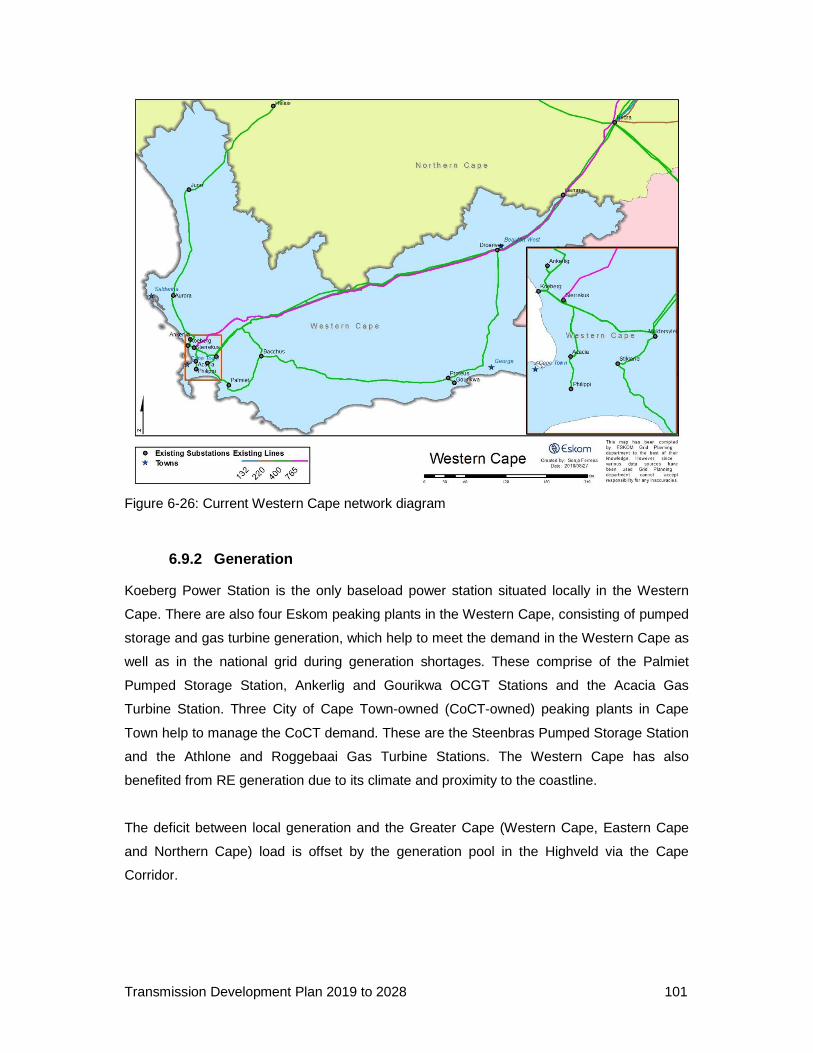
Transmission Development Plan 2019 to 2028 101
Figure 6-26: Current Western Cape network diagram
6.9.2 Generation
Koeberg Power Station is the only baseload power station situated locally in the Western
Cape. There are also four Eskom peaking plants in the Western Cape, consisting of pumped
storage and gas turbine generation, which help to meet the demand in the Western Cape as
well as in the national grid during generation shortages. These comprise of the Palmiet
Pumped Storage Station, Ankerlig and Gourikwa OCGT Stations and the Acacia Gas
Turbine Station. Three City of Cape Town-owned (CoCT-owned) peaking plants in Cape
Town help to manage the CoCT demand. These are the Steenbras Pumped Storage Station
and the Athlone and Roggebaai Gas Turbine Stations. The Western Cape has also
benefited from RE generation due to its climate and proximity to the coastline.
The deficit between local generation and the Greater Cape (Western Cape, Eastern Cape
and Northern Cape) load is offset by the generation pool in the Highveld via the Cape
Corridor.
Transmission Development Plan 2019 to 2028 102
Koeberg Power Station
Koeberg Power Station is situated at Duynefontein, 27 km north of Cape Town on the
Atlantic coast. Koeberg ensures a reliable supply of electricity to the Western Cape, one of
the fastest growing regions in South Africa. It has operated safely and efficiently for over 30
years and has a further active life of about 20 years. Koeberg Power Station has a
generating capacity of 1 860 MW. The two units are rated at 930 MW each.
Acacia Power Station
Acacia Power Station forms part of the peaking group of power stations and consists of
3 x 57 MW gas turbine engines at an installed capacity of 171 MW. Acacia also operates
predominantly in synchronous condenser mode of operation (SCO) to regulate the voltage.
In addition, it provides an off-site electrical supply to Koeberg Power Station according to the
National Nuclear Regulator licencing requirement.
Ankerlig and Gourikwa Power Stations
The OCGTs were built to meet the rapidly increasing demand for peaking power on the
Eskom grid. The gas turbine engines are similar to those used in the aviation industry and
use liquid fuel (diesel). Some of the units have been fitted with dual fuel burners in
anticipation of conversion to CCGTs. In addition to their generating capabilities, some of the
units at these two power stations are also used to regulate network voltages when running in
SCO.
Ankerlig Power Station is located at Atlantis in the Western Cape and has an installed
capacity of 1 350 MW (9 x 150 MW). Gourikwa Power Station is located at Mossel Bay and
has an installed capacity of 750 MW (5 x 150 MW).
Palmiet Pumped Storage Scheme
Palmiet Pumped Storage Scheme is a joint venture between Eskom and the Department of
Water Affairs and Forestry. It is situated in the ecologically sensitive Kogelberg Nature
Reserve in the Western Cape near Grabouw.
The power station delivers 400 MW (2 x 200 MW) of peak power into the Eskom national
grid and carries out a frequency and voltage regulating role. It is also part of an inter-
catchment water transfer project supplying water to Cape Town.
Transmission Development Plan 2019 to 2028 103
For generating purposes, water flows from an upper reservoir to the machines located in an
underground power station. The water is collected in a lower reservoir and pumped back to
the upper reservoir during off-peak periods.
Steenbras Pumped Storage Scheme
Steenbras Dam is an earth-fill type dam located on the Steenbras River in the Hottentots-
Holland Mountains, high above Gordons Bay, near Cape Town. In 1979, the Steenbras Dam
became part of the first pumped storage scheme in the country to supplement Cape Town’s
electricity supply during periods of peak demand.
Steenbras Pumped Storage Scheme is a CoCT generating facility. It consists of 4 x 45 MW
units and is integrated into the City’s network.
Athlone and Roggebaai Power Stations
The Roggebaai and Athlone Gas Power Stations are two gas turbine stations that are owned
and operated by CoCT. They are used to generate electricity over much shorter time periods
as they make use of much more expensive fuel (Aviation Jet-A1).
Athlone Power Station is located at the site of the demolished Athlone coal-fired power
station along the N2 highway near Pinelands and has an installed capacity of 36 MW.
Roggebaai Power Station is situated at the V&A Waterfront and has an installed capacity of
42 MW.
Both power stations are used for reducing the CoCT’s peak load but can also be used to
supply local loads during emergencies.
Klipheuwel Wind Energy Demonstration Facility
The Klipheuwel Wind Energy Demonstration Facility is an Eskom wind generating facility,
which was completed in February 2003 and has a capacity of 3,16 MW comprising three
wind turbines (660 kW, 1,75 MW and 750 kW). It is located around 50 km north of Cape
Town, in Durbanville.
Since the commercial operation of the facility, the plant has reached the end of its useful life
and Eskom is in the process of decommissioning this demonstration facility. One of the
turbines will be used for practical training at the South African Renewable Technology
Centre (SARETEC) situated in Bellville, Cape Town. The remainder of the wind farm (land
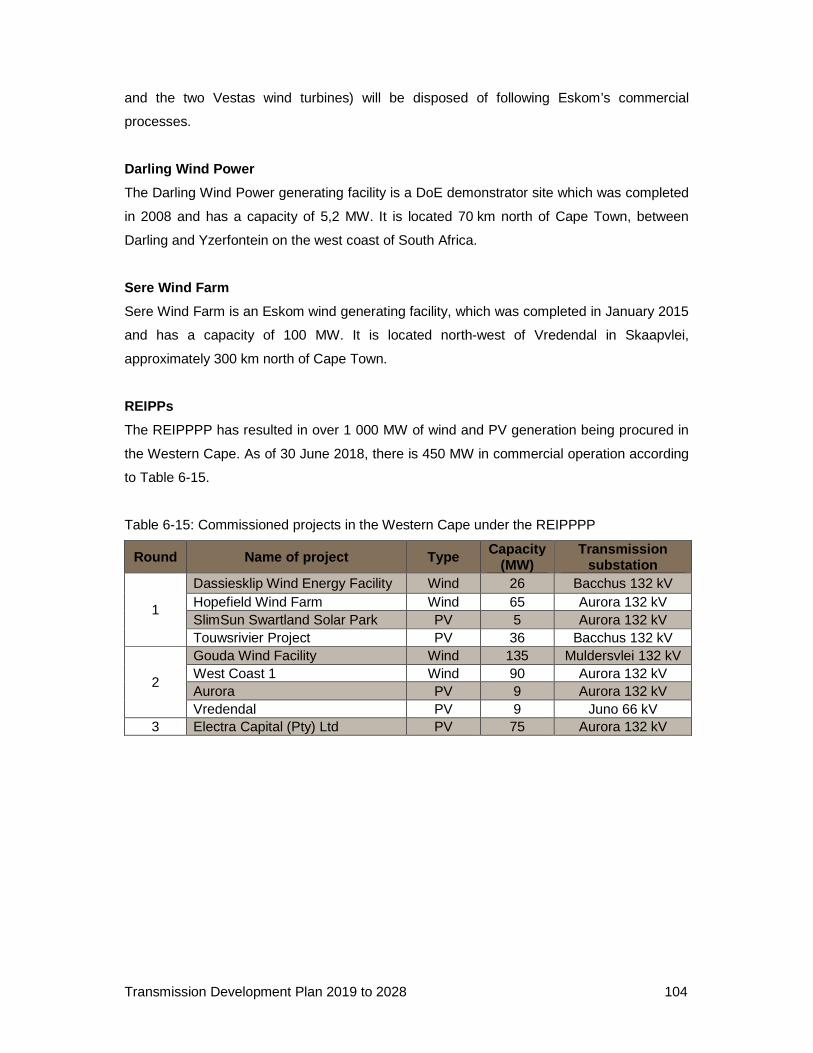
Transmission Development Plan 2019 to 2028 104
and the two Vestas wind turbines) will be disposed of following Eskom’s commercial
processes.
Darling Wind Power
The Darling Wind Power generating facility is a DoE demonstrator site which was completed
in 2008 and has a capacity of 5,2 MW. It is located 70 km north of Cape Town, between
Darling and Yzerfontein on the west coast of South Africa.
Sere Wind Farm
Sere Wind Farm is an Eskom wind generating facility, which was completed in January 2015
and has a capacity of 100 MW. It is located north-west of Vredendal in Skaapvlei,
approximately 300 km north of Cape Town.
REIPPs
The REIPPPP has resulted in over 1 000 MW of wind and PV generation being procured in
the Western Cape. As of 30 June 2018, there is 450 MW in commercial operation according
to Table 6-15.
Table 6-15: Commissioned projects in the Western Cape under the REIPPPP
Round Name of project Type Capacity (MW)
Transmission substation
1
Dassiesklip Wind Energy Facility Wind 26 Bacchus 132 kV Hopefield Wind Farm Wind 65 Aurora 132 kV SlimSun Swartland Solar Park PV 5 Aurora 132 kV Touwsrivier Project PV 36 Bacchus 132 kV
2
Gouda Wind Facility Wind 135 Muldersvlei 132 kV West Coast 1 Wind 90 Aurora 132 kV Aurora PV 9 Aurora 132 kV Vredendal PV 9 Juno 66 kV
3 Electra Capital (Pty) Ltd PV 75 Aurora 132 kV
Transmission Development Plan 2019 to 2028 105
6.9.3 Load forecast
The Western Cape GDP is the third-highest contribution to the country’s total at around 15%
and has one of the fastest growing economies in the country. Industries in the Western Cape
comprise financial and business services, manufacturing, tourism, agriculture, fishing, and
wine. The province's economy is dominated by the City of Cape Town where the vast
majority of all non-agricultural economic activity takes place. The electricity business in
terms of new RE and gas are also major drivers of the economy across the province.
The past strong residential, commercial, and light industrial load growths in the Peninsula
area are expected to continue for a number of years. Some areas of interest are the area
around Philippi and Mitchell’s Plain, where higher density residential properties are being
developed on existing residential areas.
Substantial load growth in the West Coast is expected due to the Saldanha Bay IDZ. The
120-hectare area, which was designated as an IDZ in October 2013, is well situated to
service the marine oil and gas markets within the African continent.
The Western Cape Department of Economic Development is also investigating the feasibility
of establishing a floating liquefied natural gas terminal for the importation of gas.
Historical data has shown that the Western Cape does not peak at the TOSP. The province
peak tends to be about 2,5% higher than the province load at the TOSP. The province peak
is expected to grow by 15% from ~3 900 MW to ~4 500 MW by 2028.
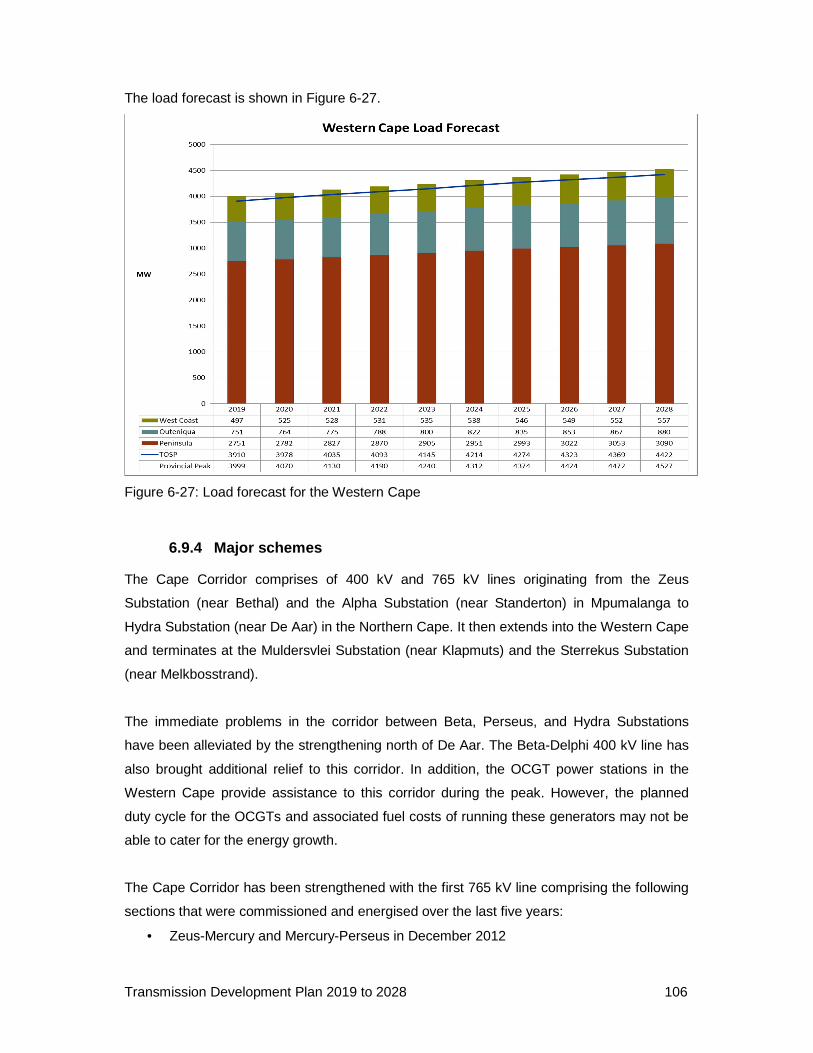
Transmission Development Plan 2019 to 2028 106
The load forecast is shown in Figure 6-27.
Figure 6-27: Load forecast for the Western Cape
6.9.4 Major schemes
The Cape Corridor comprises of 400 kV and 765 kV lines originating from the Zeus
Substation (near Bethal) and the Alpha Substation (near Standerton) in Mpumalanga to
Hydra Substation (near De Aar) in the Northern Cape. It then extends into the Western Cape
and terminates at the Muldersvlei Substation (near Klapmuts) and the Sterrekus Substation
(near Melkbosstrand).
The immediate problems in the corridor between Beta, Perseus, and Hydra Substations
have been alleviated by the strengthening north of De Aar. The Beta-Delphi 400 kV line has
also brought additional relief to this corridor. In addition, the OCGT power stations in the
Western Cape provide assistance to this corridor during the peak. However, the planned
duty cycle for the OCGTs and associated fuel costs of running these generators may not be
able to cater for the energy growth.
The Cape Corridor has been strengthened with the first 765 kV line comprising the following
sections that were commissioned and energised over the last five years:
• Zeus-Mercury and Mercury-Perseus in December 2012
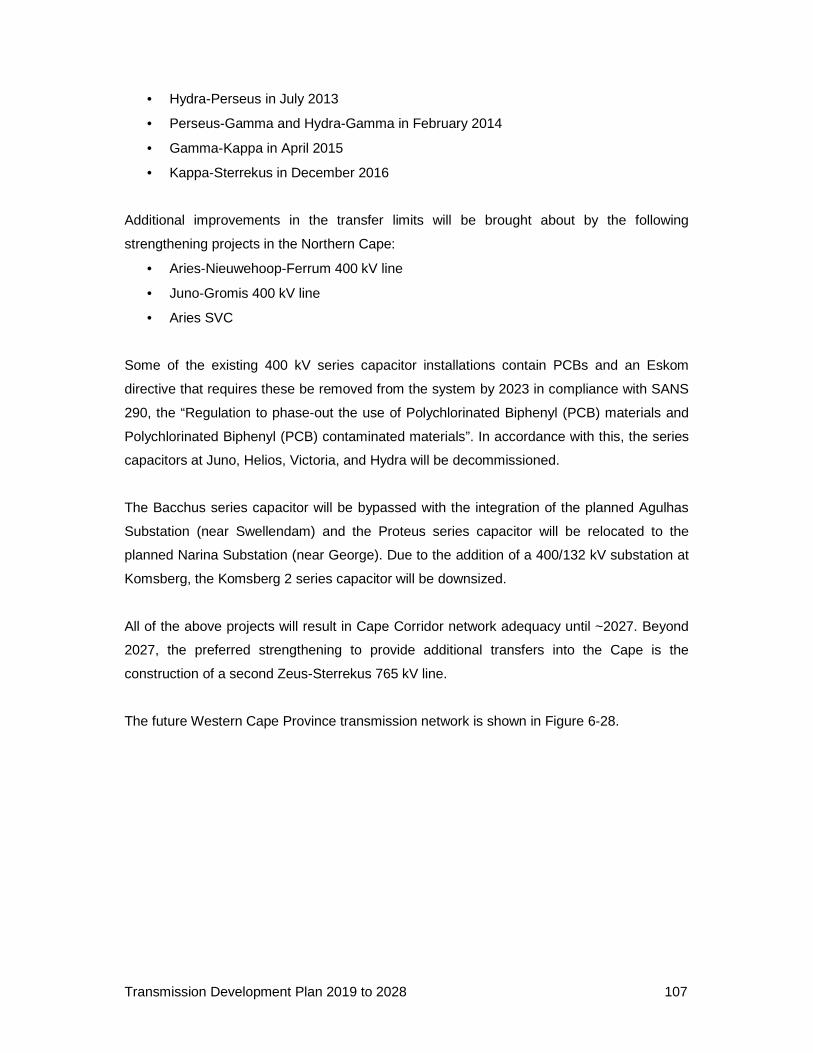
Transmission Development Plan 2019 to 2028 107
• Hydra-Perseus in July 2013
• Perseus-Gamma and Hydra-Gamma in February 2014
• Gamma-Kappa in April 2015
• Kappa-Sterrekus in December 2016
Additional improvements in the transfer limits will be brought about by the following
strengthening projects in the Northern Cape:
• Aries-Nieuwehoop-Ferrum 400 kV line
• Juno-Gromis 400 kV line
• Aries SVC
Some of the existing 400 kV series capacitor installations contain PCBs and an Eskom
directive that requires these be removed from the system by 2023 in compliance with SANS
290, the “Regulation to phase-out the use of Polychlorinated Biphenyl (PCB) materials and
Polychlorinated Biphenyl (PCB) contaminated materials”. In accordance with this, the series
capacitors at Juno, Helios, Victoria, and Hydra will be decommissioned.
The Bacchus series capacitor will be bypassed with the integration of the planned Agulhas
Substation (near Swellendam) and the Proteus series capacitor will be relocated to the
planned Narina Substation (near George). Due to the addition of a 400/132 kV substation at
Komsberg, the Komsberg 2 series capacitor will be downsized.
All of the above projects will result in Cape Corridor network adequacy until ~2027. Beyond
2027, the preferred strengthening to provide additional transfers into the Cape is the
construction of a second Zeus-Sterrekus 765 kV line.
The future Western Cape Province transmission network is shown in Figure 6-28.
Transmission Development Plan 2019 to 2028 108
Figure 6-28: Future Western Cape Transmission network diagram
6.9.5 New substations
The following new substations will be established in the Western Cape in order to address
load growth as well as IPP integration:
Load growth in the Peninsula in the residential, commercial, and light industrial sectors will
necessitate the introduction of the following 400/132 kV substations:
• Pinotage Substation in the Stellenbosch area
• Asteria Substation in the Houhoek area
• Erica Substation in the Mitchell’s Plain area
Load growth in the Southern Cape CLN in the residential, tourism, and agricultural sectors
will necessitate the introduction of two new 400/132 kV substations, namely:
• Agulhas Substation in the Swellendam area
• Narina Substation in the George area
Furthermore, IPP integration in this CLN will necessitate the following developments:
• Construction of Komsberg 400 /132 kV Substation
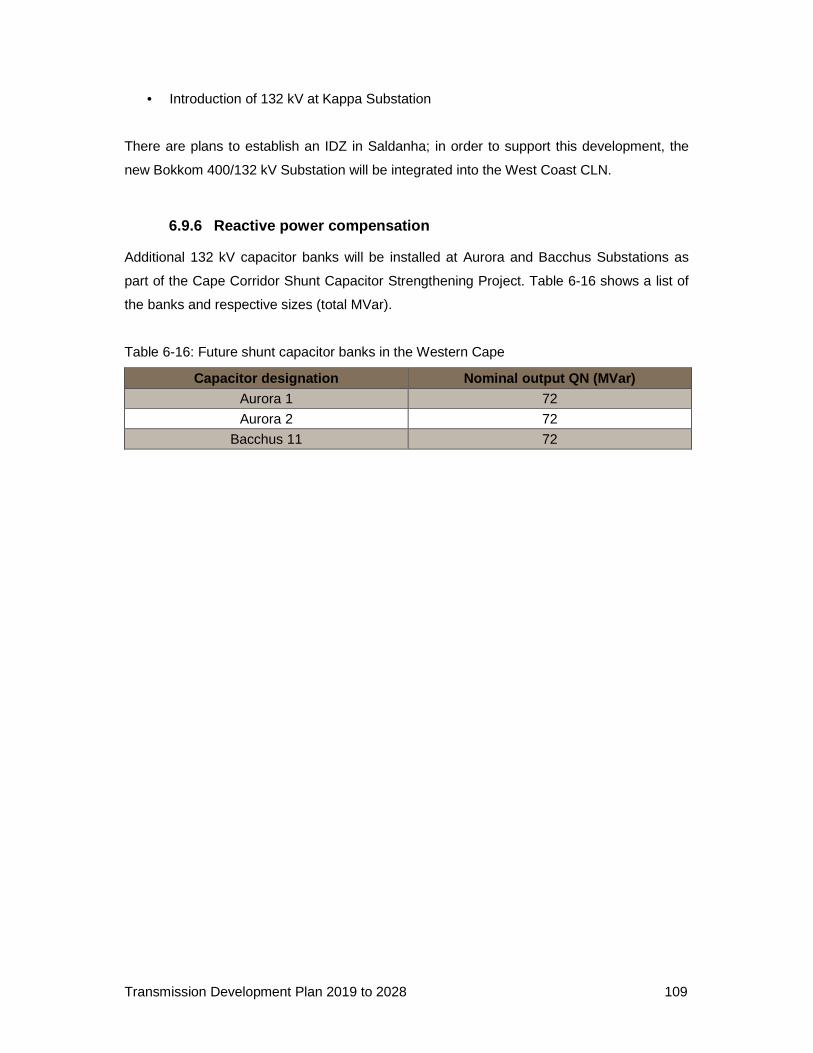
Transmission Development Plan 2019 to 2028 109
• Introduction of 132 kV at Kappa Substation
There are plans to establish an IDZ in Saldanha; in order to support this development, the
new Bokkom 400/132 kV Substation will be integrated into the West Coast CLN.
6.9.6 Reactive power compensation
Additional 132 kV capacitor banks will be installed at Aurora and Bacchus Substations as
part of the Cape Corridor Shunt Capacitor Strengthening Project. Table 6-16 shows a list of
the banks and respective sizes (total MVar).
Table 6-16: Future shunt capacitor banks in the Western Cape
Capacitor designation Nominal output QN (MVar) Aurora 1 72
Aurora 2 72
Bacchus 11 72
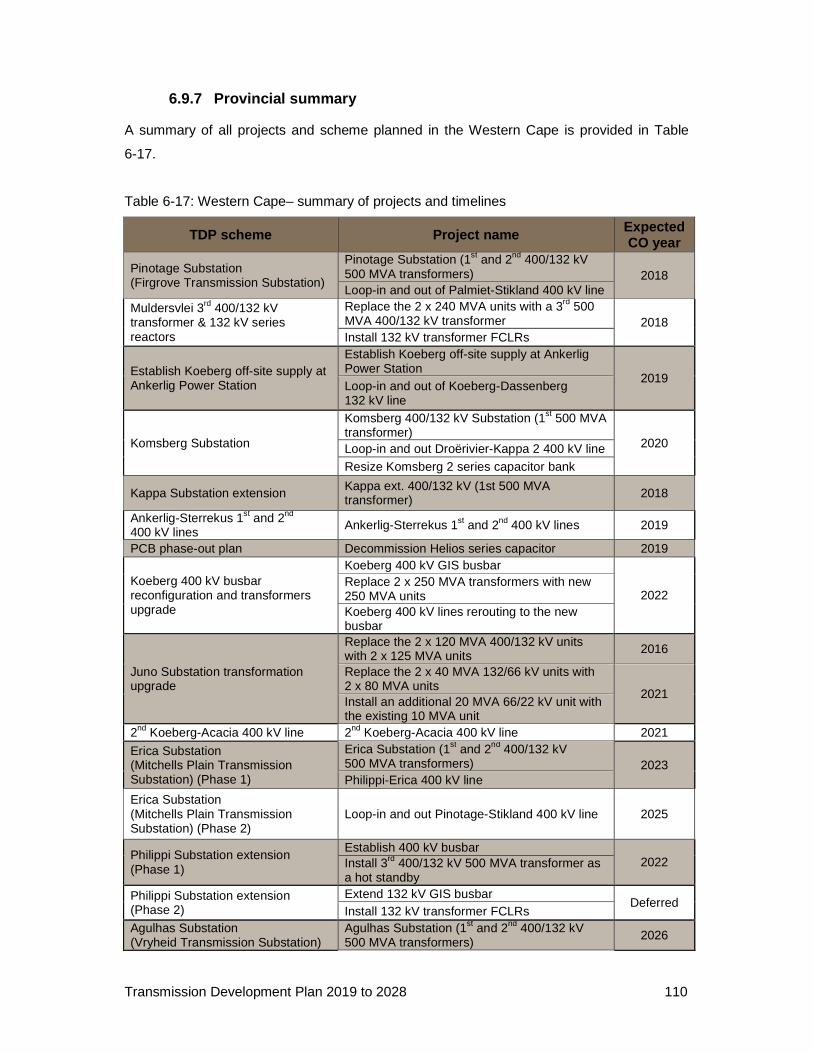
Transmission Development Plan 2019 to 2028 110
6.9.7 Provincial summary
A summary of all projects and scheme planned in the Western Cape is provided in Table
6-17.
Table 6-17: Western Cape– summary of projects and timelines
TDP scheme Project name Expected CO year
Pinotage Substation (Firgrove Transmission Substation)
Pinotage Substation (1st and 2nd 400/132 kV 500 MVA transformers) 2018 Loop-in and out of Palmiet-Stikland 400 kV line
Muldersvlei 3rd 400/132 kV transformer & 132 kV series reactors
Replace the 2 x 240 MVA units with a 3rd 500 MVA 400/132 kV transformer 2018 Install 132 kV transformer FCLRs
Establish Koeberg off-site supply at Ankerlig Power Station
Establish Koeberg off-site supply at Ankerlig Power Station
2019 Loop-in and out of Koeberg-Dassenberg 132 kV line
Komsberg Substation
Komsberg 400/132 kV Substation (1st 500 MVA transformer)
2020 Loop-in and out Droërivier-Kappa 2 400 kV line Resize Komsberg 2 series capacitor bank
Kappa Substation extension Kappa ext. 400/132 kV (1st 500 MVA transformer) 2018
Ankerlig-Sterrekus 1st and 2nd 400 kV lines Ankerlig-Sterrekus 1st and 2nd 400 kV lines 2019
PCB phase-out plan Decommission Helios series capacitor 2019
Koeberg 400 kV busbar reconfiguration and transformers upgrade
Koeberg 400 kV GIS busbar
2022 Replace 2 x 250 MVA transformers with new 250 MVA units Koeberg 400 kV lines rerouting to the new busbar
Juno Substation transformation upgrade
Replace the 2 x 120 MVA 400/132 kV units with 2 x 125 MVA units 2016
Replace the 2 x 40 MVA 132/66 kV units with 2 x 80 MVA units
2021 Install an additional 20 MVA 66/22 kV unit with the existing 10 MVA unit
2nd Koeberg-Acacia 400 kV line 2nd Koeberg-Acacia 400 kV line 2021
Erica Substation (Mitchells Plain Transmission Substation) (Phase 1)
Erica Substation (1st and 2nd 400/132 kV 500 MVA transformers) 2023 Philippi-Erica 400 kV line
Erica Substation (Mitchells Plain Transmission Substation) (Phase 2)
Loop-in and out Pinotage-Stikland 400 kV line 2025
Philippi Substation extension (Phase 1)
Establish 400 kV busbar 2022 Install 3rd 400/132 kV 500 MVA transformer as
a hot standby
Philippi Substation extension (Phase 2)
Extend 132 kV GIS busbar Deferred
Install 132 kV transformer FCLRs Agulhas Substation (Vryheid Transmission Substation)
Agulhas Substation (1st and 2nd 400/132 kV 500 MVA transformers) 2026
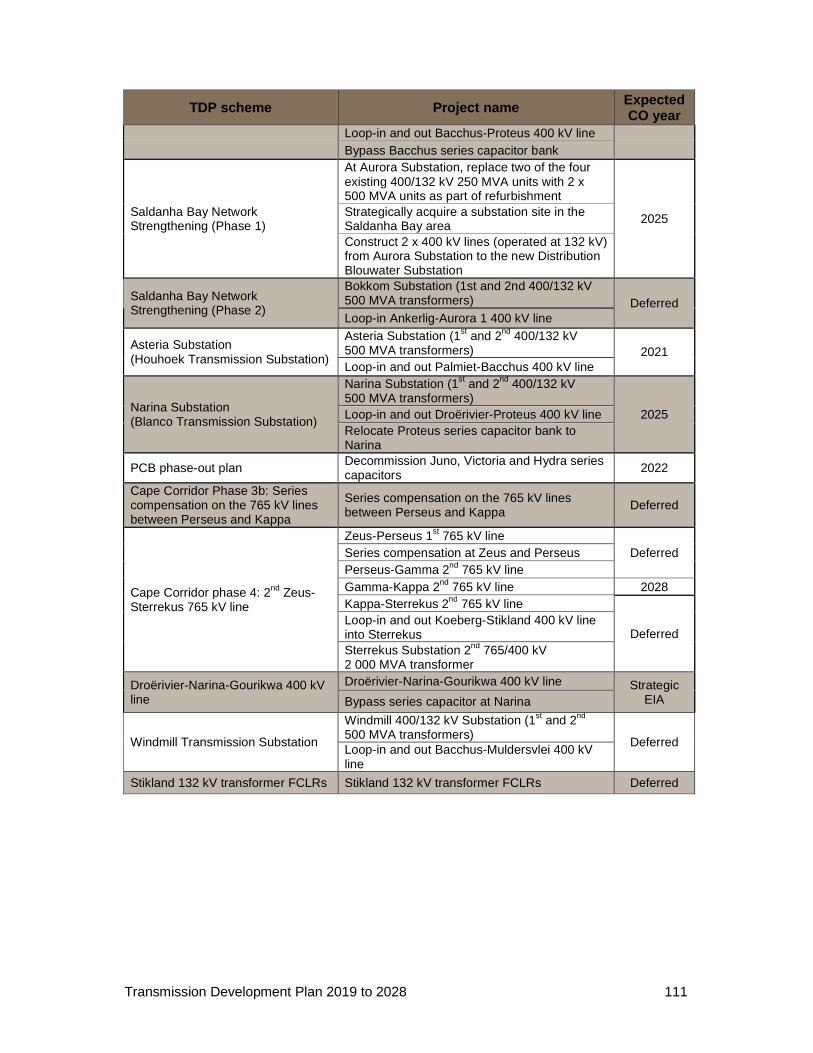
Transmission Development Plan 2019 to 2028 111
TDP scheme Project name Expected CO year
Loop-in and out Bacchus-Proteus 400 kV line Bypass Bacchus series capacitor bank
Saldanha Bay Network Strengthening (Phase 1)
At Aurora Substation, replace two of the four existing 400/132 kV 250 MVA units with 2 x 500 MVA units as part of refurbishment
2025 Strategically acquire a substation site in the Saldanha Bay area Construct 2 x 400 kV lines (operated at 132 kV) from Aurora Substation to the new Distribution Blouwater Substation
Saldanha Bay Network Strengthening (Phase 2)
Bokkom Substation (1st and 2nd 400/132 kV 500 MVA transformers) Deferred Loop-in Ankerlig-Aurora 1 400 kV line
Asteria Substation (Houhoek Transmission Substation)
Asteria Substation (1st and 2nd 400/132 kV 500 MVA transformers) 2021 Loop-in and out Palmiet-Bacchus 400 kV line
Narina Substation (Blanco Transmission Substation)
Narina Substation (1st and 2nd 400/132 kV 500 MVA transformers)
2025 Loop-in and out Droërivier-Proteus 400 kV line Relocate Proteus series capacitor bank to Narina
PCB phase-out plan Decommission Juno, Victoria and Hydra series capacitors 2022
Cape Corridor Phase 3b: Series compensation on the 765 kV lines between Perseus and Kappa
Series compensation on the 765 kV lines between Perseus and Kappa Deferred
Cape Corridor phase 4: 2nd Zeus-Sterrekus 765 kV line
Zeus-Perseus 1st 765 kV line Deferred Series compensation at Zeus and Perseus
Perseus-Gamma 2nd 765 kV line Gamma-Kappa 2nd 765 kV line 2028 Kappa-Sterrekus 2nd 765 kV line
Deferred Loop-in and out Koeberg-Stikland 400 kV line into Sterrekus Sterrekus Substation 2nd 765/400 kV 2 000 MVA transformer
Droërivier-Narina-Gourikwa 400 kV line
Droërivier-Narina-Gourikwa 400 kV line Strategic EIA Bypass series capacitor at Narina
Windmill Transmission Substation
Windmill 400/132 kV Substation (1st and 2nd 500 MVA transformers)
Deferred Loop-in and out Bacchus-Muldersvlei 400 kV line
Stikland 132 kV transformer FCLRs Stikland 132 kV transformer FCLRs Deferred
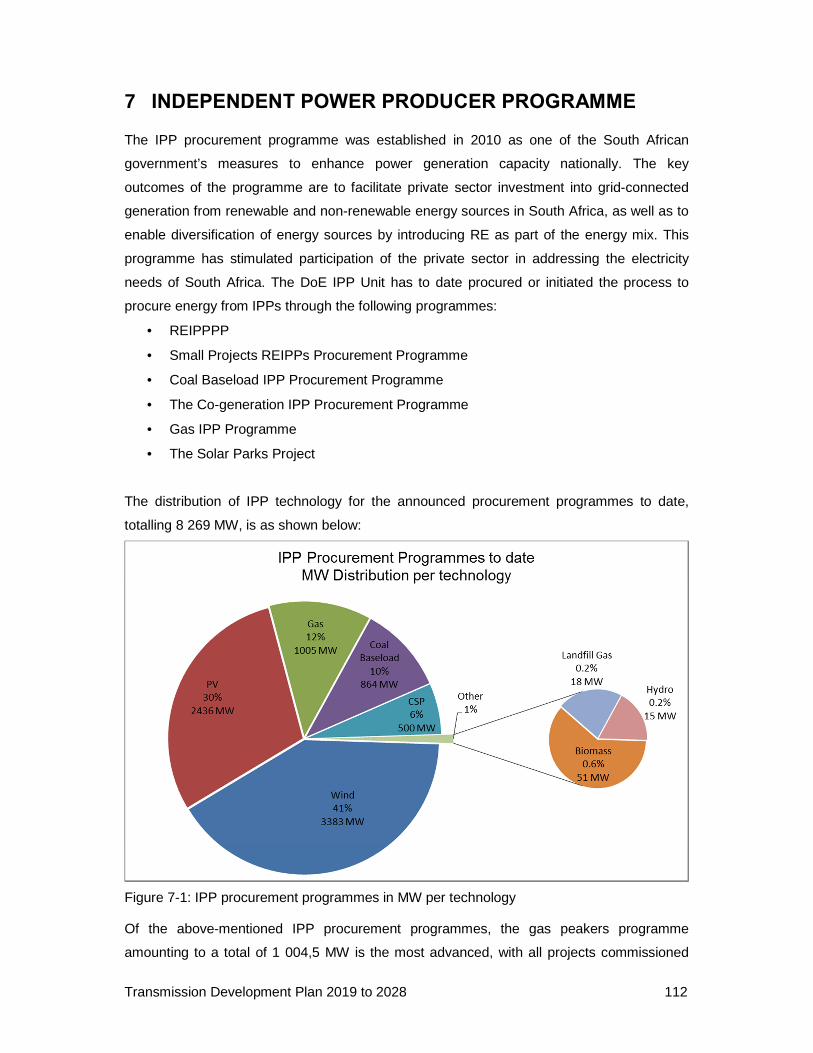
Transmission Development Plan 2019 to 2028 112
7 INDEPENDENT POWER PRODUCER PROGRAMME
The IPP procurement programme was established in 2010 as one of the South African
government’s measures to enhance power generation capacity nationally. The key
outcomes of the programme are to facilitate private sector investment into grid-connected
generation from renewable and non-renewable energy sources in South Africa, as well as to
enable diversification of energy sources by introducing RE as part of the energy mix. This
programme has stimulated participation of the private sector in addressing the electricity
needs of South Africa. The DoE IPP Unit has to date procured or initiated the process to
procure energy from IPPs through the following programmes:
• REIPPPP
• Small Projects REIPPs Procurement Programme
• Coal Baseload IPP Procurement Programme
• The Co-generation IPP Procurement Programme
• Gas IPP Programme
• The Solar Parks Project
The distribution of IPP technology for the announced procurement programmes to date,
totalling 8 269 MW, is as shown below:
Figure 7-1: IPP procurement programmes in MW per technology
Of the above-mentioned IPP procurement programmes, the gas peakers programme
amounting to a total of 1 004,5 MW is the most advanced, with all projects commissioned
Transmission Development Plan 2019 to 2028 113
and in commercial operation. These projects are located at the Dedisa Substation, near Port
Elizabeth, and the Avon Substation, approximately 30 km to the north of Durban. The
second most advanced programme is the REIPPPP with all projects in bid windows 1 and 2
connected and in commercial operation, while 17 of the 23 projects in bid windows 3 and 3,5
are commissioned and in commercial operation. The IPPs in bid windows 4 and 4B are at
the financial closure phase and are expected to be integrated with the national grid within the
current TDP period. The Small REIPP and Coal Baseload IPP are in the budget quotation
phase, while the Co-generation IPP, the Solar Parks, and the gas-to-power programmes are
in different phases of the development and concept stage.
Furthermore, the Draft IRP versions released the DoE in December 2016 and August 2018
demonstrate that RE generation will form substantial part of the future generation mix in the
country by 2040. Although the IRP indicates how much RE needs to be connected, it does
not indicate geographical location within the country. This spatial uncertainty makes it
difficult to formulate plans for grid enhancements. Moreover, the initial rounds of the
programme have consumed much of the available connection capacity in the areas with
good RE generation resources, necessitating substantial electrical infrastructure investment
in these areas to enable future REIPP integration with the national grid. This section outlines
the transmission infrastructure investment plans to enable the approved IPPs, as well as the
concept plans that forms part of the strategic plan to facilitate speedy connection of the
future IPPs based on the latest available information and the TDP assumptions.
7.1 DEVELOPMENT PLANS TO ENABLE APPROVED IPPs
The REIPPP has to date procured around 6 401 MW of energy from 106 IPP projects. Since
2011, 64 projects (3 924 MW) of the REIPPP were connected with the national grid, 96%
(3 774 MW) of which are in commercial operation. This new generation capacity is vital in
meeting the needs of the economy as well as the objectives of the Integrated Resource Plan
2010 (IRP2010). The grid integration of these projects has exhausted the grid capacity that
was previously available, particularly in the Northern Cape, Western Cape, and Eastern
Cape. Consequently, substantial grid infrastructure investments will be required to enable
power evacuation from the majority of locations within these provinces to integrate additional
IPPs.
The 26 preferred bidder projects in REIPPPP bid windows 4 and 4B are currently in the
financial closure phase and are expected to be connected with the national grid in the first
half of the current TDP period. Furthermore, the budget quotation process for the two
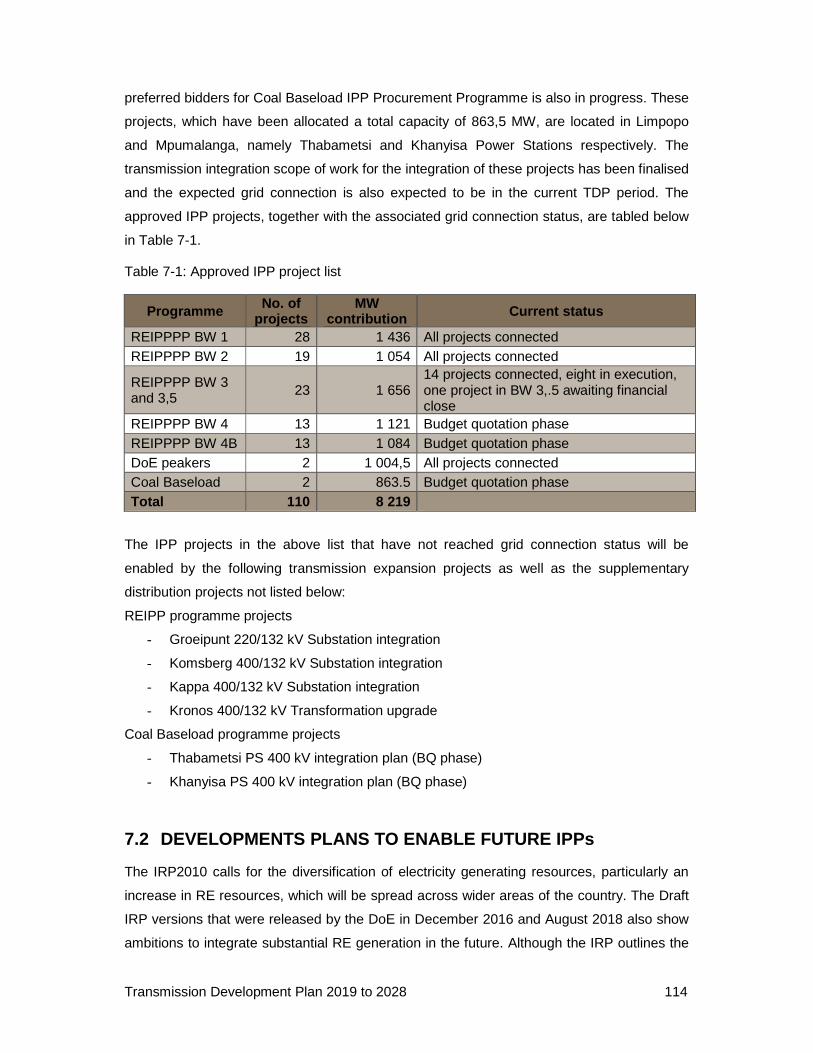
Transmission Development Plan 2019 to 2028 114
preferred bidders for Coal Baseload IPP Procurement Programme is also in progress. These
projects, which have been allocated a total capacity of 863,5 MW, are located in Limpopo
and Mpumalanga, namely Thabametsi and Khanyisa Power Stations respectively. The
transmission integration scope of work for the integration of these projects has been finalised
and the expected grid connection is also expected to be in the current TDP period. The
approved IPP projects, together with the associated grid connection status, are tabled below
in Table 7-1.
Table 7-1: Approved IPP project list
Programme No. of projects
MW contribution Current status
REIPPPP BW 1 28 1 436 All projects connected REIPPPP BW 2 19 1 054 All projects connected
REIPPPP BW 3 and 3,5 23 1 656
14 projects connected, eight in execution, one project in BW 3,.5 awaiting financial close
REIPPPP BW 4 13 1 121 Budget quotation phase REIPPPP BW 4B 13 1 084 Budget quotation phase DoE peakers 2 1 004,5 All projects connected Coal Baseload 2 863.5 Budget quotation phase Total 110 8 219
The IPP projects in the above list that have not reached grid connection status will be
enabled by the following transmission expansion projects as well as the supplementary
distribution projects not listed below:
REIPP programme projects
- Groeipunt 220/132 kV Substation integration
- Komsberg 400/132 kV Substation integration
- Kappa 400/132 kV Substation integration
- Kronos 400/132 kV Transformation upgrade
Coal Baseload programme projects
- Thabametsi PS 400 kV integration plan (BQ phase)
- Khanyisa PS 400 kV integration plan (BQ phase)
7.2 DEVELOPMENTS PLANS TO ENABLE FUTURE IPPs
The IRP2010 calls for the diversification of electricity generating resources, particularly an
increase in RE resources, which will be spread across wider areas of the country. The Draft
IRP versions that were released by the DoE in December 2016 and August 2018 also show
ambitions to integrate substantial RE generation in the future. Although the IRP outlines the
Transmission Development Plan 2019 to 2028 115
total capacity per technology to be connected per year, it does not indicate the geographical
location of the projects within South Africa. This spatial uncertainty makes it difficult to
formulate plans for grid enhancements, particularly for REIPPPP. The location of potential
sites for large-scale power generation from gas are relatively easy to predict compared to
REIPPPP, which minimises the risk to development as the network-enabling activities can
be initiated prior to the announcement of the preferred projects. This is because the
locations of gas-generation power plants are generally expected to be developed in close
proximity to existing ports along the coast of South Africa.
On the contrary, the location of the REIPPPP projects is only confirmed subsequent to the
announcement of the preferred bidders, which presents a risk to timeous development of the
enabling grid connection infrastructure, particularly long transmission lines and new
substations. The process to implement major transmission infrastructure projects could take
up to 10 years from inception to commissioning. The key components of the transmission
project development cycle resulting in this long project establishment timelines include
planning, environmental authorisation, land acquisition, procurement, and construction. In
contrast, the IPP plant infrastructure can be developed in relatively short periods at specific
locations. The disjoint in the length of time between IPP plant development and
establishment of backbone transmission infrastructure is thus of concern. If new
transmission projects are required for the IPPs, it is difficult for such projects to be delivered
within the desired target dates, which provides challenges for the future IPP programmes.
Eskom is fully committed to mitigating these challenges and enabling the execution of future
IPP procurement programmes in accordance with future ministerial determinations. A
number of initiatives have been undertaken to facilitate the connection of future DoE IPP
programmes to the national grid. These include:
• Establishment of the grid access unit (GAU) and the single buyer office to facilitate
the connection requests of IPP developers and the buying of the energy,
respectively;
• Creation of a simpler, efficient connection application process, specifically for all new
generation plant, which is applicable to both IPPs and new Eskom power plants;
• Recommending enhancement to the applicable grid codes and connection
agreements to encompass renewable generation plant;
• Publication of the grid connection capacity assessment (GCCA) document to guide
stakeholders to available network capacity in relation to the RE resources and across
the country for any type of IPP project;
Transmission Development Plan 2019 to 2028 116
• Commitment of resources to work closely with the DoE IPP Office, with the intention
of aligning the IPP programme with feasible network expansion plans;
• Introduction of a self-build procedure document that provides IPPs with the option to
“self-build” their own dedicated connection infrastructure as well as shared network in
exceptional cases;
• Identification of strategic transmission line routes to unlock network capacity to
connect future IPPs and collaborating with the Department of Environmental Affairs
(DEA) to complete strategic environmental impact assessments (SEAs) of these
routes;
• Participation in several external independent studies to identify the best resource
areas for development, such as renewable energy development zones (REDZs) and
the impact of the integration of large volumes of renewable energy generation; and
• Participation in the grid enablement working group to facilitate the development of the
Transmission and Sub-transmission grid for future IPPs.
7.2.1 Potential locations for future IPPs
The initial bid windows of the DoE REIPP Programme have taken advantage of the available
generation connection capacity on the existing transmission grid. Most of this capacity has
been rapidly allocated, especially in the areas with excellent RE resources like the Northern
Cape, Eastern Cape, and Western Cape. While there are still some areas with relatively
more connection capacity particularly in North West, Free State and Limpopo, the capacity
connection capacity in the Northern Cape, Eastern Cape and Western Cape areas has been
exhausted. Moreover, there are also a number of areas with very good RE resources that
have no transmission grid access at all.
The locations of the successful and shortlisted bidders in the REIPPPP Windows 1 to 4B are
known, as shown in Figure 7-2. The locations of the approved renewable generation as well
as the information on historical customer applications data was used to predict the potential
locations for future REIPP projects. In addition to this information, the REDZ study outcomes
and the EIA information for prospective REIPPs were incorporated into the input
assumptions to determine the potential volumes as well as the dispersion of future RE
resources.
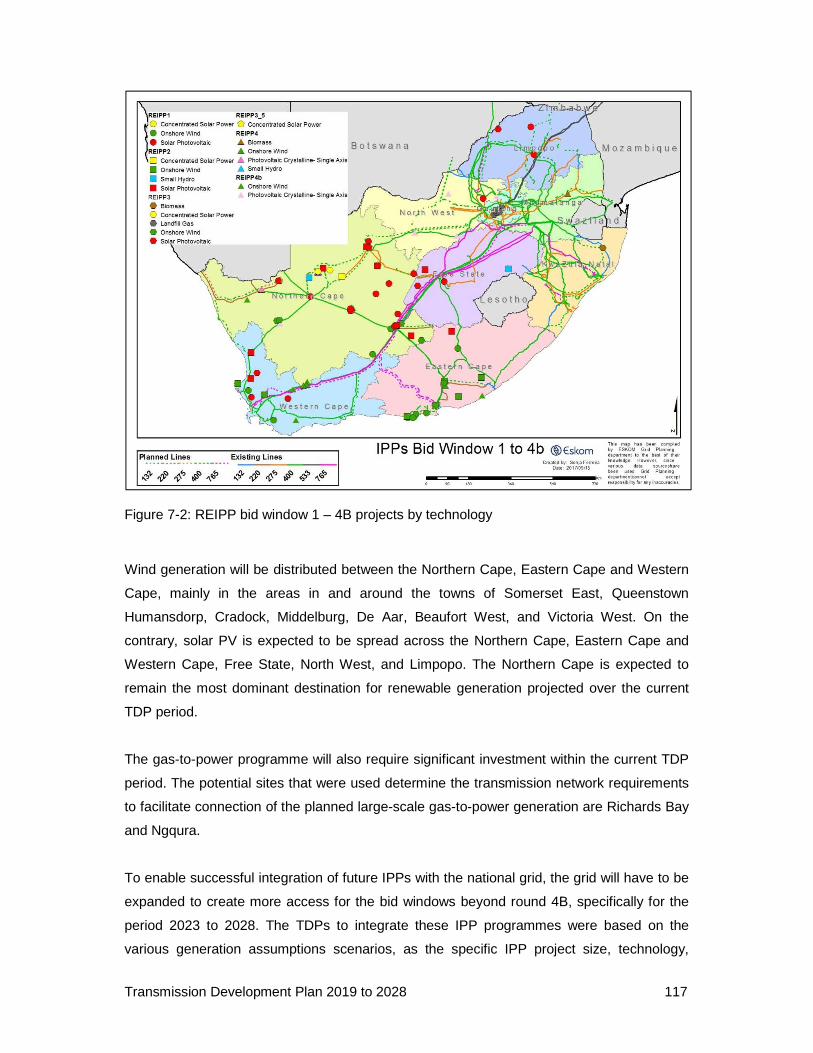
Transmission Development Plan 2019 to 2028 117
Figure 7-2: REIPP bid window 1 – 4B projects by technology
Wind generation will be distributed between the Northern Cape, Eastern Cape and Western
Cape, mainly in the areas in and around the towns of Somerset East, Queenstown
Humansdorp, Cradock, Middelburg, De Aar, Beaufort West, and Victoria West. On the
contrary, solar PV is expected to be spread across the Northern Cape, Eastern Cape and
Western Cape, Free State, North West, and Limpopo. The Northern Cape is expected to
remain the most dominant destination for renewable generation projected over the current
TDP period.
The gas-to-power programme will also require significant investment within the current TDP
period. The potential sites that were used determine the transmission network requirements
to facilitate connection of the planned large-scale gas-to-power generation are Richards Bay
and Ngqura.
To enable successful integration of future IPPs with the national grid, the grid will have to be
expanded to create more access for the bid windows beyond round 4B, specifically for the
period 2023 to 2028. The TDPs to integrate these IPP programmes were based on the
various generation assumptions scenarios, as the specific IPP project size, technology,

Transmission Development Plan 2019 to 2028 118
location, and timelines were not stated in the IRP. Scenario planning serves as a sensitivity
test to mitigate transmission infrastructure over-investment as the projects required to
integrate generation in all potential locations would lead to excess capacity in many areas,
as well as enormous requirement of capital to execute. Taking into account the generation
assumptions, IPP connection requests, internal assessments, independent studies, and
interactions with the DoE and other stakeholders, a number of potential transmission
infrastructure projects have been identified to enhance the transmission connection capacity
in the medium to long term, that is from 2023 to 2028, as well as the key transmission
projects to enable post TDP grid connection access for IPPs.
7.2.2 Transmission expansion plans for future REIPP s up to 2028
The following projects are proposed for N-1 compliance, as well as to enhance the grid
connection capacity for IPPs in the medium to long term, particularly in the Northern Cape,
Eastern Cape and Western Cape, which are perceived as the hub of future power
generation in South Africa. All these projects are expected to be commissioned within the
current TDP period.
- Gromis-Oranjemund 220 kV line
- Juno-Gromis 400 kV line
- Aggeneis-Paulputs 400 kV line (Operated at 220 kV)
- Aries-Upington 400 kV line
- Aggeneis-Nama-Gromis 400 kV line
- Aries, Aggeneis and Nama 400 kV integration
- Grassridge-Humansdorp (Thyspunt ) 400 kV line
Furthermore, a number of potential new substation sites have been identified. However,
provision for a total of two new transmission substations for IPP integration has been made
during this TDP period in additional to existing substations expansion for the same purpose
as shown below:
- Aries 400/132 kV integration (Expansion)
- Aggeneis 400/132 kV integration (Expansion)
- Gromis 400/132 kV integration (Expansion)
- Nama 400/132 kV integration (Expansion)
- Pembroke 400/132 kV integration (Expansion)
- Humansdorp (Thyspunt ) 400/132 kV new substation
- Hydra B 400/132 kV new substation
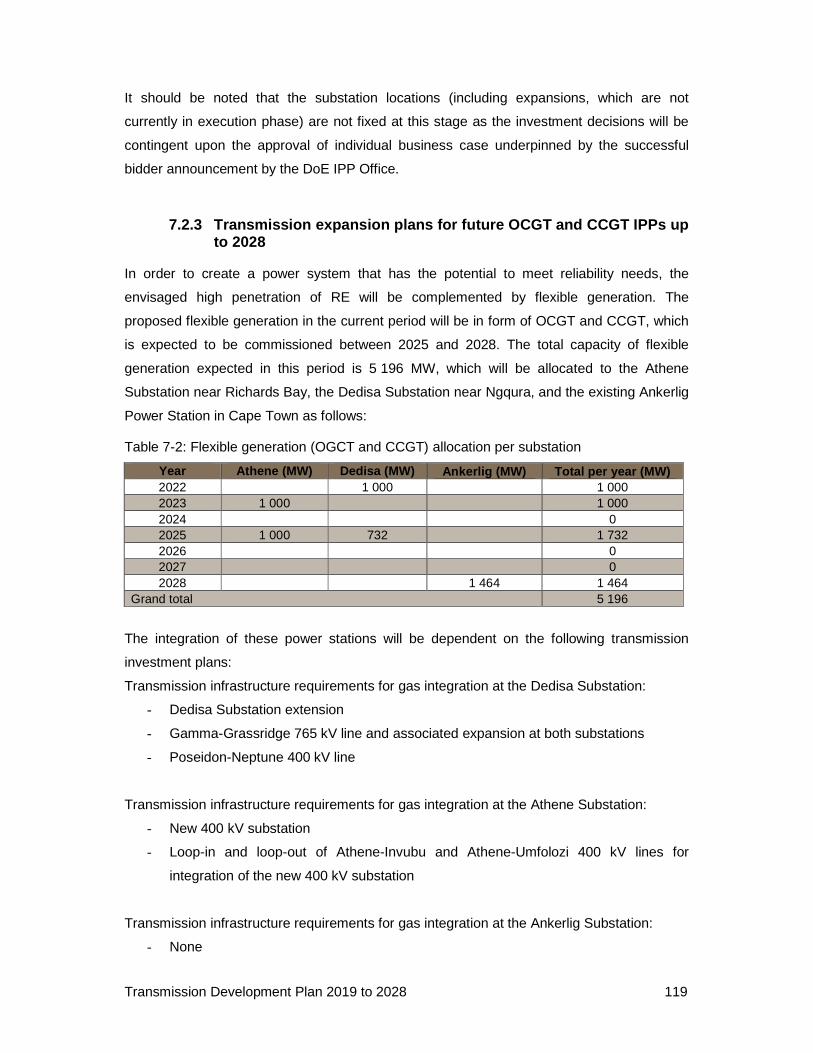
Transmission Development Plan 2019 to 2028 119
It should be noted that the substation locations (including expansions, which are not
currently in execution phase) are not fixed at this stage as the investment decisions will be
contingent upon the approval of individual business case underpinned by the successful
bidder announcement by the DoE IPP Office.
7.2.3 Transmission expansion plans for future OCGT and CCGT IPPs up to 2028
In order to create a power system that has the potential to meet reliability needs, the
envisaged high penetration of RE will be complemented by flexible generation. The
proposed flexible generation in the current period will be in form of OCGT and CCGT, which
is expected to be commissioned between 2025 and 2028. The total capacity of flexible
generation expected in this period is 5 196 MW, which will be allocated to the Athene
Substation near Richards Bay, the Dedisa Substation near Ngqura, and the existing Ankerlig
Power Station in Cape Town as follows:
Table 7-2: Flexible generation (OGCT and CCGT) allocation per substation
Year Athene (MW) Dedisa (MW) Ankerlig (MW) Total per year (MW) 2022 1 000 1 000 2023 1 000 1 000 2024 0 2025 1 000 732 1 732 2026 0 2027 0 2028 1 464 1 464
Grand total 5 196
The integration of these power stations will be dependent on the following transmission
investment plans:
Transmission infrastructure requirements for gas integration at the Dedisa Substation:
- Dedisa Substation extension
- Gamma-Grassridge 765 kV line and associated expansion at both substations
- Poseidon-Neptune 400 kV line
Transmission infrastructure requirements for gas integration at the Athene Substation:
- New 400 kV substation
- Loop-in and loop-out of Athene-Invubu and Athene-Umfolozi 400 kV lines for
integration of the new 400 kV substation
Transmission infrastructure requirements for gas integration at the Ankerlig Substation:
- None
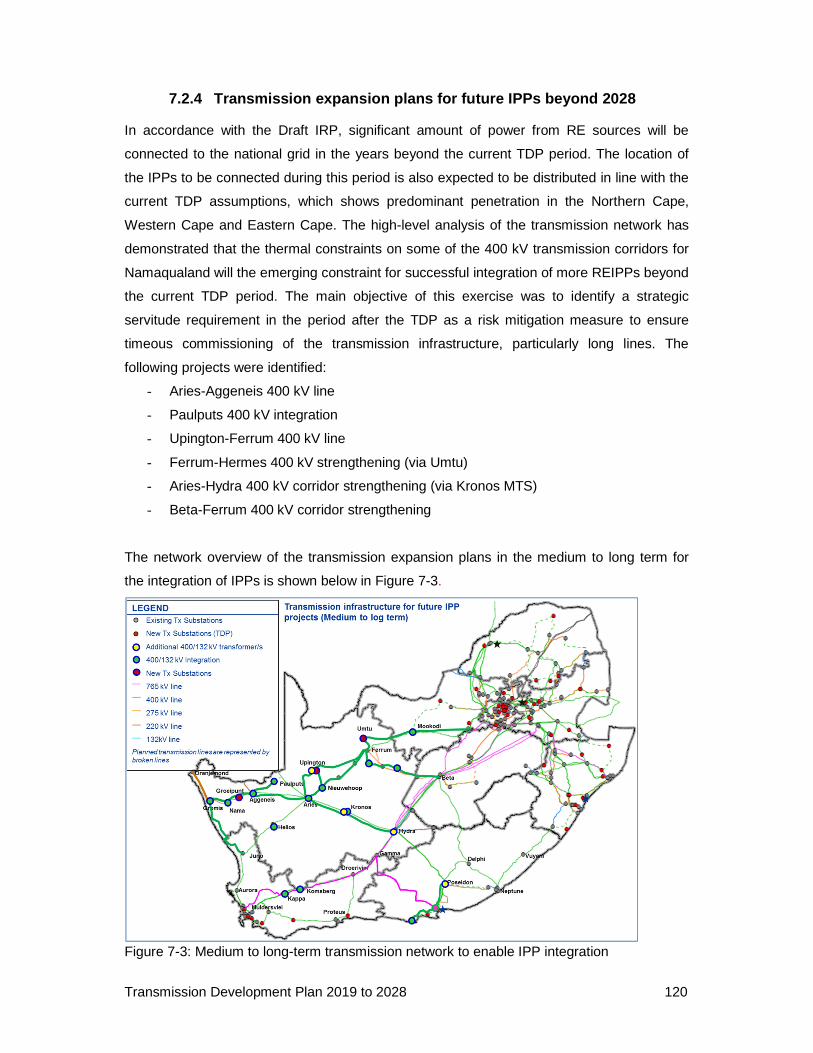
Transmission Development Plan 2019 to 2028 120
7.2.4 Transmission expansion plans for future IPPs beyond 2028
In accordance with the Draft IRP, significant amount of power from RE sources will be
connected to the national grid in the years beyond the current TDP period. The location of
the IPPs to be connected during this period is also expected to be distributed in line with the
current TDP assumptions, which shows predominant penetration in the Northern Cape,
Western Cape and Eastern Cape. The high-level analysis of the transmission network has
demonstrated that the thermal constraints on some of the 400 kV transmission corridors for
Namaqualand will the emerging constraint for successful integration of more REIPPs beyond
the current TDP period. The main objective of this exercise was to identify a strategic
servitude requirement in the period after the TDP as a risk mitigation measure to ensure
timeous commissioning of the transmission infrastructure, particularly long lines. The
following projects were identified:
- Aries-Aggeneis 400 kV line
- Paulputs 400 kV integration
- Upington-Ferrum 400 kV line
- Ferrum-Hermes 400 kV strengthening (via Umtu)
- Aries-Hydra 400 kV corridor strengthening (via Kronos MTS)
- Beta-Ferrum 400 kV corridor strengthening
The network overview of the transmission expansion plans in the medium to long term for
the integration of IPPs is shown below in Figure 7-3.
Figure 7-3: Medium to long-term transmission network to enable IPP integration
Transmission Development Plan 2019 to 2028 121
7.3 IMPACT OF THE DOE GENERATION SCENARIOS
The TDP is based on the baseline generation assumptions. To adjust for spatial uncertainty
and allow for prudent planning, generation scenarios were agreed upon by the stakeholders
during assumptions formulation phase. The scenarios are aimed at facilitating more robust
plans and help in expediting the EIA and land acquisition processes. The period of
consideration for these scenarios was 2028, as only the full impact was considered, not the
phased roll-out of these scenarios.
These generation scenarios are listed below and the specific assumptions and likely impact
of each scenario are discussed separately. The different scenarios, as introduced earlier in
this chapter, are as follows:
• Limpopo PV scenario
• Northern Cape wind scenario
• Western Cape wind, gas and nuclear scenario
• Generation decommissioning of coal plant older than 50 years
7.3.1 Limpopo PV scenario
Limpopo has a huge potential of power generation from renewable sources, specifically
solar. There are currently three projects that have been allocated generation capacity from
the approved REIPPPP id windows. There have also been several enquiries from potential
PV generators in the province. The following scenario was considered for additional solar PV
generation in Limpopo by 2028:
Solar PV generation amounting to a total of 1 000 MW moved from the Northern Cape to
Limpopo as an alternative to the baseline allocation. The additional solar PV generation
capacity output was allocated at the following substations to test robustness of the planned
TDP in the province:
• Medupi
• Witkop
• Nzhelele
• Tabor
• Spencer
• Foskor
Transmission Development Plan 2019 to 2028 122
It was observed that, this scenario will not require additional infrastructure investment in
Limpopo for power evacuation purposes. However, the evacuation of additional power is
contingent upon completion of the following projects, which are currently in execution:
• Waterberg Generation 400 kV stability enhancement, consisting of Medupi-Witkop
400 kV line and Borutho-Silimela 400 kV line.
7.3.2 Northern Cape wind scenario
The Northern Cape is an ideal location for generation from renewable sources in South
Africa. The majority of approved projects under the REIPPPP to date are located in the
Northern Cape. Moreover, the highest number of applications processed for the REIPPPP
expedited programme was located in the Northern Cape, which confirms the province as the
hub of generation from renewable sources. The following scenario was considered for
additional wind generation in the Northern Cape by 2028:
Wind generation amounting to a total of 2 200 MW moved to the Northern Cape as an
alternative to the baseline allocation. This total capacity output was allocated to the following
substations in the Northern Cape in order to test network agility to accommodate the
potential generation under this scenario:
• Aries
• Kronos
• Gamma
• Nama
• Gromis
• Aggeneis
• Oranjemund
• Hydra B
The study took into account the massive diversity between the Northern Cape and the
Eastern Cape, and Western Cape wind generation. The following strengthening projects
were recommended to evacuate additional power from wind generation in the Northern
Cape:
• In addition to the Juno-Gromis 400 kV line, this scenario will require Gromis-Nama-
Aggeneis 400 kV line: This project will enable the evacuation of the anticipated
renewable generation in the Namaqualand CLN under the Northern Cape wind
generation scenario through the Juno and Aries Substations.
Transmission Development Plan 2019 to 2028 123
7.3.3 Western Cape wind, gas and nuclear scenario
There are two designated REDZs in the Western Cape, namely Overberg and Komsberg.
These have been identified as areas with high potential for RE generation and were gazetted
as such in February 2016.
The Western Cape is also one of the prime locations for wind generation in South Africa with
some potential for PV generation, as well as for nuclear and gas generation. There have
been several enquiries for large-scale potential gas-generation integration in the vicinity of
Atlantis, near Ankerlig Power Station. As a result of this, the following scenario was
conceived for additional generation in the Western Cape by 2028:
• 732 MW of CCGT gas is relocated from Dedisa in the Eastern Cape to Ankerlig in the
Western Cape.
• A total of around 1 000 MW of wind was moved from the Eastern Cape and Northern
Cape to the Western Cape.
• An allocation of 1 600 MW of nuclear generation at Duynefontein in the Western
Cape in 2028 to test the network in the case of eventual trigger for the construction of
nuclear capacity in country.
For renewable generation, this is in addition to what has already been commissioned or
allocated to preferred bidder up to REIPPPP bid window 4B. This scenario results in the
Western Cape becoming a net exporter of power, with as much as 6 GW of excess
generation. Additional infrastructure will be required to evacuate the power from the Western
Cape; this will be in the form of 765 kV and 400 kV lines, especially in the northern ring.
Integration plans for the nuclear and gas have already been developed and the renewable
generation will require mostly additional transformers at existing substations. For the most
part, the line routes lie within the recently gazetted electricity grid infrastructure (EGI)
corridors. Furthermore, some environmental authorisations are already in place for the lines
required for the Nuclear 1 Integration at Duynefontein.
The project scope for the integration of Nuclear 1 is dependent on the completion of the
second Gamma-Kappa 765 kV line and the second Kappa-Sterrekus 765 kV line as part of
Cape Corridor phase 4. Moreover, the following six Transmission lines will be required to
integrate Duynefontein with the national grid:
• 3 x 400 kV lines to Sterrekus (3 x ~10 km)
• 1 x 400 kV line to Acacia (~32 km)
Transmission Development Plan 2019 to 2028 124
• 2 x 400 kV lines to Stikland (~2 x 46 km)
The Transmission infrastructure required to integrate renewables in the Overberg and
Komsberg areas comprises the following:
• Additional 400/132 kV transformers in existing substations, that is, Droërivier, Kappa
and Komsberg.
• Establishment of Koring Substation between Droërivier and Komsberg by turning in
the Droërivier-Komsberg 2 400 kV line and bypassing the Komsberg 2 series
capacitor bank.
Additional infrastructure over and above this will be required to deliver the power to the load
centres in the central and eastern parts of the country. This scope builds on strengthening
provided by projects such as Kimberley strengthening phase 4, the proposed Cape Corridor
phase 5 as well as the Prieska Solar Park integration.
A second 765 kV line from Mercury to Sterrekus will need to be established. There is also a
need to provide an additional 400 kV evacuation path out of Kronos. The backbone
strengthening can be summarised as follows:
• A second Mercury-Sterrekus 765 kV line with series compensation between Lereko
(Hotazel) and Mercury.
• An additional 765/400 kV transformation at Juno, Aries and Lereko (Hotazel),
Sterrekus, Hydra, and Zeus
• 1 x Kronos-Ferrum 400 kV line
• 1 x Kronos-Boundary-Beta 400 kV line
7.3.4 Generation Decommissioning of coal Plant olde r than 50 years
This scenario considers the decommissioning of some of the old coal-fired power stations in
Mpumalanga within the period of the current TDP. The criteria for identifying the power
stations likely to be affected by this hypothetical decommissioning are power stations with 50
years of commercial service and above. The units that will reach the age of 50 years within
the current TDP and considered for decommissioning as part of this scenario are at Arnot,
Camden, and Kriel Power Stations:
The network analysis results indicated that no additional infrastructure investment will be
required to enable the level of decommissioning that is higher than assumed in the base
scenario. However, additional generation will be required elsewhere in the country to offset
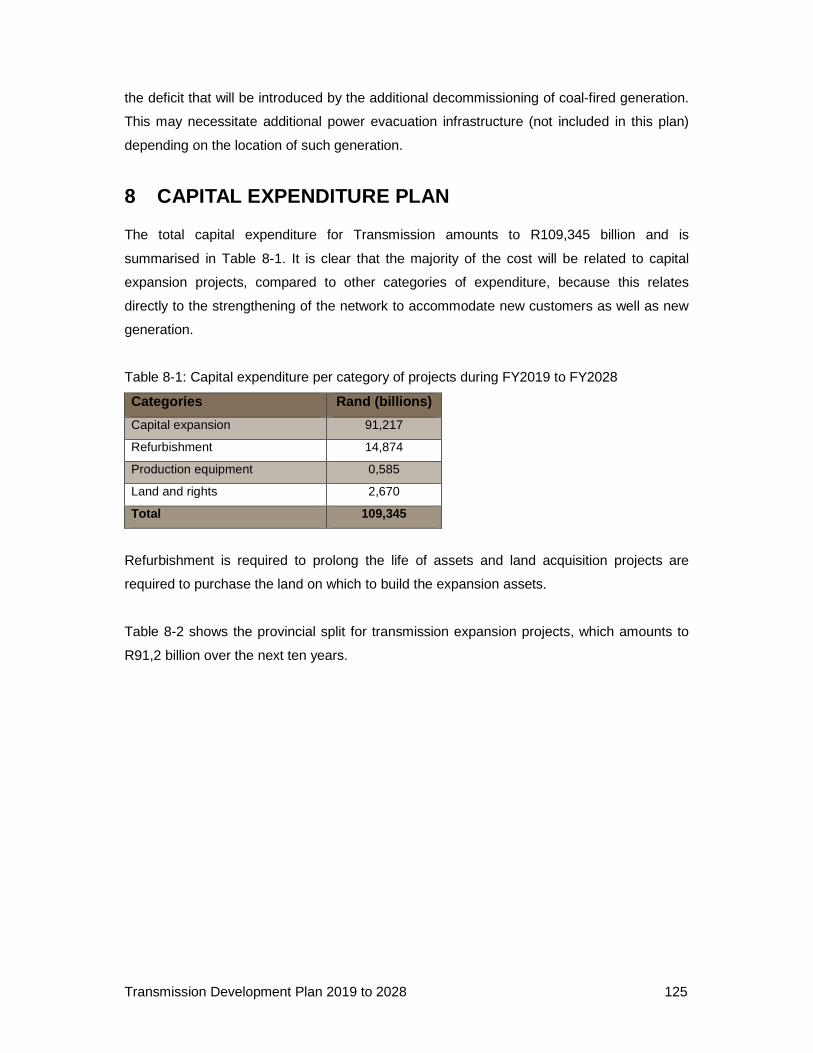
Transmission Development Plan 2019 to 2028 125
the deficit that will be introduced by the additional decommissioning of coal-fired generation.
This may necessitate additional power evacuation infrastructure (not included in this plan)
depending on the location of such generation.
8 CAPITAL EXPENDITURE PLAN
The total capital expenditure for Transmission amounts to R109,345 billion and is
summarised in Table 8-1. It is clear that the majority of the cost will be related to capital
expansion projects, compared to other categories of expenditure, because this relates
directly to the strengthening of the network to accommodate new customers as well as new
generation.
Table 8-1: Capital expenditure per category of projects during FY2019 to FY2028
Categories Rand (billions)
Capital expansion 91,217
Refurbishment 14,874
Production equipment 0,585
Land and rights 2,670
Total 109,345
Refurbishment is required to prolong the life of assets and land acquisition projects are
required to purchase the land on which to build the expansion assets.
Table 8-2 shows the provincial split for transmission expansion projects, which amounts to
R91,2 billion over the next ten years.
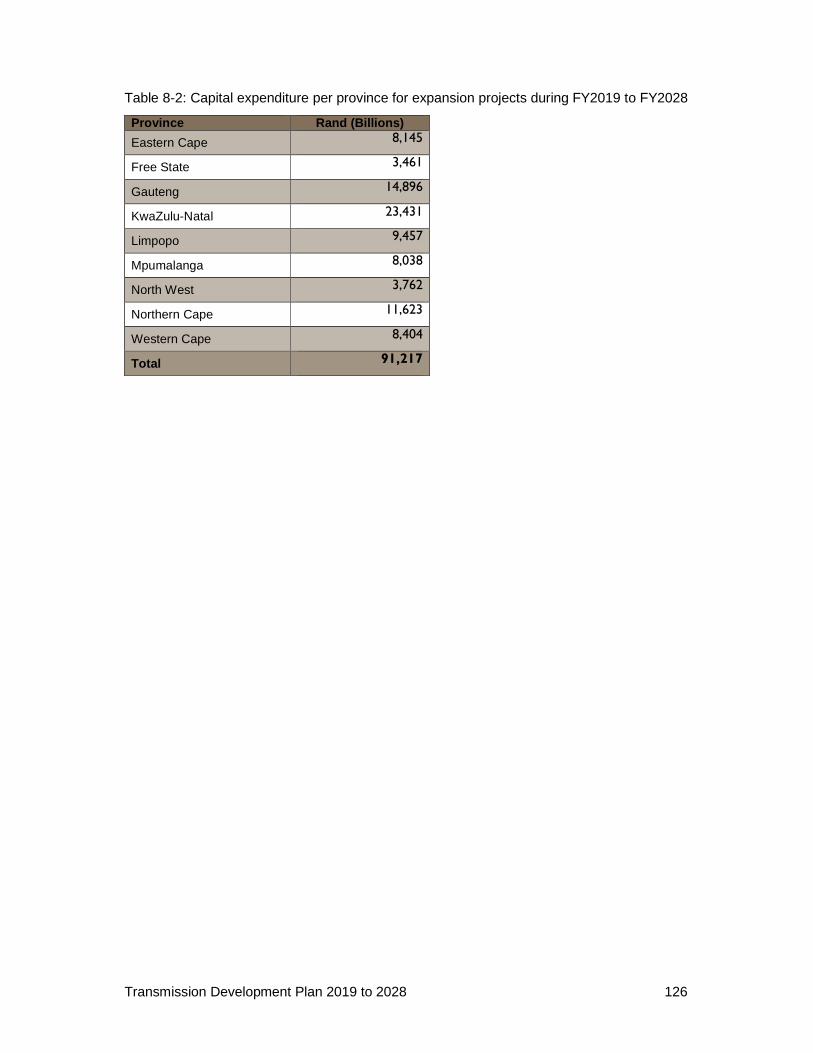
Transmission Development Plan 2019 to 2028 126
Table 8-2: Capital expenditure per province for expansion projects during FY2019 to FY2028
Province Rand (Billions)
Eastern Cape 8,145
Free State 3,461
Gauteng 14,896
KwaZulu-Natal 23,431
Limpopo 9,457
Mpumalanga 8,038
North West 3,762
Northern Cape 11,623
Western Cape 8,404
Total 91,217
Transmission Development Plan 2019 to 2028 127
9 CONCLUSION
The most visible difference between this TDP and the 2015 TDP is the rephasing of projects
in the execution phase. The acquisition of servitudes for lines and sites for new substations
continues to be a challenge for Eskom Transmission, sometimes necessitating rephasing.
Projects required for the first three rounds of the DoE REIPPPP that are under construction
have been added, as well as the projects required for the 26 additional IPP successful
bidders announced by the DoE in rounds 4 and 4B. There is an assumed plan for future
REIPP programmes based on current estimates of technology, size, and location.
The result is a realistic and achievable development plan, within the constraints imposed by
funding, site and servitude acquisition, and supplier and construction lead times. The slower
rate of completion of projects, regrettably, increases the overall risk to the network. However,
this risk can be managed, as the N-1 criterion refers to the strict deterministic level, which
assumes that an N-1 contingency event will happen at the time of the peak loading. In
reality, there is a limited chance of this happening and operational mitigation plans will cater
for most of the events until the required projects have been completed. Some of the risk
mitigation measures under consideration include higher reliance on the following: utilisation
of strategic spares, the use of capacitors in the short term for voltage support, as well as
emergency preparedness plans. Customers are consulted when compiling or reviewing
emergency preparedness plans to ensure that emergencies necessitating load reduction are
managed in a way that minimises the impact on individual customers and South Africa at
large.
Robust and efficient planning requires the timely exchange of credible information between
stakeholders. In particular, stakeholders are requested to note that spatial data and
information are critical for the effective planning and development of the transmission
network. Transmission infrastructure is generally on the critical path of connecting and
integrating large new loads and generation due to the long lead times for securing corridors.
It is recommended that, for planning purposes, developers should allow for at least seven
years’ lead time for new corridors. It should also be noted that, in the EIA process, there are
increasing objections from landowners and other stakeholders to proposed power line
routes, which may further prolong the time to implement projects. The EIA and
environmental approval process is prescribed by law. Changes to the relevant environmental
legislation can therefore have a significant effect on lead times for new projects.
Transmission Development Plan 2019 to 2028 128
The Transmission projects in this TDP will result in the overall network becoming grid code
compliant, while catering for increased load growth and the integration of new generation,
albeit at a later date than previously envisaged mainly due to funding constraints.
Transmission Development Plan 2019 to 2028 129
APPENDIX A: GENERATION ASSUMPTIONS
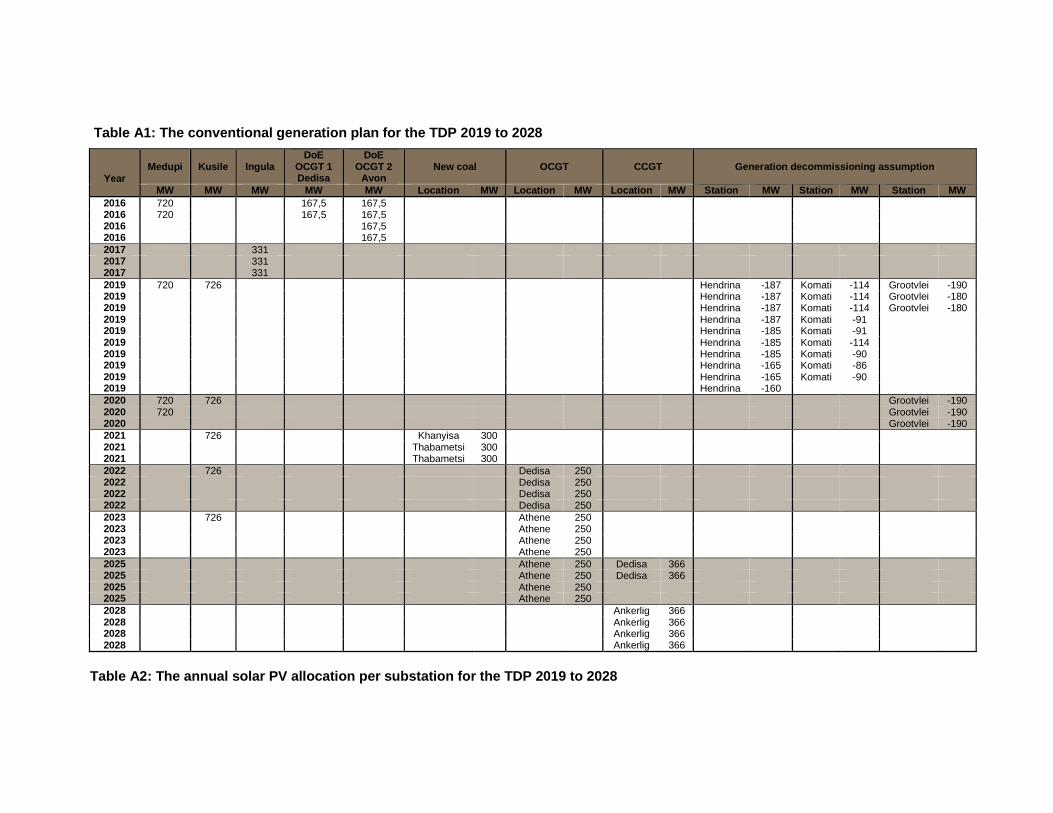
Table A1: The conventional generation plan for the TDP 2019 to 2028
Year
Medupi Kusile Ingula DoE
OCGT 1 Dedisa
DoE OCGT 2
Avon New coal OCGT CCGT Generation decommissioning assumption
MW MW MW MW MW Location MW Location MW Location MW Station MW Station MW Station MW 2016 720 167,5 167,5 2016 720 167,5 167,5 2016 167,5 2016 167,5 2017 331 2017 331 2017 331 2019 720 726 Hendrina -187 Komati -114 Grootvlei -190 2019 Hendrina -187 Komati -114 Grootvlei -180 2019 Hendrina -187 Komati -114 Grootvlei -180 2019 Hendrina -187 Komati -91 2019 Hendrina -185 Komati -91 2019 Hendrina -185 Komati -114 2019 Hendrina -185 Komati -90 2019 Hendrina -165 Komati -86 2019 Hendrina -165 Komati -90 2019 Hendrina -160 2020 720 726 Grootvlei -190 2020 720 Grootvlei -190 2020 Grootvlei -190 2021 726 Khanyisa 300 2021 Thabametsi 300 2021 Thabametsi 300 2022 726 Dedisa 250 2022 Dedisa 250 2022 Dedisa 250 2022 Dedisa 250 2023 726 Athene 250 2023 Athene 250 2023 Athene 250 2023 Athene 250 2025 Athene 250 Dedisa 366 2025 Athene 250 Dedisa 366 2025 Athene 250 2025 Athene 250 2028 Ankerlig 366 2028 Ankerlig 366 2028
Ankerlig 366
2028 Ankerlig 366
Table A2: The annual solar PV allocation per substa tion for the TDP 2019 to 2028
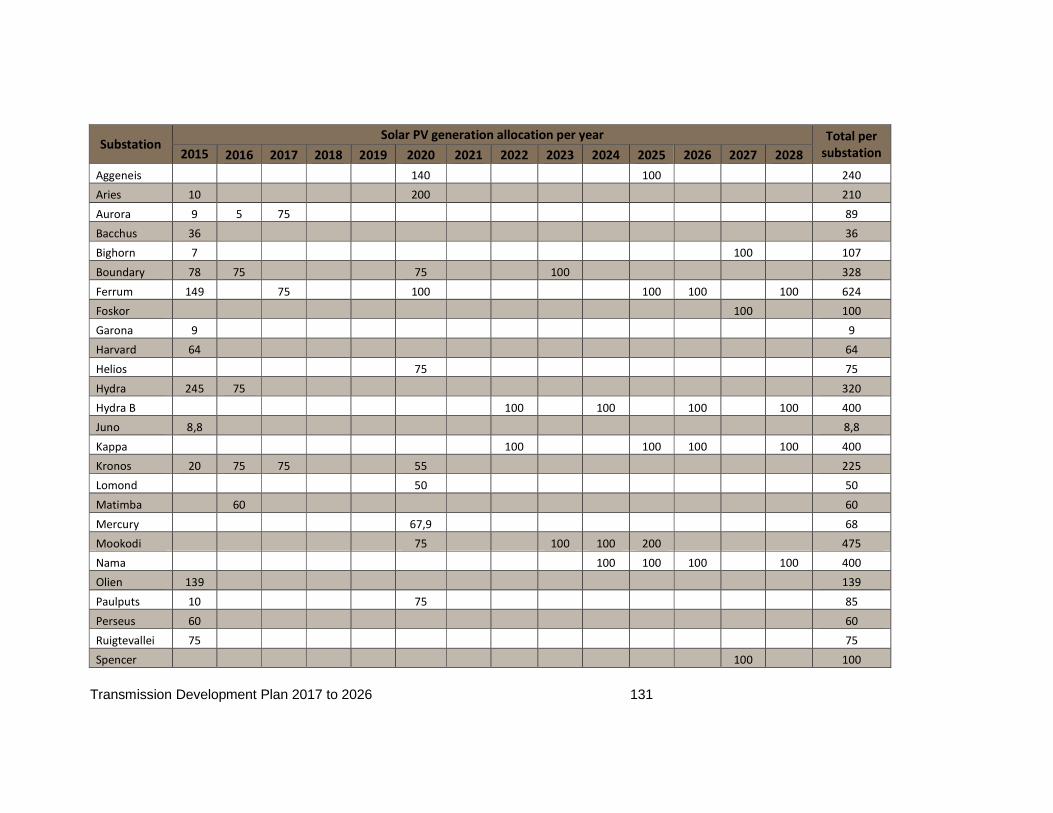
Transmission Development Plan 2017 to 2026 131
Substation Solar PV generation allocation per year Total per
substation 2015 2016 2017 2018 2019 2020 2021 2022 2023 2024 2025 2026 2027 2028
Aggeneis 140 100 240
Aries 10 200 210
Aurora 9 5 75 89
Bacchus 36 36
Bighorn 7 100 107
Boundary 78 75 75 100 328
Ferrum 149 75 100 100 100 100 624
Foskor 100 100
Garona 9 9
Harvard 64 64
Helios 75 75
Hydra 245 75 320
Hydra B 100 100 100 100 400
Juno 8,8 8,8
Kappa 100 100 100 100 400
Kronos 20 75 75 55 225
Lomond 50 50
Matimba 60 60
Mercury 67,9 68
Mookodi 75 100 100 200 475
Nama 100 100 100 100 400
Olien 139 139
Paulputs 10 75 85
Perseus 60 60
Ruigtevallei 75 75
Spencer 100 100
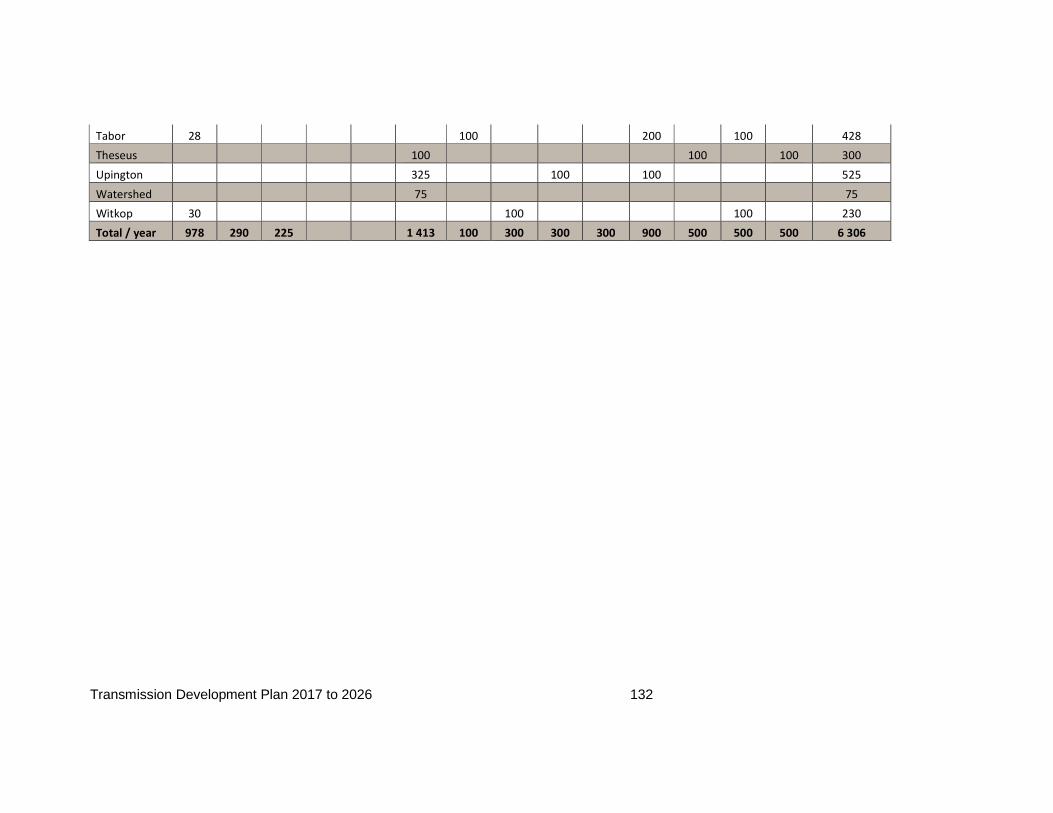
Transmission Development Plan 2017 to 2026 132
Tabor 28 100 200 100 428
Theseus 100 100 100 300
Upington 325 100 100 525
Watershed 75 75
Witkop 30 100 100 230
Total / year 978 290 225 1 413 100 300 300 300 900 500 500 500 6 306
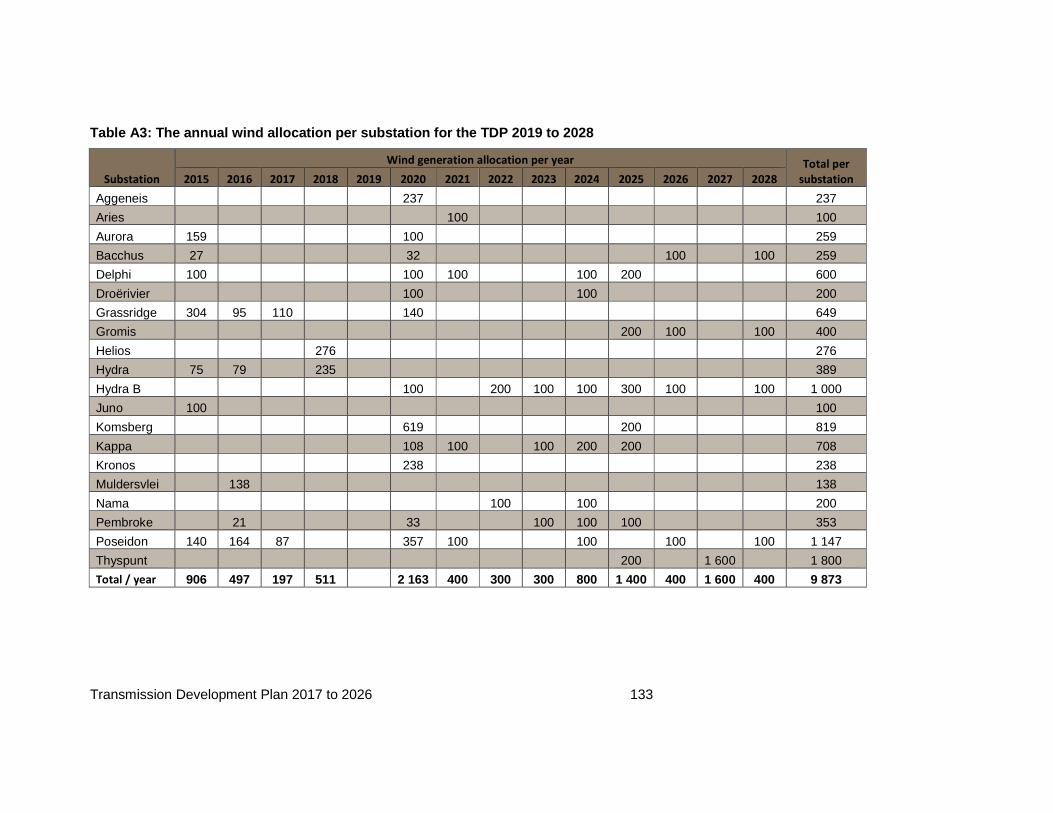
Transmission Development Plan 2017 to 2026 133
Table A3: The annual wind allocation per substation for the TDP 2019 to 2028
Substation
Wind generation allocation per year Total per
substation 2015 2016 2017 2018 2019 2020 2021 2022 2023 2024 2025 2026 2027 2028
Aggeneis 237 237
Aries 100 100
Aurora 159 100 259
Bacchus 27 32 100 100 259
Delphi 100 100 100 100 200 600
Droërivier 100 100 200
Grassridge 304 95 110 140 649
Gromis 200 100 100 400
Helios 276 276
Hydra 75 79 235 389
Hydra B 100 200 100 100 300 100 100 1 000
Juno 100 100
Komsberg 619 200 819
Kappa 108 100 100 200 200 708
Kronos 238 238
Muldersvlei 138 138
Nama 100 100 200
Pembroke 21 33 100 100 100 353
Poseidon 140 164 87 357 100 100 100 100 1 147
Thyspunt 200 1 600 1 800
Total / year 906 497 197 511
2 163 400 300 300 800 1 400 400 1 600 400 9 873
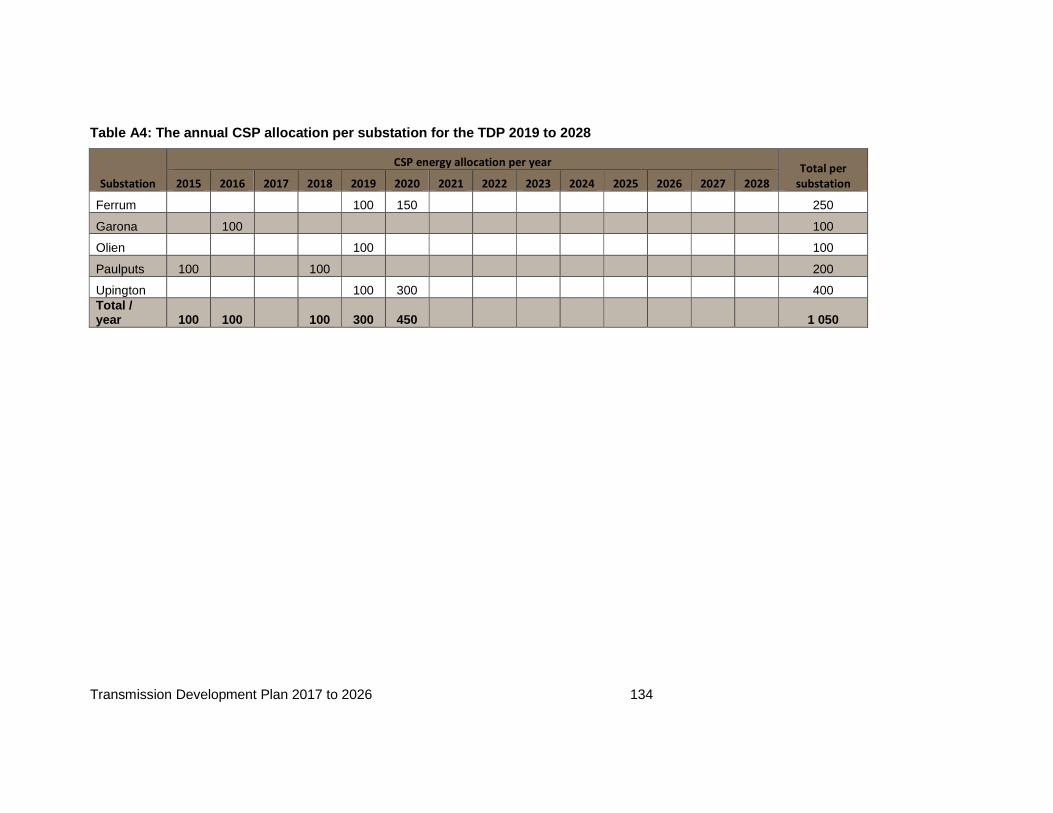
Transmission Development Plan 2017 to 2026 134
Table A4: The annual CSP allocation per substation for the TDP 2019 to 2028
Substation
CSP energy allocation per year Total per
substation 2015 2016 2017 2018 2019 2020 2021 2022 2023 2024 2025 2026 2027 2028
Ferrum 100 150 250
Garona 100 100
Olien 100 100
Paulputs 100 100 200
Upington 100 300 400 Total / year 100 100
100 300 450
1 050
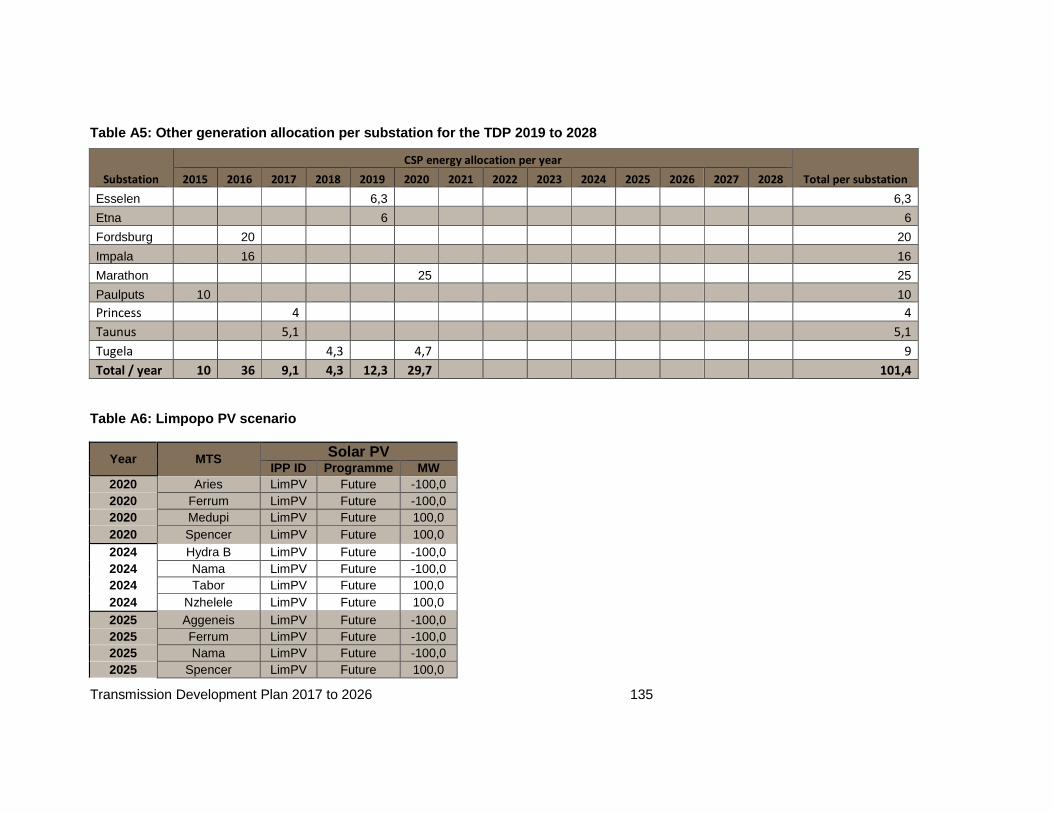
Transmission Development Plan 2017 to 2026 135
Table A5: Other generation allocation per substatio n for the TDP 2019 to 2028
Substation
CSP energy allocation per year
Total per substation 2015 2016 2017 2018 2019 2020 2021 2022 2023 2024 2025 2026 2027 2028
Esselen 6,3 6,3
Etna 6 6
Fordsburg 20 20
Impala 16 16
Marathon 25 25
Paulputs 10 10
Princess 4 4
Taunus 5,1 5,1
Tugela 4,3 4,7 9
Total / year 10 36 9,1 4,3 12,3 29,7 101,4
Table A6: Limpopo PV scenario
Year MTS Solar PV IPP ID Program me MW
2020 Aries LimPV Future -100,0 2020 Ferrum LimPV Future -100,0 2020 Medupi LimPV Future 100,0 2020 Spencer LimPV Future 100,0 2024 Hydra B LimPV Future -100,0 2024 Nama LimPV Future -100,0 2024 Tabor LimPV Future 100,0 2024 Nzhelele LimPV Future 100,0 2025 Aggeneis LimPV Future -100,0 2025 Ferrum LimPV Future -100,0 2025 Nama LimPV Future -100,0 2025 Spencer LimPV Future 100,0
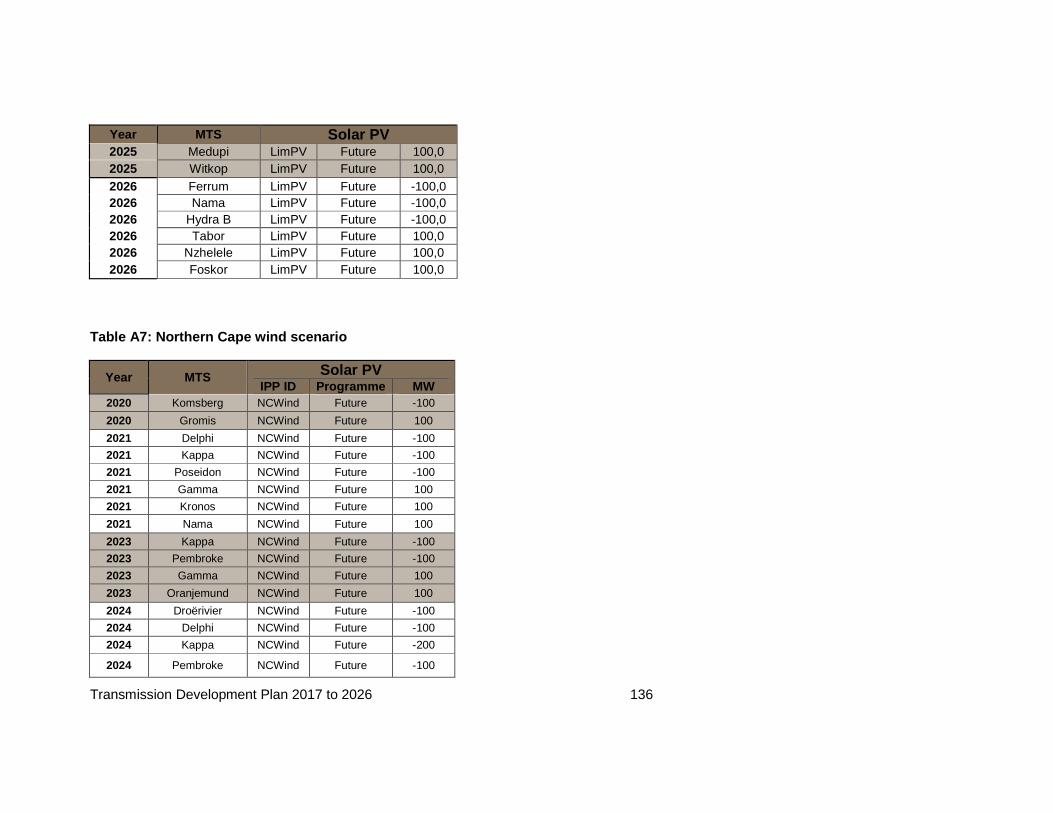
Transmission Development Plan 2017 to 2026 136
Year MTS Solar PV 2025 Medupi LimPV Future 100,0 2025 Witkop LimPV Future 100,0 2026 Ferrum LimPV Future -100,0 2026 Nama LimPV Future -100,0 2026 Hydra B LimPV Future -100,0 2026 Tabor LimPV Future 100,0 2026 Nzhelele LimPV Future 100,0 2026 Foskor LimPV Future 100,0
Table A7: Northern Cape wind scenario
Year MTS Solar PV IPP ID Program me MW
2020 Komsberg NCWind Future -100
2020 Gromis NCWind Future 100
2021 Delphi NCWind Future -100
2021 Kappa NCWind Future -100
2021 Poseidon NCWind Future -100
2021 Gamma NCWind Future 100
2021 Kronos NCWind Future 100
2021 Nama NCWind Future 100
2023 Kappa NCWind Future -100
2023 Pembroke NCWind Future -100
2023 Gamma NCWind Future 100
2023 Oranjemund NCWind Future 100
2024 Droërivier NCWind Future -100
2024 Delphi NCWind Future -100
2024 Kappa NCWind Future -200
2024 Pembroke NCWind Future -100
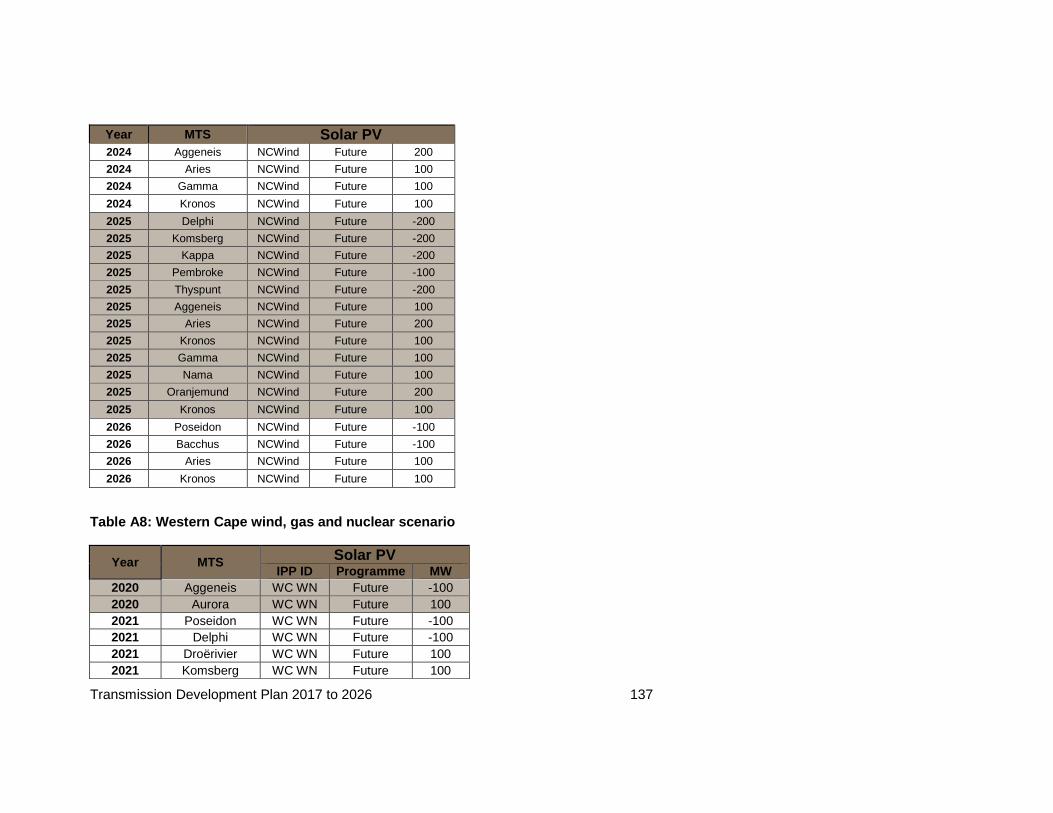
Transmission Development Plan 2017 to 2026 137
Year MTS Solar PV 2024 Aggeneis NCWind Future 200
2024 Aries NCWind Future 100
2024 Gamma NCWind Future 100
2024 Kronos NCWind Future 100
2025 Delphi NCWind Future -200
2025 Komsberg NCWind Future -200
2025 Kappa NCWind Future -200
2025 Pembroke NCWind Future -100
2025 Thyspunt NCWind Future -200
2025 Aggeneis NCWind Future 100
2025 Aries NCWind Future 200
2025 Kronos NCWind Future 100
2025 Gamma NCWind Future 100
2025 Nama NCWind Future 100
2025 Oranjemund NCWind Future 200
2025 Kronos NCWind Future 100
2026 Poseidon NCWind Future -100
2026 Bacchus NCWind Future -100
2026 Aries NCWind Future 100
2026 Kronos NCWind Future 100
Table A8: Western Cape wind, gas and nuclear scenar io
Year MTS Solar PV IPP ID Program me MW
2020 Aggeneis WC WN Future -100 2020 Aurora WC WN Future 100 2021 Poseidon WC WN Future -100 2021 Delphi WC WN Future -100 2021 Droërivier WC WN Future 100 2021 Komsberg WC WN Future 100
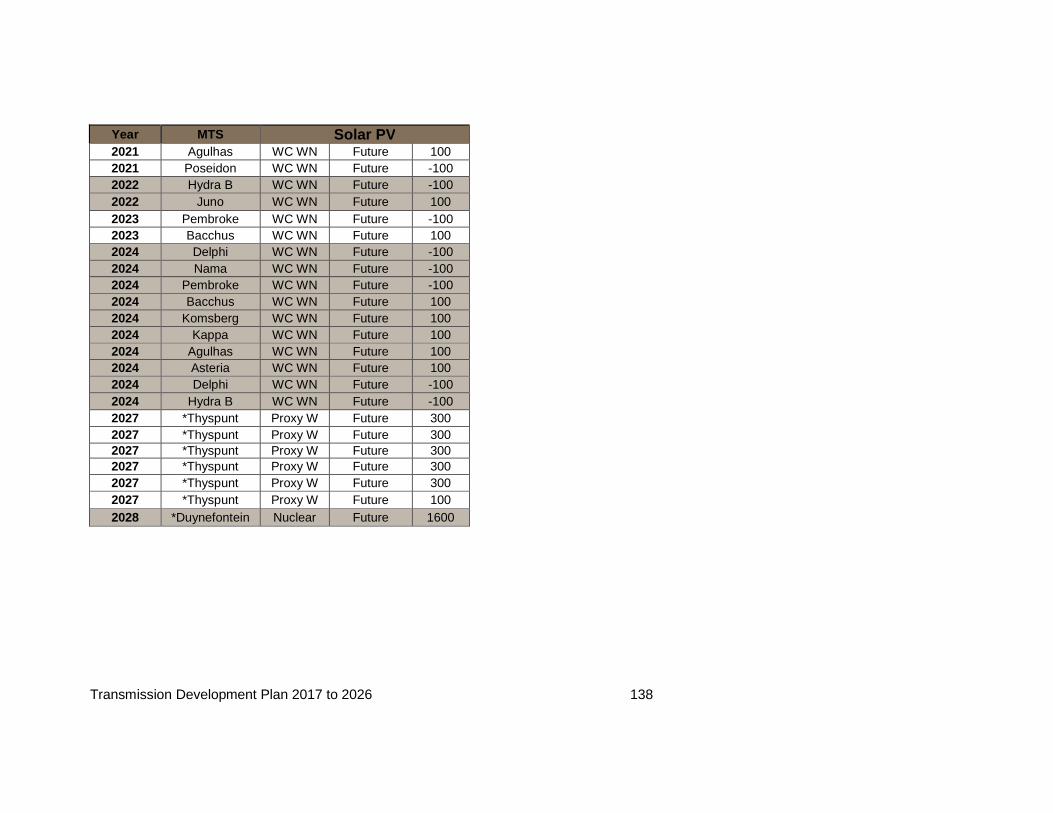
Transmission Development Plan 2017 to 2026 138
Year MTS Solar PV 2021 Agulhas WC WN Future 100 2021 Poseidon WC WN Future -100 2022 Hydra B WC WN Future -100 2022 Juno WC WN Future 100 2023 Pembroke WC WN Future -100 2023 Bacchus WC WN Future 100 2024 Delphi WC WN Future -100 2024 Nama WC WN Future -100 2024 Pembroke WC WN Future -100 2024 Bacchus WC WN Future 100 2024 Komsberg WC WN Future 100 2024 Kappa WC WN Future 100 2024 Agulhas WC WN Future 100 2024 Asteria WC WN Future 100 2024 Delphi WC WN Future -100 2024 Hydra B WC WN Future -100 2027 *Thyspunt Proxy W Future 300 2027 *Thyspunt Proxy W Future 300 2027 *Thyspunt Proxy W Future 300 2027 *Thyspunt Proxy W Future 300 2027 *Thyspunt Proxy W Future 300 2027 *Thyspunt Proxy W Future 100 2028 *Duynefontein Nuclear Future 1600
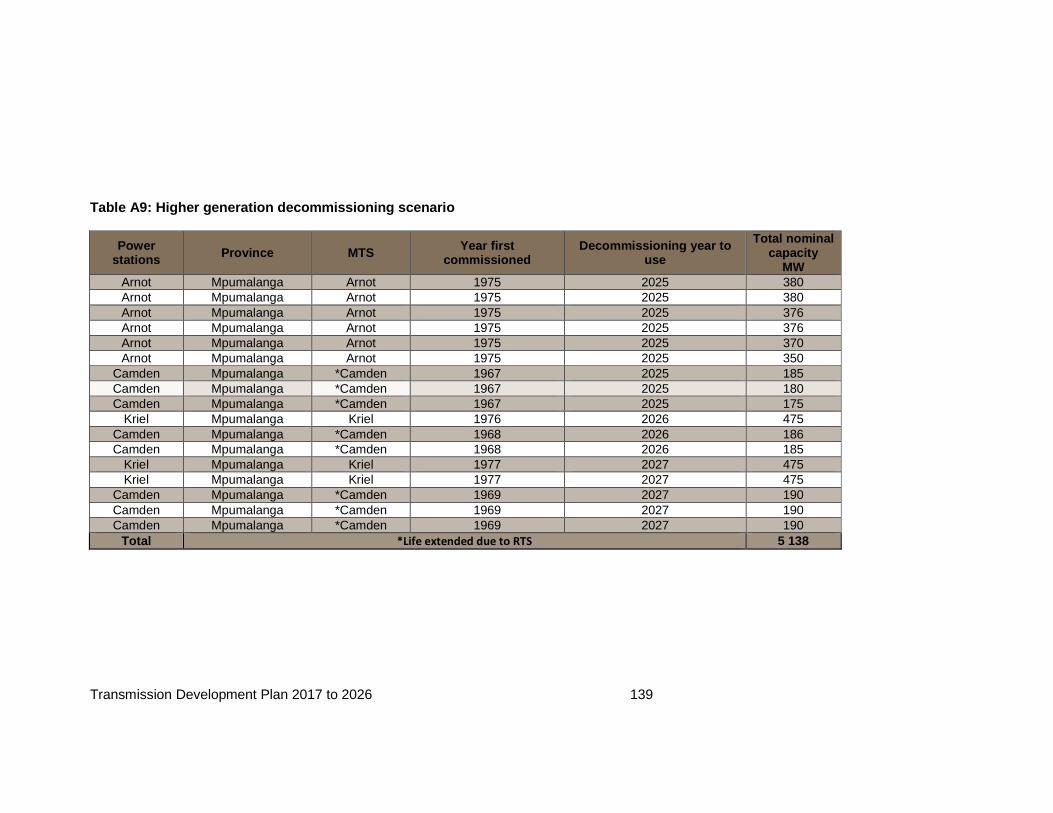
Transmission Development Plan 2017 to 2026 139
Table A9: Higher generation decommissioning scenari o
Power stations Province MTS Year first
commissioned Decommissioning year to
use
Total nominal capacity
MW Arnot Mpumalanga Arnot 1975 2025 380 Arnot Mpumalanga Arnot 1975 2025 380 Arnot Mpumalanga Arnot 1975 2025 376 Arnot Mpumalanga Arnot 1975 2025 376 Arnot Mpumalanga Arnot 1975 2025 370 Arnot Mpumalanga Arnot 1975 2025 350
Camden Mpumalanga *Camden 1967 2025 185 Camden Mpumalanga *Camden 1967 2025 180 Camden Mpumalanga *Camden 1967 2025 175
Kriel Mpumalanga Kriel 1976 2026 475 Camden Mpumalanga *Camden 1968 2026 186 Camden Mpumalanga *Camden 1968 2026 185
Kriel Mpumalanga Kriel 1977 2027 475 Kriel Mpumalanga Kriel 1977 2027 475
Camden Mpumalanga *Camden 1969 2027 190 Camden Mpumalanga *Camden 1969 2027 190 Camden Mpumalanga *Camden 1969 2027 190
Total *Life extended due to RTS 5 138
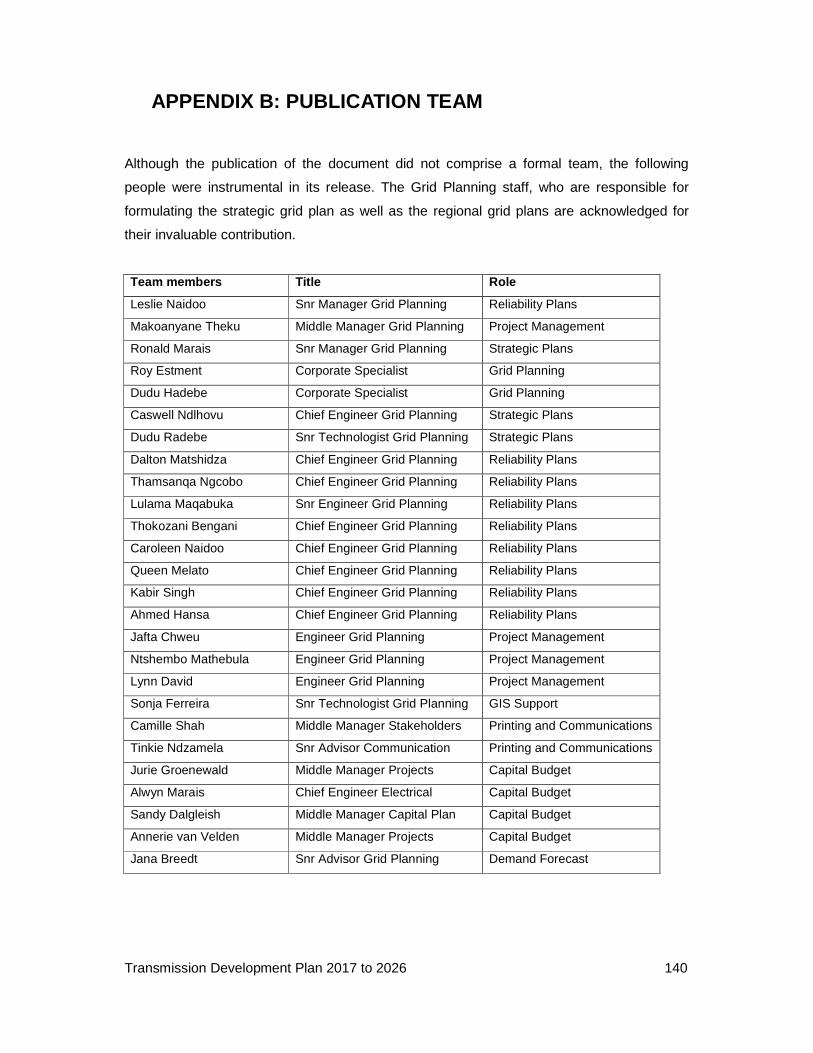
Transmission Development Plan 2017 to 2026 140
APPENDIX B: PUBLICATION TEAM
Although the publication of the document did not comprise a formal team, the following
people were instrumental in its release. The Grid Planning staff, who are responsible for
formulating the strategic grid plan as well as the regional grid plans are acknowledged for
their invaluable contribution.
Team members Title Role
Leslie Naidoo Snr Manager Grid Planning Reliability Plans
Makoanyane Theku Middle Manager Grid Planning Project Management
Ronald Marais Snr Manager Grid Planning Strategic Plans
Roy Estment Corporate Specialist Grid Planning
Dudu Hadebe Corporate Specialist Grid Planning
Caswell Ndlhovu Chief Engineer Grid Planning Strategic Plans
Dudu Radebe Snr Technologist Grid Planning Strategic Plans
Dalton Matshidza Chief Engineer Grid Planning Reliability Plans
Thamsanqa Ngcobo Chief Engineer Grid Planning Reliability Plans
Lulama Maqabuka Snr Engineer Grid Planning Reliability Plans
Thokozani Bengani Chief Engineer Grid Planning Reliability Plans
Caroleen Naidoo Chief Engineer Grid Planning Reliability Plans
Queen Melato Chief Engineer Grid Planning Reliability Plans
Kabir Singh Chief Engineer Grid Planning Reliability Plans
Ahmed Hansa Chief Engineer Grid Planning Reliability Plans
Jafta Chweu Engineer Grid Planning Project Management
Ntshembo Mathebula Engineer Grid Planning Project Management
Lynn David Engineer Grid Planning Project Management
Sonja Ferreira Snr Technologist Grid Planning GIS Support
Camille Shah Middle Manager Stakeholders Printing and Communications
Tinkie Ndzamela Snr Advisor Communication Printing and Communications
Jurie Groenewald Middle Manager Projects Capital Budget
Alwyn Marais Chief Engineer Electrical Capital Budget
Sandy Dalgleish Middle Manager Capital Plan Capital Budget
Annerie van Velden Middle Manager Projects Capital Budget
Jana Breedt Snr Advisor Grid Planning Demand Forecast
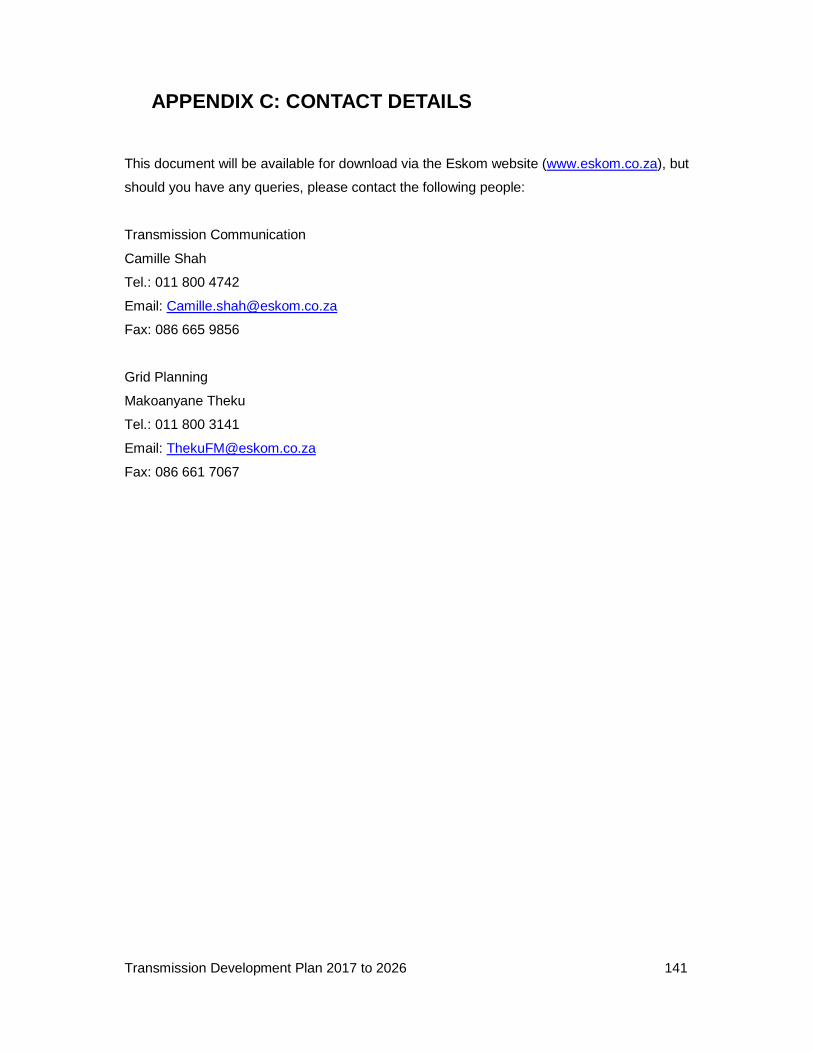
Transmission Development Plan 2017 to 2026 141
APPENDIX C: CONTACT DETAILS
This document will be available for download via the Eskom website (www.eskom.co.za), but
should you have any queries, please contact the following people:
Transmission Communication
Camille Shah
Tel.: 011 800 4742
Email: [email protected]
Fax: 086 665 9856
Grid Planning
Makoanyane Theku
Tel.: 011 800 3141
Email: [email protected]
Fax: 086 661 7067