Embed Size (px)
Citation preview
2003 Proceedings of the Midwest Business Economics Association 1
TRANSPARENCY OF MONETARY POLICY AND EQUITY MARKET VOLATILITY
Glenn T. Potts, University of Wisconsin—River Falls, [email protected]
ABSTRACT This paper investigates the effect of actions taken by the Federal Reserve to make their policy actions transparent. In 1989 the FOMC adopted a policy of using 25 basis point multiples for changes in its federal funds target. These relatively large changes made it easier for market participants to observe policy changes. This transparency of policy was a reversal of its previous position that secrecy of policy action and intent of policy promoted financial market stability. Further steps were taken in 1994 as the FOMC began to announce policy changes at the close of FOMC meetings. I have looked at three time periods with respect to Fed transparency to identify the effect of transparency on equity market volatility. The result of this study is evidence that the Fed transparency policy has reduced volatility as measured by the DJIA and the S&P 500 indexes; however, there is evidence to suggest that transparency has changed the distribution of uncertainty surrounding FOMC meetings and has increased volatility as measured by the Nasdaq composite.
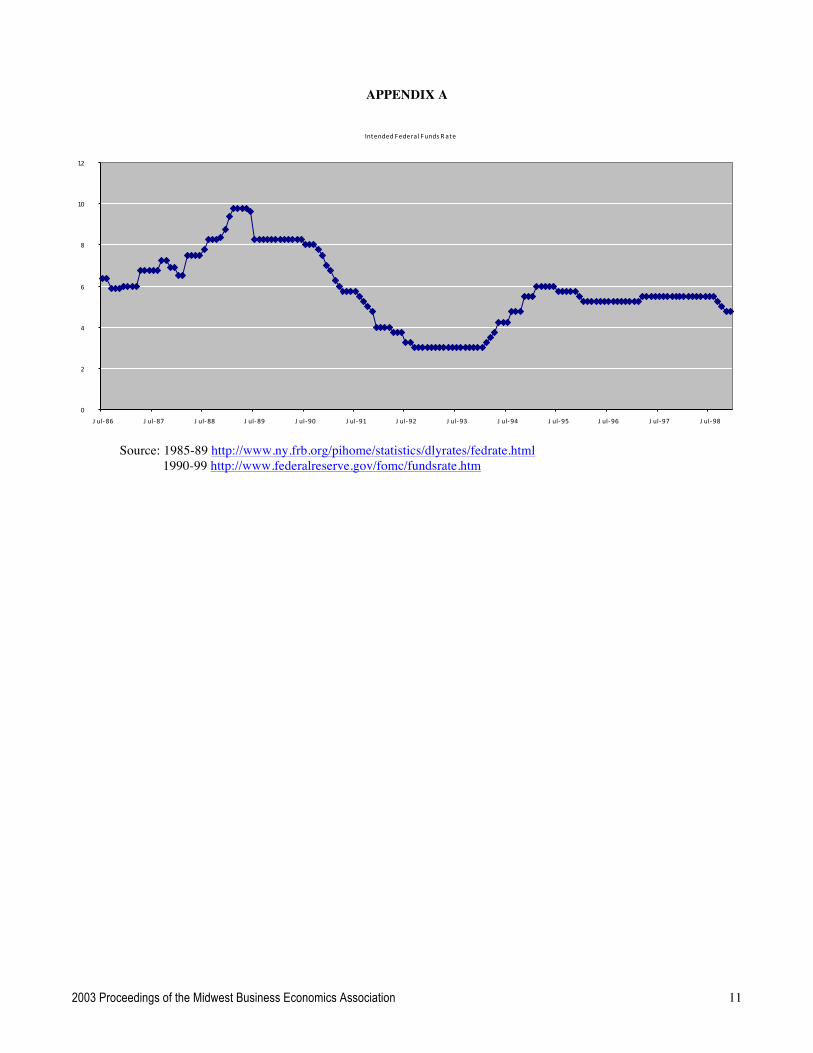
INTRODUCTION The Federal Reserve conducts policy with a belief that the effect of monetary policy is transmitted to the economy primarily through financial markets. Financial market participants share the belief that the actions of the Federal Reserve affect financial markets. This effect is two-fold, first monetary policy is conducted in financial markets and secondly the policy actions will affect economic conditions that are reflected in financial markets. Research by Rigobon & Sack (Rigobon & Sack, 2002) demonstrates that the policy effect is direct on equity markets and indirect on interest rates. Since the mid 1980s the Federal Reserve has defined and conducted policy with a federal funds target. (Edwards, 1997) The target federal funds rate for the time period of this study is presented in Appendix A. As a result of the obvious important effect of monetary policy on financial markets, participants in financial markets must be aware or seek to be aware of monetary policy. Knowing what the Fed has done or will do is valuable information. Prior to 1989, the Fed took actions to hide their actions in the market and policy intent was a closely guarded secret. In a 1975 Freedom of Information Act filing the Fed had argued that immediate release of policy intent information would create an announcement effect and subsequent market uncertainty and volatility. The
Fed disguised policy actions by conducting policy in small irregular increments. (Poole & Rasche, 2003) The intent of policy was protected by the FOMC policy to delay release of the FOMC domestic policy directive until after the subsequent meeting. This delay in release of policy continued until February 1994. (Thornton, 1996; Ackert et. al, 2001) As reported by Poole & Rasche, the Fed has undertaken several steps since August 1989 that have increased the transparency of monetary policy. In August 1989 the changes in the target federal funds rate were limited to 25 basis points making changes easier to see in the market. In February 1994 the Fed began announcing changes in the target federal funds rate at the close of the FOMC meeting. These changes were intended to “increase transparency of policy, improve accountability, and provide better information to market participants…”. (Poole & Rasche, 2003, p. 1) Romer and Romer (Romer & Romer, 2000) indicate that the Fed continues to hold secret additional information regarding Fed forecasts for the economy. Romer & Romer speculate that release of this information regarding motives for policy might reduce financial market volatility or it could result in less useful forecasts reducing the FOMC confidence in the forecasts and thus they would use these forecasts less. Clearly the Fed now believes that transparency reduces market uncertainty and improves market efficiency. However, there continues to be disagreement regarding the effect of policy transparency on market volatility. In this paper I will investigate possible changes in the effect of FOMC actions that may have occurred with the steps taken to improve transparency.
LITERATURE REVIEW A great deal of research on the effect of policy announcement or transparency of policy has been conducted in the last few years. Most of these studies investigate whether or not the Fed has been successful in its efforts to reduce market volatility and increase market efficiency by increasing transparency. I will present a representative sample of these studies. Prior to 1994 the only tool used by the Fed to announce policy changes was to change the discount rate. Chen, Mohan and Steiner (Chen et al, 1999) did an intraday study for 1973 – 1996 of the effect of changes in the discount rate on equity return volatility and discovered that announcement of policy changes increased volatility and volume. They differentiated between discount rate changes
2003 Proceedings of the Midwest Business Economics Association 2
that announced policy (unexpected changes) and changes that just brought the discount rate into alignment with the federal funds rate (expected changes). They discovered that announcement of policy with unexpected changes in the discount rate did increase volatility of equity returns, but the volatility was short lived. In addition they discovered that policy announcement did cause an increase in volume of equity trading, but this lasted only one hour. Daniel Thornton (Thornton, 1996) looked at the relationship of the T-bill rate to the federal funds target rate. This relationship could reveal the transfer of information from the Fed through the fed funds market to other financial markets. He discovered that before 1994, current changes in the T-bill rate are related to past values of the federal funds rate while after 1994 current changes in the T-bill rate are explained best by current federal funds rate. This change indicates that transparency has resulted in financial market efficiency as market participants have incorporated policy actions into interest rates quickly. In addition, Thornton identified a decrease in the difference between actual and forecasted values of the federal funds rate which he described as a decrease in volatility. Bomfim and Reinhart (Bomfim & Reinhart, March 2000) were unable to identify a change in the policy surprise effect as a result of the transparency efforts. For the time period 1989 – 1998 they looked at the federal funds target rate and the 30 day short term futures contracts. The futures contracts represented expected interest rates and the relation to the fed funds target reveals information regarding the transfer of Fed policy information to financial markets. While changes in the target were important, the effect of changes in the target on futures contracts is the same pre and post 1994. Bomfim and Reinhart conclude that the announcement of policy post 1994 had no effect. To discover the effect of the 1994 policy announcement change on volatility Bomfim (Bomfim, October 2000) looks at the effect of announcement on stock returns measured with the % change in S&P 500 and volatility of return measured as the variance of return. He discovered that the 1994 transparency efforts reduced volatility before meetings of the FOMC but increased it on meeting days, a “calm before the storm” effect. To look at the implication of markets not correctly anticipating policy prior to the announcement Ackert, Church and Gillette (Ackert et. al., 2001) look at the effect of announcement when financial markets accurately and inaccurately predicted the announcement. They conclude that if the markets have mistakenly predicted Fed policy, then at announcement of policy there is a very large correction in the market on announcement day. An additional study of interest for this paper uses the CBOE VIX as a measure of uncertainty in the market. A primary reason for the increased transparency of policy is to reduce volatility due to uncertainty regarding policy. The VIX provides information on the success of the efforts to increase transparency. Stivers and Sun (Stivers & Sun,
2002) use the Chicago Board of Option’s Exchange volatility index (VIX) as a measure of stock market uncertainty. Increases in the VIX indicated increased uncertainty. Increases in uncertainty as measured by the VIX show a large negative relationship with stock returns and a positive relationship with bond returns. For a discussion of the VIX, see Appendix C.
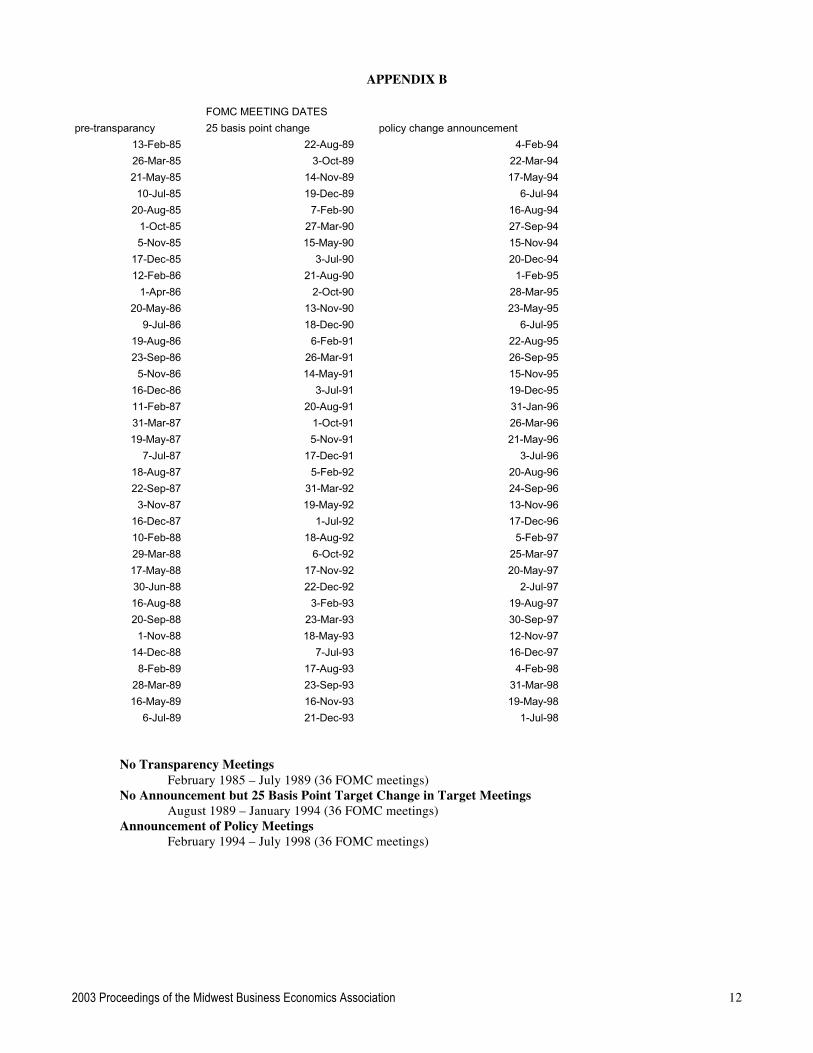
MODEL AND DATA I will look at the effect of changes in transparency of policy on volatility in equity markets. If it is true that transparency of policy reduces market uncertainty, we would expect to see reductions in volatility surrounding FOMC meetings after transparency has been increased. Also, the literature suggests that transparency may have changed the pattern of volatility surrounding the announcement. In this paper I will look at volatility and patterns of volatility in equity prices as measured by the Dow Jones Industrial Average, S&P 500 Index, and the Nasdaq composite Index. Volatility is measured in three ways, 1. volatility of equity prices 2. relative volume of trading and 3. market uncertainty. Equity Price Volatility Measure (DJIA, S&P500, NASDAQ) Intraday range = (daily high – daily low)/daily low daily range = abs [(daily close – daily open)/daily open] Relative Volume Measure (DJIA, S&P500, Nasdaq) relative volume = daily trading volume/average daily volume for that year Market Uncertainty Measure VIX % Change = (VIXt – VIXt-1) / VIXt-1 The effect of transparency efforts is accounted for by looking at three periods of time, 1. FOMC meetings when the Fed maintained secrecy 2. FOMC meetings when the Fed made no announcements of policy but used policy procedures that were easy to see in the market, and 3. FOMC meetings when policy was announced at the close of the meeting. Since the middle time period was 4.5 years and 36 FOMC meetings, I selected equal length time periods for before and after. See Appendix B. Each of the volatility measures is calculated for eleven days surrounding each FOMC meeting, five days before (t-1 to t-5), five days after (t+1 to t+5), and the day the meeting closes (t). Most meetings start and end on Tuesday, but two day meetings end on Wednesday. There are 36 values for each of the eleven days for each of the three time periods. The mean value for each of the eleven days within each of the three time period is calculated and compared. For example: Mean Intraday range for all (t-5) days for 1985 – 89 is the sum of the intraday range five days
2003 Proceedings of the Midwest Business Economics Association 3
before every FOMC meeting during 1985-89 divided by 36. This is repeated for each volatility measure with each index for all 11 days surrounding FOMC meetings for each of the three time periods. The hypotheses to be tested are:
1. There has been a reduction in volatility as the Fed has increased transparency.
2. The pattern of volatility around FOMC meeting days has changed.
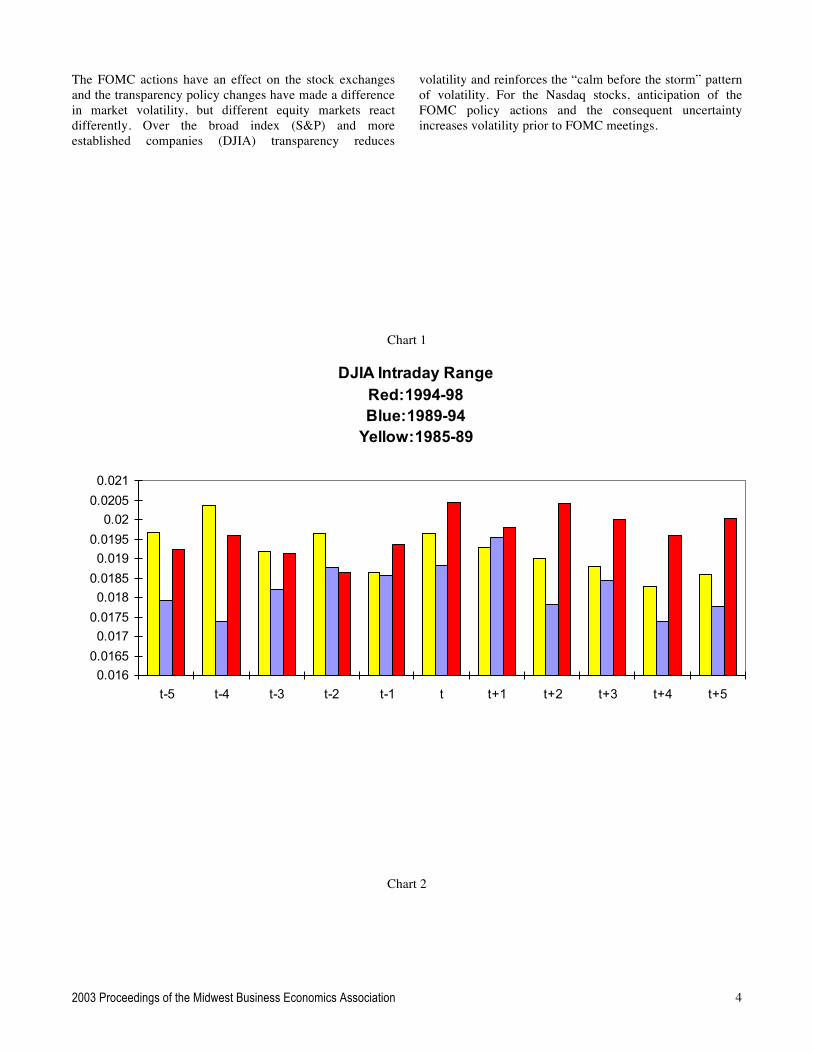
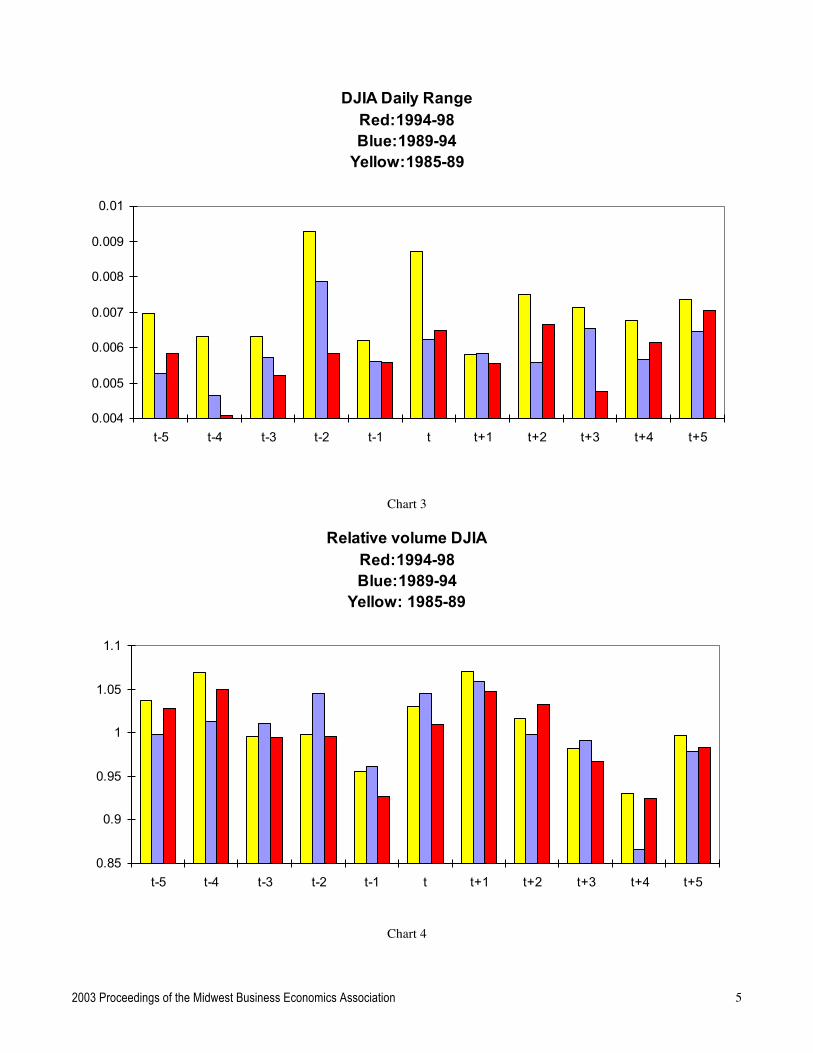
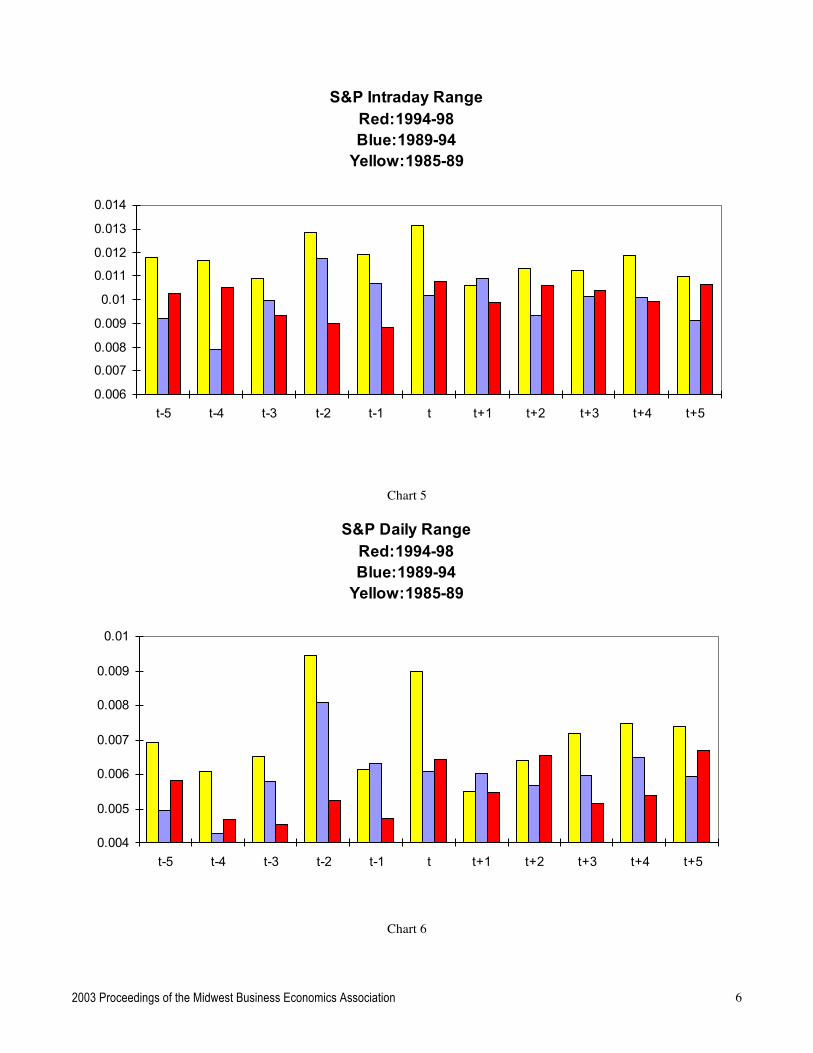
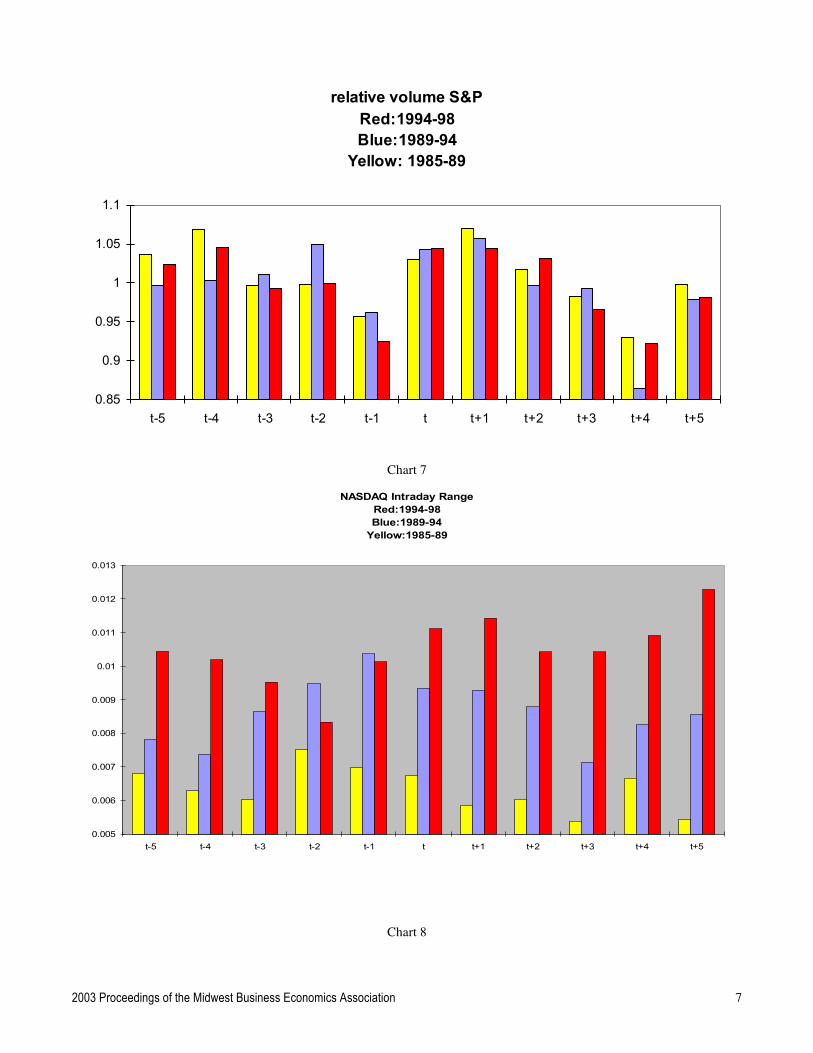
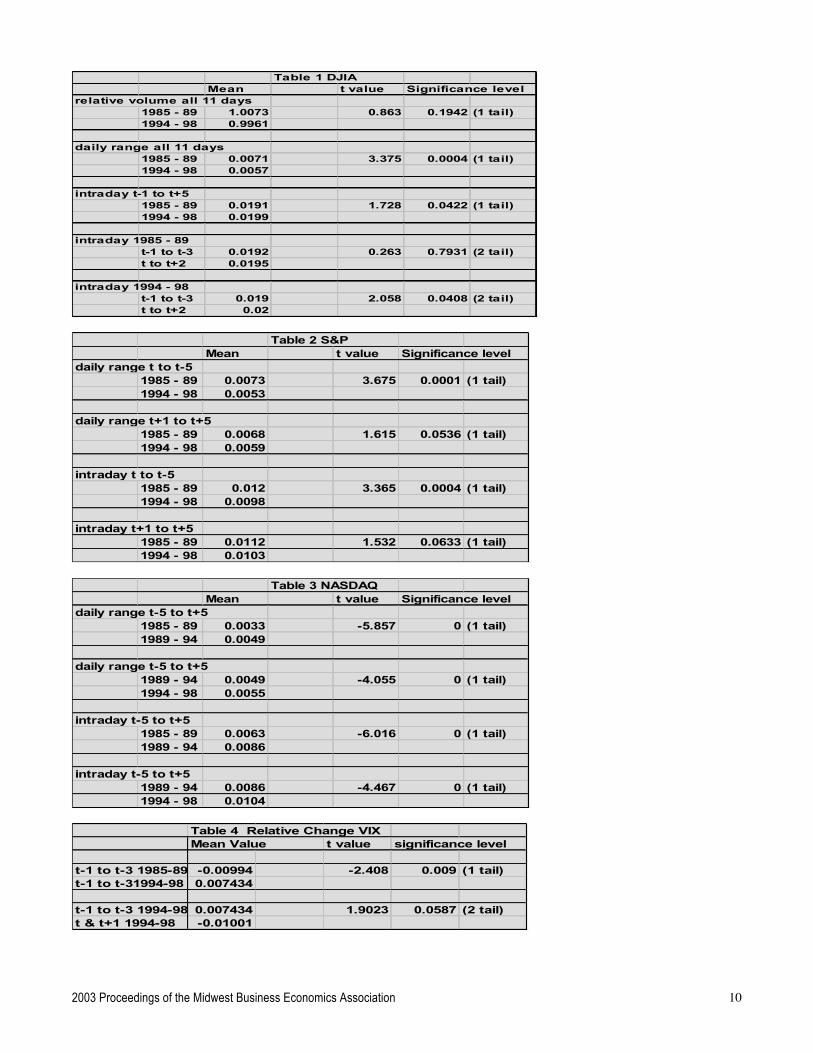
RESULTS Charts 1 – 10 present the mean values as explained above. Charts 1 – 3 present the DJIA measures. Charts 4 – 6 present the S&P 500 measures. Charts 7 – 9 present the Nasdaq measures. Chart 10 presents the VIX. These charts help provide a picture of the effect of transparency on volatility and the pattern of volatility. Where significant change appears to exist, I have performed t-tests for differences in the mean values. Charts 1 – 3 for the DJIA volatility measures provide conflicting evidence. Volatility as measured by the intraday range (high-low) appears higher in the 1994-98 announcement of policy time period for days (t-1) through (t+5) compared to 1985 – 89 the secrecy time period. The t-test confirms this at the 5% level of significance. At the same time, volatility measured with the daily range (open-close) indicates a large reduction in volatility (t-5) to (t+5) for 1994 – 98 compared to 1985 – 89 and the t-test confirms this. Volatility as measured by relative volume shows a slight decrease for the 1994 – 98 time period compared to 1985 – 89 but the t-test does not show a statistically significant change. The t-test for intraday range 1994-98 comparing before and after meeting volatility supports the “calm before the storm” finding of other authors since volatility is higher on the meeting announcement day and the days following. This pattern does not exist prior to 1994. Comparisons with the intermediate time period 1989 – 94 do not reveal a change in pattern. Table 1 presents t-tests for differences in means. Charts 4 – 6 present the measures for the S&P 500 and show a change in the pattern of volatility post 1994, volatility is reduced prior to FOMC meetings. Volatility after the FOMC meetings does not appear to have been affected by transparency. The S&P intraday range and the daily range indicate a decrease in volatility during the 1994-98 time period in comparison to 1985 – 89 for days t-5 to t. The t-tests presented in table 2 indicate a reduction in volatility prior to meetings while the t-tests for statistical significance of difference in means following meetings are above 5%. The S&P 500 relative volume measure does not show a change in the pattern surrounding FOMC meetings. Charts 7 – 9 present the volatility measures for the Nasdaq composite. The Nasdaq intraday range and the daily range show a steady and large increase over the three time periods which indicates an increase in volatility as the FOMC adopted transparency methods. The t-tests in Table 3
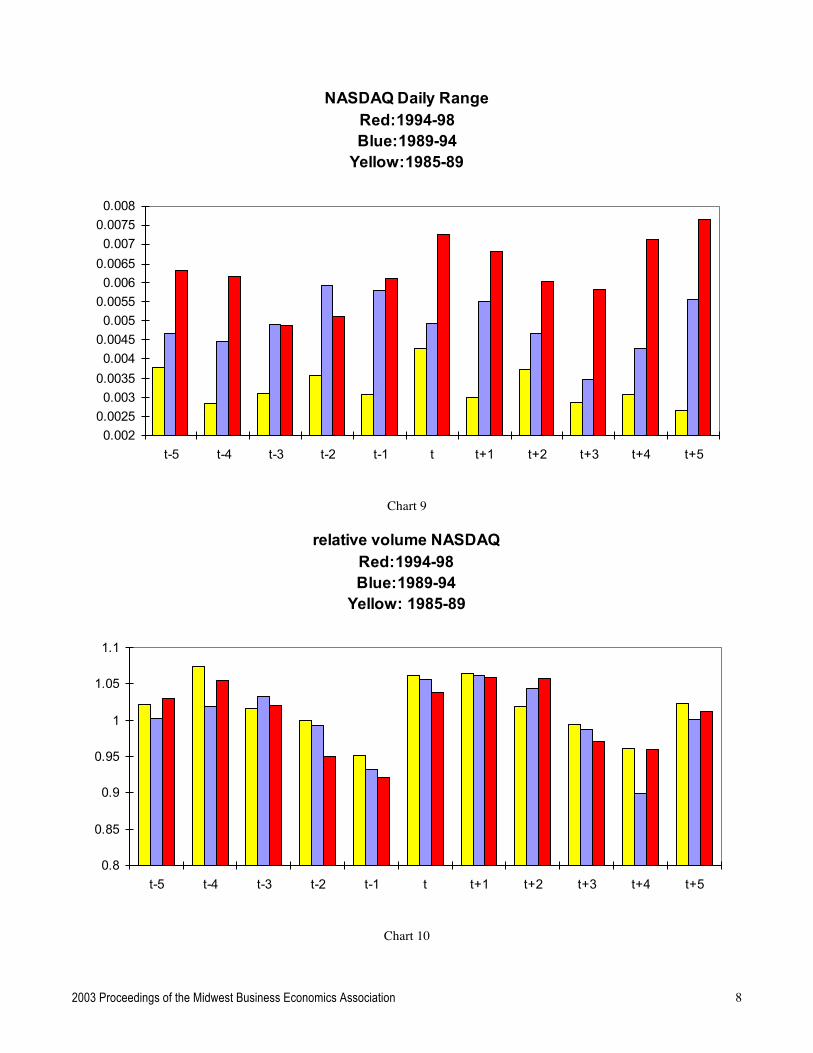
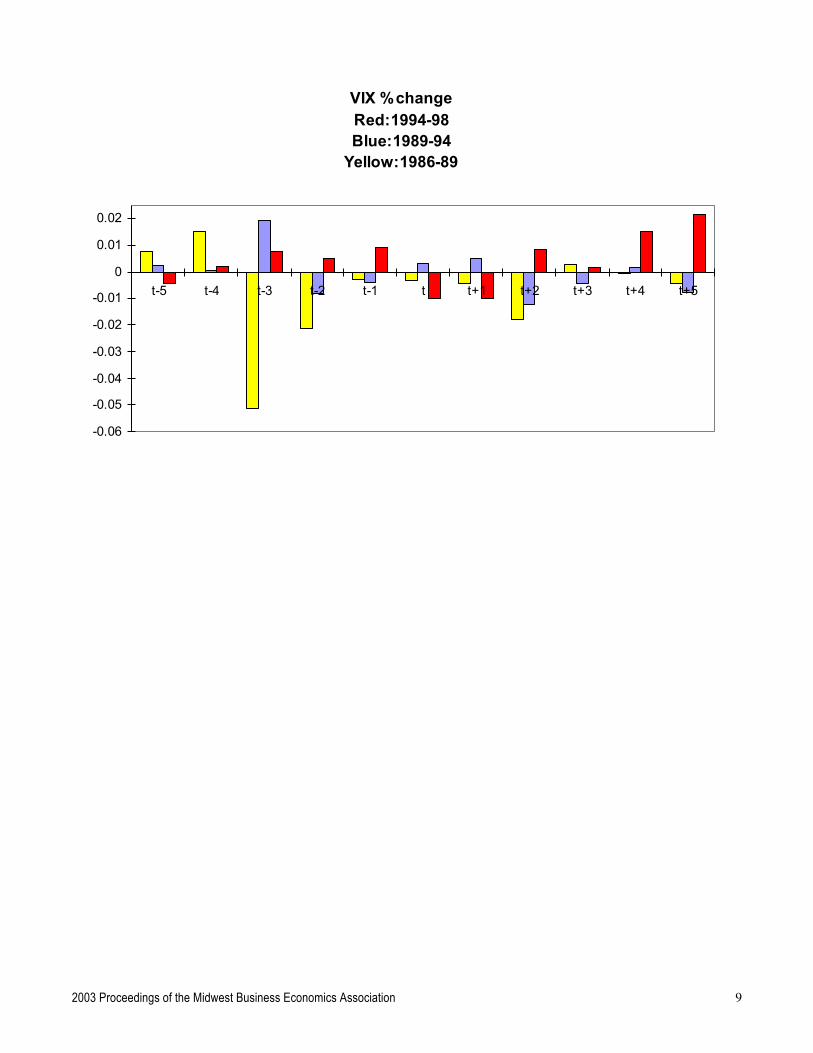
support this with statistically significant increases from 1985-89 to 1989-94 and again to 1994-98. The “calm before the storm” pattern breaks down as the relative low values for volatility occur on day t-2. The relative volume data does not show any change in pattern or level of volatility as transparency changes. Table 3 presents t-tests for differences in means. Data for the VIX volatility measure is plotted in chart 10. The VIX was introduced in 1993 but is calculated back to January 1986, the time period 1985 – 89 does not have values for the VIX for 1985. For the years 1994-98, the percentage change in the VIX was positive (increased uncertainty) for days (t-1) to (t-3) and turn negative for days (t) and (t+1) (decreased uncertainty). The index was negative for all five of these days in the 1985 – 89 time period. Table 4 presents t-tests for differences in means. The (t-1) to (t-3) difference for 1985 – 89 and 1994 – 98 is statistically significant, uncertainty increased post 1994. The difference before and after meetings for the post 1994 time period is not statistically significant at 5% for a two tail test (it is for a one tail test).
DISCUSSION The results presented indicate some differences in effect of transparency among the volatility measures and stock indexes. The DJIA daily open-close range shows decreases in volatility with transparency and the intraday high-low range shows increases in volatility. The DJIA also reveals a “calm before the storm” pattern to the volatility. The evidence within the S&P 500 index shows a strong decrease in volatility with transparency for the days prior to the FOMC meetings. The Nasdaq data shows a strong increase in volatility as transparency is increased over the three time periods and it does not show the expected “calm before the storm” pattern. The VIX data shows a pattern similar to the Nasdaq, uncertainty and thus volatility prior to FOMC meetings has increased with transparency. But, the uncertainty falls at announcement of policy, a “storm before the calm” pattern. It is reasonable to say that the uncertainty associated with an approaching FOMC meeting as indicated by the VIX would have its strongest effect on the Nasdaq stocks. These stocks compared to the stocks in the broad market index S&P 500 and the large established company stocks in the DJIA would be more affected by uncertainty. The finding of Ackert, Church and Gillette (Ackert et. al, 2001) that the announcement effect of transparency increases the correction when the market incorrectly anticipates the announcement would apply best to the Nasdaq stocks. The increased volatility intraday and reduction over the entire day in the DJIA could reflect the uncertainty, but the market calms over the open-close range.
CONCLUSION
2003 Proceedings of the Midwest Business Economics Association 4
The FOMC actions have an effect on the stock exchanges and the transparency policy changes have made a difference in market volatility, but different equity markets react differently. Over the broad index (S&P) and more established companies (DJIA) transparency reduces
volatility and reinforces the “calm before the storm” pattern of volatility. For the Nasdaq stocks, anticipation of the FOMC policy actions and the consequent uncertainty increases volatility prior to FOMC meetings.
Chart 1
DJIA Intraday Range Red:1994-98Blue:1989-94
Yellow:1985-89
0.0160.01650.0170.01750.0180.01850.0190.01950.02
0.02050.021
t-5 t-4 t-3 t-2 t-1 t t+1 t+2 t+3 t+4 t+5
Chart 2
2003 Proceedings of the Midwest Business Economics Association 5
DJIA Daily Range Red:1994-98Blue:1989-94
Yellow:1985-89
0.004
0.005
0.006
0.007
0.008
0.009
0.01
t-5 t-4 t-3 t-2 t-1 t t+1 t+2 t+3 t+4 t+5
Chart 3
Relative volume DJIARed:1994-98Blue:1989-94
Yellow: 1985-89
0.85
0.9
0.95
1
1.05
1.1
t-5 t-4 t-3 t-2 t-1 t t+1 t+2 t+3 t+4 t+5
Chart 4
2003 Proceedings of the Midwest Business Economics Association 6
S&P Intraday RangeRed:1994-98Blue:1989-94
Yellow:1985-89
0.006
0.007
0.008
0.009
0.01
0.011
0.012
0.013
0.014
t-5 t-4 t-3 t-2 t-1 t t+1 t+2 t+3 t+4 t+5
Chart 5
S&P Daily Range Red:1994-98Blue:1989-94
Yellow:1985-89
0.004
0.005
0.006
0.007
0.008
0.009
0.01
t-5 t-4 t-3 t-2 t-1 t t+1 t+2 t+3 t+4 t+5
Chart 6
2003 Proceedings of the Midwest Business Economics Association 7
relative volume S&PRed:1994-98Blue:1989-94
Yellow: 1985-89
0.85
0.9
0.95
1
1.05
1.1
t-5 t-4 t-3 t-2 t-1 t t+1 t+2 t+3 t+4 t+5
Chart 7
NASDAQ Intraday RangeRed:1994-98Blue:1989-94
Yellow:1985-89
0.005
0.006
0.007
0.008
0.009
0.01
0.011
0.012
0.013
t-5 t-4 t-3 t-2 t-1 t t+1 t+2 t+3 t+4 t+5
Chart 8
2003 Proceedings of the Midwest Business Economics Association 8
NASDAQ Daily Range Red:1994-98Blue:1989-94
Yellow:1985-89
0.0020.00250.0030.00350.0040.00450.0050.00550.0060.00650.0070.00750.008
t-5 t-4 t-3 t-2 t-1 t t+1 t+2 t+3 t+4 t+5
Chart 9
relative volume NASDAQRed:1994-98Blue:1989-94
Yellow: 1985-89
0.8
0.85
0.9
0.95
1
1.05
1.1
t-5 t-4 t-3 t-2 t-1 t t+1 t+2 t+3 t+4 t+5
Chart 10
2003 Proceedings of the Midwest Business Economics Association 9
VIX %change Red:1994-98Blue:1989-94
Yellow:1986-89
-0.06
-0.05
-0.04
-0.03
-0.02
-0.01
0
0.01
0.02
t-5 t-4 t-3 t-2 t-1 t t+1 t+2 t+3 t+4 t+5
2003 Proceedings of the Midwest Business Economics Association 10
Table 1 DJIAMean t value Significance level
relative volume all 11 days1985 - 89 1.0073 0.863 0.1942 (1 tail)1994 - 98 0.9961
daily range all 11 days1985 - 89 0.0071 3.375 0.0004 (1 tail)1994 - 98 0.0057
intraday t-1 to t+51985 - 89 0.0191 1.728 0.0422 (1 tail)1994 - 98 0.0199
intraday 1985 - 89t-1 to t-3 0.0192 0.263 0.7931 (2 tail)t to t+2 0.0195
intraday 1994 - 98t-1 to t-3 0.019 2.058 0.0408 (2 tail)t to t+2 0.02
Table 2 S&P
Mean t value Significance leveldaily range t to t-5
1985 - 89 0.0073 3.675 0.0001 (1 tail)1994 - 98 0.0053
daily range t+1 to t+51985 - 89 0.0068 1.615 0.0536 (1 tail)1994 - 98 0.0059
intraday t to t-51985 - 89 0.012 3.365 0.0004 (1 tail)1994 - 98 0.0098
intraday t+1 to t+51985 - 89 0.0112 1.532 0.0633 (1 tail)1994 - 98 0.0103
Table 3 NASDAQ
Mean t value Significance leveldaily range t-5 to t+5
1985 - 89 0.0033 -5.857 0 (1 tail)1989 - 94 0.0049
daily range t-5 to t+51989 - 94 0.0049 -4.055 0 (1 tail)1994 - 98 0.0055
intraday t-5 to t+51985 - 89 0.0063 -6.016 0 (1 tail)1989 - 94 0.0086
intraday t-5 to t+51989 - 94 0.0086 -4.467 0 (1 tail)1994 - 98 0.0104
Table 4 Relative Change VIXMean Value t value significance level
t-1 to t-3 1985-89 -0.00994 -2.408 0.009 (1 tail)t-1 to t-31994-98 0.007434
t-1 to t-3 1994-98 0.007434 1.9023 0.0587 (2 tail)t & t+1 1994-98 -0.01001
2003 Proceedings of the Midwest Business Economics Association 11
APPENDIX A
Intended Federal Funds R ate
0
2
4
6
8
10
12
J ul-‐86 J ul-‐87 J ul-‐88 J ul-‐89 J ul-‐90 J ul-‐91 J ul-‐92 J ul-‐93 J ul-‐94 J ul-‐95 J ul-‐96 J ul-‐97 J ul-‐98
Source: 1985-89 http://www.ny.frb.org/pihome/statistics/dlyrates/fedrate.html 1990-99 http://www.federalreserve.gov/fomc/fundsrate.htm
2003 Proceedings of the Midwest Business Economics Association 12
APPENDIX B
FOMC MEETING DATESpre-transparancy 25 basis point change policy change announcement
13-Feb-85 22-Aug-89 4-Feb-9426-Mar-85 3-Oct-89 22-Mar-9421-May-85 14-Nov-89 17-May-94
10-Jul-85 19-Dec-89 6-Jul-9420-Aug-85 7-Feb-90 16-Aug-94
1-Oct-85 27-Mar-90 27-Sep-945-Nov-85 15-May-90 15-Nov-94
17-Dec-85 3-Jul-90 20-Dec-9412-Feb-86 21-Aug-90 1-Feb-95
1-Apr-86 2-Oct-90 28-Mar-9520-May-86 13-Nov-90 23-May-95
9-Jul-86 18-Dec-90 6-Jul-9519-Aug-86 6-Feb-91 22-Aug-9523-Sep-86 26-Mar-91 26-Sep-95
5-Nov-86 14-May-91 15-Nov-9516-Dec-86 3-Jul-91 19-Dec-9511-Feb-87 20-Aug-91 31-Jan-9631-Mar-87 1-Oct-91 26-Mar-9619-May-87 5-Nov-91 21-May-96
7-Jul-87 17-Dec-91 3-Jul-9618-Aug-87 5-Feb-92 20-Aug-9622-Sep-87 31-Mar-92 24-Sep-96
3-Nov-87 19-May-92 13-Nov-9616-Dec-87 1-Jul-92 17-Dec-9610-Feb-88 18-Aug-92 5-Feb-9729-Mar-88 6-Oct-92 25-Mar-9717-May-88 17-Nov-92 20-May-9730-Jun-88 22-Dec-92 2-Jul-9716-Aug-88 3-Feb-93 19-Aug-9720-Sep-88 23-Mar-93 30-Sep-97
1-Nov-88 18-May-93 12-Nov-9714-Dec-88 7-Jul-93 16-Dec-97
8-Feb-89 17-Aug-93 4-Feb-9828-Mar-89 23-Sep-93 31-Mar-9816-May-89 16-Nov-93 19-May-98
6-Jul-89 21-Dec-93 1-Jul-98
No Transparency Meetings February 1985 – July 1989 (36 FOMC meetings) No Announcement but 25 Basis Point Target Change in Target Meetings August 1989 – January 1994 (36 FOMC meetings) Announcement of Policy Meetings February 1994 – July 1998 (36 FOMC meetings)
2003 Proceedings of the Midwest Business Economics Association 13
APPENDIX C
The CBOE worked with Professor Robert Whaley of Duke University to create the VIX and VXN indexes. For more information on VIX, please visit the website http://faculty.fuqua.duke.edu/~whaley/vix/. Here are some comments by Professor Whaley:
"VIX is said to be the "investor fear gauge." Given its construction, the name fits. "Gauge" simply means a measure. The descriptor "fear" arises from the fact that investors are averse to risk. Since the VIX is constructed from the implied volatilities of S&P 100 index options, it is, by definition, a measure of expected stock market risk. The descriptor "investor" arises from the fact that investors set the level of the VIX, albeit indirectly. Investor demands for S&P 100 call and put options set prices, and these prices, in turn, are used to imply the level of the VIX. Over its [16-year] history, VIX has acted reliably as a fear gauge. High levels of VIX are coincident with high degrees of market turmoil, whether the turmoil is attributable to stock market decline, the threat of war, unexpected change in interest rates, or a number of other newsworthy events. The higher the VIX, the greater the fear."
Source: http://www.cboe.com/micro/vixvxn/introduction.asp
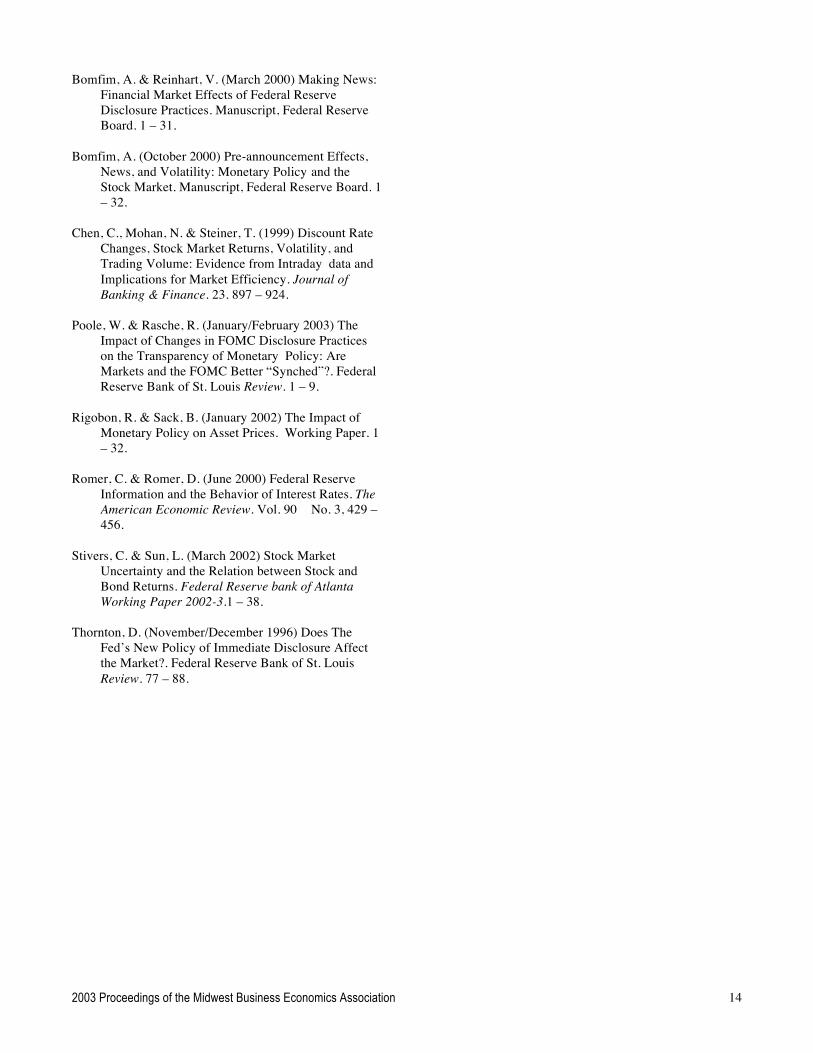
References Ackert, L., Church, B & Gillette, A. (April 2001) Immediate
Disclosure or Secrecy? The Release of Information in Experimental Asset Markets. Federal Reserve Bank of Atlanta Working Paper 2001-5. 1 – 25.
2003 Proceedings of the Midwest Business Economics Association 14
Bomfim, A. & Reinhart, V. (March 2000) Making News: Financial Market Effects of Federal Reserve Disclosure Practices. Manuscript, Federal Reserve Board. 1 – 31.
Bomfim, A. (October 2000) Pre-announcement Effects,
News, and Volatility: Monetary Policy and the Stock Market. Manuscript, Federal Reserve Board. 1 – 32.
Chen, C., Mohan, N. & Steiner, T. (1999) Discount Rate
Changes, Stock Market Returns, Volatility, and Trading Volume: Evidence from Intraday data and Implications for Market Efficiency. Journal of Banking & Finance. 23. 897 – 924.
Poole, W. & Rasche, R. (January/February 2003) The
Impact of Changes in FOMC Disclosure Practices on the Transparency of Monetary Policy: Are Markets and the FOMC Better “Synched”?. Federal Reserve Bank of St. Louis Review. 1 – 9.
Rigobon, R. & Sack, B. (January 2002) The Impact of
Monetary Policy on Asset Prices. Working Paper. 1 – 32.
Romer, C. & Romer, D. (June 2000) Federal Reserve
Information and the Behavior of Interest Rates. The American Economic Review. Vol. 90 No. 3, 429 – 456.
Stivers, C. & Sun, L. (March 2002) Stock Market
Uncertainty and the Relation between Stock and Bond Returns. Federal Reserve bank of Atlanta Working Paper 2002-3.1 – 38.
Thornton, D. (November/December 1996) Does The
Fed’s New Policy of Immediate Disclosure Affect the Market?. Federal Reserve Bank of St. Louis Review. 77 – 88.


![TUGAS I [VIX]](https://img.pdfslide.net/doc/110x75/55cf97fc550346d03394db12/tugas-i-vix.jpg)