Embed Size (px)
Citation preview

Transportation System Plan
Chapter 3 Evaluation of McMinnville’s Transportation System


McMinnville Transportation System Plan May 2010
Transpo Group | Chapter 3 – Evaluation of McMinnville’s Transportation System Page 3-1
3 Evaluation of McMinnville’s Transportation System
This chapter includes a summary of the analyses in support of the McMinnville TSP. It includes sections that summarize the data and methods used to estimate future travel volumes, street and highway performance measures based on the mobility standards identified in Chapter 2 of the TSP, and various future street and intersection improvement options to help minimize the impact growth will have in the community. The goal of the TSP is to define a balanced, multi-modal transportation plan that serves McMinnville’s Comprehensive Plan and land use as shown in Exhibit 3-1. This chapter also includes a summary of a pavement condition inventory, a walking inventory of McMinnville’s sidewalk system, and a review of the City’s bicycle system plan development, including on-street bike lanes and off-street shared-use paths. The findings from this chapter are used to identify TSP improvement projects in each of the Street (Chapter 4), Pedestrian (Chapter 5), Bicycle (Chapter 6) and Transit (Chapter 7) System Plans, plus Transportation Demand Management Plan (see also Chapter 7).
Methodology to Estimate Future Travel Volumes This section summarizes the methodology and assumptions used to develop future travel demand forecasts for the McMinnville Urban Growth Boundary (UGB) area, for the 20-year period beginning in 2003. A 2003-2023 planning horizon was chosen for consistency with the McMinnville Growth Management and Urbanization Plan, and as directed by DLCD staff. The chapter also includes an analysis of the impact of growth on traffic operations at selected intersections within the McMinnville urban area.
Exhibit 3-1 McMinnville Comprehensive Plan1
Background and General Assumptions The method used to estimate future traffic conditions for the McMinnville TSP is based on procedures in the 2001 Transportation System Planning Guidelines2 prepared by the Oregon Department of Transportation. These guidelines identify three levels of transportation forecasting (auto/truck vehicle estimates) and analysis: (1) Trend Forecasting; (2) Cumulative Analysis; or (3) Transportation Model. Both ODOT and the City of McMinnville agreed that a Level 3 Transportation Model was appropriate for the TSP analysis, and agreed that ODOT would develop the Model with input and support from the City.

McMinnville Transportation System Plan May 2010
Transpo Group | Chapter 3 – Evaluation of McMinnville’s Transportation System Page 3-2
28,500
11,400
46,220
17,421
0
10,000
20,000
30,000
40,000
50,000
Households Population
2003 2023
Level 3 - Transportation Model
ODOT’s Level 3 Transportation Model has generally been developed and used for Oregon cities with populations of 15,000 or greater. These models have served as valuable tools in analyzing street and highway networks where there are multiple and alternative solutions to test and compare. These models are used to present major street networks and highlight existing and future traffic problems. Combined with this analysis is additional post processing evaluation of turning lane requirements, intersection capacity and signal warrants.
Land Use Assumptions The two major components for estimating travel demand in the McMinnville Travel Demand Model are local housing and employment. The 2000 U.S. Census and McMinnville’s Comprehensive Plan are the base resources of identifying year 2003 population and housing. The Land Use Plan and the McMinnville Growth Management and Urbanization Plan were used to estimate city-wide housing (by low, medium and high density type) and population growth for year 2023, and localized allocation of new housing.
Population and Housing
Exhibit 3-2 summarizes year 2003 and 2023 housing and population in McMinnville. McMinnville’s population is expected to reach slightly over 46,000 by 2023 (62% growth). McMinnville’s current population, as of March 2009 is a little more than 32,400. Much of the City’s population (and housing) growth is expected in the west, southwest, northwest and north areas of the city.
Exhibit 3-2 McMinnville Population and Housing Forecast
McMinnville Transportation System Plan May 2010
Transpo Group | Chapter 3 – Evaluation of McMinnville’s Transportation System Page 3-3
Agri IndRetail Serv
EducGovt
Other
2003 Emp
2023 Emp
167
42393999
7071
15771442
1141167
19701760
4966
1165 1047 11410
1000
2000
3000
4000
5000
6000
7000
8000
Total Employment
2003 12,2162023 19,636
Employment
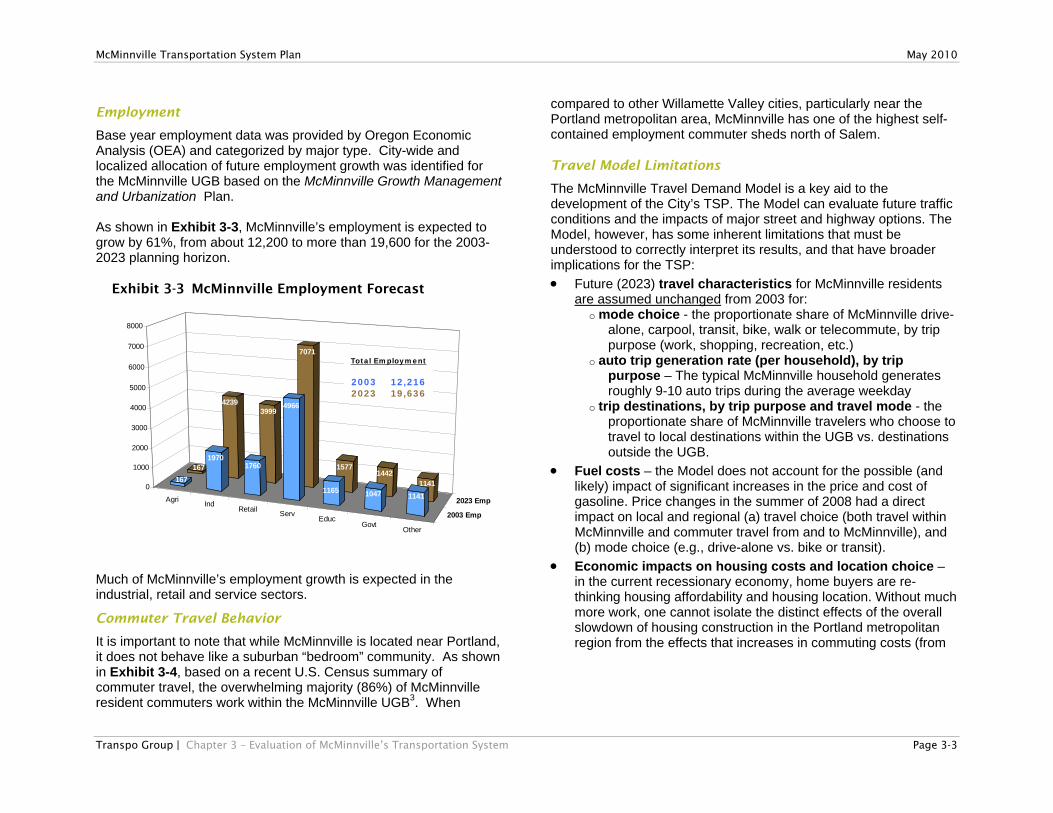
Base year employment data was provided by Oregon Economic Analysis (OEA) and categorized by major type. City-wide and localized allocation of future employment growth was identified for the McMinnville UGB based on the McMinnville Growth Management and Urbanization Plan. As shown in Exhibit 3-3, McMinnville’s employment is expected to grow by 61%, from about 12,200 to more than 19,600 for the 2003-2023 planning horizon.
Exhibit 3-3 McMinnville Employment Forecast
Much of McMinnville’s employment growth is expected in the industrial, retail and service sectors.
Commuter Travel Behavior
It is important to note that while McMinnville is located near Portland, it does not behave like a suburban “bedroom” community. As shown in Exhibit 3-4, based on a recent U.S. Census summary of commuter travel, the overwhelming majority (86%) of McMinnville resident commuters work within the McMinnville UGB3. When
compared to other Willamette Valley cities, particularly near the Portland metropolitan area, McMinnville has one of the highest self-contained employment commuter sheds north of Salem. Travel Model Limitations
The McMinnville Travel Demand Model is a key aid to the development of the City’s TSP. The Model can evaluate future traffic conditions and the impacts of major street and highway options. The Model, however, has some inherent limitations that must be understood to correctly interpret its results, and that have broader implications for the TSP: Future (2023) travel characteristics for McMinnville residents
are assumed unchanged from 2003 for: o mode choice - the proportionate share of McMinnville drive-
alone, carpool, transit, bike, walk or telecommute, by trip purpose (work, shopping, recreation, etc.)
o auto trip generation rate (per household), by trip purpose – The typical McMinnville household generates roughly 9-10 auto trips during the average weekday
o trip destinations, by trip purpose and travel mode - the proportionate share of McMinnville travelers who choose to travel to local destinations within the UGB vs. destinations outside the UGB.
Fuel costs – the Model does not account for the possible (and likely) impact of significant increases in the price and cost of gasoline. Price changes in the summer of 2008 had a direct impact on local and regional (a) travel choice (both travel within McMinnville and commuter travel from and to McMinnville), and (b) mode choice (e.g., drive-alone vs. bike or transit).
Economic impacts on housing costs and location choice – in the current recessionary economy, home buyers are re-thinking housing affordability and housing location. Without much more work, one cannot isolate the distinct effects of the overall slowdown of housing construction in the Portland metropolitan region from the effects that increases in commuting costs (from

McMinnville Transportation System Plan May 2010
Transpo Group | Chapter 3 – Evaluation of McMinnville’s Transportation System Page 3-4
Exhibit 3-4 McMinnville Commuter Travel
increases in fuel prices and congestion) are having on the local housing market in McMinnville. In the short run, however, there is a noticeable decline new home sales, as reflected, in part, by the slowing of residential development in McMinnville and greater Yamhill County.
Highway 18 corridor constraint – the Model assumes a continued trend in traffic growth within in the Highway 18/99W corridor and its connection to the Portland metro area – indirectly assuming the Newberg-Dundee Bypass is constructed and operational prior to 2023. The funding for the Bypass is uncertain. The absence of the Bypass and of additional capacity improvements
in the corridor to improve connections to I-5 would (other things being equal) reduce the demand for McMinnville homes from households whose wage earners work in the greater Portland urban area.
Transportation pricing or taxing – proposals for modified statewide transportation taxing on the basis of personal vehicle mileage rather than current gasoline purchase/consumption (gas tax) will affect future, long-distant commuting to/from McMinnville. Depending on how the pricing is imposed and how the funds are spent in the McMinnville-Portland corridor, the effects on the demand for housing in McMinnville could be positive or negative, and could vary by type and price of housing.
McMinnville Residents Commuting to Primary Willamette Valley Job Centers (1990)
Portland
West METRO
SE METRO
Gresham
McMinnville
Salem-Keizer
Albany
Corvallis
Springfield-Eugene

McMinnville Transportation System Plan May 2010
Transpo Group | Chapter 3 – Evaluation of McMinnville’s Transportation System Page 3-5
The combination of these factors—none of which the base-run (future, year 2023) of the Model (and, in some cases, the structure of the model itself) can account for— will affect travel behavior and, as a result, the number and type of new residents and businesses attracted to McMinnville. One reasonable scenario could assume that a larger portion of new McMinnville residents will be (a) non-working retirees, (b) work-at-home tele-commuters, and (c) alternative mode users, especially local and inter-city commuters. Furthermore, current McMinnville residents may also be more inclined to reduce their driving in favor of alternative, less-costly forms of transportation. Compared to that scenario, the current base-run of the Model is very likely to overstate the estimate of future vehicle travel demand, both within the McMinnville area and for those commuting to and from the Portland and Salem urban areas. Nonetheless, one must start somewhere, and the Model’s estimates can serve as a baseline for comparison. No other estimating tools are currently available to the City. Continued tracking of traffic volume will serve as the best indicator whether the Model’s 20-year vehicle traffic estimates are accurate (as the City regularly re-evaluates its TSP and supportive traffic estimate findings).
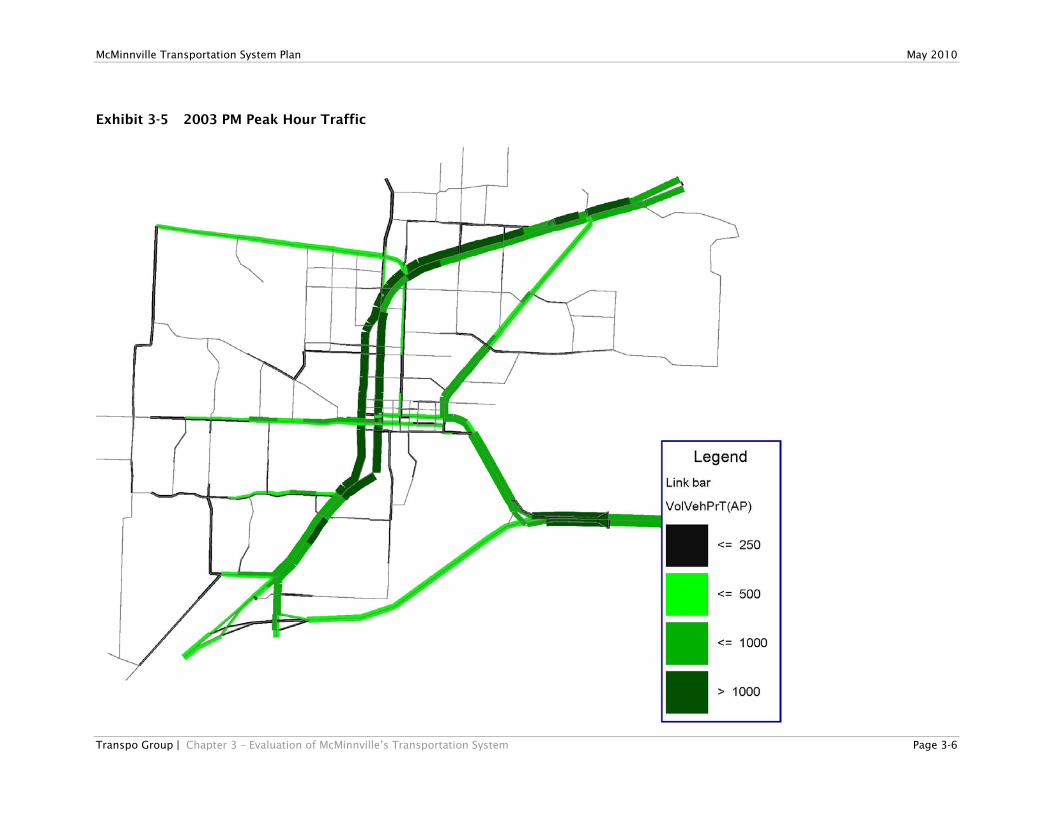
Traffic Forecasts ODOT’s Level 3 Travel Demand Model was used to estimate year 2003 and 2023 design hour volumes, which generally reflect the PM peak hour. The PM peak hour varies within the city, depending on location and adjacent land use. A city-wide weighted average reveals that the typical peak hour occurs in McMinnville between 5:00 and 6:00 pm, on an average weekday. Based on year 2003 housing and employment data, the Travel Demand Model estimates vehicular traffic on area highways and arterial and collector streets. The 2003 pm peak hour Model estimates are shown in Exhibit 3-5. These estimates compared favorably to the level of traffic recorded on McMinnville arterial streets and ODOT highways in 2003, a term referred to as “calibration.”
2023 PM Peak Hour
ODOT’s 2023 Travel Demand Model estimates future travel conditions in the McMinnville area based on two principles: (1) local demographics, reflected by the growth in housing and
employment within McMinnville’s UGB, and (2) relatively no change to the vehicle trip generation rates and trip
distribution patterns of McMinnville residents and commuters. The resulting 2023 PM peak hour Model estimates on major McMinnville streets and highways are summarized in Exhibit 3-6. Future volumes are expected to be highest on Highways 18 and 99W, with considerable growth also on McMinnville’s minor arterial network. These traffic conditions assume that no major street capacity improvements or new connections are constructed in the McMinnville UGB area. For perspective, the Travel Demand Model enables a direct comparison between years 2003 and 2023 traffic estimates. By subtracting the year 2003 traffic from year 2023, the net new traffic volume can be mapped. Exhibit 3-7 notes the net new vehicular traffic growth by route in the McMinnville area. East-west minor arterials like Baker Creek Road and Old Sheridan Road are expected to see significant growth in traffic; as are Highway 99W and Lafayette Avenue. The most significant growth in traffic is expected on Highway 18 between Norton Lane and SW McMinnville, the corridor serving the city’s high residential (west and southwest) and employment (airport area) growth areas.
McMinnville Transportation System Plan May 2010
Transpo Group | Chapter 3 – Evaluation of McMinnville’s Transportation System Page 3-6
Exhibit 3-5 2003 PM Peak Hour Traffic

McMinnville Transportation System Plan May 2010
Transpo Group | Chapter 3 – Evaluation of McMinnville’s Transportation System Page 3-7
Exhibit 3-6 2023 PM Peak Hour Traffic

McMinnville Transportation System Plan May 2010
Transpo Group | Chapter 3 – Evaluation of McMinnville’s Transportation System Page 3-8
455455
755755405405
485485
315315
345
345
465465
255
255
455455
755755405405
485485
315315
345
345
465465
255
255
Exhibit 3-7 Net Difference: 2023 -2003 PM Peak Hour
Traffic

McMinnville Transportation System Plan May 2010
Transpo Group | Chapter 3 – Evaluation of McMinnville’s Transportation System Page 3-9
Street System Performance
Future (2023) Traffic Performance As discussed in Chapter 2, the 1999 Oregon Highway Plan (OHP) mobility standards are integrated in the TSP to assess state highway intersection performance in the McMinnville urban area. These standards were originally defined by ODOT as a measure of the V/C ratio at state highway intersections. For consistency, the same measures have been applied to city street intersections in the TSP study. The mobility standards are defined as “the peak hour traffic volume (vehicles/hour) at an intersection divided by the maximum volume that the intersection can handle.” Higher levels of traffic congestion are expected when the V/C ratio is near or over 1.0.
Major Street Corridors
Similar V/C measures are used to evaluate the Travel Demand Model estimates for years 2003 and 2023 for the major highways and streets in McMinnville. These measures are helpful in first targeting those street corridors where higher levels of congestion are expected. Exhibits 3-8 and 3-9 show the PM peak hour, street corridor V/C calculations for years 2003 and 2023 respectively. In these two maps the red lines indicate where estimated travel demand exceeds the practical capacity of the street or highway, yellow lines indicate possible hot spots, and green lines indicate traffic volumes below capacity. These maps indicate and confirm recognized congestion spots today, particularly the 2nd Street corridor crossing of Adams and Baker Streets, and Lafayette Avenue. By 2023, traffic congestion on many of McMinnville’s major east-west routes will present a challenge. Baker Creek Road, 2nd Street, Fellows Street and Old Sheridan Road will all experience higher levels of congestion; as will sections of Highway 99W, especially in the south end of the city. Also of note, future travel demand on the Three Mile Lane Spur across the Yamhill River is estimated to exceed capacity.
In many cases future traffic congestion is directional. For example, most of the east-west routes serving West McMinnville are congested in the westbound direction. This is logical, as much of the PM peak traffic is made up of commuters returning home from work and other activities. While the Travel Demand Model was not developed to test the morning commute peak hour, the reverse pattern is expected, as eastbound travel lanes are more heavily congested.
Major Intersections
Using the major street corridor analysis as perspective, the evaluation of future traffic conditions in the McMinnville TSP focused on critical intersections along major and minor arterials throughout McMinnville. A more detailed evaluation of the downtown street system was also conducted and summarized separately below. These major intersections serve as additional indicators of overall system performance, and are used to help identify operational and capacity improvements at critical junction points.

McMinnville Transportation System Plan May 2010
Transpo Group | Chapter 3 – Evaluation of McMinnville’s Transportation System Page 3-10
Exhibit 3-8 2003 PM Peak Hour V/C

McMinnville Transportation System Plan May 2010
Transpo Group | Chapter 3 – Evaluation of McMinnville’s Transportation System Page 3-11
Exhibit 3-9 2023 PM Peak Hour V/C

McMinnville Transportation System Plan May 2010
Transpo Group | Chapter 3 – Evaluation of McMinnville’s Transportation System Page 3-12
2006 2023 Future
Intersection LOS1 Delay2 V/C3 or
WM4 LOS Delay
V/C or
WM
1. Hwy 99/LaFayette Ave C 25.5 0.77 C 23.9 0.80
2. Hwy 99/McDaniel Ln B 14.2 0.62 A 9.9 0.54
3. Hwy 99/McDonald Ln C 29.2 0.59 C 30.0 0.65
4. Hwy 99-NE Evans St/Baker Crk Rd B 13.3 0.62 B 19.6 0.81
5. 19th St/Hwy 99 B 12.6 0.56 A 9.7 0.56
6. 12th St/Adams (Hwy 99) B 11.3 0.78 C 31.1 0.97
16. Old Sheridan Rd/Baker (Hwy 99) C 34.1 0.72 F 155.2 1.52
17. WB Ramp/Hwy 99 E 38.9 0.82/WB F >200 3.25/WB
21. NW Baker Creek Rd/Baker St A 9.2 0.43 B 13.4 0.55
22. 19th St/Baker St (all-way stop) B 12.3 0.53 C 16.5 0.60
29. NW Baker Creek Rd/Hill Rd B 11.9 0.26/NB F 72.5 1.01/NB
31. 2nd St/Hill Ave B 15.0 0.13/EBT-L E 39.4 0.79/WB
34. Cypress St/SW Old Sheridan Rd C 16.0 0.07/NBL F >200 1.16/NBL
43. 13th St/LaFayette Ave B 12.5 0.60 B 17.0 0.79
47. OR 18/Norton Ln B 19.7 0.53 E 63.3 1.02
1. Level of service, based on 2000 Highway Capacity Manual methodology. 2. Average delay in seconds per vehicle. 3. Volume-to-capacity ratio reported for signalized intersections. 4. Worst movement reported for unsignalized intersections.
Traffic Delays on 2nd Street
Table 3-1 compares existing (2006) and future (2023) V/C ratios for PM peak hour operations with the McMinnville TSP mobility standards (see Chapter 2). With the exception of the Highway 18 westbound ramp intersection at Highway 99W, all critical area intersections operate within the TSP mobility standards. Table 3-1 Weekday PM Peak Hour LOS 2006 and 2023 Summary
By 2023, however, several intersections along McMinnville’s arterial streets and on ODOT highways exceed the mobility standards. Signalized intersections that are projected to exceed the mobility standards in 2023 include: Adams (Hwy 99) and 12th Street Highway 99 and Old Sheridan Road Highway 18 and Norton Lane
Several study area unsignalized intersections are estimated to exceed the TSP mobility standards in 2023, including: Baker Creek Road and Hill Road Cypress Street and Old Sheridan Road See Appendix C for a summary of all study area intersection V/C calculations for year 2006 and 2023, and for the summary documentation of ODOT Travel Demand Model (when made available).
Downtown McMinnville
During the 2006 weekday PM peak hour, traffic regularly backs up on 2nd Street east of Adams Street in the downtown area. Regular back-ups on 2nd Street extend as far east as Ford Street, causing disruption to north-south vehicle, bicycle and pedestrian traffic. A special examination of localized traffic operations was conducted early in the TSP process to help identify options to reduce congestion in the corridor. No reasonable options exist to widen or build new arterial streets to help relieve these conditions. The downtown McMinnville land use and street grid network is relatively fixed. Further, Cozine Creek, City Park, Michelbook golf course and existing neighborhoods greatly limit the City’s ability to extend alternative routes to West McMinnville.

McMinnville Transportation System Plan May 2010
Transpo Group | Chapter 3 – Evaluation of McMinnville’s Transportation System Page 3-13
2006 Existing 2023 – 5th Street Option
Intersection LOS1 Delay2 V/C3 or
WM4 LOS Delay
V/C or
WM
10. 3rd St & Baker (Hwy 99) B 10.3 0.58 B 15.4 0.65
11. 2nd St & Adams (Hwy 99) B 17.3 0.79 B 17.2 0.78
12. 2nd St & Baker (Hwy 99) B 12.1 0.64 C 23.0 0.88
45. 3rd St & LaFayette Ave B 17.6 0.62 C 20.9 0.71
49. 5th Street & Adams (Hwy 99) D 30.4 WB C 21.2 0.89
50. 5th Street & Baker (Hwy 99) E 38.5 EB C 20.2 0.86
52. 5th Street & Lafayette E 37.4 EBL B 15.6 0.75 1. Level of service, based on 2000 Highway Capacity Manual methodology. 2. Average delay in seconds per vehicle. 3. Volume-to-capacity ratio reported for signalized intersections. 4. Worst movement reported for unsignalized intersections. 5. Currently, the 5th Street intersections of Adams St., Baker St. and Lafayette are unsignalized.
Emphasis in the analysis of downtown options focused on increasing system efficiencies: making better use of existing street and intersection infrastructure (channelization) and traffic signal control measures. As shown in Exhibit 3-10, much of the east-west traffic through downtown is centered on 3rd Street and 2nd Street, with some also on 1st Street. All of the east-west traffic to and from West McMinnville is confined to 2nd Street. Between Adams and Baker Streets there is very little storage for vehicles on 2nd Street, and the two traffic signals have limited capacity to accommodate 2nd Street traffic, while simultaneously servicing movements on Adams and Baker Streets. Exhibit 3-11 illustrates use of 5th Street as an alternative east-west route. The option assumes placing new traffic signals at either end of 5th Street; at the Adams and Baker west end and also at Lafayette Avenue. A new signal at Adams and 5th Street obviates the need for the existing Adams/4th Street signal. An additional signal on Adams Street at 3rd Street is also assumed for enhanced pedestrian connectivity between downtown McMinnville (east of the Adams/Baker one-way couplet) and the City Park, Aquatic Center and Library. Pedestrians currently crossing Adams Street, via the 4th Street signal, can then use either the new 3rd Street or 5th Street signals. The new signal on Lafayette at 5th Street would allow eastbound traffic to access Lafayette. Today, the steady flow of traffic on Lafayette makes this connection very difficult. As a result, there is a shift in existing PM peak hour traffic of about 20-30 percent from 2nd Street to 5th Street The estimated shift in traffic to the 5th Street option is based on modified travel patterns that are predicted to occur after the traffic control upgrades are made. A detailed analysis of aggregate turning movement patterns in the Downtown McMinnville area was confirmed by observed, origin-destination patterns Additional lane re-striping or very minor curb-line adjustments at select intersections would also be required to best support the revised traffic pattern. These include: Added right-turn lane to the westbound approach on 2nd Street.
at Baker Street,
Additional left- and right-turn lanes to the southbound approach on Adams Street at 2nd Street, and
Added left-turn lane to the southbound approach on Adams Street at 5th Street.
Further, neighborhood traffic calming measures that discourage cut-through traffic are likely needed on 5th Street west of Adams Street to discourage non-local traffic. Table 3-2 compares existing (2006) and future (2023) V/C ratios for PM peak hour operations at major intersections in Downtown McMinnville with the McMinnville TSP mobility standards. Table 3-2 Weekday PM Peak Hour LOS 2006 and 2023 Summary
–Downtown McMinnville

McMinnville Transportation System Plan May 2010
Transpo Group | Chapter 3 – Evaluation of McMinnville’s Transportation System Page 3-14
705620
605
540
130
135
640
420
1,430
1,320
1,315
1,075
100
45
335
195
420
385
195
100
125
140
295
260
340
285
350
195
210 185
5th St
4th St
3rd St
2nd St
1st St
Ada
ms
St
Bak
er S
t
Evan
s St
John
son St
2006 P.M. Peak Hour Traffic
Exhibit 3-10 Existing Street and Traffic Control: Downtown

McMinnville Transportation System Plan May 2010
Transpo Group | Chapter 3 – Evaluation of McMinnville’s Transportation System Page 3-15
705620
605
540
130
135
640
420
1,430
1,320
1,355
1,075
345
110
245
145
305
375
130
90
325
255
225
260
275
170
300
160
210 185
5th St
4th St
3rd St
2nd St
1st St
Ada
ms
St
Bak
er S
t
Evan
s St
John
son St
20-30% shift in traffic from 2nd to 5th
Exhibit 3-11 Revised Street and Traffic Control: Downtown

McMinnville Transportation System Plan May 2010
Transpo Group | Chapter 3 – Evaluation of McMinnville’s Transportation System Page 3-16
Long-Range Future Options Considered In response to stakeholder participants in the TSP, a series of future transportation system options were defined and tested, and then compared to the Future Baseline travel conditions in McMinnville. Each option is defined in this section, including two Future Build options and a Transportation Demand Management option. The purpose of each option is to determine the level of traffic demand relief they provide, particularly within those corridors linking central and southwest McMinnville and the McMinnville airport area. These options are further described below.
Future Baseline
The Future Baseline condition assumes that no major street capacity improvements or new street connections are made by year 2023. As described above, traffic volumes will increase in McMinnville as population and employment continue to grow. Assumed within the Future Baseline Option are the new traffic signals and routing improvements within the Downtown McMinnville area.
Future Build Options
Two major, long-term street system build options were evaluated as part of the TSP, including (1) a new Yamhill River bridge connecting Highway 18 through McMinnville’s industrial area to Lafayette Avenue, and (2) a new Highway 18 interchange and connection to SW Hill Road.
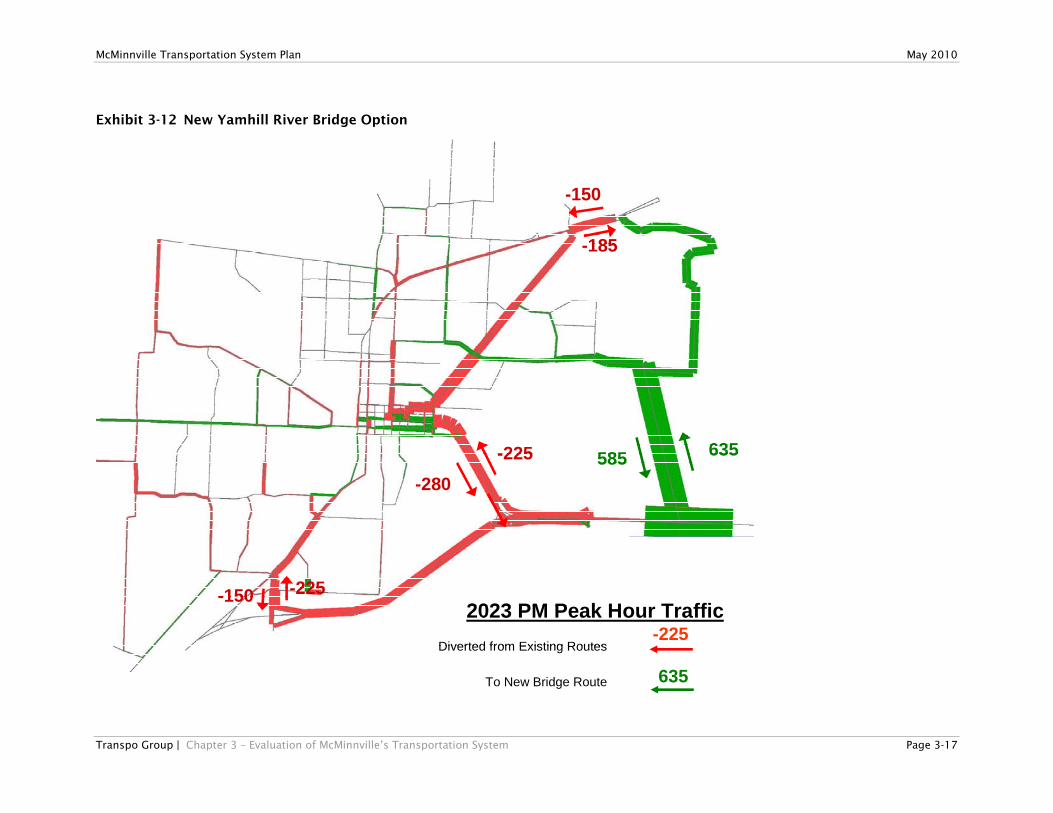
Option 1: New Yamhill River Bridge
Exhibit 3-12 identifies the general location of a new connection that would link the McMinnville Airport area, north across the Yamhill River to Riverside Drive in the McMinnville Industrial Area. The new bridge would provide significant improvements for industrial access, reducing truck traffic through the downtown McMinnville area, and provide a more direct route between the Airport and northeast McMinnville.
This option shows that a new bridge across the Yamhill River would provide significant relief to future corridor constraints, mainly reducing the level of peak hour traffic on the current Yamhill River Bridge and Highway 99W in southwest McMinnville. Further, this option would require significant study of the environmental impacts and costs associated with a new bridge across the Yamhill River. The new bridge route would also exit McMinnville’s current Urban Growth Boundary. Should the City pursue the new Yamhill River bridge option, further policy evaluation would be required to either substantiate a revision to the UGB, support an exception to applicable land use goals, and/or revise both the City’s and Yamhill County’s Transportation System Plans.
Option 2: New Highway 18 Interchange in SW McMinnville
The second build option assumes (conceptually) a new interchange on Highway 18 in southwest McMinnville. Exhibit 3-14 shows the general location of the new interchange and the relative impacts of future traffic relief to the McMinnville street and highway system. While this option does help reduce some future traffic on east-west corridors in west McMinnville, it has very little impact alleviating congestion on Three Mile Lane and Highway 99W in southwest McMinnville. Two critical design and policy issues limit this option. State policy guiding the spacing of interchanges requires the location of a new interchange on Highway 18 to be two miles west of the existing Highway 99W interchange (Oregon Highway Plan, 1999), too far west to reasonably assist McMinnville. Modifications to the existing interchange with a new link north to Hill Road would require extensive new right-of-way, much of which is outside the current UGB, and costly structural improvements to the existing interchange. For these reasons this option is not recommended for further consideration.
McMinnville Transportation System Plan May 2010
Transpo Group | Chapter 3 – Evaluation of McMinnville’s Transportation System Page 3-17
635585-225-280
-150
-150
-225
-185
2023 PM Peak Hour TrafficDiverted from Existing Routes
To New Bridge Route
-225
635
635585-225-280
-150
-150
-225
-185
635585-225-280
-150
-150
-225
-185
2023 PM Peak Hour TrafficDiverted from Existing Routes
To New Bridge Route
-225
635
Exhibit 3-12 New Yamhill River Bridge Option

McMinnville Transportation System Plan May 2010
Transpo Group | Chapter 3 – Evaluation of McMinnville’s Transportation System Page 3-18
2023 PM Peak Hour TrafficDiverted from Existing Routes
To Interchange Route
2023 PM Peak Hour TrafficDiverted from Existing Routes
To Interchange Route
Exhibit 3-13 New OR 18 Interchange

McMinnville Transportation System Plan May 2010
Transpo Group | Chapter 3 – Evaluation of McMinnville’s Transportation System Page 3-19
50% 55% 60% 65% 70% 75% 80% 85% 90% 95% 100%
Albany
Bend
Canby
Corvallis
McMinnville
Newberg
St Helens
Sandy
Drive-Alone Carpooled Transit Bike
Walk Other At-Home
Transportation Demand Management (TDM) Option
Through Transportation Demand Management (TDM), the peak travel demands in McMinnville can be reduced or spread to different time periods to provide more efficiency in the City’s transportation system. Further analysis was conducted to determine if TDM measures, either individually or collectively, would reduce the levels of congestion along key corridors by the year 2023. There are many TDM programs and measures. The most effective TDM programs focus on reducing drive-alone commuter trips, either by mode (e.g. shift from “drive-alone” to walk or carpool/vanpool modes) or by time of day (e.g. shift in commuter travel times to avoid P.M. peak hour). This option focuses on the conceptual application of combined TDM program impacts to reduce the level of drive-alone commuting to employment sites city-wide, but particularly in the McMinnville Airport area and job sites east of McMinnville. The target is to reduce the level of future drive-alone commuter travel during the PM peak hour on Three Mile Lane (across the Yamhill River bridge) and Highway 99W in southwest McMinnville. As shown in Exhibit 3-14, the work-commute characteristics of McMinnville residents are similar to other mid-sized Willamette Valley cities4. Many factors affect these characteristics: proximity
to major urban areas and employment centers, local employment, travel costs (including parking fees) and presence of transit and bicycle systems to name a few. Of course the price of fuel is a significant factor affecting travel behavior. Today, 75% of McMinnville workers drive-alone and another 15% carpool. Exhibit 3-14 2000 Census – Journey-To-Work Comparison
For the purposes of the TSP evaluation an adjustment to the future travel demand estimates (PM peak hour) are made: 10% reduction in worker commute auto trips between the McMinnville Airport industrial area and McMinnville neighborhoods. The effect of the TDM measures could result in reduction of 90-120 westbound vehicle trips during the future PM peak hour in the Three Mile Lane and Highway 99W corridors. Even with the TDM enhancements, future (2023) PM peak hour intersection performance at the intersections of OR-18/Norton Lane and Highway 99W/Old Sheridan Road exceed OHP mobility standards. See Appendix C for future LOS analysis and results.
McMinnville Transportation System Plan May 2010
Transpo Group | Chapter 3 – Evaluation of McMinnville’s Transportation System Page 3-20
ExcellentGood
FairPoor
Very PoorPartlyFailed Failed
Minor Arterial
Major Collector
Minor Collector
0.0%
5.0%
10.0%
15.0%
20.0%
25.0%
Perc
ent L
engt
h
Condition Rating
Minor ArterialMajor CollectorMinor Collector
The implementation of these TDM measures will require significant policy coordination between the City and private employers. See Chapter 7 for recommended TDM measures.
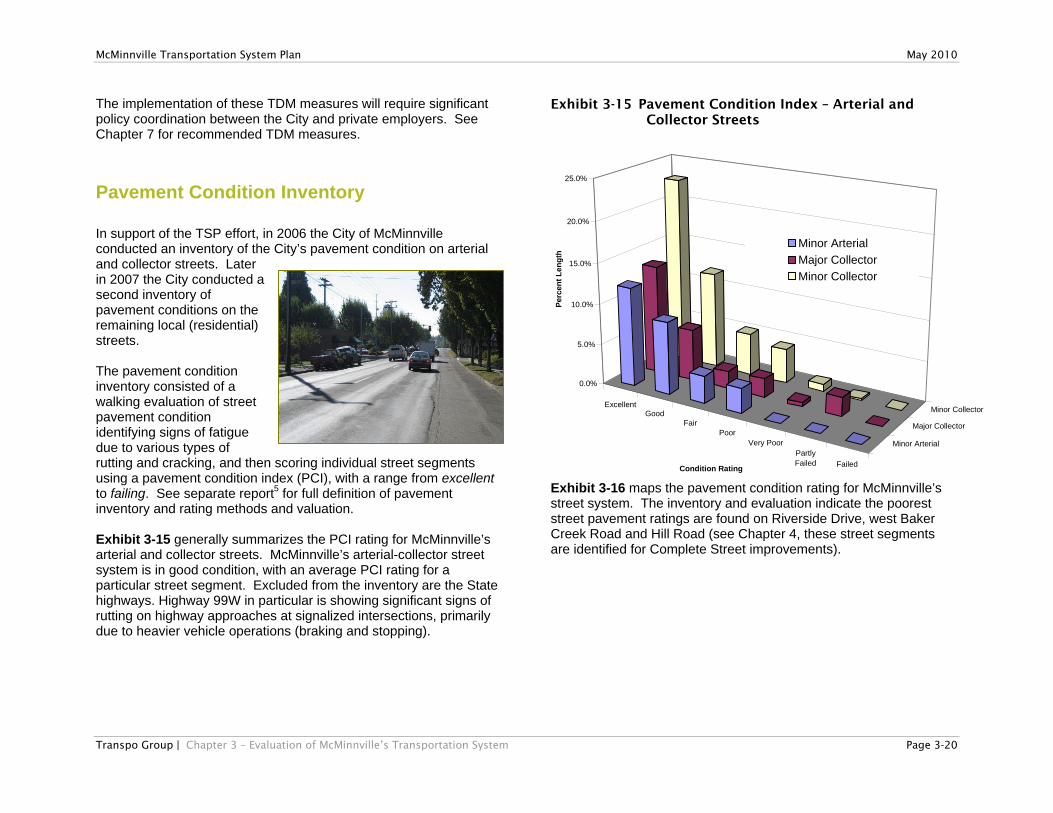
Pavement Condition Inventory In support of the TSP effort, in 2006 the City of McMinnville conducted an inventory of the City’s pavement condition on arterial and collector streets. Later in 2007 the City conducted a second inventory of pavement conditions on the remaining local (residential) streets. The pavement condition inventory consisted of a walking evaluation of street pavement condition identifying signs of fatigue due to various types of rutting and cracking, and then scoring individual street segments using a pavement condition index (PCI), with a range from excellent to failing. See separate report5 for full definition of pavement inventory and rating methods and valuation. Exhibit 3-15 generally summarizes the PCI rating for McMinnville’s arterial and collector streets. McMinnville’s arterial-collector street system is in good condition, with an average PCI rating for a particular street segment. Excluded from the inventory are the State highways. Highway 99W in particular is showing significant signs of rutting on highway approaches at signalized intersections, primarily due to heavier vehicle operations (braking and stopping).
Exhibit 3-15 Pavement Condition Index – Arterial and Collector Streets
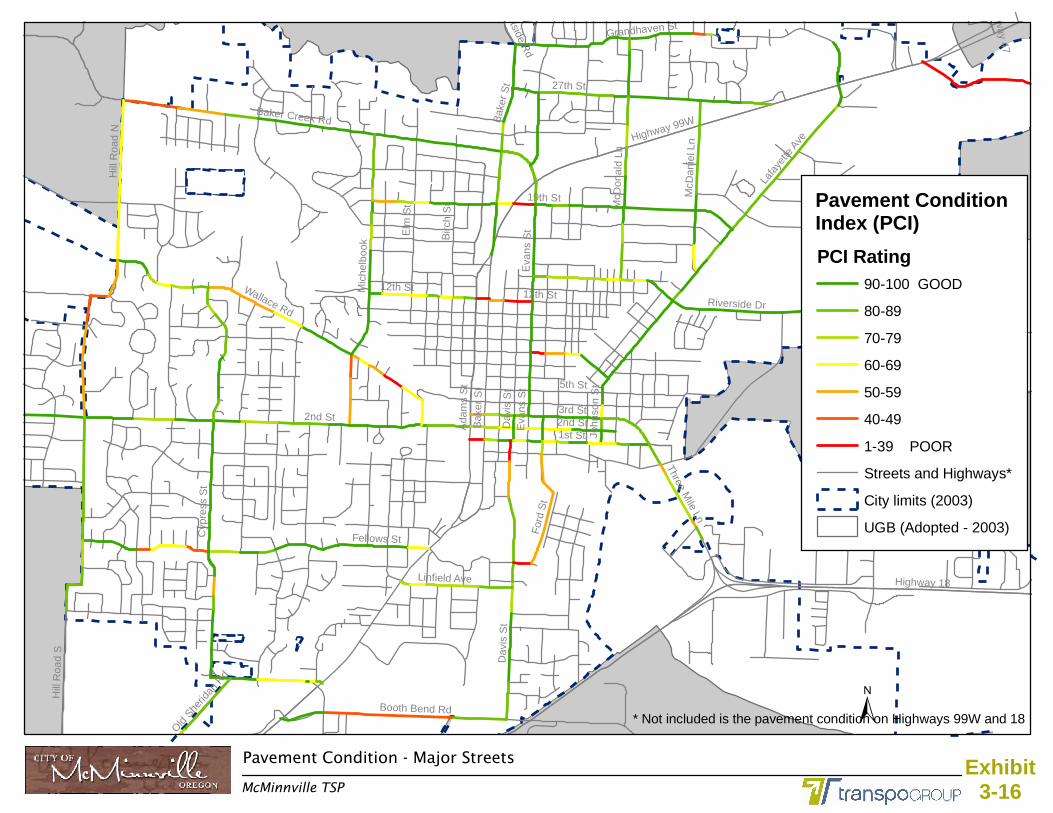
Exhibit 3-16 maps the pavement condition rating for McMinnville’s street system. The inventory and evaluation indicate the poorest street pavement ratings are found on Riverside Drive, west Baker Creek Road and Hill Road (see Chapter 4, these street segments are identified for Complete Street improvements).
For
d S
t
Booth Bend Rd
Highway 99W
Hill
Ro a
d S
Hil l
Roa
d N
Nor
ton
Ln
Riverside Dr
Three Mile Ln
1st St
5th St
3rd St
Dav
is S
t
27th St
2nd St
Wallace Rd
Highway 18
Cyp
res s
St
McD
anie
l Ln
Lafa
yette
Ave
Fellows St
Linfield Ave
McD
onal
d L n
Old S
herid
an R
d
12th St12th St
Bak
er S
t
Ba k
er S
t
Eva
ns S
tE
vans
St
Mi c
hel b
o ok
19th St
Baker Creek Rd
Westside R
d
Elm
St
Grandhaven St
Birc
h S
t
Ada
ms
St
John
s on
St
Highw
ay 47
Dav
i s S
t
2nd St
Pavement Condition Index (PCI)
PCI Rating90-100 GOOD
80-89
70-79
60-69
50-59
40-49
1-39 POOR
Streets and Highways*
City limits (2003)
UGB (Adopted - 2003)
±Pavement Condition - Major Streets
McMinnville TSP
Exhibit3-16
* Not included is the pavement condition on Highways 99W and 18
McMinnville Transportation System Plan May 2010
Transpo Group | Chapter 3 – Evaluation of McMinnville’s Transportation System Page 3-22
Preventative Mainentance Graphed with Typical Pavement Life Expectancy Cycle
0
25
50
75
100
0 5 10 15 20 25 30Years
Con
ditio
n C
ateg
orie
s
Type I
Type II / III
Type IV
Type V
Recommended Strategy: 3 Consecutive Slurry Seals6-Year Intervals @ $2.40 / sq yd
Overlay @ $11.50 / sq yd
Reconstruct @ $38.50 / sq yd
Recently Reconstructed Evans St
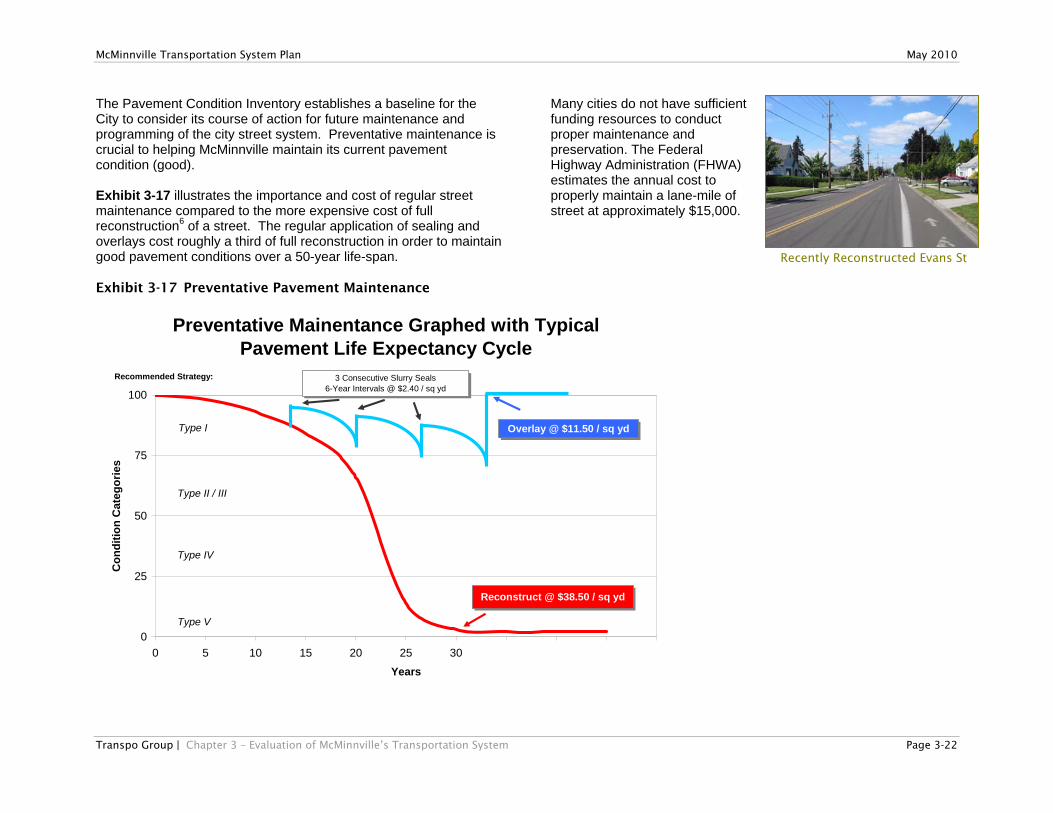
The Pavement Condition Inventory establishes a baseline for the City to consider its course of action for future maintenance and programming of the city street system. Preventative maintenance is crucial to helping McMinnville maintain its current pavement condition (good). Exhibit 3-17 illustrates the importance and cost of regular street maintenance compared to the more expensive cost of full reconstruction6 of a street. The regular application of sealing and overlays cost roughly a third of full reconstruction in order to maintain good pavement conditions over a 50-year life-span. Exhibit 3-17 Preventative Pavement Maintenance
Many cities do not have sufficient funding resources to conduct proper maintenance and preservation. The Federal Highway Administration (FHWA) estimates the annual cost to properly maintain a lane-mile of street at approximately $15,000.

McMinnville Transportation System Plan May 2010
Transpo Group | Chapter 3 – Evaluation of McMinnville’s Transportation System Page 3-23
City Maintenance Expenditures Per Lane MileFY 2004-05
Actual Expenditures per
Lane Mile
$0
$4,000
$8,000
$12,000
$16,000
Ashland
Baker
CityGari
baldi
Gresha
mMilw
aukie
Newbe
rgPort
land
Shady
Cov
eSist
ersSpri
ngfie
ldMcM
innvill
e
Ideal
Source Data: League of Oregon Cities and City of McMinnville
As shown in Exhibit 3-18, most Oregon cities fund their street maintenance programs at levels well below the FHWA ideal investment. McMinnville has done a very good job of historically maintaining its streets, but is not sufficiently budgeting to maintain these conditions in the future. Exhibit 3-18 Comparative Street Maintenance Expenditures
Sidewalk System Inventory In 2006 the City conducted a walking inventory of all city streets and Highway 99W within the UGB to document the location and type of existing and missing sidewalks and curb ramps. This section describes the data collection process and resulting inventory of sidewalk and curb ramp facilities within the McMinnville urban area. Transpo Group developed the inventory program for use of hand-held Global Positioning System (GPS) units to electronically record the necessary pedestrian system features. City Staff conducted the walking inventory of sidewalk and curb ramps. A summary of the sidewalk inventory is shown in Exhibit 3-19. There are over 86 miles of existing sidewalks in McMinnville. Many of the older and most recent neighborhoods have fully developed sidewalk networks. Other neighborhoods are missing sidewalks along many streets. These neighborhoods were developed at times when development codes and standards did not require sidewalk construction. Of the City’s existing sidewalks, 40% have some form of buffering or park strip between the sidewalk and curb. Some street segments have a sidewalk on at least one side. However, there are over 18.5 miles of missing sidewalks. The sidewalk system inventory also identified the location and type of existing curb ramps, and intersection corners with missing curb ramps. Curb ramps assist the mobility impaired pedestrians when crossing streets and are a required design feature contained within the City’s street design standards, consistent with the American’s With Disabilities Act (ADA). There are over 1,665 curb ramps within the McMinnville urban area. However, over 650 street corners have missing curb ramps.

McMinnville Transportation System Plan May 2010
Transpo Group | Chapter 3 – Evaluation of McMinnville’s Transportation System Page 3-24
0
10
20
30
40
50
60
Missing Buffer No Buffer
Mile
s
Existing Sidewalks
Exhibit 3-19 Sidewalk System Summary
Exhibit 3-20 maps the sidewalk inventory. Exhibit 3-21 maps the missing sidewalks and curb ramps. The sidewalk and curb ramp inventory serves as a crucial baseline by which Complete Street projects and priority pedestrian system improvements are identified in Chapters 4 and 5, respectively.
Bicycle System Update
A bicycle system inventory was completed as part of the 1994 McMinnville Transportation Master Plan. Several streets have been improved since 1994, including the addition of on-street bicycle lanes on Lafayette Avenue. In addition, new shared-use path facilities
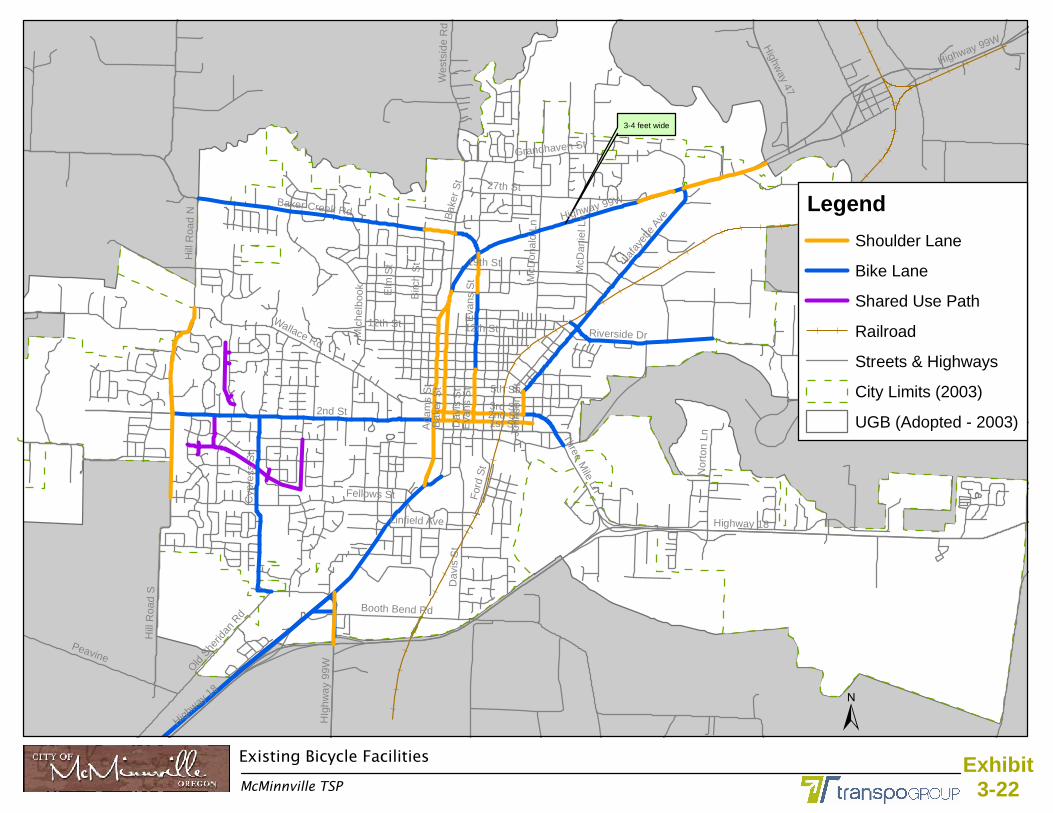
were recently constructed west of Meadows Drive along the utility rights-of-way. Several arterial routes, however, do not accommodate separate bicycle facilities, some require cyclists to share the travel lanes with motorized traffic, or use fairly narrow shoulder space. The current bicycle system is illustrated in Figure 3-22. The Bicycle System Plan chapter includes a detailed description of differing bicycle users, facilities and plan elements to complete McMinnville’s bicycle facility network.
Summary This chapter identifies the impact of McMinnville’s growth on the City’s street and highway system. It also provides a baseline by which later chapters of the TSP identify important plan recommendations for pavement management, pedestrian and bicycle system plan development, and policy development to advance a transportation demand management program for the McMinnville Urban area.

UNDER CONSTRUCTION
Peavine
Hi ll
Ro a
d S
Highw
ay 47
For
d S
t
Old S
herid
an R
d
Booth Bend Rd
Hil l
Roa
d N
Nor
ton
Ln
Riverside Dr
Dav
is S
t
2nd St
Wes
t si d
e R
d
Highway 18
Highway 18
Cy p
ress
St
McD
anie
l Ln
Highway 99W
Highway 99W
HI g
hway
99W
Lafa
yette
Ave
Fellows St
Linfield Ave
Three Mile Ln
1st St
5th St
3rd St
McD
onal
d L n
12th St 12th St
Bak
er S
t
Bak
er S
t
27th St
Eva
ns S
tE
vans
St
Mic
h elb
ook
19th St
Baker Creek Rd
El m
St
Wallace Rd
Grandhaven St
Bi rc
h S
tA
dam
s S
t
John
son
St
2nd St
Dav
i s S
t
Legend
Existing Sidewalks
Shared Use Path
Missing Sidewalks
Streets & Highways
City Limits (2003)
UGB (Adopted - 2003)
Sidewalk Inventory
McMinnville TSP
Exhibit3-20

UNDER CONSTRUCTION
Peavine
Hi ll
Ro a
d S
Highw
ay 47
For
d S
t
Old S
herid
an R
d
Booth Bend Rd
Hill
Roa
d N
Nor
ton
Ln
Riverside Dr
Dav
is S
t
2nd St
Wes
t si d
e R
d
Highway 18
Highway 18
Cy p
ress
St
McD
anie
l Ln
Highway 99W
Highway 99W
HIg
hway
99W
Lafa
yette
Ave
Fellows St
Linfield Ave
Three Mile Ln
1st St
5th St
3rd St
McD
onal
d L n
12th St 12th St
Bak
er S
t
Bak
er S
t
27th St
Eva
ns S
tE
vans
St
Mic
h elb
ook
19th St
Baker Creek Rd
Elm
St
Wallace Rd
Grandhaven St
Birc
h S
tA
dam
s S
t
John
son
St
2nd St
Dav
is S
t
Legend
No Curb Ramps
No_Sidewalks
Streets Highways
City Limits (2003)
UGB (Adopted - 2003)
Missing Sidewalks and Curb Ramps
McMinnville TSP
Exhibit3-21
3-4 feet wide
Peavine
Hi ll
Roa
d S
Highw
ay 47
Wes
t sid
e R
d
For
d S
t
Old S
herid
an R
d
Booth Bend Rd
Highway
18
HIg
hway
99W
Hi ll
Ro a
d N
Nor
ton
Ln
Riverside Dr
Dav
is S
t
2nd St
Highway 99W
Highway 99W
Cyp
ress
St
McD
anie
l Ln
Lafa
yette
Ave
Fellows St
Linfield Ave
Three Mile Ln
1st St
5th St
3rd St
McD
ona l
d Ln
12th St 12th St
Bak
er S
t
Bak
e r S
t
27th St
Eva
n s S
tE
van s
St
Mi c
hel b
o ok
19th St
Baker Creek Rd
Elm
St
Wallace Rd
Grandhaven St
Birc
h S
tA
dam
s S
t
Joh n
son
St
Highway 18
2nd St
Dav
is S
t
Legend
Shoulder Lane
Bike Lane
Shared Use Path
Railroad
Streets & Highways
City Limits (2003)
UGB (Adopted - 2003)
±Existing Bicycle Facilities
McMinnville TSP
Exhibit3-22

McMinnville Transportation System Plan May 2010
Transpo Group | Chapter 3 – Evaluation of McMinnville’s Transportation System Page 3-28
1 Exhibit 3-1 includes lands that are under appeal and not officially inside the McMinnville UGB; and include the assumptions and designations of the McMinnville Growth Management and Urbanization Plan and Highway 18 Corridor Plan. 2 Oregon Department of Transportation (ODOT), Transportation System Planning Guidelines, 2001. 3 ODOT TPAU report, 2007, source data from U.S. Census from 1990 Census Transportation Planning Package. 4 U.S Bureau of Census, 2000 Journey to Work summary. 5 McMinnville Pavement Condition Survey, Measurement Research Corporation, March 23, 2007. 6 League of Oregon Cities: Investing in a Neglected Asset. Case Study and report to invest in Oregon’s Municipal Street Infrastructure. March 2007.