Embed Size (px)
Citation preview
1
TRENDS AND FACTORS IMPACTING ON LATIN AMERICAN EQUITY
MARKET DEVELOPMENT
Note: This report was prepared as background for discussion at the 2013 Latin American Corporate
Governance Roundtable meeting in Quito, Ecuador by Daniel Blume, Senior Policy Analyst,
OECD Corporate Affairs Division, with the support of data development and analysis by Dr.
Alexandre Di Miceli da Silveira and research assistance from Ph.D. candidate Pedro Henrique
Barros. Special thanks go to the Ibero-American Federation of Exchanges and their Secretary-
General, Elvira Schamann, for their data and feedback on market trends from the region’s stock
exchanges, and to Mats Isaksson and Serdar Celik of the OECD Secretariat for the excerpts
integrated into this report developed for the OECD project on “Corporate Governance, Value
Creation and Growth.” Finally, we wish to acknowledge the funding support of the Spanish
government for this initiative, and the support of this year’s Roundtable hosts, the Bolsa de Valores
de Quito and Instituto Ecuatoriano de Gobernanza Corporativa.
Please send any comments to [email protected].
2
TABLE OF CONTENTS
1. Introduction .......................................................................................................................................... 4 2. The rationale for corporate governance and public policy ................................................................... 5 3. Trends in developed and emerging markets ......................................................................................... 5 4. Equity market development in Latin American economies .................................................................. 7
Overall equity market size and growth ..................................................................................................... 7 Market concentration and listed company size ........................................................................................ 8 Market Liquidity ...................................................................................................................................... 9 Latin American corporate financing trends: IPOs, ADRs and bonds..................................................... 11 Overall trends in stock market growth and company value ................................................................... 14
5. Latin American corporate ownership and control structures .............................................................. 15 The key role of Corporate Groups .......................................................................................................... 16 Institutional Investors ............................................................................................................................. 17 State ownership ...................................................................................................................................... 18
6. Market structure and trading practice influence on the incentives of different market actors ............ 19 Fragmentation in equity markets ............................................................................................................ 20 High frequency trading ........................................................................................................................... 21 Exchange traded funds ........................................................................................................................... 23 Impacts on incentives ............................................................................................................................. 24
7. Overall corporate governance trends in Latin America ...................................................................... 25 Argentina ................................................................................................................................................ 26 Brazil ...................................................................................................................................................... 28 Chile ....................................................................................................................................................... 30 Colombia ................................................................................................................................................ 31 Mexico .................................................................................................................................................... 32 Peru ........................................................................................................................................................ 33 Ecuador................................................................................................................................................... 33
8. Conclusions and Issues for Discussion ............................................................................................... 34 References .................................................................................................................................................. 37
ANNEX 1 ...................................................................................................................................................... 40
Tables
Table 1. Number of IPO in Latin America from 2003 to 2012 by country and by year ................. 11 Table 2. Number of Latin America companies that have cross-listed in the US market from 2003
to 2012 by country and by year ......................................................................................... 14 Table 3. Ownership structure of SOEs in some of the largest Latin American Economies ............ 18 Table 4. Estimated share of trade volume in the US (%, September 2009 ..................................... 21
Figures
Figure 1. Total investment in emerging markets (% of GDP) Gross fixed capital formation as
percentage of GDP) ............................................................................................................. 6 Figure 2. Global shift in equity markets ............................................................................................. 7
3
Figure 3. Trade increased faster than the supply of new equity ....................................................... 20 Figure 4. Global ETF assets ............................................................................................................. 24 Figure 5. Market capitalization of listed companies (% of GDP): 5 years average 1991-2011 ....... 40 Figure 6. Listed domestic companies, total: 1998-2011 ................................................................... 41 Figure 7. Listed domestic companies per million inhabitants: 5 years average 1991-2011 ............. 42 Figure 8. Market concentration: Share in total market cap of top 10 most cap firms: 1998-2010 .. 43 Figure 9. Market Capitalisation of Latin America listed companies on Dec 31st, 2012 (000’ US$)44 Figure 10. Stocks traded, total value (% of GDP): 1988-2011 ........................................................... 45 Figure 11. Stocks traded, turnover ratio (%): 1989-2011 ................................................................... 46 Figure 12. Average Free Float of Latin America Listed Companies: 1998-2012 ............................... 47 Figure 13. Capital raised on primary equity markets (only IPOs) in ‘000 000 USD from 2002 to
2012 ................................................................................................................................... 48 Figure 14. Capital raised on equity markets (IPO + Follow-On) in ‘000 000 USD from 2002 to 201249 Figure 15. Capital raised on equity (IPO + Follow-On) and bond markets in ‘000 000 USD: 2004 to
2012 ................................................................................................................................... 50 Figure 16. Percentage of listed firms listed on NYSE or on BM&FBOVESPA special listing
segments Level2 or Novo Mercado ................................................................................... 51 Figure 17. Average Stock Returns (%) of Latin America Listed Companies: 1995-2012 ................. 52 Figure 18. Cumulative Average Stock Returns of Latin America Listed Companies and FTSE 300:
Dec 31st 1994 = 100 .......................................................................................................... 53 Figure 19. Average price-to-earnings (PE ratio) of Latin America Listed Companies: 1995-2012 ... 54 Figure 20. Average percentage of voting shares held by the largest shareholder of Latin America
Listed Companies: 1998-2012 ........................................................................................... 55 Figure 21. Average percentage of voting shares held by the largest shareholder of Latin America
Listed Companies: 1998-2012 ........................................................................................... 56 Figure 22. Annual volume traded of Latin America listed companies in 2012 (000’ US$) ............... 57
4
TRENDS AND FACTORS IMPACTING ON LATIN AMERICAN EQUITY MARKET
DEVELOPMENT
1. Introduction
1. This report, prepared for the June 20-21 2013 meeting of the Latin American Corporate
Governance Roundtable and revised to take into account its discussions, comes at a critical juncture.
Equity markets all over the world are undergoing important changes. In the most developed markets, high-
frequency trading, increased use of indexing and growing market fragmentation are being seen, along with
a marked decline in initial public offerings (IPOs) and increase in de-listings during the last decade.
Meanwhile, some of the larger emerging markets have picked up a growing share of IPOs. One
consequence of this development is that, on a global scale, companies with concentrated ownership are
becoming the norm.
2. Developments in terms of market structure, investment strategies and ownership have also raised
questions about the conditions for equity-financed growth and the need to adapt corporate governance
requirements and practices to changing circumstances. These are some of the questions and issues being
discussed as the OECD prepares to revise the OECD Principles of Corporate Governance beginning in
2014. It is in this context that the OECD has also initiated a project on “Corporate Governance, Value
Creation and Growth,” aimed at better understanding these developments and the policy responses that
may be necessary to address them.
3. The Roundtable meeting provided an opportunity to better understand the particular features and
challenges associated with equity market developments worldwide and in particular in relation to the
experience of equity markets in Latin America. At center stage was the question of how equity markets
can serve the needs of the real economy and ensure that companies with growth potential get access to the
risk capital they need for innovation and job creation.
4. The Roundtable’s sessions were designed and structured to address several of the special
characteristics of Latin American markets, such as the prevalence of concentrated ownership, low liquidity
and conglomerates, and the challenges that this presents for oversight of related party transactions; efforts
to promote equity market growth and more active trading through SME listings; the strong role played by
state ownership as well as by institutional investors; and how corporate governance policies, regulations
and practices have evolved or should be adjusted to fit the particular challenges and opportunities
associated with such characteristics.
5. This paper provided background in particular for the Roundtable’s first session, which took stock
of how markets in the region have evolved over the last decade and the current corporate governance
challenges that they face. Due to data limitations, the report focuses mainly on the region’s six largest
markets – Argentina, Brazil, Chile, Colombia, Mexico and Peru – and to a lesser extent on the 2013
Roundtable meeting host, Ecuador. The six largest markets represent 97.5% of Latin American domestic
stock market capitalization and 74% of listed companies, according to FIAB data.
5
2. The rationale for corporate governance and public policy
6. The OECD’s 2013 report, “Who Cares? Corporate Governance in Today’s Equity Markets,”
lays out the rationale for the OECD’s interest in promoting effective corporate governance arrangements.1
It notes that corporate governance policies, laws and regulations influence capital formation and capital
allocation, which in turn determine economic growth. These rules and regulations determine the
conditions under which corporations are allowed to access public equity markets and the terms on which
savers are able to invest and participate in the value creating process of the corporation.
7. The report highlights how the quality of the corporate governance framework and the challenges
of policy design are relevant to three main stages of the investment process. The first stage revolves
around access to finance: the ability and willingness of savers to invest in equity that provides
entrepreneurs and growth companies with risk capital that they can use for innovation, job creation and
growth. For savers (shareholders) to come forward, a number of provisions are needed, such as secure
means of registration, transferability of shares, the right to receive corporate information and assurances
that the contractual rights that come with equity ownership are well defined and enforceable.
Entrepreneurs, on the other hand, will want to ensure that the framework makes it attractive to open up and
share ownership with outsiders.
8. The second stage of the investment process is focused on ensuring that capital is allocated to its
best possible use. This requires that shareholders have the necessary information to be able to identify and
make decisions on the economic potential of corporate activities, and that they have incentives to
independently gather and evaluate unique information about corporate prospects. This necessitates a range
of different provisions for disclosure as well as procedures related to corporate control.
9. The final stage of the investment process is focused on ensuring that corporate governance rules
enable shareholders to monitor boards and managers in their use of the money that shareholders have
invested. Shareholder rights to influence board composition, remuneration practices and relations with
stakeholders are important to this stage of the investment process.
10. Finally, it is important to note the unique role that equity financing plays in supporting corporate
innovation and growth. Since equity capital has only a residual claim on corporate earnings, it can be used
to finance projects with uncertain and long-term returns, such as research, product development,
innovation or the opening of new markets. Importantly, the transferability of shares in the public equity
market allows for the separation between the investment horizon of the individual saver and the investment
horizon of the corporation, so that a promising research project or product innovation does not have to be
stopped because a shareholder has an immediate need for cash.
3. Trends in developed and emerging markets
11. The global economy’s extensive shift of wealth towards emerging economies over the last
decades has been well documented. The OECD has summarised some of the key developments in
“Corporate Governance in Emerging Markets: A Scoping Paper” (2013), excerpted in this section. The
reshaping of the global economy is reflected in the increasing contribution of emerging economies to world
GDP growth. Emerging and developing economies’ share in global GDP was 40% in 2000, reached 49%
in 2010 and it is estimated that it will reach 57% in 2030 (OECD, 2010).
1 See also Isaksson, M. (2004), “Corporate Governance and Public Policy” in The Future of Corporate Governance,
ed. Mats Isaksson and Rolf Skog.
6
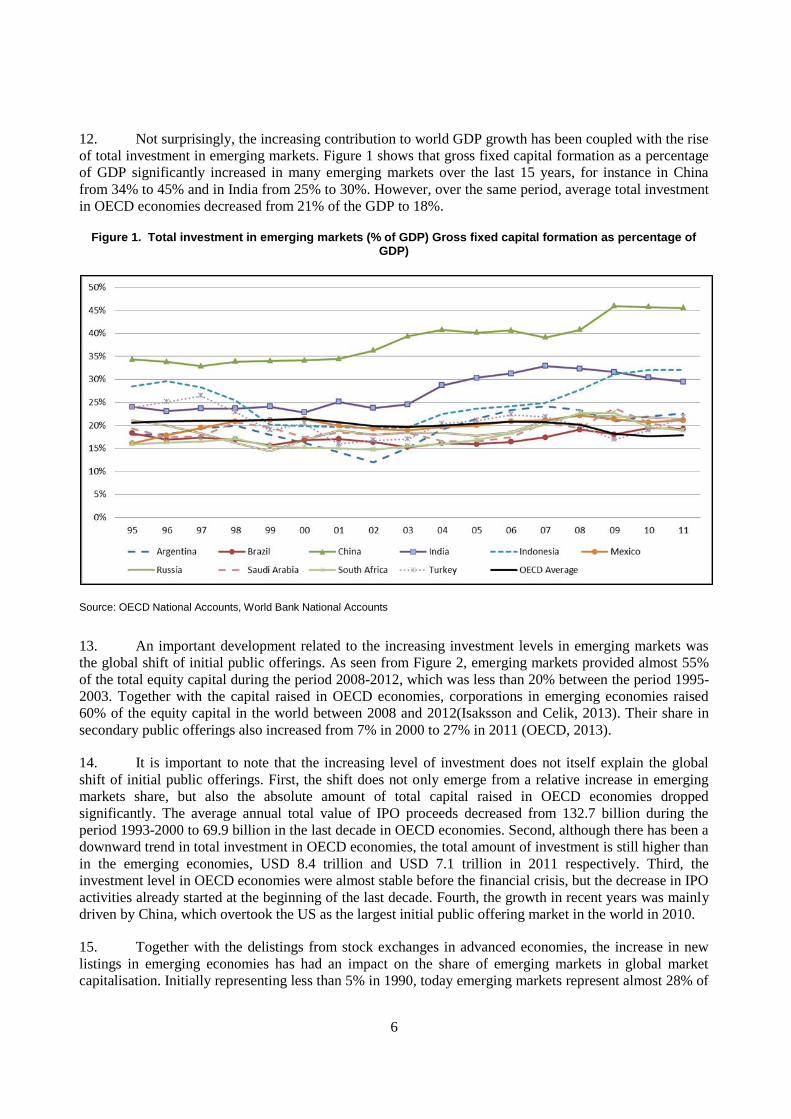
12. Not surprisingly, the increasing contribution to world GDP growth has been coupled with the rise
of total investment in emerging markets. Figure 1 shows that gross fixed capital formation as a percentage
of GDP significantly increased in many emerging markets over the last 15 years, for instance in China
from 34% to 45% and in India from 25% to 30%. However, over the same period, average total investment
in OECD economies decreased from 21% of the GDP to 18%.
Figure 1. Total investment in emerging markets (% of GDP) Gross fixed capital formation as percentage of GDP)
Source: OECD National Accounts, World Bank National Accounts
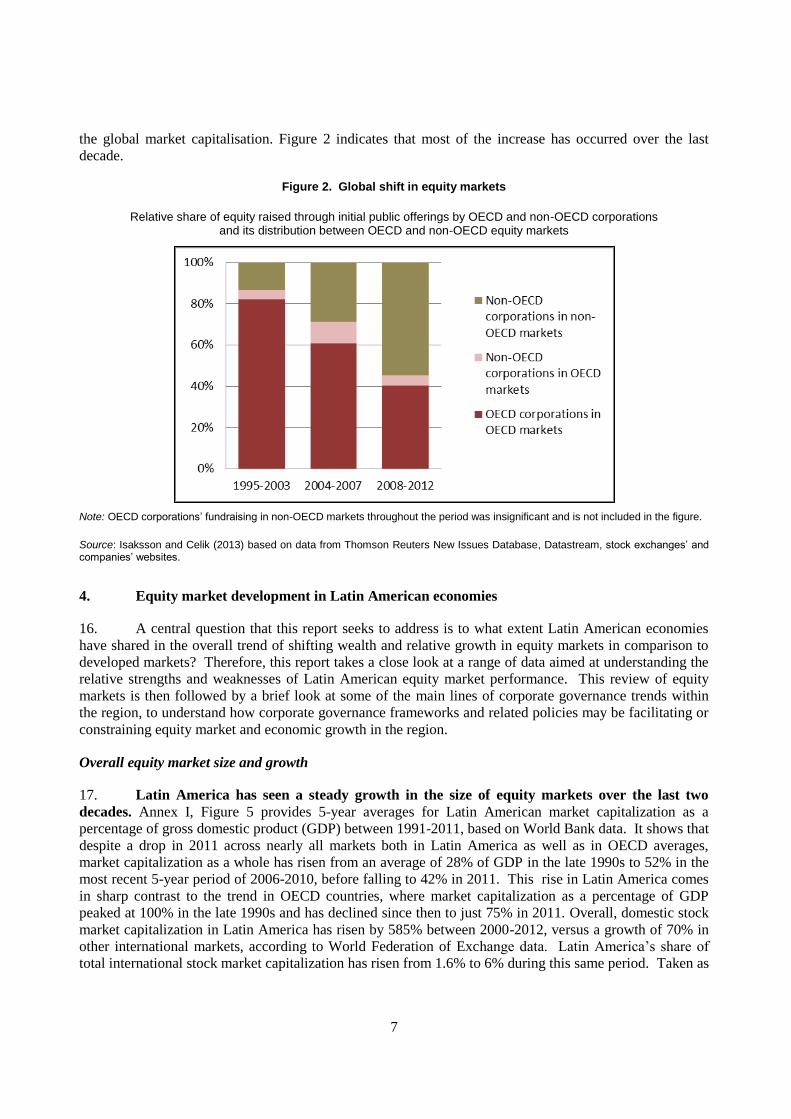
13. An important development related to the increasing investment levels in emerging markets was
the global shift of initial public offerings. As seen from Figure 2, emerging markets provided almost 55%
of the total equity capital during the period 2008-2012, which was less than 20% between the period 1995-
2003. Together with the capital raised in OECD economies, corporations in emerging economies raised
60% of the equity capital in the world between 2008 and 2012(Isaksson and Celik, 2013). Their share in
secondary public offerings also increased from 7% in 2000 to 27% in 2011 (OECD, 2013).
14. It is important to note that the increasing level of investment does not itself explain the global
shift of initial public offerings. First, the shift does not only emerge from a relative increase in emerging
markets share, but also the absolute amount of total capital raised in OECD economies dropped
significantly. The average annual total value of IPO proceeds decreased from 132.7 billion during the
period 1993-2000 to 69.9 billion in the last decade in OECD economies. Second, although there has been a
downward trend in total investment in OECD economies, the total amount of investment is still higher than
in the emerging economies, USD 8.4 trillion and USD 7.1 trillion in 2011 respectively. Third, the
investment level in OECD economies were almost stable before the financial crisis, but the decrease in IPO
activities already started at the beginning of the last decade. Fourth, the growth in recent years was mainly
driven by China, which overtook the US as the largest initial public offering market in the world in 2010.
15. Together with the delistings from stock exchanges in advanced economies, the increase in new
listings in emerging economies has had an impact on the share of emerging markets in global market
capitalisation. Initially representing less than 5% in 1990, today emerging markets represent almost 28% of
7
the global market capitalisation. Figure 2 indicates that most of the increase has occurred over the last
decade.
Figure 2. Global shift in equity markets
Relative share of equity raised through initial public offerings by OECD and non-OECD corporations and its distribution between OECD and non-OECD equity markets
Note: OECD corporations’ fundraising in non-OECD markets throughout the period was insignificant and is not included in the figure.
Source: Isaksson and Celik (2013) based on data from Thomson Reuters New Issues Database, Datastream, stock exchanges’ and companies’ websites.
4. Equity market development in Latin American economies
16. A central question that this report seeks to address is to what extent Latin American economies
have shared in the overall trend of shifting wealth and relative growth in equity markets in comparison to
developed markets? Therefore, this report takes a close look at a range of data aimed at understanding the
relative strengths and weaknesses of Latin American equity market performance. This review of equity
markets is then followed by a brief look at some of the main lines of corporate governance trends within
the region, to understand how corporate governance frameworks and related policies may be facilitating or
constraining equity market and economic growth in the region.
Overall equity market size and growth
17. Latin America has seen a steady growth in the size of equity markets over the last two
decades. Annex I, Figure 5 provides 5-year averages for Latin American market capitalization as a
percentage of gross domestic product (GDP) between 1991-2011, based on World Bank data. It shows that
despite a drop in 2011 across nearly all markets both in Latin America as well as in OECD averages,
market capitalization as a whole has risen from an average of 28% of GDP in the late 1990s to 52% in the
most recent 5-year period of 2006-2010, before falling to 42% in 2011. This rise in Latin America comes
in sharp contrast to the trend in OECD countries, where market capitalization as a percentage of GDP
peaked at 100% in the late 1990s and has declined since then to just 75% in 2011. Overall, domestic stock
market capitalization in Latin America has risen by 585% between 2000-2012, versus a growth of 70% in
other international markets, according to World Federation of Exchange data. Latin America’s share of
total international stock market capitalization has risen from 1.6% to 6% during this same period. Taken as
8
a whole, Latin American markets remain well below OECD averages but have shown strong rates of
growth in market capitalization in comparison to a gradual decline in OECD member averages.
18. Among individual markets, Chile has long served as the region’s leader in terms of market
capitalization as a percentage of GDP, with 109% as of 2011, up from an 82% average in the late 1990s.
Brazil saw the most dramatic growth in its markets over the last 20 years, moving from an average market
capitalization of 19% in the early 1990s, to 69% in the five-year period between 2006-2010. However, as
of 2011 that total had dropped to just 50%.
19. Colombia has shown the sharpest increase in 5-year averages during the last decade, increasing
from an average of 18% of GDP from 2001-2005 to 50% during the following five years, and hitting a
high of 60% as of 2011. Peru has also seen strong growth, hitting an average high of 65% in the 2006-
2010 period, before dropping to 45 percent as of 2011. Mexico lags somewhat behind at 35% in 2011,
while Argentina and Ecuador are far behind at 10% and 9% respectively as of 2011.
20. However, by a second measure of equity market health, the number of Latin American
domestically listed companies has been declining from more than 2000 in the late 1990s to 1505 as of
2011. [Listed domestic companies, total: 1998-2011, Figure 6, based on World Bank data].
21. Looking at 5-year averages of the number of listed domestic companies per million inhabitants
[Figure 7, based on World Bank data], the average in OECD member countries has remained fairly steady
at about 22 listed companies per million inhabitants, while the average in Latin American countries has
been just 4 in the late 1990s, declining to 2.8 during the last decade.
22. Chile again is shown as the clear Latin American leader with an average of 13.3 listed companies
per million inhabitants at the end of 2011, but still lagging well behind the OECD member average of 21.8.
By this measure, Latin America’s two largest markets, Brazil (1.9) and Mexico (1.1), lag well behind the
region’s leaders, Chile and Peru (6.9), and even slightly behind Ecuador (2.8), which comes in third out
of the seven Latin American countries reviewed.
Market concentration and listed company size
23. As the overall numbers of listed companies in proportion to population are so much smaller than
in OECD member countries, while market capitalization rates are relatively higher, this would suggest that
smaller companies are not taking advantage of the opportunities provided by equity markets, and that Latin
America’s largest companies are dominating and driving the growth in equity markets.
24. Indeed, a closer look at the data shows that overall numbers are driven by a relatively small
number of quite large companies. This is confirmed by market concentration data showing the share of
market capitalization of the 10 largest firms as a percentage of total market capitalization across six Latin
American countries [Figure 8]. Colombia leads the region in market concentration by this measure, with
its 10 largest firms representing 79% of market capitalization in 2010. Chile, with 47% market
capitalization among its top 10 firms, is the least concentrated market in the region, but still well above the
level of the New York Stock Exchange Euronext, where the figure was 19% in 2010.
25. Colombia led all countries in the region with the largest average market capitalization per
company of USD 5.9 billion [Figure 9]. Overall, tracking by the Economatica database2 shows Latin
2 Economatica is a comprehensive database offering information on companies listed on the exchanges of Brazil,
Argentina, Chile, Mexico, Peru, Colombia and Venezuela, as well as the largest 1,000 U.S. companies. It
has been widely used as a major source of academic research in the region. By the time of the data
collection, Economatica provided historical information on 1,700 Latin American companies, 1,068 of
9
American listed companies’ market capitalization has increased substantially since 1995, from an average
of USD 457 million per company in 1995 to USD 3.1 billion by the end of 2012. This growth has
skyrocketed especially in the past 10 years: the average market value per listed company has increased
eight fold since 2002. On the other hand, the high market capitalization levels of the largest companies are
driving the averages substantially higher than the median market capitalization value of USD 465.6
million. Colombia is the regional leader both in terms of average and median market capitalization levels,
followed by Mexico and Brazil, while Peru and Argentina show much lower median levels of USD 149.6
million and 87.1 million respectively.
Special considerations relevant to SME finance
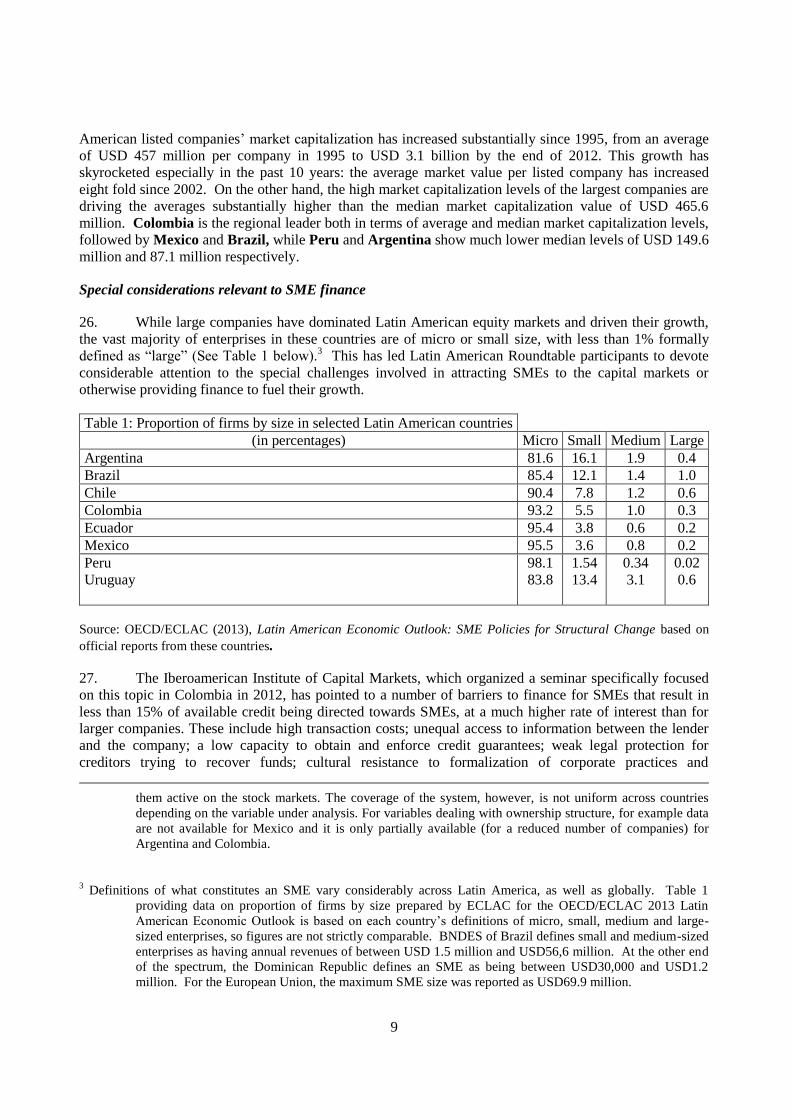
26. While large companies have dominated Latin American equity markets and driven their growth,
the vast majority of enterprises in these countries are of micro or small size, with less than 1% formally
defined as “large” (See Table 1 below).3 This has led Latin American Roundtable participants to devote
considerable attention to the special challenges involved in attracting SMEs to the capital markets or
otherwise providing finance to fuel their growth.
Table 1: Proportion of firms by size in selected Latin American countries
(in percentages) Micro Small Medium Large
Argentina 81.6 16.1 1.9 0.4
Brazil 85.4 12.1 1.4 1.0
Chile 90.4 7.8 1.2 0.6
Colombia 93.2 5.5 1.0 0.3
Ecuador 95.4 3.8 0.6 0.2
Mexico 95.5 3.6 0.8 0.2
Peru 98.1 1.54 0.34 0.02
Uruguay 83.8 13.4 3.1 0.6
Source: OECD/ECLAC (2013), Latin American Economic Outlook: SME Policies for Structural Change based on
official reports from these countries.
27. The Iberoamerican Institute of Capital Markets, which organized a seminar specifically focused
on this topic in Colombia in 2012, has pointed to a number of barriers to finance for SMEs that result in
less than 15% of available credit being directed towards SMEs, at a much higher rate of interest than for
larger companies. These include high transaction costs; unequal access to information between the lender
and the company; a low capacity to obtain and enforce credit guarantees; weak legal protection for
creditors trying to recover funds; cultural resistance to formalization of corporate practices and
them active on the stock markets. The coverage of the system, however, is not uniform across countries
depending on the variable under analysis. For variables dealing with ownership structure, for example data
are not available for Mexico and it is only partially available (for a reduced number of companies) for
Argentina and Colombia.
3 Definitions of what constitutes an SME vary considerably across Latin America, as well as globally. Table 1
providing data on proportion of firms by size prepared by ECLAC for the OECD/ECLAC 2013 Latin
American Economic Outlook is based on each country’s definitions of micro, small, medium and large-
sized enterprises, so figures are not strictly comparable. BNDES of Brazil defines small and medium-sized
enterprises as having annual revenues of between USD 1.5 million and USD56,6 million. At the other end
of the spectrum, the Dominican Republic defines an SME as being between USD30,000 and USD1.2
million. For the European Union, the maximum SME size was reported as USD69.9 million.
10
implementation of market regulation; macroeconomic factors; historical factors such as periodic
nationalisation and crises; and factors related to the origin of capital (foreign versus domestic).
28. Latin American governments and multilateral institutions have responded to these barriers in part
by establishing programmes to provide funding or otherwise facilitate SME access to finance. For
example, tThe CAF Latin American Development Bank and Inter-American Investment Corporation (IAC)
have sponsored programmes targeted at expanding financing to SMEs through private equity funds or
financial institutions, or by supporting access to bond markets as a first step that may ultimately facilitate
access to equity finance. Alternative markets for SMEs have been established in Argentina, Bolivia,
Brazil, Chile, Costa Rica, Ecuador, Mexico and Peru, but these markets have generally struggled to attract
SME listings. Educational initiatives for SMEs to strengthen corporate governance have also been
developed, for example in Colombia and Ecuador.
29. Brazil, which as of June 2013 had only attracted four SMEs to its special SME listing segment,
MAIS, has established an inter-agency Working Group to work towards a comprehensive, cross-
government/market approach to spurring greater SME use of capital markets. The Group, comprised of
representatives of its stock exchange, regulator, national development bank (BNDES), as well as other
government representatives, undertook an international study tour of experience in seven countries
(Australia, Canada, China, Korea, Poland, Spain and the United Kingdom) where SMEs are much more
active in using capital markets for their financing needs than in Latin America.
30. Its report (Brazil Working Group, 2012) found that the functioning of these markets varied
considerably and was generally tailored to fit local market practices and conditions. These market
conditions include 1) alignment of interests to reduce investor risk perceptions; 2) a network of
intermediaries that reaches out to investors; and 3) a culture of investment and risk. Generally these
markets contain a critical mass of enough listed SMEs to attract a pool of domestic investors with
knowledge of and interest in longer-term, higher risk investment strategies with potentially higher rewards.
In some cases, alternative markets for SMEs focused on particular sectors, such as mining, oil and gas.
Market incentives are often coupled with public policies or subsidies to encourage investment in SMEs,
such as 1) tax breaks for investors investing in alternative markets; 2) the fostering of the creation of
specific investment vehicles for SME finance; 3) specific rules for these markets that may require less
disclosure and differing requirements for number of shareholders and percentage of free float, as well as
alternative approaches to enforcement; and 4) SMEs may be offered financial assistance to cover the
expenses associated with the pre-listing process.
Market Liquidity
31. Within the context of concentrated ownership, one of the key issues for minority shareholders is
how liquid are the shares. While Latin American countries lag far behind OECD average measures of
market liquidity, Brazil and Mexico fare much better under these measures than they do on market
capitalization and listed company measures cited above. Brazil’s trading volume of 38.8% of GDP
[Stocks traded as a total value (% of GDP) from 1988-2011” [Figure 10] is almost double that of its closest
competitor, Chile at 22.9%, followed by Mexico at 9.7%. However, no Latin American country comes
close to the OECD member average of 112.5%. Measures of turnover ratio [“Stocks traded, turnover ratio
(%): 1989-2011” [Figure 11] also show Brazil far ahead of other Latin American countries, at 69.3% in
2011 compared to its closest competitor, Mexico, at 26.0%. Again, all Latin American countries fall far
short of the OECD average turnover ratio of 143.4% in 2011.
32. At the same time, these charts show that trading volume and turnover ratios increased most
sharply in the 2005-2008 period, especially in the OECD average but also in Latin American countries.
Following the global financial crisis of 2007-2008, the OECD member country averages have dropped
11
equally sharply, while Latin American country declines have been much smaller, signifying a relative gain
versus OECD countries among Latin American markets in terms of market liquidity over the last
few years.
33. According to analysis of the Economatica database, free float levels (estimated using share
ownership data on the percentage of all outstanding shares held by shareholders referred to by companies
as “others”4) have stayed at about the same level over the past decade for Latin American listed companies,
averaging between 21% and 23% since 2003, after descending from a high of 27% in 19982. Argentina
and Brazil had the highest free float levels of 28% and 29% respectively, while Chile and Peru had much
lower average levels of 16% as of 2012 [Figure 12].
Latin American corporate financing trends: IPOs, ADRs and bonds
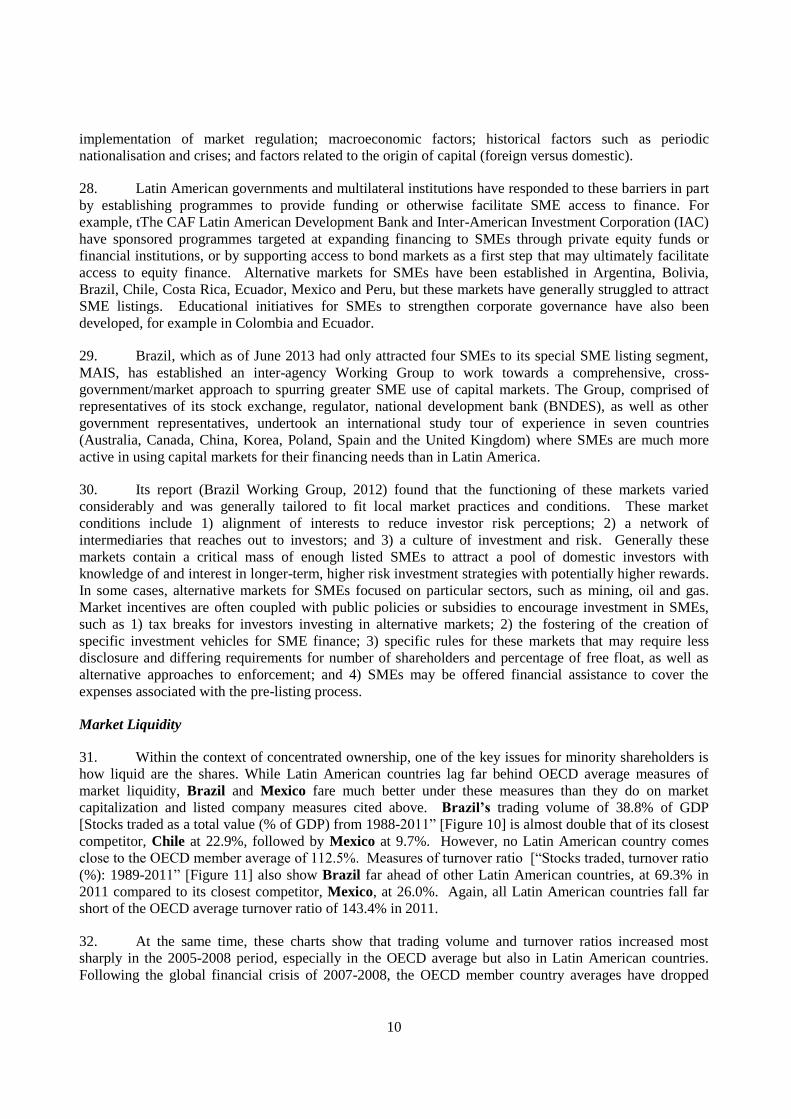
34. Another key indicator of Latin American equity market health is the extent to which domestic
markets have been used to raise new capital through Initial Public Offerings (IPOs), versus the extent to
which corporations are listed abroad, most often through American Depository Receipts (ADRs). Overall,
these data show a steady increase in IPOs between 2003 and the peak of 81 IPOs in 2007, driven by
Brazil’s IPO boom. This was followed by a sharp drop in the financial crisis year of 2008, and a steady but
more modest total of between 18 and 26 IPOs per year since then [Table 2].
35. The surge in the number of IPOs during 2004-2007 may be attributed to at least five main
factors:
1) Easy credit conditions and an asset bubble worldwide;
2) Macroeconomic stability in Latin America (coupled with a commodities boom);
3) Companies (fuelled by investment banks) making use of a “window of opportunity” resulting from
high-priced shares in the markets;
4) Improved investor protection at the country-level (through regulation or self-regulation such as the
Novo Mercado listing requirements);
5) Improved corporate governance practices at the firm-level.
Table 1. Number of IPO in Latin America from 2003 to 2012 by country and by year
Country 2003 2004 2005 2006 2007 2008 2009 2010 2011 2012 Number of companies
Argentina 0 0 0 3 4 1 0 2 2 1 13
Brazil 0 7 9 26 64 6 6 11 11 3 143
Chile 1 2 5 3 2 1 3 1 4 5 27
Colombia 2 0 5 1 6 2 11 3 0 4 34
Mexico 0 3 5 5 4 3 0 8 4 4 36
Peru 0 0 0 0 1 0 0 1 0 1 3
Latin America 3 12 24 38 81 13 20 26 21 18 256 Source: Federación Iberoamericana de Bolsas (FIAB) and its member exchanges
4 “Others” are shareholders below a certain threshhold (for example, in Brazil, this threshhold is set at 5%), for which
it is assumed that shares are more widely traded than is the case for larger blockholders. Use of this
category in aggregate as a proxy for free float is not considered to be a perfect measure but is the technique
most commonly used by academic researchers of Latin American capital markets to estimate free float
levels.
12
36. Brazil is clearly the Latin American leader, having accounted for 56% of the region’s IPOs over
the last decade, raising more than USD 60 billion between 2002 to 20125 through IPOs [Figure 13], which
have generally been listed on the special corporate governance listing tiers known as the Novo Mercado,
Level 1 and Level 2 listing segments. Around three-fourths of these IPOs, 106 out of 143, took place
during the Brazilian “IPO wave” of 2004-2007. Nearly half of the funds, 27.8 billion, were raised in a
single year, 2007, when 64 Brazilian IPOs occurred. Mexico was a distant second with slightly more than
USD 8 billion in IPO equity, followed by Chile with a little over USD 2 billion. All other Latin American
countries have raised less than USD 1 billion.
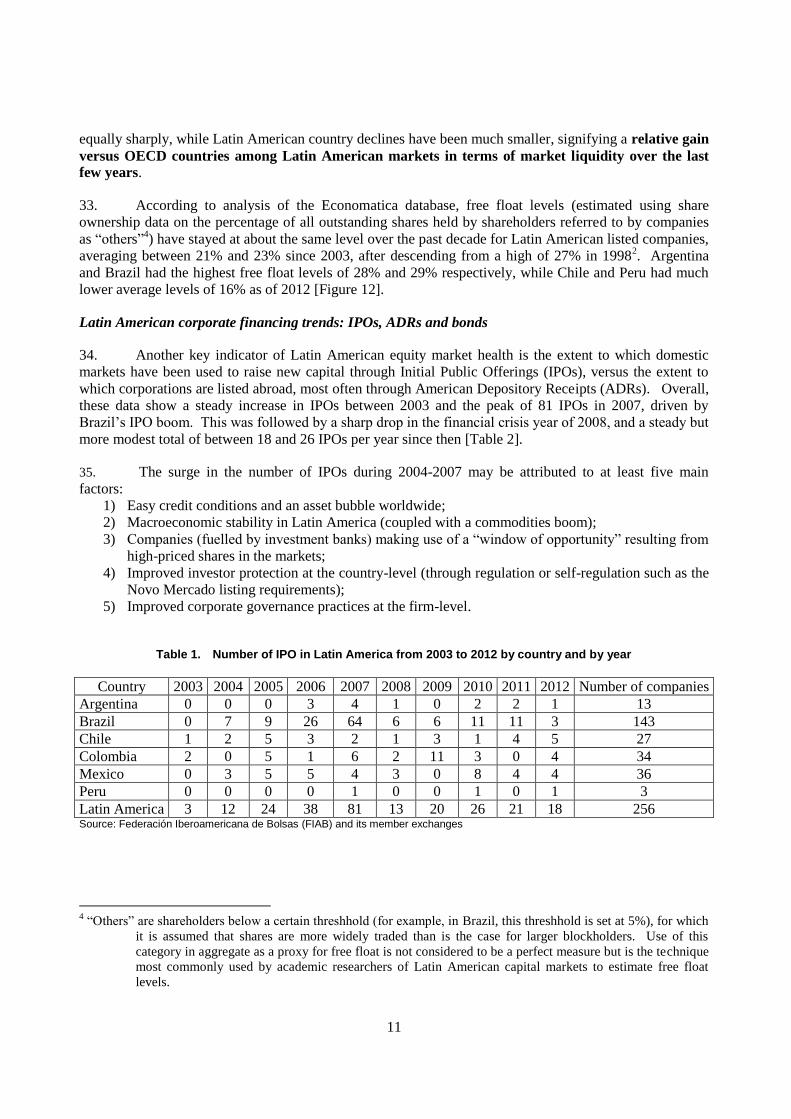
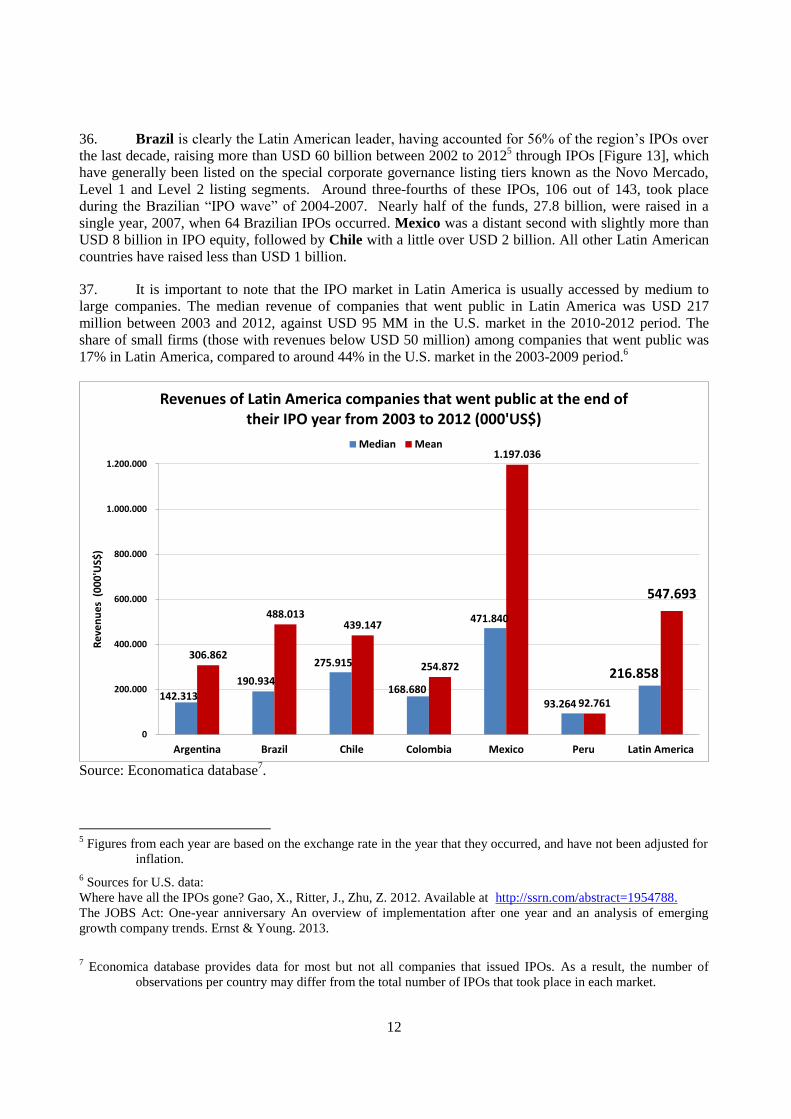
37. It is important to note that the IPO market in Latin America is usually accessed by medium to
large companies. The median revenue of companies that went public in Latin America was USD 217
million between 2003 and 2012, against USD 95 MM in the U.S. market in the 2010-2012 period. The
share of small firms (those with revenues below USD 50 million) among companies that went public was
17% in Latin America, compared to around 44% in the U.S. market in the 2003-2009 period.6
Source: Economatica database
7.
5 Figures from each year are based on the exchange rate in the year that they occurred, and have not been adjusted for
inflation.
6 Sources for U.S. data:
Where have all the IPOs gone? Gao, X., Ritter, J., Zhu, Z. 2012. Available at http://ssrn.com/abstract=1954788.
The JOBS Act: One-year anniversary An overview of implementation after one year and an analysis of emerging
growth company trends. Ernst & Young. 2013.
7 Economica database provides data for most but not all companies that issued IPOs. As a result, the number of
observations per country may differ from the total number of IPOs that took place in each market.
142.313
190.934
275.915
168.680
471.840
93.264
216.858
306.862
488.013 439.147
254.872
1.197.036
92.761
547.693
0
200.000
400.000
600.000
800.000
1.000.000
1.200.000
Argentina Brazil Chile Colombia Mexico Peru Latin America
Rev
en
ue
s (
00
0'U
S$)
Revenues of Latin America companies that went public at the end of their IPO year from 2003 to 2012 (000'US$)
Median Mean
13
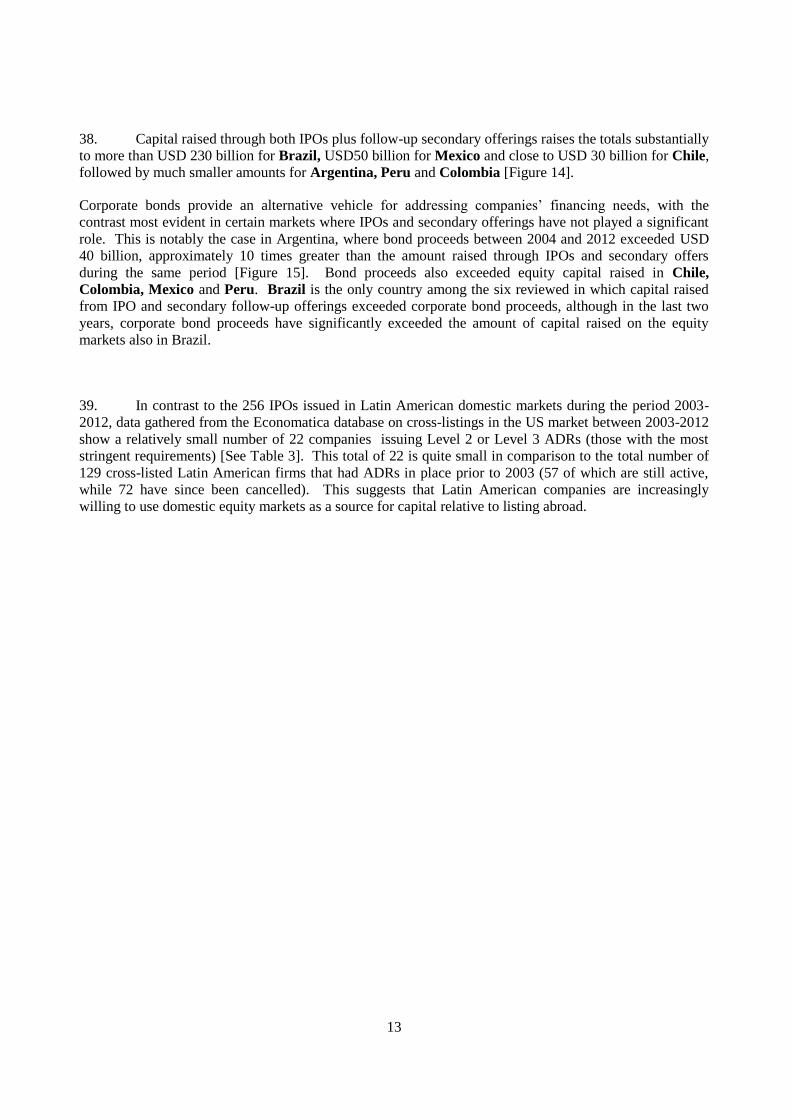
38. Capital raised through both IPOs plus follow-up secondary offerings raises the totals substantially
to more than USD 230 billion for Brazil, USD50 billion for Mexico and close to USD 30 billion for Chile,
followed by much smaller amounts for Argentina, Peru and Colombia [Figure 14].
Corporate bonds provide an alternative vehicle for addressing companies’ financing needs, with the
contrast most evident in certain markets where IPOs and secondary offerings have not played a significant
role. This is notably the case in Argentina, where bond proceeds between 2004 and 2012 exceeded USD
40 billion, approximately 10 times greater than the amount raised through IPOs and secondary offers
during the same period [Figure 15]. Bond proceeds also exceeded equity capital raised in Chile,
Colombia, Mexico and Peru. Brazil is the only country among the six reviewed in which capital raised
from IPO and secondary follow-up offerings exceeded corporate bond proceeds, although in the last two
years, corporate bond proceeds have significantly exceeded the amount of capital raised on the equity
markets also in Brazil.
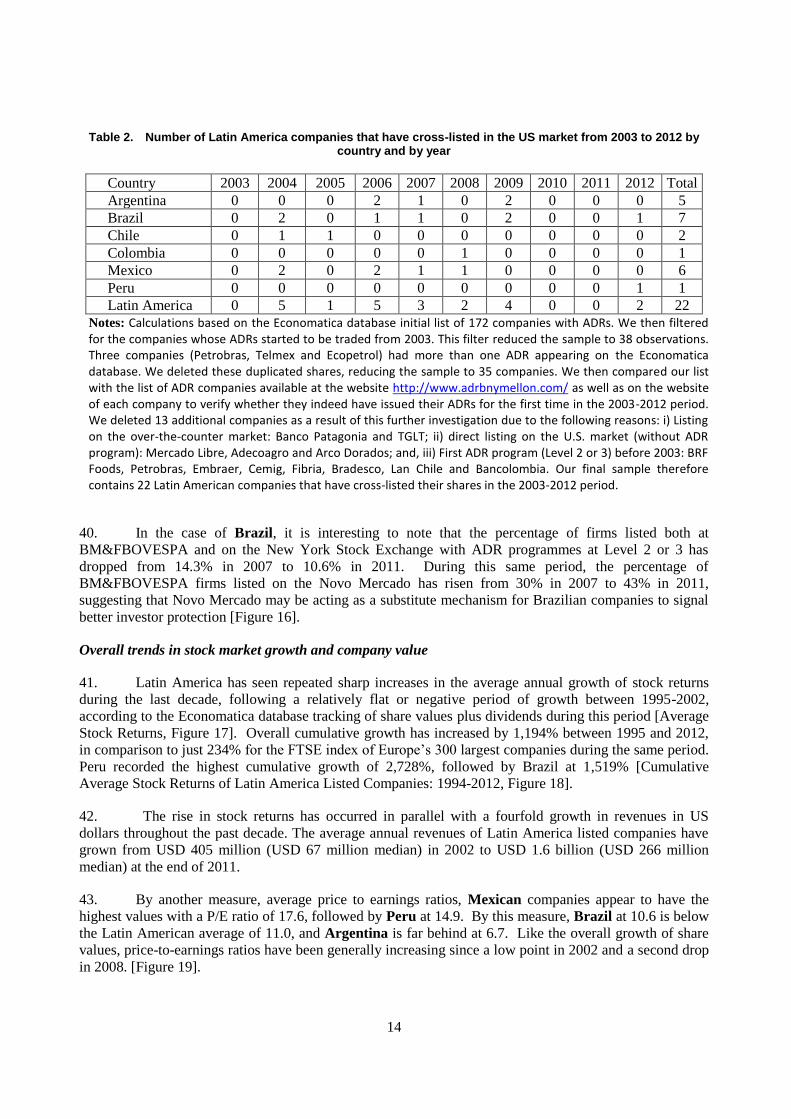
39. In contrast to the 256 IPOs issued in Latin American domestic markets during the period 2003-
2012, data gathered from the Economatica database on cross-listings in the US market between 2003-2012
show a relatively small number of 22 companies issuing Level 2 or Level 3 ADRs (those with the most
stringent requirements) [See Table 3]. This total of 22 is quite small in comparison to the total number of
129 cross-listed Latin American firms that had ADRs in place prior to 2003 (57 of which are still active,
while 72 have since been cancelled). This suggests that Latin American companies are increasingly
willing to use domestic equity markets as a source for capital relative to listing abroad.
14
Table 2. Number of Latin America companies that have cross-listed in the US market from 2003 to 2012 by country and by year
Country 2003 2004 2005 2006 2007 2008 2009 2010 2011 2012 Total
Argentina 0 0 0 2 1 0 2 0 0 0 5
Brazil 0 2 0 1 1 0 2 0 0 1 7
Chile 0 1 1 0 0 0 0 0 0 0 2
Colombia 0 0 0 0 0 1 0 0 0 0 1
Mexico 0 2 0 2 1 1 0 0 0 0 6
Peru 0 0 0 0 0 0 0 0 0 1 1
Latin America 0 5 1 5 3 2 4 0 0 2 22
Notes: Calculations based on the Economatica database initial list of 172 companies with ADRs. We then filtered for the companies whose ADRs started to be traded from 2003. This filter reduced the sample to 38 observations. Three companies (Petrobras, Telmex and Ecopetrol) had more than one ADR appearing on the Economatica database. We deleted these duplicated shares, reducing the sample to 35 companies. We then compared our list with the list of ADR companies available at the website http://www.adrbnymellon.com/ as well as on the website of each company to verify whether they indeed have issued their ADRs for the first time in the 2003-2012 period. We deleted 13 additional companies as a result of this further investigation due to the following reasons: i) Listing on the over-the-counter market: Banco Patagonia and TGLT; ii) direct listing on the U.S. market (without ADR program): Mercado Libre, Adecoagro and Arco Dorados; and, iii) First ADR program (Level 2 or 3) before 2003: BRF Foods, Petrobras, Embraer, Cemig, Fibria, Bradesco, Lan Chile and Bancolombia. Our final sample therefore contains 22 Latin American companies that have cross-listed their shares in the 2003-2012 period.
40. In the case of Brazil, it is interesting to note that the percentage of firms listed both at
BM&FBOVESPA and on the New York Stock Exchange with ADR programmes at Level 2 or 3 has
dropped from 14.3% in 2007 to 10.6% in 2011. During this same period, the percentage of
BM&FBOVESPA firms listed on the Novo Mercado has risen from 30% in 2007 to 43% in 2011,
suggesting that Novo Mercado may be acting as a substitute mechanism for Brazilian companies to signal
better investor protection [Figure 16].
Overall trends in stock market growth and company value
41. Latin America has seen repeated sharp increases in the average annual growth of stock returns
during the last decade, following a relatively flat or negative period of growth between 1995-2002,
according to the Economatica database tracking of share values plus dividends during this period [Average
Stock Returns, Figure 17]. Overall cumulative growth has increased by 1,194% between 1995 and 2012,
in comparison to just 234% for the FTSE index of Europe’s 300 largest companies during the same period.
Peru recorded the highest cumulative growth of 2,728%, followed by Brazil at 1,519% [Cumulative
Average Stock Returns of Latin America Listed Companies: 1994-2012, Figure 18].
42. The rise in stock returns has occurred in parallel with a fourfold growth in revenues in US
dollars throughout the past decade. The average annual revenues of Latin America listed companies have
grown from USD 405 million (USD 67 million median) in 2002 to USD 1.6 billion (USD 266 million
median) at the end of 2011.
43. By another measure, average price to earnings ratios, Mexican companies appear to have the
highest values with a P/E ratio of 17.6, followed by Peru at 14.9. By this measure, Brazil at 10.6 is below
the Latin American average of 11.0, and Argentina is far behind at 6.7. Like the overall growth of share
values, price-to-earnings ratios have been generally increasing since a low point in 2002 and a second drop
in 2008. [Figure 19].
15
5. Latin American corporate ownership and control structures
44. Latin American markets are known for having concentrated ownership, with companies generally
controlled by a family, controlling owner or group of controlling owners. This is the prevailing model of
ownership in most countries of the world, with the exception of the United States, United Kingdom,
Ireland and Australia. Within continental Europe, some markets such as the Netherlands also are more
dispersed than others, but companies with a controlling owner remain the prevailing model.
45. Ownership data suggest that apart from some movement towards dispersed ownership among a
small minority of Brazilian companies, Latin American markets remain highly concentrated and in some
cases, even more so than a decade ago.46. An analysis of Economatica data of Latin American listed
companies in five countries between 1998 and 2012 found that at the end of 2012, the largest shareholder
of listed companies in the region held an average of 57% of the company’s voting shares, essentially the
same as the 56% average recorded in 1998. Among individual countries, Brazil saw a decline from a 61%
average in 1998 to 54% in 2012, and Peru’s ownership concentration increased from 58% to 67% during
the same period [Figure 20].8
47. The five largest shareholders’ proportion of voting shares in Latin American listed companies
totalled 80% on average at the end of 2012, a slight drop from 82% in 1998. While the percentages
remained fairly stable in most cases over the last 15 years, Peru experienced an increase in concentration
among the five largest shareholders from 83% in 1998 to 92% in 2012. This figure decreased in Brazil
from 86% in 1998 to 77% in 2012 [Figure 21].
48. Companies without controlling shareholders exerted either by a single person or by a block of
shareholders are still the exception. Only 9.3% of listed companies in the region have less than 50% of
voting shares among their five largest shareholders. Brazil and Chile have the least concentrated
ownership in the region, with the controlling shareholder in Brazil averaging a 45% share of all
outstanding shares in 2012, a 5% drop from 2002. This figure is well below the 54% average control of
voting shares in Brazil, indicating that the use of non-voting shares in Brazil remains significant. Chile
also experienced a 5% decline in average percentage of outstanding shares to 47.5% at the end of 2012,
similar to the average percentage of voting shares in Chile, as only a small minority of Chilean companies
use non-voting shares.
49. Brazilian companies have considerable diversity in terms of the type of their ownership structure.
In addition to the traditional presence of family, state or foreign-control, two other forms of shareholding
structure have gained relevance in the past 15 years. Shared control, in which the control is exerted by a
pool of shareholders (usually two to four) acting in concert; and, widely-held companies, characterized by
a dispersed shareholding structure in which the largest shareholder usually holds less than 10% of the
shares. While the former has gained relevance mainly due to the privatization process that took place at the
end of the 90’s, the latter has started to flourish following the rapid growth of IPOs in the Brazilian stock
markets initiated in 2004. Currently, a relevant fraction of about 40% of Brazilian listed companies are
classified as under shared control. Although widely-held firms remain few in number, their consistent
increase from 0% before 2005 to 4.2% in 2007 to 6.8% in 2011 may signal a clear shift in the pattern of
ownership structure of a relevant fraction of Brazilian listed companies in the future.
8 The data presented in this section should be considered as rough indications of trends, since the population of
companies in the Economica database has shifted over time as a result of de-listings and new listings.
16
The key role of Corporate Groups
50. Fernando Lefort, Dean of the Diego Portales University Business School in Chile, provided an
excellent summary of the role played by corporate groups in Latin American economies as an annex to the
Roundtable’s “White Paper on Corporate Governance in Latin America” (2003). While noting some
difficulties in collecting good data on the size and structure of conglomerates across most Latin American
countries, Lefort nevertheless concludes that direct or indirect control by one of the numerous industrial,
financial and mixed conglomerates is the predominant corporate structure in Latin American economies. A
conglomerate is a group of firms linked to each other through ownership relations and controlled by a local
family, a group of investors acting in concert or by a foreign company. In Latin America, conglomerates
are usually controlled by the dominant shareholders through relatively complex structures including the use
of pyramids, cross-holdings and dual class shares, and often involve quite diversified sets of companies. In
the 2000s, over 90% of 33 of the largest groups in Latin America were family owned and managed.9
51. The structure varies by country. In Chile, one study from the year 2000 found that 68% of listed,
non-financial firms were controlled by one of approximately 50 non-financial conglomerates, representing
91% of the assets of non-financial companies listed in Chilean stock markets. About half of these
conglomerates were foreign-owned.10
Chilean Securities Law 18.045 defines business groups as a
collection of legal entities which share ownership, administration, or credit responsibility ties of such a
nature that there is a ground to believe that their economic and financial behaviour is guided by common
interests, or that their financial risks of debt and equity are interconnected (Silva, Majluf and Paredes,
2006). More recent data showed that 71.6% of listed firms in Chile were held by other listed firms from
2004-2008. Bank ownership plays a relatively small role in Chile due to restrictions imposed in 1982 on
bank ownership of shares following the debt crisis (3.2% on average). Foreign investors directly own
17.4% of shares, with foreign multinationals also making use of pyramidal structures (but cross-
shareholdings are prohibited by law). In addition, international banks indirectly held shares through
pension funds and insurance business.11
52. In Argentina, a 2005 study12
found that of 54 of the largest listed companies, 20 were linked
to conglomerates structured around pyramidal ownership structures. Lefort found that of 24 Argentinean
companies that have listed ADRs, 93% had affiliation to groups through pyramids. In these companies, the
controlling group had rights, directly or indirectly, over 68% of firms’ cash flows.13
These studies found
relatively little use of non-voting shares by groups to further separate ownership from control rights.
Bebzcuk found that while cash flow concentration was around 57%, voting rights concentration on average
reached 63%.
53. In Brazil, by contrast, there has been larger use of non-voting shares to enhance control
beyond levels of share ownership. However, this is not the case for the growing number of companies
listed on the Novo Mercado, which must subscribe to one-share one-vote requirements. Aguilera et al
(2011) conclude that industrial firms were the dominant shareholders in Brazil, holding 40.1% of all shares
9 Schneider, 2008, “Economic Liberalization and Corporate Governance: the Resilience of Business Groups in Latin
America,” Comparative Politics (40(4 July):379-98).
10 See Lefort and Walker (2000), “Ownership and Capital Structure of Chilean Conglomerates: Facts and Hypothesis
in Chile.” ABANTE, Vol. 3, No. 1, April.
11 See “Corporate Governance in Emerging Markets,” by Aguilera, R et al, 2011
12 Bebzcuk, R. (2005), “Corporate Governance and Ownership: Measurement and Impact on Corporate Performance
and Dvidend Policy in Argentina,” IDB Draft Paper.
13 See Lefort,(2005), “Ownership Structure and Corporate Governance in Latin America, Revista ABANTE, Vol. 8,
No.1, pp. 55-84, April.
17
on the market from 2004-2008, and using non-voting shares and pyramidal arrangements to allow
industrial groups to finance their projects. Banks were the second largest shareholders with an average of
30%, during the same period.
54. Data for Mexico is less recent, but available research also concludes that conglomerates are
the most common corporate structure, holding on average, 65.5% of listed company shares. Separation of
ownership and control is achieved through pyramids and use of dual class shares (Lefort, 2005).
55. In Colombia, one study of 233 listed and non-listed companies found that 116,
approximately half, are affiliated with groups. The study cites three of the largest conglomerates, known
as Sindicato Antioqueño, the Santodomingo group and the Ardila group, as making use of extensive cross-
shareholdings or pyramids to maintain control of 59 out of the 116 affiliated corporations in their sample
covering 1996-2002.14
The largest, Sindicato Antiqueño, is said to be affiliated with around 100 listed and
non-listed firms, including many that were not in the reviewed sample.
56. The predominance of conglomerates across the larger economies in the region has important
implications for corporate governance and capital markets. These groups may have greater flexibility to
manage financing and investment needs among different members of the group than non-affiliated
companies. However, when such groups involve differentiated levels of ownership among the different
companies within the group (in other words, they are not 100%-owned subsidiaries), this may provide
opportunities for abusive related party transactions or other measures that shift funds from one company to
another in favour of the controlling owner’s more concentrated holdings. When some of the companies in
the group are listed and some non-listed, this may also limit the transparency of transactions between these
entities and correspondingly increase the risk of minority shareholder expropriation. due to the inability to
monitor such transactions.
57. The question also arises regarding the fiduciary duties of board members of companies within
the group, as to whether the controlling owner has appointed them to represent the interests of the group as
a whole or the company on whose board they serve. The question of conflicts of interest may also arise
when board members serving on multiple boards within the same group must consider transactions
involving two or more of the companies for which they are board members.
58. Regulators in the region have tended to try to address these issues by developing an informed
understanding of the group structures within their markets, to understand who are the beneficial owners of
different companies in order to verify whether they are correctly following disclosure and other regulatory
requirements related to the approval of related party transactions.
Institutional Investors
59. The 2011 Roundtable report, “Strengthening Latin American Corporate Governance: the Role of
Institutional Investors” noted the particularly important role played by privately managed pension funds in
most Latin American markets. [Figure 22: Assets managed by PFAs and mutual funds.] According to data
in the report, Brazil is the only country where total assets by mutual funds are substantially higher than
pension funds. In Argentina (where privately managed pension funds were transferred to state control in
2008), Chile and Peru, pension funds have much higher levels than mutual funds, while in Colombia and
Mexico the amount managed under pension funds is similar to that of mutual funds.
60. The Roundtable report on institutional investors did not include data on investments in equity of
insurance or private equity, finding that these types of funds were relatively small in Latin American
14
See Gutierrez, L., Pombo, C et al, (2005) “Ownership and Control in Colombian Corporations”
18
markets. Most recent data available from the Latin American Venture Capital Association suggests that
private equity and venture capital investments in the region are continuing to grow, with the amount
invested in 2012 deals rising by 21% to a total of USD 7.9 billion15
. The amounts of private equity and
venture capital appear to be increasingly significant but remain relatively small in comparison to the
USD 28.5 billion raised through IPO and secondary offerings in the six largest Latin American
economies in 2012, and more than USD 60 billion raised through corporate bond issuances during the
same period.
61. About half of the Brazilian listed companies analysed (which represent around 99% of BM&F
BOVESPA’s market capitalization at the end of each year) have an institutional investor acting as a
relevant shareholder (Institutional investors are characterized as relevant shareholders if they hold more
than 5% of the voting shares or own more than 10% of the total outstanding shares). The ratio of
companies with investment funds or private equity funds as a relevant shareholder has increased from
32.8% to 39.4% in four years, indicating a potentially increasing role for investment funds and private
equity on boards of directors and on the strategic decisions of these companies.
State ownership
62. The state plays an important role in the ownership of listed companies in several Latin American
countries. In Argentina, it was reported at the Roundtable’s Related Party Transactions Task Force
meeting in 2012 that the Argentine Social Security Administration (Administración Nacional de la
Seguridad Social – ANSES) held positions ranging from 0.14% to 40% in 44 of the 50 largest firms by
market capitalization. Prior to 2011, pension funds were prohibited from voting more than 5% of the
shares of a public company. This restriction was lifted by decree in 2011. ANSES’s legal department is
charged with overseeing the participation of the institution at AGMs and nominating directors where its
holdings are sufficient to elect them. ANSES-nominated directors are classified as independent.16
The
Argentinean government’s response to an OECD survey for the Latin American SOE Network meeting of
2012 reported that Argentina has state ownership of at least 10 percent in 17 listed companies.
63. The OECD’s report surveying seven Latin American countries found that listed companies with
state ownership (defined as companies with at least 10% state ownership) are relatively rare in the region
overall, but that the small number masks their greater overall impact on the capital markets, since often the
companies with state ownership are some of the largest in the market. For example, in Brazil SOEs
accounted for approximately 25% of total market capitalization on the BM&F BOVESPA exchange in
2012. Petrobras alone makes up 17% while three companies (Petrobras along with Banco do Brasil and
Electrobras) make up 21%.
64. In Colombia only three SOEs are listed. However, these three (Ecopetrol, ISAGEN and ISA, for
which the state averages 80% control) constituted 50.3% of the Colombia Stock Exchange market
capitalization at the end of 2012, and 70% of the total value of SOEs.17
Table 3. Ownership structure of SOEs in some of the largest Latin American Economies
Country SOEs Wholly owned Partially owned Listed
15
See http://lavca.org/2013/04/05/2013-industry-data-analysis/ .
16 See OECD (2012c), Latin American Corporate Governance Roundtable Task Force Report on Related Party
Transactions, Chapter 2 on Argentina.
17 OECD (2012d), Ownership Oversight and Board Practices for Latin American State-Owned Enterprises and OECD
(forthcoming), Corporate Governance of Colombian State-Owned Enterprises
19
Argentina 112 23 (21%) 89 (79%) 19 (17%)
Brazil 147 38 (26%) 109 (74%) 8 (5%)1
Chile 33 30 (91%) 3 (8%) 3 (8%)
Colombia 105 18 (17%) 87 (83%) 3 (3%)
Ecuador 24 21 (88%) 3 (12%) 0 (0%)
Mexico 110 NA NA 0 (0%)
Peru 31 23 (74%)2 8 (26%)2 9 (29%)2
Total 562 153 (34%)3 299 (66%)3 40 (7%)
Notes: Based upon OECD, Regional Trends: Ownership Oversight and Board Practices of Latin American State-Owned Enterprises (2012). Countries are ordered alphabetically. Countries in order of PPP-adjusted GDP in 2011: 1) Brazil; 2) Mexico; 3) Argentina; 4) Colombia; 5) Peru; 6) Chile; and 7) Ecuador. Survey data was not available from Venezuela that would normally rank 4 in PPP adjusted GDP.
1 Figure includes only federal SOEs. Individual Brazilian states also have 17 listed enterprises.
2 Peru figures only refer to SOEs overseen by FONAFE and do not include SOEs overseen by the Ministry of Finance, most of which are municipally-owned enterprises. Normally, listed companies are assumed to be partially owned. However, in the case of Electro Peru, Egesur and Sedapal, the SOEs are listed, but with 100% state ownership.
3 Percentage figures for wholly and partially owned SOEs do not include Mexico. The Brazilian government’s official definition of state-owned enterprises only includes enterprises with 50% or greater state ownership, and only considers ownership at the federal rather than state level.
65. An OECD review on the size and composition of listed enterprises with state ownership in both
OECD and partner countries finds that among OECD members, 26 out of 34 countries have listed
enterprises with state ownership. In most of these countries, the state generally holds a minority stake in
its listed companies. On the other hand, its review of listed SOEs in eight emerging economies (Brazil,
Colombia, China, India, Indonesia, Lithuania, the Russian Federation and South Africa), finds that the
dominant tendency among these countries was to maintain controlling ownership.
6. Market structure and trading practice influence on the incentives of different market actors
66. The OECD’s current initiative on Value Creation, Corporate Governance and Growth suggests
that there have been fundamental transformations in the structure of equity markets over the last decade,
with important implications for corporate governance. It concludes that trade practices have become more
sophisticated, markets have become fragmented and new, equity-based instruments have increased in
importance. This section (pars. 59-65, 69-73, 76-78) excerpts the findings of the OECD report, “Who
Cares: Corporate Governance in Current Equity Markets” (Isaksson and Celik, 2013), and seeks to
examine to what extent these trends can also be found in Latin American markets.
67. The OECD review found that even if data are limited to the “traditional” stock exchanges, trading
in equity has increased much faster than the supply of new equity capital through initial and secondary
public offerings. Particularly during the pre-crisis period, between 2004 and 2007, the increase in trade
volume was three times the increase in primary market volume.
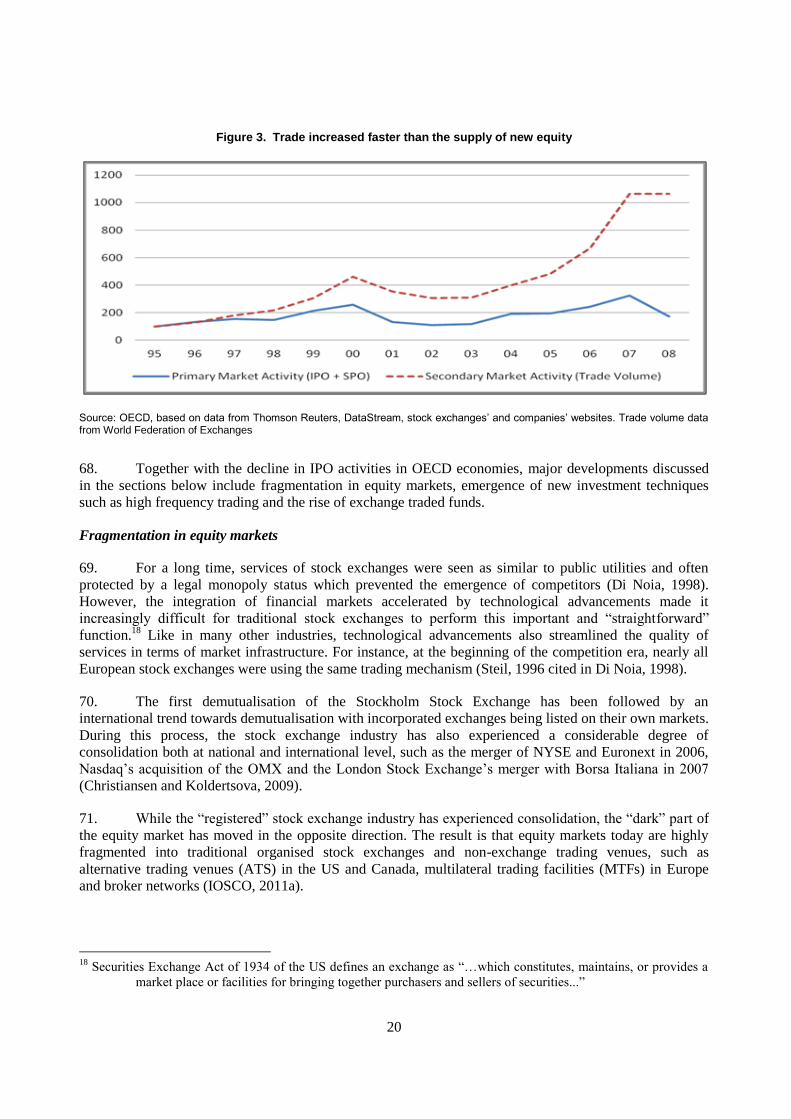
20
Figure 3. Trade increased faster than the supply of new equity
Source: OECD, based on data from Thomson Reuters, DataStream, stock exchanges’ and companies’ websites. Trade volume data from World Federation of Exchanges
68. Together with the decline in IPO activities in OECD economies, major developments discussed
in the sections below include fragmentation in equity markets, emergence of new investment techniques
such as high frequency trading and the rise of exchange traded funds.
Fragmentation in equity markets
69. For a long time, services of stock exchanges were seen as similar to public utilities and often
protected by a legal monopoly status which prevented the emergence of competitors (Di Noia, 1998).
However, the integration of financial markets accelerated by technological advancements made it
increasingly difficult for traditional stock exchanges to perform this important and “straightforward”
function.18
Like in many other industries, technological advancements also streamlined the quality of
services in terms of market infrastructure. For instance, at the beginning of the competition era, nearly all
European stock exchanges were using the same trading mechanism (Steil, 1996 cited in Di Noia, 1998).
70. The first demutualisation of the Stockholm Stock Exchange has been followed by an
international trend towards demutualisation with incorporated exchanges being listed on their own markets.
During this process, the stock exchange industry has also experienced a considerable degree of
consolidation both at national and international level, such as the merger of NYSE and Euronext in 2006,
Nasdaq’s acquisition of the OMX and the London Stock Exchange’s merger with Borsa Italiana in 2007
(Christiansen and Koldertsova, 2009).
71. While the “registered” stock exchange industry has experienced consolidation, the “dark” part of
the equity market has moved in the opposite direction. The result is that equity markets today are highly
fragmented into traditional organised stock exchanges and non-exchange trading venues, such as
alternative trading venues (ATS) in the US and Canada, multilateral trading facilities (MTFs) in Europe
and broker networks (IOSCO, 2011a).
18
Securities Exchange Act of 1934 of the US defines an exchange as “…which constitutes, maintains, or provides a
market place or facilities for bringing together purchasers and sellers of securities...”
21
Table 4. Estimated share of trade volume in the US (%, September 2009)
Registered Exchanges 63.8
Electronic Communication Networks 10.8
Total Displayed Trading 74.6
Dark Pools (32) 7.9
Broker-Dealer Internalisation (>200) 17.5
Total Undisplayed Trading 25.4 Source: The US SEC, Concept Release on Equity Market Structure, 2010.
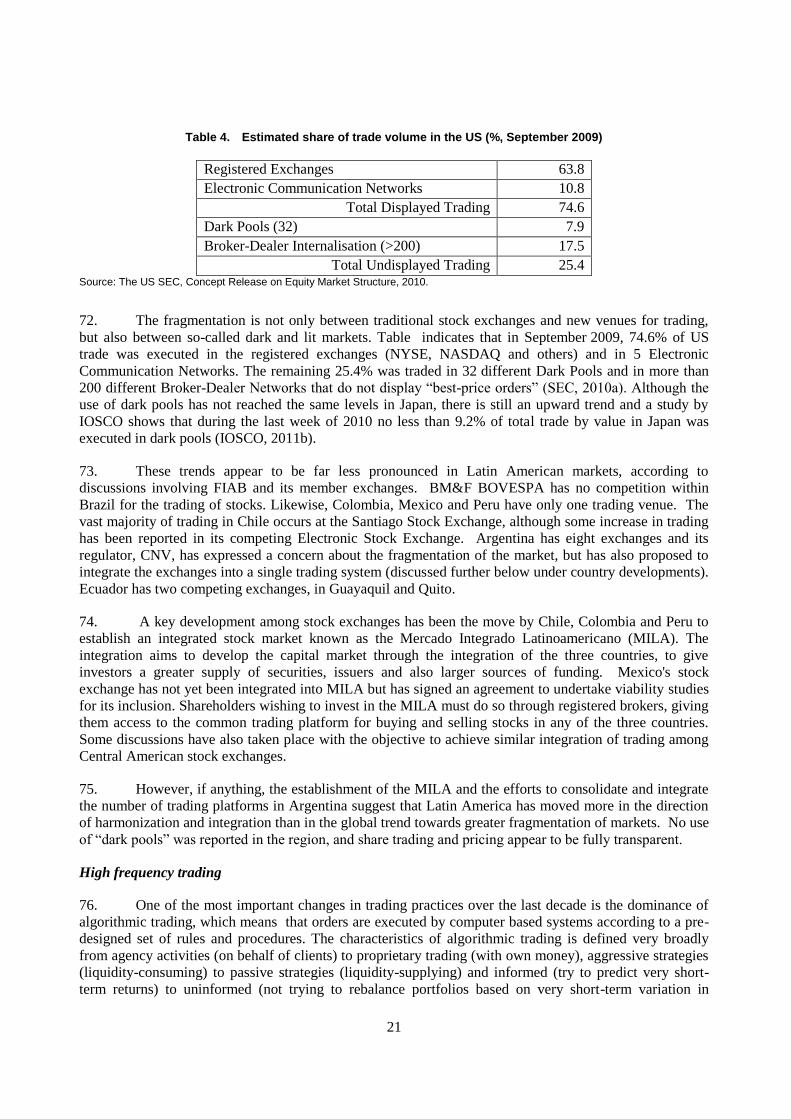
72. The fragmentation is not only between traditional stock exchanges and new venues for trading,
but also between so-called dark and lit markets. Table indicates that in September 2009, 74.6% of US
trade was executed in the registered exchanges (NYSE, NASDAQ and others) and in 5 Electronic
Communication Networks. The remaining 25.4% was traded in 32 different Dark Pools and in more than
200 different Broker-Dealer Networks that do not display “best-price orders” (SEC, 2010a). Although the
use of dark pools has not reached the same levels in Japan, there is still an upward trend and a study by
IOSCO shows that during the last week of 2010 no less than 9.2% of total trade by value in Japan was
executed in dark pools (IOSCO, 2011b).
73. These trends appear to be far less pronounced in Latin American markets, according to
discussions involving FIAB and its member exchanges. BM&F BOVESPA has no competition within
Brazil for the trading of stocks. Likewise, Colombia, Mexico and Peru have only one trading venue. The
vast majority of trading in Chile occurs at the Santiago Stock Exchange, although some increase in trading
has been reported in its competing Electronic Stock Exchange. Argentina has eight exchanges and its
regulator, CNV, has expressed a concern about the fragmentation of the market, but has also proposed to
integrate the exchanges into a single trading system (discussed further below under country developments).
Ecuador has two competing exchanges, in Guayaquil and Quito.
74. A key development among stock exchanges has been the move by Chile, Colombia and Peru to
establish an integrated stock market known as the Mercado Integrado Latinoamericano (MILA). The
integration aims to develop the capital market through the integration of the three countries, to give
investors a greater supply of securities, issuers and also larger sources of funding. Mexico's stock
exchange has not yet been integrated into MILA but has signed an agreement to undertake viability studies
for its inclusion. Shareholders wishing to invest in the MILA must do so through registered brokers, giving
them access to the common trading platform for buying and selling stocks in any of the three countries.
Some discussions have also taken place with the objective to achieve similar integration of trading among
Central American stock exchanges.
75. However, if anything, the establishment of the MILA and the efforts to consolidate and integrate
the number of trading platforms in Argentina suggest that Latin America has moved more in the direction
of harmonization and integration than in the global trend towards greater fragmentation of markets. No use
of “dark pools” was reported in the region, and share trading and pricing appear to be fully transparent.
High frequency trading
76. One of the most important changes in trading practices over the last decade is the dominance of
algorithmic trading, which means that orders are executed by computer based systems according to a pre-
designed set of rules and procedures. The characteristics of algorithmic trading is defined very broadly
from agency activities (on behalf of clients) to proprietary trading (with own money), aggressive strategies
(liquidity-consuming) to passive strategies (liquidity-supplying) and informed (try to predict very short-
term returns) to uninformed (not trying to rebalance portfolios based on very short-term variation in
22
returns) traders (Friederich and Payne, 2011). However, the current public discussion focuses primarily on
one particular type of algorithmic trading, namely so-called high frequency trading (HFT), which also
represents the largest and increasing share in trade volumes in some OECD markets.
77. Although there is no commonly accepted definition, the main features of HFT can be identified
as proprietary trading, using extraordinarily high-speed computers with sophisticated software, applying
co-location services and the use of individual data feeds that are offered for a fee by stock exchanges. High
frequency trading is also characterised by very short time frames for transactions, cancelation of orders
shortly after the submission and ending the trading day with a maximum flat position (SEC, 2010a). In
2009, HFT accounted for nearly 60% of the total trading volume in US equity market (Lash and Spicer,
2009). In Europe it represented some 38% of total trade volume in 2010 with an upward trend (IOSCO,
2011a).
78. From a corporate governance perspective it is important to note that HFT is more than a
technological advancement allowing high-speed computer trading. It can also be seen as an investment
strategy with a very short-terms focus. The ambition is not to assess and trade on genuine information
concerning the long-term performance of any individual company. Rather, the strategy is heavily based on
short-term arbitrage opportunities that are often obtained by unique and fast access to trading
information.19
79. Technological advancements that make it possible to develop and adopt sophisticated and fast
computerised trading practices were the critical factor behind the rise of the HFT. Nevertheless, changes in
the regulatory framework, trading rules and practices have also contributed to this rapid transformation.
This includes regulatory reforms, such as NMS in the United States, MiFID in Europe and Marketplace
Rules in Canada, that aimed at promoting competition in trading services (IOSCO, 2011a), decreasing the
tick sizes20
that makes it easier for investors to engage in speculative activity (Grant Thornton, 2010) and
the possibility of co-locating the computer servers of trading firms within the stock exchanges to gain
faster access.
80. The OECD’s report on current equity markets notes the concerns that are being raised by
regulators and other market observers regarding the influence of high-frequency trading on equity markets,
including their ability to efficiently allocate equity capital, as well as on corporate governance. Existing
models of corporate governance call upon shareholders to actively monitor the companies in which they
invest, and to positively influence their corporate governance practices. The model depends on having at
least some active investors – both controlling and minority shareholders -- to take a long-term interest in
the company. As high-frequency trading grows, there is a fear that price discovery will be increasingly
dominated by consideration of market trading data alone, rather than of underlying research and analysis
on corporate fundamentals and corporate governance practices which may impact on such fundamentals. In
addition, concerns have been raised that high frequency traders pay less attention to small and growing
firms and that they instead focus their trading on the liquid shares of large corporations. This in turn can
impact on the willingness of new companies to enter public equity markets.
81. However, high-frequency trading reportedly has not yet reached a volume in Latin American
markets to have raised a concern among exchanges and regulators in the region. To the contrary, the New
York Times reported that in Brazil – as well as in other Latin American economies like Chile and Mexico -
19
Beside general characteristics, HFT covers a wide number of financial strategies with different market impacts;
such as market making strategies, arbitrage strategies and directional strategies (IOSCO, 2011a)
20 The smallest increment for a stock price movement.
23
- “exchanges are actively courting high-speed traders without much resistance from their regulators.”21
The article reported that high-frequency-trading represented about 10.6% of all trades this year in Brazil,
up from 8.5% in 2012, but still only a fraction of levels found in the US, where it represents a majority of
the trading, and in Europe, with about 45% of the trading, according to Celent, a research and consulting
firm. Stock exchanges have seen such trading as a means to increase the volume of trade and market
liquidity, also raising revenues through increased transactions. BM&F Bovespa established a data center in
2009 that allowed firms to co-locate within a few feet of the exchange’s server, cutting down delays
associated with data travelling through fiber optic cables. Cicero Augusto Vieira Neto, BM&F Bovespa’s
chief operations officer, suggested in the article that the fact that Brazil has a single trading environment
(as opposed to the multiple exchanges and dark pools in US and European markets), meant that
computerized trading firms had fewer opportunities for arbitrage, which should keep HFT volumes lower
in Brazil.
82. While the predominant perception appears to be that Latin American markets have not reached a
stage where trading volume is high enough to be significantly influenced by the HFT trends affecting more
developed markets, it will be important to monitor data on such trading and average holding periods to
understand how incentives may be evolving for shareholders to consider the long-term interests of Latin
American companies.
Exchange traded funds
83. The rise of intermediary ownership has for a long time been coupled with the rise of passive
investment strategies that are based on a closely pre-defined set of criteria. The most obvious example is
various forms of index tracking, which has become an important “strategy” for a broad spectrum of
investors (Rey and Seiler, 2001). Already in the beginning of the 1990s many pension funds allocated
more than half of their investments in equities to indexes. Two important factors driving this development
were first of all that passive investment strategies (indexing) helped investors to dispose of heavy
brokerage commissions and advisory fees, and secondly that active institutional investors were
unsuccessful in beating the market averages over time (Lowenstein, 1991).
84. In the mid-1990s, the use of indexing was taken to yet another level by the development of
exchange traded funds (ETFs). Since then, ETFs have emerged as alternative investment vehicles for both
passive and active investment strategies. ETFs share the common characteristics of mutual funds but are
also tradable like shares on exchanges (Ramaswamy, 2011). As a result, investing in ETFs makes it
possible to both decrease the transaction costs and diversify the portfolio for passive investors, and at the
same time follow an active strategy for holding and trading different ETFs. As seen from Figure 4, the total
market value of assets under ETFs has grown dramatically during the last decade and after a slight
decrease in 2008 during the global financial crisis, it reached USD 1,351 billion in 2011.
85. Similar concerns have been raised about the growth in trading of indexed funds, as it reduces the
incentives for shareholders of such funds to intervene in individual companies, since they represent only a
small fraction of the overall investment. As ETFs are also generally created for the most actively traded
companies in the market, they may also exacerbate the liquidity problem for smaller and less actively
traded companies.
21
Dan Horch and Nathaniel Popper, “As others hesitate, Brazil welcomes high-speed trading,” New York Times, 24
May, 2013.
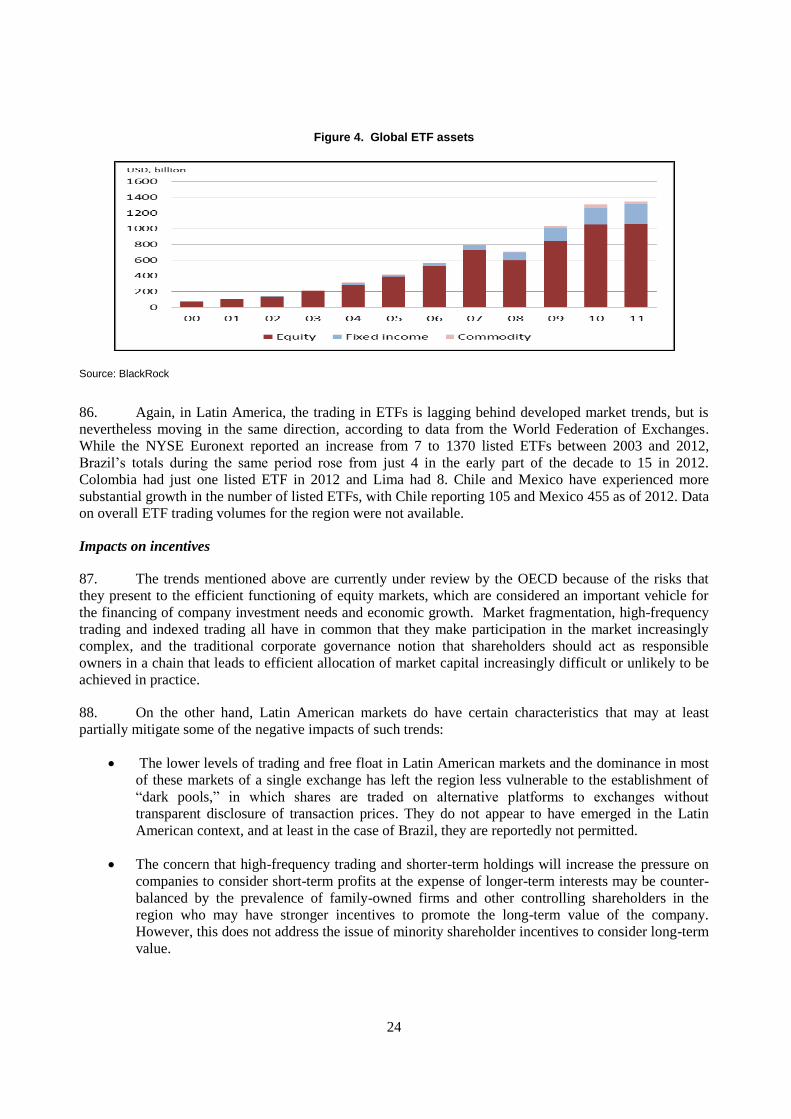
24
Figure 4. Global ETF assets
Source: BlackRock
86. Again, in Latin America, the trading in ETFs is lagging behind developed market trends, but is
nevertheless moving in the same direction, according to data from the World Federation of Exchanges.
While the NYSE Euronext reported an increase from 7 to 1370 listed ETFs between 2003 and 2012,
Brazil’s totals during the same period rose from just 4 in the early part of the decade to 15 in 2012.
Colombia had just one listed ETF in 2012 and Lima had 8. Chile and Mexico have experienced more
substantial growth in the number of listed ETFs, with Chile reporting 105 and Mexico 455 as of 2012. Data
on overall ETF trading volumes for the region were not available.
Impacts on incentives
87. The trends mentioned above are currently under review by the OECD because of the risks that
they present to the efficient functioning of equity markets, which are considered an important vehicle for
the financing of company investment needs and economic growth. Market fragmentation, high-frequency
trading and indexed trading all have in common that they make participation in the market increasingly
complex, and the traditional corporate governance notion that shareholders should act as responsible
owners in a chain that leads to efficient allocation of market capital increasingly difficult or unlikely to be
achieved in practice.
88. On the other hand, Latin American markets do have certain characteristics that may at least
partially mitigate some of the negative impacts of such trends:
The lower levels of trading and free float in Latin American markets and the dominance in most
of these markets of a single exchange has left the region less vulnerable to the establishment of
“dark pools,” in which shares are traded on alternative platforms to exchanges without
transparent disclosure of transaction prices. They do not appear to have emerged in the Latin
American context, and at least in the case of Brazil, they are reportedly not permitted.
The concern that high-frequency trading and shorter-term holdings will increase the pressure on
companies to consider short-term profits at the expense of longer-term interests may be counter-
balanced by the prevalence of family-owned firms and other controlling shareholders in the
region who may have stronger incentives to promote the long-term value of the company.
However, this does not address the issue of minority shareholder incentives to consider long-term
value.
25
Pension funds, private equity investors and other institutional investors who continue to see value
in good corporate governance may have a stronger relative influence in the less liquid markets of
Latin America than their counterparts in more developed countries. While the actual record of
institutional investor influence on corporate governance in Latin America remains a mixed one,
there has nevertheless been some positive experience to report, discussed in the next section of
this report.
89. Despite these mitigating factors in the Latin American context, there remains reason for concern
regarding the growth of indexed trading (ETFs) and high-frequency trading in the region. While their use
remains well below the levels of OECD’s most developed markets, they nevertheless appear to have also
taken root in some Latin American markets, and present similar risks of further concentrating trading in the
markets’ most liquid shares, and further weakening the incentives of shareholders, including institutional
investors, to intervene at the individual company level.
7. Overall market and corporate governance trends in Latin America
90. As the data and developments described in this report indicate, Latin American equity market
experience has been both positive and at the same time fallen short of its potential. Companies listed on
Latin American markets have seen strong growth in revenues, share values, stock returns and market
capitalization. And while Latin American market capitalization as a percentage of GDP is still lagging
behind OECD averages (except in Chile), its markets have grown at a much faster rate than in the world’s
more developed economies.
91. A number of possible factors cited earlier in this report with reference to the Latin American (and
particularly Brazilian) IPO boom of 2004 to 2007 may also be relevant to the more long-term positive
growth in the market, such as macroeconomic stability in the region, rising commodity prices, a high level
of global liquidity during much of this period, improved legal and regulatory protections for investors, and
improved corporate governance practices among many Latin American companies.
92. On the other hand, the access to equity finance that the markets provide has not been shared
widely. As previously noted, Latin American listed companies tend to be larger on average than those
listed in the US. Liquidity as reflected in trading volumes has remained quite low, creating higher risks of
share price volatility, particularly among smaller companies on the market with low levels of free float.
Within this environment, the number of listed companies as a percentage of the population has been
declining across the region and remains far below OECD member country averages.
93. In Roundtable discussions, many barriers were cited as constraining the growth of domestic
capital markets:
1) Foreign exchange controls were cited as a major barrier in Argentina to foreign investment in the
stock market, distorting the costs of financing.
2) It was suggested that many companies are reluctant to list, especially in smaller markets, due to
concerns that increased disclosure will have negative impacts on tax liabilities or other
government intervention in business operations.
3) Companies may also be concerned that disclosure requirements could put them at a competitive
disadvantage vis a vis their non-listed (and in some cases multi-national) competitors.
26
4) Family founders may also have concerns about loss of control of the company, and may decide
that the costs of complying with regulatory and disclosure requirements are higher than the
benefit they may receive from cheaper access to capital obtained on the market.
5) There are also challenges on the demand side in attracting investors for smaller companies, and in
the absence of liquidity, about the potential volatility of share prices.
94. Despite the challenges presented by low liquidity and a relatively small number of listed
companies as a percentage of the population, the overall growth trends have been positive in most Latin
American countries. There is no doubt that this growth is in part a result of the broader regional economic
trends and growth of emerging markets as a whole. But to the extent that capital market growth has helped
to play a role in the broader economic growth of the region, the fundamental question for the Latin
American Roundtable is to what extent corporate governance improvements in the region may have
influenced these trends, or have the potential through further actions to do so? It would be overly
ambitious and realistically not possible to quantify the impacts of different actions in different countries
and the impacts that these have had on the markets, but nevertheless it can be useful to briefly review the
record and experience, country by country, before reaching overall conclusions and issues for the
Roundtable’s further consideration.
95. The summaries provided below should not be seen as systematic or comprehensive, as some
countries have been more active than others in reporting to the OECD Secretariat on recent corporate
governance developments. This summary takes into account information obtained in previous Roundtable
reports on corporate governance progress, the role of institutional investors, board nomination and
effectiveness, use of corporate governance codes in the region, and on frameworks for review of related
party transactions. Additional information was obtained through e-mail communications, web site research
and press reports.
Argentina
96. Among the six largest equity markets in Latin America, Argentina has been the outlier,
experiencing the sharpest decline in market capitalization levels (Figure 5) over the last decade, and lowest
levels of trading volumes in the region (Figures 10 and 11).
97. Previous Roundtable discussions and reviews of Argentinean corporate governance have found
the legal framework to be generally consistent with international standards, but have pointed to varying
factors influencing the capital market environment in Argentina over time. Argentina enacted
comprehensive capital market reform regulation through Decree 677/01 in 2001. This featured many of the
corporate governance-related requirements considered consistent with international good practice, such as
extension of advance notice requirements for annual general shareholder meetings, provisions to allow
minority shareholders with at least 2% ownership to initiate items on the agenda, processes for proxy
solicitation, requirements for disclosure and approval of related party transactions, etc. A subsequent
regulation in 2004 required the establishment of audit committees with a majority of independent directors.
However, Roundtable participants have noted a lack of a corporate governance market culture in
Argentina. With Argentina’s economy suffering during the early part of the decade from financial crisis,
many in the Argentinean business community were critical of the requirements, suggesting that the applied
international standards were not adapted effectively to their market conditions. Companies considered that
there was little market incentive to adapt good corporate governance practices because shareholders were
not active in rewarding better practices with higher market prices.
98. Interestingly, in more recent years, the business community has become somewhat more vocal in
advocating better corporate governance practices. This has come in an environment in which they have
27
raised concerns about the role of the state in the market following the 2008 nationalization of private
pension funds, now publicly owned by the National Social Security Administration (Administración
Nacional de la Seguridad Social – ANSES), with voting rights exercised by the Ministry of Economy to
appoint directors to the boards of a number of listed companies. To be sure, state use of its ownership
stakes to appoint board members is consistent with good corporate governance practices, but in a context in
which the state plays a strong role in the economy as a whole, it is important to also ensure that its
ownership stake is not used to disproportionately influence the business of the company. The
nationalization of Argentina’s private pension funds, coupled with the well-publicized expropriation by the
government of 51% of the shares of YPF owned by Repsol, has appeared to have an impact both on
companies’ willingness to list in the market as well as on foreign investor perception of the risks of
investing in Argentinean equity markets.
99. It is also clear, however, that the Argentinean government has been actively considering ways to
strengthen its capital markets, including through the enactment of a new Capital Market Law in December
2012. Its announced objectives are to:
Promote a cultural change in savings and investment;
Strengthen retail investor protection; and
Promote federal and inclusive capital markets.
100. According to CNV, its provisions imply a structural redesign of the capital market, including:
No more self-regulation. The self-regulated organizations are now directly regulated by
Argentina’s securities regulator, CNV;
Encouragement of market demutualization;
Expansion of the CNV´s powers of regulation and supervision to all the players involved in the
capital market;
Adoption of a generic concept of "Registered Agents"22
.
Lower dependence on current credit rating agencies..
Protection of minority investors. The new law imposes mandatory rules on public tender offer
and the duty to report the dividend policy and the remuneration of members of the board of
directors and the compensation policy for company managers.
Exchange of information between agencies that regulate the financial system: the CNV, the
Central Bank of Argentina, the Argentine Insurance Authority and the Financial Intelligence
Unit in order to perform their research duties, preserving the confidentiality of the information.
The police power of the CNV has been strengthened. The CNV may declare, without any
preliminary investigation, that any acts submitted to its inspection are irregular and without
effect for administrative purposes whenever they are in conflict with the Law 26,831 or any
regulations issued by the CNV, giving the CNV the power to request the assistance of the
police force.
22
"Registered Agents" includes “Natural persons and/or legal entities authorized by the CNV to be registered in
the applicable registers created by the CNV for purposes of performing trading, underwriting, distribution,
brokering, settlement and clearing, custody and collective deposit of securities, management and custody of
collective investment products, risk rating and any other activities that, at the discretion of the CNV, must be
registered for purposes of developing the capital market” (Section 2 of Law 26,831).
28
With the enactment of Law 26,831 there is an intention to incorporate new players
(professional associations, unions, SMEs, small savers) through dissemination programs,
financial education, distribution channels (dealers) and trading platforms.
101. As mentioned earlier in the report, the CNV has also proposed to develop a single, integrated
trading system to promote interconnection and consolidation of Argentina’s eight exchanges into a single
market, to be managed by an entity formed by one, several or all entities in the market. CNV’s intent is to
promote both the “demand side,” through financial education programmes aimed at both retail and
institutional investors, and also work to promote greater awareness of the capital markets as a source of
finance for SMEs.
102. In addition to the elements of the law cited above, the part of the law that has attracted the most
controversy is a provision that gives CNV the right, without possibility of appeal through the courts, to
respond to complaints about minority shareholder protection or conduct its own investigations into
ensuring minority shareholder protection. If CNV finds that rights are being abused, it has the right to
replace a member or members of the board with its own appointees for up to 180 days, or to send a staff
member to monitor the company’s board meetings and intervene if it considers this necessary. CNV may
also appoint an auditor with veto power over certain decisions of the board. CNV issued 700 pages of
implementing regulations for the law in September 2013, and some in the business community reacted
with particular concern to these provisions. CNV representatives have suggested that such interventions
would only occur based on specific and objective criteria, and that sometimes such enforcement powers are
necessary to be able to act on a timely basis. Clarin, the media company which has a long-running dispute
with the government, has filed a legal appeal and the court has issued a temporary injunction to block
enforcement of this provision as unconstitutional. How these provisions are dealt with in the future could
have an important impact both on companies’ willingness to list as well as on how shareholder rights are
enforced.
Brazil
103. Brazil’s experience of initiating the Novo Mercado, Level 1 and Level 2 corporate governance
listing segments during the last decade has generally been recognized internationally as a text-book case of
how attention to corporate governance, combined with the right economic conditions, can lead to equity
market and economic growth23
. The corporate governance tiers provided the structure under which Brazil
experienced a boom in IPOs and listings between 2003-2007, with the market welcoming the higher levels
of disclosure, requirements for independent directors, dispute resolution mechanisms and other minority
shareholder protections available to shareholders investing in companies on these listing tiers.
104. It is important to note that Brazil has also undertaken a number of regulatory improvements in
recent years applying to all listed companies. The Brazilian Securities Commission CVM has strengthened
disclosure requirements through Instruction 480 requiring annual reporting on a Reference Form, including
substantial new requirements on related party transactions and compensation practices. Brazil also adopted
International Financial Reporting Standards in 2008, and issuedregulations to strengthen access to and
participation in annual shareholder meetings, including through mechanisms to allow for electronic voting.
In addition, CVM’s issuance of Guideline 35 in 2008, recommending safeguards to ensure against abuse of
related party transactions during mergers and acquisitions, has been seen as an important influence in
ensuring the fair treatment of minority shareholders in such transactions.
23
See, for example, Santana, M. et al, (2007) “Novo Mercado and its followers: Case Studies in Corporate
Governance Reform” Global Corporate Governance Forum Focus 5.
29
105. Most recently, a voluntary initiative was announced in 2012, the Committee on Mergers and
Acquisitions (CAF), also known as the Brazilian Takeover Panel, to provide an additional, voluntary
mechanism that companies can commit to follow to help to ensure fair treatment of shareholders during
mergers and acquisitions.
106. Earlier sections of this report have already highlighted the strong growth both in market
capitalization as well as trading volume during this period, as well as the downward trend in ADRs as
domestic companies have increasingly relied on local markets for their equity capital needs rather than
cross-listing abroad. Data also show growing diversity in company structures, including a small but
growing number of companies with dispersed ownership. The regulatory and voluntary initiatives related
to takeovers are also a reflection of the active market for corporate control in Brazilian markets.
107. However, the report also notes the more recent slow-down in equity markets following the global
financial crisis and recent, weaker macroeconomic conditions. In fact, Chile, Colombia and Mexico all
reported higher numbers of IPOs in 2012 than Brazil’s three reported IPOs, down from 11 in 2010 and
2011. Some recent press coverage has raised the question of whether Brazil risks losing its place as the
most dynamic equity market in the region.24
Concerns have revolved around market scandals and lack of
rigor in terms of corporate governance practices among some recently listed companies, including some
listed on the Novo Mercado and Level 1 listing segments, as well as around the role played by the state in
the capital markets.
108. One issue raised at the Roundtable was the role played by the Brazilian national development
bank (BNDES) in providing long-term credit to companies, providing loans at subsidised interest rates that
may make capital market financing relatively less appealing in some cases. The OECD’s 2013 Economic
Survey of Brazil found that most of BNDES lending goes to large and very large companies that may be
able to access such finance through other sources, and specifically recommended that BNDES orient more
of its financing towards infrastructure, innovation and small and medium-sized companies that have less
access to private credit markets. Concerns about the state’s role have also been visible in the government’s
intervention in 2012 with electricity companies, asking them to renegotiate contracts with the state to set
electricity rates at lower levels.
109. The case of the Petrobras election of its board of directors in 2012 also raised concerns, when the
pension funds of state enterprises joined state development banks (BNDES and BNDESpar) in voting as
minority shareholders and used this status to elect to the Board members that other minority shareholders
did not consider to be independent of the state’s controlling interest. This development led to much
discussion within the market, a review of the case by CVM, as well as a CVM staff letter reflecting on past
cases relevant to the Petrobras case. Following these developments, the more recent Petrobras election of
May, 2013 reflected the understanding that these state-linked shareholders should not vote as minority
shareholders, resulting in the election of a board member considered to be fully independent of the state’s
interest. The resolution of the case may be seen as a positive illustration of the active role of minority
shareholders in Brazil and their ability to influence corporate governance through market pressures.
.
24
See, for example, Bruna Maia, “Bye, bye, Brasil: Markets in neighbouring countries are becoming more attractive
to foreigners,” in Capital Aberto International Edition, May 2013
(http://www.capitalaberto.com/english/ler_artigo.php?pag=2&sec=71&i=3495 )
30
Chile
110. As noted earlier in this report, Chile has consistently led the region in terms of market
capitalization as a percentage of GDP, with its levels now exceeding those of the OECD average, and with
by far the highest number of listed companies in the region as a percentage of the population. Yet, its
overall market size remains small, with trade volumes and turnover ratios lagging behind those of Brazil.
111. Chile’s capital market reforms of 2000, instituting new requirements for takeovers and
establishing Directors Committees with responsibilities similar to audit committees, were an important
landmark in strengthening Chile’s corporate governance framework. Its legal and regulatory framework
was reviewed as part of Chile’s accession process prior to joining the OECD in 2010, and found to be
largely consistent with the recommendations of the OECD Principles of Corporate Governance. In
particular, the OECD welcomed capital market reform legislation enacted in 2009, which further refined
the roles played by independent directors serving as the Chair of the Board’s 3-person Directors’
Committee, which is responsible for reviewing and making recommendations to the full board on a range
of sensitive issues such as on related party transactions, hiring of external auditors, and director and
executive remuneration. The success of this model hinges on the ability of minority shareholders to elect
independent board members, led by Chile’s private pension funds which historically play an active role in
defending minority shareholder rights. In most cases they are able to make use of cumulative voting
mechanisms to elect at least one board member, while in cases where they are able to elect two or more,
independent board members will comprise a majority of the Directors’ Committee.
112. The OECD in its accession review recommended further improvements to disclosure (including
the need for requirements to disclose shareholder agreements), as well as to nomination and dismissal
processes for the heads of Chile’s regulatory institutions to ensure their political independence. It also
highlighted the particular dominance of conglomerates in the Chilean market and the need to give ongoing
attention to the issue of monitoring and oversight of corporate groups.
113. In subsequent reviews of Chile’s progress against these recommendations in 2012, Chile’s
representatives have noted their development of legislation that would create a new structure for oversight
of SVS aimed at strengthening the political independence of the regulator, but this legislation has not yet
been enacted.
114. SVS has also moved to improve disclosure through a regulation issued in May 2013, aimed at
enhancing the quality of the information to be provided to the market in several areas. These include
disclosure in relation to management (organizational structure, economic interests of executive officers and
directors remuneration and allowances other than usual, as ownership of equity or compensation plans) and
ownership and control (way of exercising control, scheme of direct and indirect property relations). This
new regulation is intended to provide investors with additional information on the nature of the
relationships among the companies, their related parties and the conglomerates to which they belong.
115. An additional significant development in Chile has been a related party transactions case
involving Chile’s largest private power producer, Enersis, in which Enersis’ controlling owner, Spanish-
based Endesa, instigated a proposed USD 8 billion capital increase in July 2012. Chilean pension funds
strenuously objected to the terms of the deal, and following the issuance of an SVS statement on
interpretation of requirements for related party transactions suggesting that the capital increase would
require the approval of board members that are not linked to the controlling shareholder, the proposed
capital increase was withdrawn, pending further consideration of the board.25
25
See OECD (2012) “Latin American Corporate Governance Roundtable Task Force Report on Related Party
Transactions.”
31
116. The experience with Enersis in Chile is an illustration of the critical role of not only having the
legal framework and protections in place, but having some prominent cases in which those rights are
exercised to send a signal to the market that they must be complied with. Nevertheless, there appears to be
a growing advocacy in Chile, at least within the business community, of the need to foster voluntary and
self-regulatory initiatives to complement the Chilean legal framework. Chile is the only country in the
region that does not have a voluntary corporate governance code that is actively used or recognized by the
market.
Colombia
117. As reported above, Colombia has led the region over the last decade in its market capitalization
growth, from an 18% average share of GDP from 2001-2005 to 60% as of 2011, rising to second place in
the region behind Chile. Colombia also reported the largest average company size and highest market
concentration, indicating that its growth has been driven by its largest companies, including both state- and
privately-owned conglomerates. Its liquidity levels, however, continue to lag behind those of Brazil, Chile
and Mexico in terms of trading volume as percent of GDP and turnover ratios.
118. Investment and economic growth in Colombia is likely to be a reflection of a wider set of trends,
including the greater stability of the country in recent years following decades of internal conflict. But
Colombia has also actively pursued corporate governance improvements during this period which have
positioned it to allow for its listed companies to make use of domestic capital markets as one factor in its
overall growth.
119. Significant developments in the Colombian corporate governance framework have included the
enactment of a Securities Market Law in 2005 that required boards to have at least 25% of their members
to be independent; to establish audit committees that include an independent member as chair; a
requirement to separate the board chairman from the position of CEO; and a requirement that shareholder
agreements be disclosed in order to have effect. Subsequent to that, a major development in the market was
the establishment of a voluntary corporate governance code in 2007 with 41 recommended practices,
requiring companies to report on whether they comply, but not requiring an explanation in case of non-
compliance. This requirement was changed in 2012 to now require companies to also provide explanations
in the case of non-compliance.
120. Colombia has also enacted a number of requirements in 2007 in relation to pension funds,
requiring them to take into account corporate governance of the companies they invest in, and to disclose
the importance that they place on corporate governance in their investment decision process. Following the
creation of a multiple fund scheme in 2010 that authorized Pension Fund Administrators (AFPs) to
establish varying levels of risk for different funds, Superfinanciera issued a more detailed decree setting
out elements to be addressed in evaluations of issuers’ corporate governance. AFPs have to evaluate
aspects like: the clear allocation of roles among governance bodies; disclosure needs to be transparent and
should include financial documents and address risk-taking; and full disclosure needs to be made regarding
related party transactions and methods of protecting minority shareholders rights, as well as methods for
preventing conflicts of interests between shareholders, administrators, and employees. Acting as minority
shareholders, the AFPs hold shares in 32 of 81 Colombian listed companies, and are able to elect board
members in approximately 14 listed companies.
121. Regulatory requirements for mutual funds also call for them to consider relevant corporate
government regulations, including corporate reports on compliance with the national corporate governance
code, within their investment policies.
32
122. A final and long-awaited development has been the implementation of International Financial
Reporting Standard requirements. Discussions about the implementation of IFRS have been under way in
Colombia for at least a decade, with implementation timetables repeatedly delayed. In July 2009, the
Colombian government enacted a law for the convergence of national standards with IFRS, which was
scheduled to begin in 2013 for some users. However, in December 2012, it was announced that the
Colombian government would defer mandatory IFRS application to 2015, in reaction to many submissions
received noting difficulties regarding its implementation. Application of the IFRS for SMEs will be
deferred to 2016.
123. More generally, Colombia has embarked on a comprehensive push to meet international
standards through the priority its government has given to becoming a member of the OECD. As follow-
up to the OECD’s decision in May 2013 to invite Colombia to begin the accession process to become an
OECD member, the OECD Corporate Governance Committee will assess Colombia’s willingness and
ability to implement the OECD Principles of Corporate Governance and Guidelines on Corporate
Governance of State-Owned Enterprises. The World Bank has also recently conducted a review of
Colombia against the OECD Principles, but the Colombian government has not agreed to release the report
publicly.
Mexico
124. Mexico, as the second largest market in the region, has experienced sharp increases in the last
few years in market index values, IPO activity, as well as in the price-to-earnings ratio of its companies
(17.6 at the end of 2012). As Mexico has not undertaken major corporate governance changes since the
enactment of its Securities Market Law reforms in 2005, it would be difficult to attribute the recent
improvements in market activity directly to corporate governance reforms (although Mexico stands out in
Latin America as one of the few countries lacking any state ownership in listed companies, an issue that is
currently attracting much attention from foreign investors in the region).
125. Nevertheless, the 2005 Securities Market Law Reforms established important improvements to
the legal framework related to board duties of loyalty and care, requirements for independent board
members and audit committees, and to disclosure requirements, including disclosure of shareholder
agreements and restrictions on their use. A distinctive aspect of the reform was to establish a new type of
company, “Sociedades Anónimas Promotoras de Inversion, or “SAPIs,” which are allowed relief from
regulatory requirements for a transitionary period in an attempt to attract more companies to list on the
market.
126. More recently, pension fund regulators have established new requirements aimed at promoting
their more active consideration of corporate governance by managers of Mexico’s growing mandatory
pension savings scheme (AFORES), including allowing them for the first time beginning in 2010 to invest
in individual companies rather than only in indexed funds. Still, Mexico has quite a large number of small
pension funds, meaning that both their capacities to engage in the market and the size of their individual
investments tend to be much smaller than in a number of other markets such as Colombia, Chile and Peru,
where pension funds are encouraged to play an active role in the markets.
127. The recent participation of the securities market and pension fund regulators in the Roundtable’s
work on institutional investors and CNBV’s participation in the Roundtable Task Force on Related Party
Transactions therefore has been a positive development. A number of representatives of the private sector
and corporate governance institutes such as the Center for Excellence in Corporate Governance have
maintained an active role in the Roundtable, providing information on the use of Mexico’s corporate
governance code (disclosed to and overseen by the Mexican Stock Exchange), corporate governance
indices, and the practices of boards of directors.
33
Peru
128. Peru’s relatively small market has stood out for its high level of stock returns (a 2,728% increase
in cumulative average stock returns since 1994!), as noted earlier in this report, but at the same time it is
plagued by higher market concentration and lower trade volumes than any of the six countries reviewed
except Argentina. Peru also had smaller numbers of IPOs (3 in the last decade) than the other five
countries reviewed here.
129. Pension funds have been active in the nomination of board members and in developing guidance
for board members elected by their votes. They have also developed guidelines for companies setting out
their expectations for dissemination of information, the annual general meeting, the annual report, ethics
codes, internal regulations and other matters.They have nevertheless noted the difficulty in establishing
differentiated investment strategies with so few local equities to invest in. Peru established an institutional
investor task force in 2011 to promote implementation of the Roundtable’s recommendations on this
subject and has also participated in the Roundtable’s Task Force on Related Party Transactions. The
planned update of Peru’s “Principles of Corporate Governance for Peruvian Corporations” was seen as a
potential opportunity to enhance the quality of disclosure of RPTs, among other improvements.
130. The Peruvian Principles are an important part of Peru’s corporate governance framework,
serving as the basis for comply or explain reporting to the regulator on corporate governance practices, and
for a rating programme overseen by the Lima Stock Exchange of listed company governance. The Stock
Exchange’s ratings are used to maintain a “corporate governance index” which groups together and
recognizes companies that have obtained high scores on their corporate governance practices. The
rationale behind the index is that these companies will obtain relatively higher share prices, incentivizing
other companies to follow suit. The issue of corporate governance indices and the experience of Peru,
Brazil and Mexico in this regard was further discussed at the Roundtable in a session featuring a World
Bank review of experience across eight markets with such indices.
Ecuador
131. Only limited data were available on developments in Ecuador, as previous Roundtable reports
have tended to focus on the six largest markets.
132. Ecuador faces the same challenges as other smaller markets in the region – how to attract
liquidity and listings with only a small number of listed companies (41), many of which do not actively
trade shares. The Quito Stock Exchange reported that most efforts to attract listings are focused on the
issuance of bonds, which are seen as an important step in companies’ development of higher standards.
A larger group of 232 companies may be considered to have listed on Ecuador exchanges when non-equity
listings in bonds or other fixed income instruments are included. Nearly half of these, 102, are SMEs,
defined as companies with between 55 and 95 employees, and gross sales between USD 1 million and
USD 5 million.
133. In addition, Ecuador has a second market for smaller companies with lower standards based on
self-regulation, known as “The Register of Unlisted Securities”, or REVNI. The 32 SMEs listed on this
segment are required to provide a certain amount of information to list, but with fewer requirements than
on the main market. Recent reforms extended the term length for fixed and variable income instruments to
36 months, up from a previous maximum of 180 days with ability to extend an additional 80 days.
134. The Quito Stock Exchange has undertaken major educational initiatives to promote corporate
governance improvements and listings on the Exchange, and has recently established a corporate
governance institute to further support such improvements. One targeted financial training program called
34
“mi PYME bursatil”or “my listed SME” has help SMEs to improve and formally implement standards.
Their experience has shown that issuers are voluntarily entering the market first through REVNI for a
period of acclimation. As of mid-2013, the training program had trained 1,600 people.
135. Relative to population size, Ecuador has done as well as most of the larger markets in terms of
the number of listed companies per million people (4). But with low liquidity and a lack of actively traded
shares to invest in, it remains difficult to attract new investment and new issuers to the market. Ecuador,
like Mexico, so far has chosen not to list state-owned enterprises on its market, but this remains one
possible avenue to spur a wider choice of listings on the market.
8. Conclusions
136. This review of equity market trends in the region finds that Latin American markets have
experienced substantial growth over the last decade, sharing in the wider global trend among emerging
markets to account for a growing share of global market capitalization and equity financing.
137. Nevertheless, the high levels of market concentration and declining overall number of listed
companies suggest that this success is not widely shared, and has been concentrated in the region’s largest
companies. Brazil for example, has approximately 66,000 medium and large-sized companies, but only
about 400 listed companies, or fewer than 1%, taking advantage of equity market financing to support their
growth. The important role played by large conglomerates – including financial, industrial or mixed
groups, often family-owned and in some cases with state ownership – combined with low liquidity,
particularly among smaller listed companies, raises distinctive challenges for the markets and for corporate
governance.
138. Latin American policy-makers and market institutions have responded to these challenges
through a number of actions aimed at enhancing the role of equity finance as a vehicle for corporate
finance and economic growth. These steps have included:
Consolidation of stock exchange trading through the MILA initiative integrating the trading
platforms of Chile, Colombia and Peru (with the possibility of Mexico also joining), as well as a
consolidation proposal under consideration in Argentina for its eight exchanges;
Adoption of regulations for pension funds and other institutional investors establishing corporate
governance requirements for their own oversight, including for disclosure and appropriate
management of conflicts of interest, and encouraging or mandating them to take corporate
governance into account in their equity investment decisions;
Initiatives to facilitate participation in shareholder meetings through electronic voting (in Brazil)
or through stream-lined proxy voting rules;
The enactment of director independence requirements, clarifications of directors’ duties and
establishment of audit committees (or Directors Committees) with at least one independent
director in most markets, complemented by active corporate governance institutes and institutes
of directors involved in training and corporate governance awareness programmes;
Widespread adoption of IFRS (except in Colombia, where implementation is in process) and
increasing attention in some markets to disclosure of related party transactions;
35
Active regulatory enforcement and issuance of guidelines and advisory opinions, particularly in
Brazil and Chile, to facilitate enforcement and to prevent or resolve disputes between
shareholders.
Self-regulatory initiatives such as the Novo Mercado in Brazil and comply or explain disclosure
of practices against national corporate governance codes in Argentina, Colombia, Mexico and
Peru.
Slower take-up of global trends involving high frequency trading, market fragmentation and
exchange traded funds which may, taken together, undermine individual shareholder incentives
to actively monitor corporate governance, and impede efficient allocation of capital within the
market.
139. Clearly, however, major challenges remain, as they do in all markets, in seeking to ensure that
shareholders, board members and management all play the roles that enable corporate governance to
function effectively in supporting strong company performance and efficient allocation of capital. Beyond
this overall challenge, the Roundtable has identified a number of more specific challenges including:
Achieving the balance between regulation aimed at ensuring minority shareholder protection and
investor confidence, while maintaining the necessary flexibility for companies to adopt practices
tailored to their specific circumstances, and minimizing the costs and compliance burdens that
may deter companies from making use of equity finance opportunities;
Ensuring effective and efficient enforcement of corporate governance rules through regulatory
institutions; and predictable and timely court processes;
Shifting the focus of board improvements from static analysis of board member composition to a
more dynamic focus on how it functions and how it can most effectively tackle the issues of
greatest importance to the company, such as strategy, risks and value creation.
Developing a corporate governance culture for both listed and non-listed firms that is based on
the value that good corporate governance can create for an enterprise, rather than simply adopting
formalistic structures and processes to meet third party requirements.
Addressing the corporate governance challenges associated with conglomerate structures,
particularly in relation to disclosure and review of related party transactions;
Considering the potential for listing of state-owned enterprises to spur equity market growth,
while at the same time ensuring that the state acts according to high corporate governance
standards in its role as owner, setting a positive example for other listed companies in the market;
Considering the state’s role as a direct source of investment in companies – whether through the
equity markets or through more direct corporate finance – and its implications for the viability
and attractiveness of equity market financing for corporate investment needs;
Considering the use of corporate bond markets as an intermediate vehicle to enhance corporate
governance and disclosure while providing family founders with the means to maintain full
company control, which may ultimately facilitate later consideration of listing.
Considering the establishment or promoting the use of SME listing segments with fewer
corporate governance requirements, as some markets in the region have already done, and

36
considering the impact of the tax code on incentives to list. Differing definitions of SMEs and
lack of good, comparable data may be hindering a full understanding of the necessary steps to
facilitate their access to finance in the region.
37
References
Aguilera, R et al (2011), Corporate Governance in Emerging Markets
Andrews, D. and Serres, A. (2012), “Intangible Assets, Resource Allocation and Growth: A Framework for
Analysis”, OECD Economics Department Working Papers, No. 989, OECD Publishing.
Bebzcuk, R. (2005), “Corporate Governance and Ownership: Measurement and Impact on Corporate
Performance and Dividend Policy in Argentina,” IDB Draft Paper.
BlackRock (2011), Can Investors Continue to Profit from Corporate Margins?, BlackRock Investment
Institute,
www2.blackrock.com/webcore/litService/search/getDocument.seam?venue=PUB_IND&source=GL
OBAL&contentId=1111144794.
BlackRock (2011), Are Emerging Markets the Next Developed Markets?, BlackRock Investment Institute
https://www2.blackrock.com/webcore/litService/search/getDocument.seam?venue=PUB_IND&sour
ce=GLOBAL&contentId=1111146576 .
Blundell-Wignall and Atkinson (2011), “Global SIFIs, Derivatives and Financial Stability”, OECD
Journal: Financial Market Trends, Volume 2011, Issue 1.
Brazil Working Group Report (2013), Equity Financing SMEs through Capital Market: Working Group
Report International Experience http://www.bmfbovespa.com.br/empresas/download/Diagnostico-
ingles.pdf.
Christiansen, H. and A. Kolderstsova (2009), “The Role of Stock Exchanges in Corporate Governance”,
OECD Journal: Financial Market Trends, Vol. 2009/1, doi: 10.1787/fmt-v2009-art10-en.
Claessens, S. and Yurtoglu B. (2012), “Corporate Governance In Emerging Markets: A Survey”.
Di Noia, C. (1998), “Competition and Integration among Stock Exchanges in Europe: Network Effects,
Implicit Mergers and Remote Access”, Working Paper, No. 98/03, the Wharton Financial
Institutions Center.
Ernst & Young (2013), “The JOBS Act: One-year anniversary An overview of implementation after one
year and an analysis of emerging growth company trends”.
Estrada G. et al (2010), “Financial Development and Economic Growth in Developing Asia”, ADB
Working Paper Series, No. 233, November.
Friedrich S. and R. Payne (2011), “Computer Based Trading, Liquidity and Trading Costs”, The Future of
Computer Trading in Financial Markets, DR-5, Foresight, London,
www.bis.gov.uk/assets/foresight/docs/computer-trading/11-1240-dr5-computer-based -trading-
liquidity-and-trading-costs.pdf.
Gao, X., Ritter, J., Zhu, Z. (2012). “Where have all the IPOs gone?”t http://ssrn.com/abstract=1954788.
Goldman Sachs (2010a), “EM Equity in Two Decades: A Changing Landscape”, Global Economics Paper
No: 204.
38
Goldman Sachs (2010b), “Shanghai in 2020: Asia’s Financial Centre”, Global Economics Paper No: 198.
Grant Thornton (2010), “Market Structure is Causing the IPO Crisis – and More”, Capital Market Series,
David Weild and Edward Kim, Grant Thornton
Gutierrez, L., Pombo, C et al, (2005) “Ownership and Control in Colombian Corporations”
Group of Thirty (2013), Long-term Finance and Economic Growth.
IMF (2012), International Financial Statistics, Yearbook 2012.
IOSCO (2011a), Regulatory Issues Raised by the Impact of Technological Changes on Market Integrity
and Efficiency, IOSCO, Madrid, www.iosco.org/library/pubdocs/pdf/IOSCOPD361.pdf.
IOSCO (2011b), Principles for Dark Liquidity, IOSCO, Madrid,
www.iosco.org/library/pubdocs/pdf/IOSCOPD353.pdf.
IOSCO (2012), Development and Regulation of Institutional Investors in Emerging Markets,
http://www.iosco.org/library/pubdocs/pdf/IOSCOPD384.pdf
Isaksson, M. (2004), “Corporate Governance and Public Policy” in The Future of Corporate Governance,
ed. Mats Isaksson and Rolf Skog
Isaksson, M. and S. Celik, (2013) “Who Cares? Corporate Governance in Today’s Equity Markets”, OECD
Corporate Governance Working Papers, No. 8, OECD Publishing.
http://dx.doi.org/10.1787/5k47zw5kdnmp-en.
Lash H. and J. Spicer (2009), “Who’s Afraid of High-frequency Trading?” Thomson Reuters,
www.reuters.com/article/2009/12/02/us-highfrequency-idUSN173583920091202.
Lefort F. (2005), “Ownership Structure and Corporate Governance in Latin America, Revista ABANTE,
Vol. 8, No.1, pp. 55-84, April.
Lefort and Walker (2000), “Ownership and Capital Structure of Chilean Conglomerates: Facts and
Hypothesis in Chile.” ABANTE, Vol. 3, No. 1, April.
Lehuedé, H. (2013), “Colombian SOEs: A Review Against the OECD Guidelines on Corporate
Governance of State-owned Enterprises”, OECD Corporate Governance Working Papers, No. 12, OECD
Publishing.
http://dx.doi.org/10.1787/5k3v1ts5s4f6-en
Lowenstein L. (1991), Index Investment Strategies and Corporate Governance, The University of Toledo,
College of Law, March.
McKinsey Global Institute (2011), The Emerging Equity Gap: Growth and Stability in the New Investor
Landscape.
OECD (2004), Latin American White Paper on Corporate Governance
OECD (2010), Perspectives on Global Development 2010: Shifting Wealth.
39
OECD (2011), Achieving Effective Boards: A Comparative Study of Corporate Governance frameworks
and Board Practices in Argentina, Brazil, Chile, Colombia, Mexico, Panama and Peru.
http://www.oecd.org/brazil/48510039.pdf
OECD (2011), Reform Priorities in Asia: Taking Corporate Governance to a Higher Level
OECD (2012a), The Role of MENA Stock Exchanges in Corporate Governance
OECD (2012b), Strengthening Latin American Corporate Governance: The Role of Institutional Investors
OECD (2012c), Latin American Corporate Governance Roundtable Task Force Report on Related Party
Transactions
OECD (2012d), Ownership Oversight and Board Practices for Latin American State-Owned Enterprises
OECD (2013) “Corporate Governance in Emerging Markets: A Scoping Paper”, unpublished.
OECD (2013b), OECD Economic Surveys: Brazil
OECD/ECLAC (2012), Latin American Economic Outlook 2013: SME Policies for Structural Change
http://dx.doi.org/10.1787/leo-2013-en.
Ramaswamy (2011), “Market Structures and Systemic Risks of Exchange-Traded Funds”, BIS Working
Papers, No. 343, April.
Rey D.M. and D. Seiler (2001), “Indexation and Tracking Errors”, WWZ – Department of Finance,
Working Paper, No. 2/01.
Securities and Exchange Commission (SEC, 2010), Concept Release on Equity Market Structure, SEC,
Washington, DC, www.sec.gov/rules/concept/2010/34-61358.pdf.
Schneider, 2008, “Economic Liberalization and Corporate Governance: the Resilience of Business Groups
in Latin America,” Comparative Politics (40(4 July):379-98).
Silva, F., Majluf, N. and Paredes, R.D. (2006). Family ties, interlocking directors and performance of
business groups in emerging countries: The case of Chile. Journal of Business Research, 59, 315-
321.
Steil, B. (1996), “Equity Trading IV: The ISD and the Regulation of European Market Structure,” The
European Equity Markets, The Royal Institute of International Affairs.
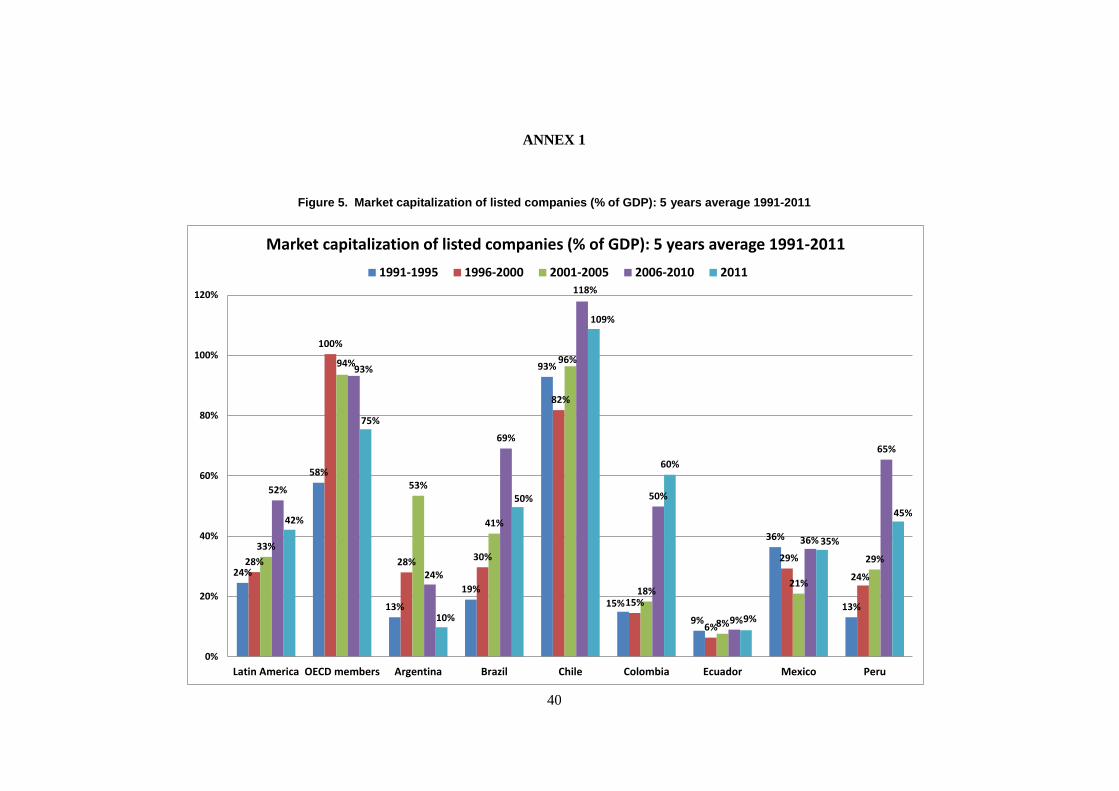
40
ANNEX 1
Figure 5. Market capitalization of listed companies (% of GDP): 5 years average 1991-2011
24%
58%
13%
19%
93%
15%
9%
36%
13%
28%
100%
28% 30%
82%
15%
6%
29%
24%
33%
94%
53%
41%
96%
18%
8%
21%
29%
52%
93%
24%
69%
118%
50%
9%
36%
65%
42%
75%
10%
50%
109%
60%
9%
35%
45%
0%
20%
40%
60%
80%
100%
120%
Latin America OECD members Argentina Brazil Chile Colombia Ecuador Mexico Peru
Market capitalization of listed companies (% of GDP): 5 years average 1991-2011
1991-1995 1996-2000 2001-2005 2006-2010 2011
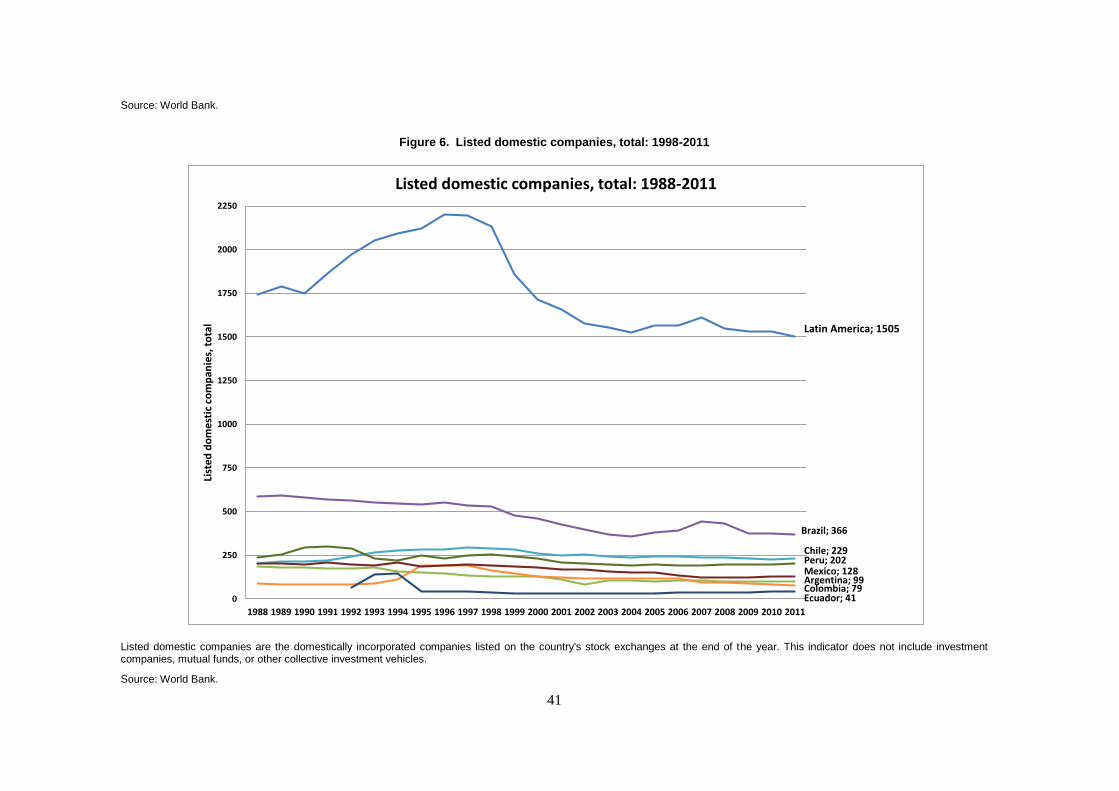
41
Source: World Bank.
Figure 6. Listed domestic companies, total: 1998-2011
Listed domestic companies are the domestically incorporated companies listed on the country's stock exchanges at the end of the year. This indicator does not include investment companies, mutual funds, or other collective investment vehicles.
Source: World Bank.
Latin America; 1505
Argentina; 99
Brazil; 366
Chile; 229
Colombia; 79Ecuador; 41
Mexico; 128Peru; 202
0
250
500
750
1000
1250
1500
1750
2000
2250
1988 1989 1990 1991 1992 1993 1994 1995 1996 1997 1998 1999 2000 2001 2002 2003 2004 2005 2006 2007 2008 2009 2010 2011
List
ed
do
mes
tic
com
pan
ies,
to
tal
Listed domestic companies, total: 1988-2011
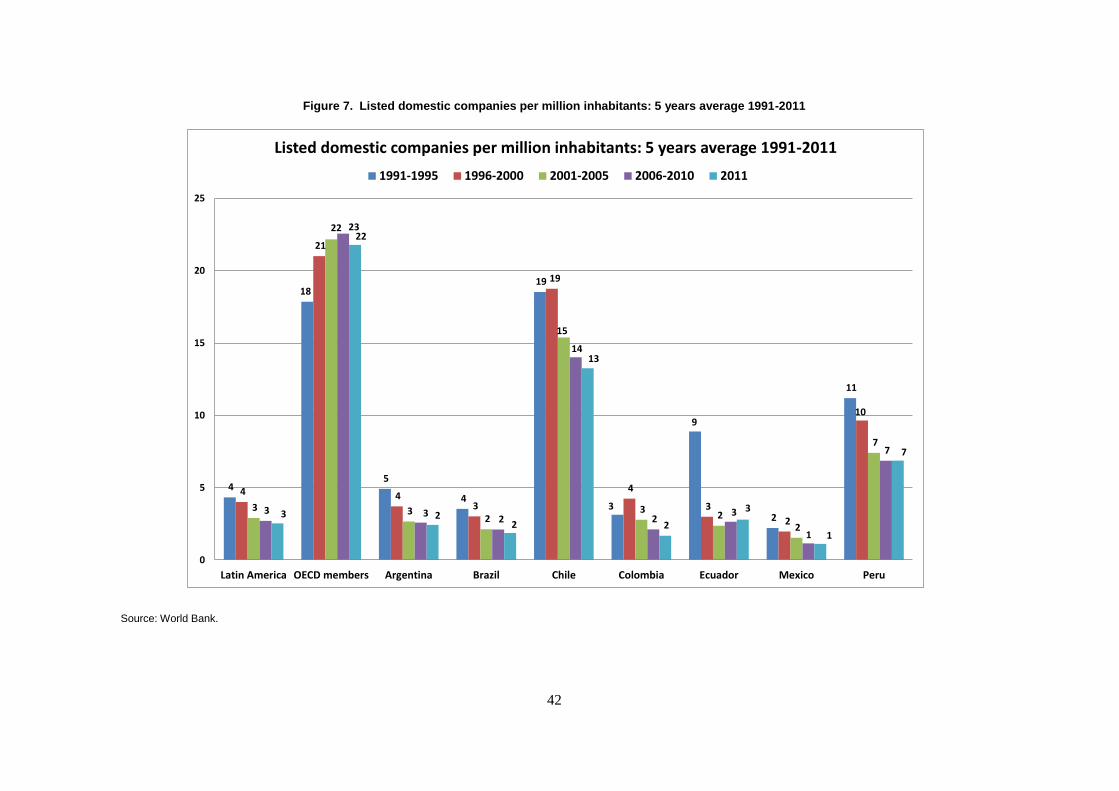
42
Figure 7. Listed domestic companies per million inhabitants: 5 years average 1991-2011
Source: World Bank.
4
18
5
4
19
3
9
2
11
4
21
4 3
19
4
3
2
10
3
22
3 2
15
3 2
2
7
3
23
3 2
14
2 3
1
7
3
22
2 2
13
2
3
1
7
0
5
10
15
20
25
Latin America OECD members Argentina Brazil Chile Colombia Ecuador Mexico Peru
Listed domestic companies per million inhabitants: 5 years average 1991-2011
1991-1995 1996-2000 2001-2005 2006-2010 2011
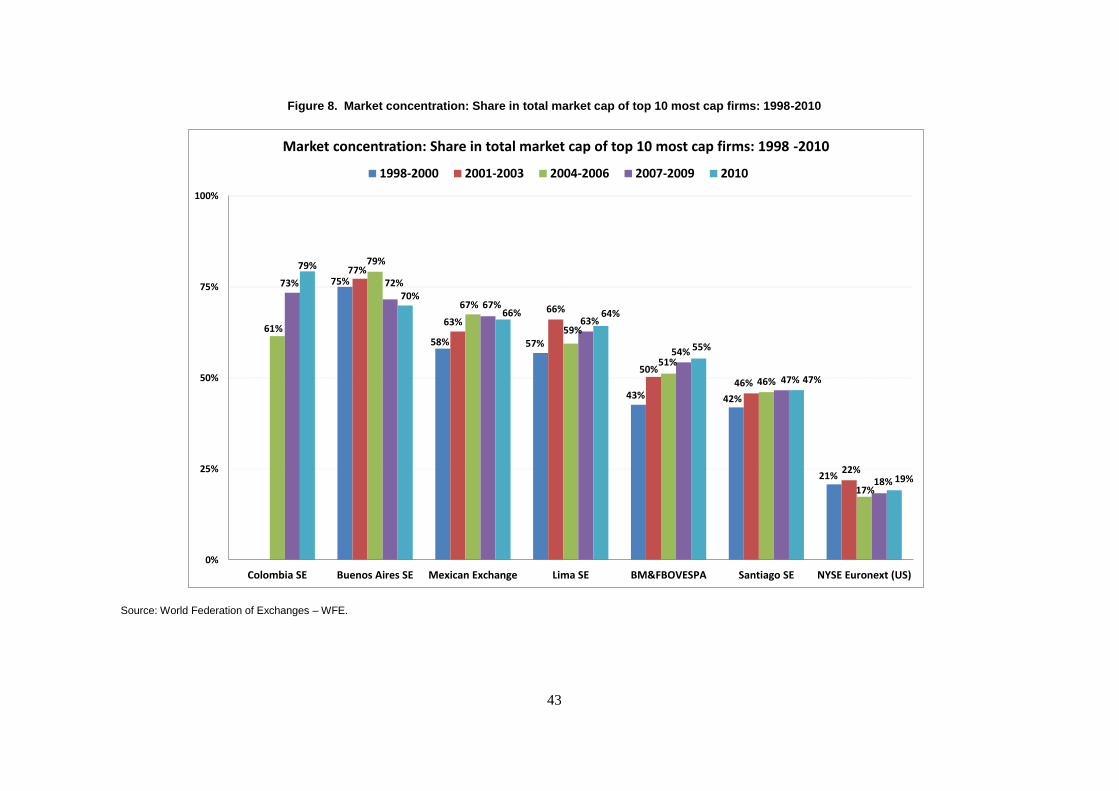
43
Figure 8. Market concentration: Share in total market cap of top 10 most cap firms: 1998-2010
Source: World Federation of Exchanges – WFE.
75%
58% 57%
43% 42%
21%
77%
63%66%
50%
46%
22%
61%
79%
67%
59%
51%
46%
17%
73% 72%
67%
63%
54%
47%
18%
79%
70%
66% 64%
55%
47%
19%
0%
25%
50%
75%
100%
Colombia SE Buenos Aires SE Mexican Exchange Lima SE BM&FBOVESPA Santiago SE NYSE Euronext (US)
Market concentration: Share in total market cap of top 10 most cap firms: 1998 -2010
1998-2000 2001-2003 2004-2006 2007-2009 2010
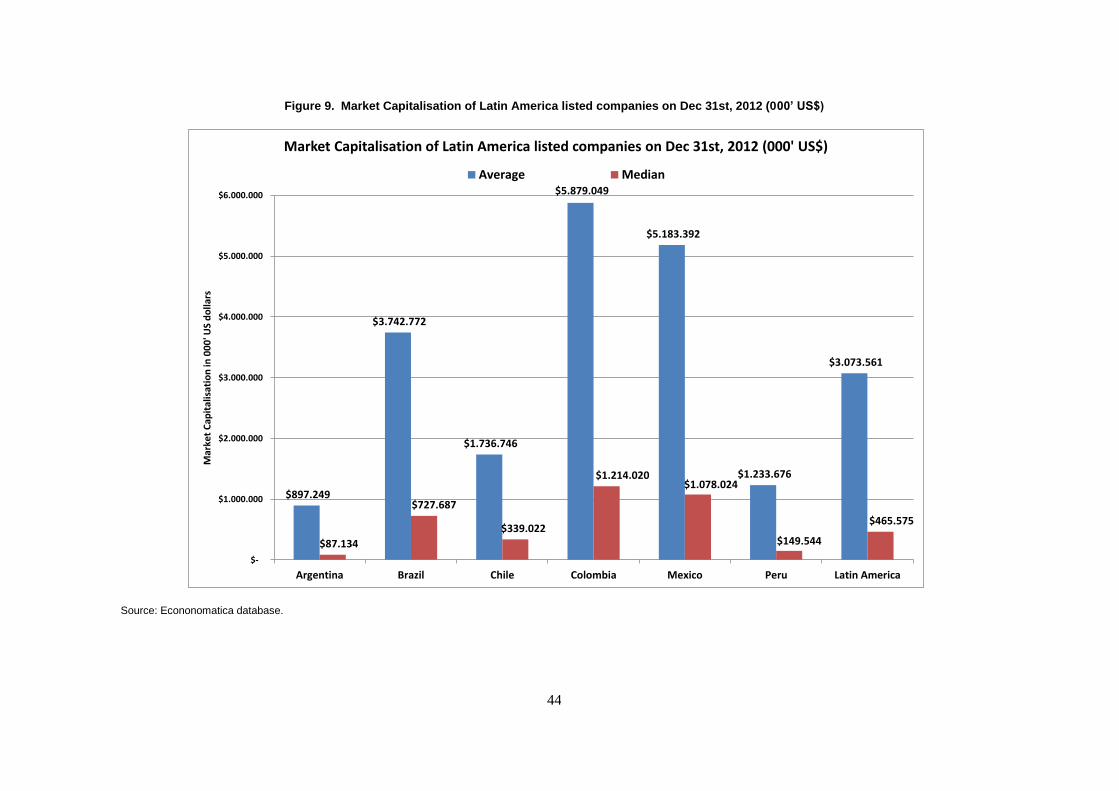
44
Figure 9. Market Capitalisation of Latin America listed companies on Dec 31st, 2012 (000’ US$)
Source: Econonomatica database.
$897.249
$3.742.772
$1.736.746
$5.879.049
$5.183.392
$1.233.676
$3.073.561
$87.134
$727.687
$339.022
$1.214.020 $1.078.024
$149.544
$465.575
$-
$1.000.000
$2.000.000
$3.000.000
$4.000.000
$5.000.000
$6.000.000
Argentina Brazil Chile Colombia Mexico Peru Latin America
Mar
ket
Cap
ital
isat
ion
in 0
00
' US
do
llars
Market Capitalisation of Latin America listed companies on Dec 31st, 2012 (000' US$)
Average Median
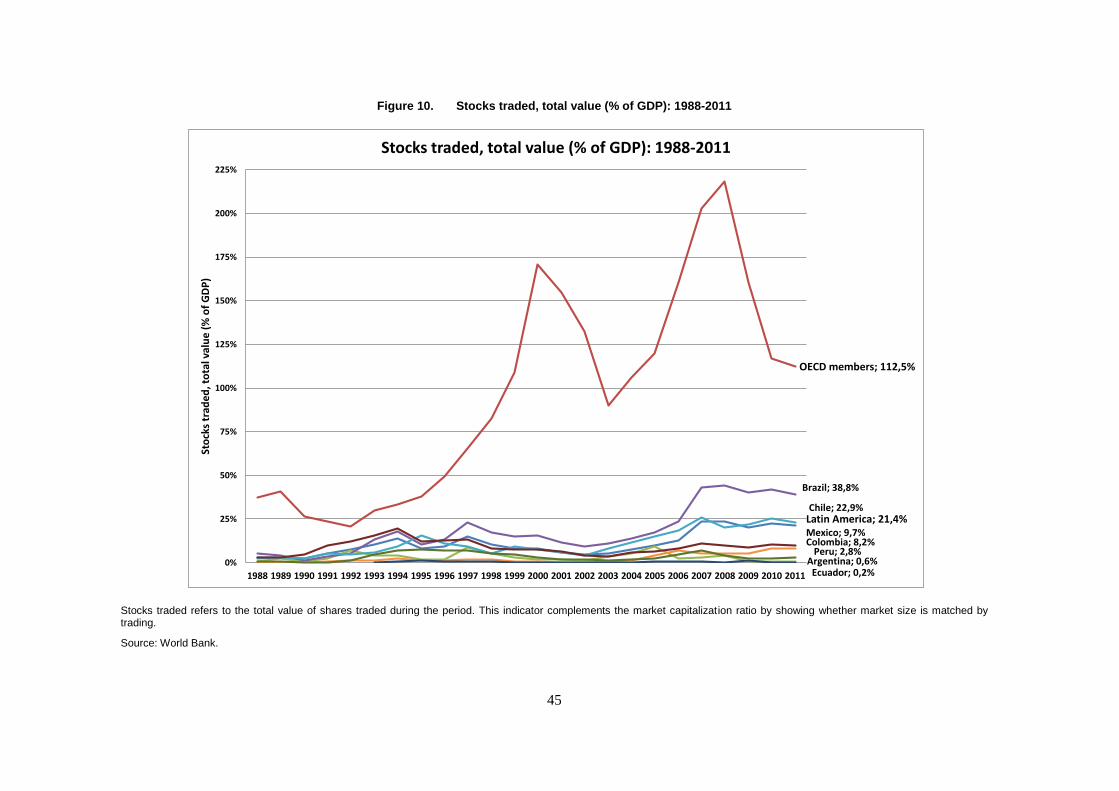
45
Figure 10. Stocks traded, total value (% of GDP): 1988-2011
Stocks traded refers to the total value of shares traded during the period. This indicator complements the market capitalization ratio by showing whether market size is matched by trading.
Source: World Bank.
Latin America; 21,4%
OECD members; 112,5%
Argentina; 0,6%
Brazil; 38,8%
Chile; 22,9%
Colombia; 8,2%
Ecuador; 0,2%
Mexico; 9,7%
Peru; 2,8%0%
25%
50%
75%
100%
125%
150%
175%
200%
225%
1988 1989 1990 1991 1992 1993 1994 1995 1996 1997 1998 1999 2000 2001 2002 2003 2004 2005 2006 2007 2008 2009 2010 2011
Sto
cks
trad
ed, t
ota
l val
ue
(% o
f G
DP
)
Stocks traded, total value (% of GDP): 1988-2011
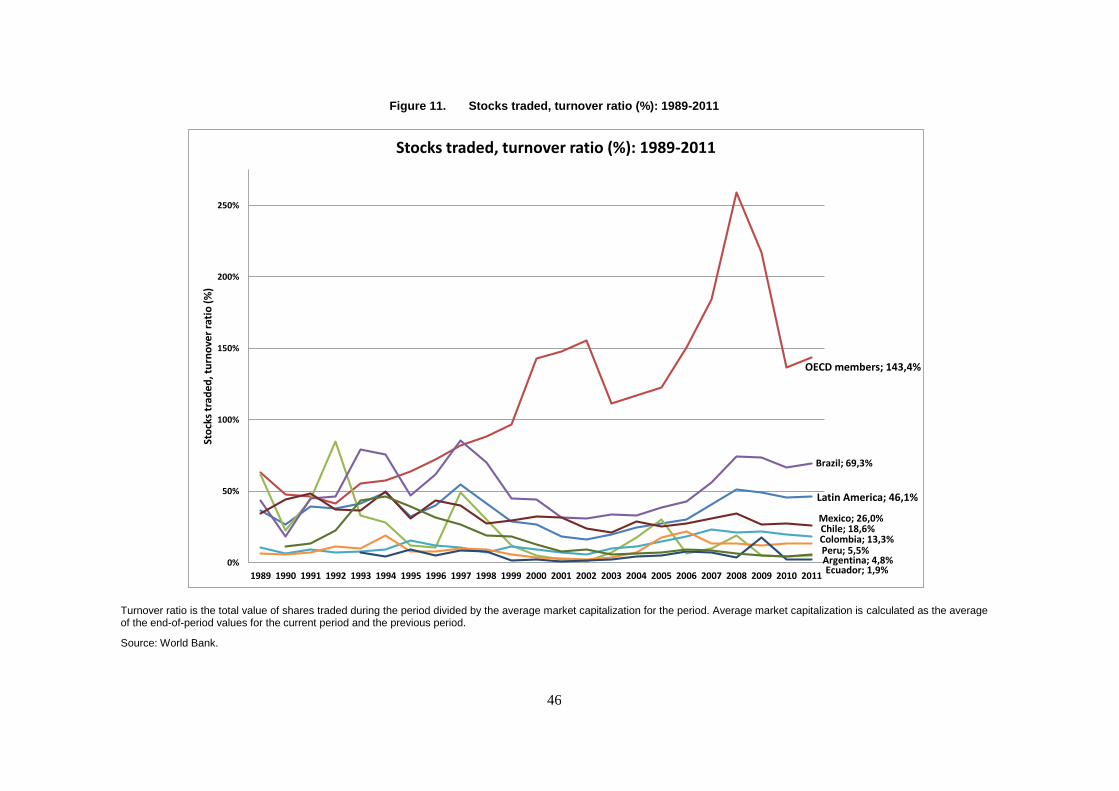
46
Figure 11. Stocks traded, turnover ratio (%): 1989-2011
Turnover ratio is the total value of shares traded during the period divided by the average market capitalization for the period. Average market capitalization is calculated as the average of the end-of-period values for the current period and the previous period.
Source: World Bank.
Latin America; 46,1%
OECD members; 143,4%
Argentina; 4,8%
Brazil; 69,3%
Chile; 18,6%Colombia; 13,3%
Ecuador; 1,9%
Mexico; 26,0%
Peru; 5,5%0%
50%
100%
150%
200%
250%
1989 1990 1991 1992 1993 1994 1995 1996 1997 1998 1999 2000 2001 2002 2003 2004 2005 2006 2007 2008 2009 2010 2011
Sto
cks
trad
ed, t
urn
ove
r ra
tio
(%
)
Stocks traded, turnover ratio (%): 1989-2011
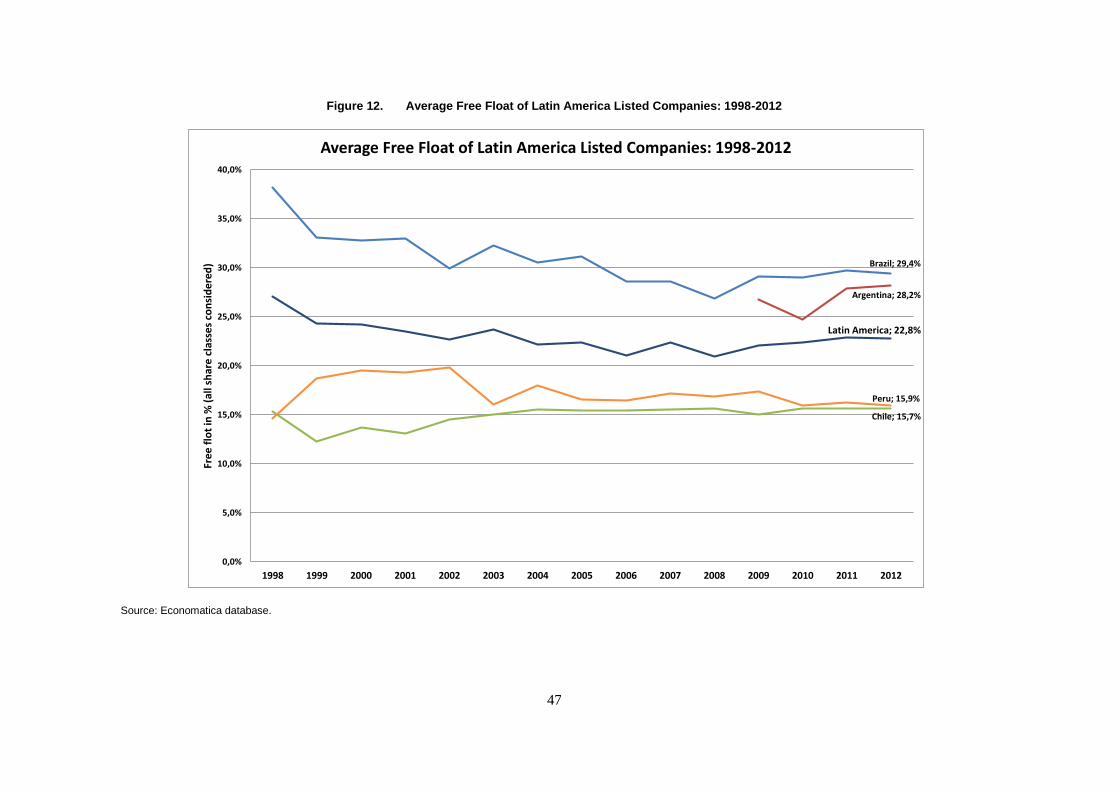
47
Figure 12. Average Free Float of Latin America Listed Companies: 1998-2012
Source: Economatica database.
Argentina; 28,2%
Brazil; 29,4%
Chile; 15,7%
Peru; 15,9%
Latin America; 22,8%
0,0%
5,0%
10,0%
15,0%
20,0%
25,0%
30,0%
35,0%
40,0%
1998 1999 2000 2001 2002 2003 2004 2005 2006 2007 2008 2009 2010 2011 2012
Free
flo
t in
% (
all s
har
e cl
asse
s co
nsi
der
ed)
Average Free Float of Latin America Listed Companies: 1998-2012
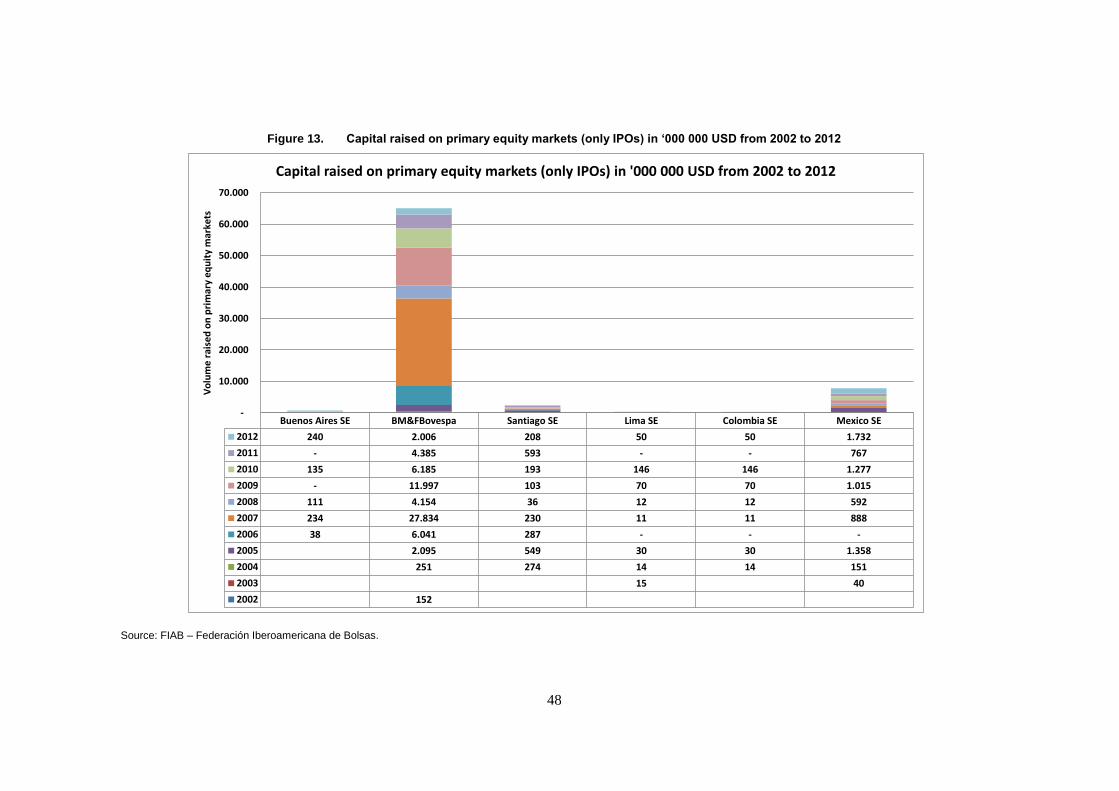
48
Figure 13. Capital raised on primary equity markets (only IPOs) in ‘000 000 USD from 2002 to 2012
Source: FIAB – Federación Iberoamericana de Bolsas.
Buenos Aires SE BM&FBovespa Santiago SE Lima SE Colombia SE Mexico SE
2012 240 2.006 208 50 50 1.732
2011 - 4.385 593 - - 767
2010 135 6.185 193 146 146 1.277
2009 - 11.997 103 70 70 1.015
2008 111 4.154 36 12 12 592
2007 234 27.834 230 11 11 888
2006 38 6.041 287 - - -
2005 2.095 549 30 30 1.358
2004 251 274 14 14 151
2003 15 40
2002 152
-
10.000
20.000
30.000
40.000
50.000
60.000
70.000
Vo
lum
e r
aise
d o
n p
rim
ary
equ
ity
mar
kets
Capital raised on primary equity markets (only IPOs) in '000 000 USD from 2002 to 2012
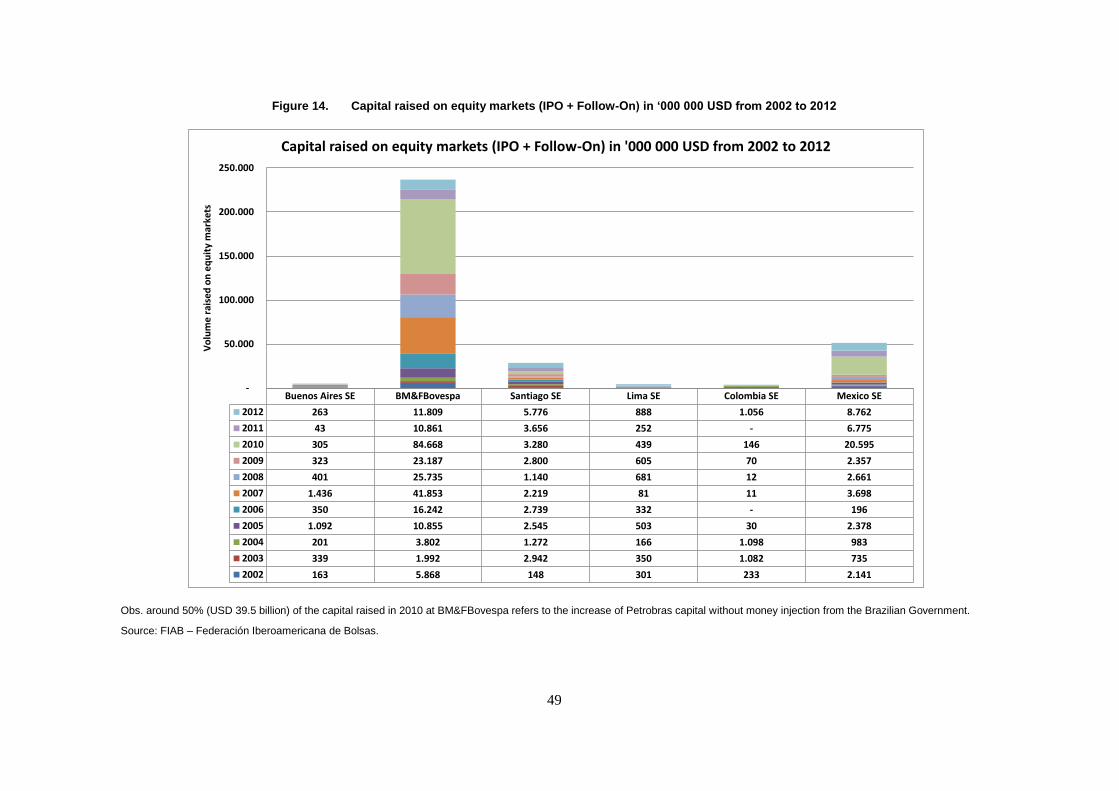
49
Figure 14. Capital raised on equity markets (IPO + Follow-On) in ‘000 000 USD from 2002 to 2012
Obs. around 50% (USD 39.5 billion) of the capital raised in 2010 at BM&FBovespa refers to the increase of Petrobras capital without money injection from the Brazilian Government.
Source: FIAB – Federación Iberoamericana de Bolsas.
Buenos Aires SE BM&FBovespa Santiago SE Lima SE Colombia SE Mexico SE
2012 263 11.809 5.776 888 1.056 8.762
2011 43 10.861 3.656 252 - 6.775
2010 305 84.668 3.280 439 146 20.595
2009 323 23.187 2.800 605 70 2.357
2008 401 25.735 1.140 681 12 2.661
2007 1.436 41.853 2.219 81 11 3.698
2006 350 16.242 2.739 332 - 196
2005 1.092 10.855 2.545 503 30 2.378
2004 201 3.802 1.272 166 1.098 983
2003 339 1.992 2.942 350 1.082 735
2002 163 5.868 148 301 233 2.141
-
50.000
100.000
150.000
200.000
250.000
Vo
lum
e r
aise
d o
n e
qu
ity
mar
kets
Capital raised on equity markets (IPO + Follow-On) in '000 000 USD from 2002 to 2012
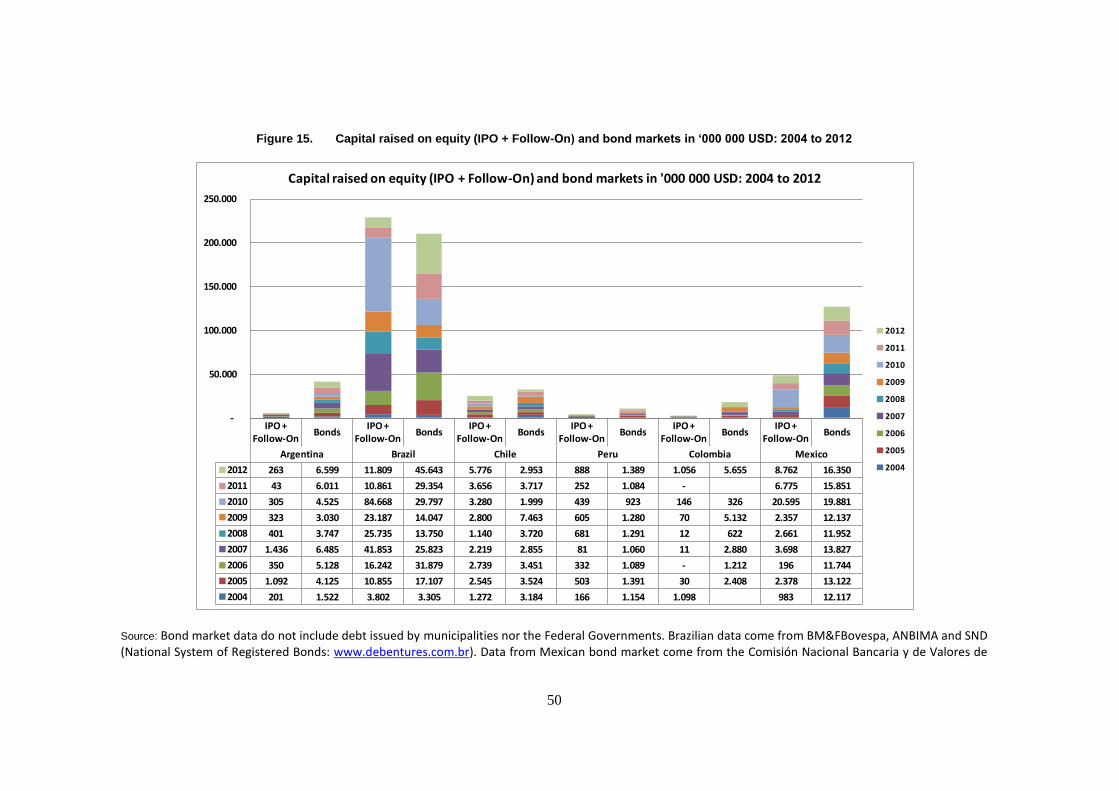
50
Figure 15. Capital raised on equity (IPO + Follow-On) and bond markets in ‘000 000 USD: 2004 to 2012
Source: Bond market data do not include debt issued by municipalities nor the Federal Governments. Brazilian data come from BM&FBovespa, ANBIMA and SND (National System of Registered Bonds: www.debentures.com.br). Data from Mexican bond market come from the Comisión Nacional Bancaria y de Valores de
IPO + Follow-On
BondsIPO +
Follow-OnBonds
IPO + Follow-On
BondsIPO +
Follow-OnBonds
IPO + Follow-On
BondsIPO +
Follow-OnBonds
Argentina Brazil Chile Peru Colombia Mexico
2012 263 6.599 11.809 45.643 5.776 2.953 888 1.389 1.056 5.655 8.762 16.350
2011 43 6.011 10.861 29.354 3.656 3.717 252 1.084 - 6.775 15.851
2010 305 4.525 84.668 29.797 3.280 1.999 439 923 146 326 20.595 19.881
2009 323 3.030 23.187 14.047 2.800 7.463 605 1.280 70 5.132 2.357 12.137
2008 401 3.747 25.735 13.750 1.140 3.720 681 1.291 12 622 2.661 11.952
2007 1.436 6.485 41.853 25.823 2.219 2.855 81 1.060 11 2.880 3.698 13.827
2006 350 5.128 16.242 31.879 2.739 3.451 332 1.089 - 1.212 196 11.744
2005 1.092 4.125 10.855 17.107 2.545 3.524 503 1.391 30 2.408 2.378 13.122
2004 201 1.522 3.802 3.305 1.272 3.184 166 1.154 1.098 983 12.117
-
50.000
100.000
150.000
200.000
250.000
Capital raised on equity (IPO + Follow-On) and bond markets in '000 000 USD: 2004 to 2012
2012
2011
2010
2009
2008
2007
2006
2005
2004
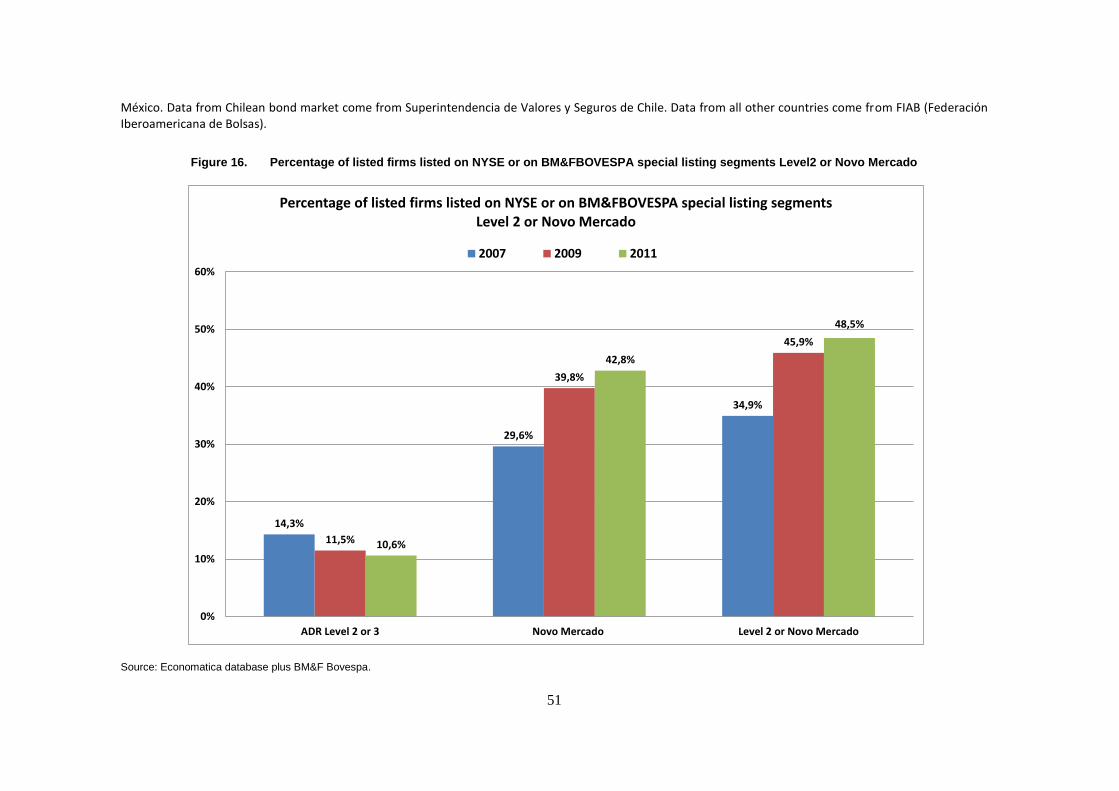
51
México. Data from Chilean bond market come from Superintendencia de Valores y Seguros de Chile. Data from all other countries come from FIAB (Federación Iberoamericana de Bolsas).
Figure 16. Percentage of listed firms listed on NYSE or on BM&FBOVESPA special listing segments Level2 or Novo Mercado
Source: Economatica database plus BM&F Bovespa.
14,3%
29,6%
34,9%
11,5%
39,8%
45,9%
10,6%
42,8%
48,5%
0%
10%
20%
30%
40%
50%
60%
ADR Level 2 or 3 Novo Mercado Level 2 or Novo Mercado
Percentage of listed firms listed on NYSE or on BM&FBOVESPA special listing segments Level 2 or Novo Mercado
2007 2009 2011
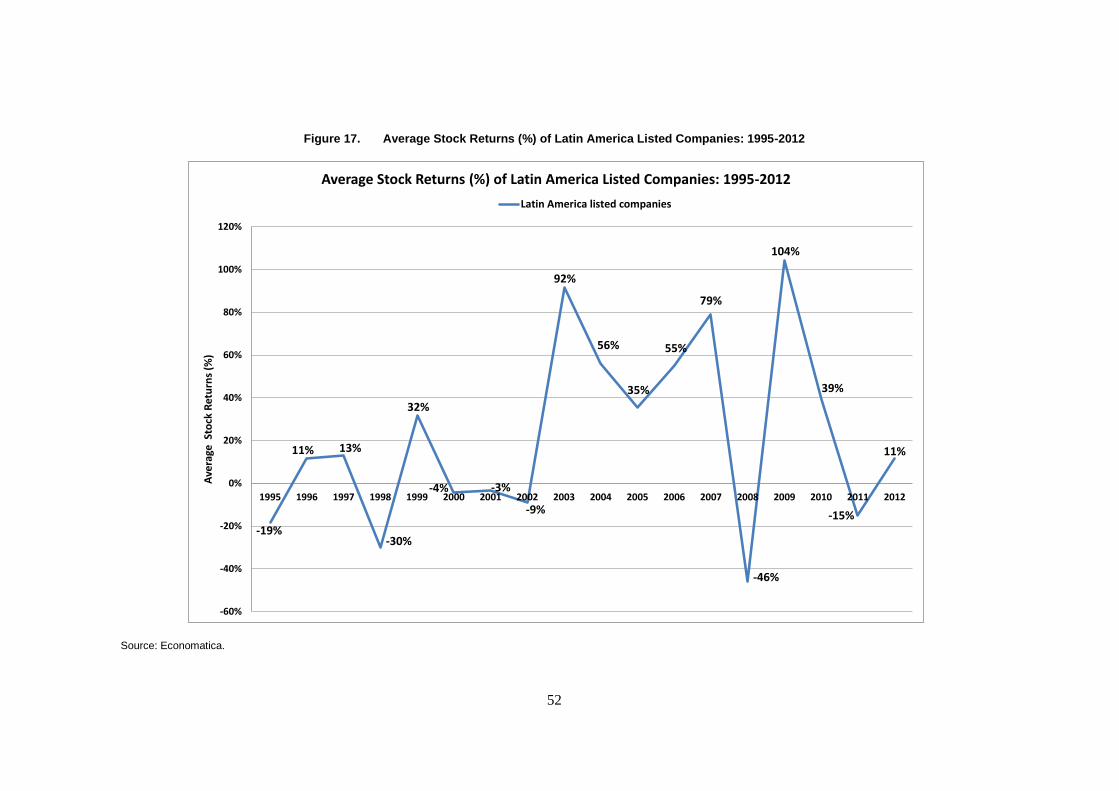
52
Figure 17. Average Stock Returns (%) of Latin America Listed Companies: 1995-2012
Source: Economatica.
-19%
11% 13%
-30%
32%
-4% -3%
-9%
92%
56%
35%
55%
79%
-46%
104%
39%
-15%
11%
-60%
-40%
-20%
0%
20%
40%
60%
80%
100%
120%
1995 1996 1997 1998 1999 2000 2001 2002 2003 2004 2005 2006 2007 2008 2009 2010 2011 2012
Ave
rage
Sto
ck R
etu
rns
(%)
Average Stock Returns (%) of Latin America Listed Companies: 1995-2012
Latin America listed companies
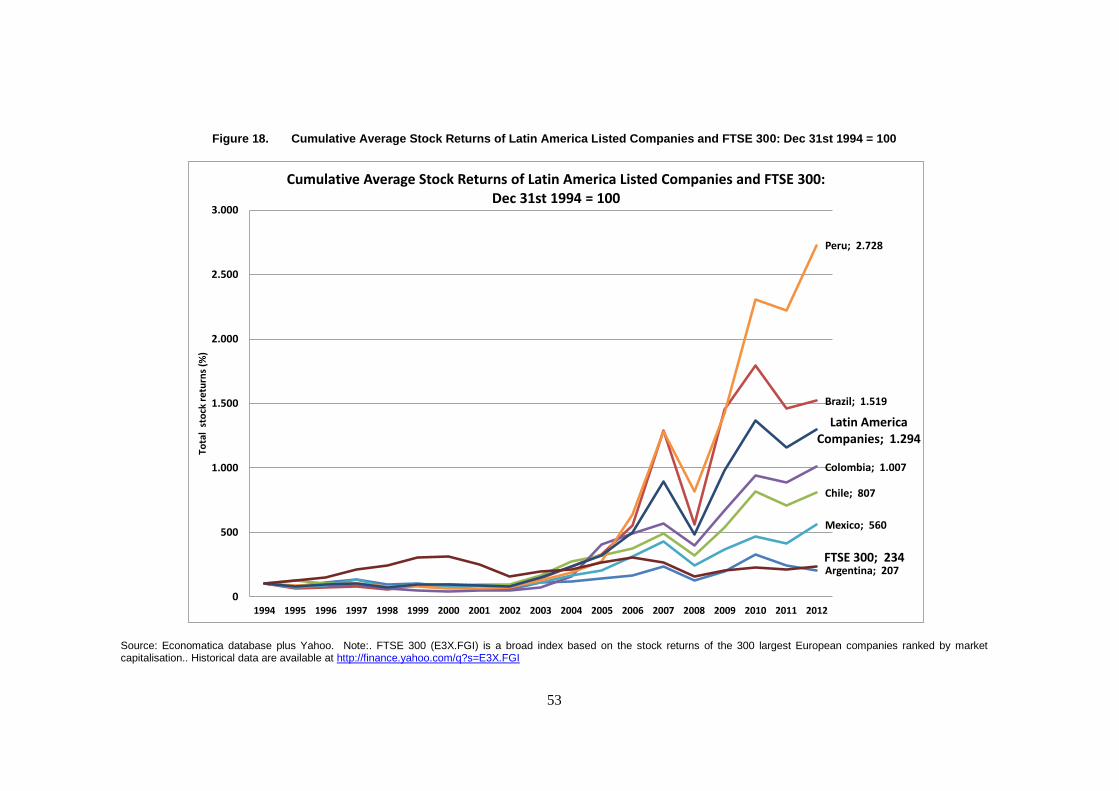
53
Figure 18. Cumulative Average Stock Returns of Latin America Listed Companies and FTSE 300: Dec 31st 1994 = 100
Source: Economatica database plus Yahoo. Note:. FTSE 300 (E3X.FGI) is a broad index based on the stock returns of the 300 largest European companies ranked by market capitalisation.. Historical data are available at http://finance.yahoo.com/q?s=E3X.FGI
Argentina; 207
Brazil; 1.519
Chile; 807
Colombia; 1.007
Mexico; 560
Peru; 2.728
Latin America Companies; 1.294
FTSE 300; 234
0
500
1.000
1.500
2.000
2.500
3.000
1994 1995 1996 1997 1998 1999 2000 2001 2002 2003 2004 2005 2006 2007 2008 2009 2010 2011 2012
Tota
l st
ock
ret
urn
s (%
)
Cumulative Average Stock Returns of Latin America Listed Companies and FTSE 300: Dec 31st 1994 = 100
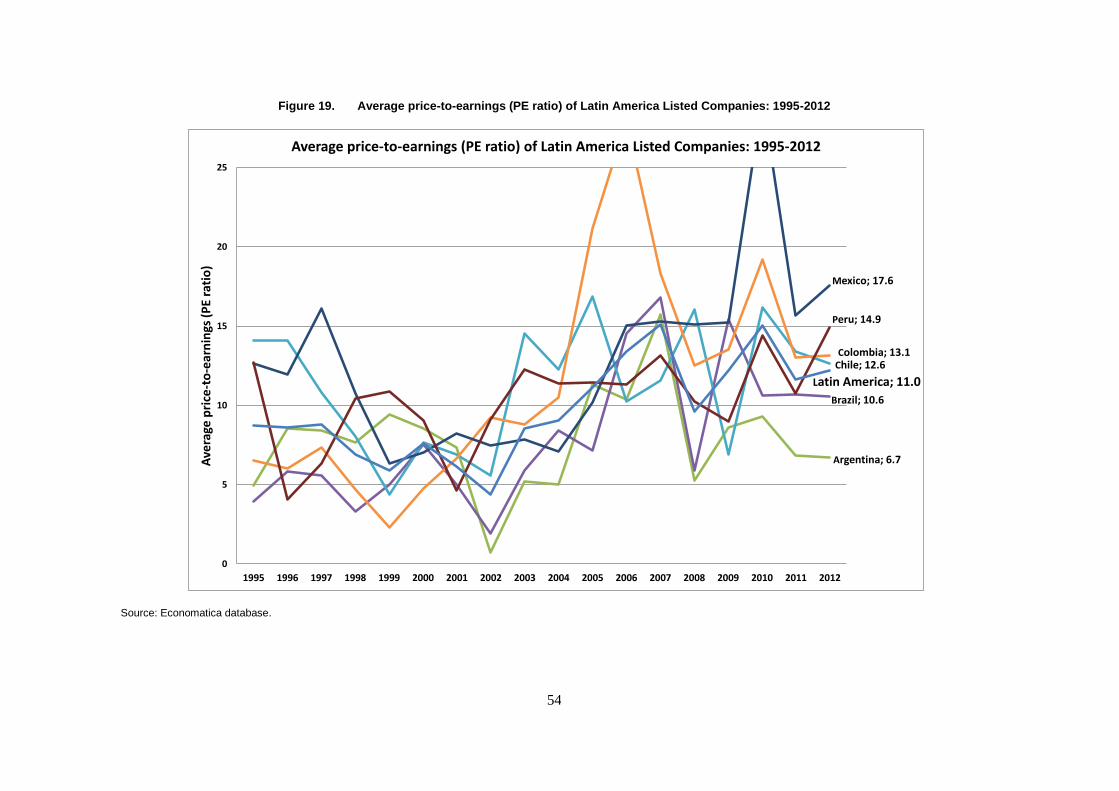
54
Figure 19. Average price-to-earnings (PE ratio) of Latin America Listed Companies: 1995-2012
Source: Economatica database.
Argentina; 6.7
Brazil; 10.6
Chile; 12.6Colombia; 13.1
Mexico; 17.6
Peru; 14.9
Latin America; 11.0
0
5
10
15
20
25
1995 1996 1997 1998 1999 2000 2001 2002 2003 2004 2005 2006 2007 2008 2009 2010 2011 2012
Ave
rage
pri
ce-t
o-e
arn
ings
(P
E ra
tio
)
Average price-to-earnings (PE ratio) of Latin America Listed Companies: 1995-2012
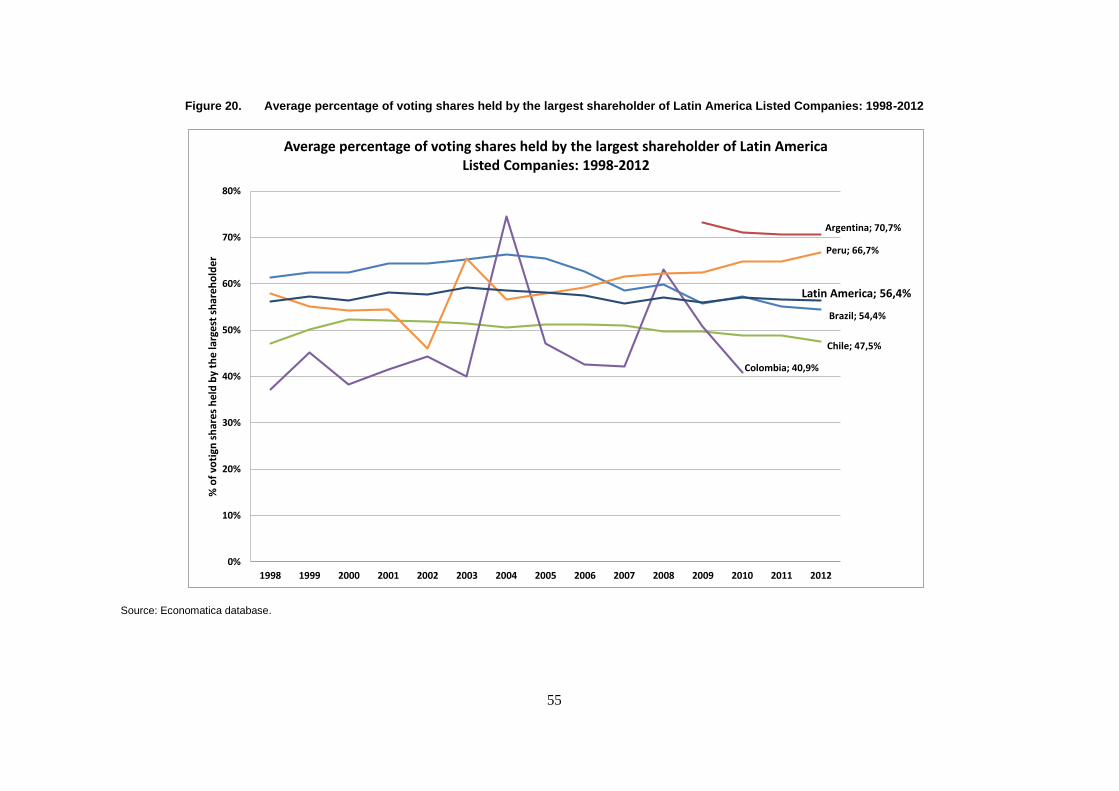
55
Figure 20. Average percentage of voting shares held by the largest shareholder of Latin America Listed Companies: 1998-2012
Source: Economatica database.
Argentina; 70,7%
Brazil; 54,4%
Chile; 47,5%
Colombia; 40,9%
Peru; 66,7%
Latin America; 56,4%
0%
10%
20%
30%
40%
50%
60%
70%
80%
1998 1999 2000 2001 2002 2003 2004 2005 2006 2007 2008 2009 2010 2011 2012
% o
f vo
tign
sh
ares
hel
d b
y th
e la
rges
t sh
areh
old
er
Average percentage of voting shares held by the largest shareholder of Latin America Listed Companies: 1998-2012
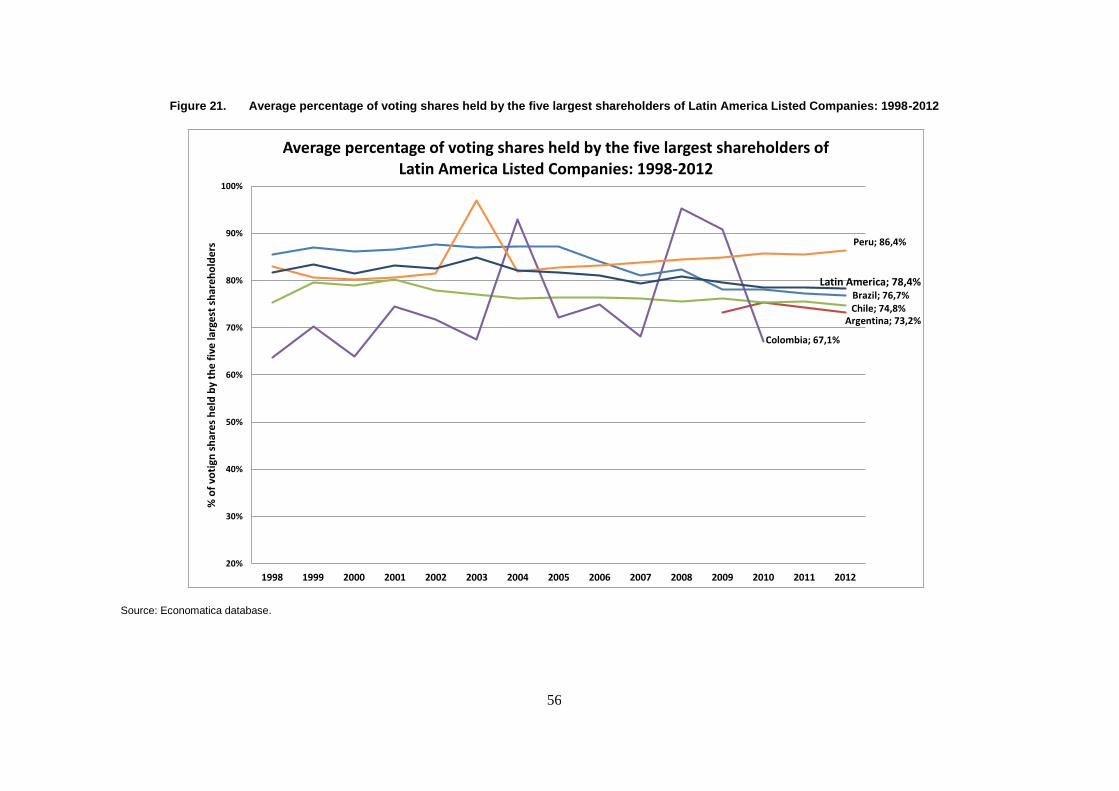
56
Figure 21. Average percentage of voting shares held by the five largest shareholders of Latin America Listed Companies: 1998-2012
Source: Economatica database.
Argentina; 73,2%
Brazil; 76,7%Chile; 74,8%
Colombia; 67,1%
Peru; 86,4%
Latin America; 78,4%
20%
30%
40%
50%
60%
70%
80%
90%
100%
1998 1999 2000 2001 2002 2003 2004 2005 2006 2007 2008 2009 2010 2011 2012
% o
f vo
tign
sh
ares
hel
d b
y th
e fi
ve la
rges
t sh
areh
old
ers
Average percentage of voting shares held by the five largest shareholders of Latin America Listed Companies: 1998-2012
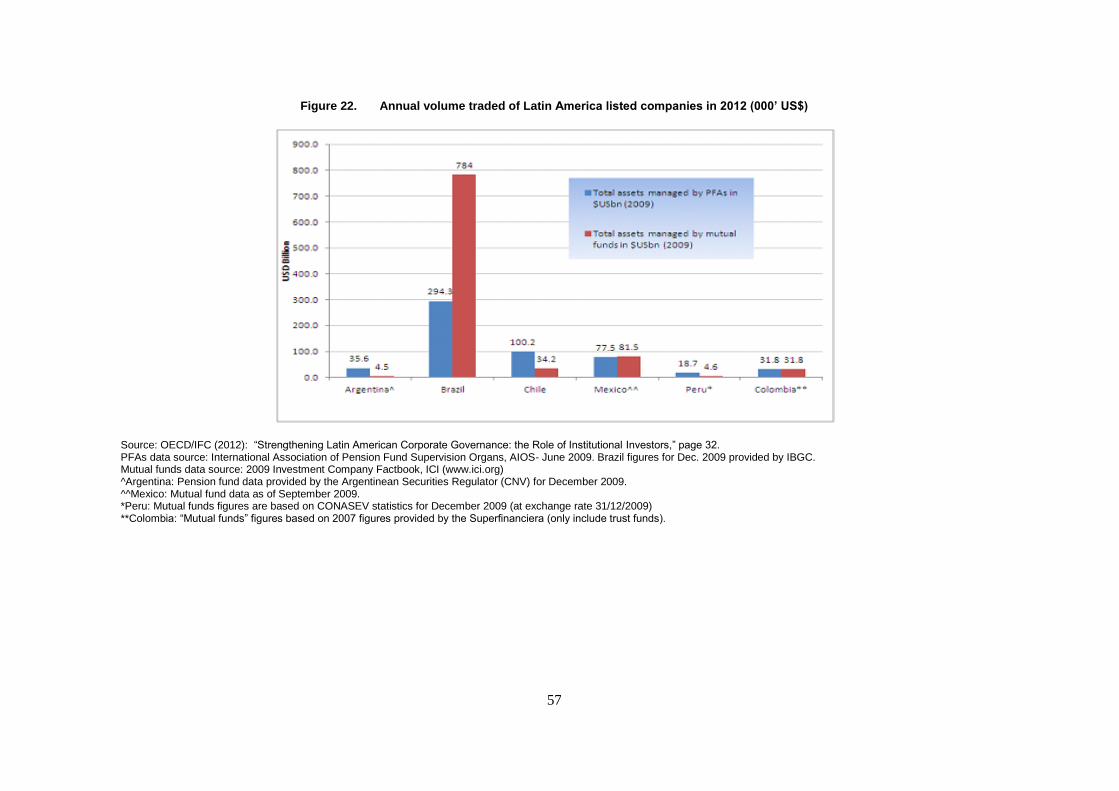
57
Figure 22. Annual volume traded of Latin America listed companies in 2012 (000’ US$)
Source: OECD/IFC (2012): “Strengthening Latin American Corporate Governance: the Role of Institutional Investors,” page 32. PFAs data source: International Association of Pension Fund Supervision Organs, AIOS- June 2009. Brazil figures for Dec. 2009 provided by IBGC. Mutual funds data source: 2009 Investment Company Factbook, ICI (www.ici.org) ^Argentina: Pension fund data provided by the Argentinean Securities Regulator (CNV) for December 2009. ^^Mexico: Mutual fund data as of September 2009. *Peru: Mutual funds figures are based on CONASEV statistics for December 2009 (at exchange rate 31/12/2009) **Colombia: “Mutual funds” figures based on 2007 figures provided by the Superfinanciera (only include trust funds).