Embed Size (px)
Citation preview
Trends and Patterns in Fertilizer Use by Smallholder Farmers in Kenya,
1997-2007
Joshua Ariga, T.S. Jayne, Betty Kibaara, and J.K. Nyoro
Paper presented at the Egerton University Tegemeo Institute Agricultural Policy Conference,
17 September 2008, Nairobi, Kenya
2
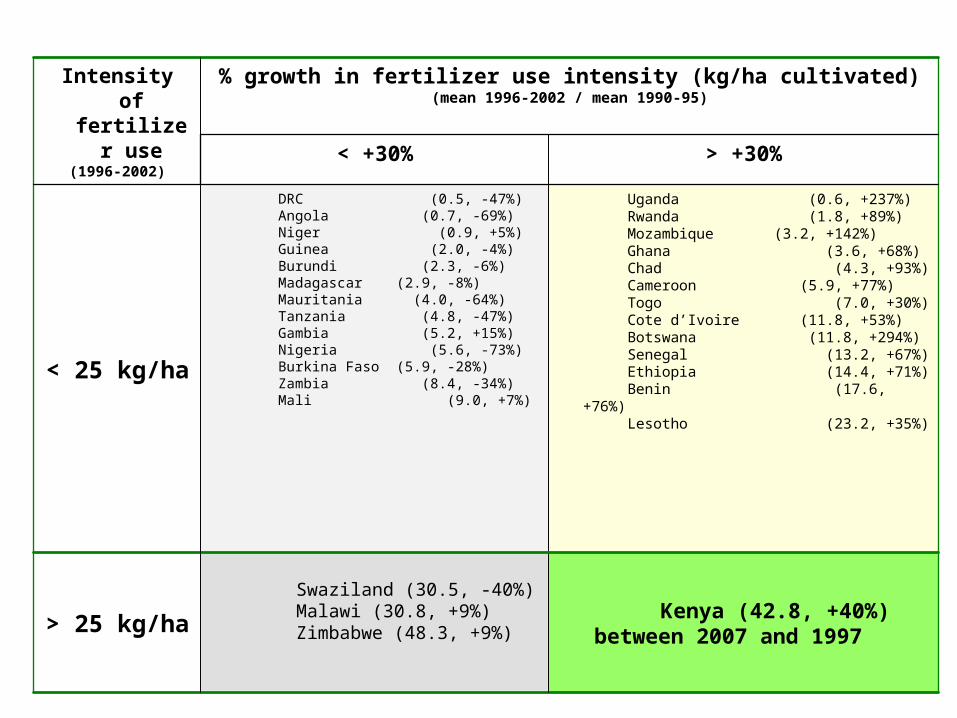
Kenya (42.8, +40%) between 2007 and 1997
Swaziland (30.5, -40%) Malawi (30.8, +9%) Zimbabwe (48.3, +9%)
> 25 kg/ha
Uganda (0.6, +237%) Rwanda (1.8, +89%) Mozambique (3.2, +142%) Ghana (3.6, +68%) Chad (4.3, +93%) Cameroon (5.9, +77%) Togo (7.0, +30%) Cote d’Ivoire (11.8, +53%) Botswana (11.8, +294%) Senegal (13.2, +67%) Ethiopia (14.4, +71%) Benin (17.6, +76%) Lesotho (23.2, +35%)
DRC (0.5, -47%) Angola (0.7, -69%) Niger (0.9, +5%) Guinea (2.0, -4%) Burundi (2.3, -6%) Madagascar (2.9, -8%) Mauritania (4.0, -64%) Tanzania (4.8, -47%) Gambia (5.2, +15%) Nigeria (5.6, -73%) Burkina Faso (5.9, -28%) Zambia (8.4, -34%) Mali (9.0, +7%)
< 25 kg/ha
> +30%< +30%
% growth in fertilizer use intensity (kg/ha cultivated)(mean 1996-2002 / mean 1990-95)
Intensity of fertilizer
use(1996-2002)
3
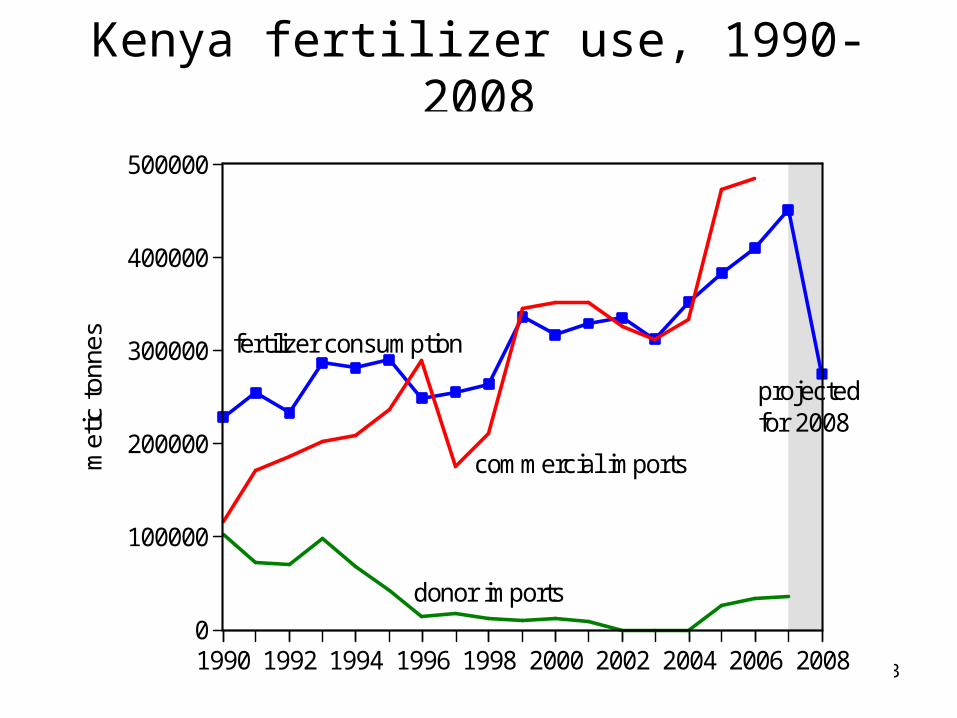
Kenya fertilizer use, 1990-2008
0
100000
200000
300000
400000
500000
1990 1992 1994 1996 1998 2000 2002 2004 2006 2008
donor imports
commercial imports
fertilizer consumption
projectedfor 2008
met
ic t
onne
s
4
Objectives:
1. Trends in fertilizer use on maize
2. Factors driving the increase in fertilizer use, 1997-2007
3. Household characteristics associated with fertilizer use
4. Impact on maize yields
5. Policy implications in light of higher food and fertilizer prices

5
Trends in Fertilizer Use on Maize
Objective 1
6
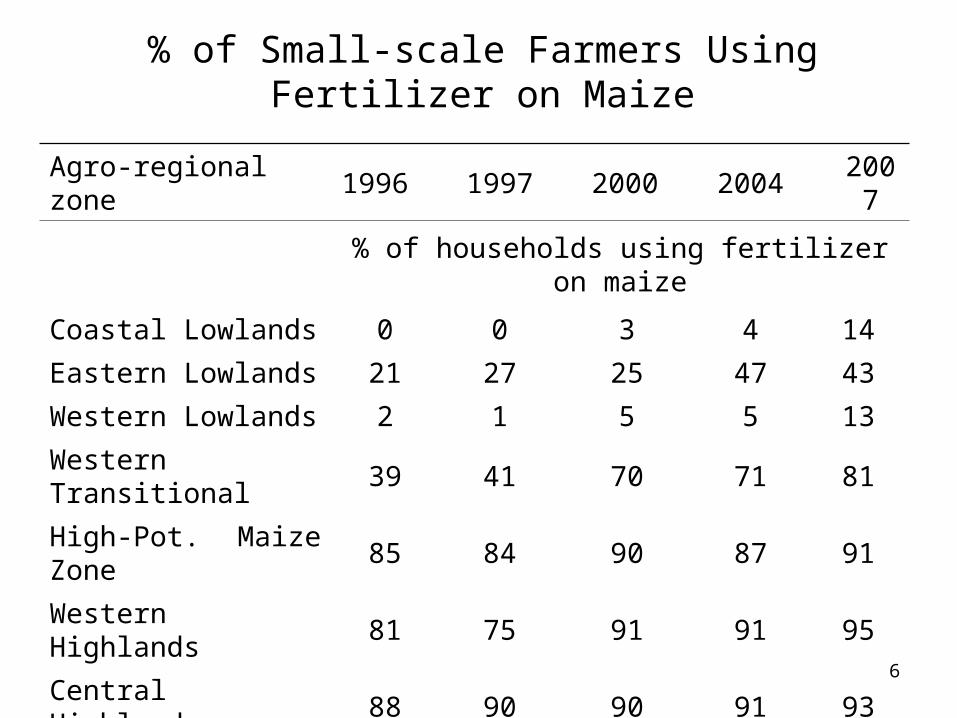
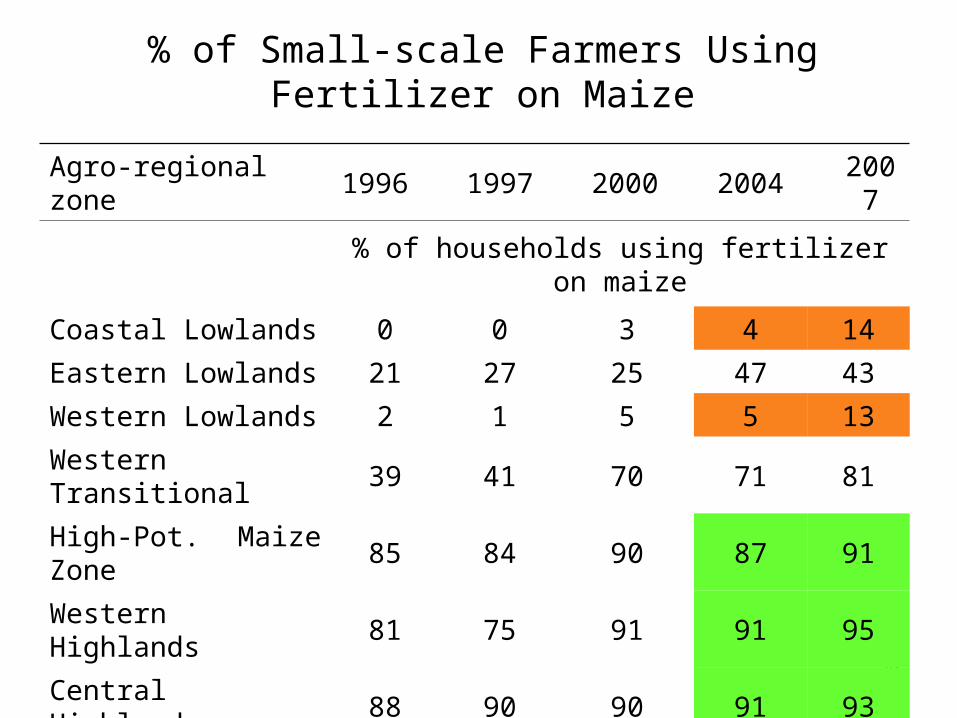
% of Small-scale Farmers Using Fertilizer on Maize
Agro-regional zone 1996 1997 2000 2004 2007
% of households using fertilizer on maize
Coastal Lowlands 0 0 3 4 14
Eastern Lowlands 21 27 25 47 43
Western Lowlands 2 1 5 5 13
Western Transitional 39 41 70 71 81
High-Pot. Maize Zone 85 84 90 87 91
Western Highlands 81 75 91 91 95
Central Highlands 88 90 90 91 93
Marginal Rain Shadow 6 6 12 11 16
Total Sample 56 58 64 66 70
7
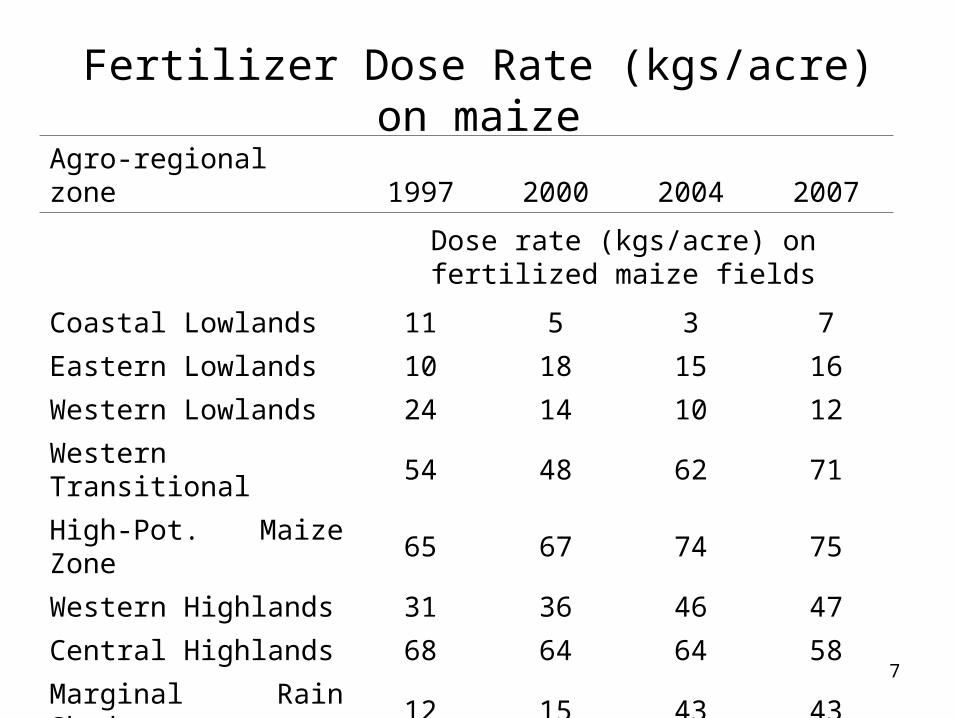
Fertilizer Dose Rate (kgs/acre) on maize
Agro-regional zone 1997 2000 2004 2007
Dose rate (kgs/acre) on fertilized maize fields
Coastal Lowlands 11 5 3 7
Eastern Lowlands 10 18 15 16
Western Lowlands 24 14 10 12
Western Transitional 54 48 62 71
High-Pot. Maize Zone 65 67 74 75
Western Highlands 31 36 46 47
Central Highlands 68 64 64 58
Marginal Rain Shadow 12 15 43 43
National sample 56 55 60 59
8
Factors driving the increase in
fertilizer use, 1997-2007
Objective 2
9
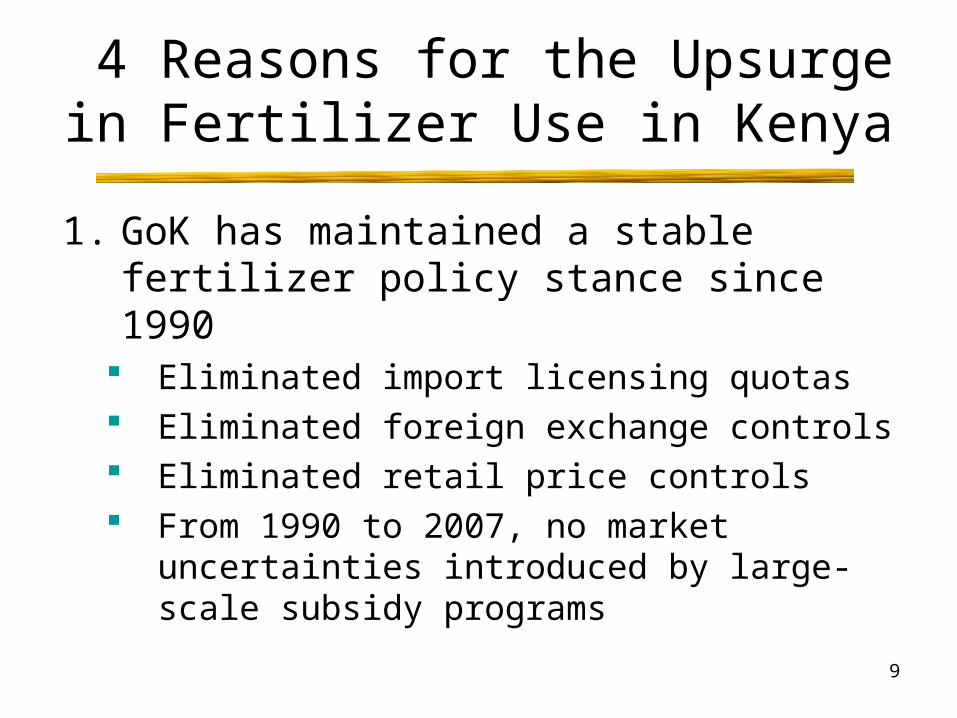
4 Reasons for the Upsurge in Fertilizer Use in Kenya
1. GoK has maintained a stable fertilizer policy stance since 1990
Eliminated import licensing quotas Eliminated foreign exchange controls Eliminated retail price controls From 1990 to 2007, no market uncertainties
introduced by large-scale subsidy programs

10
Farmer fertilizer purchases, Malawi
Purchases
0
50
100
150
200
250
300
350
1997/98 1998/99 1999/00 2000/01 2001/02 2002/03 2003/04 2004/05 2005/6 2006/7
'000
tonn
es
Subsidised* Unsubsidised Total
11
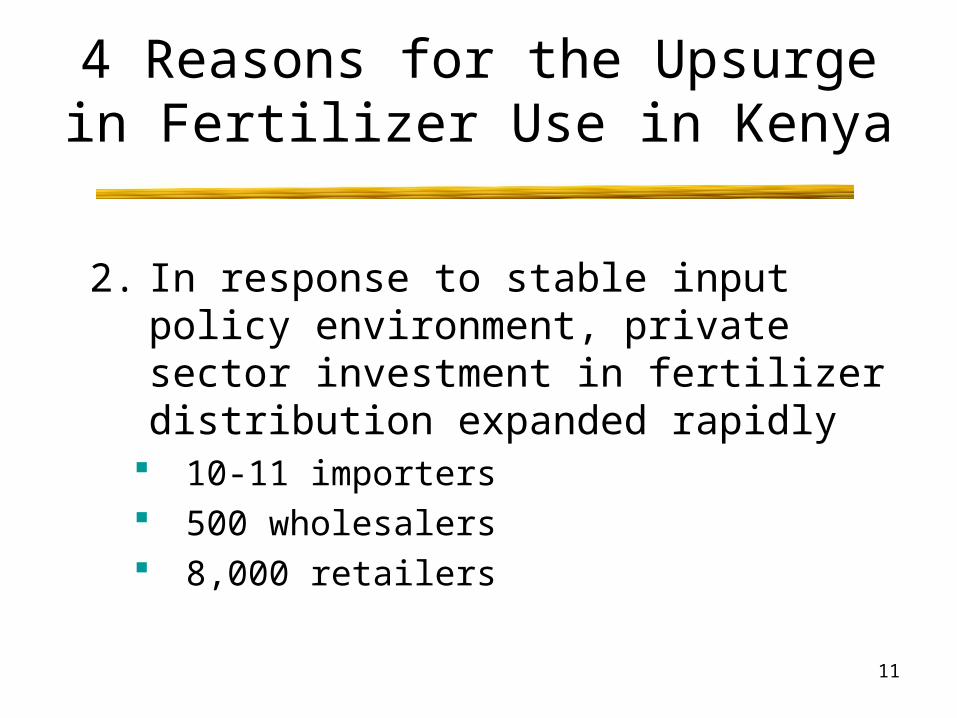
4 Reasons for the Upsurge in Fertilizer Use in Kenya
2. In response to stable input policy environment, private sector investment in fertilizer distribution expanded rapidly
10-11 importers 500 wholesalers 8,000 retailers
12
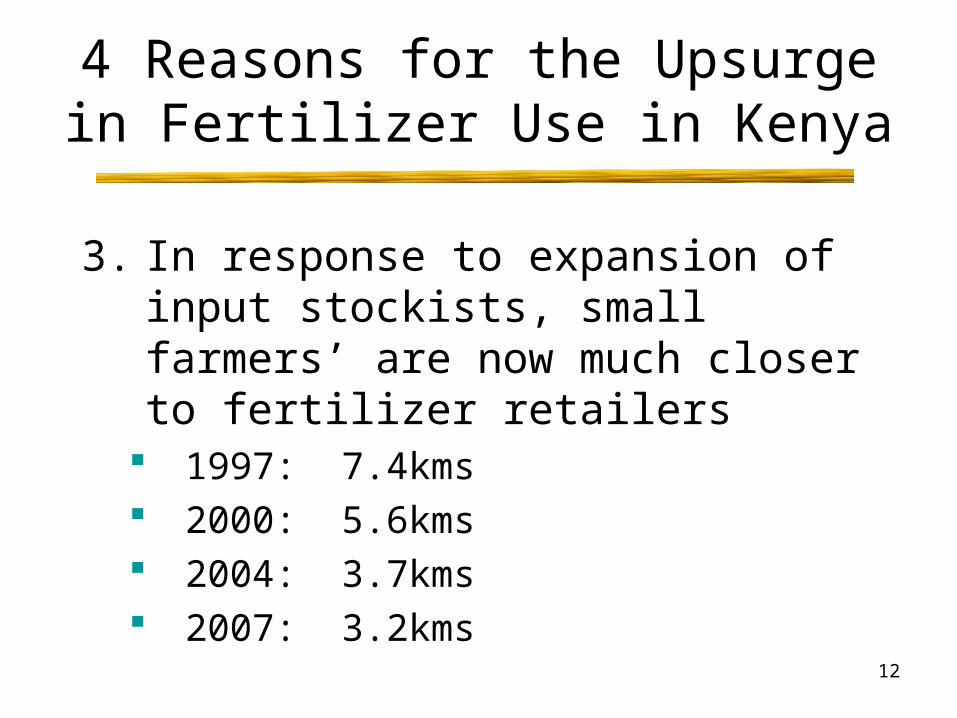
4 Reasons for the Upsurge in Fertilizer Use in Kenya
3. In response to expansion of input stockists, small farmers’ are now much closer to fertilizer retailers
1997: 7.4kms 2000: 5.6kms 2004: 3.7kms 2007: 3.2kms
13
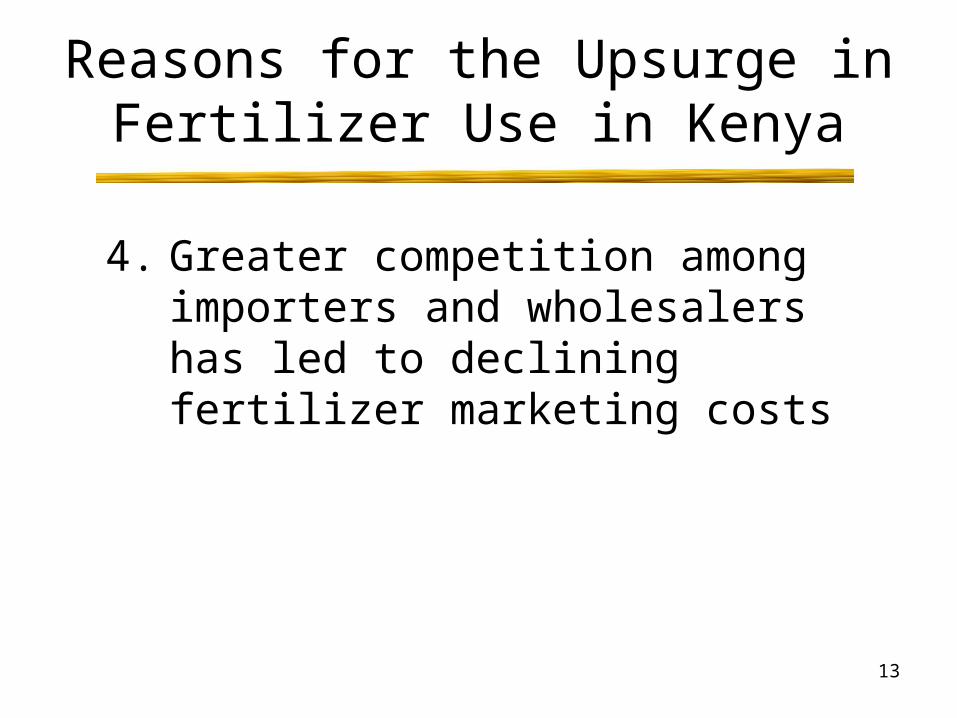
Reasons for the Upsurge in Fertilizer Use in Kenya
4. Greater competition among importers and wholesalers has led to declining fertilizer marketing costs

14
Price of DAP (Di-Ammonium Phosphate) in Mombasa and Nakuru (nominal Shillings per 50kg bag)
0
1000
2000
3000
4000
1990 1992 1994 1996 1998 2000 2002 2004 2006 2008
nom
inal
Ksh
per
50k
g ba
g
Nakuru, wholesale
Mombasa, cif
15
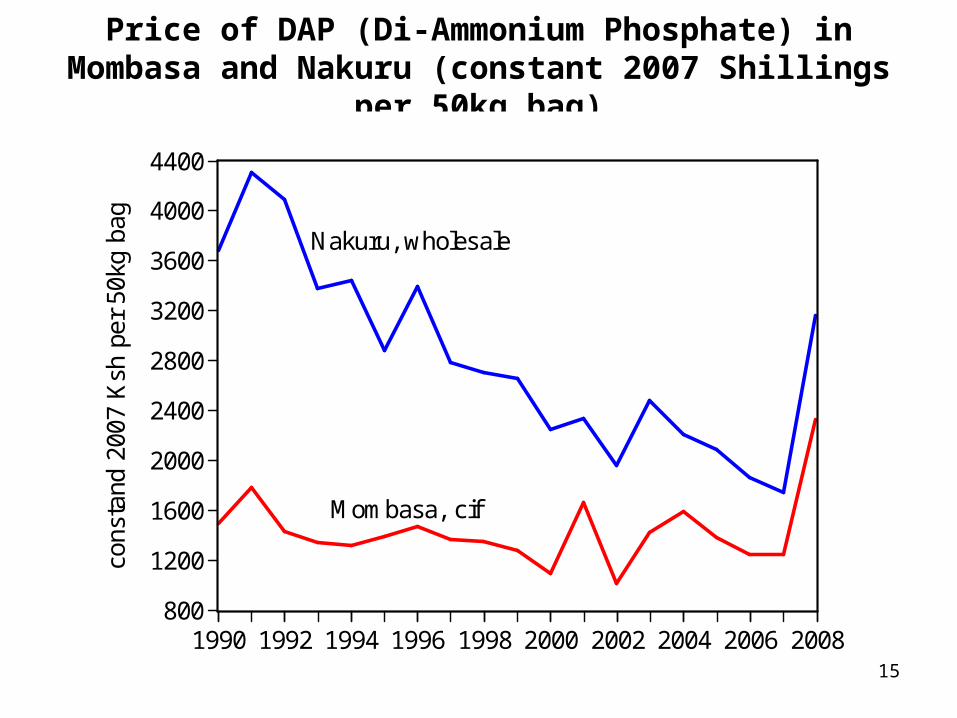
Price of DAP (Di-Ammonium Phosphate) in Mombasa and Nakuru (constant 2007 Shillings per 50kg bag)
0
1000
2000
3000
4000
1990 1992 1994 1996 1998 2000 2002 2004 2006 2008
nom
inal
Ksh
per
50k
g ba
g
Nakuru, wholesale
Mombasa, cif
800
1200
1600
2000
2400
2800
3200
3600
4000
4400
1990 1992 1994 1996 1998 2000 2002 2004 2006 2008
cons
tand
200
7 K
sh p
er 5
0kg
bag
Nakuru, wholesale
Mombasa, cif
16
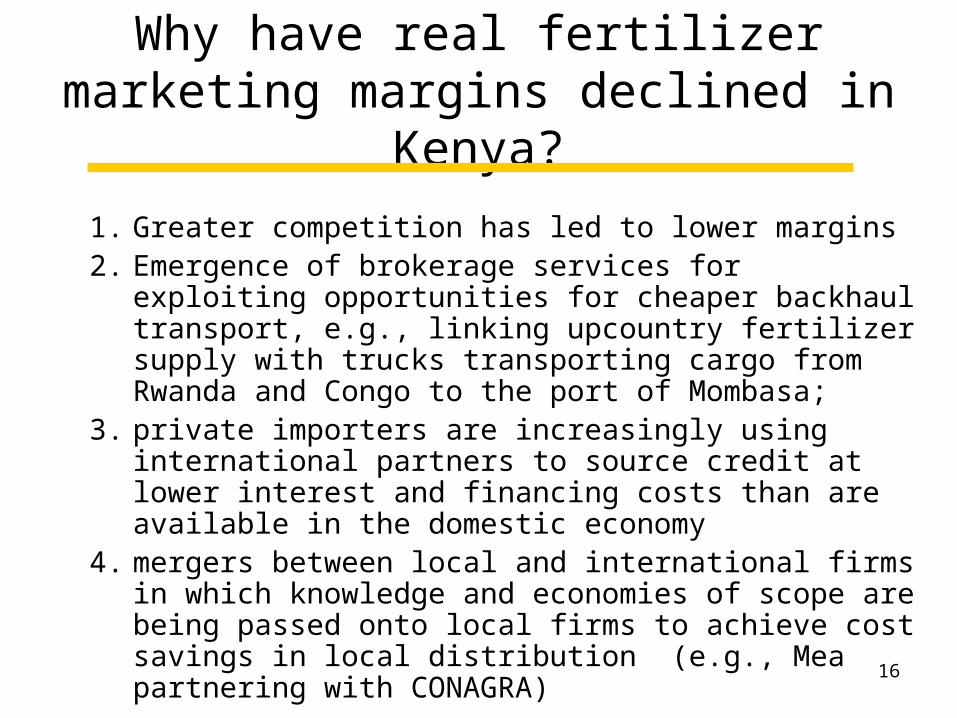
Why have real fertilizer marketing margins declined in Kenya?
1. Greater competition has led to lower margins2. Emergence of brokerage services for exploiting
opportunities for cheaper backhaul transport, e.g., linking upcountry fertilizer supply with trucks transporting cargo from Rwanda and Congo to the port of Mombasa;
3. private importers are increasingly using international partners to source credit at lower interest and financing costs than are available in the domestic economy
4. mergers between local and international firms in which knowledge and economies of scope are being passed onto local firms to achieve cost savings in local distribution (e.g., Mea partnering with CONAGRA)
17
Objective 3
Household characteristics associated with fertilizer use
18
02
04
06
08
01
00
0 10 20 30 40Total acres
Scatter lowess
Table 1a: Zone 1 Fertilizer rate vs. Household Acres
05
01
00
15
02
00
0 10 20 30 40Total acres
Scatter lowess
Table 1a: Zone 2 Fertilizer rate vs. Household Acres
05
01
00
15
02
00
Fe
rtili
zer
rate
pe
r a
cre
0 10 20 30 40Total acres
Scatter lowess
Table 1a: Zone 3 Fertilizer rate vs. Household Acres
01
00
20
03
00
Fe
rtili
zer
rate
pe
r a
cre
0 10 20 30 40Total acres
Scatter lowess
Table 1a: Zone 4 Fertilizer rate vs. Household Acres
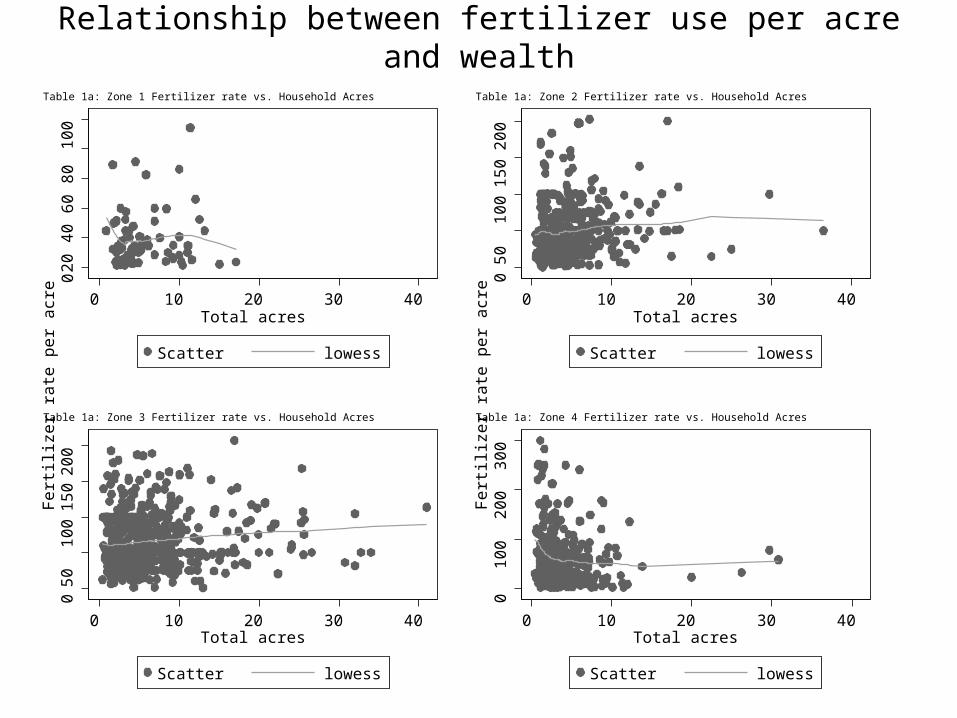
Relationship between fertilizer use per acre and wealth
19
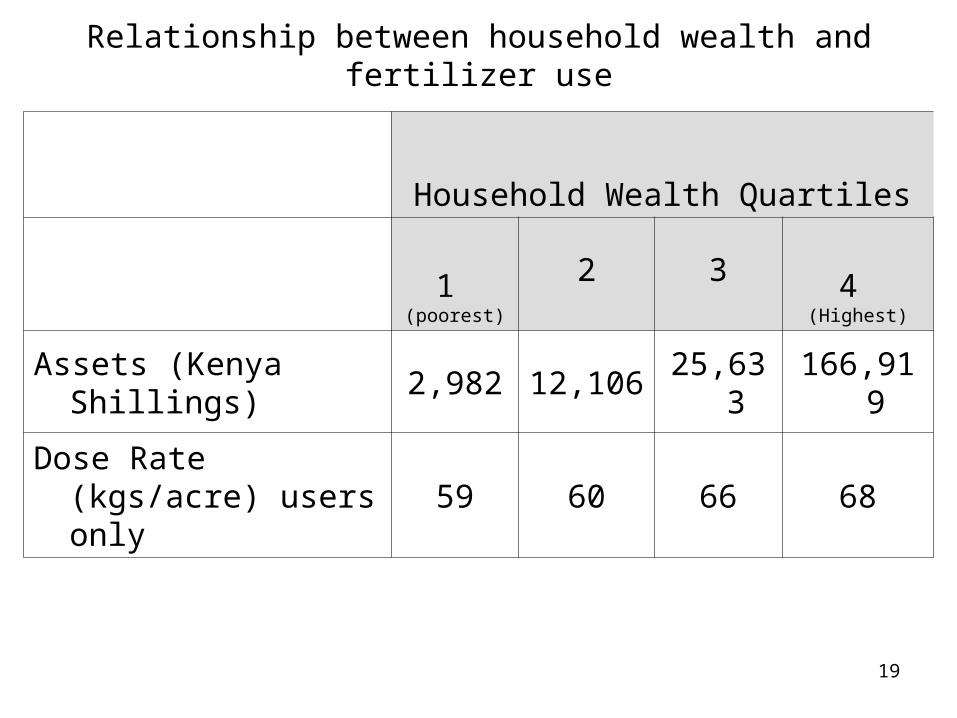
Relationship between household wealth and fertilizer use
Household Wealth Quartiles
1 (poorest)
2 3 4 (Highest)
Assets (Kenya Shillings) 2,982 12,106 25,633 166,919
Dose Rate (kgs/acre) users only
59 60 66 68
20
% of Small-scale Farmers Using Fertilizer on Maize
Agro-regional zone 1996 1997 2000 2004 2007
% of households using fertilizer on maize
Coastal Lowlands 0 0 3 4 14
Eastern Lowlands 21 27 25 47 43
Western Lowlands 2 1 5 5 13
Western Transitional 39 41 70 71 81
High-Pot. Maize Zone 85 84 90 87 91
Western Highlands 81 75 91 91 95
Central Highlands 88 90 90 91 93
Marginal Rain Shadow 6 6 12 11 16
Total Sample 56 58 64 66 70
21
Objective 4
Impact on maize yields
22
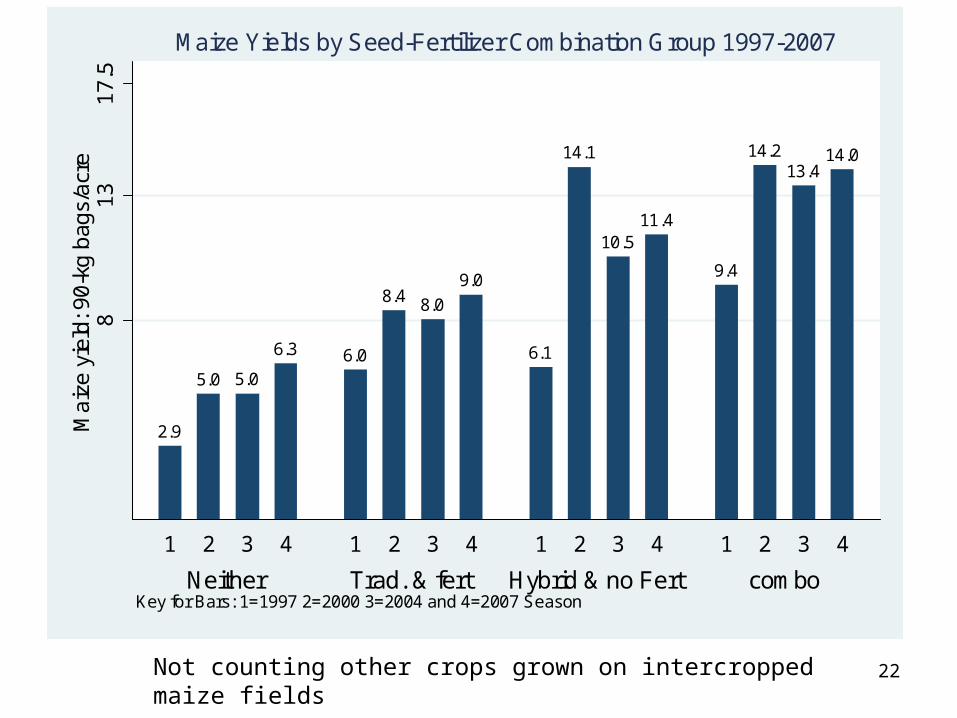
2.9
5.0 5.0
6.3 6.0
8.4 8.0
9.0
6.1
14.1
10.511.4
9.4
14.213.4
14.0
81
31
7.5
Ma
ize
yie
ld: 9
0-kg
bag
s/a
cre
Neither Trad. & fert Hybrid & no Fert combo
1 2 3 4 1 2 3 4 1 2 3 4 1 2 3 4
Key for Bars: 1=1997 2=2000 3=2004 and 4=2007 Season
Maize Yields by Seed-Fertilizer Combination Group 1997-2007
Not counting other crops grown on intercropped maize fields
23
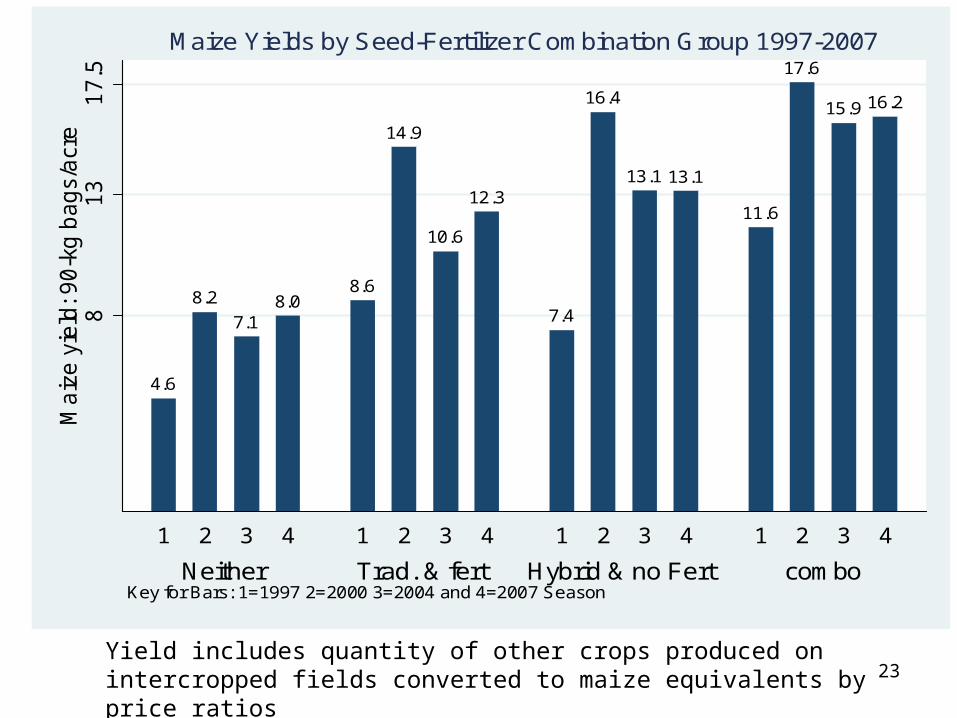
4.6
8.2
7.18.0
8.6
14.9
10.6
12.3
7.4
16.4
13.1 13.1
11.6
17.6
15.9 16.28
13
17.5
Ma
ize
yie
ld: 9
0-k
g b
ag
s/a
cre
Neither Trad. & fert Hybrid & no Fert combo
1 2 3 4 1 2 3 4 1 2 3 4 1 2 3 4
Key for Bars: 1=1997 2=2000 3=2004 and 4=2007 Season
Maize Yields by Seed-Fertilizer Combination Group 1997-2007
Yield includes quantity of other crops produced on intercropped fields converted to maize equivalents by price ratios
24
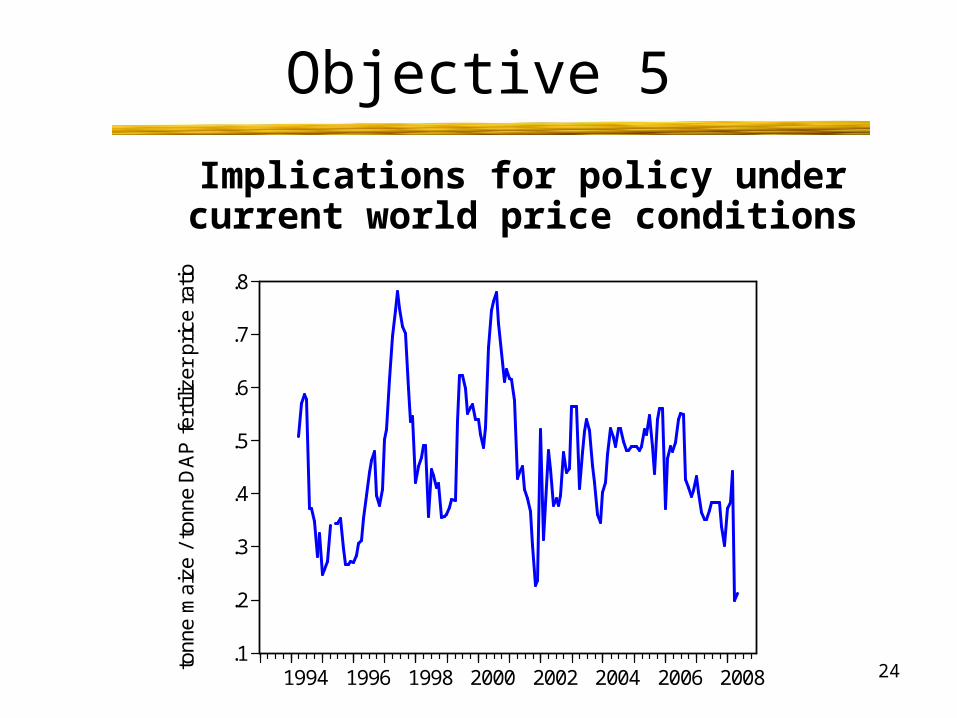
Objective 5
Implications for policy under current world price conditions
.1
.2
.3
.4
.5
.6
.7
.8
1994 1996 1998 2000 2002 2004 2006 2008tonn
e m
aize
/ t
onne
DA
P f
ertil
izer
pri
ce r
atio
25
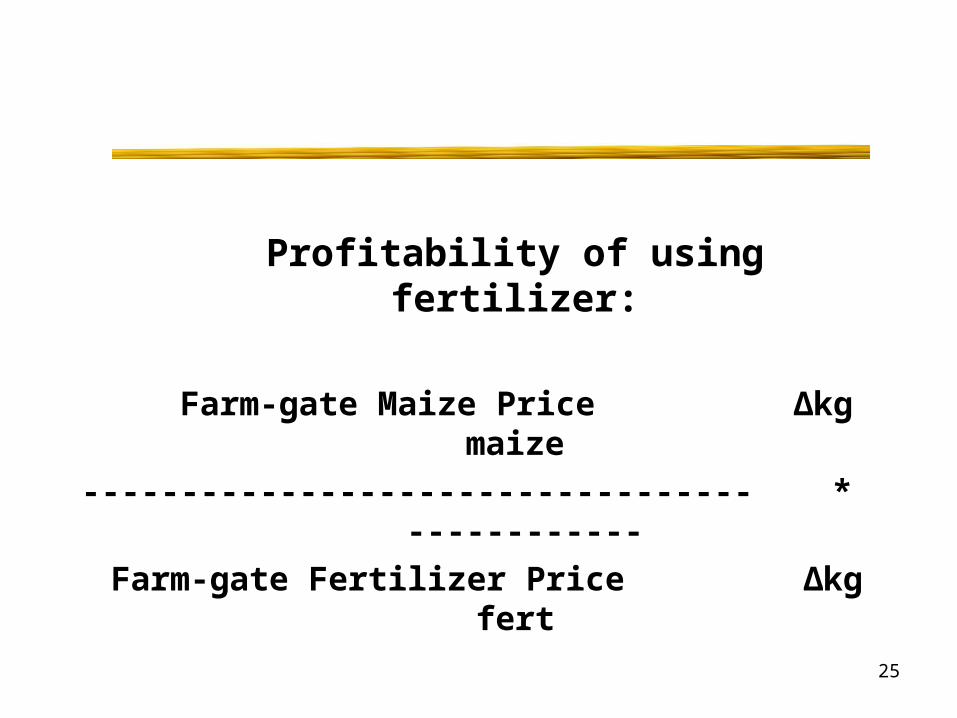
Profitability of using fertilizer:
Farm-gate Maize Price Δkg maize
---------------------------------- * ------------
Farm-gate Fertilizer Price Δkg fert
26
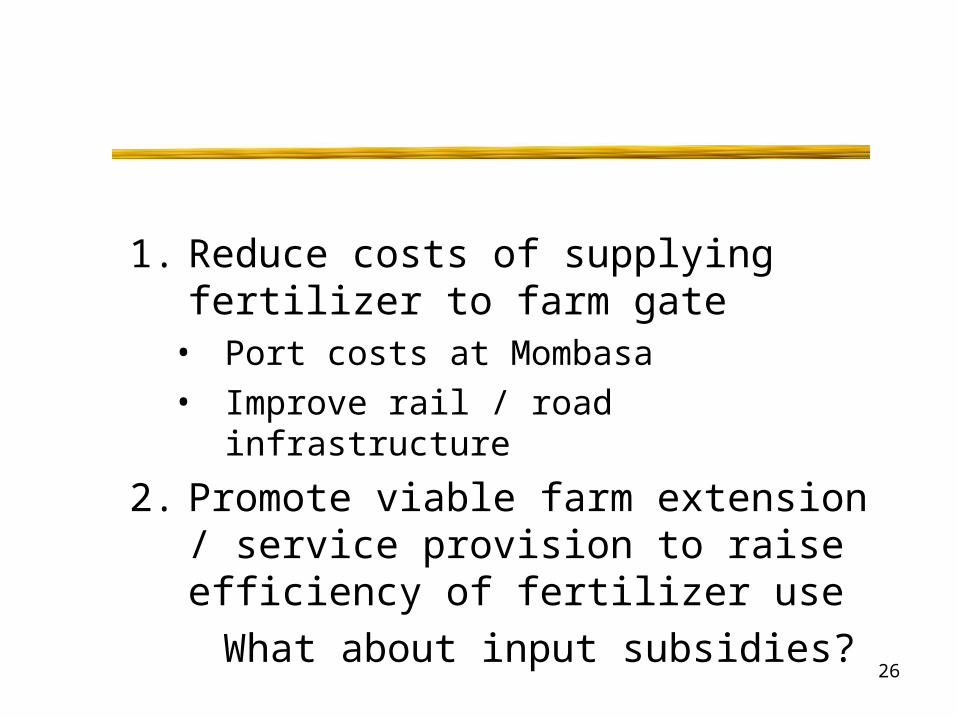
1. Reduce costs of supplying fertilizer to farm gate
• Port costs at Mombasa• Improve rail / road infrastructure
2. Promote viable farm extension / service provision to raise efficiency of fertilizer use
What about input subsidies?

27
Summary of research evidence about fertilizer subsidies in Africa:
can help to raise production, but little sustained benefit after subsidies are withdrawn
(e.g., Zambia, Malawi) Benefits tend to be disproportionately
captured by better-off farmers, unless near universal coverage
Costly – foregone payoffs from alternative public investments
28
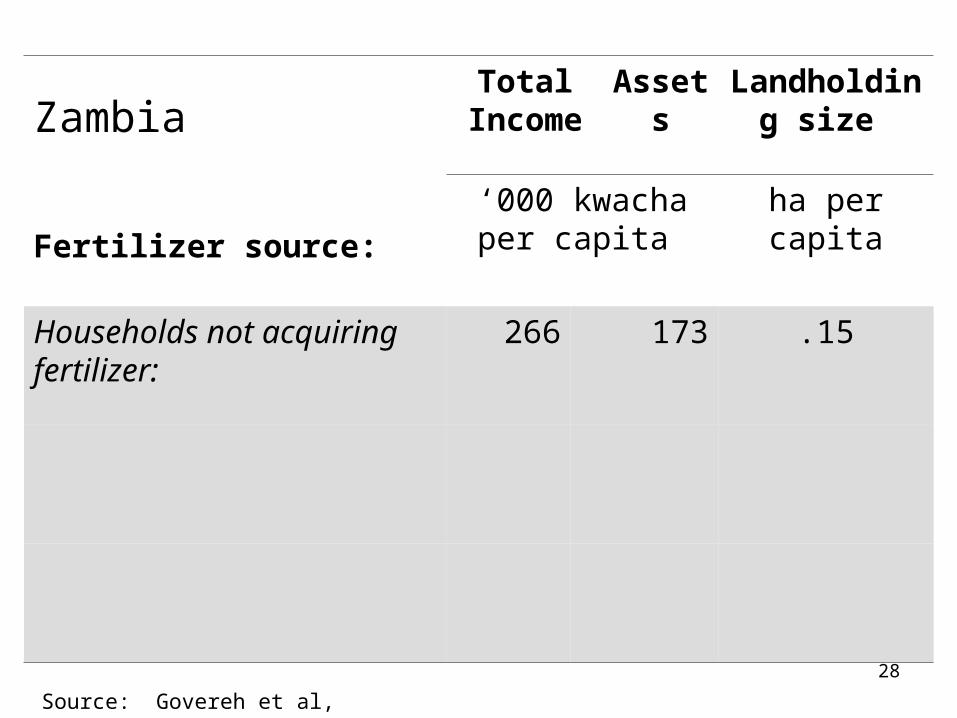
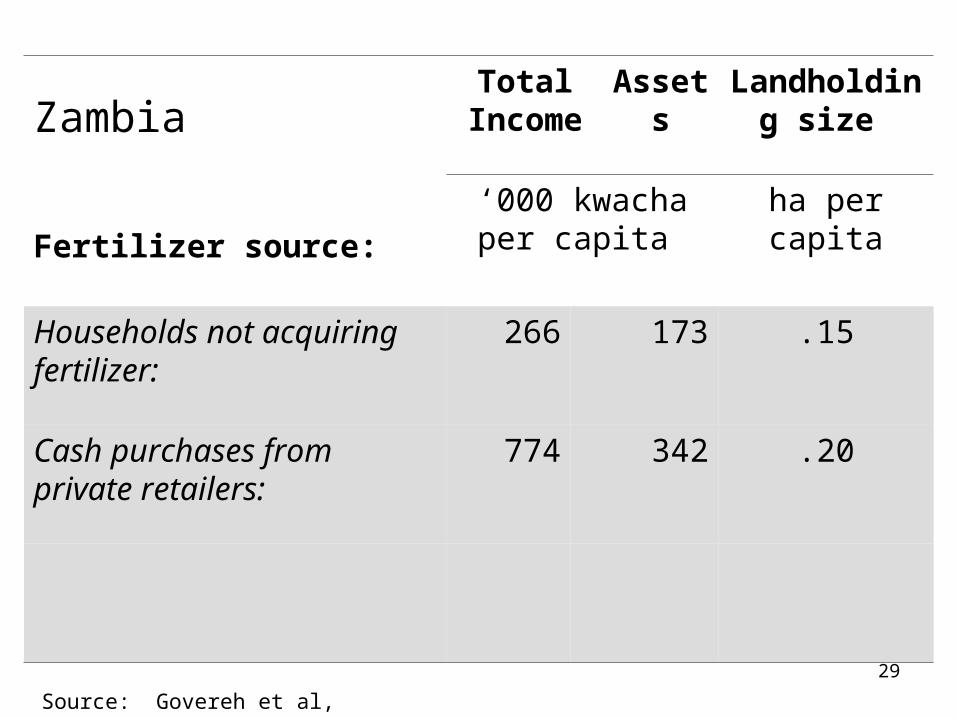
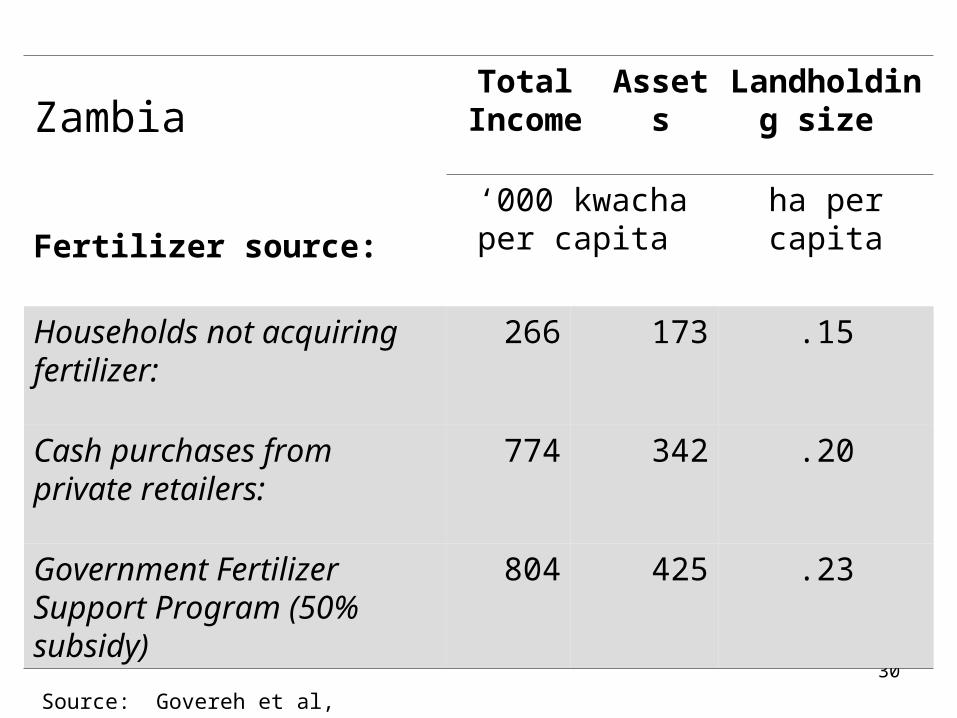
ZambiaTotal
IncomeAssets Landholding
size
Fertilizer source:
‘000 kwacha per capita
ha per capita
Households not acquiring fertilizer:
266 173 .15
Source: Govereh et al, 2006
29
ZambiaTotal
IncomeAssets Landholding
size
Fertilizer source:
‘000 kwacha per capita
ha per capita
Households not acquiring fertilizer:
266 173 .15
Cash purchases from private retailers:
774 342 .20
Source: Govereh et al, 2006
30
ZambiaTotal
IncomeAssets Landholding
size
Fertilizer source:
‘000 kwacha per capita
ha per capita
Households not acquiring fertilizer:
266 173 .15
Cash purchases from private retailers:
774 342 .20
Government Fertilizer Support Program (50% subsidy)
804 425 .23
Source: Govereh et al, 2006

31
Budget allocation to Agricultural Sector in Zambia: ZMK465 million in 2005
Personnel Emoluments20%
Operational funds11%
Irrigation Development3%
Infrastructure2%
Food Security Pack & EDRP12%
Food Reserve Agency Maize Marketing
15%
Fertilizer Support Program37%
32
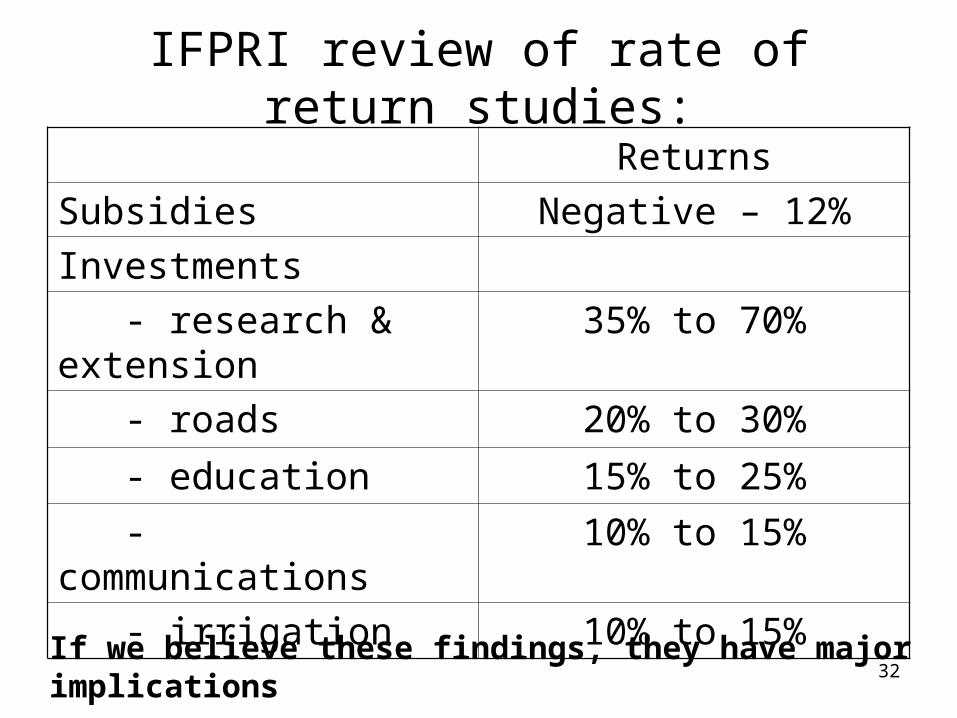
IFPRI review of rate of return studies:
Returns
Subsidies Negative – 12%
Investments
- research & extension 35% to 70%
- roads 20% to 30%
- education 15% to 25%
- communications 10% to 15%
- irrigation 10% to 15%
If we believe these findings, they have major implications

33
If the decision has already been made to provide input subsidies:
Four insights (from experience in Malawi and Zambia):
34
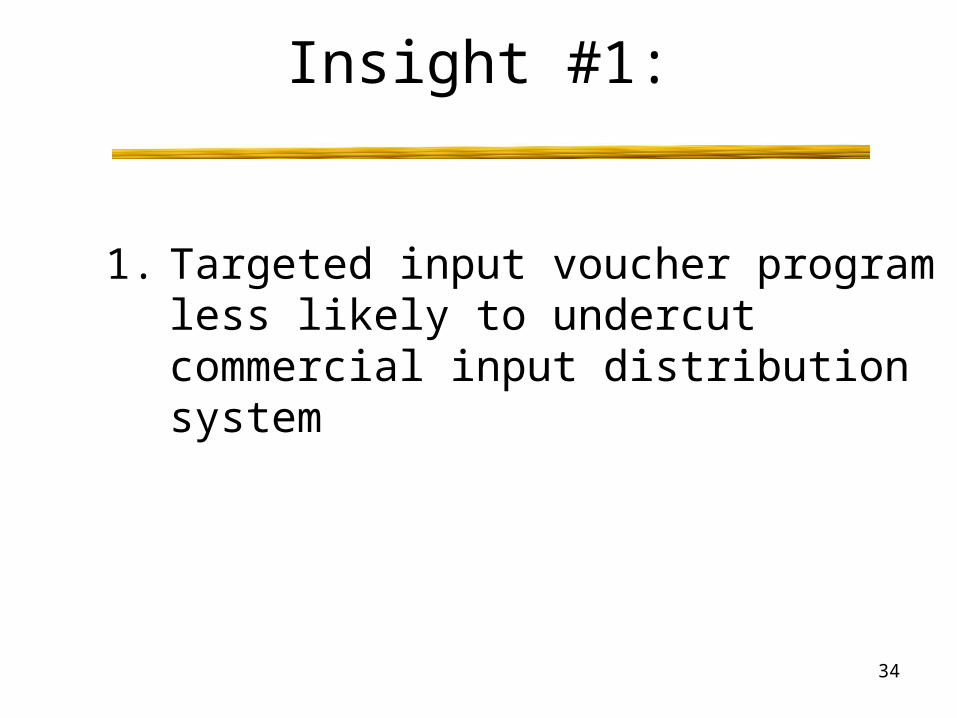
Insight #1:
1. Targeted input voucher program less likely to undercut commercial input distribution system
35
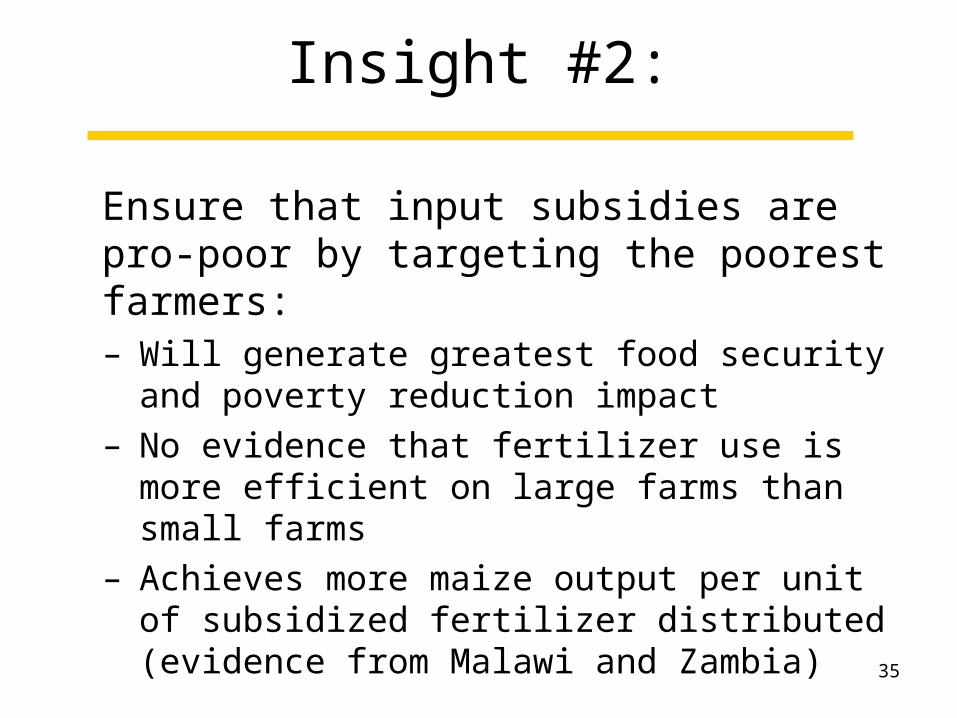
Insight #2:
Ensure that input subsidies are pro-poor by targeting the poorest farmers:– Will generate greatest food security and
poverty reduction impact– No evidence that fertilizer use is more
efficient on large farms than small farms– Achieves more maize output per unit of
subsidized fertilizer distributed (evidence from Malawi and Zambia)
36
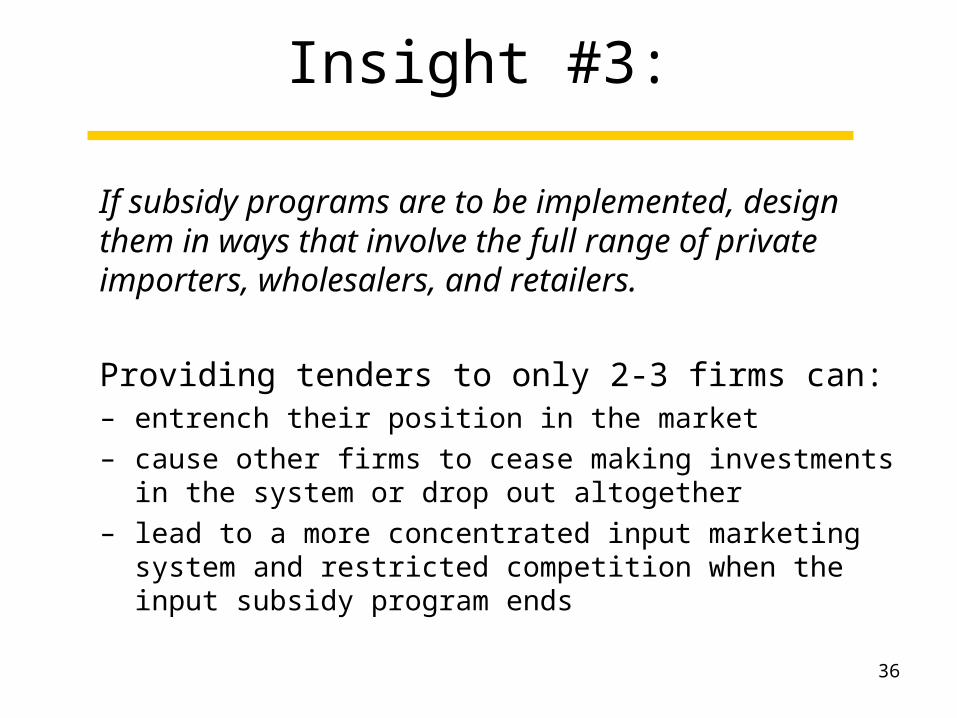
Insight #3:
If subsidy programs are to be implemented, design them in ways that involve the full range of private importers, wholesalers, and retailers.
Providing tenders to only 2-3 firms can: – entrench their position in the market– cause other firms to cease making investments in the
system or drop out altogether– lead to a more concentrated input marketing system
and restricted competition when the input subsidy program ends
37
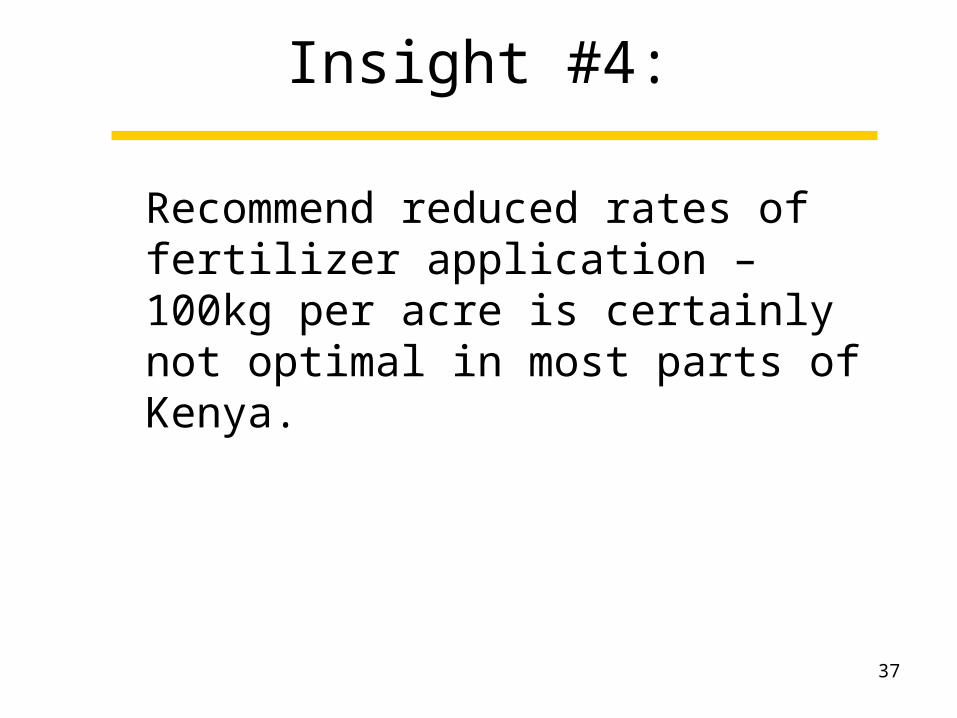
Insight #4:
Recommend reduced rates of fertilizer application – 100kg per acre is certainly not optimal in most parts of Kenya.
38
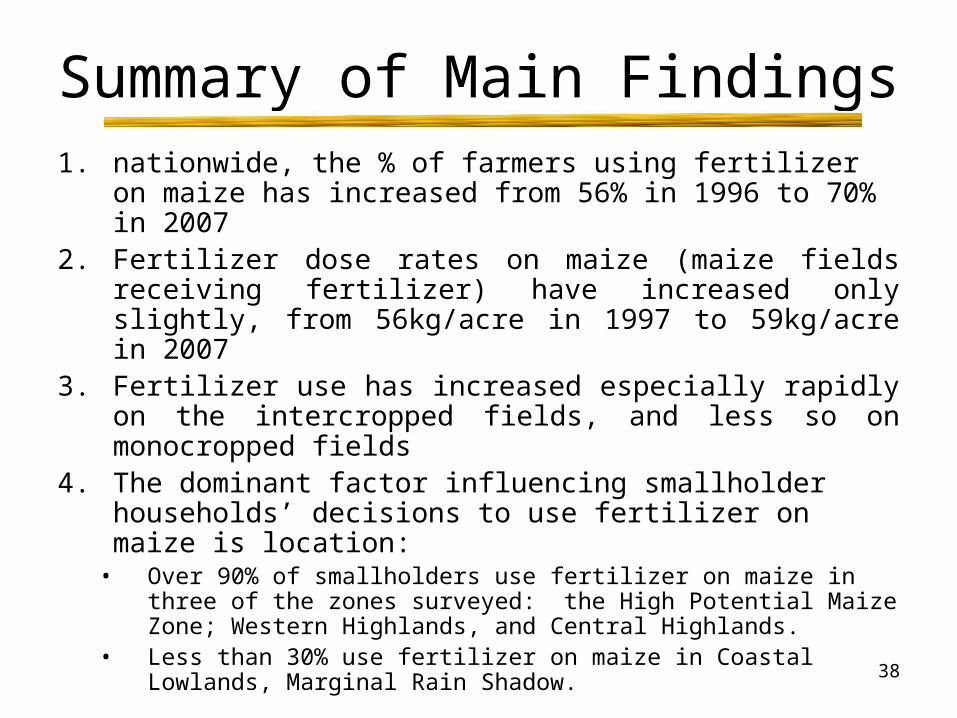
Summary of Main Findings1. nationwide, the % of farmers using fertilizer on maize
has increased from 56% in 1996 to 70% in 20072. Fertilizer dose rates on maize (maize fields receiving
fertilizer) have increased only slightly, from 56kg/acre in 1997 to 59kg/acre in 2007
3. Fertilizer use has increased especially rapidly on the intercropped fields, and less so on monocropped fields
4. The dominant factor influencing smallholder households’ decisions to use fertilizer on maize is location:
• Over 90% of smallholders use fertilizer on maize in three of the zones surveyed: the High Potential Maize Zone; Western Highlands, and Central Highlands.
• Less than 30% use fertilizer on maize in Coastal Lowlands, Marginal Rain Shadow.
39
Summary of Main Findings
5. Total area under maize has remained largely constant over the decade
6. maize yields increased by 20% between 1997-2007 period, which is correlated with the rise in fertilizer use.
7. Paying attention to the different types of maize production technologies and maize cultivation techniques is important to carefully control for confounding factors when examining trends in maize yields in Kenya
41
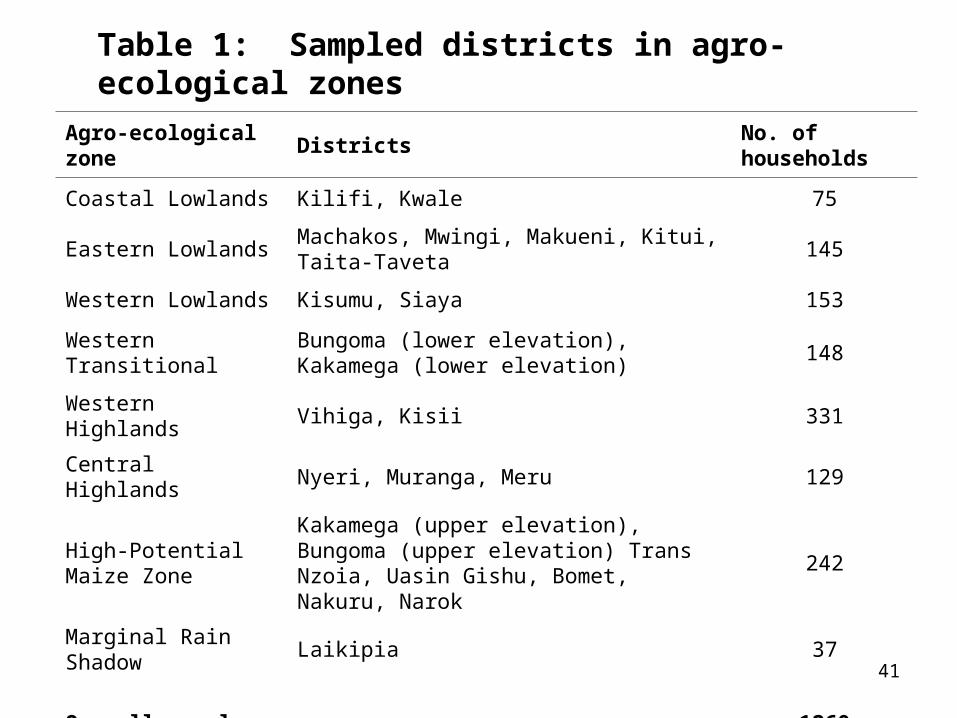
Table 1: Sampled districts in agro-ecological zones
Agro-ecological zone Districts No. of households
Coastal Lowlands Kilifi, Kwale 75
Eastern Lowlands Machakos, Mwingi, Makueni, Kitui, Taita-Taveta 145
Western Lowlands Kisumu, Siaya 153
Western TransitionalBungoma (lower elevation), Kakamega (lower elevation)
148
Western Highlands Vihiga, Kisii 331
Central Highlands Nyeri, Muranga, Meru 129
High-Potential Maize Zone
Kakamega (upper elevation), Bungoma (upper elevation) Trans Nzoia, Uasin Gishu, Bomet, Nakuru, Narok
242
Marginal Rain Shadow Laikipia 37
Overall sample 1260