Embed Size (px)
Citation preview
Trends in HPC Power Metrics and where to from here?
Ramkumar Nagappan
System Architect
Technical Computing Group System Architecture and Pathfinding
Intel
September 22, 2015
Workshop on HPC Power Management: Measuring Effectiveness, Annapolis, Maryland
INFORMATION IN THIS DOCUMENT IS PROVIDED IN CONNECTION WITH INTEL PRODUCTS. NO LICENSE, EXPRESS OR IMPLIED, BY ESTOPPEL OR OTHERWISE, TO ANY INTELLECTUAL PROPERTY RIGHTS IS GRANTED BY THIS DOCUMENT. EXCEPT AS PROVIDED IN INTEL'S TERMS AND CONDITIONS OF SALE FOR SUCH PRODUCTS, INTEL ASSUMES NO LIABILITY WHATSOEVER AND INTEL DISCLAIMS ANY EXPRESS OR IMPLIED WARRANTY, RELATING TO SALE AND/OR USE OF INTEL PRODUCTS INCLUDING LIABILITY OR WARRANTIES RELATING TO FITNESS FOR A PARTICULAR PURPOSE, MERCHANTABILITY, OR INFRINGEMENT OF ANY PATENT, COPYRIGHT OR OTHER INTELLECTUAL PROPERTY RIGHT.UNLESS OTHERWISE AGREED IN WRITING BY INTEL, THE INTEL PRODUCTS ARE NOT DESIGNED NOR INTENDED FOR ANY APPLICATION IN WHICH THE FAILURE OF THE INTEL PRODUCT COULD CREATE A SITUATION WHERE PERSONAL INJURY OR DEATH MAY OCCUR.Intel may make changes to specifications and product descriptions at any time, without notice. Designers must not rely on the absence or characteristics of any features or instructions marked "reserved" or "undefined." Intel reserves these for future definition and shall have no responsibility whatsoever for conflicts or incompatibilities arising from future changes to them. The information here is subject to change without notice. Do not finalize a design with this information. The products described in this document may contain design defects or errors known as errata which may cause the product to deviate from published specifications. Current characterized errata are available on request. This document contains information on products in the design phase of development. All products, computer systems, dates, and figures specified are preliminary based on current expectations, and are subject to change without notice. Intel product plans in this presentation do not constitute Intel plan of record product roadmaps. Please contact your Intel representative to obtain Intel’s current plan of record product roadmaps. Software and workloads used in performance tests may have been optimized for performance only on Intel microprocessors. Performance tests, such as STREAM , NPB, NAMD and Linpack, are measured using specific computer systems, components, software, operations and functions. Any change to any of those factors may cause the results to vary. You should consult other information and performance tests to assist you in fully evaluating your contemplated purchases, including the performance of that product when combined with other products.Intel does not control or audit the design or implementation of third party benchmarks or Web sites referenced in this document. Intel encourages all of its customers to visit the referenced Web sites or others where similar performance benchmarks are reported and confirm whether the referenced benchmarks are accurate and reflect performance of systems available for purchase. Relative performance is calculated by assigning a baseline value of 1.0 to one benchmark result, and then dividing the actual benchmark result for the baseline platform into each of the specific benchmark results of each of the other platforms, and assigning them a relative performance number that correlates with the performance improvements reported.
Intel, Xeon and the Intel logo are trademarks of Intel Corporation in the U.S. and other countries.
*Other names and brands may be claimed as the property of others
Copyright © 2014 Intel Corporation. All rights reserved.
Notices
2
Optimization NoticeOptimization Notice
Intel's compilers may or may not optimize to the same degree for non-Intel microprocessors for optimizations that are not unique to Intel microprocessors. These optimizations include SSE2, SSE3, and SSE3 instruction sets and other optimizations. Intel does not guarantee the availability, functionality, or effectiveness of any optimization on microprocessors not manufactured by Intel.
Microprocessor-dependent optimizations in this product are intended for use with Intel microprocessors. Certain optimizations not specific to Intel microarchitecture are reserved for Intel microprocessors. Please refer to the applicable product User and Reference Guides for more information regarding the specific instruction sets covered by this notice.
Notice revision #20110804
* Other names and brands may be claimed as the property of others. Copyright © 2014 Intel Corporation. All rights reserved.
Agenda• Current trends in power metrics
• PUE, ITUE, TUE, Green 500
• Current Trends in Energy efficiency
• CPU and System Energy Efficiency
• Challenges in measuring energy efficiency metrics
• Upcoming new usage models
• System Power cap, Running jobs under power limit & Power ramp controls
• Do we need new metrics to improve energy efficiency?
• Summary
4
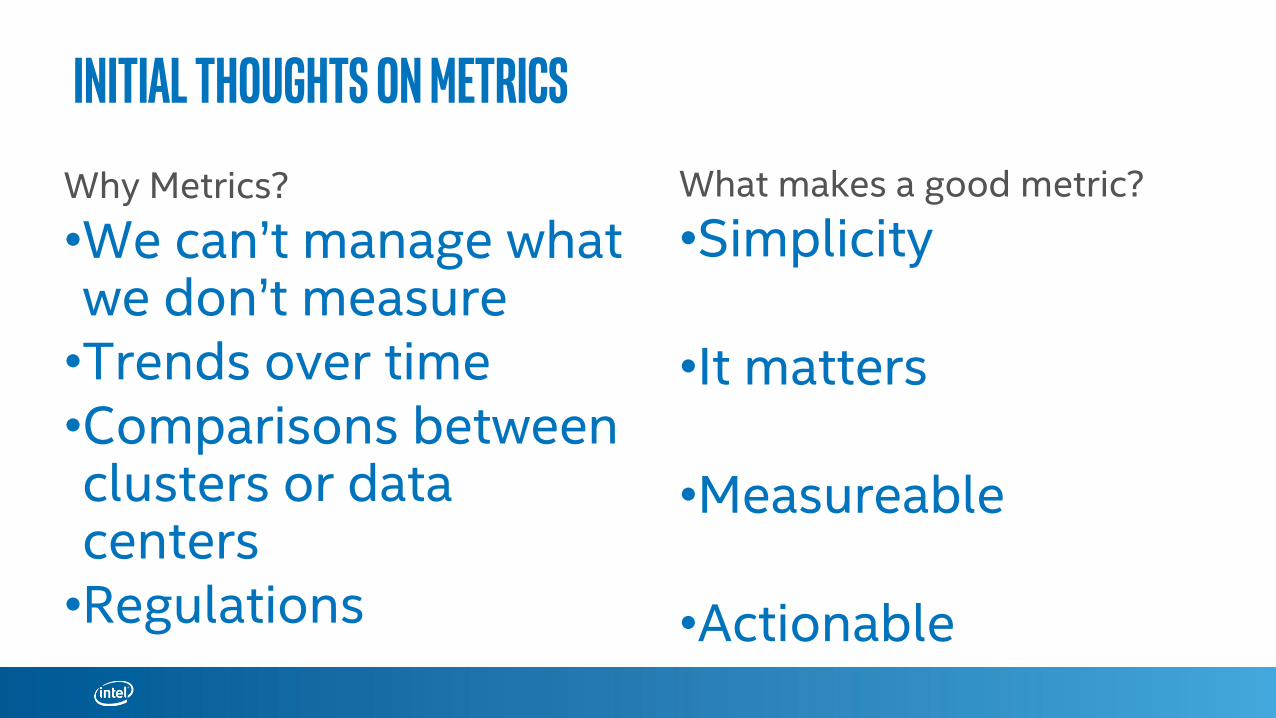
Initial Thoughts on Metrics
Why Metrics?
•We can’t manage what we don’t measure•Trends over time•Comparisons between clusters or data centers•Regulations
What makes a good metric?
•Simplicity
•It matters
•Measureable
•Actionable
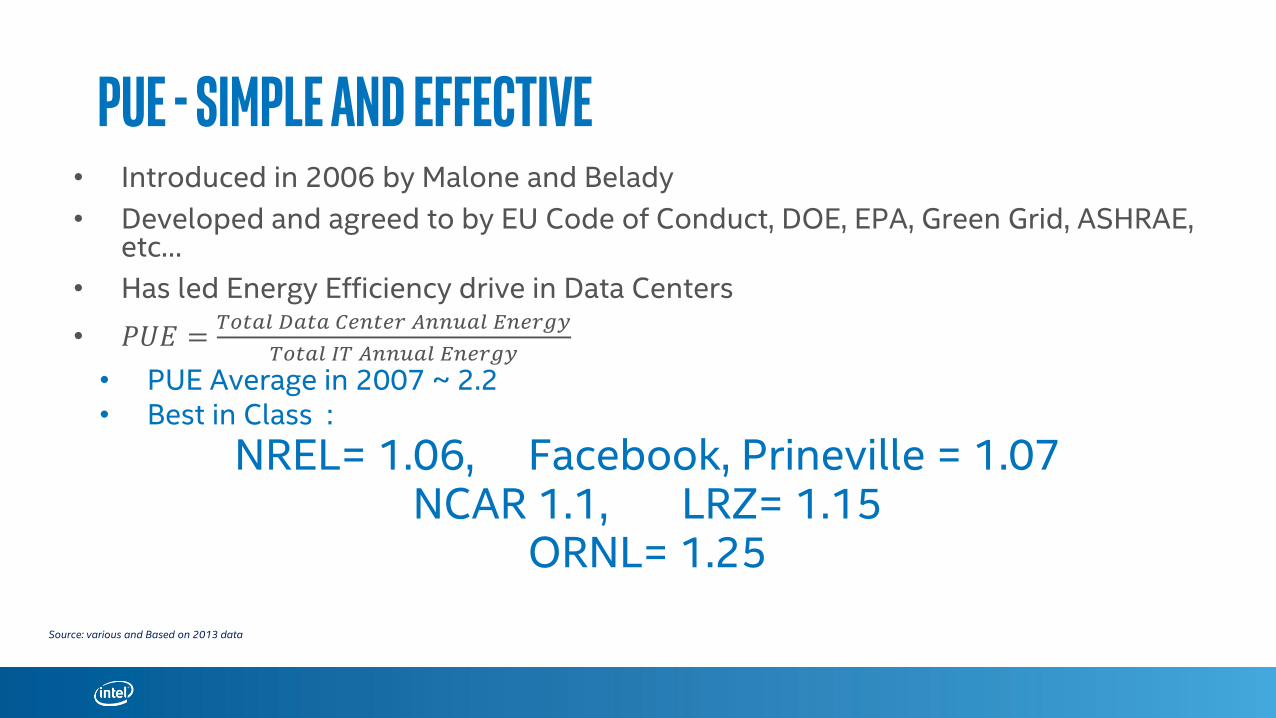
PUE - simple and effective• Introduced in 2006 by Malone and Belady
• Developed and agreed to by EU Code of Conduct, DOE, EPA, Green Grid, ASHRAE, etc…
• Has led Energy Efficiency drive in Data Centers
• 𝑃𝑈𝐸 =𝑇𝑜𝑡𝑎𝑙 𝐷𝑎𝑡𝑎 𝐶𝑒𝑛𝑡𝑒𝑟 𝐴𝑛𝑛𝑢𝑎𝑙 𝐸𝑛𝑒𝑟𝑔𝑦
𝑇𝑜𝑡𝑎𝑙 𝐼𝑇 𝐴𝑛𝑛𝑢𝑎𝑙 𝐸𝑛𝑒𝑟𝑔𝑦
• PUE Average in 2007 ~ 2.2• Best in Class :
NREL= 1.06, Facebook, Prineville = 1.07NCAR 1.1, LRZ= 1.15
ORNL= 1.25
Source: various and Based on 2013 data
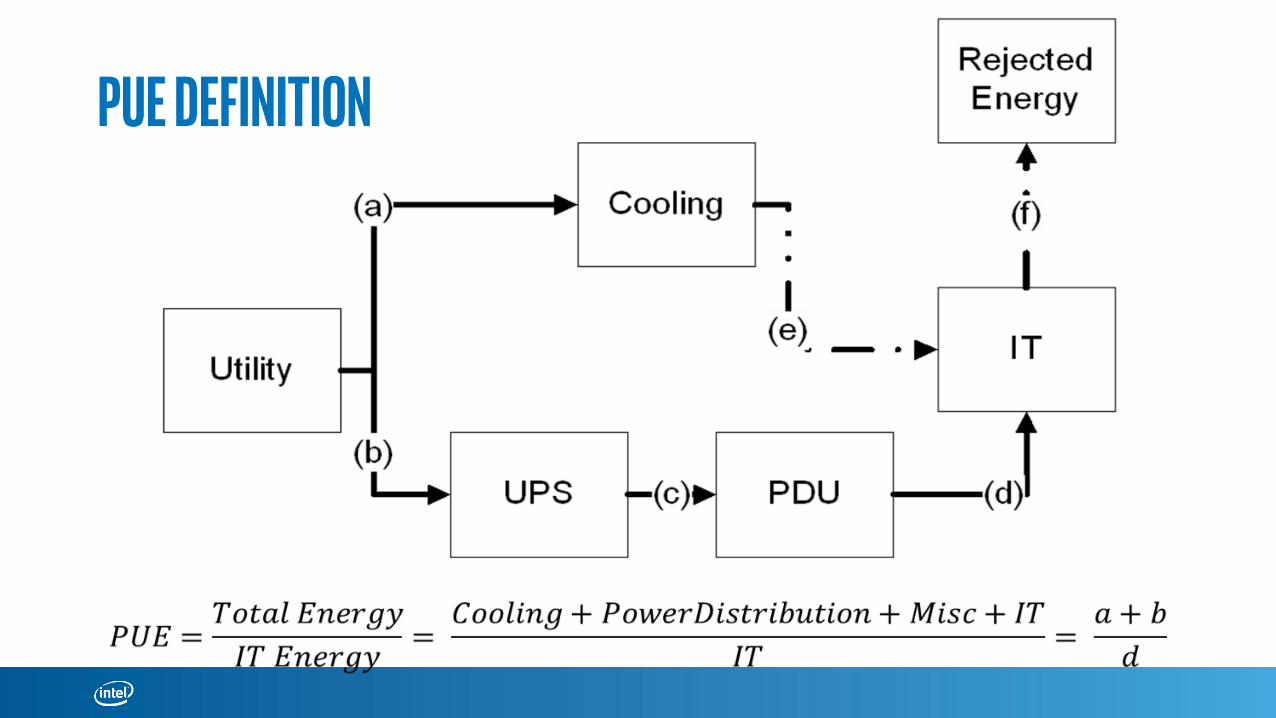
PUE Definition
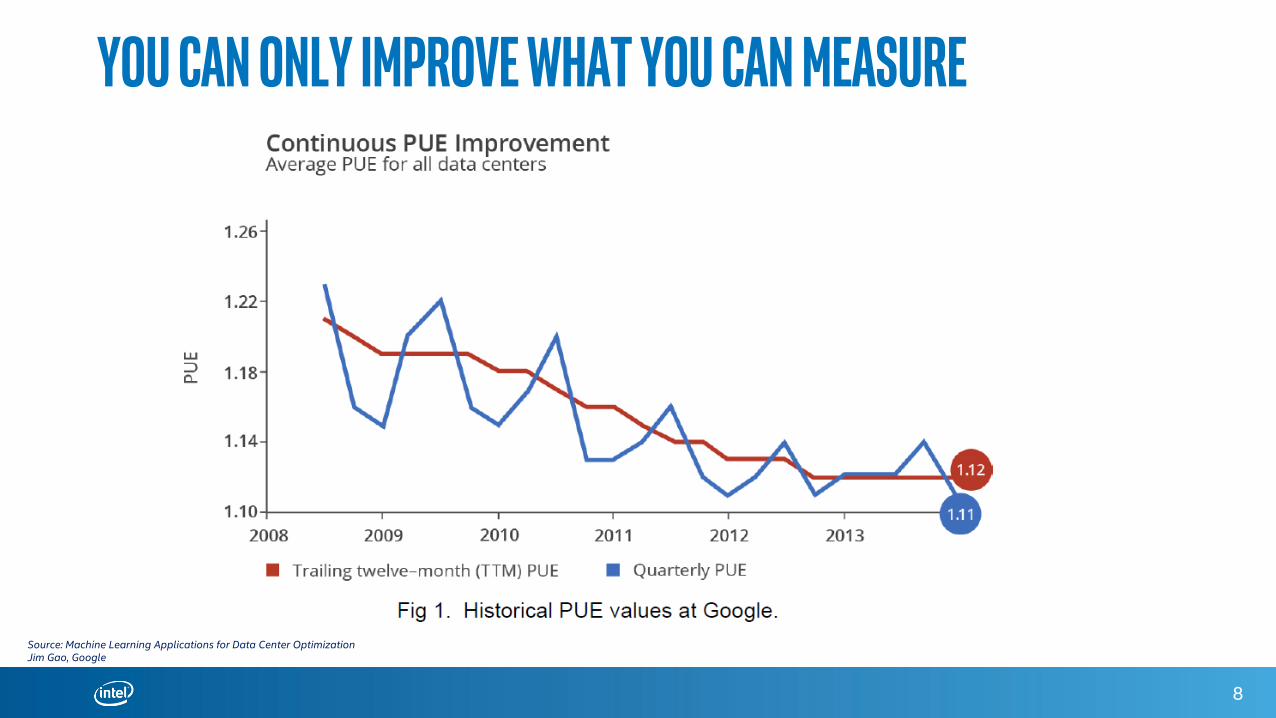
You can only improve what you can measure
8
Source: Machine Learning Applications for Data Center OptimizationJim Gao, Google
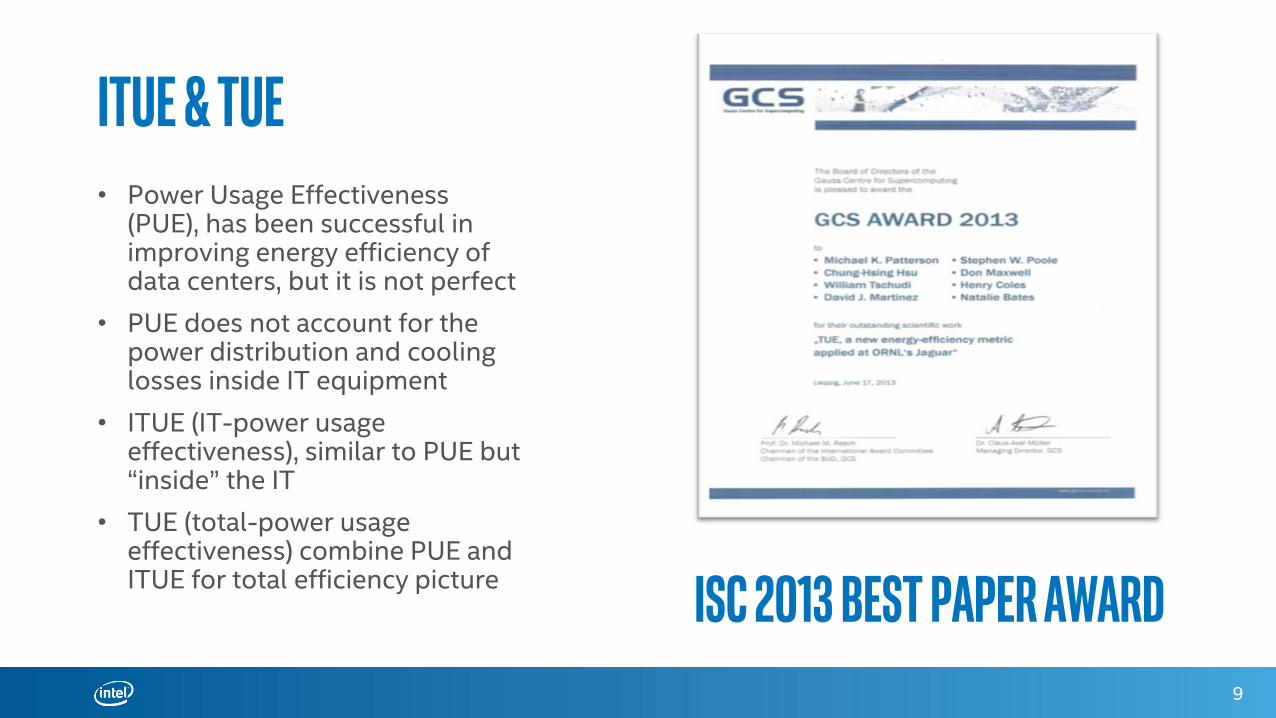
ITUE & TUE• Power Usage Effectiveness
(PUE), has been successful in improving energy efficiency of data centers, but it is not perfect
• PUE does not account for the power distribution and cooling losses inside IT equipment
• ITUE (IT-power usage effectiveness), similar to PUE but “inside” the IT
• TUE (total-power usage effectiveness) combine PUE and ITUE for total efficiency picture
9
ISC 2013 Best Paper Award
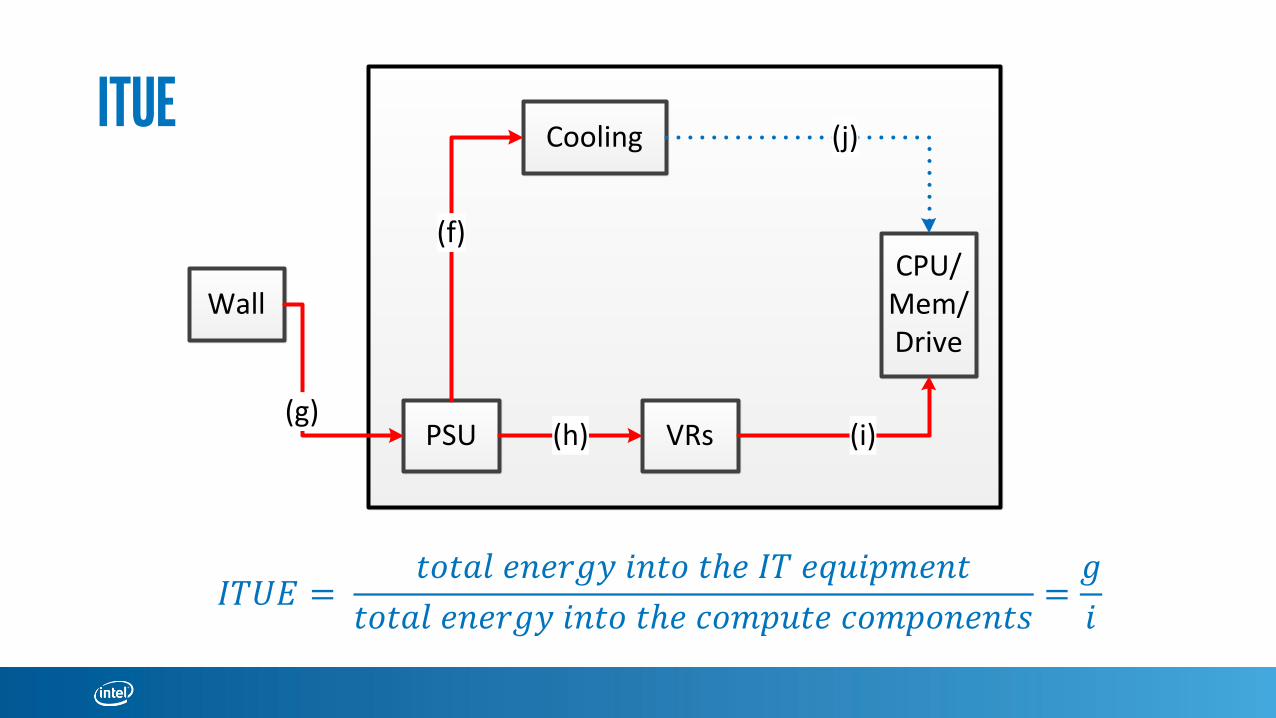
ITUE
𝐼𝑇𝑈𝐸 =𝑡𝑜𝑡𝑎𝑙 𝑒𝑛𝑒𝑟𝑔𝑦 𝑖𝑛𝑡𝑜 𝑡ℎ𝑒 𝐼𝑇 𝑒𝑞𝑢𝑖𝑝𝑚𝑒𝑛𝑡
𝑡𝑜𝑡𝑎𝑙 𝑒𝑛𝑒𝑟𝑔𝑦 𝑖𝑛𝑡𝑜 𝑡ℎ𝑒 𝑐𝑜𝑚𝑝𝑢𝑡𝑒 𝑐𝑜𝑚𝑝𝑜𝑛𝑒𝑛𝑡𝑠=𝑔
𝑖
Wall
Cooling
PSU VRs
CPU/Mem/Drive
(f)
(j)
(i)(h)(g)
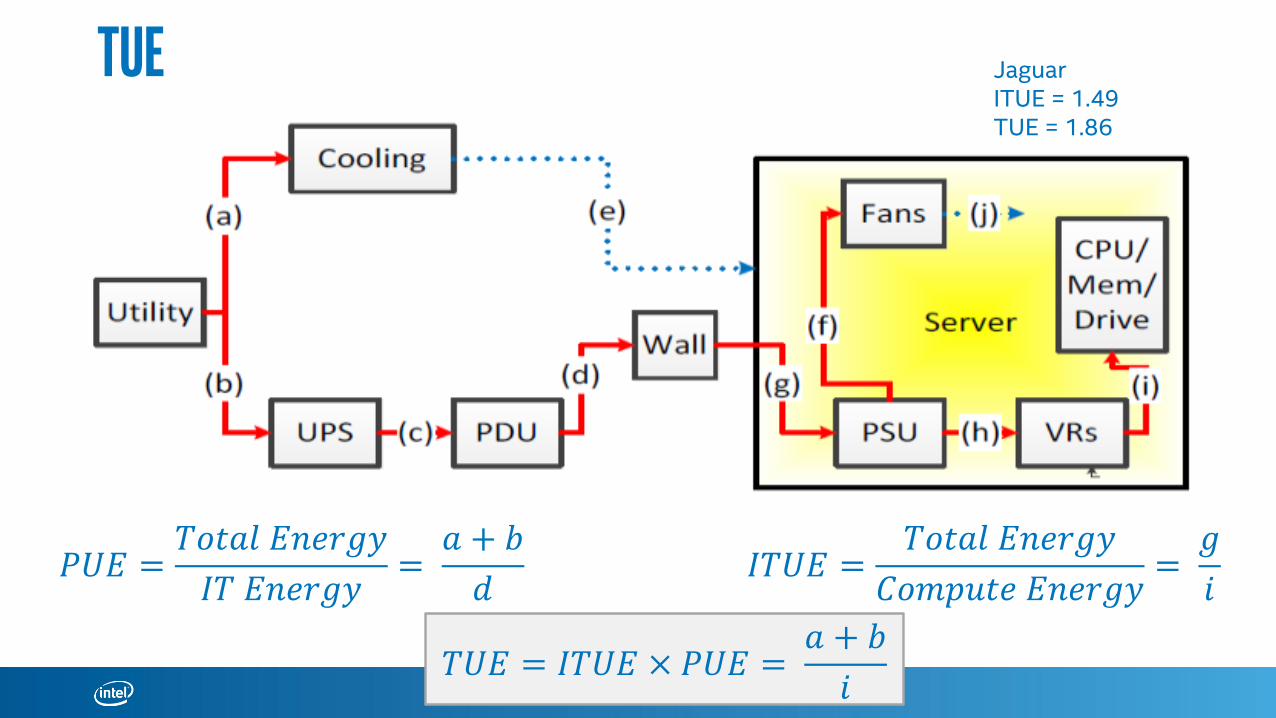
TUE
𝑃𝑈𝐸 =𝑇𝑜𝑡𝑎𝑙 𝐸𝑛𝑒𝑟𝑔𝑦
𝐼𝑇 𝐸𝑛𝑒𝑟𝑔𝑦=
𝑎 + 𝑏
𝑑𝐼𝑇𝑈𝐸 =
𝑇𝑜𝑡𝑎𝑙 𝐸𝑛𝑒𝑟𝑔𝑦
𝐶𝑜𝑚𝑝𝑢𝑡𝑒 𝐸𝑛𝑒𝑟𝑔𝑦=
𝑔
𝑖
𝑇𝑈𝐸 = 𝐼𝑇𝑈𝐸 × 𝑃𝑈𝐸 =𝑎 + 𝑏
𝑖
Jaguar ITUE = 1.49TUE = 1.86
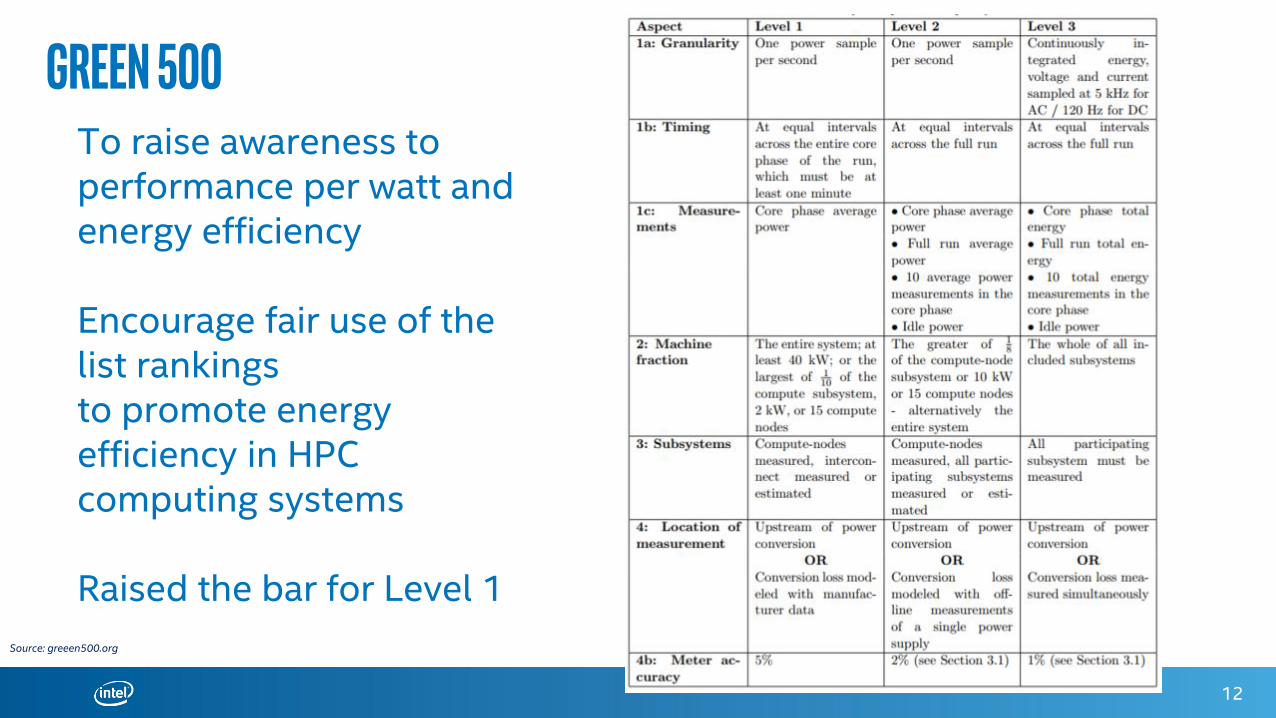
Green 500
12
To raise awareness to performance per watt and energy efficiency
Encourage fair use of the list rankings to promote energy efficiency in HPCcomputing systems
Raised the bar for Level 1
Source: greeen500.org
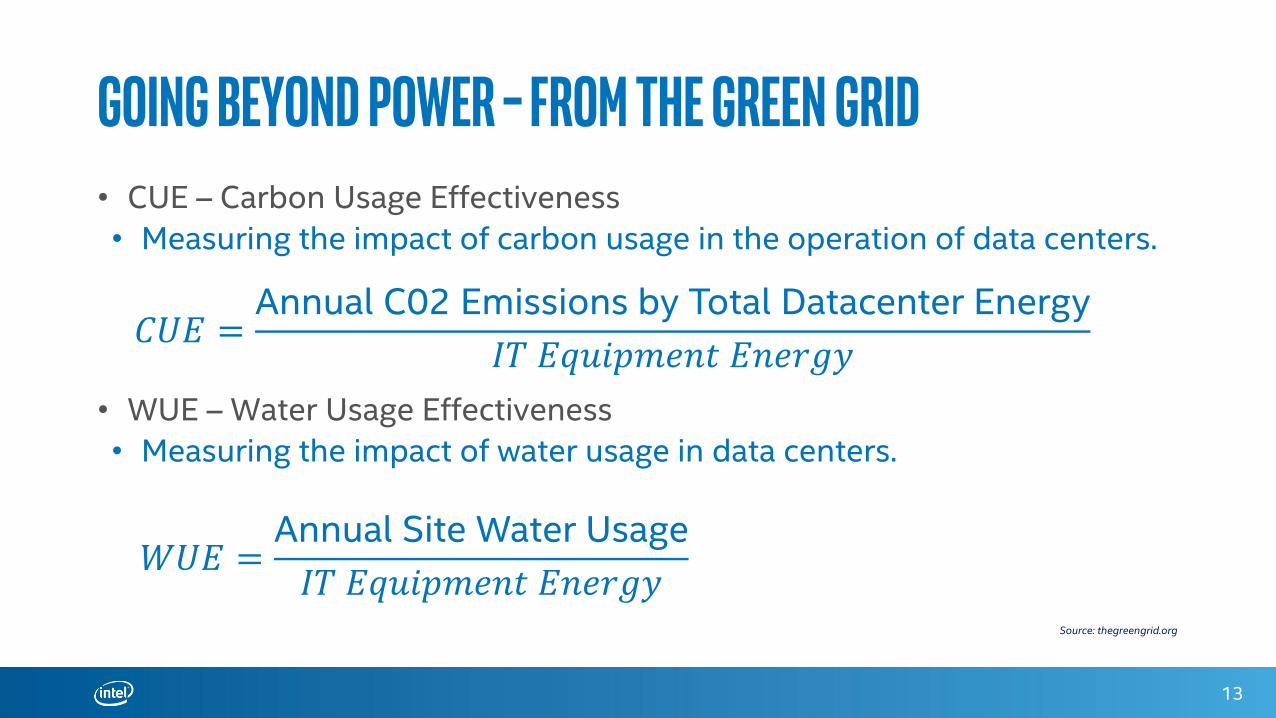
Going Beyond Power – From The Green Grid• CUE – Carbon Usage Effectiveness
• Measuring the impact of carbon usage in the operation of data centers.
• WUE – Water Usage Effectiveness
• Measuring the impact of water usage in data centers.
13
𝐶𝑈𝐸 =Annual C02 Emissions by Total Datacenter Energy
𝐼𝑇 𝐸𝑞𝑢𝑖𝑝𝑚𝑒𝑛𝑡 𝐸𝑛𝑒𝑟𝑔𝑦
𝑊𝑈𝐸 =Annual Site Water Usage
𝐼𝑇 𝐸𝑞𝑢𝑖𝑝𝑚𝑒𝑛𝑡 𝐸𝑛𝑒𝑟𝑔𝑦Source: thegreengrid.org
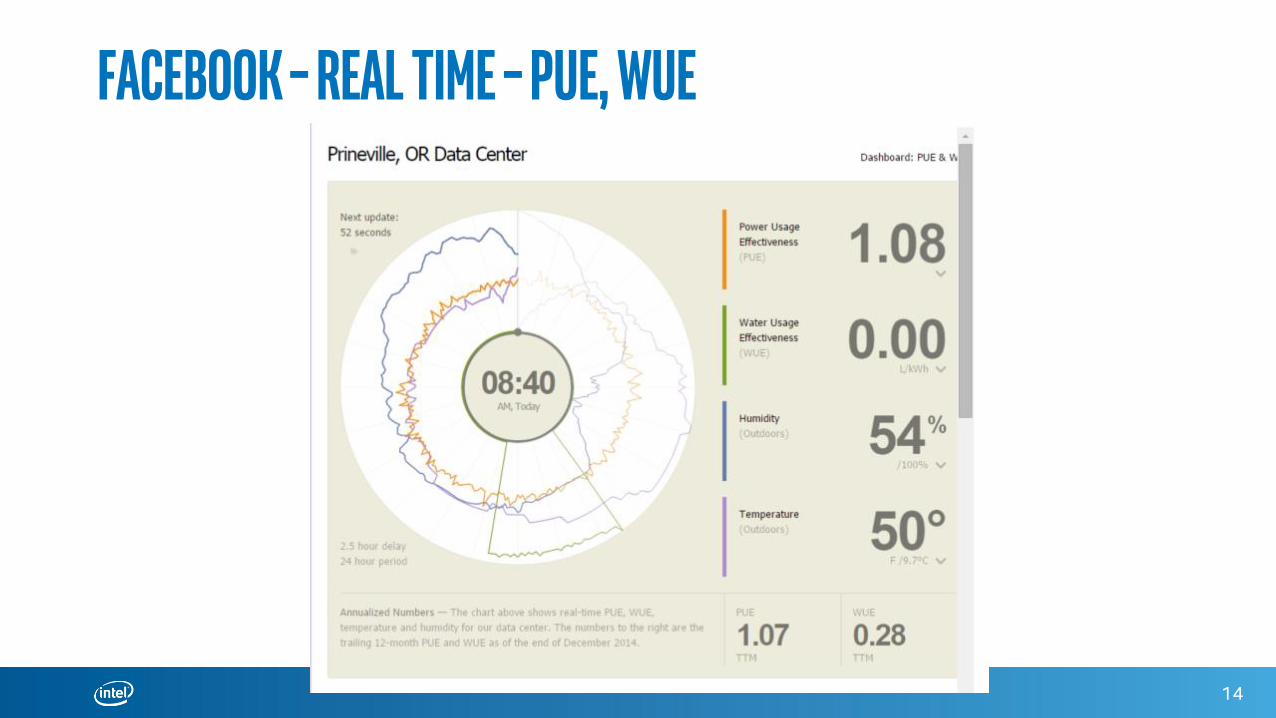
Facebook – Real time – pUE, WUE
14
Quick Survey• Raise your hand if you are measuring PUE
in your datacenter?
15
Quick Survey• Raise your hand if you are measuring PUE
in your datacenter?
• Raise your hand if you are measuring ITUE/TUE in your datacenter?
16
Quick Survey• Raise your hand if you are measuring PUE
in your datacenter?
• Raise your hand if you are measuring ITUE in your datacenter?
• Raise your hand if your system in
Green500 list at Level 3?
17
Agenda• Current trends in power metrics
• PUE, ITUE, TUE, Green 500
• Current Trends in Energy efficiency
• CPU and System Energy Efficiency
• Challenges in measuring energy efficiency metrics
• Upcoming new usage models
• System Power cap, Running jobs under power limit & Power ramp controls
• Do we need new metrics to improve energy efficiency?
• Summary
18
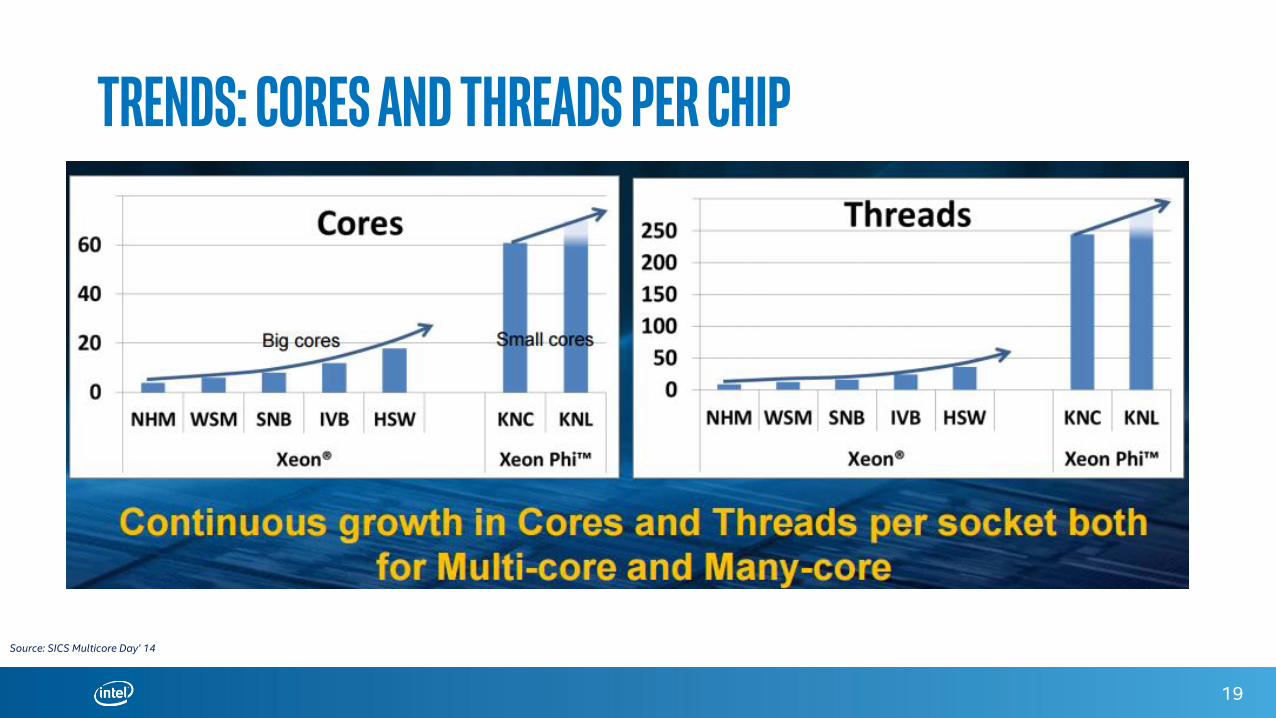
Trends: Cores and Threads per Chip
19
Source: SICS Multicore Day’ 14
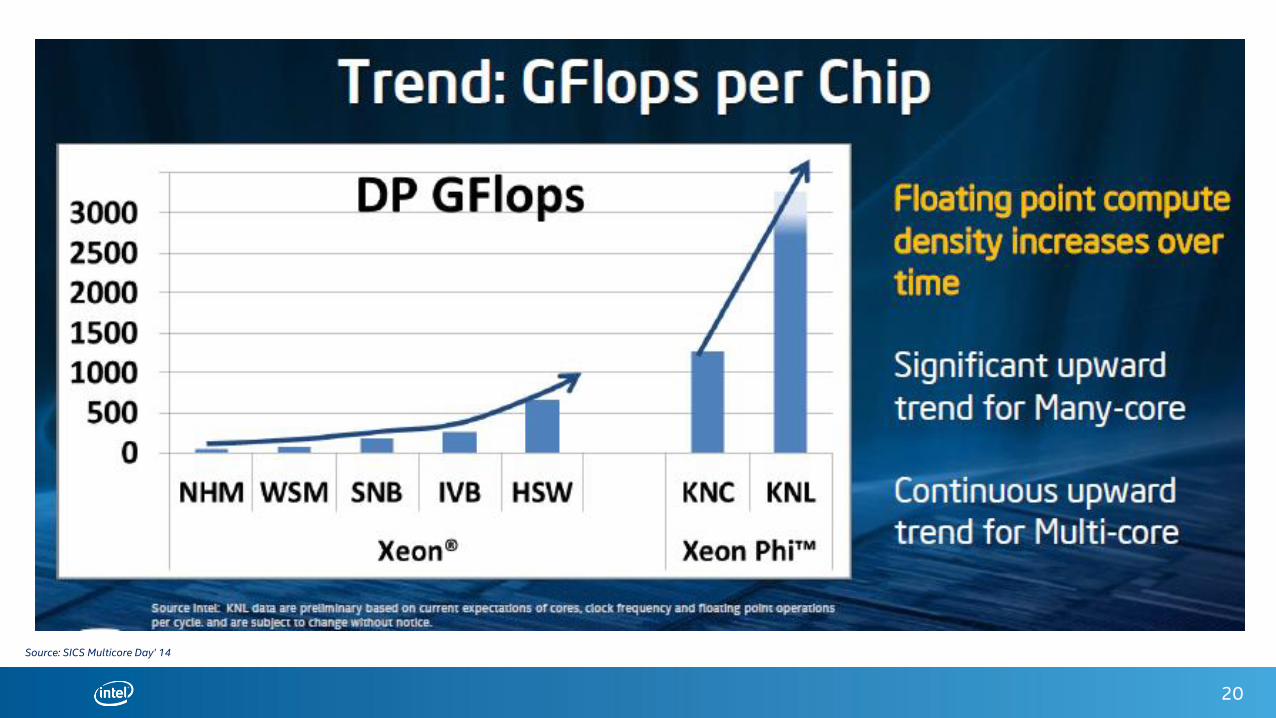
20
Source: SICS Multicore Day’ 14
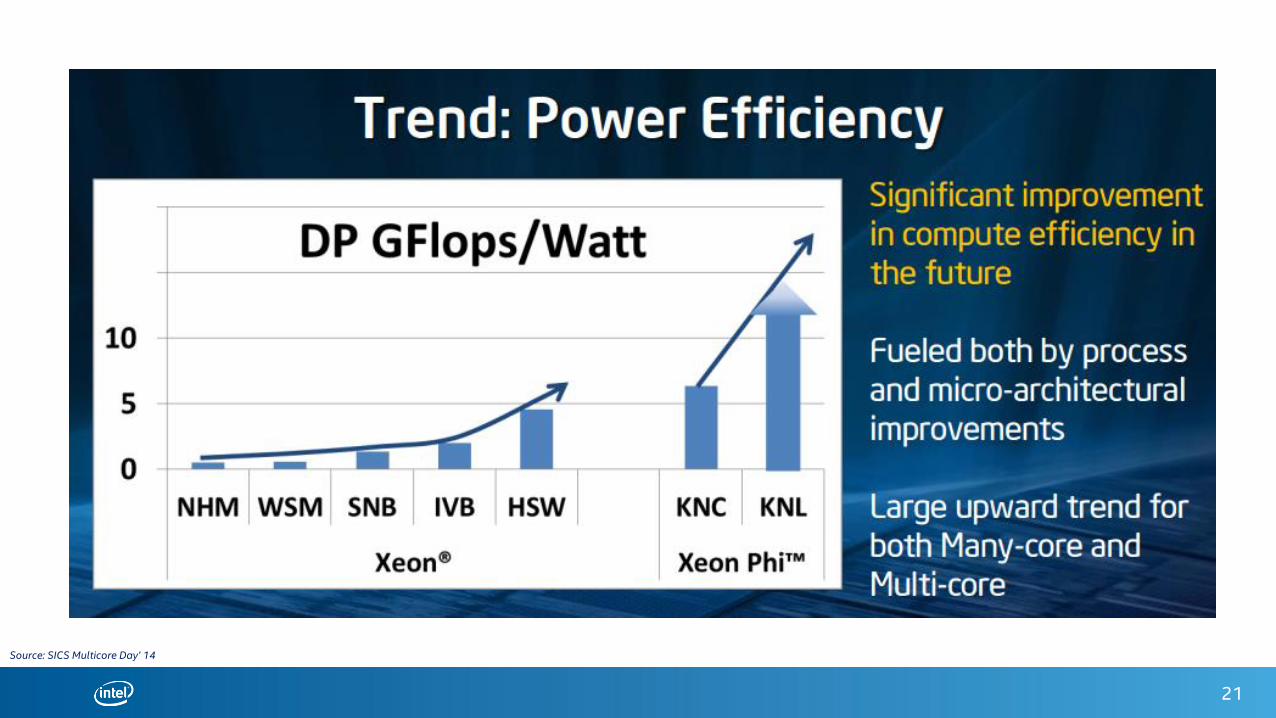
21
Source: SICS Multicore Day’ 14
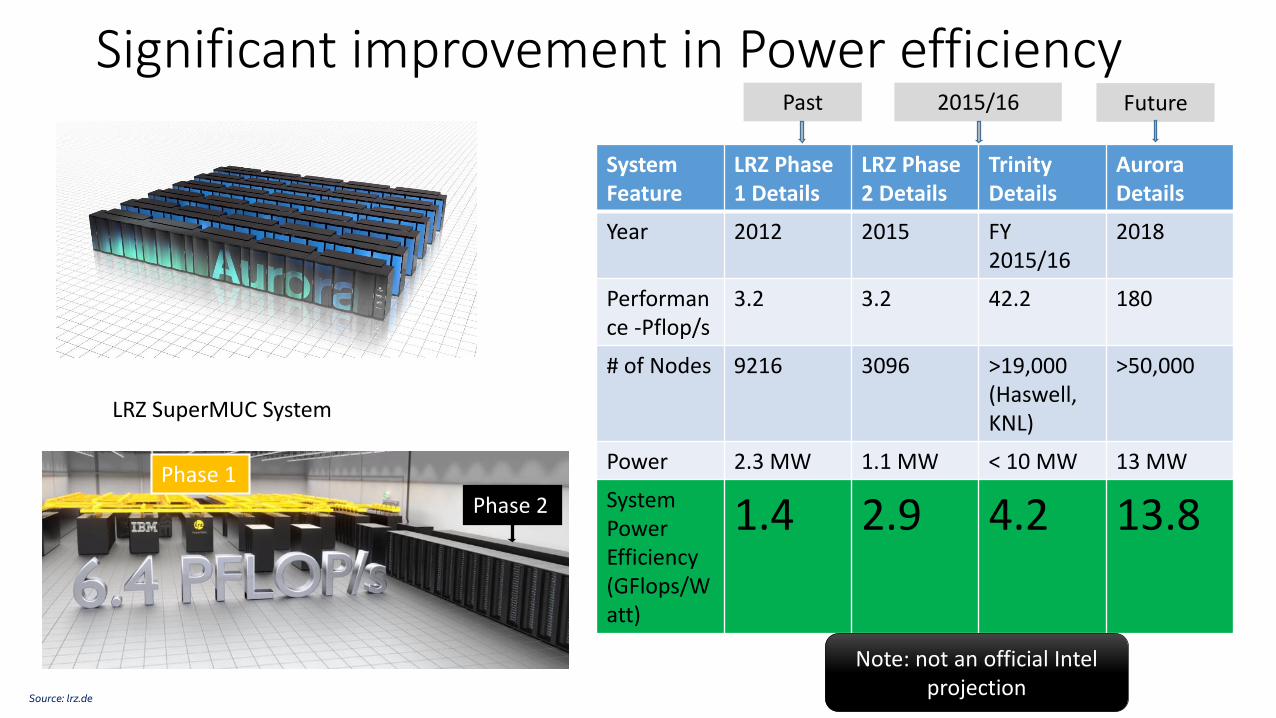
Significant improvement in Power efficiency
System Feature
LRZ Phase 1 Details
LRZ Phase 2 Details
TrinityDetails
Aurora Details
Year 2012 2015 FY 2015/16
2018
Performance -Pflop/s
3.2 3.2 42.2 180
# of Nodes 9216 3096 >19,000 (Haswell,KNL)
>50,000
Power 2.3 MW 1.1 MW < 10 MW 13 MW
System Power Efficiency (GFlops/Watt)
1.4 2.9 4.2 13.8
LRZ SuperMUC System
Past 2015/16 Future
Source: lrz.de
Phase 2
Phase 1
Note: not an official Intel projection
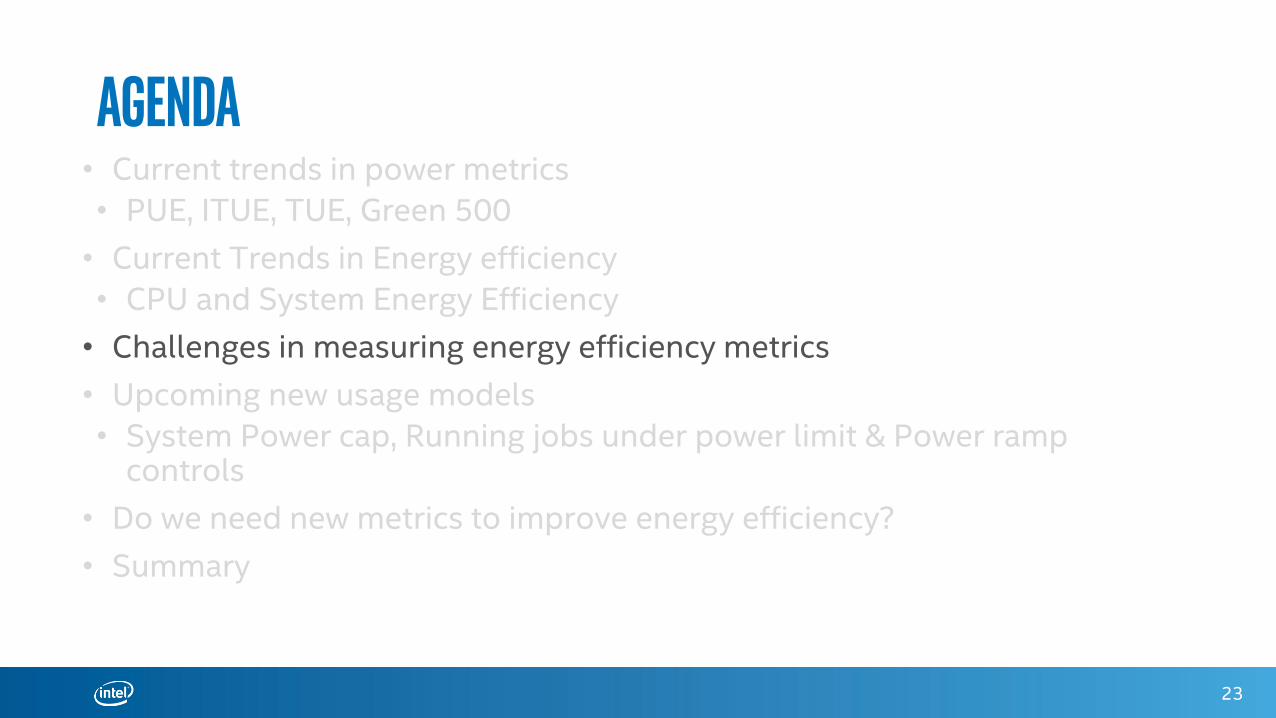
Agenda• Current trends in power metrics
• PUE, ITUE, TUE, Green 500
• Current Trends in Energy efficiency
• CPU and System Energy Efficiency
• Challenges in measuring energy efficiency metrics
• Upcoming new usage models
• System Power cap, Running jobs under power limit & Power ramp controls
• Do we need new metrics to improve energy efficiency?
• Summary
23
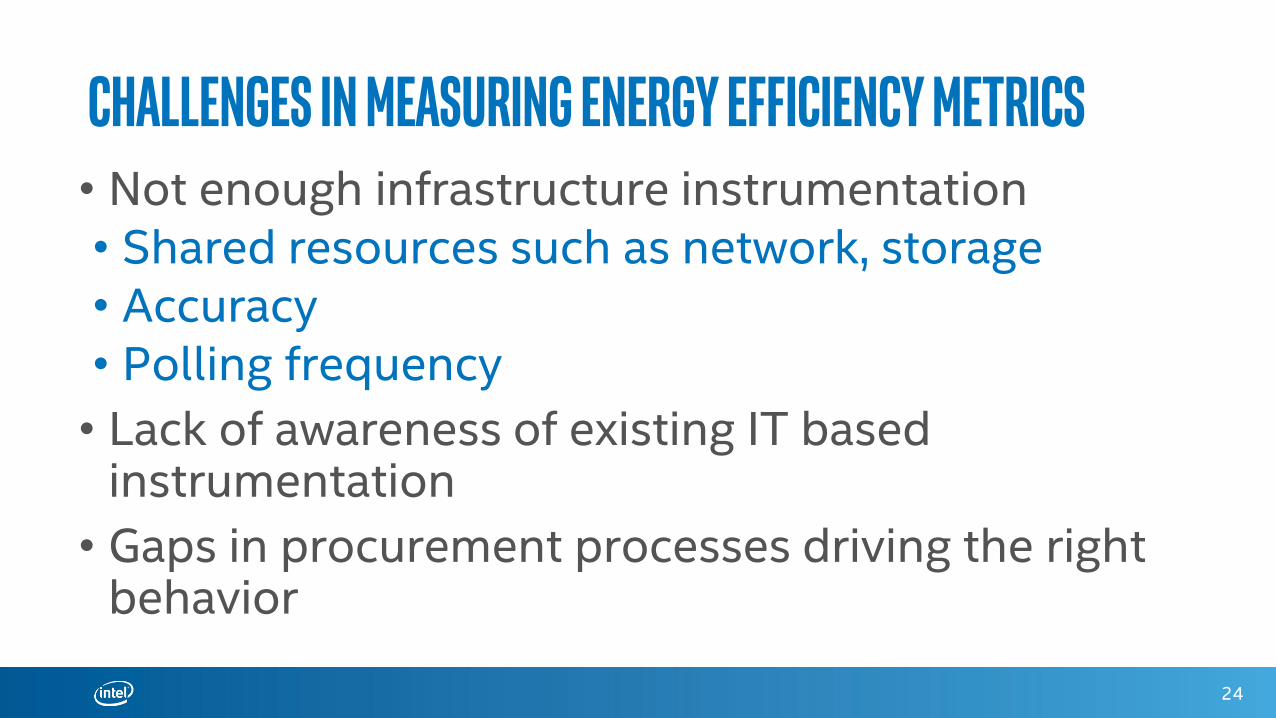
challenges in measuring energy efficiency metrics• Not enough infrastructure instrumentation• Shared resources such as network, storage• Accuracy• Polling frequency
• Lack of awareness of existing IT based instrumentation
• Gaps in procurement processes driving the right behavior
24
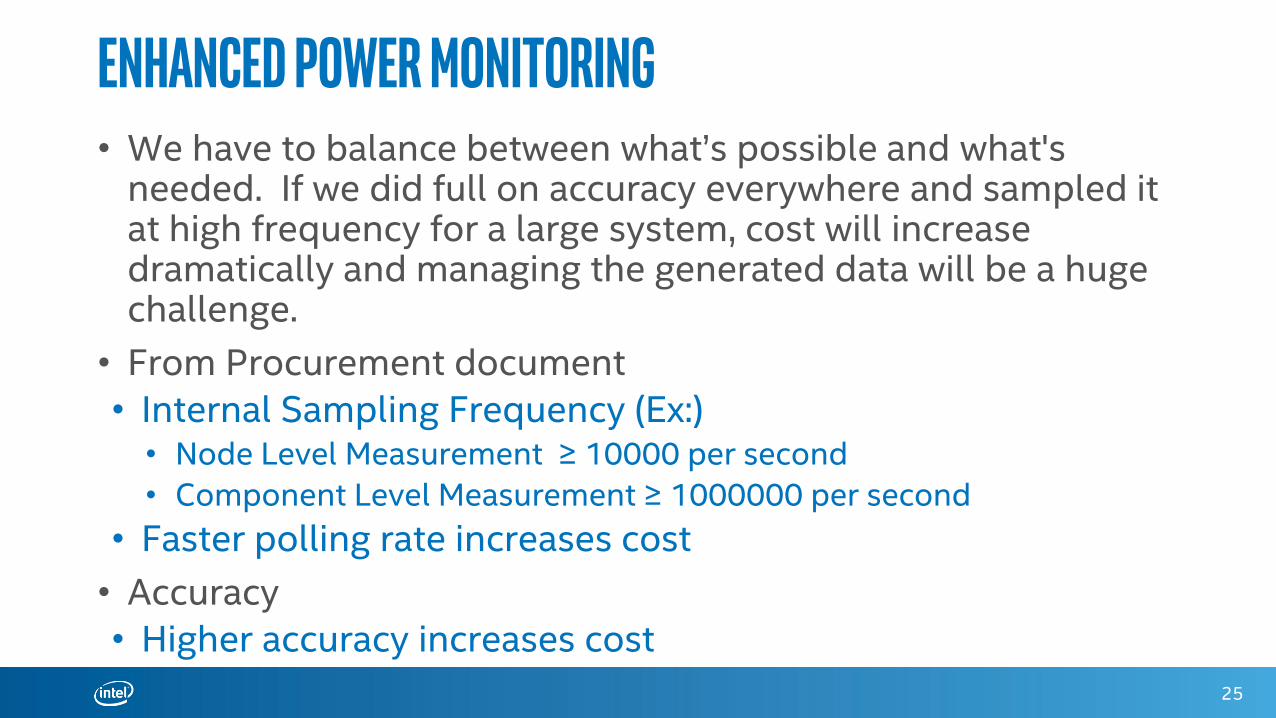
Enhanced Power Monitoring• We have to balance between what’s possible and what's
needed. If we did full on accuracy everywhere and sampled it at high frequency for a large system, cost will increase dramatically and managing the generated data will be a huge challenge.
• From Procurement document
• Internal Sampling Frequency (Ex:)• Node Level Measurement ≥ 10000 per second
• Component Level Measurement ≥ 1000000 per second
• Faster polling rate increases cost
• Accuracy
• Higher accuracy increases cost
25
Agenda• Current trends in power metrics
• PUE, ITUE, TUE, Green 500
• Current Trends in Energy efficiency
• CPU and System Energy Efficiency
• Challenges in measuring energy efficiency metrics
• Upcoming new usage models
• System Power cap, Running jobs under power limit & Power ramp controls
• Do we need new metrics to improve energy efficiency?
• Summary
26
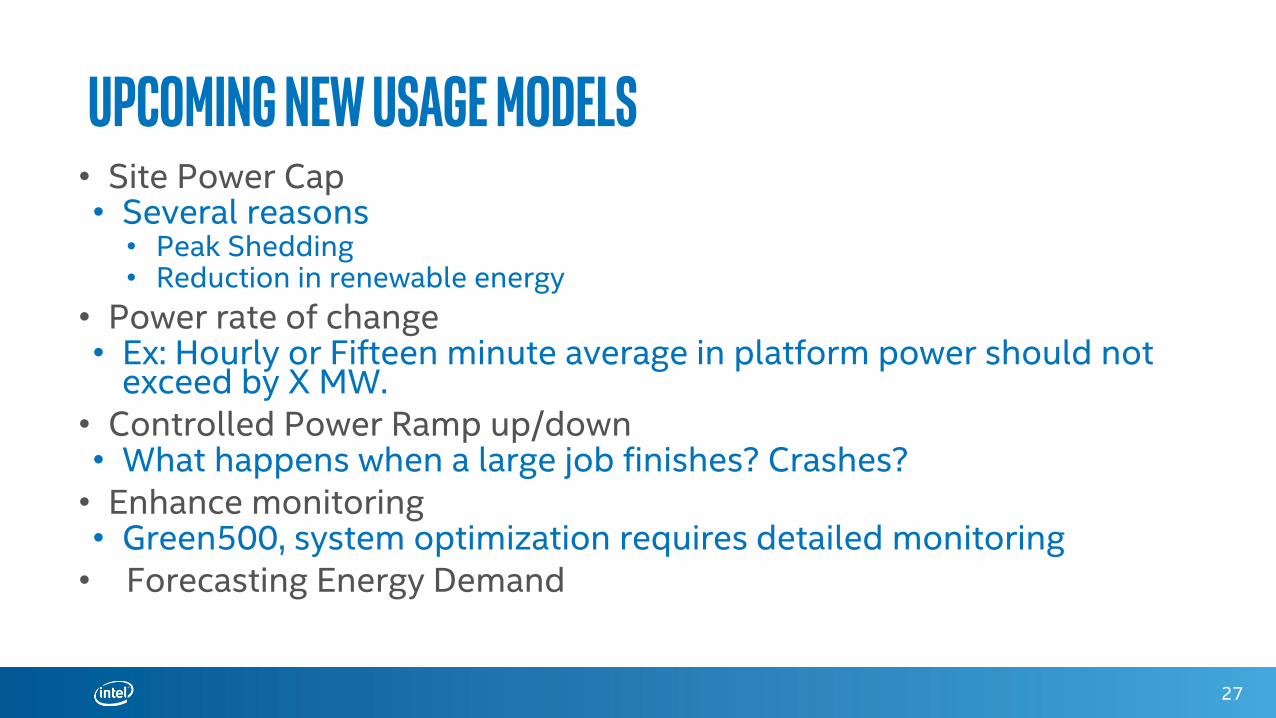
Upcoming new Usage Models• Site Power Cap• Several reasons
• Peak Shedding• Reduction in renewable energy
• Power rate of change• Ex: Hourly or Fifteen minute average in platform power should not
exceed by X MW.• Controlled Power Ramp up/down• What happens when a large job finishes? Crashes?• Enhance monitoring• Green500, system optimization requires detailed monitoring• Forecasting Energy Demand
27
Agenda• Current trends in power metrics
• PUE, ITUE, TUE, Green 500
• Current Trends in Energy efficiency
• CPU and System Energy Efficiency
• Challenges in measuring energy efficiency metrics
• Upcoming new usage models
• System Power cap, Running jobs under power limit & Power ramp controls
• Do we need new metrics to improve energy efficiency?
• Summary
28
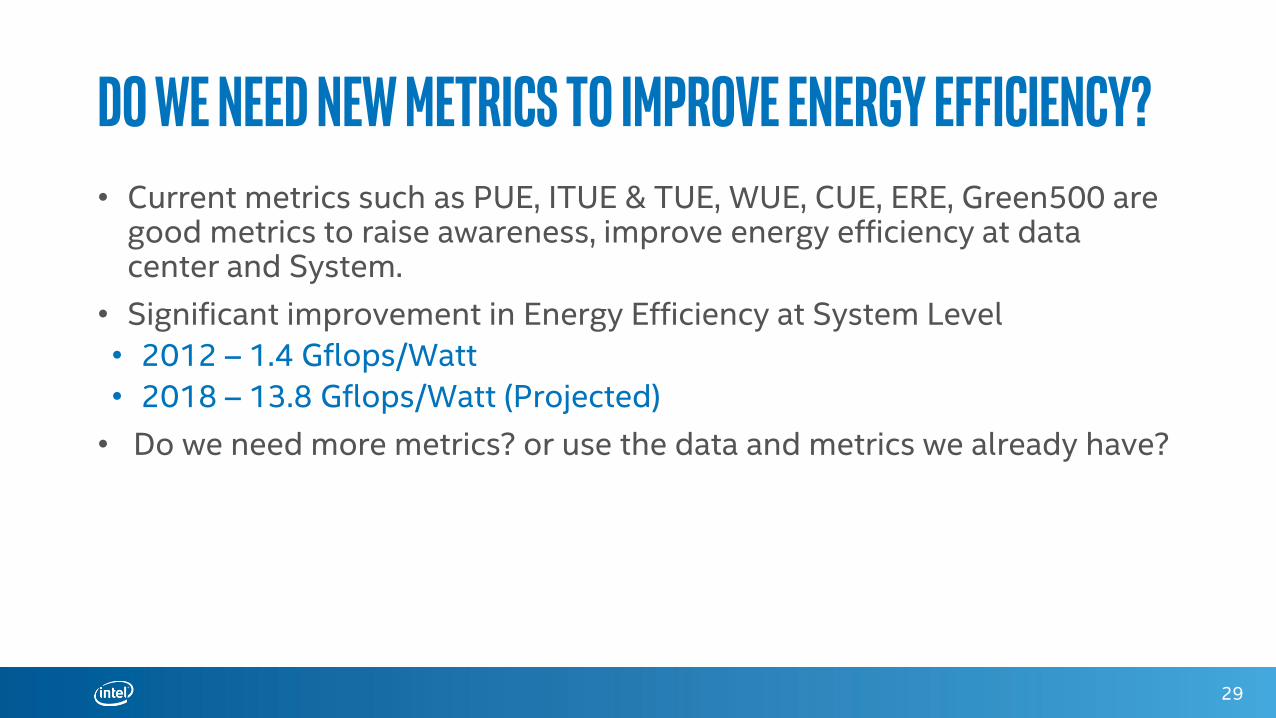
Do we need new metrics to improve energy efficiency?• Current metrics such as PUE, ITUE & TUE, WUE, CUE, ERE, Green500 are
good metrics to raise awareness, improve energy efficiency at data center and System.
• Significant improvement in Energy Efficiency at System Level
• 2012 – 1.4 Gflops/Watt
• 2018 – 13.8 Gflops/Watt (Projected)
• Do we need more metrics? or use the data and metrics we already have?
29
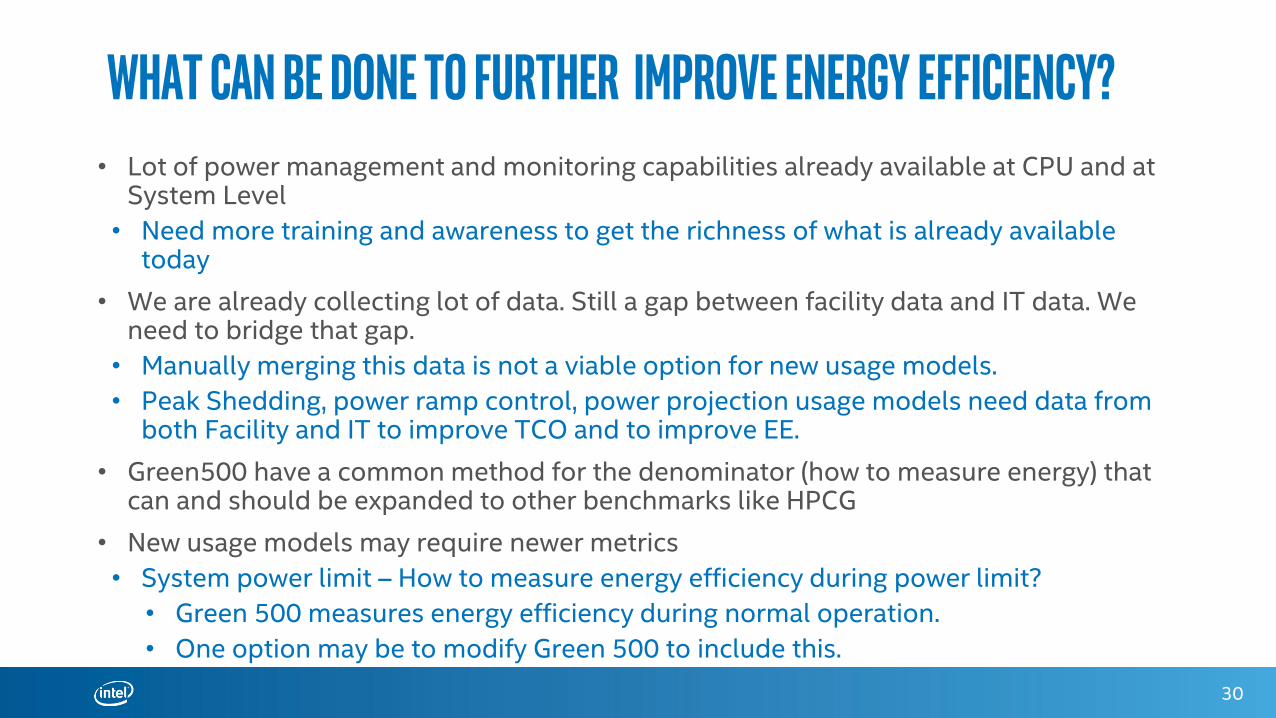
What can be done to further improve energy efficiency?• Lot of power management and monitoring capabilities already available at CPU and at
System Level
• Need more training and awareness to get the richness of what is already available today
• We are already collecting lot of data. Still a gap between facility data and IT data. We need to bridge that gap.
• Manually merging this data is not a viable option for new usage models.
• Peak Shedding, power ramp control, power projection usage models need data from both Facility and IT to improve TCO and to improve EE.
• Green500 have a common method for the denominator (how to measure energy) that can and should be expanded to other benchmarks like HPCG
• New usage models may require newer metrics
• System power limit – How to measure energy efficiency during power limit?
• Green 500 measures energy efficiency during normal operation.
• One option may be to modify Green 500 to include this.
30
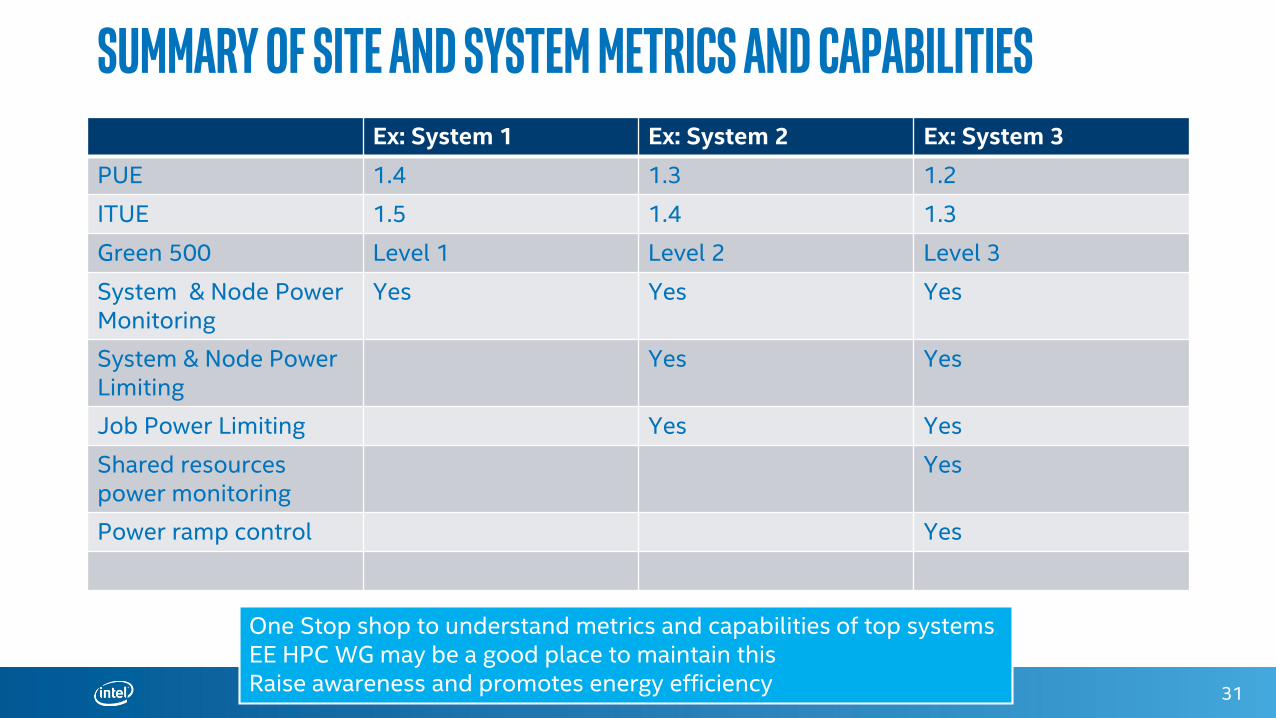
summary of Site and System Metrics and CapabilitiesEx: System 1 Ex: System 2 Ex: System 3
PUE 1.4 1.3 1.2
ITUE 1.5 1.4 1.3
Green 500 Level 1 Level 2 Level 3
System & Node Power Monitoring
Yes Yes Yes
System & Node Power Limiting
Yes Yes
Job Power Limiting Yes Yes
Shared resources power monitoring
Yes
Power ramp control Yes
31
One Stop shop to understand metrics and capabilities of top systemsEE HPC WG may be a good place to maintain thisRaise awareness and promotes energy efficiency
Agenda• Current trends in power metrics
• PUE, ITUE, TUE, Green 500
• Current Trends in Energy efficiency
• CPU and System Energy Efficiency
• Challenges in measuring energy efficiency metrics
• Upcoming new usage models
• System Power cap, Running jobs under power limit & Power ramp controls
• Do we need new metrics to improve energy efficiency?
• Summary
32
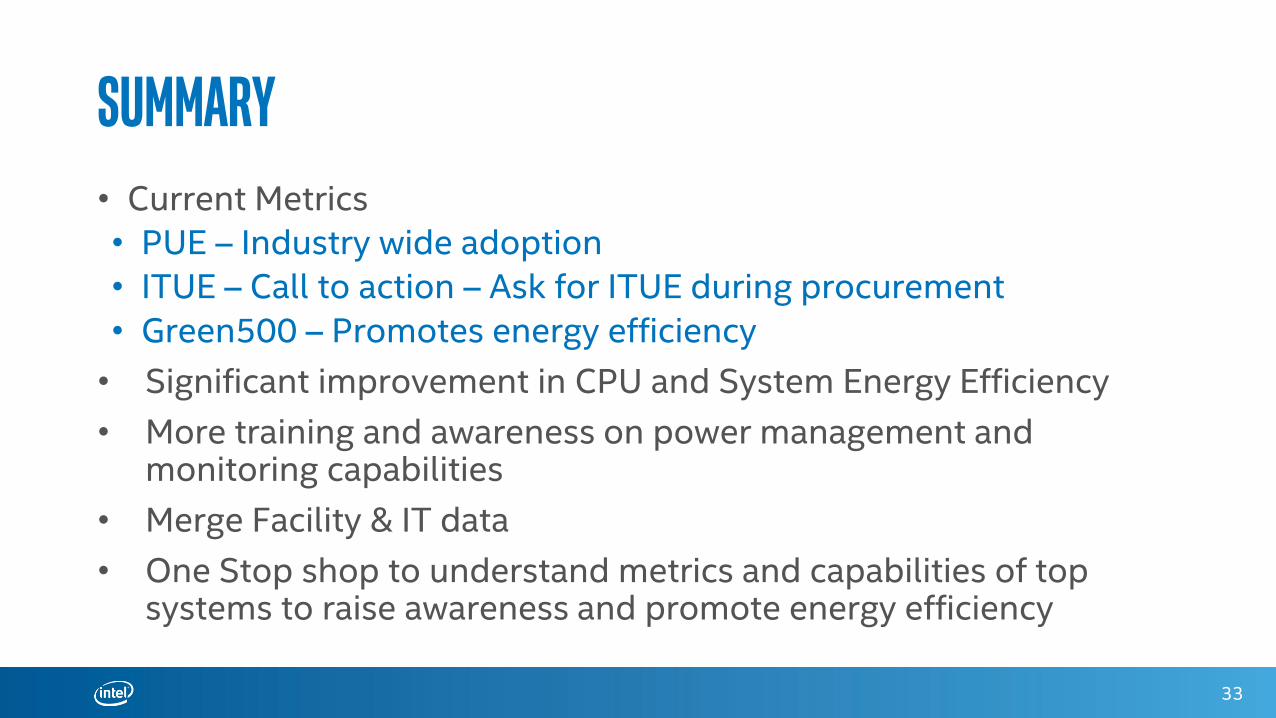
Summary• Current Metrics
• PUE – Industry wide adoption
• ITUE – Call to action – Ask for ITUE during procurement
• Green500 – Promotes energy efficiency
• Significant improvement in CPU and System Energy Efficiency
• More training and awareness on power management and monitoring capabilities
• Merge Facility & IT data
• One Stop shop to understand metrics and capabilities of top systems to raise awareness and promote energy efficiency
33

34
Intel may make changes to specifications and product descriptions at any time, without notice. Designers must not rely on the absence or characteristics of any features or instructions marked "reserved" or "undefined". Intelreserves these for future definition and shall have no responsibility whatsoever for conflicts or incompatibilities arising from future changes to them. The information here is subject to change without notice. Do not finalize a designwith this information.
The products described in this document may contain design defects or errors known as errata which may cause the product to deviate from published specifications. Current characterized errata are available on request.
Contact your local Intel sales office or your distributor to obtain the latest specifications and before placing your product order.
Copies of documents which have an order number and are referenced in this document, or other Intel literature, may be obtained by calling 1-800-548-4725, or go to: http://www.intel.com/design/literature.htm
Intel, Intel Xeon, Intel Xeon Phi™, Intel® Atom™ are trademarks or registered trademarks of Intel Corporation or its subsidiaries in the United States or other countries.
Copyright © 2014, Intel Corporation
*Other brands and names may be claimed as the property of others.
Intel does not control or audit the design or implementation of third party benchmark data or Web sites referenced in this document. Intel encourages all of its customers to visit the referenced Web sites or others where similarperformance benchmark data are reported and confirm whether the referenced benchmark data are accurate and reflect performance of systems available for purchase.The cost reduction scenarios described in this document areintended to enable you to get a better understanding of how the purchase of a given Intel product, combined with a number of situation-specific variables, might affect your future cost and savings. Nothing in this document should beinterpreted as either a promise of or contract for a given level of costs.
Intel® Advanced Vector Extensions (Intel® AVX)* are designed to achieve higher throughput to certain integer and floating point operations. Due to varying processor power characteristics, utilizing AVX instructions may cause a)some parts to operate at less than the rated frequency and b) some parts with Intel® Turbo Boost Technology 2.0 to not achieve any or maximum turbo frequencies. Performance varies depending on hardware, software, and systemconfiguration and you should consult your system manufacturer for more information.
*Intel® Advanced Vector Extensions refers to Intel® AVX, Intel® AVX2 or Intel® AVX-512. For more information on Intel® Turbo Boost Technology 2.0, visit http://www.intel.com/go/turbo
All products, computer systems, dates and figures specified are preliminary based on current expectations, and are subject to change without notice.
Optimization Notice
Intel’s compilers may or may not optimize to the same degree for non-Intel microprocessors for optimizations that are not unique to Intel microprocessors.
These optimizations include SSE2®, SSE3, and SSSE3 instruction sets and other optimizations. Intel does not guarantee the availability, functionality, or effectiveness of any optimization on microprocessors not
manufactured by Intel. Microprocessor-dependent optimizations in this product are intended for use with Intel microprocessors. Certain optimizations not specific to Intel microarchitecture are reserved for Intel
microprocessors. Please refer to the applicable product User and Reference Guides for more information regarding the specific instruction sets covered by this notice.
Notice revision #20110804
Legal Disclaimer
* Other names and brands may be claimed as the property of others. Copyright © 2014 Intel Corporation. All rights reserved. 35