Embed Size (px)
Citation preview
TRIHALOMETHANE
REMOVAL AND FORMATION MECHANISM IN WATER
R.C. Chawla, M. M. Varma,
A. BaIram, M.M. Murali and
P. Natarajan
Howard University Washington, D.C. 20059
Submitted to The D.C. Water Resources Research Center
University of the District of Columbia Washington, D.C. 20008
May 1983
Contents of this publication do not necessarily reflect the views and policies of the
U.S. Department of the Interior, nor does mention of trade names or commercial products constitute their endorsement or recommendation for use by the U.S. Government.
Contents
Topic Page I. Abstract -------------------------------------------------------------- ii
II. Introduction---------------------------------------------------------- 1
III. Theory--------------------------------------------------------------- 2
THM Formation -------------------------------------------------------- 2
THM Removal --------------------------------------------------------- 6
IV. Methodology ------------------------------------------------------- 8
Batch Method --------------------------------------------------------- 10
Columnar Method -----------------------------------------------------11 THM Analysis ---------------------------------------------------------13
V. Results and Discussion -------------------------------------------15
I. THM Formation Kinetics ------------------------------------------15
II. THM Removal -----------------------------------------------------27
(a) Batch Tests --------------------------------------------------------27
(b) Columnar Tests --------------------------------------------------- 37
VI. Conclusions ------------------------------------------------------ 43
VII. Recommendations ---------------------------------------------- 44
VIII. References ------------------------------------------------------ 45
IX. Appendices ------------------------------------------------------- 46
A: Sample Calculations --------------------------------------------- 46
B: Sample Data - Chromatograms --------------------------------- 47 B: Glassware Used --------------------------------------------------- 53
iii
Introduction
Drinking water is chlorinated to inactivate the bacteria in order to prevent the spread of water
borne diseases. However the recent investigations of Rook (1974) and Bellar (1974) indicate
that aqueous chlorine reacts with "humic-acid-like" materials, usually referred to as
precursors, to form trihalomethanes (THM's). THM's are suspected carcinogens. U.S. EPA
(1978) has promulgated that maximum concentration level (MCL) of total trihalomethanes in
water should not exceed 100 ug/Q. Hence engineers are required to minimize the
concentration of THM's in water, either by removing the precursors before chlorination or by
removing the THM's formed by adsorption.
The precursors vary both quantitatively and qualitatively due to hydrological and seasonal
changes. For the most part these are difficult to measure.
The objectives of the research were to study the formation kinetics of THM's and their
removal using granulated activated carbon (GAC). To avoid the temporal changes the
formation studies were made on lyophilized water.
2
Theory
THM Formation
The aqueous chlorine reacts with a wide variety of organics in water to give rise to
haloform reactions and produce THMs. The organics that lead to the formation of haloforms
are many such as methyl ketone acetelhydes, ethanol and secondary alcohols. In addition humic
acid substances, and algae like material also react with aqueous chlorine to produce THMs.,
The THM formation also depends on the chemical component of the water especially the
presence of Bromine, Iodine because these two will determine the formation of various other
halogenated species.
Another source of THMs is due to industrial emissions to the atmosphere. Some volatile
organics escape to the atmosphere and halogenated compounds upon combustion generate Cl
(also industry discharges large amounts of chlorine to the atmosphere), which reacts to form
chlorofom and other trihalomethanes. THM's formed in the atmosphere are washed by
This is a complex reaction mechanism controlled by parameters such as:
o Concentration and type of precursors
o Concentration of chlorine
o Temperature
o pH
o Time
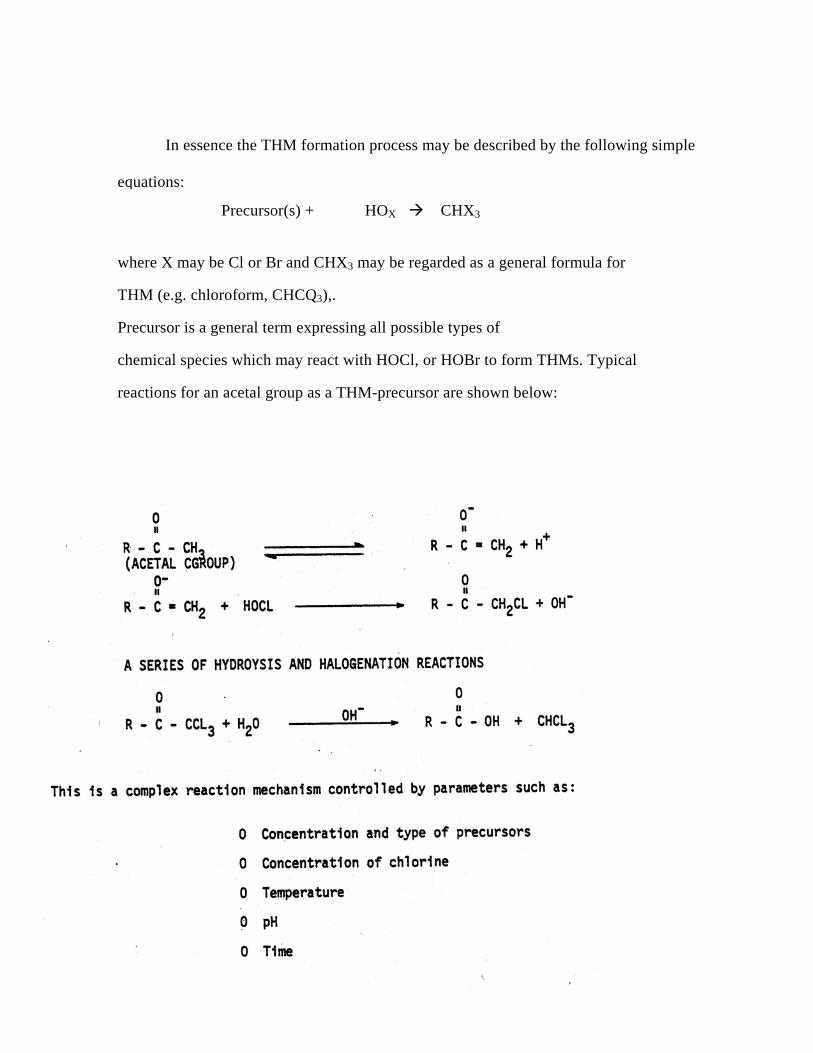
In essence the THM formation process may be described by the following simple
equations:
Precursor(s) + HOX CHX3
where X may be Cl or Br and CHX3 may be regarded as a general formula for
THM (e.g. chloroform, CHCQ3),.
Precursor is a general term expressing all possible types of
chemical species which may react with HOCl, or HOBr to form THMs. Typical
reactions for an acetal group as a THM-precursor are shown below:
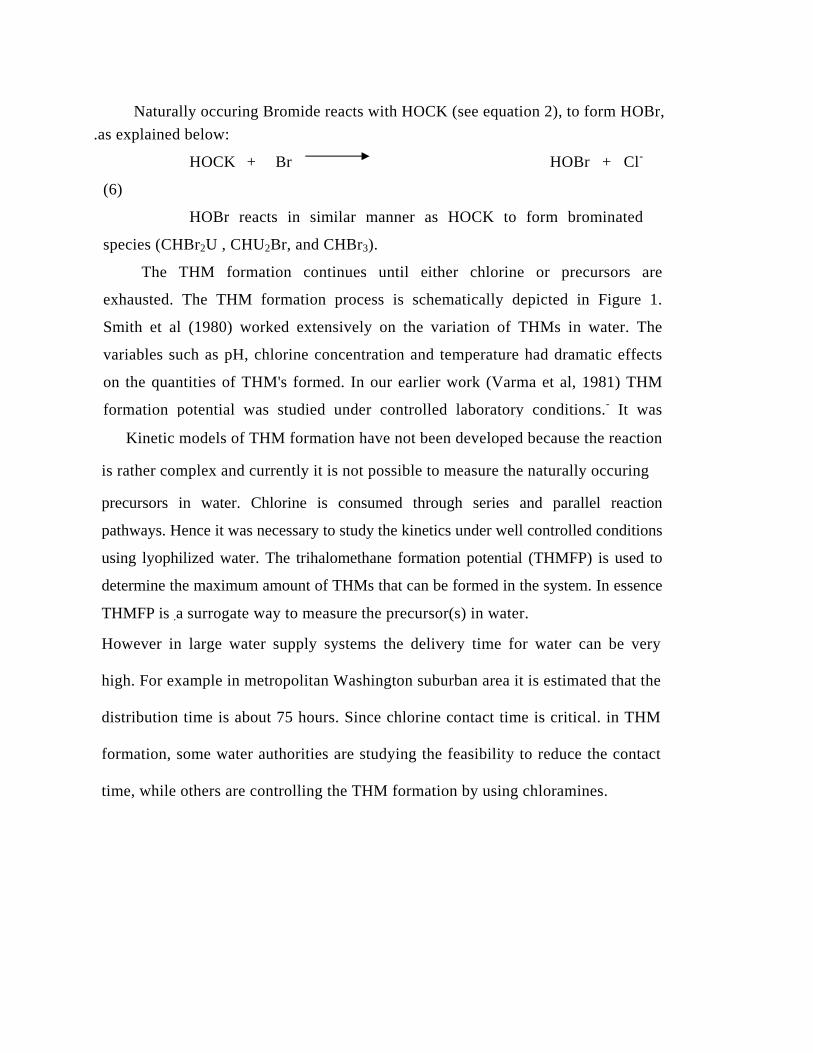
Naturally occuring Bromide reacts with HOCK (see equation 2), to form HOBr, .as explained below:
HOCK + Br HOBr + Cl
-
(6)
HOBr reacts in similar manner as HOCK to form brominated
species (CHBr2U , CHU2Br, and CHBr3).
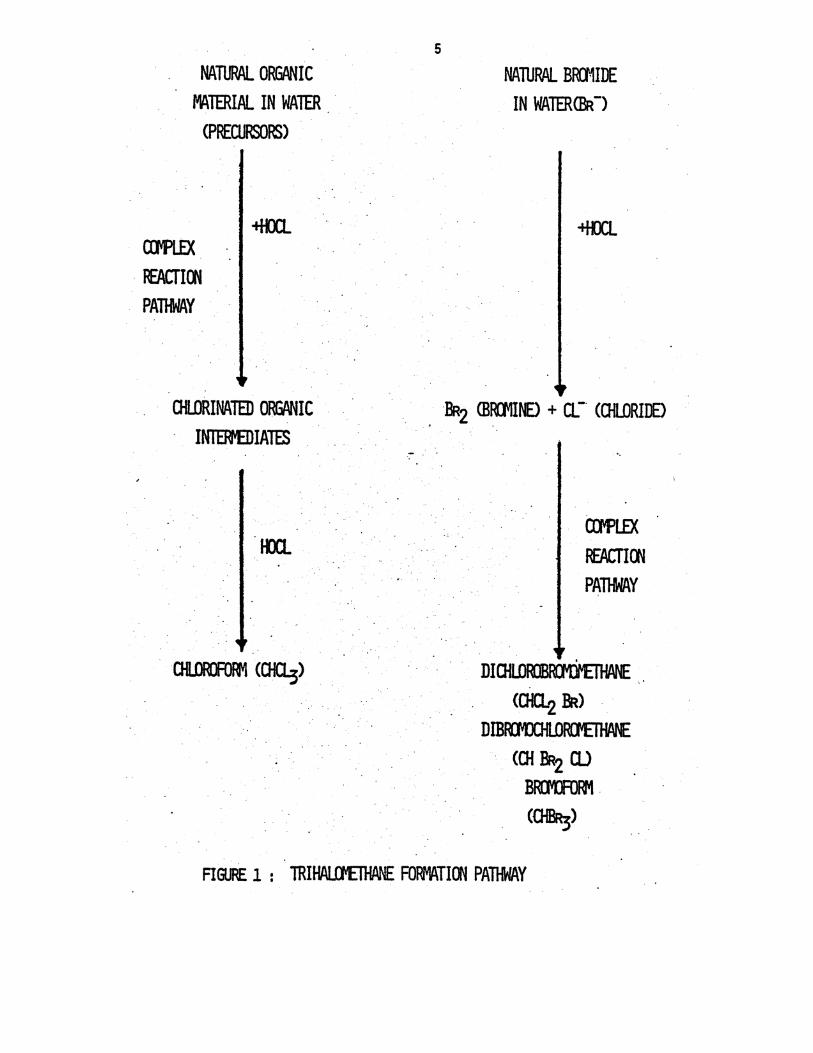
The THM formation continues until either chlorine or precursors are
exhausted. The THM formation process is schematically depicted in Figure 1.
Smith et al (1980) worked extensively on the variation of THMs in water. The
variables such as pH, chlorine concentration and temperature had dramatic effects
on the quantities of THM's formed. In our earlier work (Varma et al, 1981) THM
formation potential was studied under controlled laboratory conditions.- It was
Kinetic models of THM formation have not been developed because the reaction
is rather complex and currently it is not possible to measure the naturally occuring
precursors in water. Chlorine is consumed through series and parallel reaction
pathways. Hence it was necessary to study the kinetics under well controlled conditions
using lyophilized water. The trihalomethane formation potential (THMFP) is used to
determine the maximum amount of THMs that can be formed in the system. In essence
THMFP is .a surrogate way to measure the precursor(s) in water.
However in large water supply systems the delivery time for water can be very
high. For example in metropolitan Washington suburban area it is estimated that the
distribution time is about 75 hours. Since chlorine contact time is critical. in THM
formation, some water authorities are studying the feasibility to reduce the contact
time, while others are controlling the THM formation by using chloramines.
6
THM Removal
To meet the requirements of THM concentration laid down by U.S. EPA, water
authorities can formulate their own strategy. The alternatives are:
(a) treatment to remove trihalomethanes after formation
(b) treatment to remove trihalomethane precursor(s)
(c) to use an alternate disinfectant.
This investigation deals with the removal of THM's by adsorption on GAC, hence no
reference will be made to the other methods.
To determine the degree of removal of TTHMs by adsorption, an isotherm test is
usually applied. The isotherm is a relationship between the amount of the pollutant adsorbed
and its concentration in the aqueous solution at equilibrium. One can screen the potential
adsorbents for the removal of the THMs, and compare their effectiveness under varied
conditions. Thus the adsorption isotherm can be used as a screening tool in determining the
effectiveness of columnar method.
Freundlich equation is employed to test the model. The mathematical equation is
x/M = k c 1/n
where x = amount of substance adsorbed calculated from original and equilibrium
concentrations Co and Ct
M = weight of GAC
k and n are constants. K is the intercept at Ct = 1 (log Ct = 0).
1/n is the slope of the x/M vs Ct plot on a log-log paper. Stationary beds of GAC are used to
remove THMs from drinking water. The aqueous solution flows downward through the
adsorbent. The adsorbed contaminants accumulate
7
on the surface of the bed until the amount reaches the maximum level. The maximum amount of
the contaminants that can be adsorbed on GAC occurs when the adsorbed concentration is in
equilibrium with the concentration of the contaminant in the surrounding aqueous solution. Thus
the capacity of the carbon at equilibrium can be determined from the isotherm study. The
effluent concentration from the column remains low until the exhausted zone of GAC
reaches the bottom of the column and then it starts increasing dramatically to the influent
concentrations. At this stage the entire column is saturated and the influence concentration is
equal to the effluent concentration.
Blanck (1979) showed that 80 percent breakthrough of TTHM occured on or before 14 weeks of
operation. DeMarco and Wood (1979) demonstrated that strongly adsorbed bromine containing
trihalomethanes have smaller critical bed depth, that is, a thinner mass transfer zone. Stevens
(1975) also reported the removal of humic-like-matter by a GAC column. Wood and DeMarco
(1980) indicated that minimum adsorbed bed depth is 19 cm (7.5 in) to remove the
THMFP to 200 ug/l and 32 cm (12.5 in) to 100 ug/l from an average influent concentration
of 434 ug/l. It is apparent that more in-depth investigation is needed if GAC or other synthetic
resins have to be used for removing THM's formed on the chlorination of drinking water
supplies.
8
Methodology
'The research project was divided into two parts (a) formation kinetics and (b) removal
mechanism. The removal mechanism was studied both by batch test and columnar method.
As a general precaution, all glassware was thoroughly cleaned in hot water with detergent
and was rinsed with super Q water. These glasswares were baked in an oven for at least 2
hours at 150° 1700C to get rid of all the organics present. It is advisable not to touch the
glasswares with hands. Gloves were used to avoid contamination. Granular activated carbon
(GAC) of 200 mesh size supplied by Fisher Scientific Co. was used for all the experimental
studies. GAC was washed with super Q water many times till all the fine particles
disappeared. GAC was transferred to a drying tray and placed in an oven at 100°C for drying
overnight. This washed carbon after drying is ready for use in organic adsorption
experiments.
Stock solutions of T HM's were prepared gravimetrically by determining the weight
of the chloroform in a known volume of methanol. The concentration of the stock solution is
reported in µg/l (microgram per liter). The stock solution was diluted in 1:10 ratio with
methanol to an intermediate solution. This intermediate solution was further diluted with
super Q water via progressive dilutions to analytical requirements to a known concentration
before each experiment was conducted. Subsequently, the gravimetric technique of
determining concentration of stock solution was checked by the analytical technique i.e., the
gas chromatogram, and it was found to be nearly close. A sample calculation for determining
stock solution concentration is shown in Appendix A.
9
It was necessary to concentrate the water sample. Several methods for concentration
are available, namely, vacuum distillation, synthetic resins (XAD-8 or XAD 2) adsorption
and subsequent elution, reverse osmosis, and lyophilization. Each method has its own
strengths and weaknesses; however, considering the simplicity, ease and minimal loss of
volatile matter during the procedure, lyophilization was selected for concentrating the
sample.
Twenty (20) gallons of water were lyophilized; the water was evaporated under low
vacuum and dried solids were collected in a glass bottle and kept in a refrigerator until its
use. The solids were re suspended in Super "Q" water and pH adjusted to 8.00.
To this water, chlorine was added to obtain predetermined concentration. A separate
study showed that an initial concentration of 5 mg/Z of chlorine resulted in 1 mg/z free
chlorine in the aqueous solution after 100 hours of reaction time. This chlorine dose was
consistent with the normal chlorine dose added by the Washington Surburban Sanitary
Commission (WSSC), and most other municipalities.
The chlorine solution was prepared by bubbling chlorine gas through super "Q"
water. A known amount of this solution was added to achieve the desired concentration.
The reaction flask (brown glass bottle), was carefully washed and baked. It was
placed in a constant temperature bath* set at a predetermined temperature (21°). The actual
temperature of the bath was within + 0.5° of the set reaction temperature.
* Blue M Company, Blue Island, Illinois
10
At various time intervals, two samples of approximately 100cc each were withdrawn
from the reaction vessel for analysis. In one sample, the pH was measured and excess
chlorine was then neutralized with sodium thiosulfate solution.
The chlorine in the other sample was measured by a Specific Ion electrode** fitted
with a residual chlorine electrode. This was standardized against the DPD method.
Subsequently, this sample was analyzed for THM. These data were collected at various time
intervals.
Batch Method: For small scale experimental studies, batch test is the most ideally
suitable method. The reason being, it is simple, needs very few equipments and it is
cheaper.
In the laboratory batch test were conducted by taking four 2000 ml volumetric flasks
with stoppers. Washed GAC of varying amounts were weighed and placed in volumetric
flasks. A known concentration of chlorophorm (CHCt3) was prepared from the stock
solution. A 20 ml sample of flask contents at time t=0 was collected in glass vials. and
screwed tightly and stored in the refrigerator. CHCz3 solution was added to the volumetric
flask noting the day and time at the start of the experiment. The solutions were vigorously
shaken for thorough mixing of CHCk3 and GAC. Samples were taken every two hours and
filtered through 0.45 u filter, labelled and stored in glass vials for the further analysis of
CHCZ3. The tests were conducted for 8 to 10 days.
** Orion Specific Ion Meter. Orion Research Inc. - Cambridge, Mass.
11
Another set of batch tests involved using a separate flask for each sample. This
was done to keep the volume and concentration constant throughout the experiment.
In these experiments 0.5 gm of GAC was placed in nine (9) - 250 ml volumetric
flasks. The flasks were filled with the same concentration of THM solution. The flasks
were placed in dark environment and shaken several times, manually. At the end of each
day, for nine days, one flask was taken from the batch. A known volume of solution was
filled, and analyzed for THM's, as explained later.
The second set of experiments was performed to determine the adsorptive capacity
of GAC. As several doses of carbon ranging from 0.05 to 0.5 gm were placed in 250 ml
volumetric flasks. The flasks were filled with a known concentration of THM solution
placed in dark environment, and shaken manually. Al experiments were continued for 10
days, the time to reach the contents in equilibrium state. The time was evaluated from the
first set of experiments. The time varied from 7 to 8 days; hence 10 days was selected. At
the end of the prescribed period, a known volume of solutions was filtered from each flask,
and analyzed for THM's.
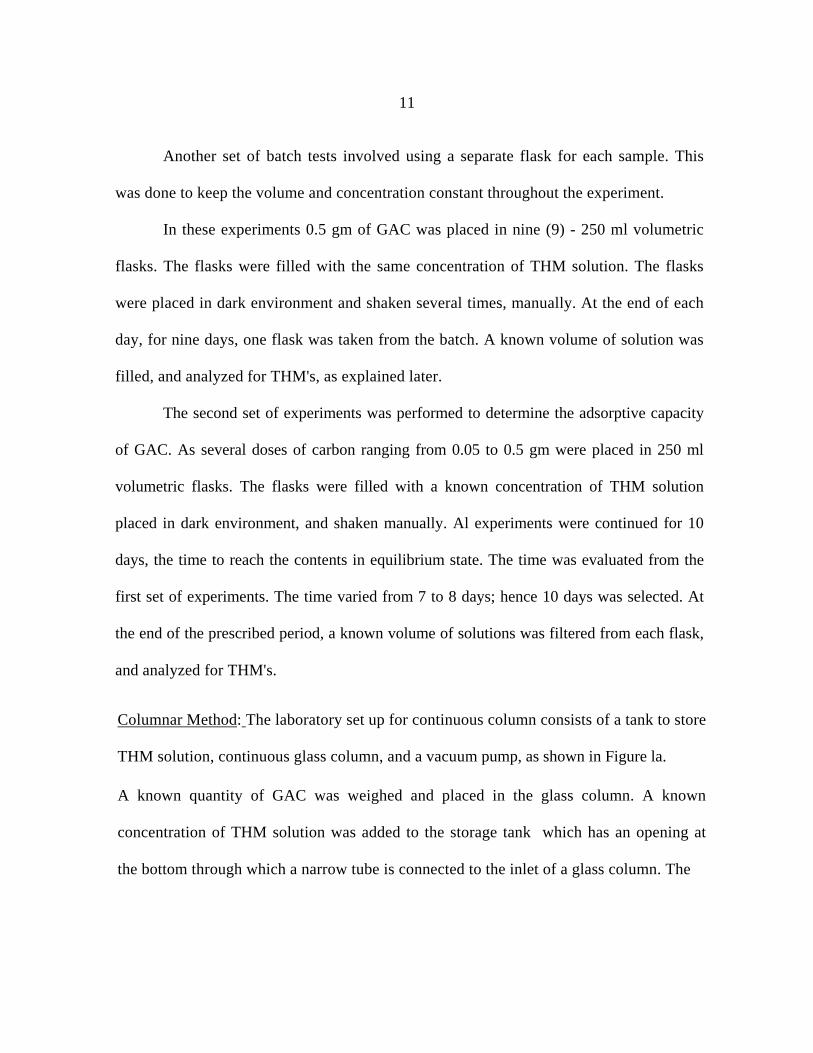
Columnar Method: The laboratory set up for continuous column consists of a tank to store
THM solution, continuous glass column, and a vacuum pump, as shown in Figure la.
A known quantity of GAC was weighed and placed in the glass column. A known
concentration of THM solution was added to the storage tank which has an opening at
the bottom through which a narrow tube is connected to the inlet of a glass column. The

13
flow of solution is controlled by the pump. To start the experiment the sample at time t=0
was collected, which denotes the initial concentration. The pump was started and the time
noted. Maximum care was taken to maintain a constant head, i.e., to maintain constant
inflow and outflow from glass column. In the experiments conducted the flow varied from
160-500 ml/hr but a constant flow rate was maintained for each experiment. Samples were
collected every 15 minutes from the effluent and stored in glass vials, properly labelled and
refrigerated. The tests were conducted for 2 to 3 hours depending on the concentration of the
THM solution and quantity of carbon used. The collected samples were analyzed for
determination of THM's by the method described in the analysis section.
THM Analysis:
The analysis for THM's was performed by the liquid-liquid extraction technique. 10
ml of the sample were taken in a screw capped test tube to which 1 ml of pentane was
added. The tube was capped tightly, and shaken vigorously for one minute. It was allowed to
stand until the separation of phases was clearly visible. A liquid of the upper organic phase
was removed carefully with disposable pipette and transferred to micro vials before it was
sealed. These micro vials were arranged in sequence on the rack for the G.C. analysis. The
instrument automatically injects one sample after another, and the results are printed. The
area on the graph was integrated for determination of the concentration of the sample in
micrograms per liter (µg/l).
The quantitative measurements for all the samples were carried out with a
Hewlett-Packard Model 5830 Gas Chromatograph fitted with a Ni 63
14
electron capture detector. The glass volume was I" x 4', packed with 10 percent FFAP on gas-
chrom Q. The operating data of the GC is provided below:
Column: 6.4mm x 1.22m(* x 4') Glass Packing: 10% FFAP on Gas-Chrom Q Carrier Gas: Argon-Methane 95%/5% Carrier Gas Flow Rate: 50 ml/min Oven Temperature: 90°C Injection Temperature: 2500C Detector: Ni - Electron Capture Detector Temperature: 300°C
Liquid-Liquid Extraction Method using pentane has been investigated in detail by many
researchers (Richard and Junk, 1977; Mieure, 1977; Varma et al, 1979). These researchers
found that pentane has the advantages of low solubility in water, good distribution
coefficients and favorable polarity and volatility for effective separation from the THM's.
This technique has the advantages of being fast (about 5 minutes per sample), has
minimal interferences from other commonly occuring organics in water and requires-very
little equipments besides an electron-capture GC detector.
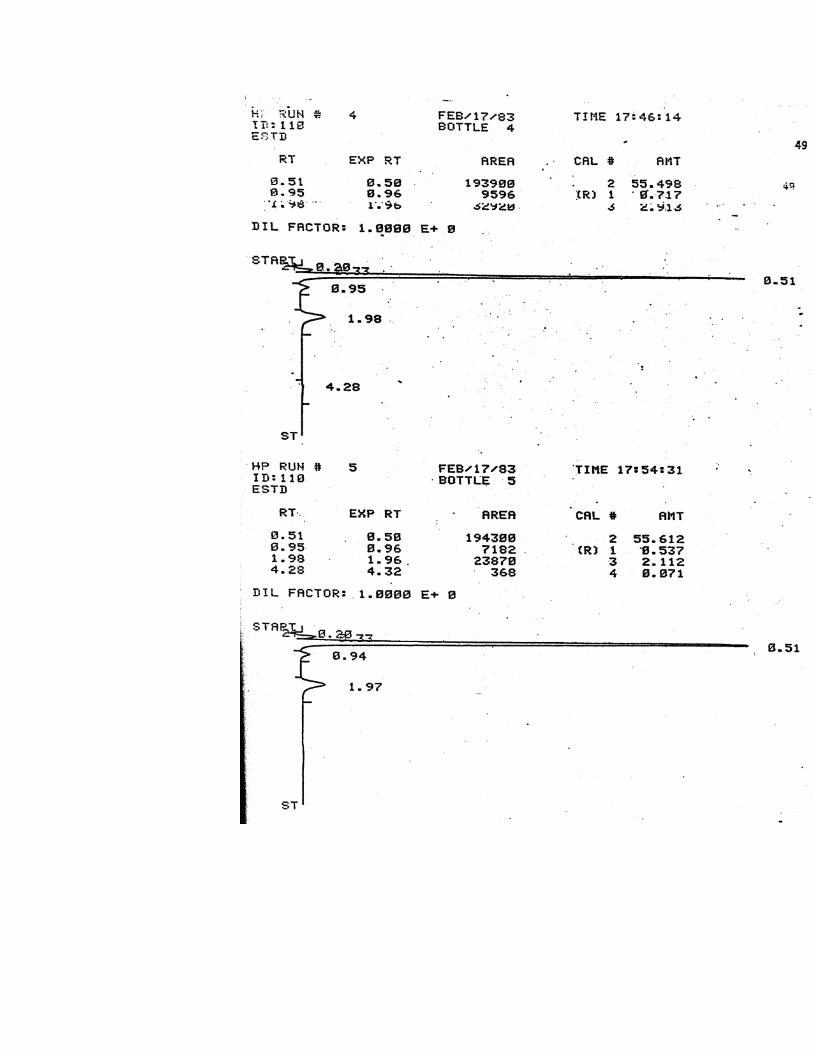
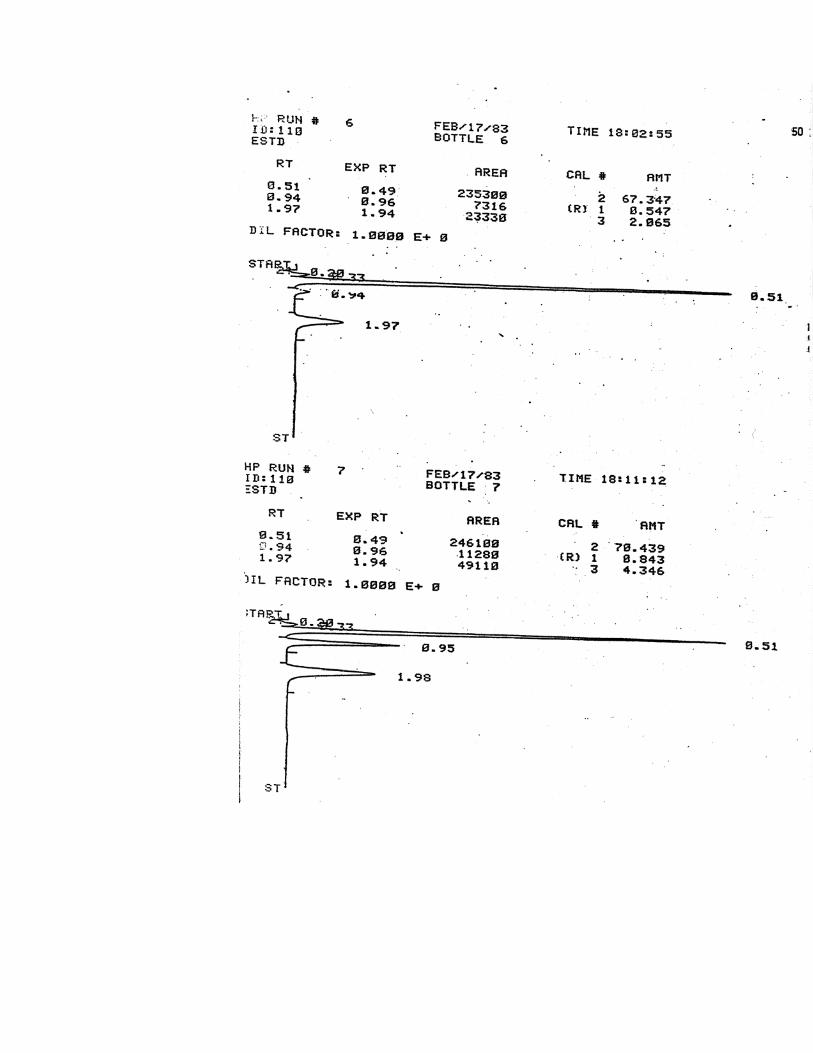
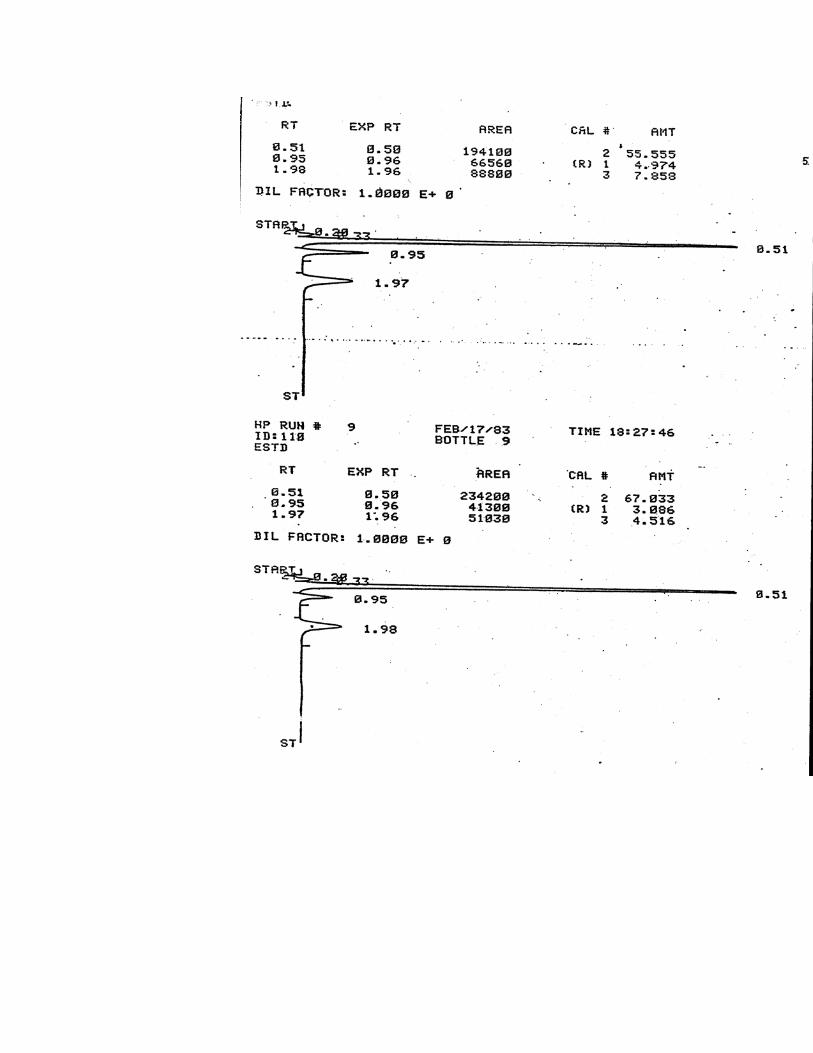
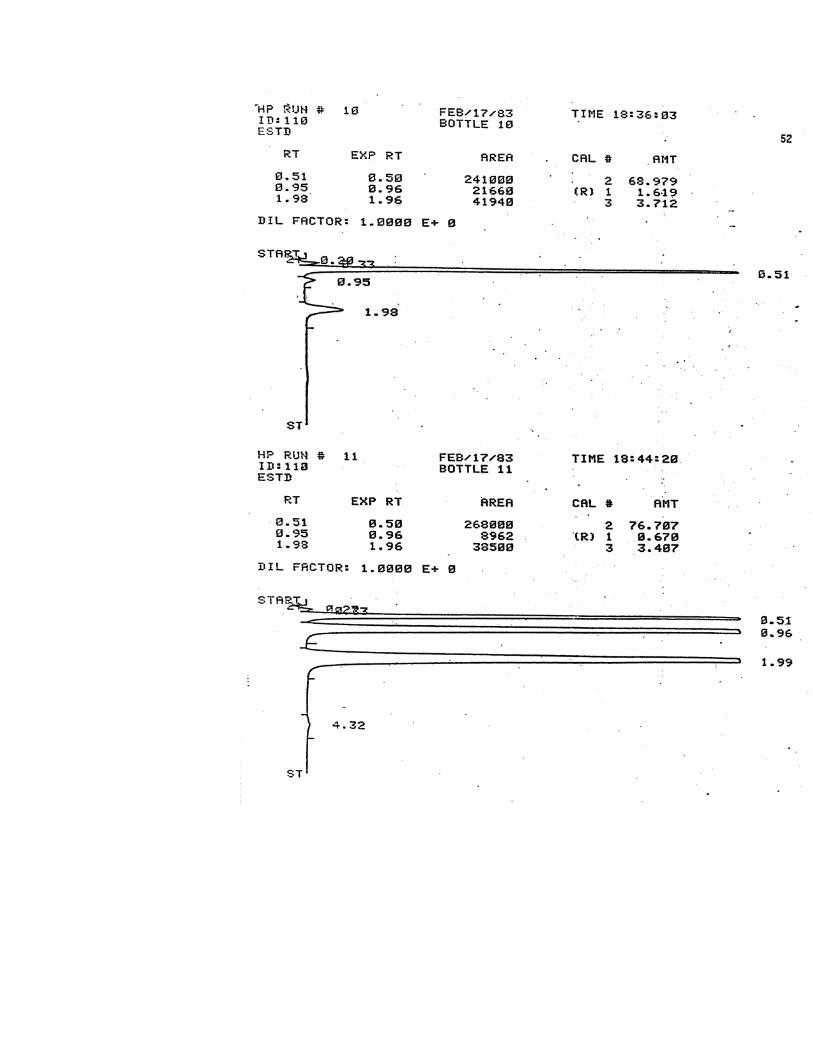
Typical chromatograms are included in Appendix B.
15
Results and Discussion
I. THM Formation Kinetics
Several sets of experiments were performed. The effect of varying
chlorine dose on the THM formation with respect to time was studied at fixed precursor
concentration. Similarly in another set of experiments, the solid concentration was varied
keeping the chlorine dose, pH, and temperature constant. These sets of experiments were
conducted for time frames: 100, 6 and 1 hours.
The last time frame was investigated primarily to evaluate the reaction kinetics, while the
100 hour time frame was investigated to simulate large distribution systems, typical of
large metropolitan areas.
TTHMFP as well as CHU3 formation potential at different time intervals are given
in Figure 2. It indicates that CHU3 predominates. Consequently, in reporting the results,
CHCz3 is the species frequently referred to, though the other species were also measured.
Formation rate of THM decreases with time. At the end of the experiment the residual
chlorine was 1.2 mg/Z. The solids concentration in Potomac water supplied by WSSC is
usually in the neighborhood of 110 mg/t.
A plot of CHU3 formation potential at two different chlorine dosages of 5 and
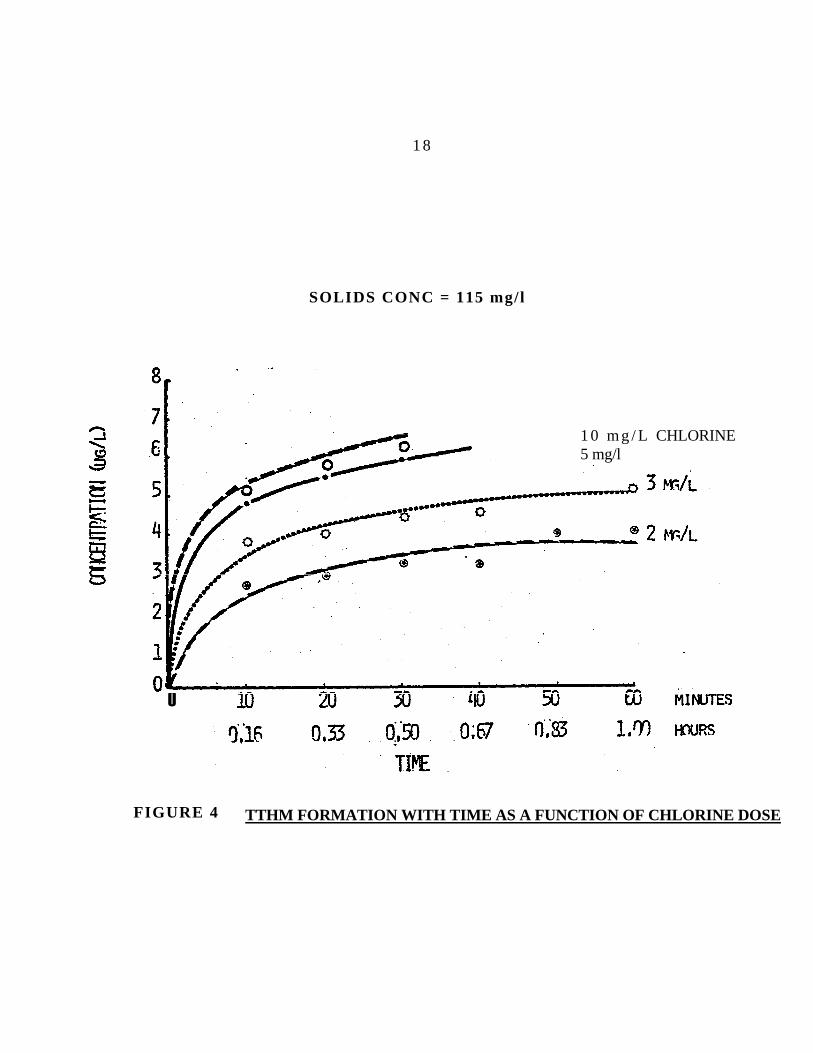
11.2 mg/z is given in Figure 3. -A similar plot for 1 hour at various chlorine doses is
depicted in Figure 4. These figures indicate that TTHMFP increased with increasing
chlorine however the increase was not linearly proportional to the chlorine dose.
At a constant chlorine dose and fixed temperature, the chloroform formation was
plotted against time, for three different solid concentrations
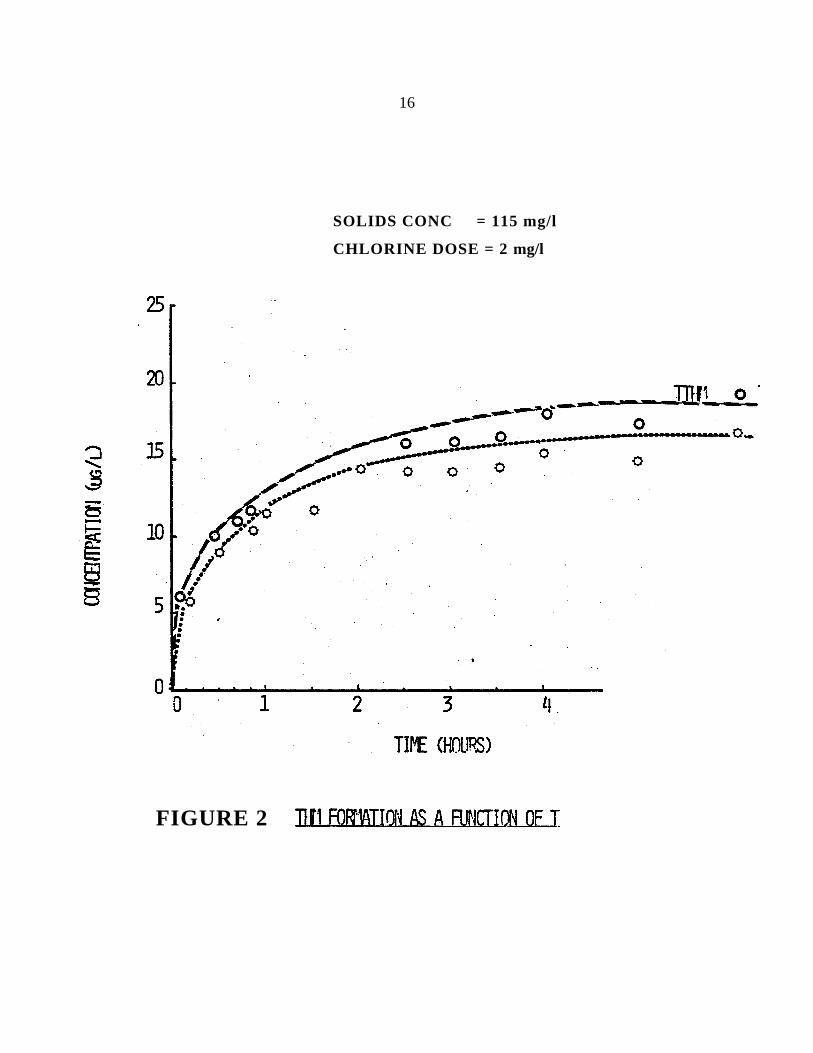
16 SOLIDS CONC = 115 mg/l
CHLORINE DOSE = 2 mg/l
FIGURE 2
17
SOLIDS CONC = 114.3 mg/l TIME (HOURS) FIGURE 3: CHCL3 FORMATION AS A FUNCTION OF TIME
1 8
SOLIDS CONC = 115 mg/l
0
1 0 m g / L CHLORINE 5 mg/l
FIGURE 4 TTHM FORMATION WITH TIME AS A FUNCTION OF CHLORINE DOSE
19
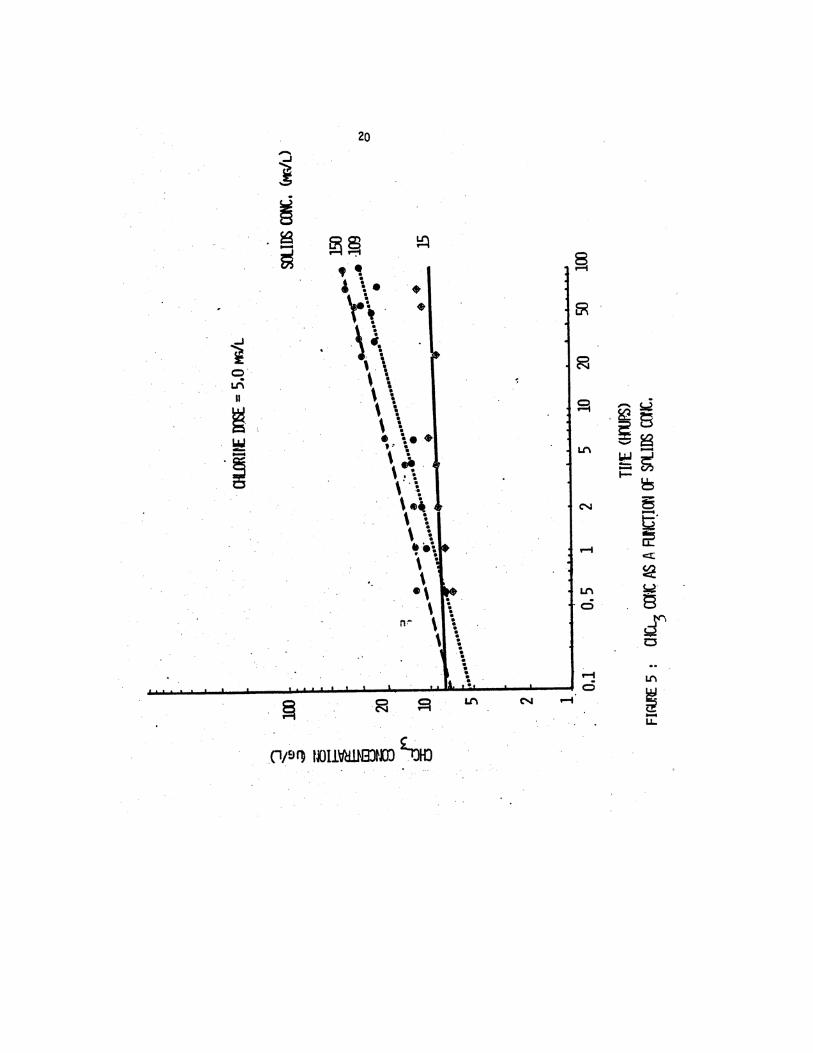
on a log-log graph as shown in Figure 5. The resulting plots are linear.
The plot at solid concentration of 15 mg/z does not indicate a significant increase in CHU3
formation potential at 100 hours; probably the precursors were depleted in a short time.
However, when the solids were increased (109 and 150 mg/R3), the CHU3 formation
increased.
Essentially the slopes for these plots are the same suggesting that qualitatively the mechanism of THM formation remains unaltered.
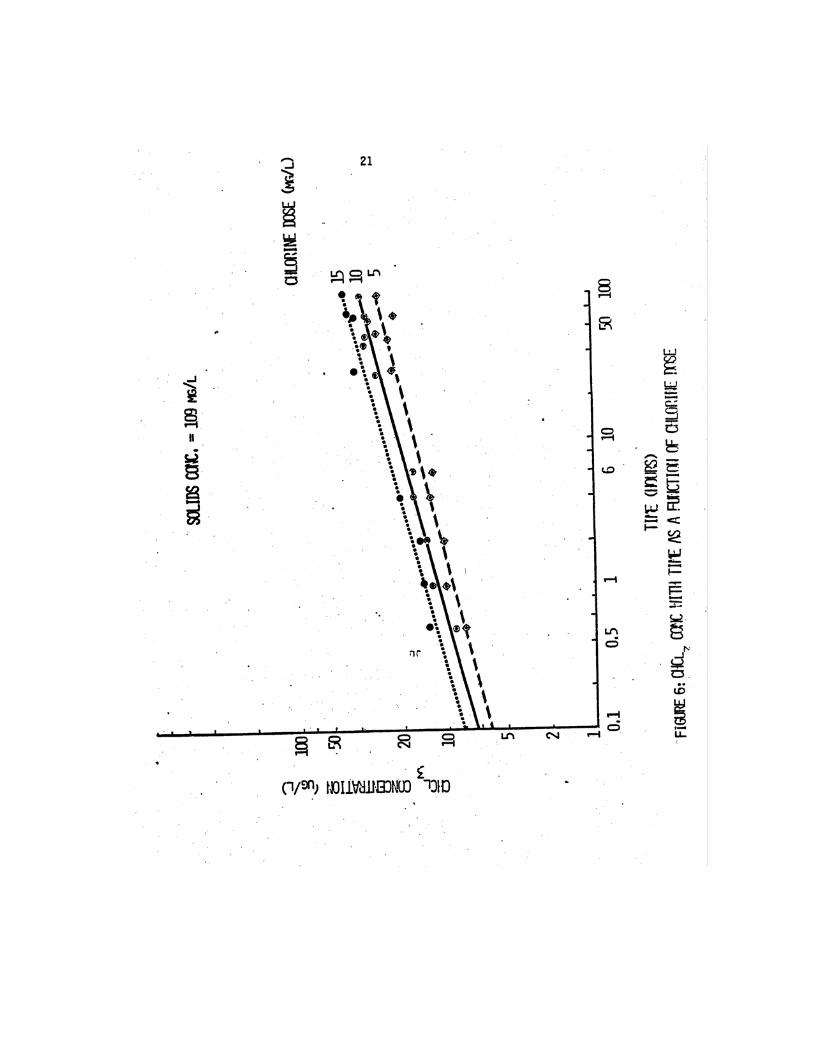
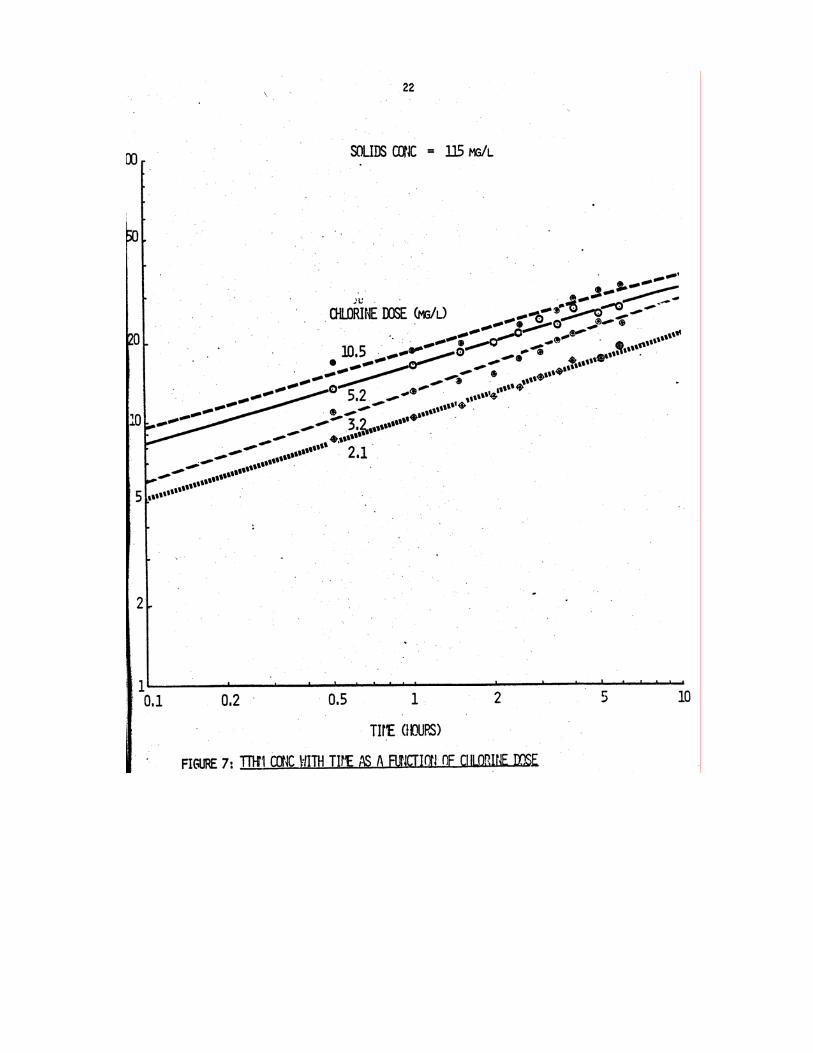
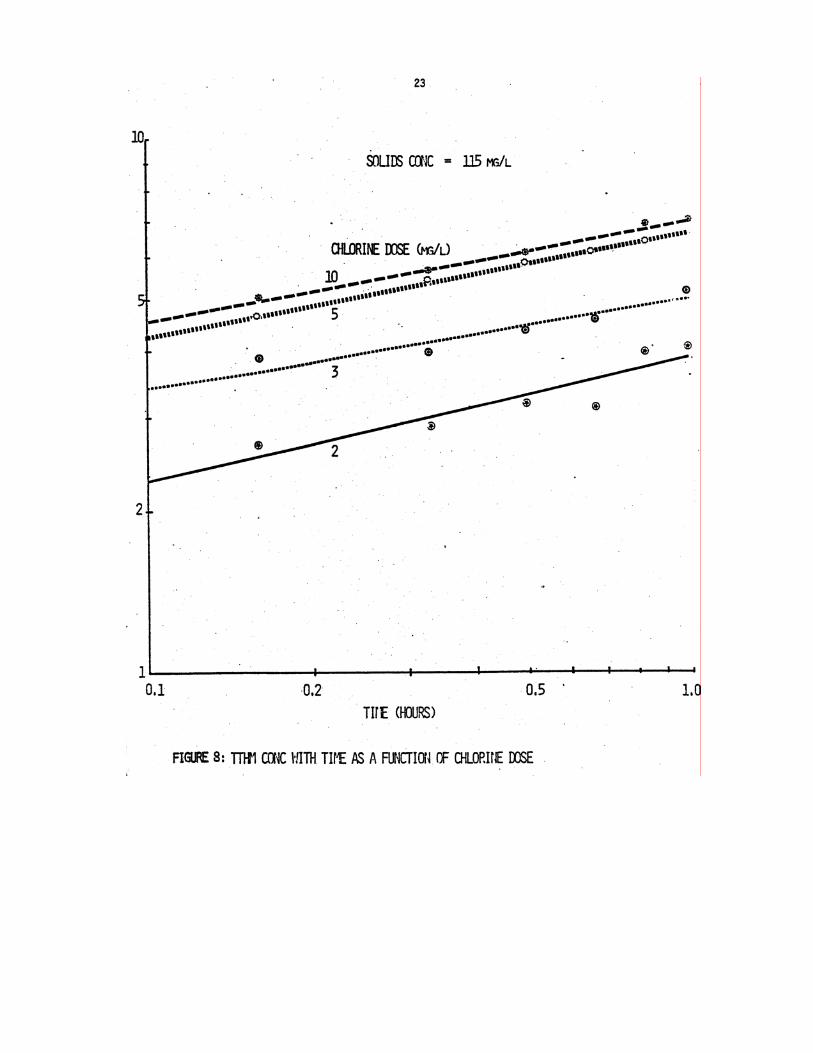
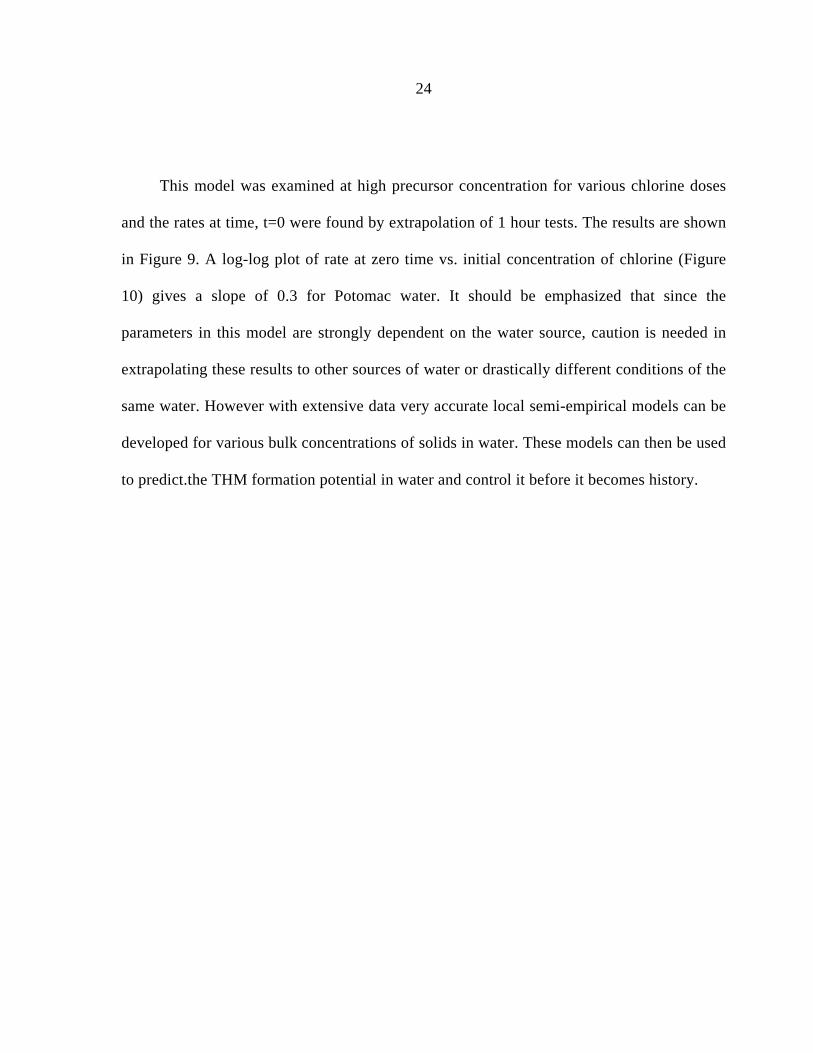
Figures 6 through 8 show formation of chloroform for various chlorine doses, for 100 hour,
6 hour and 1 hour time durations. In these experiments the concentration of precursor was
kept constant, and any increase in CHU3 was caused by a corresponding change in chlorine
dose. The family of curves obtained shows that the slopes are about the same on a log-log
plot indicating that there is no significant shift in the mechanism of reaction.
The role of chlorine in the formation of trihalomethane in water is
not well understood. Investigators appear to differ, and the comparative analysis of limited
published data on this subject cannot be done precisely because information on precursor
concentration and chlorine consumed is not readily available
A semi-empirical model is needed which would be source dependent to account for
the variation in the precursor type and concentration. The simplest model to describe this
situation is expressed below:
d THM/dt = K[precursor]a [Chlorine]B
24
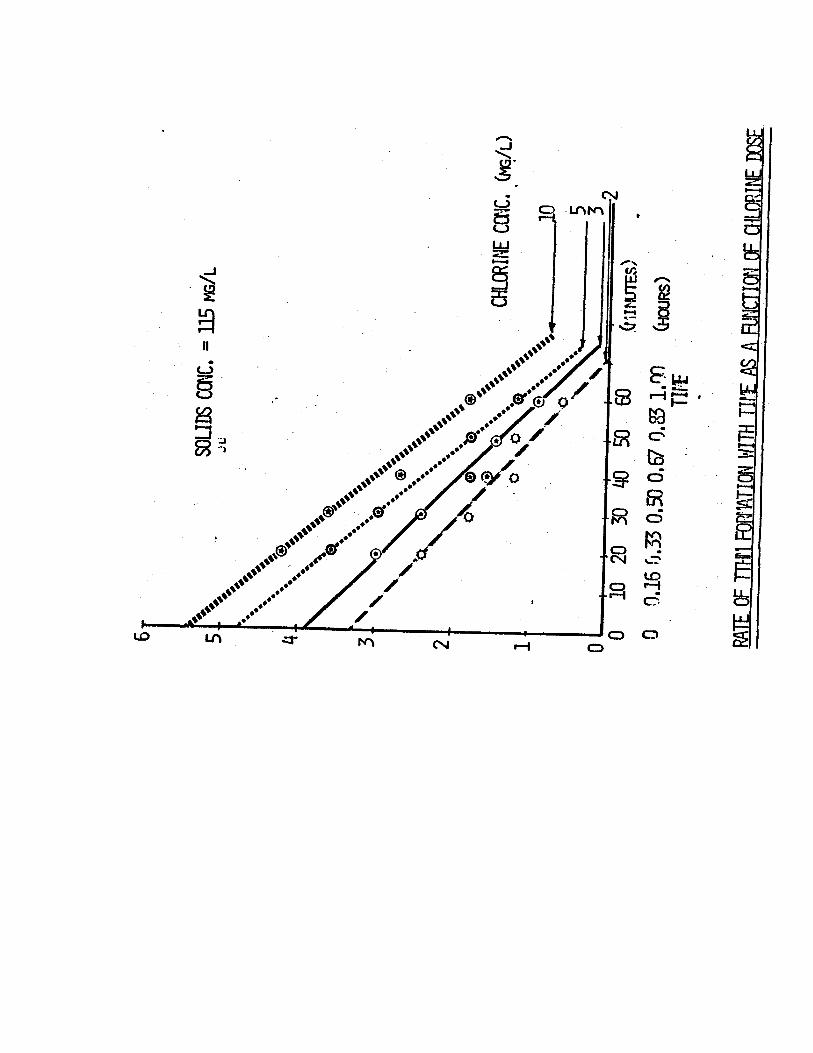
This model was examined at high precursor concentration for various chlorine doses
and the rates at time, t=0 were found by extrapolation of 1 hour tests. The results are shown
in Figure 9. A log-log plot of rate at zero time vs. initial concentration of chlorine (Figure
10) gives a slope of 0.3 for Potomac water. It should be emphasized that since the
parameters in this model are strongly dependent on the water source, caution is needed in
extrapolating these results to other sources of water or drastically different conditions of the
same water. However with extensive data very accurate local semi-empirical models can be
developed for various bulk concentrations of solids in water. These models can then be used
to predict.the THM formation potential in water and control it before it becomes history.
27
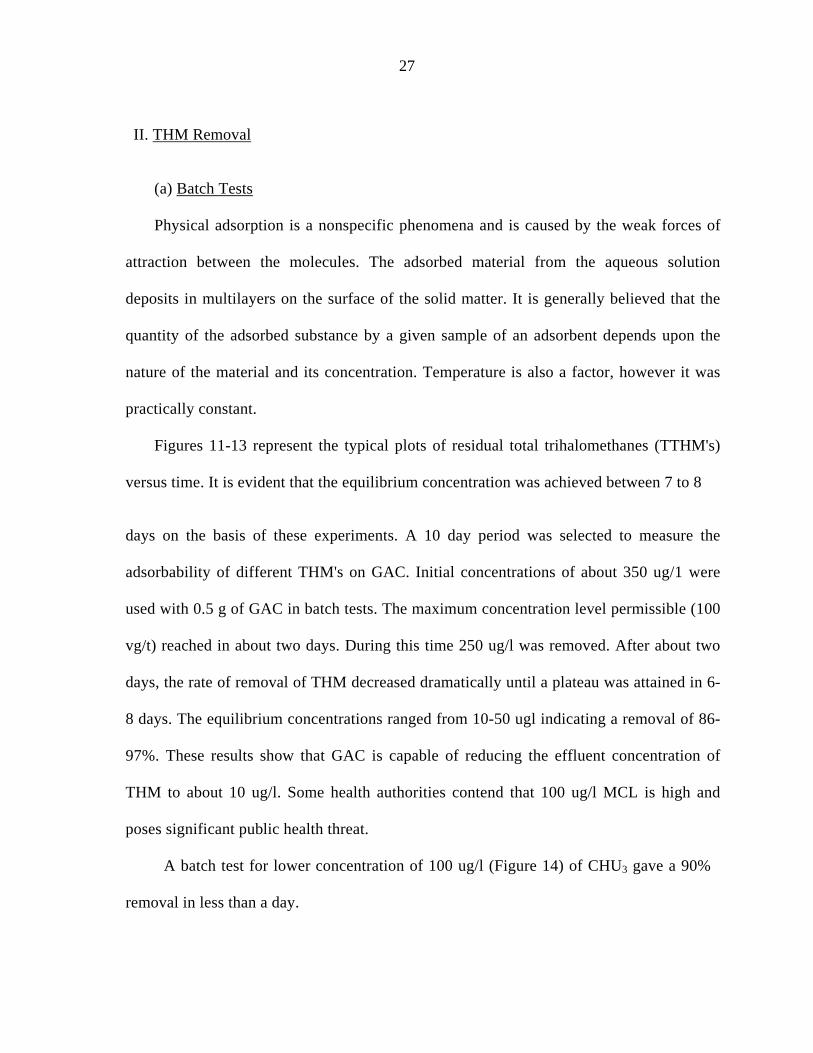
II. THM Removal
(a) Batch Tests
Physical adsorption is a nonspecific phenomena and is caused by the weak forces of
attraction between the molecules. The adsorbed material from the aqueous solution
deposits in multilayers on the surface of the solid matter. It is generally believed that the
quantity of the adsorbed substance by a given sample of an adsorbent depends upon the
nature of the material and its concentration. Temperature is also a factor, however it was
practically constant.
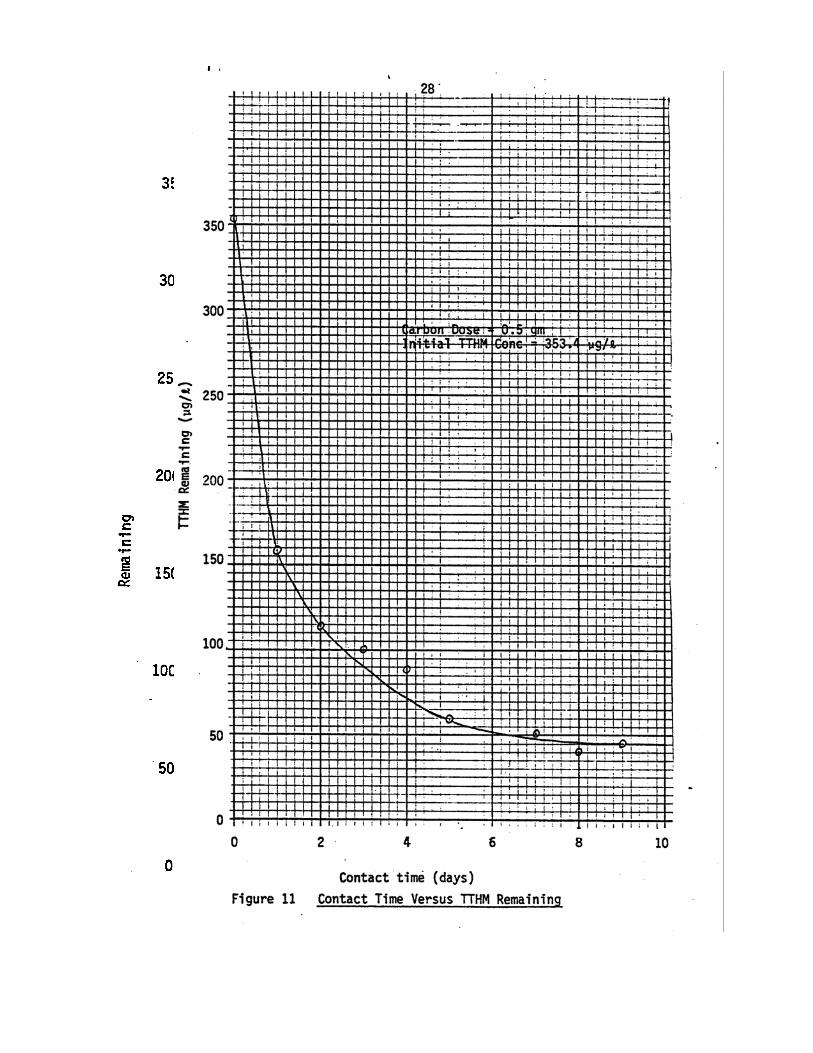
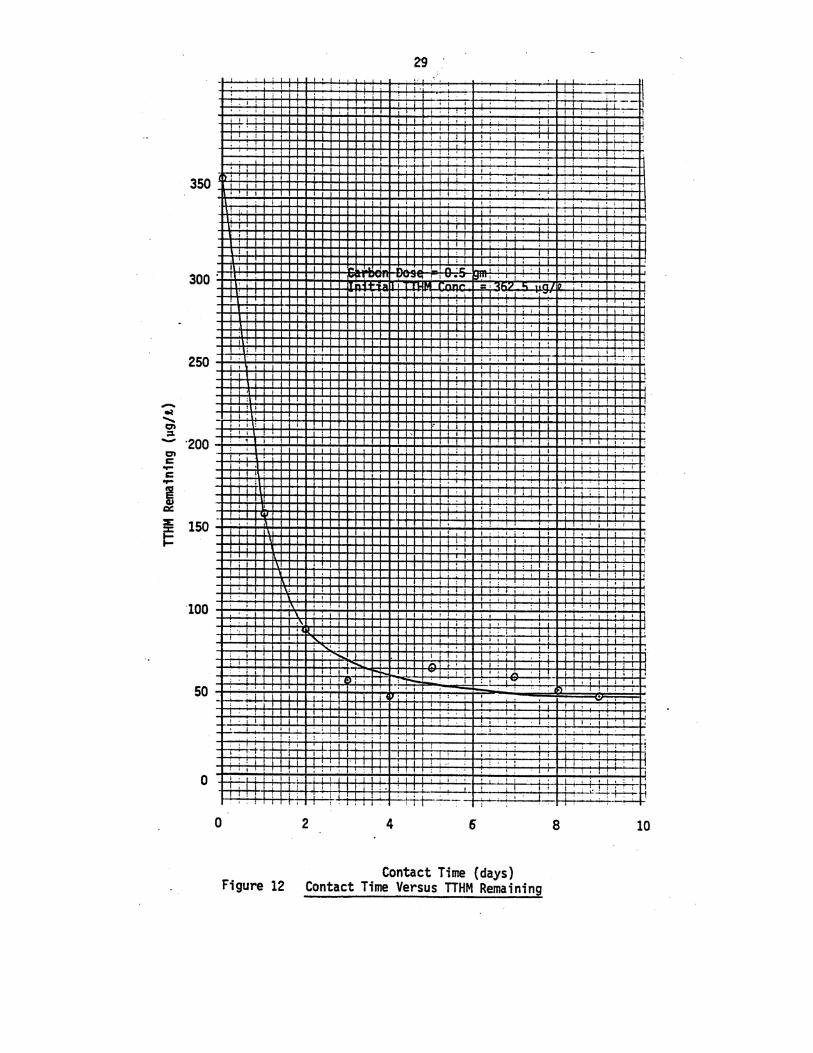
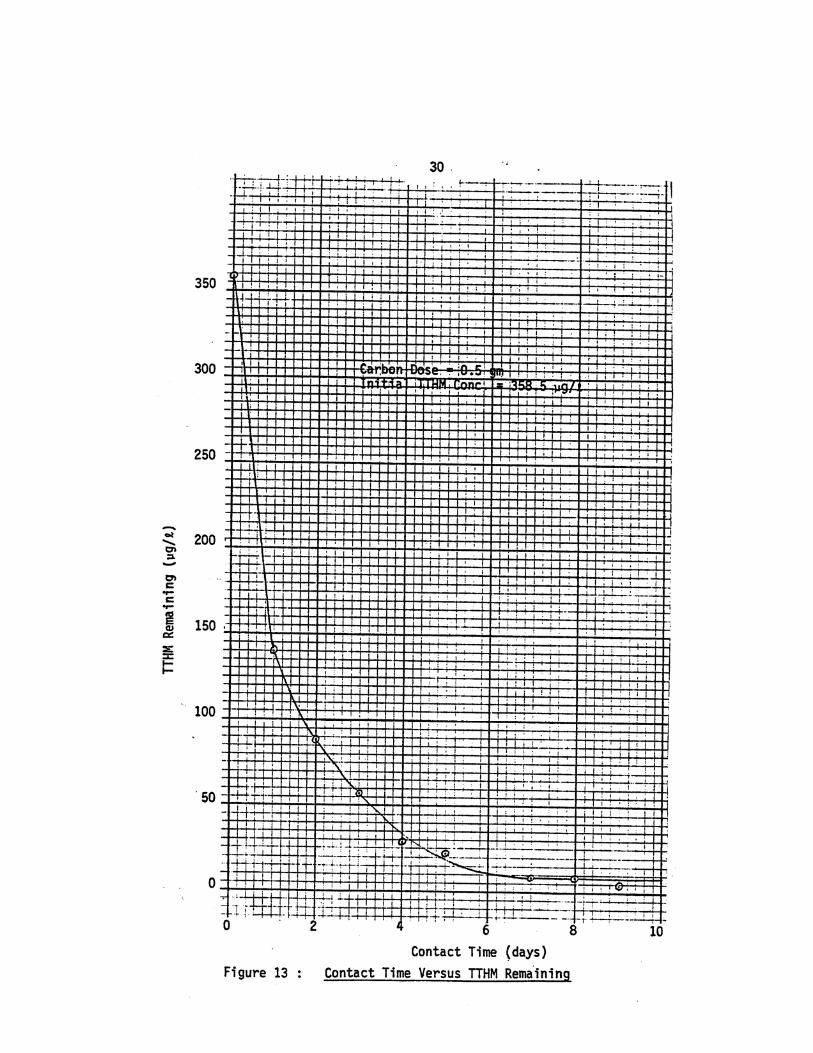
Figures 11-13 represent the typical plots of residual total trihalomethanes (TTHM's)
versus time. It is evident that the equilibrium concentration was achieved between 7 to 8
days on the basis of these experiments. A 10 day period was selected to measure the
adsorbability of different THM's on GAC. Initial concentrations of about 350 ug/1 were
used with 0.5 g of GAC in batch tests. The maximum concentration level permissible (100
vg/t) reached in about two days. During this time 250 ug/l was removed. After about two
days, the rate of removal of THM decreased dramatically until a plateau was attained in 6-
8 days. The equilibrium concentrations ranged from 10-50 ugl indicating a removal of 86-
97%. These results show that GAC is capable of reducing the effluent concentration of
THM to about 10 ug/l. Some health authorities contend that 100 ug/l MCL is high and
poses significant public health threat.
A batch test for lower concentration of 100 ug/l (Figure 14) of CHU3 gave a 90%
removal in less than a day.
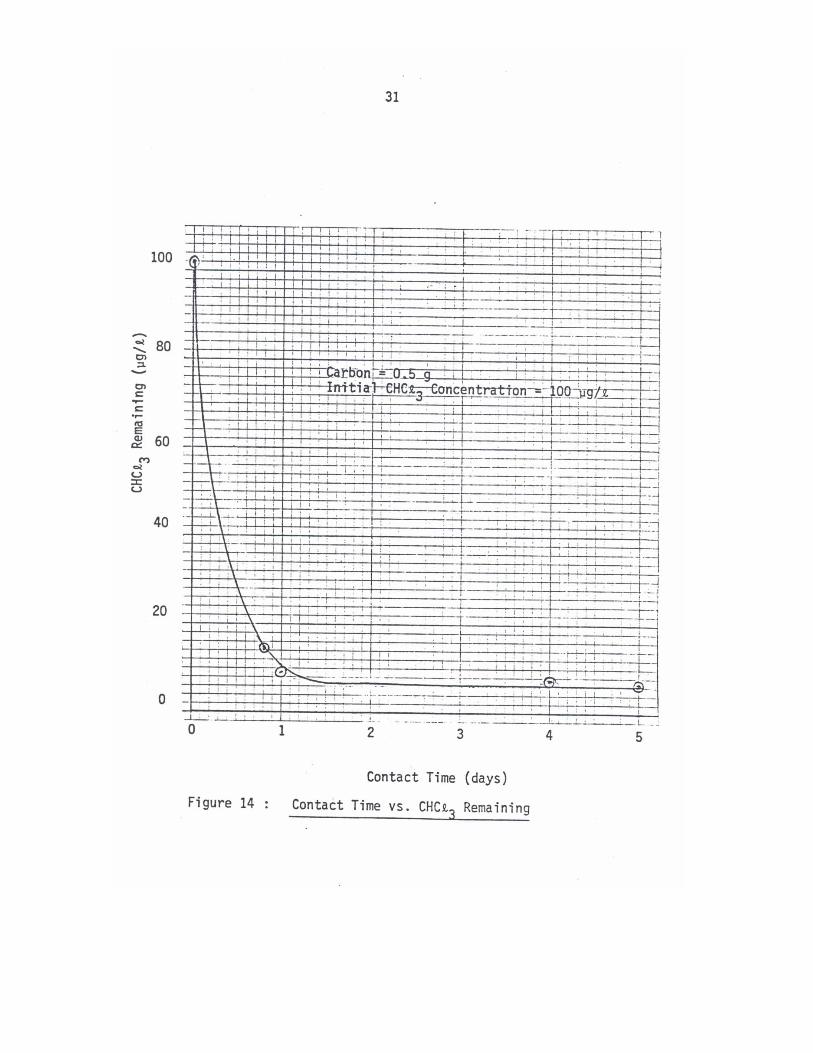
32 A plateau was reached in about two days and the equilibrium concentration was 3 ug/l
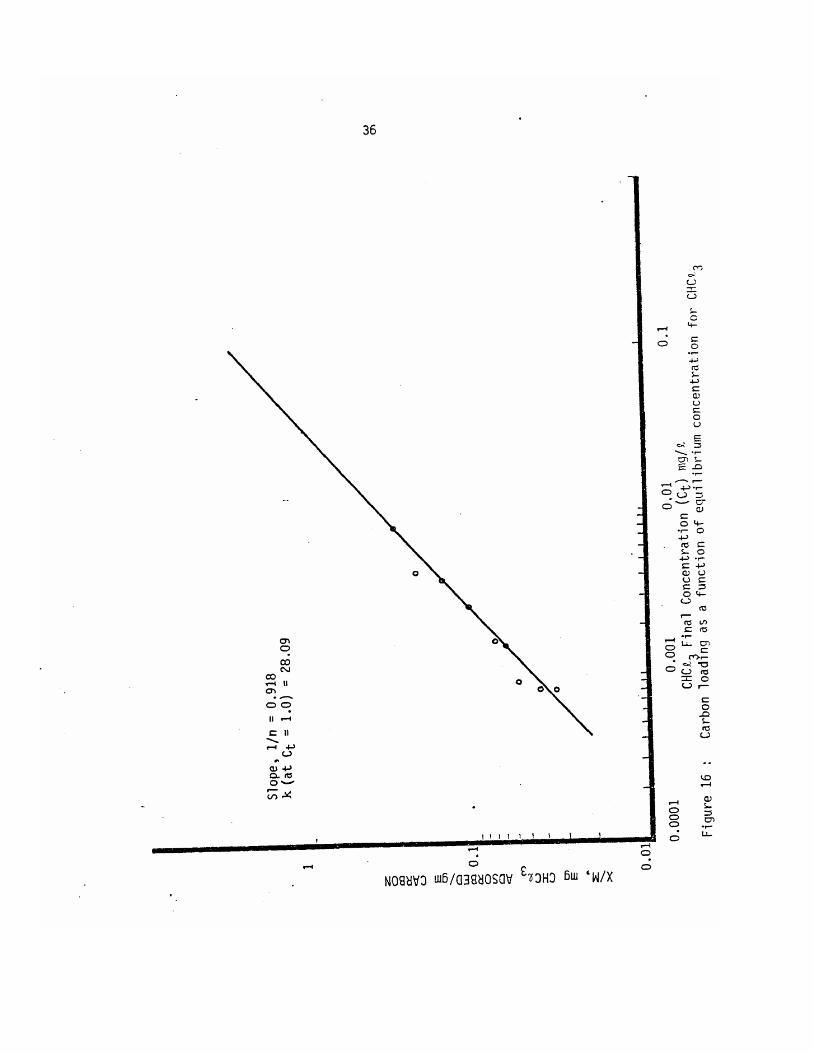
indicating a 97% reduction. As earlier expressed, Freundlich equation is often expressed in a logorithmic form:
log X/M = log k + 1/n log Ct.
Adsorption data, when plotted as X/M vs Ct on a log-log plot according to the above
equation will yield straight lines.
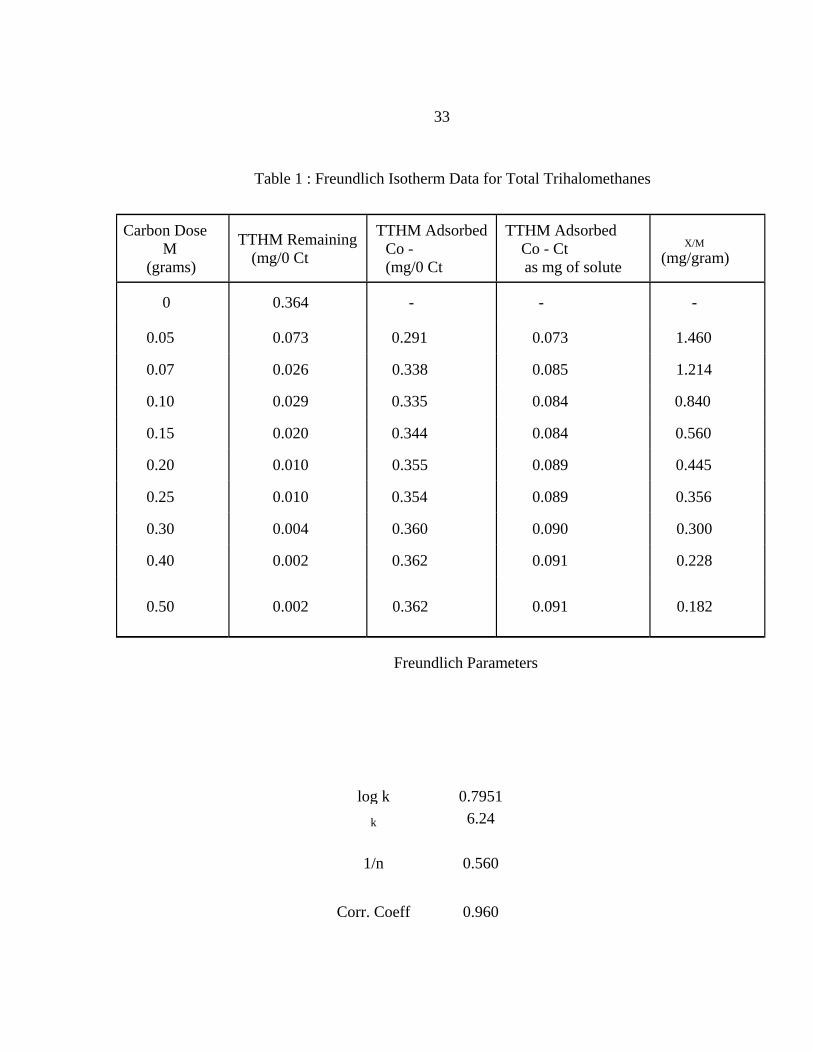
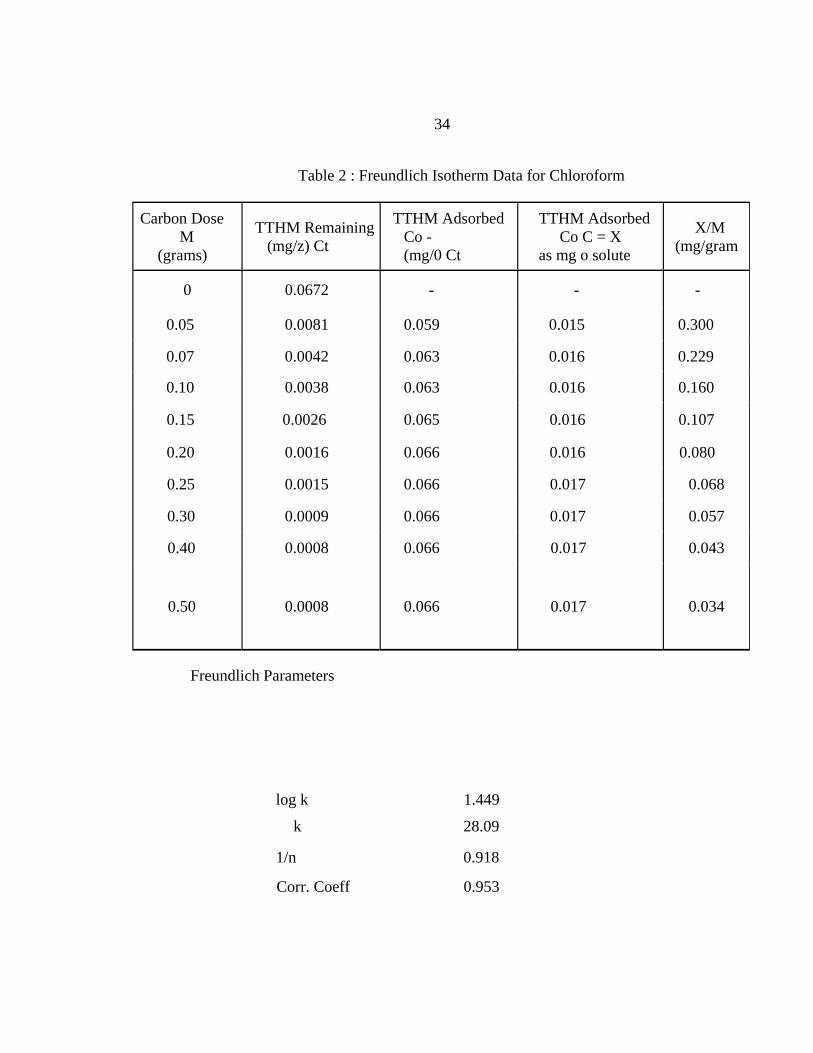
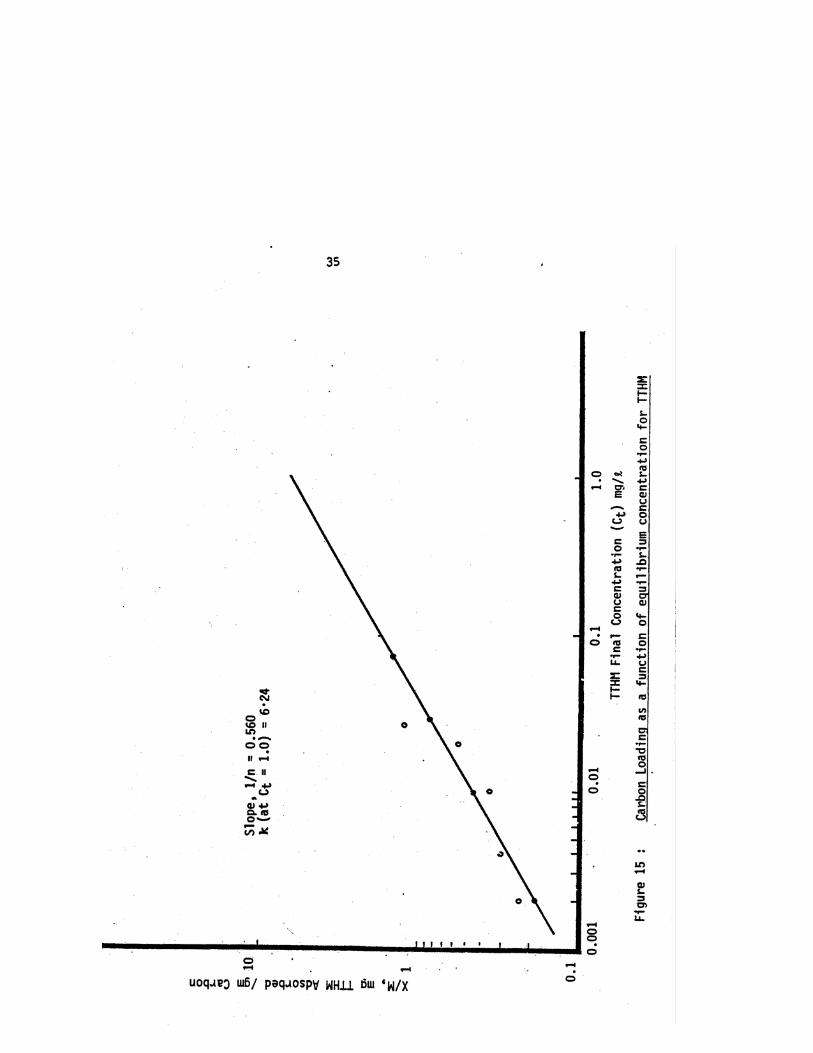
Tables 1 and 2 summarize the initial carbon doses used and residual chloroform or total
trihalomethanes remaining in the solution after treatment with GAC. The columns in the
tables are self explanatory. Values
of X/M (mg of TTHM or chloroform/ g carbon) were plotted functions of equilibrium
concentrations in Figures 15 and 16. The resulting plots are straight lines verifying the
Freundlich Isotherm hypothesis.
The parameters k and 1/n were obtained from these plots. The resulting equations for the
removal of TTHM and CHC23 are plotted as:
TTHM : log X/M = 0.795 + 0.560 log Ct CHCl.3 : log X/M = 1.449 + 0.918 log Ct
and 9 where X and M are in mg-and Ct is in mg/t. A higher 1/n value for CHU3 indicates that the
breakpoint will occur more abruptly for CHCL3 used singularly than in mixed substrate
conditions. From the THM formation kinetics results presented earlier in Figure 2, it is
evident that the chloroform formation is about 90% of the TTHM's. Therefore in the
removal mechanism chloroform will appear earlier in the effluent than the other three
species which will be adsorbed for a longer period of time. Therefore the emphasis should
be given to CHU3 concentration in the effluent more heavily than the arithmetic
33
Table 1 : Freundlich Isotherm Data for Total Trihalomethanes
Carbon Dose TTHM Adsorbed TTHM Adsorbed TTHM Remaining X/M M Co - Co - Ct (mg/0 Ct (grams) (mg/0 Ct as mg of solute (mg/gram)
0 0.364 - - -
0.05 0.073 0.291 0.073 1.460
0.07 0.026 0.338 0.085 1.214
0.10 0.029 0.335 0.084 0.840
0.15 0.020 0.344 0.084 0.560
0.20 0.010 0.355 0.089 0.445
0.25 0.010 0.354 0.089 0.356
0.30 0.004 0.360 0.090 0.300
0.40 0.002 0.362 0.091 0.228
0.50 0.002 0.362 0.091 0.182
Freundlich Parameters
log k 0.7951k 6.24
1/n 0.560
Corr. Coeff 0.960
34
Table 2 : Freundlich Isotherm Data for Chloroform
Carbon Dose TTHM Adsorbed TTHM Adsorbed TTHM Remaining X/M M Co - Co C = X (mg/z) Ct (grams) (mg/0 Ct as mg o solute (mg/gram
0 0.0672 - - -
0.05 0.0081 0.059 0.015 0.300
0.07 0.0042 0.063 0.016 0.229
0.10 0.0038 0.063 0.016 0.160
0.15 0.0026 0.065 0.016 0.107
0.20 0.0016 0.066 0.016 0.080
0.25 0.0015 0.066 0.017 0.068
0.30 0.0009 0.066 0.017 0.057
0.40 0.0008 0.066 0.017 0.043
0.50 0.0008 0.066 0.017 0.034
Freundlich Parameters
log k 1.449
k 28.09
1/n 0.918
Corr. Coeff 0.953
37
sum of all the four THM species, when evaluating the reaction kinetics of adsorption.
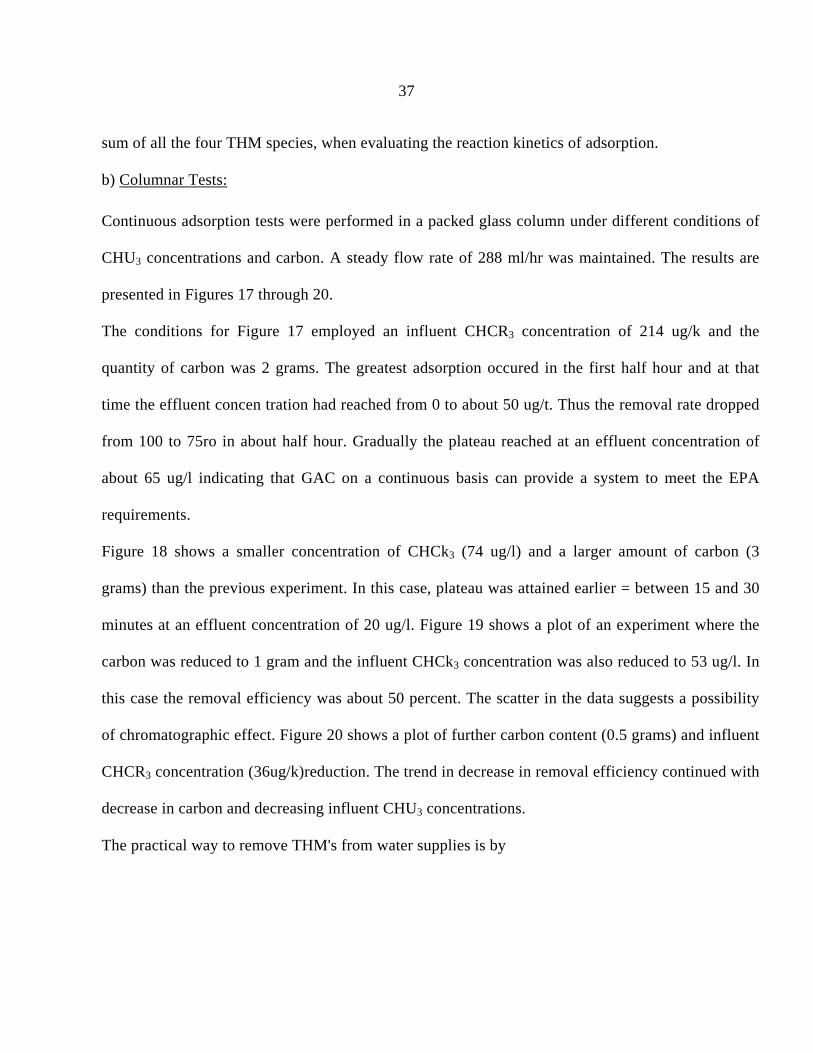
b) Columnar Tests:
Continuous adsorption tests were performed in a packed glass column under different conditions of
CHU3 concentrations and carbon. A steady flow rate of 288 ml/hr was maintained. The results are
presented in Figures 17 through 20.
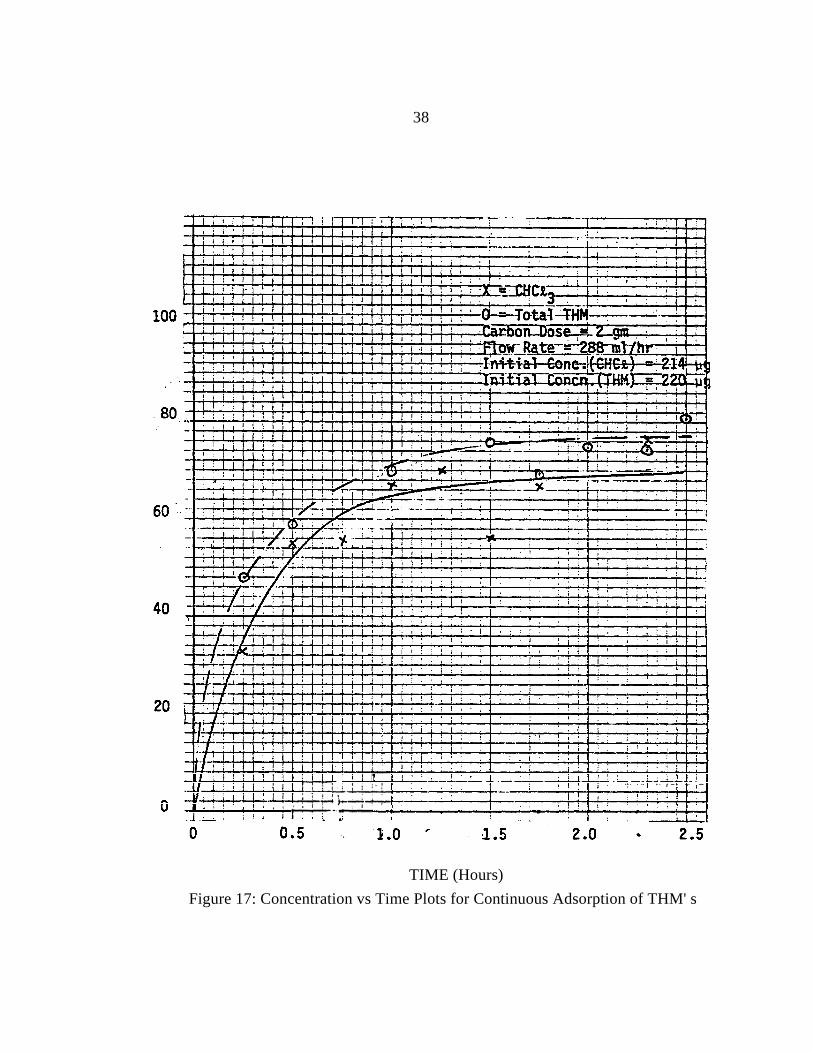
The conditions for Figure 17 employed an influent CHCR3 concentration of 214 ug/k and the
quantity of carbon was 2 grams. The greatest adsorption occured in the first half hour and at that
time the effluent concen tration had reached from 0 to about 50 ug/t. Thus the removal rate dropped
from 100 to 75ro in about half hour. Gradually the plateau reached at an effluent concentration of
about 65 ug/l indicating that GAC on a continuous basis can provide a system to meet the EPA
requirements.
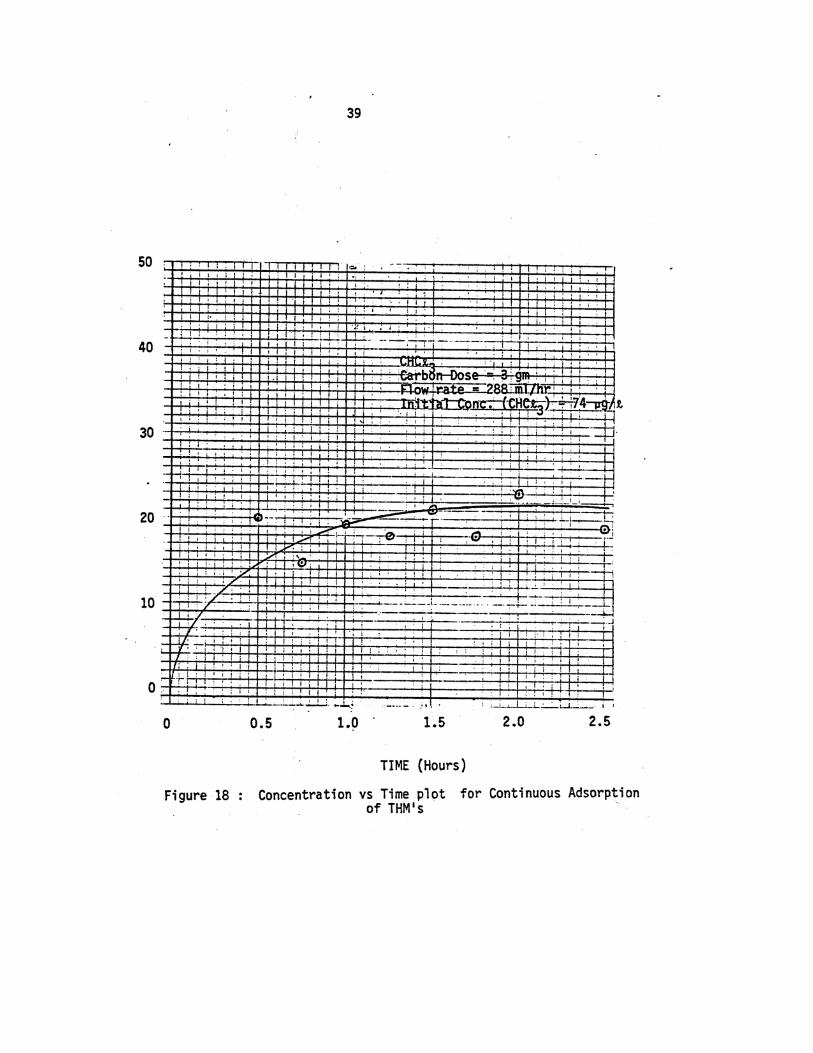
Figure 18 shows a smaller concentration of CHCk3 (74 ug/l) and a larger amount of carbon (3
grams) than the previous experiment. In this case, plateau was attained earlier = between 15 and 30
minutes at an effluent concentration of 20 ug/l. Figure 19 shows a plot of an experiment where the
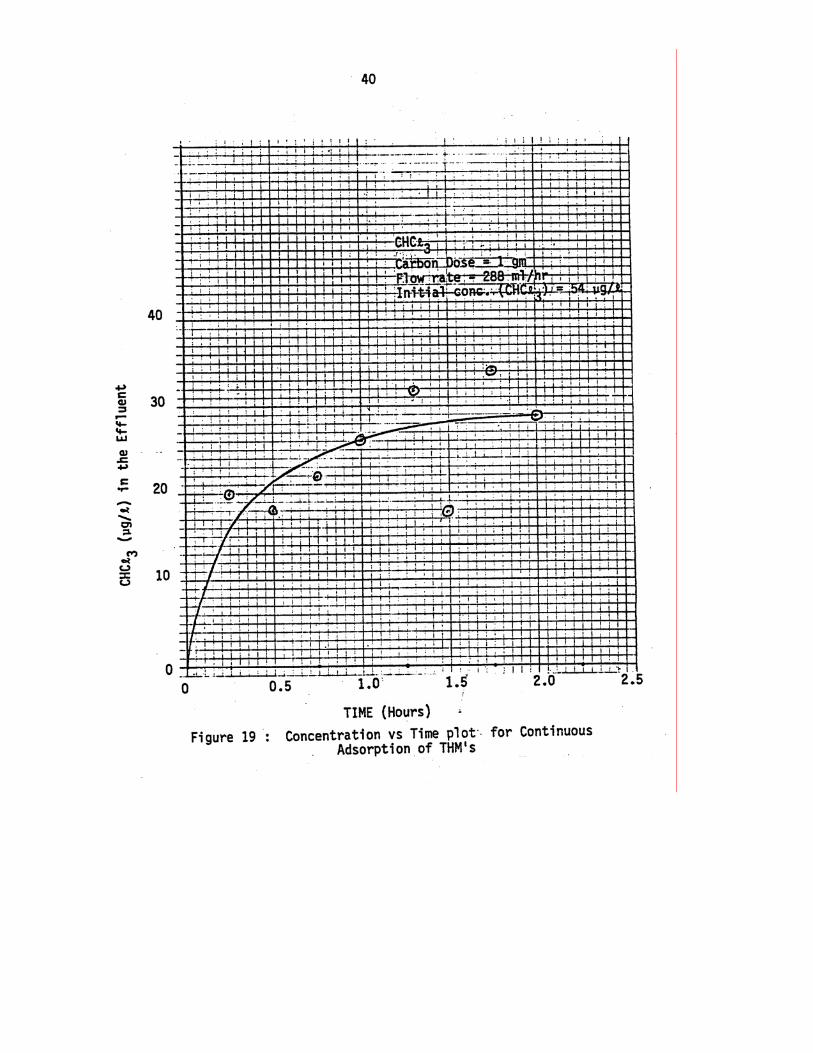
carbon was reduced to 1 gram and the influent CHCk3 concentration was also reduced to 53 ug/l. In
this case the removal efficiency was about 50 percent. The scatter in the data suggests a possibility
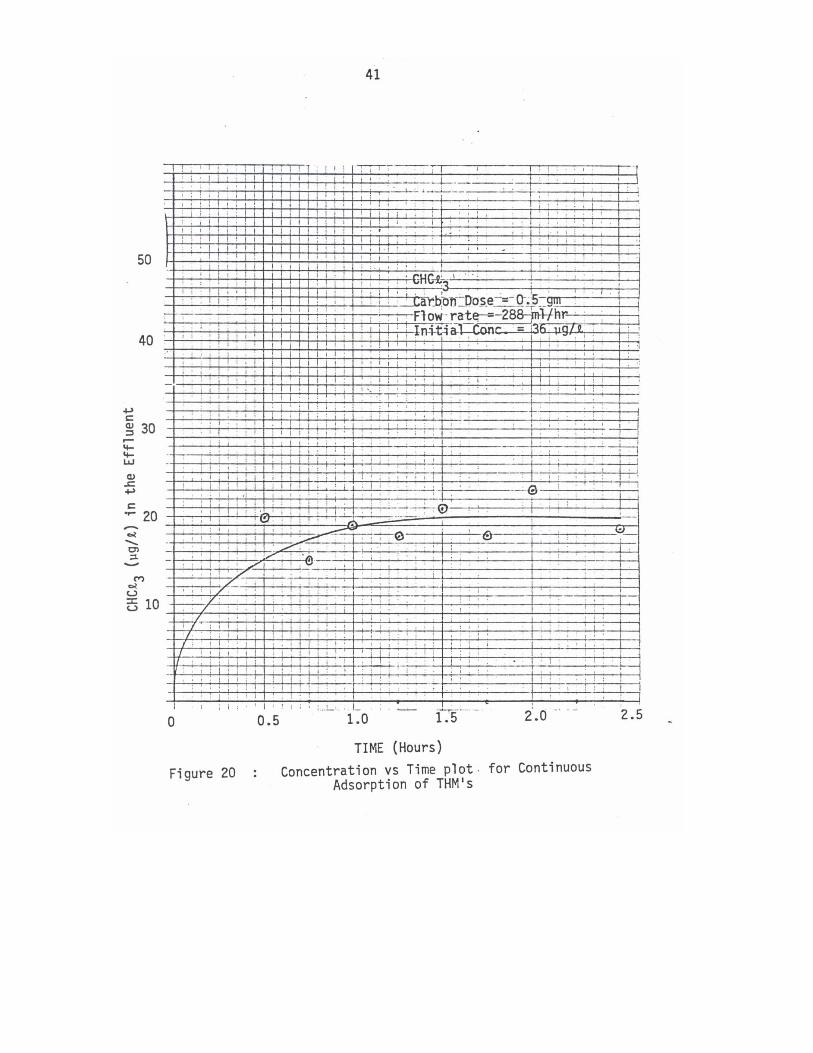
of chromatographic effect. Figure 20 shows a plot of further carbon content (0.5 grams) and influent
CHCR3 concentration (36ug/k)reduction. The trend in decrease in removal efficiency continued with
decrease in carbon and decreasing influent CHU3 concentrations.
The practical way to remove THM's from water supplies is by
38
TIME (Hours) Figure 17: Concentration vs Time Plots for Continuous Adsorption of THM' s
42
continuous process. Our results show that GAC can be used to meet the existing EPA-
THM standards. In addition it has the reserve capacity of providing an effluent with
many time more stringent standards with a judicious choice of conditions such as
retention time, flow rate, packing size and regeneration techniques.
43
Conclusions
(1) The study of THM formation indicates that about 90% of the TTHM formed is CHCR3.
(2) Over a wide range of chlorine concentrations (2-15 mg/t) the mechanism of THM formation remains unchanged.
(3) Over a wide range of solids (precursors) concentrations (15-50 mg/k), the mechanism of THM formation remains unchanged.
(4) The THM formation increases with increase in chlorine concentration but the increase is not linear.
(5) The THM formation increases with increase in precursors concentration.
(6) The rate of THM formation decreases with time.
(7) A simple kinetic model for THM formation predicts an order of 0.3 for chlorine concentration. (8) Adsorption studies for THM removal indicate an equilibrium time of about 6-8 days.
(9) The THM removal by GAC appears to conform to Freundlich Isotherms.
(10) The breakpoint in chloroform removal as compared to TTHM appears more abrupt.
(11) Columnar studies confirmed the batch data that GAC can be effectively used for THM removal on a continuous basis to meet EPA regulations - both current and probable stringent standards in the future.
(12) The removal efficiencies decrease with decrease in carbon content and decrease in influent chloroform concentrations.
44
Recommendations
(1) Attempts should be made to develop a more rigorous predictive model for THM formation in water.
(2) Studies should be carried out to determine the seasonal effects and incorporate them in the predictive model.
(3) The removal efficiencies of binary and multicomponent systems of THM's should be studied in a continuous manner.
(4) The effects of carbon dose and influent concentrations on the removal efficiencies and carbon life should be quantified.
(5) A predictive model for THM removal by GAC should be developed.
45
References
1) Bellar, T.A. et al, "The Occurrence of Organohalides in Finished Drinking Waters", Journal AWWA, 66: 12: 703 (December,1974).
2) Blanck, C.A., "Trihalomethane Reduction in Operating Water Treatment Plants, "JAWWA, 71, 525-528 (September 1979).
3) DeMarco, J. and Wood, P., "Design Data for Organic Removal by Carbon Beds", In: Proceedings - National Conference on Environmental Engineering, American Society of Civil Engineers, Kansas City, MO., July 10 12, 1978, American Society of Civil Engineers, New York, NY (1979)
4) Mieure, J.P., "A Rapid and Sensitive Method for Determining Volatile Organohalides in Water", Journal AWWA, 69:1:60 (January 1977).
5) Richard, J.J. and Junk, G.A., "Liquid Extraction for the Rapid Determination of Halomethanes in Water", Journal AWWA, 69:1:62 (January 1977).
6) Rook, J.J., "Formation of Haloforms During Chlorination of Natural Waters", Water Treat. Exam., 231 (1974).
7) Stevens, A.A., et al, "Clorination of Organics in Drinking Water", U.S. EPA Report, Cincinnati, Ohio, 1975.
8)- Smith, V.L., Cech, I., Brown, J.H. and Bogdan, G.F., "Temporal Variations in Trihalomethane Content of Drinking Water", ES&T, 14 (2): 190 (February 1980).
9) USEPA, "Control of Organic Chemical Contaminants in Drinking Water", Fed. Reg. (February 9, 1978).
10) Varma, M.M., Siddique, M.R., Doty, K. and Machis, A., "Analysis of Trihalomethanes in Aqueous Solutions: A Comparative Study", Journal AWWA, 71:7:389 (July 1979).
11) Varma, M.M. et al, "Detection and Causation of Trihalomethanes in Rural Water", Project Report. Office of Research and Development U.S. EPA, Cincinnati, Ohio, 1981.
12) Wood, P.R., and DeMarco, J., "Effectiveness of Various Adsorbents in Removing Organic Compounds from Water - Part II - Removing Total Ogranic Carbon and Trihalomethane Precursor Substances", In: Activated Carbon Adsorption of Organics from the Aqueous Phase, Vol. II, McGuire, M.J., and Suffet, I.H., Eds., Ann Arbor Science Publishers, Inc., Ann Arbor, MI (1980) p. 115-136.

46
Appendix A
Sample Calculations weight of 50 ml volumetric flask below mark with methanol and lid = 90.2882 gm
weight of flask and chloroform and methanol and lid = 90.2986 gm
90.2986 gm
- 90.2882 gm weight of chloroform 0.0104 concentration of chloroform = 0.0104 gm/50 ml
or 10.4 mg/50 ml
or 10400 ug/50 ml OR 208 vg/ml - stock solution
Take 10 ml of stock solution and make it to 100 ml with methanol. The concentration would
become 20.8 vg/ml - This is the Intermediate Solution.
Take the required amount of Intermediate Solution according to the concentration requirements
for each experiment.
47
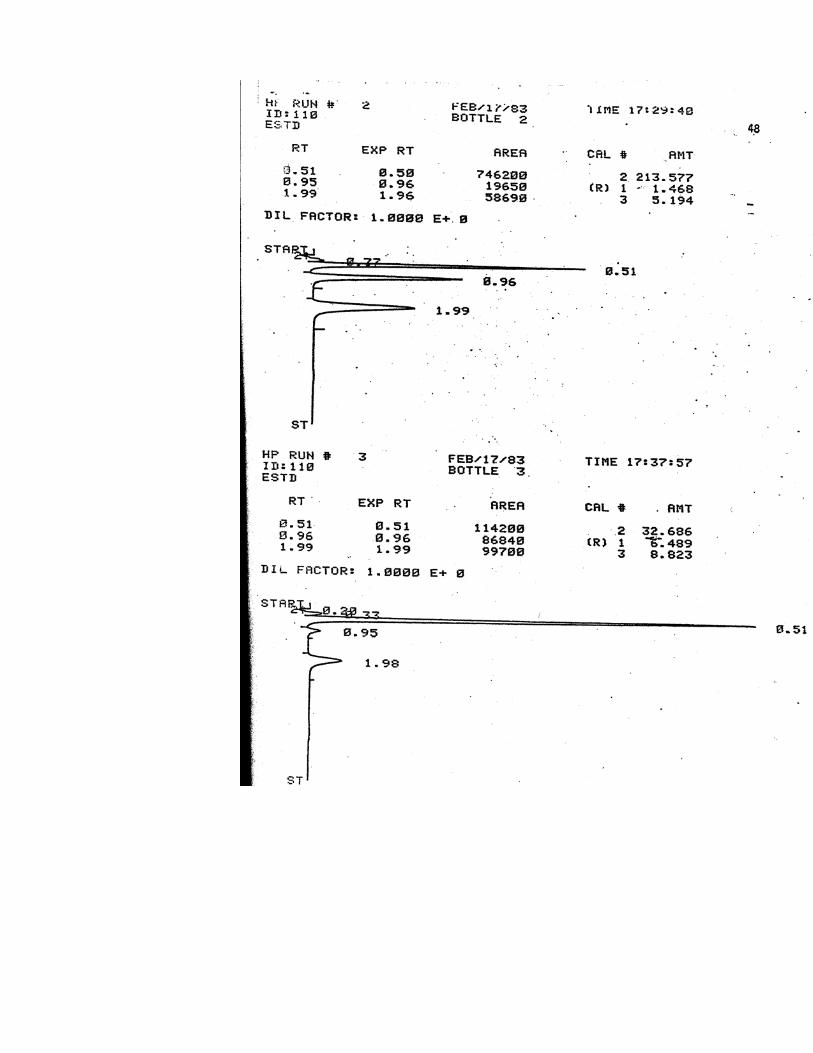
Appendix B
GC Analysis The THM analysis using GC-electron capture detector produces computerized
plots of relative peak intensities and peak areas. Typical plots for a few samples are
included in this Appendix. The nomenclature for these plots is as follows:
Speci ,=. #1 = CHCR2 Br
2 = CHU3
3 = CHU Br2
4 = CHBr3
RT indicates the retention time for each-speci, which identifies the speci. Area is
calculated by the integrator in the instrument and relative amounts in ug/l are displayed
on the chromatograms. The initial concentration of CHU3 for the sample plots shown was
214 ug/l and the TTHM was 220 ug/l.


Appendix C
Glassware Used
volumetric pipettes 0.5 ml, 1, 5, 10 and 2.0 ml
graduated pipettes 0.5 ml, 1, 5, 10 and 2.0 ml
pi pumps, microliter syringes
volumetric flask - 10, 25, 50, 100, 200, 250 ml, 500 ml, 1000 ml and 2000 ml
screw caps and test tubes
tweezers, thermometers
drying tray, tongs or pair of gloves test tube rack, scintillation vials, scintillation rack, filtration flask, vacuum pumps,
filter paper 0.45 u, beakers all sizes, disposable pipetts, pipette dispenser,
wash tray, microvial, microcaps, crimper, methanol, CHCk3 solution,
granular activated carbon
dark bottle for storing GAC,
oven, refrigerator, continuous column storage tank.