Embed Size (px)
Citation preview

RURAL CONNECTIONS: CHALLENGES AND OPPORTUNITIES IN
AMERICA’S HEARTLAND
MAY 2020
Founded in 1971, TRIP ® of Washington, DC, is a nonprofit organization that researches, evaluates and distributes economic and technical data on surface transportation issues. TRIP is sponsored by insurance companies, equipment manufacturers, distributors and suppliers; businesses involved in highway and transit engineering and construction; labor unions; and organizations concerned with efficient and safe surface transportation.

1
Executive Summary America's rural heartland is the primary source of many of the goods and products that
supports our nation’s economy and way of life. It also is home to a significant share of the nation’s population and many of its natural resources and popular tourist destinations. The strength of the nation’s rural economy is heavily reliant on the quality of its transportation system, particularly the roads and highways that link rural America with the rest of the U.S. and to markets in other countries. The importance of the rural transportation system as the backbone of the nation’s energy, food and fiber supply chain has been heightened during the response to the COVID-19 pandemic.
America’s rural transportation network provides the first and last link in the supply chain from farm to market. The quality and connectivity of America’s rural transportation system supports the economy of the entire nation and quality of life for the approximately 60 million Americans living in rural areas. Good transportation is essential in rural areas to provide access to jobs, to facilitate the movement of goods and people, to access opportunities for health care and education, and to provide links to other social services.
Roads, highways, rails and bridges in the nation’s heartland face a number of significant challenges: they lack adequate capacity; they fail to provide needed levels of connectivity to many communities; and, they cannot adequately support growing freight travel in many corridors. Rural roads and bridges have significant deficiencies and deterioration, they lack many desirable safety features, and they experience fatal traffic crashes at a rate far higher than all other roads and highways. This report looks at the condition, use and safety of the nation’s rural transportation system, particularly its roads, highways and bridges, and identifies needed improvements.
Addressing the nation’s rural transportation challenges will require a significant increase in investment, but the tremendous decrease in vehicle travel that has occurred due to the COVID-19 pandemic is estimated to reduce state transportation revenues by at least 30 percent – approximately $50 billion -- over the next 18 months.
Rural areas in this report are based on the U.S. Census Bureau definition, which defines rural areas as regions outside of urban areas with a population of 2,500 or more. Road, bridge and safety data in this report is based on the Federal Highway Administration (FHWA) definition for rural areas, which allows states to use the U.S. Census Bureau definition to identify rural routes or to define rural areas as regions outside of urban areas with a population of 5,000 or more. The following are the key findings of the report. AMERICA’S RURAL HEARTLAND Rural America is the primary source of the energy, food and fiber that drives the U.S. economy. The decline in rural population has been halted largely due to increasing employment and declining poverty.
• The U.S. Census Bureau defines rural areas as regions outside of urban areas with a population of 2,500 or more.
• According to the U.S. Census Bureau definition, 19 percent of the nation’s residents live in rural
areas – approximately 60 million people.

2
• The nation’s rural areas account for 97 percent of America’s land area and are home to the vast majority of the nation’s 2.2 million farms.
• America’s rural population, which had declined slightly from 2010 to 2016, has since increased,
adding an additional 54,000 people from 2016 to 2018. The modest rebound in rural population is likely a result of increased employment and declining poverty.
• The rural poverty rate, which is the percentage of people making below the amount of money
deemed necessary to have a basic standard of living, decreased from 18.5 percent in 2013 to 16.1 percent in 2018.
• America’s rural economy is far more reliant on goods production, which includes farming,
ranching, forestry, fishing, mining and energy extraction, and manufacturing, than is the nation’s urban economy.
• Many of the transportation challenges facing rural America are similar to those in urbanized
areas. However, rural residents tend to be more heavily reliant on their limited transportation network - primarily rural roads and highways - than their counterparts in urban areas. Residents of rural areas often must travel longer distances to access education, employment, retail locations, social opportunities and health services.
• The rural U.S. population is older than the nation as a whole, with an average age in rural areas
of 49 years, compared to 46 in urban areas. • The movement of retiring baby boomers to rural America is likely to continue in the future as
aging Americans seek out communities that offer affordable housing, small-town quality of life and desirable natural amenities, while often located within a short drive of larger metropolitan areas.
• Popular tourism activities in rural America include hiking, golfing, biking, hunting, fishing and
water sports. Rural areas are also home to beaches, national and state parks, wineries, orchards and other national amenities.
RURAL TRANSPORTATION CHALLENGES: FUNDING America’s ability to address its rural transportation challenges is threatened by a significant decrease in state transportation revenues, forecast due to the COVID-19 pandemic. The nation’s ability to address deficiencies in the rural and urban transportation systems would be enhanced if Congress approves the reauthorization of a timely, adequately and reliably funded federal surface transportation program.

3
• An analysis of the Status of the Nation’s Highways, Bridges and Transit, 23rd Edition, submitted by the United States Department of Transportation (USDOT) to Congress in 2019, finds that the nation’s rural roads, highways and bridges face a $211 billion backlog in needed repairs and improvements.
• The findings of the report indicate that the nation’s annual $28 billion investment by all levels of government in rural road, highway and bridge rehabilitation and enhancements should be increased by 28 percent, to approximately $36 billion annually, to improve their condition, reliability and safety.
• The American Association of State Highway and Transportation Officials (AASHTO) estimates
that state transportation revenues will be decreased by at least 30 percent – approximately $50 billion --over the next 18 months due to the reduced level of vehicle travel as a result of the COVID-19 pandemic.
• Signed into law in December 2015, the Fixing America’s Surface Transportation Act (FAST Act),
which provides federal funding for surface transportation, including highways and transit, is set to expire on September 30th 2020.
RURAL TRANSPORTATION CHALLENGE: SAFETY Traffic fatalities on the nation’s rural, non-Interstate roads occur at a rate more than double than on all other roads. A disproportionate share of fatalities take place on rural roads compared to the amount of traffic they carry.
• Rural, non-Interstate roads have a traffic fatality rate that is more than double than on all other roads. In 2018, non-Interstate rural roads had a traffic fatality rate of 2.00 deaths for every 100 million vehicle miles of travel (VMT), compared to a fatality rate of 0.88 deaths per 100 million VMT on all other roads.
• Rural, non-Interstate routes accounted for 22 percent of all VMT in the U.S. in 2018. However, crashes on the nation’s rural, non-Interstate routes resulted in 40 percent (14,455 of 36,560) of the nation’s traffic fatalities in 2018.
• The chart below shows the 25 states that led the nation in the number of rural, non-Interstate
traffic fatalities in 2018. Data for all states is available in Appendix B.

4
• The chart below shows the 25 states with the highest rate of rural, non-Interstate traffic fatalities per 100 million VMT, and the fatality rate per 100 million VMT on all other roads in the state in 2018. Data for all states is available in Appendix C.
RANK STATE2018 Rural Non-Interstate Traffic
Fatalities1 Texas 1,295 2 California 938 3 North Carolina 782 4 South Carolina 593 5 Florida 584 6 Pennsylvania 479 7 Alabama 480 8 Georgia 470 9 Indiana 470
10 Kentucky 465 11 Missouri 460 12 Ohio 443 13 New York 429 14 Tennessee 422 15 Virginia 404 16 Mississippi 397 17 Michigan 388 18 Oklahoma 381 19 Wisconsin 351 20 Illinois 323 21 Oregon 307 22 Arkansas 276 23 Louisiana 275 24 Kansas 268 25 Arizona 226

5
The higher traffic fatality rate found on rural non-Interstate routes results from multiple factors, including a lack of desirable roadway safety features, longer emergency vehicle response times, and the higher speeds traveled on rural roads compared to urban roads.
• Rural roads are more likely than urban roads to have roadway features that reduce safety, including narrow lanes, limited shoulders, sharp curves, exposed hazards, pavement drop-offs, steep slopes and limited clear zones along roadsides.
• Because many rural routes have been constructed over a period of years, they often have inconsistent design features for such things as lane widths, curves, shoulders and clearance zones along roadsides.
RANK STATE
Fatality Rate per 100M VMT on
Rural Non-Interstates
Fatality Rate per 100M VMT on All
Other Roads
1 South Carolina 3.44 1.12 2 Oregon 2.92 0.76 3 Kentucky 2.55 0.83 4 Tennessee 2.42 0.97 5 Arizona 2.36 1.39 6 Rhode Island 2.35 0.61 7 Kansas 2.31 0.66 8 Oklahoma 2.29 0.95 9 North Carolina 2.28 0.75
10 Florida 2.27 1.30 11 Texas 2.26 1.04 12 New York 2.24 0.49 13 California 2.22 0.86 14 South Dakota 2.22 0.52 15 Delaware 2.19 0.74 16 Alabama 2.16 0.97 17 Indiana 2.15 0.65 18 West Virginia 2.10 1.15 19 Louisiana 2.10 1.33 20 Nevada 2.10 1.04 21 Montana 2.07 0.84 22 Mississippi 2.07 1.24 23 Virginia 2.05 0.63 24 Pennsylvania 2.05 0.90 25 Arkansas 2.04 1.04

6
• Rural roads are more likely than urban roads to be two-lane routes. Eighty-six percent of the nation’s rural non-freeway arterial roads have two-lanes, compared to 56 percent of urban non-freeway arterial routes.
• Rural roads are more likely than urban roads to have narrow lanes. A desirable lane width for collector and arterial roadways is at least 11 feet. Twenty-three percent of rural collector and arterial roads have lane widths of 10 feet or less, compared to 18 percent of urban collector and arterial roads.
• Most head-on crashes on rural, non-Interstate roads are caused by a motorist making an
unintentional maneuver as a result of driver fatigue, being distracted or driving too fast in a curve.
• While driver behavior is a significant factor in traffic crash rates, both safety belt usage and impaired driving rates are similar in their involvement rate as a factor in urban and rural traffic crashes.
Many roadway safety improvements can be made to reduce serious crashes and traffic fatalities. These improvements are designed largely to keep vehicles from leaving the correct lane and to reduce the consequences of a vehicle leaving the roadway. Making needed roadway safety improvements would result in a significant reduction in traffic fatalities and serious injuries.
• A 2017 report from the AAA Foundation for Traffic Safety found that implementing the $146 billion in needed, cost-effective roadway safety improvements on U.S. roadways would save approximately 63,700 lives and reduce the number of serious injuries as a result of traffic crashes by approximately 350,000 over 20 years. Thus, over a 20-year period, every $100 million spent on needed roadway safety improvements would reduce the number of traffic fatalities by 44 and serious traffic injuries by 760.
• The type of safety design improvements that are appropriate for a section of rural road will
depend partly on the nature of the safety problem on that section of road and the amount of funding available.
• Low-cost safety improvements include installing rumble strips along the centerline and sides of roads, improving signage and pavement/lane markings including higher levels of retroreflectivity, installing lighting, removing or shielding roadside obstacles, using chevrons and post-mounted delineators to indicate roadway alignment along curves, adding skid resistant surfaces at curves, upgrading or adding guardrails, and improving pedestrian and bicycling facilities.
• Moderate-cost improvements include adding turn lanes at intersections, resurfacing
pavements and adding median barriers.

7
• Moderate to high-cost improvements include improving roadway alignment, reducing the angle of curves, widening lanes, converting conventional intersections to roundabouts, adding or paving shoulders, adding intermittent passing lanes, or adding a third or fourth lane.
• Systemic installation of cost-effective safety solutions and devices in rural areas helps to
improve safety not just by targeting individual safety problem points on a road, but also making entire segments safer by improving those roadway segments that exhibit the characteristics that typically result in fatal or serious-injury crashes.
RURAL TRANSPORTATION CHALLENGES: DEFICIENT ROAD AND BRIDGE CONDITIONS
The nation’s rural roads, highways and bridges have significant deficiencies and deterioration. Thirteen percent of the nation’s rural roads have pavements in poor condition, and nearly one-in-twelve of the nation’s rural bridges need rehabilitation, repair or replacement.
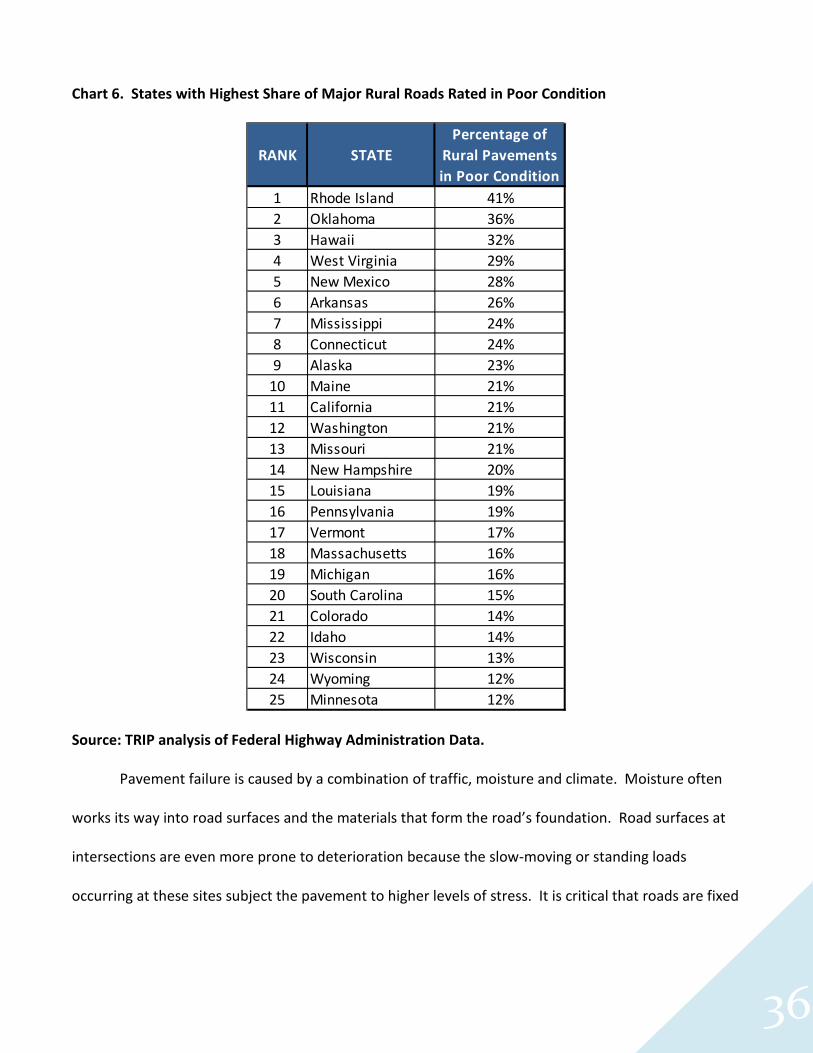
• In 2018, 13 percent of the nation’s major rural roads (arterials and collectors) were rated in poor condition, 21 percent were rated in mediocre condition, 16 percent were rated in fair condition and 50 percent were rated in good condition.
• The chart below ranks the 25 states with the greatest percentage of rural roads in poor
condition in 2018. Rural pavement conditions for all states can be found in Appendix D.

8
• In 2019, eight percent of the nation’s rural bridges were rated as poor/structurally deficient. Forty-seven percent of rural bridges were rated fair and 45 percent of rural bridges were rated in good condition.
• In 2019, 71 percent of the nation’s bridges are rural but 79 percent of the nation’s bridges rated as poor/structurally deficient are rural.
• A bridge is rated poor/structurally deficient if there is significant deterioration of the bridge
deck, supports or other major components. Poor/structurally deficient bridges are often posted for lower weight or closed to traffic, restricting or redirecting large vehicles, including commercial trucks, agricultural equipment, school buses and emergency services vehicles. A fair rating indicates that a bridge’s structural elements are sound but minor deterioration has occurred to the bridge’s deck, substructure or superstructure.
RANK STATEPercentage of
Rural Pavements in Poor Condition
1 Rhode Island 41%2 Oklahoma 36%3 Hawaii 32%4 West Virginia 29%5 New Mexico 28%6 Arkansas 26%7 Mississippi 24%8 Connecticut 24%9 Alaska 23%
10 Maine 21%11 California 21%12 Washington 21%13 Missouri 21%14 New Hampshire 20%15 Louisiana 19%16 Pennsylvania 19%17 Vermont 17%18 Massachusetts 16%19 Michigan 16%20 South Carolina 15%21 Colorado 14%22 Idaho 14%23 Wisconsin 13%24 Wyoming 12%25 Minnesota 12%

9
• The chart below ranks the 25 states with the highest share of rural bridges rated poor/structurally deficient in 2019. Rural bridge conditions for all states can be found in Appendix E.
RANK STATE
Percent Rural Bridges Rated
Poor/Structurally Deficient
Percent Rural Bridges Rated Fair
Percent Rural Bridges Rated
Good
1 RHODE ISLAND 22% 60% 18%2 WEST VIRGINIA 21% 53% 26%3 IOWA 20% 42% 38%4 SOUTH DAKOTA 18% 50% 32%5 PENNSYLVANIA 17% 50% 33%6 LOUISIANA 15% 37% 48%7 MAINE 13% 57% 29%8 NEW YORK 12% 49% 39%9 MICHIGAN 12% 49% 40%
10 NORTH DAKOTA 11% 35% 53%11 OKLAHOMA 11% 46% 43%12 NORTH CAROLINA 11% 50% 39%13 MISSISSIPPI 9% 28% 63%14 MISSOURI 9% 48% 43%15 ALASKA 9% 47% 44%16 NEBRASKA 9% 39% 52%17 HAWAII 9% 61% 30%18 NEW HAMPSHIRE 9% 42% 49%19 SOUTH CAROLINA 9% 50% 42%20 CALIFORNIA 9% 43% 48%21 NEW JERSEY 9% 62% 29%22 MASSACHUSETTS 8% 56% 36%23 ILLINOIS 8% 40% 51%24 WISCONSIN 8% 41% 51%25 KENTUCKY 8% 58% 34%

10
RURAL TRANSPORTATION CHALLENGE: CONNECTIVITY The potential for additional economic growth in many rural areas is being impeded by the failure to significantly modernize the nation’s rural transportation system and provide for adequate connectivity.
• Sixty-six U.S. cities with a population of 50,000 or more do not have direct access to the Interstate Highway System Appendix A.
• Rural transportation accessibility and connectivity are critical to transportation-dependent
business sectors, including the growing energy production and extraction sectors, advanced manufacturing, and tourism. Many jobs located in urban areas also depend on economic input from rural communities.
• Since the routes for the Interstate Highway System were designated in 1956, the nation’s
population has nearly doubled, from 165 million to 327 million.
• The abandonment of more than 100,000 miles of rail lines in recent decades, mostly in rural areas, has reduced access in many rural communities and increased reliance on trucking for freight movement.
• A report by the American Association of State Highway and Transportation Officials (AASHTO)
found that connectivity is particularly poor in rural portions of Western states because of the significant distance between Interstate highway routes and the lack of adequate rail service.
• Only 60 percent of rural counties nationwide have public transportation available. Twenty-eight
percent of those have very limited service.
• Residents of rural areas often must travel longer distances to access education, employment, retail locations, social opportunities and health services. Rural residents also assume additional risks as a result of living in areas that may be farther from emergency response services including police, fire or medical assistance.
RURAL QUALITY OF LIFE AND ECONOMIC VITALITY RELY ON TRANSPORTATION The quality of life in America’s small communities and rural areas, and the health of the nation’s rural economy, is highly reliant on the quality of the nation’s transportation system, particularly its roads, highways and bridges. America’s rural transportation network provides the first and last link in the supply chain from farm to market while supporting the tourism industry and enabling the production of energy, food and fiber.
• The importance of the rural transportation system as the backbone of the nation’s energy, food and fiber supply chain has been heightened during the response to the COVID-19 pandemic.

11
• Freight mobility and efficiency is fundamental to rural economic vitality and prosperity. Economic growth and stability in rural areas are heavily reliant on the ability to move raw materials into, or the value-added products out of, these areas.
• Agriculture, food, and related industries, including food and beverage manufacturing, apparel
manufacturing and food and beverage stores and establishments -- which rely on agricultural inputs -- contributed $1.05 trillion to the U.S. gross domestic product (GDP) in 2017. This represents 5.4 percent of overall U.S. GDP.
• While farming accounts for just six percent of all jobs in rural America, for every person
employed in farming there are seven more jobs in agribusiness, including wholesale and retail trade, processing, marketing, production, and distribution.
• Employment in goods production, which includes farming, forestry, fishing, mining and energy
extraction, accounts for 11 percent of earnings in the nation’s rural economy versus two percent in the urban economy.
• Manufacturing jobs account for 15 percent of earnings in the nation’s rural economy, versus
nine percent in the urban economy. • A United States Department of Agriculture (USDA) report found that “an effective
transportation system supports rural economies, reducing the prices farmers pay for inputs such as seeds and fertilizers, raising the value of their crops and greatly increasing market access.”
• Trucks provide the majority of transportation for agricultural products, accounting for 47
percent of total ton miles of travel, compared to 37 percent by rail and eight percent by barge. • The Council of State Governments found that “rural highways provide many benefits to the
nation’s transportation system, including serving as a bridge to other states, supporting the agriculture and energy industries, connecting economically challenged citizens in remote locations to employers, enabling the movement of people and freight, and providing access to America’s tourist attractions.”
• Transportation is becoming an even more critical segment of the food distribution network.
While food demand is concentrated mostly in urban areas, food distribution is the most dispersed segment of the economy.
• A highly competitive and efficient transportation system can lead to lower food costs for U.S.
consumers and higher market prices for producers due to lower shipping costs, smaller margins and more competitive export prices.

12
• A report by the Pacific Economic Cooperation Council recommends that governments improve the quality of their transportation systems serving the movement of goods from rural to urban regions as a strategy to lower food costs and increase economic prosperity.
• A report on agricultural transportation by the USDA found it likely that market changes and
shifts in consumer preferences would further increase the reliance on trucking to move U.S. agricultural products.
RURAL CONNECTIONS TO TOURISM AND RECREATION The condition and quality of the nation’s highway system plays a critical role in providing access to America's many tourist destinations, particularly its scenic parks and recreational areas, which are mostly located in rural areas.
• America’s 419 national parks, which are largely located in rural areas, received a record 329 million visitors in 2019, many in personal vehicles.
• In 2019, domestic and international travelers in the U.S. spent approximately $1.1 trillion.
• Travel and tourism spending in the U.S. in 2019 supported nine million jobs.
• Urban residents traveling to destinations outside their home metro areas account for 44 percent of personal vehicle miles traveled on rural roadways.
RURAL ACCESS TO ENERGY SOURCES Travel loads on America’s rural roads are increasing, due partly to the booming energy extraction sector. This has been driven by increases in domestic oil and gas extraction, largely as a result of advancements in hydraulic fracturing (fracking), which has greatly increased the accessibility of shale oil and gas deposits, and the increased production of renewable energy such as wind and solar.
• Ethanol production in the U.S. increased from 1.6 billion gallons in 2000 to 15.8 billion gallons in 2019.
• U.S. production of liquid fuels, including crude oil and natural gas, increased 93 percent from
2000 to 2019, increasing liquid fuel’s share of overall U.S. energy production (including coal and nuclear) from 49 to 66 percent.
• U.S. production of renewable energy, including wind and solar, increased 91 percent from 2000
to 2019, increasing renewable energy’s share of overall U.S. energy production from nine to 12 percent.

13
• The development of significant new oil and gas fields in numerous areas, particularly in the North Central Plains, and increased agricultural production are placing increased traffic loads by large trucks on non-Interstate rural roads, which often have not been constructed to carry such high load volumes.
• The average annual travel per-lane-mile by large trucks on rural Interstate highways in the U.S.
increased 29 percent from 2000 to 2018. TRANSPORTATION OPPORTUNITIES IN RURAL AMERICA
America must adopt transportation policies that improve rural transportation connectivity, safety and conditions to provide the nation's small communities and rural areas with a level of safe and efficient access that will support quality of life and enhance economic productivity. TRIP recommends the following for an improved rural transportation system, based partially on findings and recommendations made by AASHTO, the National Highway Cooperative Research Program (NCHRP), the Council of State Governments (CSG) and the Ports-to-Plains Alliance.
Improve access and connectivity in America’s small communities and rural areas
Widen and extend key highway routes, including Interstates, to increase connectivity to smaller and emerging communities to facilitate access to jobs, education and healthcare, while improving access for agriculture, energy, manufacturing, forestry, tourism and other critical segments of the rural economy.
A NCHRP report found that the construction of an additional 30,000 lane miles of limited access highways, largely along existing corridors, is needed to address the nation’s need for increased rural connectivity.
Modernize major two-lane roads and highways so they can accommodate increased personal
and commercial travel. Improve public transit service in rural America to provide improved mobility for people without
access to private vehicles.
Improve rural traffic safety
Adequately fund needed rural roadway safety improvements and provide enhanced enforcement, education and improved emergency response to reduce the rate of rural traffic fatalities.
Implement cost-effective roadway safety improvements, including rumble strips, shoulder improvements, lane widening, curve reductions, skid resistant surfaces at curves, passing lanes, intersection improvements and improved signage, pavement markings and lighting, guardrails and barriers, and improved shielding of obstacles.
14
Improve the condition of rural roads, highways and bridges
Adequately fund local and state transportation programs to insure sufficient preservation of rural roads, highways and bridges to maintain transportation service and accommodate large truck travel, which is needed to support the rural economy.
All data used in this report is the most current available. Sources of information for this report include: The Federal Highway Administration (FHWA), the National Highway Traffic Safety Administration (NHTSA), the National Cooperative Highway Research Program (NCHRP), the American Association of State Highway and Transportation Officials (AASHTO), the United States Department of Agriculture (USDA), the Council of State Governments (CSG) and the U.S. Census Bureau. Front cover photo credit: Jerry McBride, Durango Herald.

15
Introduction
America’s rural transportation system provides mobility for rural residents and visitors while
linking urban America with the source of much of its food supply, energy and other natural resources.
The ongoing challenge of responding to the spread of the COVID-19 virus has underscored the critical
importance of the nation’s freight transportation system in keeping urban and rural communities
adequately supplied with medical supplies, food and energy. America’s rural heartland is a vital part of
the country, serving as a place to live and visit, and as a cultural and economic resource. The nation’s
rural transportation system plays a critical role in supporting the economy of rural America -
particularly its agriculture, energy, manufacturing and tourism sectors - and connecting the nation’s
heartland to urban America.
Roads, bridges and highways are the backbone of the nation’s rural transportation system,
supporting its economy and providing daily mobility for residents, businesses and visitors. The
condition, safety and efficiency of the nation’s rural roads and bridges all play a critical role in the
quality of life in rural and urban America.
Good transportation is essential to rural areas to provide access to jobs, to facilitate the
movement of goods and people, to access health care and opportunities for education, and to provide
links to other social services. Transportation supports businesses and is a critical factor in a company’s
decision to locate or expand business operations. For communities that rely on tourism and natural
amenities to help support their economy, transportation is the key link between visitors and
destinations.

16
Many of the transportation challenges facing rural America are similar to those in urbanized
areas. However, rural residents tend to rely more heavily on their limited transportation network –
primarily rural roads and highways - than their counterparts in more urban areas.
The importance of rural transportation is likely to increase in the future as more people choose
to live in rural America and the reliance on rural transportation systems to transport products and
people to and from rural areas increases. Making needed improvements to the nation’s rural
transportation system will be critical in supporting quality of life and economic development of rural
America and the entire nation.
AMERICA’S HEARTLAND
The U.S. Census Bureau defines rural areas as regions outside of urban areas with a population
of 2,500 or more.1 According to the U.S. Census Bureau definition, approximately 60 million people -
19 percent of the nation’s population live in rural areas.2
Rural areas cover 97 percent of the nation’s land area and are home to the vast majority of the
nation’s 2.2 million farms.3
America’s rural population declined slightly from 2010 to 2016 and has since increased, adding an
additional 54,000 people from 2016 to 2018.4 The modest rebound in rural population appears tied to
increased employment and declining poverty in rural America.5
The improved economy in rural America has resulted in a reduction in the rural poverty
rate, which is the percentage of people making below the amount of money deemed necessary to have

17
a basic standard of living. The rural poverty rate decreased from 18.5 percent in 2013 to 16.1 percent
in 2018.6
The highest proportions of rural populations are located in the upper Midwest and West,
though states throughout the nation have sizeable rural populations. The chart below details the
percentage of rural population in each state.
Chart 1. Share of rural population in each state
Source: Federal Highway Administration.
The rural U.S. population is older than the nation as a whole, with an average age of residents
in rural areas of 49 years, compared to 46 in urban areas.7
Growth in rural areas, particularly in the South and West, has also been fueled by significant
domestic and international migration to regions that offer affordable housing, small-town quality of life
and desirable natural amenities or climate, yet are within commuting distances of larger metropolitan

18
areas.8 A continued movement of retiring baby boomers to rural America is considered likely as aging
Americans seek out communities that have these qualities.9
TRANSPORTATION’S CRITICAL IMPORTANCE TO THE RURAL ECONOMY
The quality of life in America’s small communities and rural areas and the health of the nation’s
rural economy, from the production and transport of energy, food and fiber, to attracting tourism, is
highly reliant on the quality of the nation’s transportation system.
The nation’s rural economy is far more reliant on goods production and manufacturing than the
urban economy. Employment in goods production, which includes farming, forestry, fishing, mining
and energy extraction, accounts for 11 percent of earnings in the nation’s rural economy versus two
percent in the urban economy.10 Similarly, manufacturing jobs account for 15 percent of earnings in
the nation’s rural economy versus nine percent in the urban economy.11
Rural America is economically diverse, and while most rural counties offer employment in a
variety of industries, they differ in their industry mix. The Economic Research Service (ERS) of the
United States Department of Agriculture has classified predominantly rural counties in six mutually
exclusive categories that reflect the industry that most supports its economy. In the following chart,
the ERS classifies rural counties based on their dominant economic sector.

19
Chart 3. Rural Counties Classified by Dominant Economic Sector
Source: USDA, Economic Research Service
America's rural roads, highways and bridges provide the first and last link in the supply chain
from farm to market and other retail outlets. Freight mobility and efficiency are fundamental to rural
economic vitality and prosperity. Economic growth and stability in rural areas is heavily reliant on the
ability to move raw materials into, or the value-added products out of, these areas.
Good rural transportation is critical to transportation-dependent business sectors including the
growing energy production sector, advanced manufacturing, and tourism. Many jobs located in urban
areas also depend upon good access to economic inputs from rural areas.
A USDA report found that “an effective transportation system supports rural economies,
reducing the prices farmers pay for inputs such as seeds and fertilizers, raising the value of their crops
and greatly increasing market access. The economics of rural areas are intertwined. As agriculture
thrives, so does its supporting communities. An efficient system of freight transportation is an
important foundation for a vibrant rural economy, including rural manufacturing.”12

20
While farming accounts for just six percent of all jobs in rural America, for every person
employed in farming there are seven more jobs in agribusiness, including wholesale and retail trade,
processing, marketing, production and distribution.13
Agriculture, food, and related industries, including food and beverage manufacturing, apparel
manufacturing and food and beverage stores and establishments, which rely on agricultural inputs,
contributed $1.05 trillion to the U.S. gross domestic product GDP in 2017 – 5.4 percent of overall U.S.
GDP.14
Trucks provide the majority of transportation for agricultural products, accounting for 47
percent of total ton-miles of travel, compared to 37 percent by rail, eight percent by barge, and eight
percent by mixed modes. 15
A report from The Council of State Governments found that “rural highways provide many
benefits to the nation’s transportation system, including serving as a bridge to other states, supporting
the agriculture and energy industries, connecting economically challenged citizens in remote locations
to employers, enabling the movement of people and freight and providing access to America’s tourist
attractions.”16
The importance of a good rural transportation system to the efficiency of a region’s economic
performance is increasing as food distribution becomes more dependent on reliable transportation. A
report by the Pacific Economic Cooperation Council found that transportation is becoming an even
more critical segment of the food distribution network as food distribution is the most dispersed
segment of the economy, while food demand is concentrated mostly in urban areas. The report
recommends that governments improve the quality of their transportation systems serving the

21
movement of goods from rural to urban regions as a strategy to lower food costs and increase
economic prosperity.17
A highly competitive and efficient transportation system can lead to lower food costs for U.S.
consumers and higher market prices for producers due to lower shipping costs, smaller margins and
more competitive export prices.18
A report on agricultural transportation by the USDA found it likely that market changes and
changes in consumer preferences would further increase the reliance on trucking to move U.S.
agricultural products. The USDA report found that future foreign demand for U.S. agricultural products
will increasingly be for processed products, such as flour, which rely on increased domestic
transportation. Consumer demands in the U.S. and the need for greater traceability of where and how
an agricultural product was produced will also increase the need for smaller, time-sensitive delivery.
The USDA report found that for agricultural products, “movements toward lower volumes of trait-
specific commodities will likely favor trucks as the primary mode of transport.”19
The condition and quality of the nation’s highway system also play a critical role in providing
access to America's many tourist destinations, particularly scenic parks and recreational areas, which
are mostly located in rural areas. In 2019, domestic and international travelers in the U.S. spent
approximately $1.1 trillion.20 Travel and tourism spending in the U.S. in 2019 supported 9 million
jobs.21 America’s 419 national parks, which are largely located in rural areas, received 327 million
visitors in 2019, many in personal vehicles.22 Urban residents traveling to destinations outside their
home metro areas account for forty-four percent of personal vehicle miles traveled on rural
roadways.23

22
For many Americans, the primary reason to visit rural communities is to access tourist activities.
America’s rural landscape boasts activities including hiking, golfing, biking, hunting, fishing, skiing, and
water sports, while attracting visitors through its beaches, national and state parks, wineries, orchards
and other national amenities.
Increases in domestic oil and gas extraction, largely as a result of advancements in hydraulic
fracturing (fracking), have greatly increased the accessibility of shale oil and gas deposits. This increase,
along with the heightened production of renewable energy such as wind and solar, are creating
additional travel loads on the nation’s rural highways.
Ethanol production in the U.S. increased from 1.6 billion gallons in 2000 to 15.8 billion gallons in
2019.24 U.S. production of liquid fuels, including crude oil and natural gas, increased 93 percent from
2000 to 2019, increasing liquid fuel’s share of overall U.S. energy production from 49 to 66 percent
during that time.25
U.S. production of renewable energy, including wind and solar, increased 91 percent from 2000
to 2019, increasing renewable energy’s share of overall U.S. energy production from nine to 12 percent
during that time.26
The development of new oil and gas fields in numerous areas, particularly in the North Central
Plains, and increased agricultural production are placing significantly greater traffic loads by large
trucks on non-Interstate rural roads. Oftentimes, these roads have not been constructed to carry such
high load volumes. Annual travel per-lane mile by large trucks on U.S. rural Interstate highways
increased 29 percent from 2000 to 2018.27

23
Rural Transportation Challenges: Funding
Investment in the nation’s rural roads, highways and bridges is funded by local, state and
federal governments. State transportation revenue, which is derived largely from motor fuel taxes,
vehicle registration fees and toll receipts, is expected to be greatly reduced by the COVID-19 pandemic,
which has resulted in a significant reduction in travel. The American Association of State Highway and
Transportation Officials estimates that state
transportation revenues will be decreased by at least
30 percent – approximately $50 billion -- over the
next 18 months due to the reduced level of vehicle
travel as a result of the COVID-19 pandemic.28
Federal funds for highway and transit
improvements are provided through the federal
Highway Trust Fund, which raises revenue through
federal user fees, largely an 18.4 cents-per-gallon tax
on gasoline and a 24.4 cents-per-gallon tax on diesel
fuel.
Signed into law in December 2015, the Fixing
America’s Surface Transportation Act (FAST Act),
provides modest increases in federal highway and transit spending. The five-year bill also provides
states with greater funding certainty and streamlines the federal project approval process. But, the

24
FAST Act does not provide adequate funding to meet the nation’s need for highway and transit
improvements and does not include a long-term and sustainable funding source.
The five-year, $305 billion FAST Act will provide a boost of approximately 15 percent in highway
funding and 18 percent in transit funding over the duration of the program, which expires on
September 30, 2020.29 In addition to federal motor fuel tax revenues, the FAST Act has also been
funded by $70 billion in U.S. general funds, which relies on several unrelated federal programs
including the Strategic Petroleum Reserve, the Federal Reserve and U.S. Customs.
America’s ability to address its rural transportation challenges would be greatly enhanced if
Congress is able to provide a long-term, dedicated, user-based revenue stream capable of fully funding
the federal surface transportation program.

25
An analysis of the Status of the Nation’s Highways, Bridges and Transit, 23rd Edition report,
submitted by the USDOT to Congress in
2019, indicates that the U.S. faces a $211
billion backlog in needed repairs and
improvements to the nation’s rural
roads, highways and bridges.30 This
includes a $125 billion backlog for rural
road and highway rehabilitation, a $42
billion backlog for needed rural bridge
rehabilitation, and a $44 billion backlog
for needed rural roadway
enhancements.31

26
The findings of the report indicate that the nation’s annual $28 billion investment in rural road,
highway and bridge rehabilitation and
enhancements by all levels of
government should be increased by 28
percent, to approximately $36 billion
annually, to improve their condition,
reliability and safety.32
Rural Transportation Challenge: Safety
Traffic crashes are a major source of fatalities in the U.S., particularly in rural America. The
nation’s rural, non-Interstate roads have the highest rate of traffic fatalities. Rural Interstate routes
were excluded from the safety analysis in this report because they are built to very high safety
standards and do not have the significant traffic safety deficiencies common on many rural roads.

27
In 2018, traffic crashes claimed the lives of 36,560 people in the U.S. Traffic crashes on the
nation’s non-Interstate rural roads resulted in 14,455 fatalities in 2018-- 40 percent of all traffic
fatalities in the U.S. The nation’s non-Interstate rural roads carried only 22 percent of all vehicle miles
of travel (VMT)in 2018.33
The fatality rate on rural non-Interstate routes in 2018 was 2.00 deaths for every 100 million
VMT, more than double the fatality
rate of 0.88 fatalities per 100 million
VMT on all other routes.34 The
overall fatality rate for all U.S. roads
in 2018 was 1.13 fatalities per 100
million VMT.35
The five states with the
largest number of fatalities as a result
of crashes on rural, non-Interstate
roads in 2018 were Texas, California,
North Carolina, South Carolina and
Florida. State-by-state data on the
number of traffic fatalities occurring
on rural, non-Interstate routes in 2018 and their share of overall fatalities and VMT can be found in
Appendix B.

28
Chart 4. States with greatest number of fatalities in crashes on non-Interstate rural roads in 2018.
Source: TRIP analysis of National Highway Traffic Safety Administration data. The state with the highest rate of traffic fatalities on its non-Interstate, rural routes in 2018 was
South Carolina, with 3.44 traffic fatalities per 100 million VMT.36 Oregon, Kentucky, Tennessee and
Arizona experienced the next highest rates of traffic fatalities on their non-Interstate, rural roads.
State-by-state data on traffic fatality rates on rural, non-Interstate routes and all other routes can be
found in Appendix C.
RANK STATE2018 Rural Non-Interstate Traffic
Fatalities1 Texas 1,295 2 California 938 3 North Carolina 782 4 South Carolina 593 5 Florida 584 6 Pennsylvania 479 7 Alabama 480 8 Georgia 470 9 Indiana 470
10 Kentucky 465 11 Missouri 460 12 Ohio 443 13 New York 429 14 Tennessee 422 15 Virginia 404 16 Mississippi 397 17 Michigan 388 18 Oklahoma 381 19 Wisconsin 351 20 Illinois 323 21 Oregon 307 22 Arkansas 276 23 Louisiana 275 24 Kansas 268 25 Arizona 226

29
Chart 5. States with highest rate of traffic fatalities on rural, non-Interstate routes per 100 million VMT in 2018 and fatality rate on all other roads in the state in 2018.
Source: TRIP analysis of National Highway Traffic Safety Administration and Federal Highway Administration data.
Traffic Safety Factors
Key factors that contribute to fatal traffic crashes include the following: human behavior, safety
features of the vehicle, emergency response times, medical care of the victims, and the safety design
of the roadway. 37 Human behavioral issues can include the use of safety belts, driver impairment due
RANK STATE
Fatality Rate per 100M VMT on
Rural Non-Interstates
Fatality Rate per 100M VMT on All
Other Roads
1 South Carolina 3.44 1.12 2 Oregon 2.92 0.76 3 Kentucky 2.55 0.83 4 Tennessee 2.42 0.97 5 Arizona 2.36 1.39 6 Rhode Island 2.35 0.61 7 Kansas 2.31 0.66 8 Oklahoma 2.29 0.95 9 North Carolina 2.28 0.75
10 Florida 2.27 1.30 11 Texas 2.26 1.04 12 New York 2.24 0.49 13 California 2.22 0.86 14 South Dakota 2.22 0.52 15 Delaware 2.19 0.74 16 Alabama 2.16 0.97 17 Indiana 2.15 0.65 18 West Virginia 2.10 1.15 19 Louisiana 2.10 1.33 20 Nevada 2.10 1.04 21 Montana 2.07 0.84 22 Mississippi 2.07 1.24 23 Virginia 2.05 0.63 24 Pennsylvania 2.05 0.90 25 Arkansas 2.04 1.04

30
to alcohol or drugs, distracted or drowsy driving, and speeding. Because rural roads have fewer
intersections than urban roads and are more likely to provide travel between urban areas, they often
have higher speed limits than many urban routes. Because rural traffic crashes often occur in more
remote locations than urban crashes, emergency medical care following a serious accident is often
slower in arriving, contributing to a higher traffic fatality rate on rural roads.
Traffic fatality rates on rural roads are higher than on urban roads, partly because rural roads
are less likely to have adequate safety features and are more likely than urban roads to have two lanes.
Eighty-six percent of the nation’s major, rural non-freeway roads and highways are two-lane routes,
while 56 percent of urban, major non-freeway roads and highways are two-lane routes.38
Rural routes have often been constructed over a period of years. As a result they may have
inconsistent design features for such things as lane widths, curves, shoulders and clearance zones
along roadways.39 Many rural roads have been built with narrow lanes, limited shoulders, excessive
curves and steep slopes alongside roadways.40
While a desirable lane width for collector and arterial roadways is at least 11 feet, 23 percent of
rural collector and arterial roads have lane widths of 10 feet or less, compared to 18 percent of urban
collector and arterial roads.41 With passenger vehicle, heavy truck and commercial farming traffic
increasing, the safety inadequacies of these rural roads are contributing to the higher rate of fatal
crashes on rural roads.
The vast majority of rural, non-interstate traffic fatalities – 91 percent – occur on two-lane
roads.42 A report on head-on collisions by the National Cooperative Highway Research Program found
that “most head-on crashes are likely to result from a motorist making an ‘unintentional’ maneuver –
the driver falls asleep, is distracted, or travels too fast in a curve.”43

31
Making Rural Roads Safer
A report on rural road safety by the United States General Accounting Office (GAO) found that
several factors hinder efforts to improve rural road safety. The GAO report noted that these
challenges include the large number of rural roads and the relatively low volume of traffic they carry,
combined with the high cost of some desirable improvement. The GAO report also found federal
highway funding cannot be used on many rural roads, most of which are the responsibility of local
governments, which may have limited resources.44
A 2017 report from the AAA Foundation for Traffic Safety found that implementing cost-
effective and needed roadway safety improvements on U.S. roadways at a cost of $146 billion would
save approximately 63,700 lives and reduce the number of serious injuries as a result of traffic crashes
by approximately 350,000 over 20 years. Thus, over a 20-year period, every $100 million spent on
needed roadway safety improvements would reduce the number of traffic fatalities by 44 and serious
traffic injuries by 760.
A variety of design improvements can help improve rural road safety. The goal of these
improvements is to keep vehicles in the correct lane and minimize the consequences of vehicles
leaving the roadway. The type of safety design improvements that are appropriate for a section of rural
road will depend partly on the amount of funding available and the nature of the safety problem on
that section of road. Several studies have classified rural safety improvements by both their
effectiveness and their cost. These improvements include:

32
LOW COST:
Rumble strips – Rumble strips are raised or grooved patterns constructed on the roadway’s shoulder.
They have been found to reduce run-off-the-road crashes by 25 to 43 percent.45
Centerline rumble strips – Several states have started to install centerline rumble strips to alert drivers
who may be encroaching or have strayed into an opposing lane.
Improved signage and pavement markings, including higher levels of retroreflectivity –Traffic signs
and pavement markings represent the first line of crucial information for drivers and can help improve
night-time visibility. Signs with greater retroreflectivity, more visible pavement markings and raised,
reflective lane makings can all help drivers to stay on a roadway, particularly at night.
Lighting – A study of the addition of street lighting at 49 isolated rural intersections in Minnesota
found that nighttime crashes decreased by 35 percent after the addition of lighting.46
Removing or shielding road-side obstacles – Trees, large rocks, utility poles, heavy mail boxes and
other road-side objects can be shielded or moved away from the road to reduce the likelihood that a
vehicle leaving the roadway would strike these objects.
Upgrade or add guardrails – Adding or improving guardrails has been found to reduce traffic fatality
rates by 50 to 58 percent.47
Chevrons and post-mounted delineators along curves – The use of chevrons or post-mounted
delineators to indicate roadway alignment have been found to be effective in reducing crashes at
curves by providing drivers with better visual cues about the presence and geometry of a curve.48
MODERATE COST:
Install median barriers – Median barriers have been found to reduce traffic fatality rates by 65
percent.49

33
Adding turn lanes at intersections – The addition of left turn lanes at rural intersections was found to
reduce crashes by 33 to 48 percent.50 The addition of right turn lanes at intersections was found to
reduce crashes by eight to 26 percent.51
Resurfacing pavements - Resurfaced pavements have been found to result in a 25 percent reduction in
fatal crashes. 52
MODERATE TO HIGH COST:
Add or pave shoulders – Paving or widening shoulders has been found to reduce traffic fatality rates
by 10 to 35 percent, depending on the width of the widening and the location.53
Improved roadway alignment – Realigning roadways has been found to average a 50 percent
reduction in traffic fatality rates.54
Construct intermittent passing lanes or two-way left-turn lane – Adding passing lanes has been found
to reduce traffic fatality rates by 20 percent, while the addition of a two-way left-turn lane has been
found to reduce traffic fatality rates by 30 percent.55
Converting Conventional Intersections to Roundabouts –Converting a stop-controlled intersection to
a roundabout can reduce injury crashes by 82 percent, while converting a signalized intersection to a
roundabout can reduce injury crashes by 78 percent.56
Widen lanes – Making lanes wider has been found to reduce traffic fatality rates by eight to 10
percent. 57
Add lanes – A report on the likely safety benefit of converting two-lane rural roads into four-lane
routes found that traffic accident rates would be reduced by 40 to 60 percent.58

34
The use of Roadway Safety Assessments (RSAs) is a proven approach that can improve safety on
rural roads. Improved data collection on rural road safety can help to identify roadway segments with
dangerous characteristics.
Systemic installation of cost-effective safety solutions and devices in rural areas helps to improve
safety not just by targeting problem points on a road, but also making entire segments safer by
improving those roadway segments that exhibit the characteristics that typically result in fatal or
serious-injury crashes.
Rural Transportation Challenge: Road Conditions
The life cycle of America's rural roads is greatly affected by the ability of the transportation
agency responsible for their upkeep to
perform timely maintenance and
upgrades to ensure that road and
highway surfaces last as long as
possible. The pavement condition of
the nation’s major roads is evaluated
and classified as being in poor,
mediocre, fair or good condition.
In 2018, 13 percent of the
nation’s major rural roads were rated
in poor condition, 21 percent were
rated in mediocre condition, 16
percent were rated in fair condition

35
and 50 percent were rated in good condition.59 Roads rated poor may show signs of deterioration,
including rutting, cracks and potholes. In some cases, poor roads can be resurfaced but often are too
deteriorated and must be reconstructed. Roads rated in mediocre and fair condition may show signs
of significant wear and may also have some visible pavement distress. Most pavements in mediocre
and fair condition can be repaired by resurfacing, but some may need more extensive reconstruction
to return them to good condition. A desirable goal for state and local organizations that are
responsible for road maintenance is to keep 75 percent of major roads in good condition.60
The states with the largest share of their rural roads with pavements in poor condition are
Rhode Island, Oklahoma, Hawaii West Virginia and New Mexico. Rural pavement conditions for all
states can be found in Appendix D.
36
Chart 6. States with Highest Share of Major Rural Roads Rated in Poor Condition
Source: TRIP analysis of Federal Highway Administration Data.
Pavement failure is caused by a combination of traffic, moisture and climate. Moisture often
works its way into road surfaces and the materials that form the road’s foundation. Road surfaces at
intersections are even more prone to deterioration because the slow-moving or standing loads
occurring at these sites subject the pavement to higher levels of stress. It is critical that roads are fixed
RANK STATEPercentage of
Rural Pavements in Poor Condition
1 Rhode Island 41%2 Oklahoma 36%3 Hawaii 32%4 West Virginia 29%5 New Mexico 28%6 Arkansas 26%7 Mississippi 24%8 Connecticut 24%9 Alaska 23%
10 Maine 21%11 California 21%12 Washington 21%13 Missouri 21%14 New Hampshire 20%15 Louisiana 19%16 Pennsylvania 19%17 Vermont 17%18 Massachusetts 16%19 Michigan 16%20 South Carolina 15%21 Colorado 14%22 Idaho 14%23 Wisconsin 13%24 Wyoming 12%25 Minnesota 12%
37
before they require major repairs because reconstructing roads costs approximately four times more
than resurfacing them.61
As the nation’s major rural roads and highways continue to age, they will reach a point where
routine paving and maintenance will not be adequate to keep pavement surfaces in good condition
and costly reconstruction of the roadway and its underlying surfaces will become necessary.
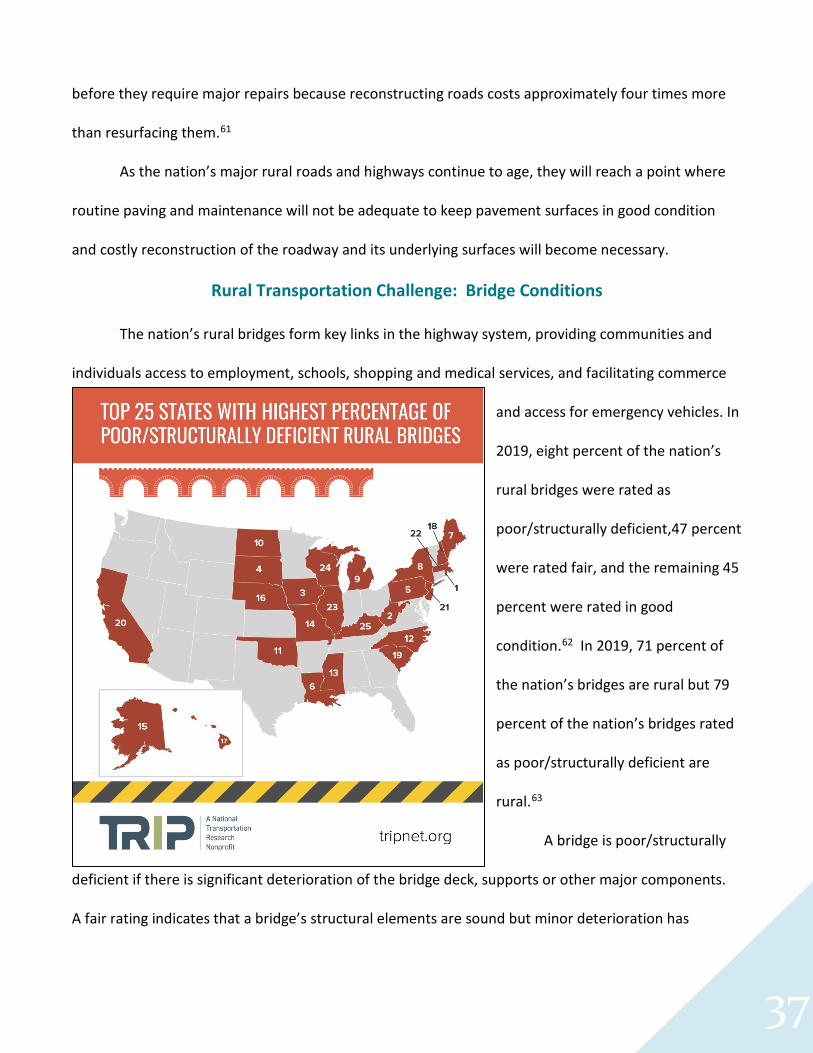
Rural Transportation Challenge: Bridge Conditions
The nation’s rural bridges form key links in the highway system, providing communities and
individuals access to employment, schools, shopping and medical services, and facilitating commerce
and access for emergency vehicles. In
2019, eight percent of the nation’s
rural bridges were rated as
poor/structurally deficient,47 percent
were rated fair, and the remaining 45
percent were rated in good
condition.62 In 2019, 71 percent of
the nation’s bridges are rural but 79
percent of the nation’s bridges rated
as poor/structurally deficient are
rural.63
A bridge is poor/structurally
deficient if there is significant deterioration of the bridge deck, supports or other major components.
A fair rating indicates that a bridge’s structural elements are sound but minor deterioration has

38
occurred to the bridge’s deck, substructure or superstructure. Bridges that are structurally deficient
may be posted for lower weight limits or closed if their condition warrants such action. Deteriorated
bridges can have a significant impact on daily life. Restrictions on vehicle weight may cause many
vehicles – especially emergency vehicles, commercial trucks, school buses and farm equipment – to
use alternate routes to avoid posted bridges. Redirected trips lengthen travel time, waste fuel and
reduce the efficiency of the local economy.
With more than one-fifth of its rural bridges – 22 percent – rated poor/structurally deficient,
Rhode Island has the highest share in the nation, followed by West Virginia, Iowa, South Dakota and
Pennsylvania.64 Rural bridge conditions for all states can be found in Appendix E.

39
Chart 7. States with Highest Share of Rural Bridges Rated Poor/Structurally Deficient (2019).
Source: TRIP analysis of Federal Highway Administration data.
The service life of bridges can be extended by performing routine maintenance such as
resurfacing decks, painting surfaces, ensuring that a facility has good drainage and replacing
deteriorating components. But most bridges will eventually require more costly reconstruction or
major rehabilitation to remain operable.
RANK STATE
Percent Rural Bridges Rated
Poor/Structurally Deficient
Percent Rural Bridges Rated Fair
Percent Rural Bridges Rated
Good
1 RHODE ISLAND 22% 60% 18%2 WEST VIRGINIA 21% 53% 26%3 IOWA 20% 42% 38%4 SOUTH DAKOTA 18% 50% 32%5 PENNSYLVANIA 17% 50% 33%6 LOUISIANA 15% 37% 48%7 MAINE 13% 57% 29%8 NEW YORK 12% 49% 39%9 MICHIGAN 12% 49% 40%
10 NORTH DAKOTA 11% 35% 53%11 OKLAHOMA 11% 46% 43%12 NORTH CAROLINA 11% 50% 39%13 MISSISSIPPI 9% 28% 63%14 MISSOURI 9% 48% 43%15 ALASKA 9% 47% 44%16 NEBRASKA 9% 39% 52%17 HAWAII 9% 61% 30%18 NEW HAMPSHIRE 9% 42% 49%19 SOUTH CAROLINA 9% 50% 42%20 CALIFORNIA 9% 43% 48%21 NEW JERSEY 9% 62% 29%22 MASSACHUSETTS 8% 56% 36%23 ILLINOIS 8% 40% 51%24 WISCONSIN 8% 41% 51%25 KENTUCKY 8% 58% 34%

40
Rural Transportation Challenge: Connectivity
Growing economic activity in rural America combined with the failure to significantly expand
the nation’s rural transportation system, particularly its network of modern highways, has resulted in a
lack of adequate connectivity. This lack of mobility and connectivity is impeding the potential for
economic growth in many rural areas.
Residents of rural areas often must travel longer distances to access education, employment,
retail locations, social opportunities, and health services. Rural residents also assume additional risks as
a result of living in areas that may be farther from police and fire response, or emergency medical
services.65
The Interstate Highway System is the most critical highway link for commerce and intercity travel in
rural America, but many rural and smaller communities in the U.S. are not adequately served by the
Interstate system. Since the routes for the Interstate Highway System were designated in 1956, the
nation’s population has nearly doubled, from 165 million to 329 million, and is projected to increase to
420 million people by 2050.66
A report by AASHTO found that 66 areas in the United States with populations of at least 50,000
people are not connected to the Interstate System (Appendix A).67 This lack of connection to the
nation’s major highway system reduces the economic competitiveness of these communities and their
surrounding rural areas. “Maintaining connectivity is essential not only to serve rural communities, but
also to support the shifting agricultural and energy extraction and production needs of a growing
population and economy,” the report found.68
The report by AASHTO also found that connectivity is particularly poor in rural portions of
Western states because of the significant distance between Interstate highway routes and the lack of

41
adequate rail service.69 The lack of connectivity in rural America has been exacerbated by the
continued reduction in the areas served by railroads as a result of the abandonment of un-profitable or
lightly used rail lines. Over the last few decades, more than 100,000 miles of rail lines have been
abandoned, mostly in rural areas, reducing access in many rural communities and increasing reliance
on trucking for freight movement.70 This loss of rail service reduces transport options, particularly for
farmers.
According to the AASHTO report, a lack of adequate rural public transit greatly impacts people
without access to private vehicles, including those with lower incomes and older people who live in
rural America.71 Rural transit, which often takes the form of specialized services such as van pools
tailored to access employment and healthcare, often fails to meet the needs of rural Americans. Only
60 percent of rural counties nationwide have public transportation available and 28 percent of those
have very limited service.72
Transportation Opportunities in Rural America
Providing an adequate level of safe and efficient access in America’s small communities and
rural areas to support quality of life and enhance economic productivity will require that the nation
adopt transportation policies that will improve rural transportation connectivity, safety and conditions.
The following recommendations by TRIP for an improved rural transportation system are also
based partially on recommendations and findings of AASHTO, NCHRP, CSG and the Ports-to-Plains
Alliance.

42
Improve access and connectivity in America’s small communities and rural areas
Widen and extend key highway routes, including Interstates, to increase connectivity to smaller
and emerging communities to facilitate access to jobs, education and healthcare while improving
access for agriculture, energy, manufacturing, forestry, tourism and other critical segments of the
rural economy.
An NCHRP report found that the construction of an additional 30,000 lane miles of limited access
highways, largely along existing corridors, is needed to address the nation’s need for increased
rural connectivity.
Modernize major two-lane roads and highways so they can accommodate increased personal
and commercial travel.
Improve public transit service in rural America to provide improved mobility for people without
access to private vehicles.
Improve rural traffic safety
Adequately fund needed rural roadway safety improvements and provide enhanced
enforcement, education and improved emergency response to reduce the rate of rural traffic
fatalities.
Roadway safety improvements may include rumble strips, shoulder improvements, lane
widening, curve reductions, passing lanes, intersection improvements and improved signage
and lighting, and improved shielding of obstacles.

43
Improve the condition of rural roads, highways and bridges
Adequately fund local and state transportation programs to ensure sufficient preservation of
rural roads, highways and bridges to maintain transportation service and accommodate large
truck travel, which is needed to support the rural economy.
Conclusion
The ongoing response to the COVID-19 pandemic is serving as a reminder that the nation’s rural
roads and bridges are a critical link in the nation’s transportation system, providing access to medical
supplies, food, fiber and manufactured goods that are keeping Americans safe while continuing to
drive the nation’s economic recovery. In a rural America that is experiencing economic and population
growth and that is highly transportation reliant, the transportation system plays a critical role in
connecting communities to America’s urban areas, supporting commerce, commuting and tourism.
The nation’s rural transportation system, particularly its roads and bridges, faces significant challenges.
The rural transportation network carries increasing levels of traffic, fails to provide adequate
connectivity for many communities, has significant deterioration and has significantly higher rates of
serious traffic crashes than other roads.
Providing the nation with a rural transportation system that will support the economy and
future development will require that the U.S. invest in a rural transportation system that is safe,
efficient, and well-maintained, and that provides adequate mobility and connectivity to the nation’s
rural communities.
###

44
ENDNOTES
1 Highway Functional Classification Concepts, Criteria and Procedures (2013). Federal Highway Administration. http://www.fhwa.dot.gov/planning/processes/statewide/related/highway_functional_classifications/ 2 United States Census Bureau (2016). New Census Data Show Differences Between Urban and Rural Populations. https://www.census.gov/newsroom/press-releases/2016/cb16-210.html 3. Ibid and United States Department of Agriculture. Economic Research Service.
http://www.ers.usda.gov/topics/rural-economy-population/population-migration.aspx 4 United States Department of Agriculture. (2019). Rural America at a Glance 2019 Edition. https://www.ers.usda.gov/publications/pub-details/?pubid=95340 5 Ibid. 6 United States Department of Agriculture (2020). Rural Poverty & Well-Being. https://www.ers.usda.gov/topics/rural-economy-population/rural-poverty-well-being/ 7 Ibid. 8 Slow Going for the Population in Rural America (2004). M. Mather and J. D’Amico. Population Reference Bureau. 9 Economic Research Service, United States Department of Agriculture (2009). Baby Boom Migration and its Impact on Rural America. 10 United States Department of Agriculture. Economic Research Service (2016). Rural America at a Glance 2016 Edition. https://www.ers.usda.gov/webdocs/publications/80894/eib-162.pdf?v=42684 11 Ibid. 12 United States Department of Agriculture, (2010). Study of Rural Transportation Issues. Ch. 3. https://www.ers.usda.gov/data-products/ag-and-food-statistics-charting-the-essentials/ag-and-food-sectors-and-the-economy/ 13 A Guide to Food and Fiber Literacy, Oklahoma State University. (1998). 14 United States Department of Agriculture, Economic Research Service (2019). Ag and Food Sectors and the Economy. https://www.ers.usda.gov/data-products/chart-gallery/gallery/chart-detail/?chartId=88969 15 TRIP analysis of Federal Highway Administration’s Freight Analysis Framework data (2019). Data is for 2017. https://faf.ornl.gov/fafweb/ 16 Rural Transportation Needs (2011). Council of State Governments. ES-1. 17 The Role of Transportation Infrastructure in a Seamless Food System, Pacific Food System Outlook 2004-2005. https://www.pecc.org/resources/foodagriculture-1/638-pacific-food-system-outlook-the-role-of-transportation-infrastructure-in-a-seamless-food-system/file 18 Transportation Impact of Changing Patterns of Production and Domestic and Global Distribution of Agricultural Products. Federal Highway Administration. p. 3 19 U.S. Agriculture and Transportation: Challenges & Opportunities for the 21st Century. 2000. United States Department of Agriculture. Based on the 2000 conference: “Agricultural Transportation Challenges of the 21st Century.” 20 U.S. Travel Association (2020). U.S. Travel and Tourism Overview (2019). https://www.ustravel.org/system/files/media_root/document/Research_Fact-Sheet_US-Travel-and-Tourism-Overview.pdf 21 Ibid.

45
22 National Park Service (2020). National Park Service Visitation Tops 327 Million in 2019. https://www.nps.gov/orgs/1207/2019-visitation-numbers.htm 23 U.S. Department of Transportation (2020). Rural Opportunities to Use Transportation for Economic Success. https://www.transportation.gov/rural 24 Renewable Fuels Association (2020). Annual U.S. Fuel Ethanol Production. https://ethanolrfa.org/statistics/annual-ethanol-production/ 25 U.S. Energy Administration (2020). Primary Energy Production by Source. Additional analysis provided by TRIP. https://www.eia.gov/totalenergy/data/monthly/ 27. Ibid. 27 Federal Highway Administration. Highway Statistics 2000 and 2018. See charts VM-1 and HM-60. Additional analysis by TRIP. 28 The American Association of State Highway and Transportation Officials, P. McKenna, J. Tymon (April 6, 2020). Correspondence to Congressional Leadership. https://policy.transportation.org/wp-content/uploads/sites/59/2020/04/2020-04-06-AASHTO-Letter-to-Congress-on-COVID-19-Phase-4-FINAL.pdf 29 2015 “Fixing America’s Surface Transportation Act.” (2015) American Road and Transportation Builders Association. http://www.artba.org/newsline/wp-content/uploads/2015/12/ANALYSIS-FINAL.pdf 30 United States Department of Transportation (2019). Status of the Nation’s Highways, Bridges, and Transit: Conditions and Performance, 23rd Edition. Chapter 7. Additional analysis provided by TRIP. https://www.fhwa.dot.gov/policy/23cpr/ 31 Ibid. 32 Ibid. 33 TRIP analysis of NHTSA and Federal Highway Administration data (2019). 34 Ibid. 35 Ibid. 36 Ibid. 37 United States General Accounting Office. Highway Safety: Federal and state efforts to Address Rural Road Safety Challenges (2004). P. 2. 38 Highway Statistics 2013, HM-55. Data is for arterial routes, excluding Interstates and other freeways and expressways. Federal Highway Administration. 39 Rural Road Safety: A Global Challenge. Public Roads September/October 1999. Federal Highway Administration. P. 4. 40 County Engineers Adopt Rural Road Safety Program. Minnesota Local Technical Assistance Program. 200 41 Highway Statistics 2013, HM-60. Federal Highway Administration. Data excludes Interstates or Urban Other Freeways and Expressway. 42 TRIP analysis of NHTSA data. 43 Guidance for Implementation of the AASHTO Strategic Highway Safety Plan. Volume 4: A Guide for Addressing Head-on Collisions. 2003. National Cooperative Highway Research Program. NCHRP Report 500.. P. I-2.

46
44 Federal and State Efforts to Address Rural Road Safety Challenges, May 2004. United States General Accounting Office. GAO-04-663. P. 25. 45 Kentucky Transportation Center. Development of Procedures for Identifying High-Crash Locations and Prioritizing Safety Improvements. 2003. P. 23. 46 Safety Impacts of Street Lighting at Isolated Rural Intersections. Isebrands, H., Hallmark, S., Hans, Z., McDonald, T., Iowa State/University/ Center for Transportation Research and Education. 47 Kentucky Transportation Center. Development of Procedures for Identifying High-Crash Locations and Prioritizing Safety Improvements. 2003. P. 23. 48 Volume 7: A Guide for Reducing Collisions on Horizontal Curves. National Cooperative Highway Research Program. Report 500. 2004. P. V-10. 49 Ibid. P. 23. 50 Safety Effectiveness of Intersection Left- and Right-Turn Lanes. Federal Highway Administration. 2002. Report No. FHWA-RD-02-103. P. 5. 51 Ibid. P. 5. 52 Ibid. P. 23. 53 Ibid. 24. 54 Ibid. P. 25. 55 Ibid. P. 24. 56 AAA Foundation for Traffic Safety. (2017). Safety Benefits of Highway Infrastructure Investments. P. 15. 57 Ibid. P. 25. 58 Kentucky Transportation Center. Development of Procedures for Identifying High-Crash Locations and Prioritizing Safety Improvements. 2003. P. 23. 59 Federal Highway Administration. Highway Statistics 2018. HM-63, HM-64. Data is for all arterials, including Interstates and major collectors. 60 Why We Must Preserve our Pavements, D. Jackson, J. Mahoney, G. Hicks, 1996 International Symposium on Asphalt Emulsion Technology. 61 Selecting a Preventative Maintenance Treatment for Flexible Pavements. R. Hicks, J. Moulthrop. Transportation Research Board. 1999. Figure 1. 62 U.S. Department of Transportation - Federal Highway Administration: National Bridge Inventory 2019. 63 Ibid. 64 Ibid. 65 Self Reported Satisfaction With Accessibility in Isolated Rural Areas. Federal Highway Administration. 2014. 66 American Association of State Highway and Transportation Officials (2010). Transportation Reboot: Restarting America’s Most Essential Operating System. The Case for Capacity: To Unlock Gridlock, Generate Jobs, Deliver Freight and Connect Communities. P. 37. 67Ibid. 68 National Cooperative Highway Research Program, Transportation Research Board (2007). Future Options for the National System of Interstate and Defense Highways. ES-ii. 69 American Association of State Highway and Transportation Officials (2010). Transportation Reboot: Restarting America’s Most Essential Operating System. The Case for Capacity: To Unlock Gridlock, Generate Jobs, Deliver Freight and Connect Communities. P. 43.

47
70 Ibid. P. 21. 71 Ibid. P. 6. 72 Rural Transportation Needs (2011). Council of State Governments. P. 2.