Embed Size (px)
Citation preview
Tunnelling and Underground Space Technology 46 (2015) 1–11
Contents lists available at ScienceDirect
Tunnelling and Underground Space Technology
journal homepage: www.elsevier .com/ locate/ tust
Tunnel reinforcement in columnar jointed basalts: The role of rock massanisotropy
http://dx.doi.org/10.1016/j.tust.2014.10.0080886-7798/� 2014 Elsevier Ltd. All rights reserved.
⇑ Corresponding author. Tel.: +972 8 6472621.E-mail address: [email protected] (Y.H. Hatzor).
1 Present address: Geological Survey of Israel, Jerusalem 95501, Israel.
Yossef H. Hatzor a,⇑, Xia-Ting Feng b, Shaojun Li b, Gony Yagoda-Biran a,1, Quan Jiang b, Lianxing Hu c
a Dept. of Geological and Environmental Sciences, Ben-Gurion University of the Negev, Beer-Sheva, Israelb National Key Laboratory of Geomechanics and Geotechnical Engineering, Institute of Rock and Soil Mechanics, The Chinese Academy of Sciences, Xiaohongshan Wuchang,Wuhan, Chinac China Three Gorges Corporation, Beijing 100038, China
a r t i c l e i n f o a b s t r a c t
Article history:Received 2 April 2014Received in revised form 26 August 2014Accepted 30 October 2014Available online 19 November 2014
Keywords:TunnelingColumnar basaltRock boltsDDAAnisotropy
The extent of the loosening zone in tunnels excavated through columnar jointed basalts is studied withthe numerical discontinuous deformation analysis (DDA) method. The structure of the rock mass andtunnel geometry are modeled on the basis of a real field case study of deep tunneling performed in sucha rock mass in south west China. Slender prismatic keyblocks formed by the intersection of broadly-spaced, gently-dipping breccia layers and closely-spaced, orthogonally oriented, steeply dipping colum-nar joints result in a highly anisotropic rock mass structure and give rise to sliding and toppling failuremodes in the sidewalls and to an excessive height of loosening zone in the roof, the geometry of which isshown to be controlled by the orientation of the steeply inclined columnar joints. Results of displacementmonitoring performed during tunnel excavation in a similar rock mass with multiple point boreholeextensometers confirm the numerically obtained depth of the loosening zone both in the sidewallsand the roof. We find that the height of the loosening zone in the roof as obtained with DDA is greaterthan would have been predicted by Terzaghi’s empirical rock load classification for ‘‘blocky’’ rock masses,and show that its shape and orientation are controlled by the anisotropy of the rock mass structure.Moreover, we demonstrate that dimensioning rock bolt reinforcement using well-established empiricalcriteria without consideration of the anisotropic nature of the rock mass may lead to un-conservativedesign.
� 2014 Elsevier Ltd. All rights reserved.
1. Introduction
Rock masses consisting of columnar basalts pose difficult chal-lenges to the design of underground mining and excavation oper-ations because of the intensity of the jointing pattern. Typicallyrock mass structures are characterized by well-defined joint sets(e.g. Hudson and Priest, 1979) each with representative spacingand length distributions (e.g. Priest and Hudson, 1976, 1981;Zhang and Einstein, 1998). The intersections of discrete joints inthe rock mass give rise to three dimensional blocks of variousshapes and sizes (Kuszmaul, 1999; Shi and Goodman, 1989) theinteraction of which can be studied numerically using discrete ele-ment approaches such as DEM (Cundall, 1987) or DDA (Shi, 1993).The same is true for rock masses consisting of columnar basalts,but here the mean spacing of the columnar joints is extremely
small and their length is constrained by upper and lower bound-aries of lava flows (Hetényi et al., 2012), which typically manifestin the field as bedding plane like partings, giving rise to a structurethat has been referred to in sedimentary rocks as mechanical lay-ering (Bai and Gross, 1999; Bakun-Mazor et al., 2009; Narr andSuppe, 1991; Ruf et al., 1998). The spacing between the upperand lower lava flow boundaries, or the thickness of a single colum-nar joint stack (elsewhere referred to as colonnade (Hetényi et al.,2012)), is controlled by the volcanic conditions at time of the erup-tion but is typically in the order of several meters. The spacingbetween the columnar joints, however, is typically limited to sev-eral to tens of centimeters only (Goehring and Stephen, 2008) witha characteristic homogeneous spacing distribution, giving rise toorderly shaped prisms of a typically pentagonal or hexagonal crosssection (Saliba and Jagla, 2003). Since essentially the stacks ofcolumnar joints are bounded between the gently dipping upperand lower boundaries of lava flows (elsewhere referred to as basaland upper breccia layers (see Hetényi et al., 2012)), and are typi-cally oriented normal to those boundaries, the inclination of the
2 Y.H. Hatzor et al. / Tunnelling and Underground Space Technology 46 (2015) 1–11
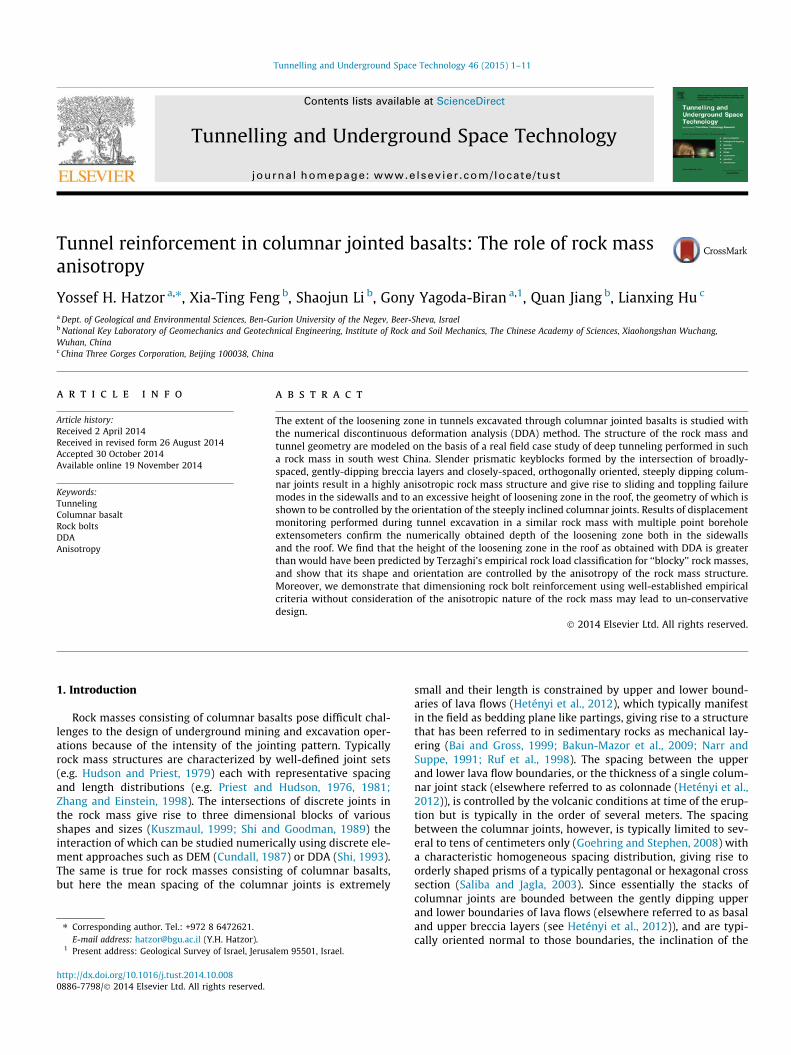
prismatic blocks tends to be rather steep, causing stability prob-lems around underground openings excavated through such rockmasses. An example of steeply inclined columnar joints orientednormal to the boundary planes is shown in Fig. 1. This particularrelationship between the columnar joints and the breccia planesgives rise to a highly anisotropic rock mass structure, the tunnelingchallenges of which are explored in this paper.
In this paper we model the deformation of a rock mass consist-ing of columnar jointing using the numerical discontinuous defor-mation analysis (DDA) method (Shi, 1993) with two modifications:
1. Non-reflecting boundaries around the jointed domain are intro-duced following the recent development of Bao et al. (2012) andinitial in situ stresses are imposed from the beginning of thenumerical simulation, thus allowing us to minimize the sizeof the modeled domain and focus our analysis near the under-ground opening.
2. To simulate the response of the rock mass to tunneling as accu-rately as possible we model the excavation sequence using arecent development that was originally introduced into thenumerical manifold method by Tal et al. (2014).
Naturally, in the more mature DEM and certainly in the FEMthese modifications have been standard practice for some time,but application of these improvements in DDA is fairly new.
Following introduction of the rock mass structure and consider-ations in mesh generation, we first demonstrate the application ofsequential excavation modeling in DDA and then show the modesof failure and depth of loosening zone that are expected to developin the sidewalls and roof, respectively. We show that because ofthe strong rock mass anisotropy, the initial principal stresses rotateafter the excavation is formed and become aligned with the orien-tation of the principal joint sets. This of course controls the shapeand orientation of the loosening zone which develops around theopening following the excavation. Our DDA results are validatedand confirmed by means of in situ displacement monitoring dataobtained with multiple point borehole extensometers during
Fig. 1. Steeply inclined columnar joints oriented normal to a breccia plane. In the inset a(see Jiang et al., 2014).
tunneling in a similar rock mass structure. Finally, using the boltelement in DDA we test the applicability of the empirical rock bolt-ing guidelines recommended by Lang (1961, 1972) with respect tothe required bolt spacing and length.
2. The DDA model
2.1. The modeled rock mass structure
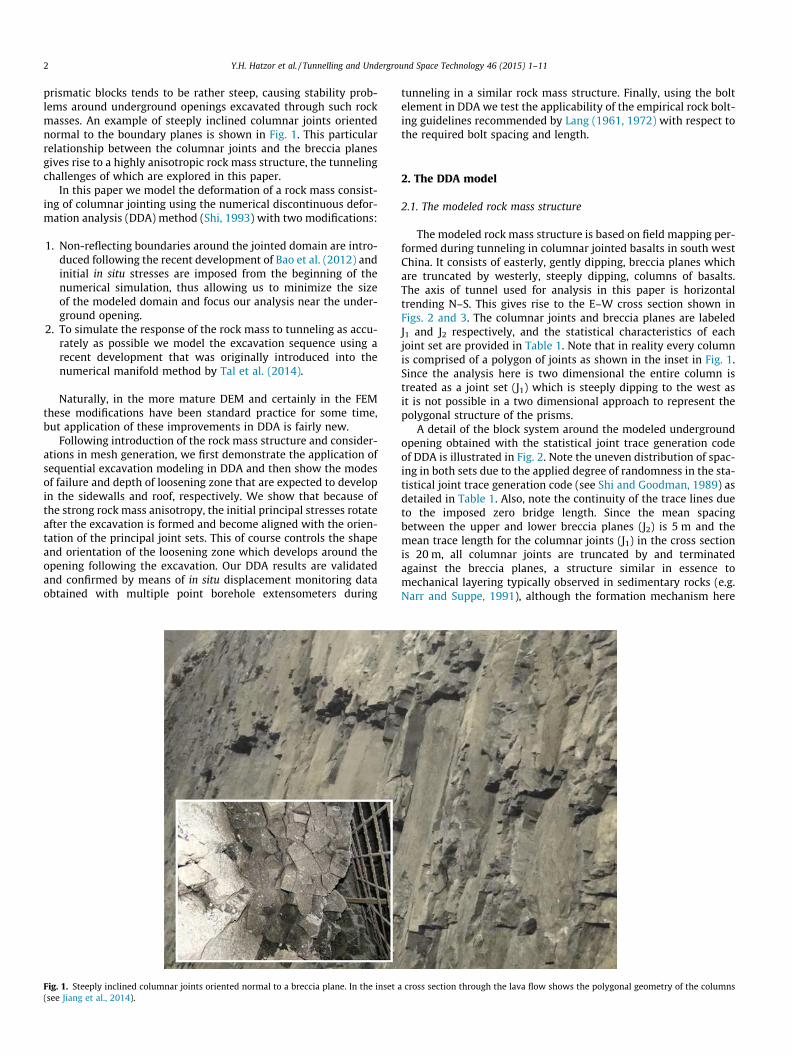
The modeled rock mass structure is based on field mapping per-formed during tunneling in columnar jointed basalts in south westChina. It consists of easterly, gently dipping, breccia planes whichare truncated by westerly, steeply dipping, columns of basalts.The axis of tunnel used for analysis in this paper is horizontaltrending N–S. This gives rise to the E–W cross section shown inFigs. 2 and 3. The columnar joints and breccia planes are labeledJ1 and J2 respectively, and the statistical characteristics of eachjoint set are provided in Table 1. Note that in reality every columnis comprised of a polygon of joints as shown in the inset in Fig. 1.Since the analysis here is two dimensional the entire column istreated as a joint set (J1) which is steeply dipping to the west asit is not possible in a two dimensional approach to represent thepolygonal structure of the prisms.
A detail of the block system around the modeled undergroundopening obtained with the statistical joint trace generation codeof DDA is illustrated in Fig. 2. Note the uneven distribution of spac-ing in both sets due to the applied degree of randomness in the sta-tistical joint trace generation code (see Shi and Goodman, 1989) asdetailed in Table 1. Also, note the continuity of the trace lines dueto the imposed zero bridge length. Since the mean spacingbetween the upper and lower breccia planes (J2) is 5 m and themean trace length for the columnar joints (J1) in the cross sectionis 20 m, all columnar joints are truncated by and terminatedagainst the breccia planes, a structure similar in essence tomechanical layering typically observed in sedimentary rocks (e.g.Narr and Suppe, 1991), although the formation mechanism here
cross section through the lava flow shows the polygonal geometry of the columns
20 m
-E- -W- Breccia planes
Columnar Joints
Fig. 2. A detail of the two dimensional DDA model representing the analyzed rockmass.
1
3
4
5
2
6 7 10 9 8 11
50.0, 49.350.0, 52.250.0, 58.2
50.0, 74.2
50.0, 99.2
59.95, 34.00 62.85, 34.00 68.85, 34.00
Non reflec�ve boundaries
100 m
100 m
-E- -W-
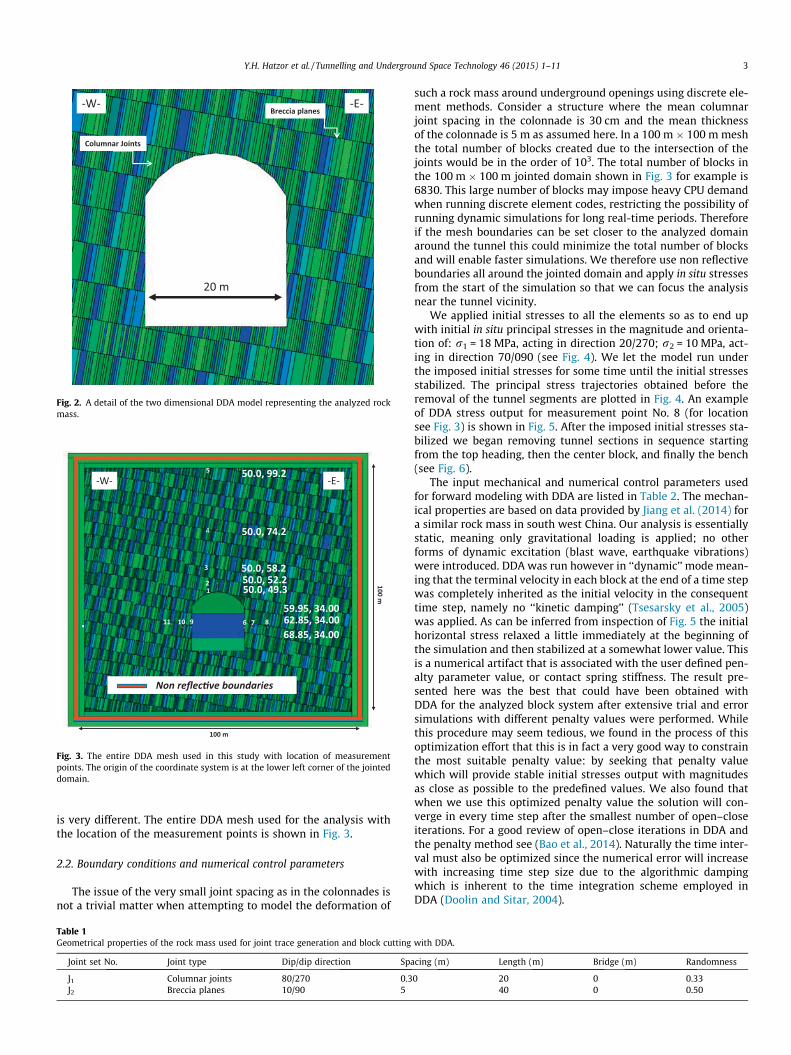
Fig. 3. The entire DDA mesh used in this study with location of measurementpoints. The origin of the coordinate system is at the lower left corner of the jointeddomain.
Y.H. Hatzor et al. / Tunnelling and Underground Space Technology 46 (2015) 1–11 3
is very different. The entire DDA mesh used for the analysis withthe location of the measurement points is shown in Fig. 3.
2.2. Boundary conditions and numerical control parameters
The issue of the very small joint spacing as in the colonnades isnot a trivial matter when attempting to model the deformation of
Table 1Geometrical properties of the rock mass used for joint trace generation and block cutting
Joint set No. Joint type Dip/dip direction Spa
J1 Columnar joints 80/270 0.3J2 Breccia planes 10/90 5
such a rock mass around underground openings using discrete ele-ment methods. Consider a structure where the mean columnarjoint spacing in the colonnade is 30 cm and the mean thicknessof the colonnade is 5 m as assumed here. In a 100 m � 100 m meshthe total number of blocks created due to the intersection of thejoints would be in the order of 103. The total number of blocks inthe 100 m � 100 m jointed domain shown in Fig. 3 for example is6830. This large number of blocks may impose heavy CPU demandwhen running discrete element codes, restricting the possibility ofrunning dynamic simulations for long real-time periods. Thereforeif the mesh boundaries can be set closer to the analyzed domainaround the tunnel this could minimize the total number of blocksand will enable faster simulations. We therefore use non reflectiveboundaries all around the jointed domain and apply in situ stressesfrom the start of the simulation so that we can focus the analysisnear the tunnel vicinity.
We applied initial stresses to all the elements so as to end upwith initial in situ principal stresses in the magnitude and orienta-tion of: r1 = 18 MPa, acting in direction 20/270; r2 = 10 MPa, act-ing in direction 70/090 (see Fig. 4). We let the model run underthe imposed initial stresses for some time until the initial stressesstabilized. The principal stress trajectories obtained before theremoval of the tunnel segments are plotted in Fig. 4. An exampleof DDA stress output for measurement point No. 8 (for locationsee Fig. 3) is shown in Fig. 5. After the imposed initial stresses sta-bilized we began removing tunnel sections in sequence startingfrom the top heading, then the center block, and finally the bench(see Fig. 6).
The input mechanical and numerical control parameters usedfor forward modeling with DDA are listed in Table 2. The mechan-ical properties are based on data provided by Jiang et al. (2014) fora similar rock mass in south west China. Our analysis is essentiallystatic, meaning only gravitational loading is applied; no otherforms of dynamic excitation (blast wave, earthquake vibrations)were introduced. DDA was run however in ‘‘dynamic’’ mode mean-ing that the terminal velocity in each block at the end of a time stepwas completely inherited as the initial velocity in the consequenttime step, namely no ‘‘kinetic damping’’ (Tsesarsky et al., 2005)was applied. As can be inferred from inspection of Fig. 5 the initialhorizontal stress relaxed a little immediately at the beginning ofthe simulation and then stabilized at a somewhat lower value. Thisis a numerical artifact that is associated with the user defined pen-alty parameter value, or contact spring stiffness. The result pre-sented here was the best that could have been obtained withDDA for the analyzed block system after extensive trial and errorsimulations with different penalty values were performed. Whilethis procedure may seem tedious, we found in the process of thisoptimization effort that this is in fact a very good way to constrainthe most suitable penalty value: by seeking that penalty valuewhich will provide stable initial stresses output with magnitudesas close as possible to the predefined values. We also found thatwhen we use this optimized penalty value the solution will con-verge in every time step after the smallest number of open–closeiterations. For a good review of open–close iterations in DDA andthe penalty method see (Bao et al., 2014). Naturally the time inter-val must also be optimized since the numerical error will increasewith increasing time step size due to the algorithmic dampingwhich is inherent to the time integration scheme employed inDDA (Doolin and Sitar, 2004).
with DDA.
cing (m) Length (m) Bridge (m) Randomness
0 20 0 0.3340 0 0.50
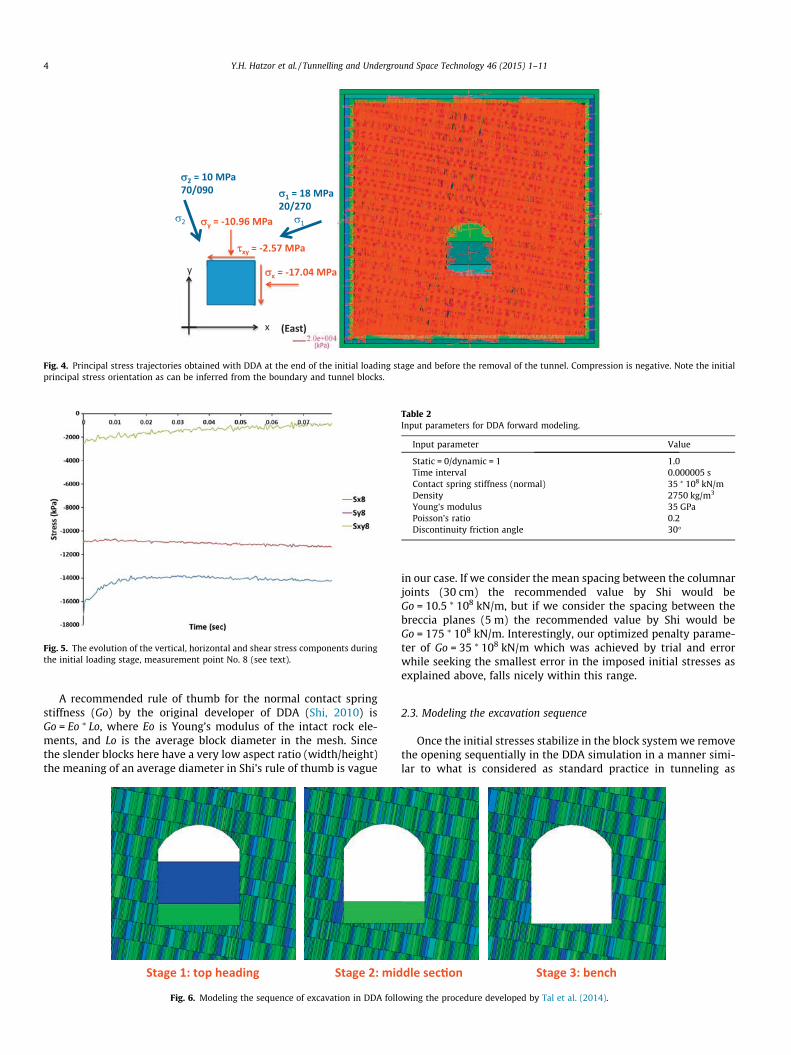
Fig. 4. Principal stress trajectories obtained with DDA at the end of the initial loading stage and before the removal of the tunnel. Compression is negative. Note the initialprincipal stress orientation as can be inferred from the boundary and tunnel blocks.
Fig. 5. The evolution of the vertical, horizontal and shear stress components duringthe initial loading stage, measurement point No. 8 (see text).
Table 2Input parameters for DDA forward modeling.
Input parameter Value
Static = 0/dynamic = 1 1.0Time interval 0.000005 sContact spring stiffness (normal) 35 ⁄ 108 kN/mDensity 2750 kg/m3
Young’s modulus 35 GPaPoisson’s ratio 0.2Discontinuity friction angle 30�
4 Y.H. Hatzor et al. / Tunnelling and Underground Space Technology 46 (2015) 1–11
A recommended rule of thumb for the normal contact springstiffness (Go) by the original developer of DDA (Shi, 2010) isGo = Eo ⁄ Lo, where Eo is Young’s modulus of the intact rock ele-ments, and Lo is the average block diameter in the mesh. Sincethe slender blocks here have a very low aspect ratio (width/height)the meaning of an average diameter in Shi’s rule of thumb is vague
Stage 1: top heading Stage 2: mid
Fig. 6. Modeling the sequence of excavation in DDA foll
in our case. If we consider the mean spacing between the columnarjoints (30 cm) the recommended value by Shi would beGo = 10.5 ⁄ 108 kN/m, but if we consider the spacing between thebreccia planes (5 m) the recommended value by Shi would beGo = 175 ⁄ 108 kN/m. Interestingly, our optimized penalty parame-ter of Go = 35 ⁄ 108 kN/m which was achieved by trial and errorwhile seeking the smallest error in the imposed initial stresses asexplained above, falls nicely within this range.
2.3. Modeling the excavation sequence
Once the initial stresses stabilize in the block system we removethe opening sequentially in the DDA simulation in a manner simi-lar to what is considered as standard practice in tunneling as
dle sec�on Stage 3: bench
owing the procedure developed by Tal et al. (2014).
Y.H. Hatzor et al. / Tunnelling and Underground Space Technology 46 (2015) 1–11 5
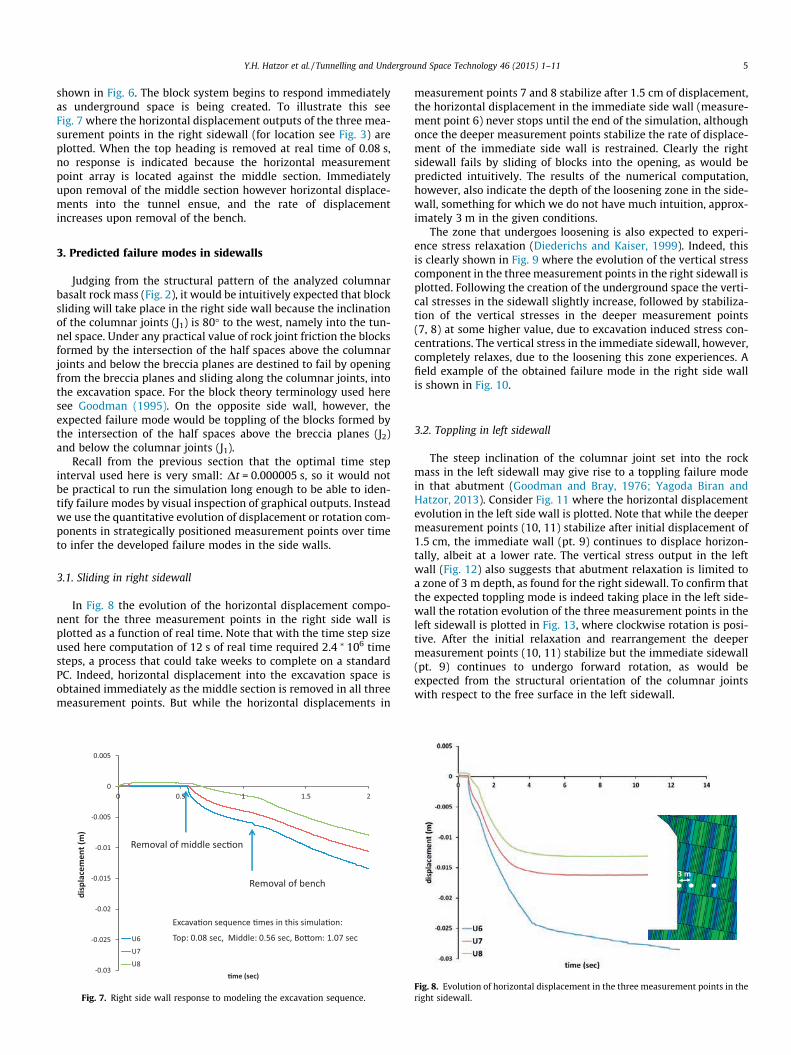
shown in Fig. 6. The block system begins to respond immediatelyas underground space is being created. To illustrate this seeFig. 7 where the horizontal displacement outputs of the three mea-surement points in the right sidewall (for location see Fig. 3) areplotted. When the top heading is removed at real time of 0.08 s,no response is indicated because the horizontal measurementpoint array is located against the middle section. Immediatelyupon removal of the middle section however horizontal displace-ments into the tunnel ensue, and the rate of displacementincreases upon removal of the bench.
3. Predicted failure modes in sidewalls
Judging from the structural pattern of the analyzed columnarbasalt rock mass (Fig. 2), it would be intuitively expected that blocksliding will take place in the right side wall because the inclinationof the columnar joints (J1) is 80� to the west, namely into the tun-nel space. Under any practical value of rock joint friction the blocksformed by the intersection of the half spaces above the columnarjoints and below the breccia planes are destined to fail by openingfrom the breccia planes and sliding along the columnar joints, intothe excavation space. For the block theory terminology used heresee Goodman (1995). On the opposite side wall, however, theexpected failure mode would be toppling of the blocks formed bythe intersection of the half spaces above the breccia planes (J2)and below the columnar joints (J1).
Recall from the previous section that the optimal time stepinterval used here is very small: Dt = 0.000005 s, so it would notbe practical to run the simulation long enough to be able to iden-tify failure modes by visual inspection of graphical outputs. Insteadwe use the quantitative evolution of displacement or rotation com-ponents in strategically positioned measurement points over timeto infer the developed failure modes in the side walls.
3.1. Sliding in right sidewall
In Fig. 8 the evolution of the horizontal displacement compo-nent for the three measurement points in the right side wall isplotted as a function of real time. Note that with the time step sizeused here computation of 12 s of real time required 2.4 ⁄ 106 timesteps, a process that could take weeks to complete on a standardPC. Indeed, horizontal displacement into the excavation space isobtained immediately as the middle section is removed in all threemeasurement points. But while the horizontal displacements in
-0.03
-0.025
-0.02
-0.015
-0.01
-0.005
0
0.005
0 0.5 1 1.5 2
disp
lace
men
t (m
)
�me (sec)
U6
U7
U8
Excava�on sequence �mes in this simula�on:
Top: 0.08 sec, Middle: 0.56 sec, Bo�om: 1.07 sec
Removal of middle sec�on
Removal of bench
Fig. 7. Right side wall response to modeling the excavation sequence.
measurement points 7 and 8 stabilize after 1.5 cm of displacement,the horizontal displacement in the immediate side wall (measure-ment point 6) never stops until the end of the simulation, althoughonce the deeper measurement points stabilize the rate of displace-ment of the immediate side wall is restrained. Clearly the rightsidewall fails by sliding of blocks into the opening, as would bepredicted intuitively. The results of the numerical computation,however, also indicate the depth of the loosening zone in the side-wall, something for which we do not have much intuition, approx-imately 3 m in the given conditions.
The zone that undergoes loosening is also expected to experi-ence stress relaxation (Diederichs and Kaiser, 1999). Indeed, thisis clearly shown in Fig. 9 where the evolution of the vertical stresscomponent in the three measurement points in the right sidewall isplotted. Following the creation of the underground space the verti-cal stresses in the sidewall slightly increase, followed by stabiliza-tion of the vertical stresses in the deeper measurement points(7, 8) at some higher value, due to excavation induced stress con-centrations. The vertical stress in the immediate sidewall, however,completely relaxes, due to the loosening this zone experiences. Afield example of the obtained failure mode in the right side wallis shown in Fig. 10.
3.2. Toppling in left sidewall
The steep inclination of the columnar joint set into the rockmass in the left sidewall may give rise to a toppling failure modein that abutment (Goodman and Bray, 1976; Yagoda Biran andHatzor, 2013). Consider Fig. 11 where the horizontal displacementevolution in the left side wall is plotted. Note that while the deepermeasurement points (10, 11) stabilize after initial displacement of1.5 cm, the immediate wall (pt. 9) continues to displace horizon-tally, albeit at a lower rate. The vertical stress output in the leftwall (Fig. 12) also suggests that abutment relaxation is limited toa zone of 3 m depth, as found for the right sidewall. To confirm thatthe expected toppling mode is indeed taking place in the left side-wall the rotation evolution of the three measurement points in theleft sidewall is plotted in Fig. 13, where clockwise rotation is posi-tive. After the initial relaxation and rearrangement the deepermeasurement points (10, 11) stabilize but the immediate sidewall(pt. 9) continues to undergo forward rotation, as would beexpected from the structural orientation of the columnar jointswith respect to the free surface in the left sidewall.
3 m
Fig. 8. Evolution of horizontal displacement in the three measurement points in theright sidewall.
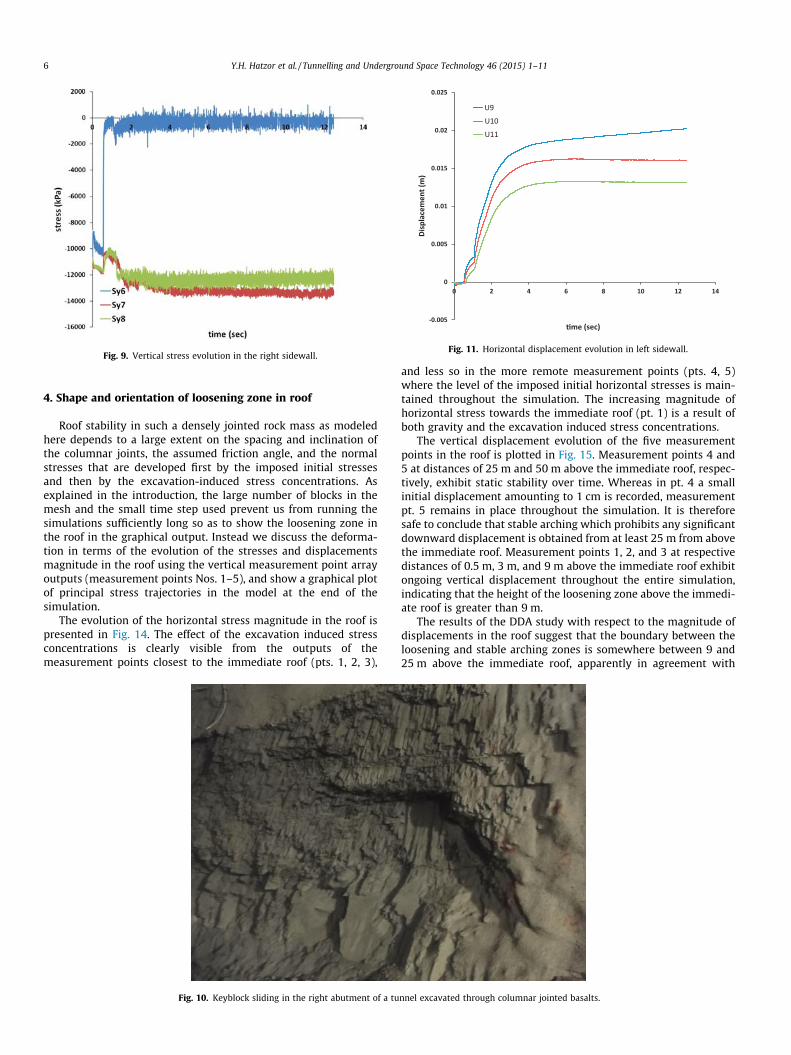
Fig. 9. Vertical stress evolution in the right sidewall.
-0.005
0
0.005
0.01
0.015
0.02
0.025
0 2 4 6 8 10 12 14
Disp
lace
men
t (m
)
�me (sec)
U9
U10
U11
Fig. 11. Horizontal displacement evolution in left sidewall.
6 Y.H. Hatzor et al. / Tunnelling and Underground Space Technology 46 (2015) 1–11
4. Shape and orientation of loosening zone in roof
Roof stability in such a densely jointed rock mass as modeledhere depends to a large extent on the spacing and inclination ofthe columnar joints, the assumed friction angle, and the normalstresses that are developed first by the imposed initial stressesand then by the excavation-induced stress concentrations. Asexplained in the introduction, the large number of blocks in themesh and the small time step used prevent us from running thesimulations sufficiently long so as to show the loosening zone inthe roof in the graphical output. Instead we discuss the deforma-tion in terms of the evolution of the stresses and displacementsmagnitude in the roof using the vertical measurement point arrayoutputs (measurement points Nos. 1–5), and show a graphical plotof principal stress trajectories in the model at the end of thesimulation.
The evolution of the horizontal stress magnitude in the roof ispresented in Fig. 14. The effect of the excavation induced stressconcentrations is clearly visible from the outputs of themeasurement points closest to the immediate roof (pts. 1, 2, 3),
Fig. 10. Keyblock sliding in the right abutment of a tu
and less so in the more remote measurement points (pts. 4, 5)where the level of the imposed initial horizontal stresses is main-tained throughout the simulation. The increasing magnitude ofhorizontal stress towards the immediate roof (pt. 1) is a result ofboth gravity and the excavation induced stress concentrations.
The vertical displacement evolution of the five measurementpoints in the roof is plotted in Fig. 15. Measurement points 4 and5 at distances of 25 m and 50 m above the immediate roof, respec-tively, exhibit static stability over time. Whereas in pt. 4 a smallinitial displacement amounting to 1 cm is recorded, measurementpt. 5 remains in place throughout the simulation. It is thereforesafe to conclude that stable arching which prohibits any significantdownward displacement is obtained from at least 25 m from abovethe immediate roof. Measurement points 1, 2, and 3 at respectivedistances of 0.5 m, 3 m, and 9 m above the immediate roof exhibitongoing vertical displacement throughout the entire simulation,indicating that the height of the loosening zone above the immedi-ate roof is greater than 9 m.
The results of the DDA study with respect to the magnitude ofdisplacements in the roof suggest that the boundary between theloosening and stable arching zones is somewhere between 9 and25 m above the immediate roof, apparently in agreement with
nnel excavated through columnar jointed basalts.
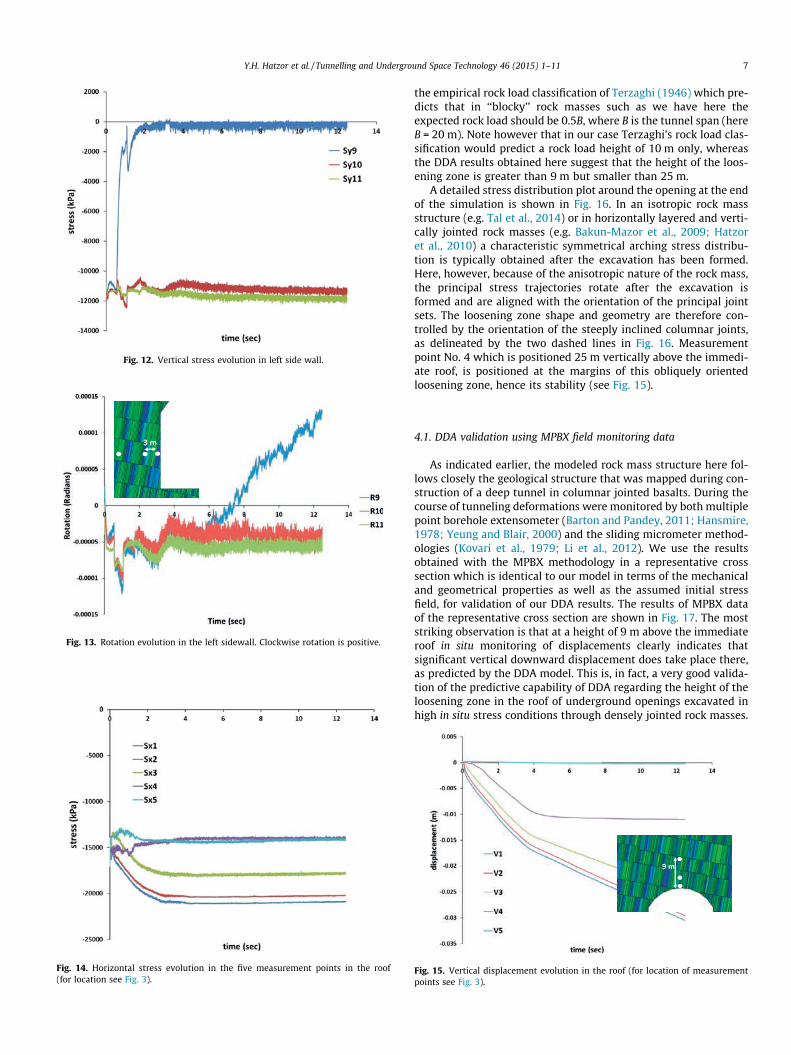
Fig. 12. Vertical stress evolution in left side wall.
3 m
Fig. 13. Rotation evolution in the left sidewall. Clockwise rotation is positive.
Fig. 14. Horizontal stress evolution in the five measurement points in the roof(for location see Fig. 3).
Y.H. Hatzor et al. / Tunnelling and Underground Space Technology 46 (2015) 1–11 7
the empirical rock load classification of Terzaghi (1946) which pre-dicts that in ‘‘blocky’’ rock masses such as we have here theexpected rock load should be 0.5B, where B is the tunnel span (hereB = 20 m). Note however that in our case Terzaghi’s rock load clas-sification would predict a rock load height of 10 m only, whereasthe DDA results obtained here suggest that the height of the loos-ening zone is greater than 9 m but smaller than 25 m.
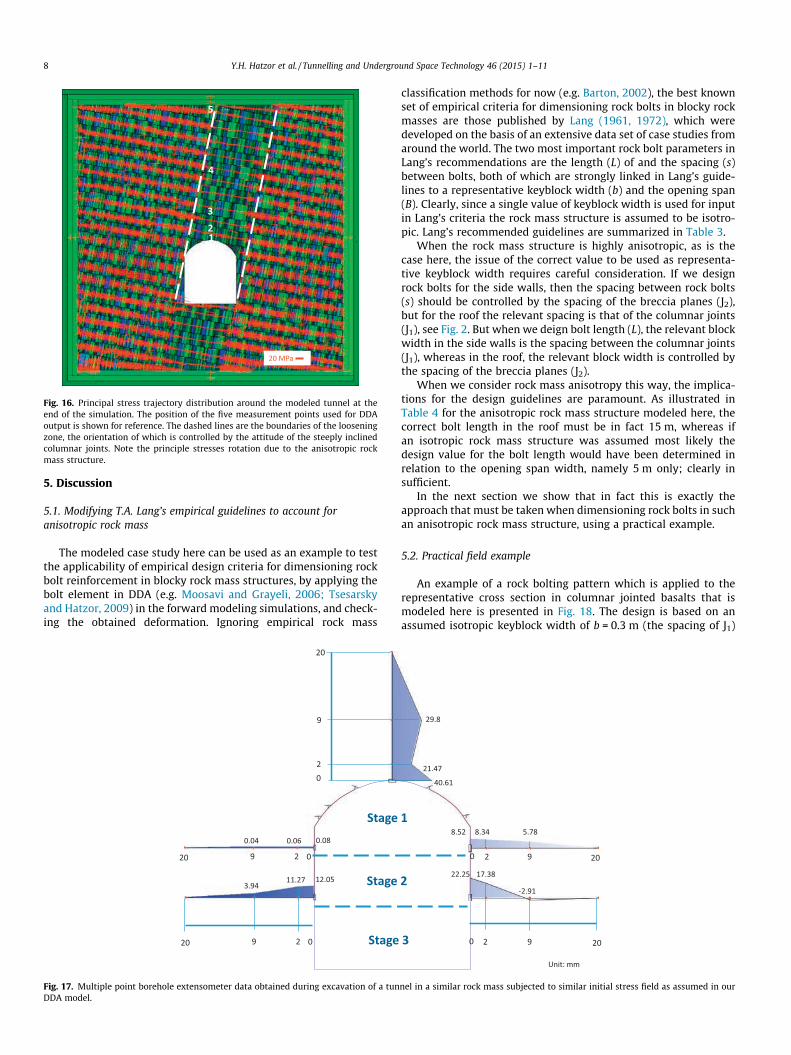
A detailed stress distribution plot around the opening at the endof the simulation is shown in Fig. 16. In an isotropic rock massstructure (e.g. Tal et al., 2014) or in horizontally layered and verti-cally jointed rock masses (e.g. Bakun-Mazor et al., 2009; Hatzoret al., 2010) a characteristic symmetrical arching stress distribu-tion is typically obtained after the excavation has been formed.Here, however, because of the anisotropic nature of the rock mass,the principal stress trajectories rotate after the excavation isformed and are aligned with the orientation of the principal jointsets. The loosening zone shape and geometry are therefore con-trolled by the orientation of the steeply inclined columnar joints,as delineated by the two dashed lines in Fig. 16. Measurementpoint No. 4 which is positioned 25 m vertically above the immedi-ate roof, is positioned at the margins of this obliquely orientedloosening zone, hence its stability (see Fig. 15).
4.1. DDA validation using MPBX field monitoring data
As indicated earlier, the modeled rock mass structure here fol-lows closely the geological structure that was mapped during con-struction of a deep tunnel in columnar jointed basalts. During thecourse of tunneling deformations were monitored by both multiplepoint borehole extensometer (Barton and Pandey, 2011; Hansmire,1978; Yeung and Blair, 2000) and the sliding micrometer method-ologies (Kovari et al., 1979; Li et al., 2012). We use the resultsobtained with the MPBX methodology in a representative crosssection which is identical to our model in terms of the mechanicaland geometrical properties as well as the assumed initial stressfield, for validation of our DDA results. The results of MPBX dataof the representative cross section are shown in Fig. 17. The moststriking observation is that at a height of 9 m above the immediateroof in situ monitoring of displacements clearly indicates thatsignificant vertical downward displacement does take place there,as predicted by the DDA model. This is, in fact, a very good valida-tion of the predictive capability of DDA regarding the height of theloosening zone in the roof of underground openings excavated inhigh in situ stress conditions through densely jointed rock masses.
9 m
Fig. 15. Vertical displacement evolution in the roof (for location of measurementpoints see Fig. 3).
1
3
4
5
2
20 MPa
Fig. 16. Principal stress trajectory distribution around the modeled tunnel at theend of the simulation. The position of the five measurement points used for DDAoutput is shown for reference. The dashed lines are the boundaries of the looseningzone, the orientation of which is controlled by the attitude of the steeply inclinedcolumnar joints. Note the principle stresses rotation due to the anisotropic rockmass structure.
8 Y.H. Hatzor et al. / Tunnelling and Underground Space Technology 46 (2015) 1–11
5. Discussion
5.1. Modifying T.A. Lang’s empirical guidelines to account foranisotropic rock mass
The modeled case study here can be used as an example to testthe applicability of empirical design criteria for dimensioning rockbolt reinforcement in blocky rock mass structures, by applying thebolt element in DDA (e.g. Moosavi and Grayeli, 2006; Tsesarskyand Hatzor, 2009) in the forward modeling simulations, and check-ing the obtained deformation. Ignoring empirical rock mass
0 2
9
20
0 2 9 20
0 2 9 20
Stage
Stage
Stage
3.9411.27
0.04 0.06
12.05
0.08
Fig. 17. Multiple point borehole extensometer data obtained during excavation of a tunDDA model.
classification methods for now (e.g. Barton, 2002), the best knownset of empirical criteria for dimensioning rock bolts in blocky rockmasses are those published by Lang (1961, 1972), which weredeveloped on the basis of an extensive data set of case studies fromaround the world. The two most important rock bolt parameters inLang’s recommendations are the length (L) of and the spacing (s)between bolts, both of which are strongly linked in Lang’s guide-lines to a representative keyblock width (b) and the opening span(B). Clearly, since a single value of keyblock width is used for inputin Lang’s criteria the rock mass structure is assumed to be isotro-pic. Lang’s recommended guidelines are summarized in Table 3.
When the rock mass structure is highly anisotropic, as is thecase here, the issue of the correct value to be used as representa-tive keyblock width requires careful consideration. If we designrock bolts for the side walls, then the spacing between rock bolts(s) should be controlled by the spacing of the breccia planes (J2),but for the roof the relevant spacing is that of the columnar joints(J1), see Fig. 2. But when we deign bolt length (L), the relevant blockwidth in the side walls is the spacing between the columnar joints(J1), whereas in the roof, the relevant block width is controlled bythe spacing of the breccia planes (J2).
When we consider rock mass anisotropy this way, the implica-tions for the design guidelines are paramount. As illustrated inTable 4 for the anisotropic rock mass structure modeled here, thecorrect bolt length in the roof must be in fact 15 m, whereas ifan isotropic rock mass structure was assumed most likely thedesign value for the bolt length would have been determined inrelation to the opening span width, namely 5 m only; clearly insufficient.
In the next section we show that in fact this is exactly theapproach that must be taken when dimensioning rock bolts in suchan anisotropic rock mass structure, using a practical example.
5.2. Practical field example
An example of a rock bolting pattern which is applied to therepresentative cross section in columnar jointed basalts that ismodeled here is presented in Fig. 18. The design is based on anassumed isotropic keyblock width of b = 0.3 m (the spacing of J1)
0 2 9 20
0 2 9 20
1
2
3
40.61
21.47
29.8
8.34 5.788.52
17.38
-2.91
22.25
Unit: mm
nel in a similar rock mass subjected to similar initial stress field as assumed in our
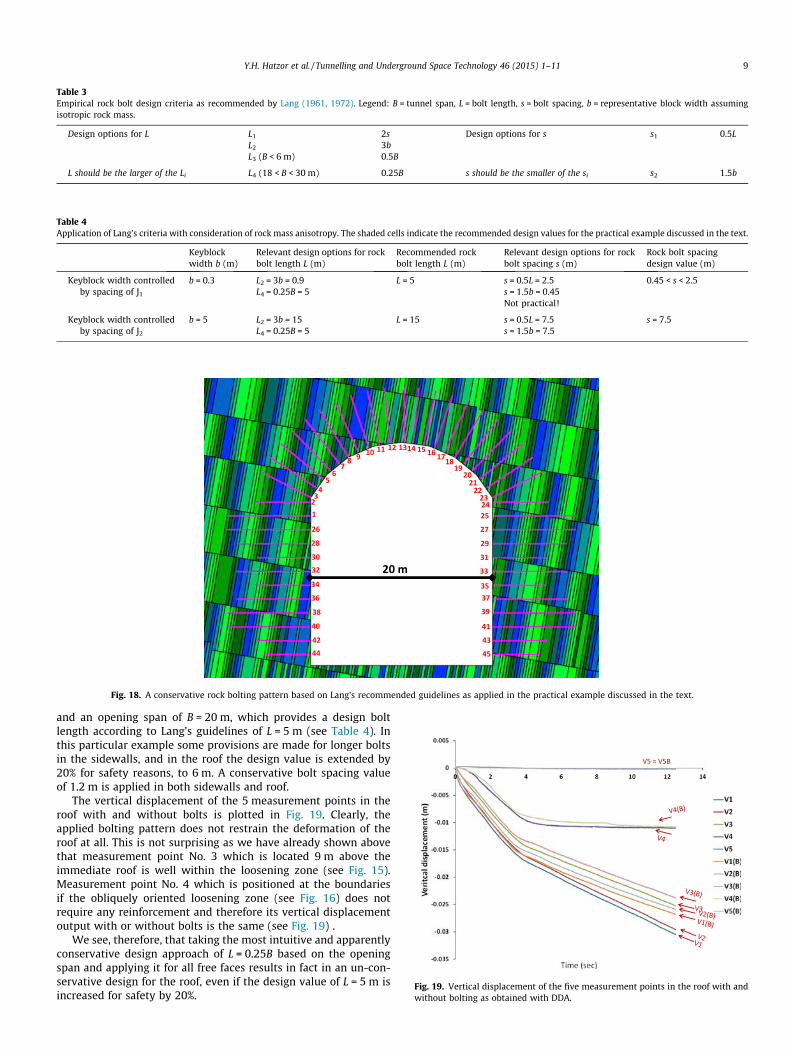
Table 3Empirical rock bolt design criteria as recommended by Lang (1961, 1972). Legend: B = tunnel span, L = bolt length, s = bolt spacing, b = representative block width assumingisotropic rock mass.
Design options for L L1 2s Design options for s s1 0.5LL2 3bL3 (B < 6 m) 0.5B
L should be the larger of the Li L4 (18 < B < 30 m) 0.25B s should be the smaller of the si s2 1.5b
4442
40
38
36
34
3230
28
26
45
43
41
39
3735
33
31
29
27
252423
2221
2019
1817161514131211109 8 7
6 5
4 3
2 1
20 m
Fig. 18. A conservative rock bolting pattern based on Lang’s recommended guidelines as applied in the practical example discussed in the text.
Table 4Application of Lang’s criteria with consideration of rock mass anisotropy. The shaded cells indicate the recommended design values for the practical example discussed in the text.
Keyblockwidth b (m)
Relevant design options for rockbolt length L (m)
Recommended rockbolt length L (m)
Relevant design options for rockbolt spacing s (m)
Rock bolt spacingdesign value (m)
Keyblock width controlledby spacing of J1
b = 0.3 L2 = 3b = 0.9 L = 5 s = 0.5L = 2.5 0.45 < s < 2.5L4 = 0.25B = 5 s = 1.5b = 0.45
Not practical!
Keyblock width controlledby spacing of J2
b = 5 L2 = 3b = 15 L = 15 s = 0.5L = 7.5 s = 7.5L4 = 0.25B = 5 s = 1.5b = 7.5
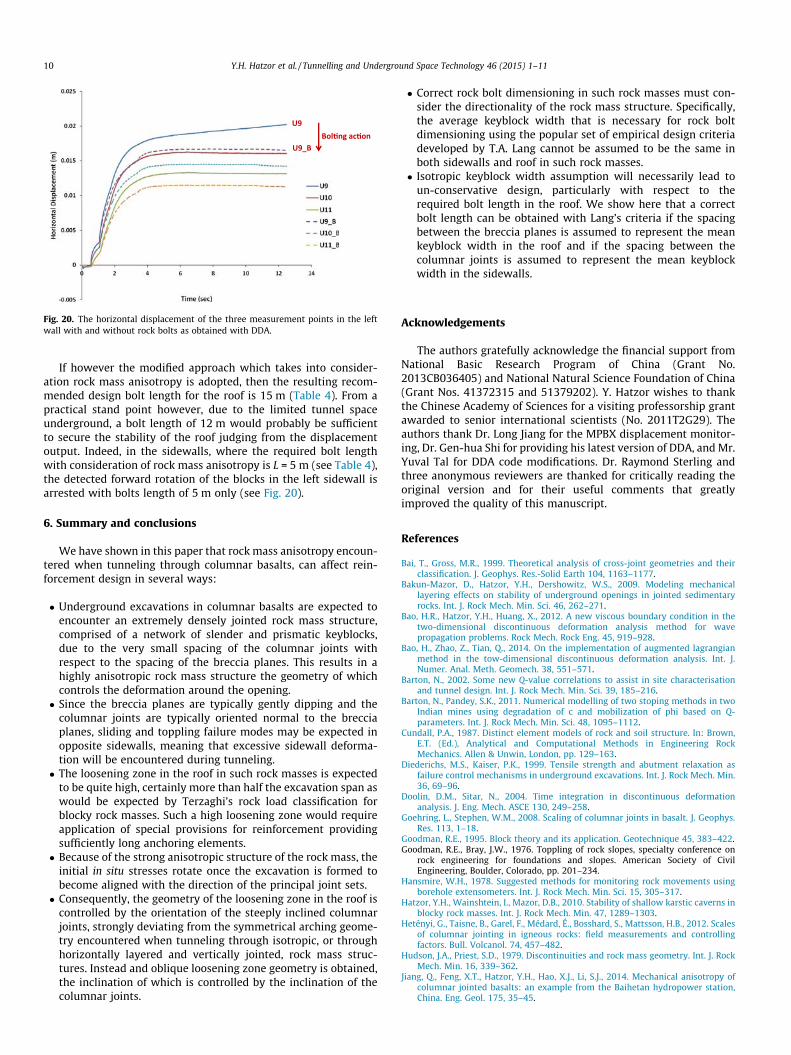
V5 = V5B
Fig. 19. Vertical displacement of the five measurement points in the roof with andwithout bolting as obtained with DDA.
Y.H. Hatzor et al. / Tunnelling and Underground Space Technology 46 (2015) 1–11 9
and an opening span of B = 20 m, which provides a design boltlength according to Lang’s guidelines of L = 5 m (see Table 4). Inthis particular example some provisions are made for longer boltsin the sidewalls, and in the roof the design value is extended by20% for safety reasons, to 6 m. A conservative bolt spacing valueof 1.2 m is applied in both sidewalls and roof.
The vertical displacement of the 5 measurement points in theroof with and without bolts is plotted in Fig. 19. Clearly, theapplied bolting pattern does not restrain the deformation of theroof at all. This is not surprising as we have already shown abovethat measurement point No. 3 which is located 9 m above theimmediate roof is well within the loosening zone (see Fig. 15).Measurement point No. 4 which is positioned at the boundariesif the obliquely oriented loosening zone (see Fig. 16) does notrequire any reinforcement and therefore its vertical displacementoutput with or without bolts is the same (see Fig. 19) .
We see, therefore, that taking the most intuitive and apparentlyconservative design approach of L = 0.25B based on the openingspan and applying it for all free faces results in fact in an un-con-servative design for the roof, even if the design value of L = 5 m isincreased for safety by 20%.
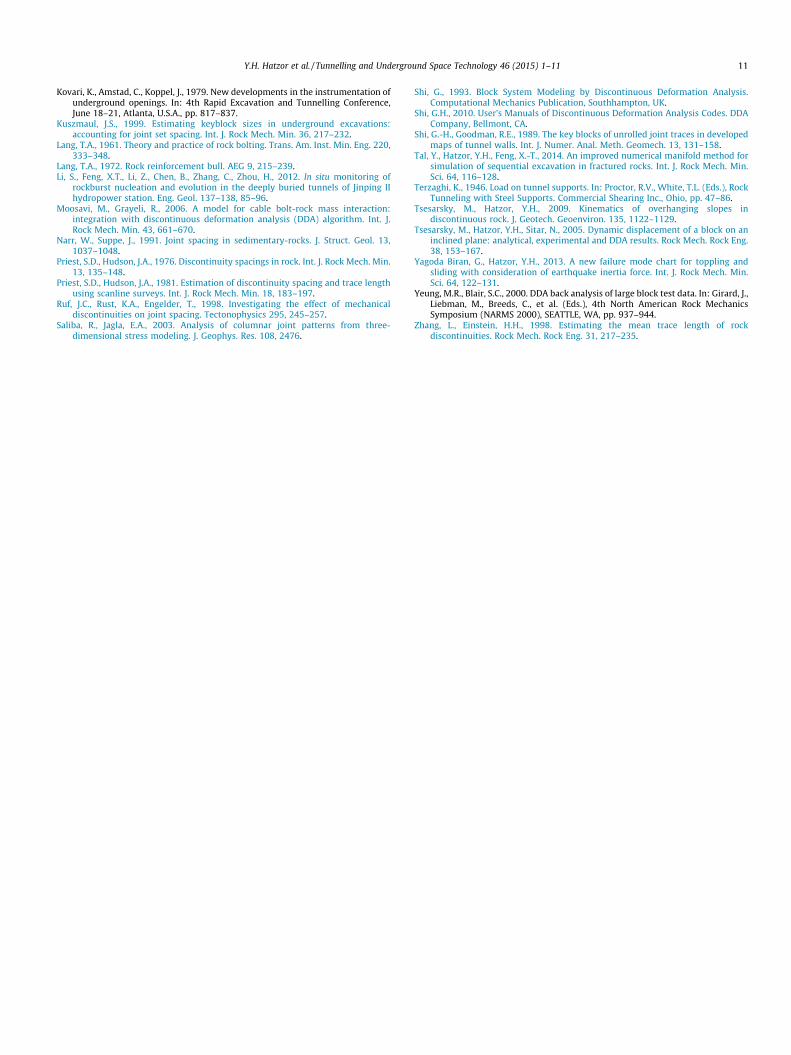
U9
U9_BBol�ng ac�on
Fig. 20. The horizontal displacement of the three measurement points in the leftwall with and without rock bolts as obtained with DDA.
10 Y.H. Hatzor et al. / Tunnelling and Underground Space Technology 46 (2015) 1–11
If however the modified approach which takes into consider-ation rock mass anisotropy is adopted, then the resulting recom-mended design bolt length for the roof is 15 m (Table 4). From apractical stand point however, due to the limited tunnel spaceunderground, a bolt length of 12 m would probably be sufficientto secure the stability of the roof judging from the displacementoutput. Indeed, in the sidewalls, where the required bolt lengthwith consideration of rock mass anisotropy is L = 5 m (see Table 4),the detected forward rotation of the blocks in the left sidewall isarrested with bolts length of 5 m only (see Fig. 20).
6. Summary and conclusions
We have shown in this paper that rock mass anisotropy encoun-tered when tunneling through columnar basalts, can affect rein-forcement design in several ways:
� Underground excavations in columnar basalts are expected toencounter an extremely densely jointed rock mass structure,comprised of a network of slender and prismatic keyblocks,due to the very small spacing of the columnar joints withrespect to the spacing of the breccia planes. This results in ahighly anisotropic rock mass structure the geometry of whichcontrols the deformation around the opening.� Since the breccia planes are typically gently dipping and the
columnar joints are typically oriented normal to the brecciaplanes, sliding and toppling failure modes may be expected inopposite sidewalls, meaning that excessive sidewall deforma-tion will be encountered during tunneling.� The loosening zone in the roof in such rock masses is expected
to be quite high, certainly more than half the excavation span aswould be expected by Terzaghi’s rock load classification forblocky rock masses. Such a high loosening zone would requireapplication of special provisions for reinforcement providingsufficiently long anchoring elements.� Because of the strong anisotropic structure of the rock mass, the
initial in situ stresses rotate once the excavation is formed tobecome aligned with the direction of the principal joint sets.� Consequently, the geometry of the loosening zone in the roof is
controlled by the orientation of the steeply inclined columnarjoints, strongly deviating from the symmetrical arching geome-try encountered when tunneling through isotropic, or throughhorizontally layered and vertically jointed, rock mass struc-tures. Instead and oblique loosening zone geometry is obtained,the inclination of which is controlled by the inclination of thecolumnar joints.
� Correct rock bolt dimensioning in such rock masses must con-sider the directionality of the rock mass structure. Specifically,the average keyblock width that is necessary for rock boltdimensioning using the popular set of empirical design criteriadeveloped by T.A. Lang cannot be assumed to be the same inboth sidewalls and roof in such rock masses.� Isotropic keyblock width assumption will necessarily lead to
un-conservative design, particularly with respect to therequired bolt length in the roof. We show here that a correctbolt length can be obtained with Lang’s criteria if the spacingbetween the breccia planes is assumed to represent the meankeyblock width in the roof and if the spacing between thecolumnar joints is assumed to represent the mean keyblockwidth in the sidewalls.
Acknowledgements
The authors gratefully acknowledge the financial support fromNational Basic Research Program of China (Grant No.2013CB036405) and National Natural Science Foundation of China(Grant Nos. 41372315 and 51379202). Y. Hatzor wishes to thankthe Chinese Academy of Sciences for a visiting professorship grantawarded to senior international scientists (No. 2011T2G29). Theauthors thank Dr. Long Jiang for the MPBX displacement monitor-ing, Dr. Gen-hua Shi for providing his latest version of DDA, and Mr.Yuval Tal for DDA code modifications. Dr. Raymond Sterling andthree anonymous reviewers are thanked for critically reading theoriginal version and for their useful comments that greatlyimproved the quality of this manuscript.
References
Bai, T., Gross, M.R., 1999. Theoretical analysis of cross-joint geometries and theirclassification. J. Geophys. Res.-Solid Earth 104, 1163–1177.
Bakun-Mazor, D., Hatzor, Y.H., Dershowitz, W.S., 2009. Modeling mechanicallayering effects on stability of underground openings in jointed sedimentaryrocks. Int. J. Rock Mech. Min. Sci. 46, 262–271.
Bao, H.R., Hatzor, Y.H., Huang, X., 2012. A new viscous boundary condition in thetwo-dimensional discontinuous deformation analysis method for wavepropagation problems. Rock Mech. Rock Eng. 45, 919–928.
Bao, H., Zhao, Z., Tian, Q., 2014. On the implementation of augmented lagrangianmethod in the tow-dimensional discontinuous deformation analysis. Int. J.Numer. Anal. Meth. Geomech. 38, 551–571.
Barton, N., 2002. Some new Q-value correlations to assist in site characterisationand tunnel design. Int. J. Rock Mech. Min. Sci. 39, 185–216.
Barton, N., Pandey, S.K., 2011. Numerical modelling of two stoping methods in twoIndian mines using degradation of c and mobilization of phi based on Q-parameters. Int. J. Rock Mech. Min. Sci. 48, 1095–1112.
Cundall, P.A., 1987. Distinct element models of rock and soil structure. In: Brown,E.T. (Ed.), Analytical and Computational Methods in Engineering RockMechanics. Allen & Unwin, London, pp. 129–163.
Diederichs, M.S., Kaiser, P.K., 1999. Tensile strength and abutment relaxation asfailure control mechanisms in underground excavations. Int. J. Rock Mech. Min.36, 69–96.
Doolin, D.M., Sitar, N., 2004. Time integration in discontinuous deformationanalysis. J. Eng. Mech. ASCE 130, 249–258.
Goehring, L., Stephen, W.M., 2008. Scaling of columnar joints in basalt. J. Geophys.Res. 113, 1–18.
Goodman, R.E., 1995. Block theory and its application. Geotechnique 45, 383–422.Goodman, R.E., Bray, J.W., 1976. Toppling of rock slopes, specialty conference on
rock engineering for foundations and slopes. American Society of CivilEngineering, Boulder, Colorado, pp. 201–234.
Hansmire, W.H., 1978. Suggested methods for monitoring rock movements usingborehole extensometers. Int. J. Rock Mech. Min. Sci. 15, 305–317.
Hatzor, Y.H., Wainshtein, I., Mazor, D.B., 2010. Stability of shallow karstic caverns inblocky rock masses. Int. J. Rock Mech. Min. 47, 1289–1303.
Hetényi, G., Taisne, B., Garel, F., Médard, É., Bosshard, S., Mattsson, H.B., 2012. Scalesof columnar jointing in igneous rocks: field measurements and controllingfactors. Bull. Volcanol. 74, 457–482.
Hudson, J.A., Priest, S.D., 1979. Discontinuities and rock mass geometry. Int. J. RockMech. Min. 16, 339–362.
Jiang, Q., Feng, X.T., Hatzor, Y.H., Hao, X.J., Li, S.J., 2014. Mechanical anisotropy ofcolumnar jointed basalts: an example from the Baihetan hydropower station,China. Eng. Geol. 175, 35–45.
Y.H. Hatzor et al. / Tunnelling and Underground Space Technology 46 (2015) 1–11 11
Kovari, K., Amstad, C., Koppel, J., 1979. New developments in the instrumentation ofunderground openings. In: 4th Rapid Excavation and Tunnelling Conference,June 18–21, Atlanta, U.S.A., pp. 817–837.
Kuszmaul, J.S., 1999. Estimating keyblock sizes in underground excavations:accounting for joint set spacing. Int. J. Rock Mech. Min. 36, 217–232.
Lang, T.A., 1961. Theory and practice of rock bolting. Trans. Am. Inst. Min. Eng. 220,333–348.
Lang, T.A., 1972. Rock reinforcement bull. AEG 9, 215–239.Li, S., Feng, X.T., Li, Z., Chen, B., Zhang, C., Zhou, H., 2012. In situ monitoring of
rockburst nucleation and evolution in the deeply buried tunnels of Jinping IIhydropower station. Eng. Geol. 137–138, 85–96.
Moosavi, M., Grayeli, R., 2006. A model for cable bolt-rock mass interaction:integration with discontinuous deformation analysis (DDA) algorithm. Int. J.Rock Mech. Min. 43, 661–670.
Narr, W., Suppe, J., 1991. Joint spacing in sedimentary-rocks. J. Struct. Geol. 13,1037–1048.
Priest, S.D., Hudson, J.A., 1976. Discontinuity spacings in rock. Int. J. Rock Mech. Min.13, 135–148.
Priest, S.D., Hudson, J.A., 1981. Estimation of discontinuity spacing and trace lengthusing scanline surveys. Int. J. Rock Mech. Min. 18, 183–197.
Ruf, J.C., Rust, K.A., Engelder, T., 1998. Investigating the effect of mechanicaldiscontinuities on joint spacing. Tectonophysics 295, 245–257.
Saliba, R., Jagla, E.A., 2003. Analysis of columnar joint patterns from three-dimensional stress modeling. J. Geophys. Res. 108, 2476.
Shi, G., 1993. Block System Modeling by Discontinuous Deformation Analysis.Computational Mechanics Publication, Southhampton, UK.
Shi, G.H., 2010. User’s Manuals of Discontinuous Deformation Analysis Codes. DDACompany, Bellmont, CA.
Shi, G.-H., Goodman, R.E., 1989. The key blocks of unrolled joint traces in developedmaps of tunnel walls. Int. J. Numer. Anal. Meth. Geomech. 13, 131–158.
Tal, Y., Hatzor, Y.H., Feng, X.-T., 2014. An improved numerical manifold method forsimulation of sequential excavation in fractured rocks. Int. J. Rock Mech. Min.Sci. 64, 116–128.
Terzaghi, K., 1946. Load on tunnel supports. In: Proctor, R.V., White, T.L. (Eds.), RockTunneling with Steel Supports. Commercial Shearing Inc., Ohio, pp. 47–86.
Tsesarsky, M., Hatzor, Y.H., 2009. Kinematics of overhanging slopes indiscontinuous rock. J. Geotech. Geoenviron. 135, 1122–1129.
Tsesarsky, M., Hatzor, Y.H., Sitar, N., 2005. Dynamic displacement of a block on aninclined plane: analytical, experimental and DDA results. Rock Mech. Rock Eng.38, 153–167.
Yagoda Biran, G., Hatzor, Y.H., 2013. A new failure mode chart for toppling andsliding with consideration of earthquake inertia force. Int. J. Rock Mech. Min.Sci. 64, 122–131.
Yeung, M.R., Blair, S.C., 2000. DDA back analysis of large block test data. In: Girard, J.,Liebman, M., Breeds, C., et al. (Eds.), 4th North American Rock MechanicsSymposium (NARMS 2000), SEATTLE, WA, pp. 937–944.
Zhang, L., Einstein, H.H., 1998. Estimating the mean trace length of rockdiscontinuities. Rock Mech. Rock Eng. 31, 217–235.