Embed Size (px)
Citation preview
2015-16 School Accountability Report Card for Turtle Rock Elementary School Page 1 of 12
Turtle Rock Elementary School
School Accountability Report Card
Reported Using Data from the 2015-16 School Year
Published During 2016-17
By February 1 of each year, every school in California is required by state law to publish a School Accountability Report Card (SARC). The SARC contains information about the condition and performance of each California public school. Under the Local Control Funding Formula (LCFF) all local educational agencies (LEAs) are required to prepare a Local Control and Accountability Plan (LCAP), which describes how they intend to meet annual school-specific goals for all pupils, with specific activities to address state and local priorities. Additionally, data reported in an LCAP is to be consistent with data reported in the SARC. • For more information about SARC requirements, see the California Department of Education (CDE) SARC Web page at
http://www.cde.ca.gov/ta/ac/sa/. • For more information about the LCFF or LCAP, see the CDE LCFF Web page at http://www.cde.ca.gov/fg/aa/lc/. • For additional information about the school, parents/guardians and community members should contact the school principal or
the district office. DataQuest DataQuest is an online data tool located on the CDE DataQuest Web page at http://dq.cde.ca.gov/dataquest/ that contains additional information about this school and comparisons of the school to the district and the county. Specifically, DataQuest is a dynamic system that provides reports for accountability (e.g., test data, enrollment, high school graduates, dropouts, course enrollments, staffing, and data regarding English learners). Internet Access Internet access is available at public libraries and other locations that are publicly accessible (e.g., the California State Library). Access to the Internet at libraries and public locations is generally provided on a first-come, first-served basis. Other use restrictions may include the hours of operation, the length of time that a workstation may be used (depending on availability), the types of software programs available on a workstation, and the ability to print documents.
About This School Contact Information (School Year 2016-17)
School Contact Information
School Name------- Turtle Rock Elementary School
Street------- 5151 Amalfi Drive
City, State, Zip------- Irvine, CA 92603
Phone Number------- (949) 936-6250
Principal------- Karen Catabijan
E-mail Address------- [email protected]
Web Site------- http://www.iusd.org/tr/
CDS Code 30-73650-6068647
2015-16 School Accountability Report Card for Turtle Rock Elementary School Page 2 of 12
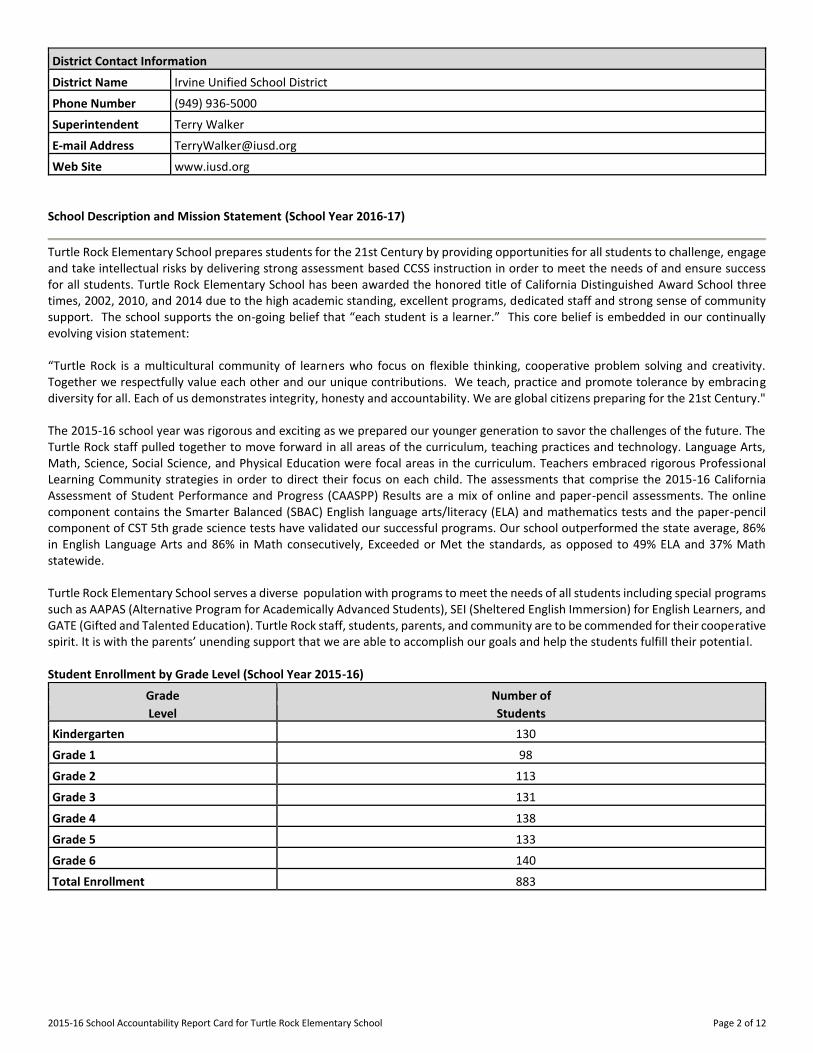
District Contact Information
District Name------- Irvine Unified School District
Phone Number------- (949) 936-5000
Superintendent-------
Terry Walker
E-mail Address------- [email protected]
Web Site------- www.iusd.org
School Description and Mission Statement (School Year 2016-17)
Turtle Rock Elementary School prepares students for the 21st Century by providing opportunities for all students to challenge, engage and take intellectual risks by delivering strong assessment based CCSS instruction in order to meet the needs of and ensure success for all students. Turtle Rock Elementary School has been awarded the honored title of California Distinguished Award School three times, 2002, 2010, and 2014 due to the high academic standing, excellent programs, dedicated staff and strong sense of community support. The school supports the on-going belief that “each student is a learner.” This core belief is embedded in our continually evolving vision statement: “Turtle Rock is a multicultural community of learners who focus on flexible thinking, cooperative problem solving and creativity. Together we respectfully value each other and our unique contributions. We teach, practice and promote tolerance by embracing diversity for all. Each of us demonstrates integrity, honesty and accountability. We are global citizens preparing for the 21st Century." The 2015-16 school year was rigorous and exciting as we prepared our younger generation to savor the challenges of the future. The Turtle Rock staff pulled together to move forward in all areas of the curriculum, teaching practices and technology. Language Arts, Math, Science, Social Science, and Physical Education were focal areas in the curriculum. Teachers embraced rigorous Professional Learning Community strategies in order to direct their focus on each child. The assessments that comprise the 2015-16 California Assessment of Student Performance and Progress (CAASPP) Results are a mix of online and paper-pencil assessments. The online component contains the Smarter Balanced (SBAC) English language arts/literacy (ELA) and mathematics tests and the paper-pencil component of CST 5th grade science tests have validated our successful programs. Our school outperformed the state average, 86% in English Language Arts and 86% in Math consecutively, Exceeded or Met the standards, as opposed to 49% ELA and 37% Math statewide. Turtle Rock Elementary School serves a diverse population with programs to meet the needs of all students including special programs such as AAPAS (Alternative Program for Academically Advanced Students), SEI (Sheltered English Immersion) for English Learners, and GATE (Gifted and Talented Education). Turtle Rock staff, students, parents, and community are to be commended for their cooperative spirit. It is with the parents’ unending support that we are able to accomplish our goals and help the students fulfill their potential. Student Enrollment by Grade Level (School Year 2015-16)
Grade Number of
Level Students
Kindergarten 130
Grade 1 98
Grade 2 113
Grade 3 131
Grade 4 138
Grade 5 133
Grade 6 140
Total Enrollment 883
2015-16 School Accountability Report Card for Turtle Rock Elementary School Page 3 of 12
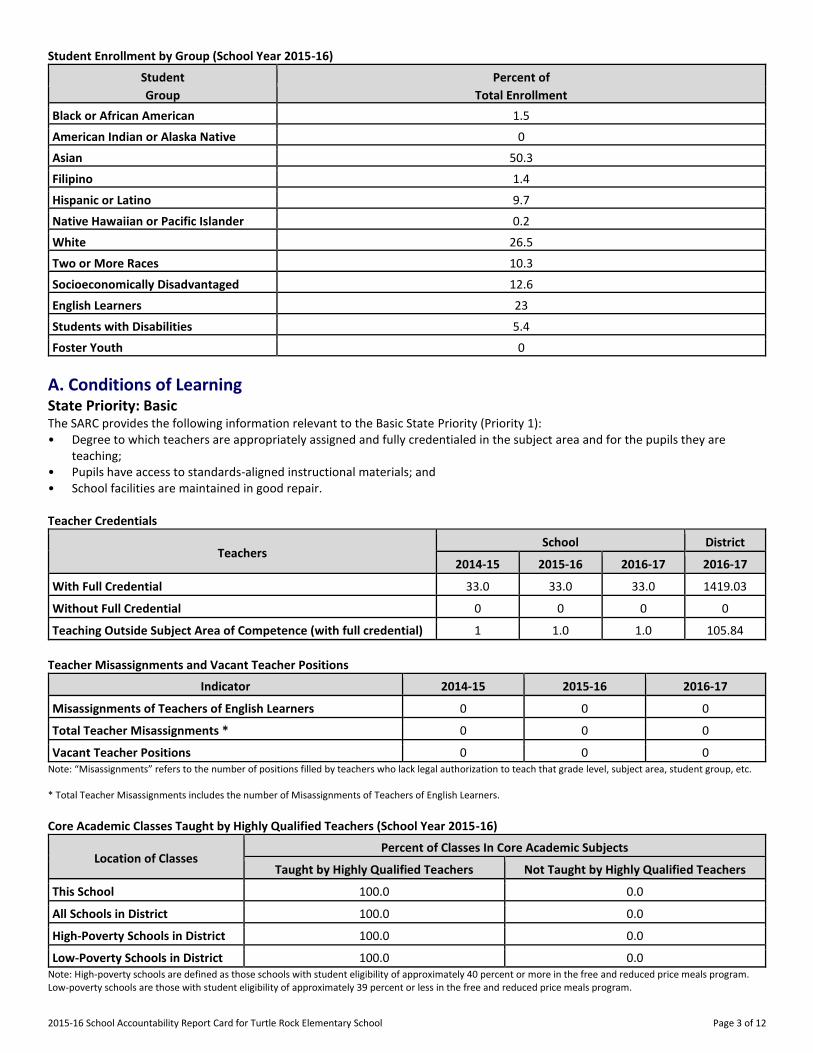
Student Enrollment by Group (School Year 2015-16)
Student Percent of
Group Total Enrollment
Black or African American 1.5
American Indian or Alaska Native 0
Asian 50.3
Filipino 1.4
Hispanic or Latino 9.7
Native Hawaiian or Pacific Islander 0.2
White 26.5
Two or More Races 10.3
Socioeconomically Disadvantaged 12.6
English Learners 23
Students with Disabilities 5.4
Foster Youth 0
A. Conditions of Learning State Priority: Basic The SARC provides the following information relevant to the Basic State Priority (Priority 1): • Degree to which teachers are appropriately assigned and fully credentialed in the subject area and for the pupils they are
teaching; • Pupils have access to standards-aligned instructional materials; and • School facilities are maintained in good repair. Teacher Credentials
Teachers School District
2014-15 2015-16 2016-17 2016-17
With Full Credential 33.0 33.0 33.0 1419.03
Without Full Credential 0 0 0 0
Teaching Outside Subject Area of Competence (with full credential) 1 1.0 1.0 105.84
Teacher Misassignments and Vacant Teacher Positions
Indicator 2014-15 2015-16 2016-17
Misassignments of Teachers of English Learners 0 0 0
Total Teacher Misassignments * 0 0 0
Vacant Teacher Positions 0 0 0 Note: “Misassignments” refers to the number of positions filled by teachers who lack legal authorization to teach that grade level, subject area, student group, etc. * Total Teacher Misassignments includes the number of Misassignments of Teachers of English Learners. Core Academic Classes Taught by Highly Qualified Teachers (School Year 2015-16)
Location of Classes Percent of Classes In Core Academic Subjects
Taught by Highly Qualified Teachers Not Taught by Highly Qualified Teachers
This School 100.0 0.0
All Schools in District 100.0 0.0
High-Poverty Schools in District 100.0 0.0
Low-Poverty Schools in District 100.0 0.0 Note: High-poverty schools are defined as those schools with student eligibility of approximately 40 percent or more in the free and reduced price meals program. Low-poverty schools are those with student eligibility of approximately 39 percent or less in the free and reduced price meals program.
2015-16 School Accountability Report Card for Turtle Rock Elementary School Page 4 of 12
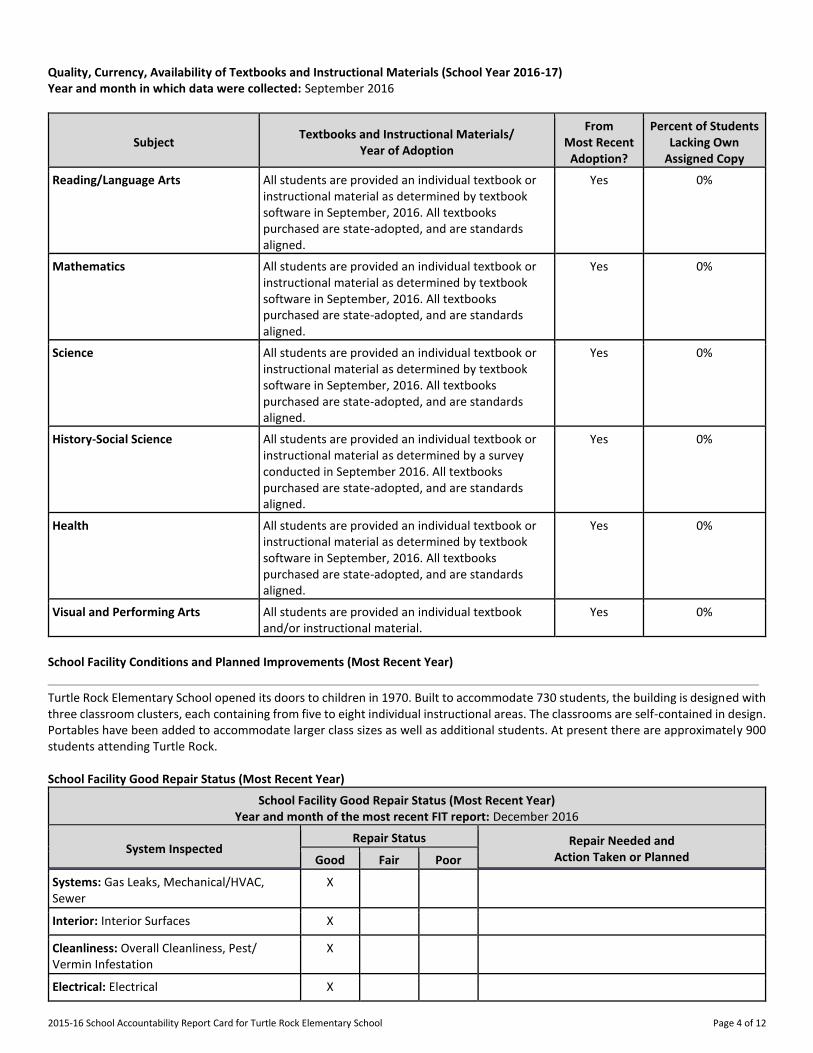
Quality, Currency, Availability of Textbooks and Instructional Materials (School Year 2016-17) Year and month in which data were collected: September 2016
Subject Textbooks and Instructional Materials/
Year of Adoption
From Most Recent
Adoption?
Percent of Students Lacking Own
Assigned Copy
Reading/Language Arts All students are provided an individual textbook or instructional material as determined by textbook software in September, 2016. All textbooks purchased are state-adopted, and are standards aligned.
Yes 0%
Mathematics All students are provided an individual textbook or instructional material as determined by textbook software in September, 2016. All textbooks purchased are state-adopted, and are standards aligned.
Yes 0%
Science All students are provided an individual textbook or instructional material as determined by textbook software in September, 2016. All textbooks purchased are state-adopted, and are standards aligned.
Yes 0%
History-Social Science All students are provided an individual textbook or instructional material as determined by a survey conducted in September 2016. All textbooks purchased are state-adopted, and are standards aligned.
Yes 0%
Health All students are provided an individual textbook or instructional material as determined by textbook software in September, 2016. All textbooks purchased are state-adopted, and are standards aligned.
Yes 0%
Visual and Performing Arts All students are provided an individual textbook and/or instructional material.
Yes 0%
School Facility Conditions and Planned Improvements (Most Recent Year)
Turtle Rock Elementary School opened its doors to children in 1970. Built to accommodate 730 students, the building is designed with three classroom clusters, each containing from five to eight individual instructional areas. The classrooms are self-contained in design. Portables have been added to accommodate larger class sizes as well as additional students. At present there are approximately 900 students attending Turtle Rock. School Facility Good Repair Status (Most Recent Year)
School Facility Good Repair Status (Most Recent Year) Year and month of the most recent FIT report: December 2016
System Inspected Repair Status Repair Needed and
Action Taken or Planned Good Fair Poor
Systems: Gas Leaks, Mechanical/HVAC, Sewer
X
Interior: Interior Surfaces X
Cleanliness: Overall Cleanliness, Pest/ Vermin Infestation
X
Electrical: Electrical X
2015-16 School Accountability Report Card for Turtle Rock Elementary School Page 5 of 12
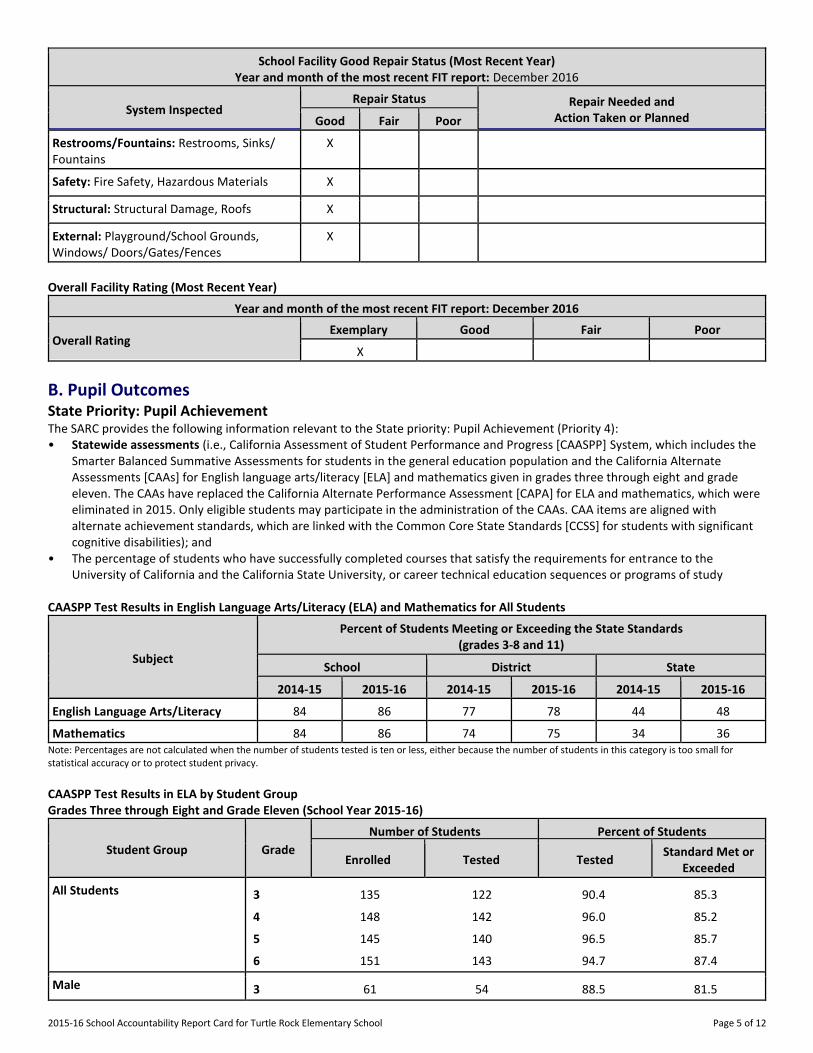
School Facility Good Repair Status (Most Recent Year) Year and month of the most recent FIT report: December 2016
System Inspected Repair Status Repair Needed and
Action Taken or Planned Good Fair Poor
Restrooms/Fountains: Restrooms, Sinks/ Fountains
X
Safety: Fire Safety, Hazardous Materials X
Structural: Structural Damage, Roofs X
External: Playground/School Grounds, Windows/ Doors/Gates/Fences
X
Overall Facility Rating (Most Recent Year)
Year and month of the most recent FIT report: December 2016
Overall Rating Exemplary Good Fair Poor
X
B. Pupil Outcomes State Priority: Pupil Achievement The SARC provides the following information relevant to the State priority: Pupil Achievement (Priority 4): • Statewide assessments (i.e., California Assessment of Student Performance and Progress [CAASPP] System, which includes the
Smarter Balanced Summative Assessments for students in the general education population and the California Alternate Assessments [CAAs] for English language arts/literacy [ELA] and mathematics given in grades three through eight and grade eleven. The CAAs have replaced the California Alternate Performance Assessment [CAPA] for ELA and mathematics, which were eliminated in 2015. Only eligible students may participate in the administration of the CAAs. CAA items are aligned with alternate achievement standards, which are linked with the Common Core State Standards [CCSS] for students with significant cognitive disabilities); and
• The percentage of students who have successfully completed courses that satisfy the requirements for entrance to the University of California and the California State University, or career technical education sequences or programs of study
CAASPP Test Results in English Language Arts/Literacy (ELA) and Mathematics for All Students
Subject
Percent of Students Meeting or Exceeding the State Standards (grades 3-8 and 11)
School District State
2014-15 2015-16 2014-15 2015-16 2014-15 2015-16
English Language Arts/Literacy 84 86 77 78 44 48
Mathematics 84 86 74 75 34 36 Note: Percentages are not calculated when the number of students tested is ten or less, either because the number of students in this category is too small for statistical accuracy or to protect student privacy.
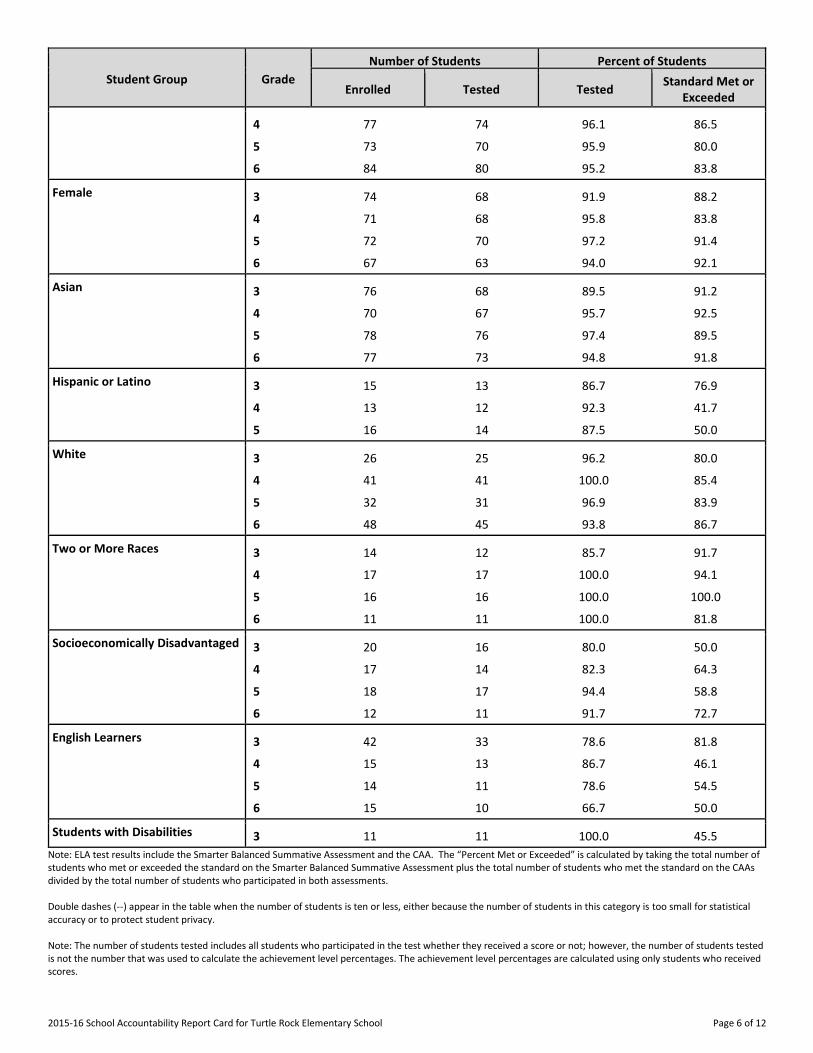
CAASPP Test Results in ELA by Student Group Grades Three through Eight and Grade Eleven (School Year 2015-16)
Student Group Grade
Number of Students Percent of Students
Enrolled Tested Tested Standard Met or
Exceeded
All Students 3 135 122 90.4 85.3
4 148 142 96.0 85.2
5 145 140 96.5 85.7
6 151 143 94.7 87.4
Male 3 61 54 88.5 81.5
2015-16 School Accountability Report Card for Turtle Rock Elementary School Page 6 of 12
Student Group Grade
Number of Students Percent of Students
Enrolled Tested Tested Standard Met or
Exceeded
4 77 74 96.1 86.5
5 73 70 95.9 80.0
6 84 80 95.2 83.8
Female 3 74 68 91.9 88.2
4 71 68 95.8 83.8
5 72 70 97.2 91.4
6 67 63 94.0 92.1
Asian 3 76 68 89.5 91.2
4 70 67 95.7 92.5
5 78 76 97.4 89.5
6 77 73 94.8 91.8
Hispanic or Latino 3 15 13 86.7 76.9
4 13 12 92.3 41.7
5 16 14 87.5 50.0
White 3 26 25 96.2 80.0
4 41 41 100.0 85.4
5 32 31 96.9 83.9
6 48 45 93.8 86.7
Two or More Races 3 14 12 85.7 91.7
4 17 17 100.0 94.1
5 16 16 100.0 100.0
6 11 11 100.0 81.8
Socioeconomically Disadvantaged 3 20 16 80.0 50.0
4 17 14 82.3 64.3
5 18 17 94.4 58.8
6 12 11 91.7 72.7
English Learners 3 42 33 78.6 81.8
4 15 13 86.7 46.1
5 14 11 78.6 54.5
6 15 10 66.7 50.0
Students with Disabilities 3 11 11 100.0 45.5
Note: ELA test results include the Smarter Balanced Summative Assessment and the CAA. The “Percent Met or Exceeded” is calculated by taking the total number of students who met or exceeded the standard on the Smarter Balanced Summative Assessment plus the total number of students who met the standard on the CAAs divided by the total number of students who participated in both assessments. Double dashes (--) appear in the table when the number of students is ten or less, either because the number of students in this category is too small for statistical accuracy or to protect student privacy. Note: The number of students tested includes all students who participated in the test whether they received a score or not; however, the number of students tested is not the number that was used to calculate the achievement level percentages. The achievement level percentages are calculated using only students who received scores.
2015-16 School Accountability Report Card for Turtle Rock Elementary School Page 7 of 12
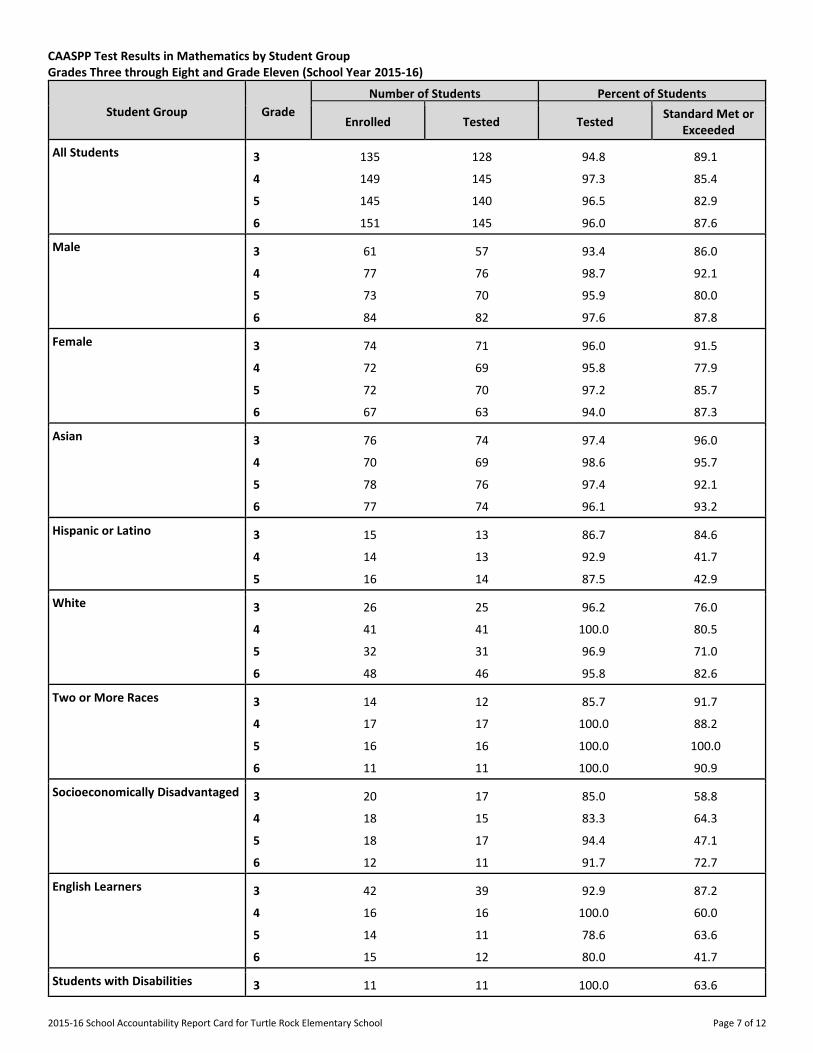
CAASPP Test Results in Mathematics by Student Group Grades Three through Eight and Grade Eleven (School Year 2015-16)
Student Group Grade
Number of Students Percent of Students
Enrolled Tested Tested Standard Met or
Exceeded
All Students 3 135 128 94.8 89.1
4 149 145 97.3 85.4
5 145 140 96.5 82.9
6 151 145 96.0 87.6
Male 3 61 57 93.4 86.0
4 77 76 98.7 92.1
5 73 70 95.9 80.0
6 84 82 97.6 87.8
Female 3 74 71 96.0 91.5
4 72 69 95.8 77.9
5 72 70 97.2 85.7
6 67 63 94.0 87.3
Asian 3 76 74 97.4 96.0
4 70 69 98.6 95.7
5 78 76 97.4 92.1
6 77 74 96.1 93.2
Hispanic or Latino 3 15 13 86.7 84.6
4 14 13 92.9 41.7
5 16 14 87.5 42.9
White 3 26 25 96.2 76.0
4 41 41 100.0 80.5
5 32 31 96.9 71.0
6 48 46 95.8 82.6
Two or More Races 3 14 12 85.7 91.7
4 17 17 100.0 88.2
5 16 16 100.0 100.0
6 11 11 100.0 90.9
Socioeconomically Disadvantaged 3 20 17 85.0 58.8
4 18 15 83.3 64.3
5 18 17 94.4 47.1
6 12 11 91.7 72.7
English Learners 3 42 39 92.9 87.2
4 16 16 100.0 60.0
5 14 11 78.6 63.6
6 15 12 80.0 41.7
Students with Disabilities 3 11 11 100.0 63.6
2015-16 School Accountability Report Card for Turtle Rock Elementary School Page 8 of 12
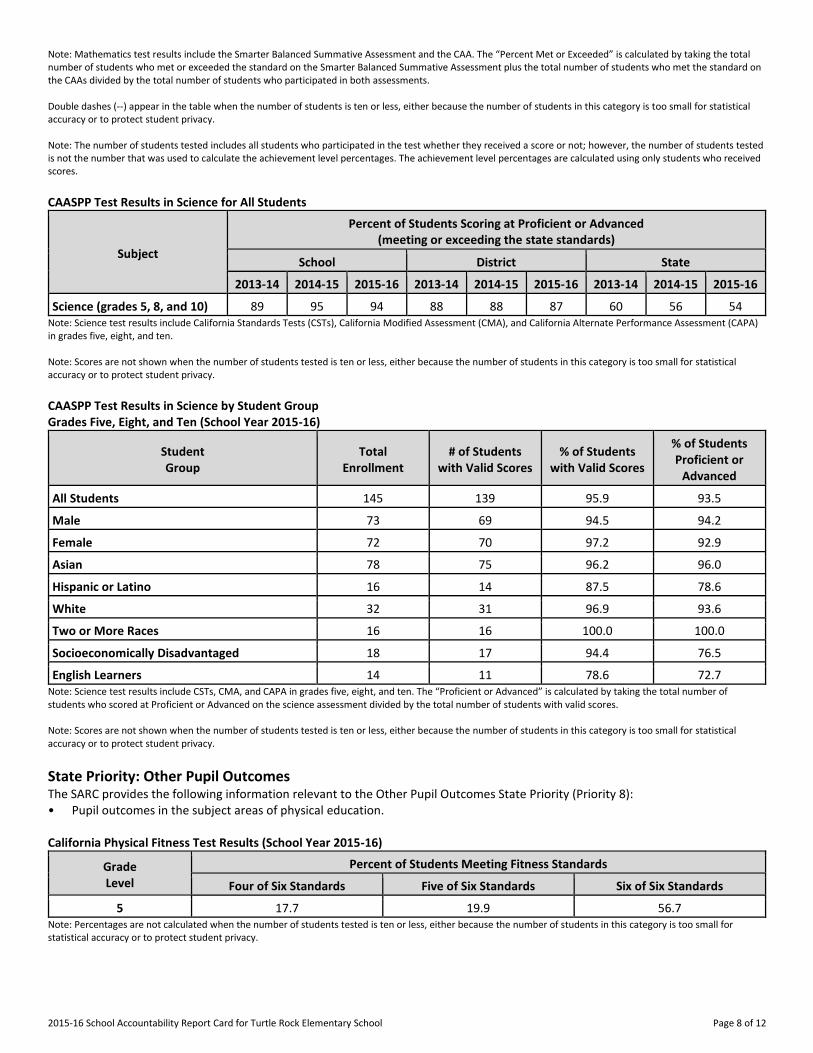
Note: Mathematics test results include the Smarter Balanced Summative Assessment and the CAA. The “Percent Met or Exceeded” is calculated by taking the total number of students who met or exceeded the standard on the Smarter Balanced Summative Assessment plus the total number of students who met the standard on the CAAs divided by the total number of students who participated in both assessments. Double dashes (--) appear in the table when the number of students is ten or less, either because the number of students in this category is too small for statistical accuracy or to protect student privacy. Note: The number of students tested includes all students who participated in the test whether they received a score or not; however, the number of students tested is not the number that was used to calculate the achievement level percentages. The achievement level percentages are calculated using only students who received scores.
CAASPP Test Results in Science for All Students
Subject
Percent of Students Scoring at Proficient or Advanced (meeting or exceeding the state standards)
School District State
2013-14 2014-15 2015-16 2013-14 2014-15 2015-16 2013-14 2014-15 2015-16
Science (grades 5, 8, and 10) 89 95 94 88 88 87 60 56 54 Note: Science test results include California Standards Tests (CSTs), California Modified Assessment (CMA), and California Alternate Performance Assessment (CAPA) in grades five, eight, and ten. Note: Scores are not shown when the number of students tested is ten or less, either because the number of students in this category is too small for statistical accuracy or to protect student privacy.
CAASPP Test Results in Science by Student Group Grades Five, Eight, and Ten (School Year 2015-16)
Student Group
Total Enrollment
# of Students with Valid Scores
% of Students with Valid Scores
% of Students Proficient or
Advanced
All Students 145 139 95.9 93.5
Male 73 69 94.5 94.2
Female 72 70 97.2 92.9
Asian 78 75 96.2 96.0
Hispanic or Latino 16 14 87.5 78.6
White 32 31 96.9 93.6
Two or More Races 16 16 100.0 100.0
Socioeconomically Disadvantaged 18 17 94.4 76.5
English Learners 14 11 78.6 72.7 Note: Science test results include CSTs, CMA, and CAPA in grades five, eight, and ten. The “Proficient or Advanced” is calculated by taking the total number of students who scored at Proficient or Advanced on the science assessment divided by the total number of students with valid scores. Note: Scores are not shown when the number of students tested is ten or less, either because the number of students in this category is too small for statistical accuracy or to protect student privacy.
State Priority: Other Pupil Outcomes The SARC provides the following information relevant to the Other Pupil Outcomes State Priority (Priority 8): • Pupil outcomes in the subject areas of physical education. California Physical Fitness Test Results (School Year 2015-16)
Grade Level
Percent of Students Meeting Fitness Standards
Four of Six Standards Five of Six Standards Six of Six Standards
---5--- 17.7 19.9 56.7 Note: Percentages are not calculated when the number of students tested is ten or less, either because the number of students in this category is too small for statistical accuracy or to protect student privacy.
2015-16 School Accountability Report Card for Turtle Rock Elementary School Page 9 of 12
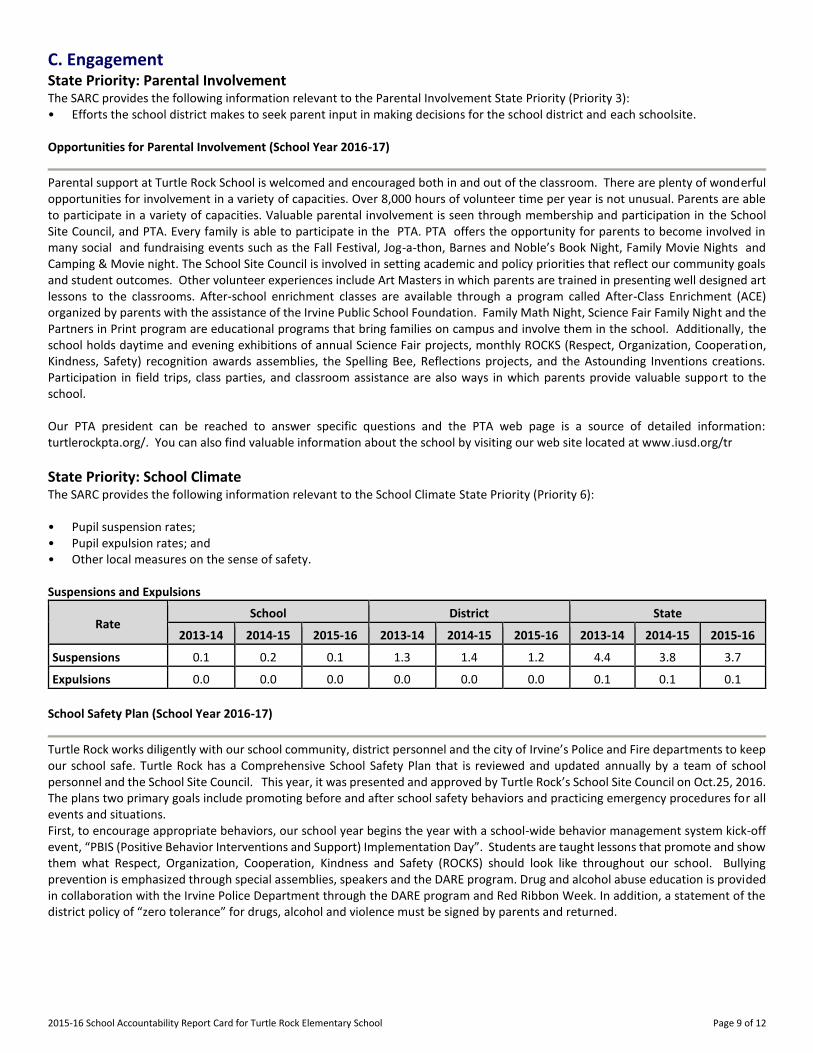
C. Engagement State Priority: Parental Involvement The SARC provides the following information relevant to the Parental Involvement State Priority (Priority 3): • Efforts the school district makes to seek parent input in making decisions for the school district and each schoolsite. Opportunities for Parental Involvement (School Year 2016-17)
Parental support at Turtle Rock School is welcomed and encouraged both in and out of the classroom. There are plenty of wonderful opportunities for involvement in a variety of capacities. Over 8,000 hours of volunteer time per year is not unusual. Parents are able to participate in a variety of capacities. Valuable parental involvement is seen through membership and participation in the School Site Council, and PTA. Every family is able to participate in the PTA. PTA offers the opportunity for parents to become involved in many social and fundraising events such as the Fall Festival, Jog-a-thon, Barnes and Noble’s Book Night, Family Movie Nights and Camping & Movie night. The School Site Council is involved in setting academic and policy priorities that reflect our community goals and student outcomes. Other volunteer experiences include Art Masters in which parents are trained in presenting well designed art lessons to the classrooms. After-school enrichment classes are available through a program called After-Class Enrichment (ACE) organized by parents with the assistance of the Irvine Public School Foundation. Family Math Night, Science Fair Family Night and the Partners in Print program are educational programs that bring families on campus and involve them in the school. Additionally, the school holds daytime and evening exhibitions of annual Science Fair projects, monthly ROCKS (Respect, Organization, Cooperation, Kindness, Safety) recognition awards assemblies, the Spelling Bee, Reflections projects, and the Astounding Inventions creations. Participation in field trips, class parties, and classroom assistance are also ways in which parents provide valuable support to the school. Our PTA president can be reached to answer specific questions and the PTA web page is a source of detailed information: turtlerockpta.org/. You can also find valuable information about the school by visiting our web site located at www.iusd.org/tr
State Priority: School Climate The SARC provides the following information relevant to the School Climate State Priority (Priority 6): • Pupil suspension rates; • Pupil expulsion rates; and • Other local measures on the sense of safety. Suspensions and Expulsions
Rate School District State
2013-14 2014-15 2015-16 2013-14 2014-15 2015-16 2013-14 2014-15 2015-16
Suspensions------- 0.1 0.2 0.1 1.3 1.4 1.2 4.4 3.8 3.7
Expulsions------- 0.0 0.0 0.0 0.0 0.0 0.0 0.1 0.1 0.1
School Safety Plan (School Year 2016-17)
Turtle Rock works diligently with our school community, district personnel and the city of Irvine’s Police and Fire departments to keep our school safe. Turtle Rock has a Comprehensive School Safety Plan that is reviewed and updated annually by a team of school personnel and the School Site Council. This year, it was presented and approved by Turtle Rock’s School Site Council on Oct.25, 2016. The plans two primary goals include promoting before and after school safety behaviors and practicing emergency procedures for all events and situations. First, to encourage appropriate behaviors, our school year begins the year with a school-wide behavior management system kick-off event, “PBIS (Positive Behavior Interventions and Support) Implementation Day”. Students are taught lessons that promote and show them what Respect, Organization, Cooperation, Kindness and Safety (ROCKS) should look like throughout our school. Bullying prevention is emphasized through special assemblies, speakers and the DARE program. Drug and alcohol abuse education is provided in collaboration with the Irvine Police Department through the DARE program and Red Ribbon Week. In addition, a statement of the district policy of “zero tolerance” for drugs, alcohol and violence must be signed by parents and returned.
2015-16 School Accountability Report Card for Turtle Rock Elementary School Page 10 of 12
Secondly, in order to continue promoting school-wide emergency awareness students and staff participate in either fire, earthquake or intruder drills monthly. Staff participates in updating the Comprehensive School Safety Plan. Most teachers are certified in First Aid and CPR. All staff members attend training on emergency procedures. For emergency purposes there is a school site communication system, stored water, emergency equipment, and medical supplies. In addition, the PTA has supported the site disaster team by providing funds to update our disaster preparedness supplies. Efforts to assure safety on-site include phones in each classroom, two-way radios, enclosing the rear part of the school during the instructional day, re-organizing and re-striping the parking lot, and obtaining ongoing oversight by the Irvine Police Department of traffic in and around the school during the hours when students are entering or leaving school. All visitors register using the new Raptor Visitor/Volunteer Management System. This system builds on the district’s program of campus safety for all students and faculty.
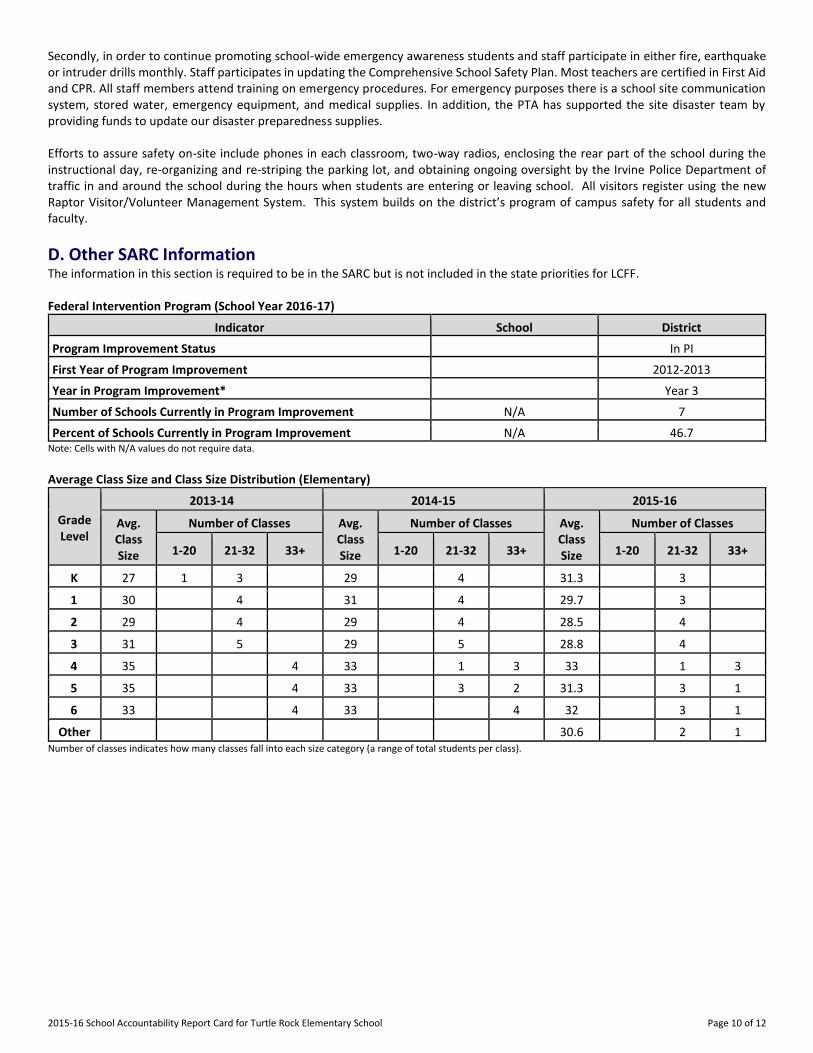
D. Other SARC Information The information in this section is required to be in the SARC but is not included in the state priorities for LCFF. Federal Intervention Program (School Year 2016-17)
Indicator School District
Program Improvement Status In PI
First Year of Program Improvement 2012-2013
Year in Program Improvement* Year 3
Number of Schools Currently in Program Improvement N/A 7
Percent of Schools Currently in Program Improvement N/A 46.7 Note: Cells with N/A values do not require data.
Average Class Size and Class Size Distribution (Elementary)
Grade Level
2013-14 2014-15 2015-16
Avg. Class Size
Number of Classes Avg. Class Size
Number of Classes Avg. Class Size
Number of Classes
1-20 21-32 33+ 1-20 21-32 33+ 1-20 21-32 33+
K
27 1 3 29 4 31.3 3
1
30 4 31 4 29.7 3
2
29 4 29 4 28.5 4
3
31 5 29 5 28.8 4
4
35 4 33 1 3 33 1 3
5
35 4 33 3 2 31.3 3 1
6
33 4 33 4 32 3 1
Other
30.6 2 1 Number of classes indicates how many classes fall into each size category (a range of total students per class).
2015-16 School Accountability Report Card for Turtle Rock Elementary School Page 11 of 12
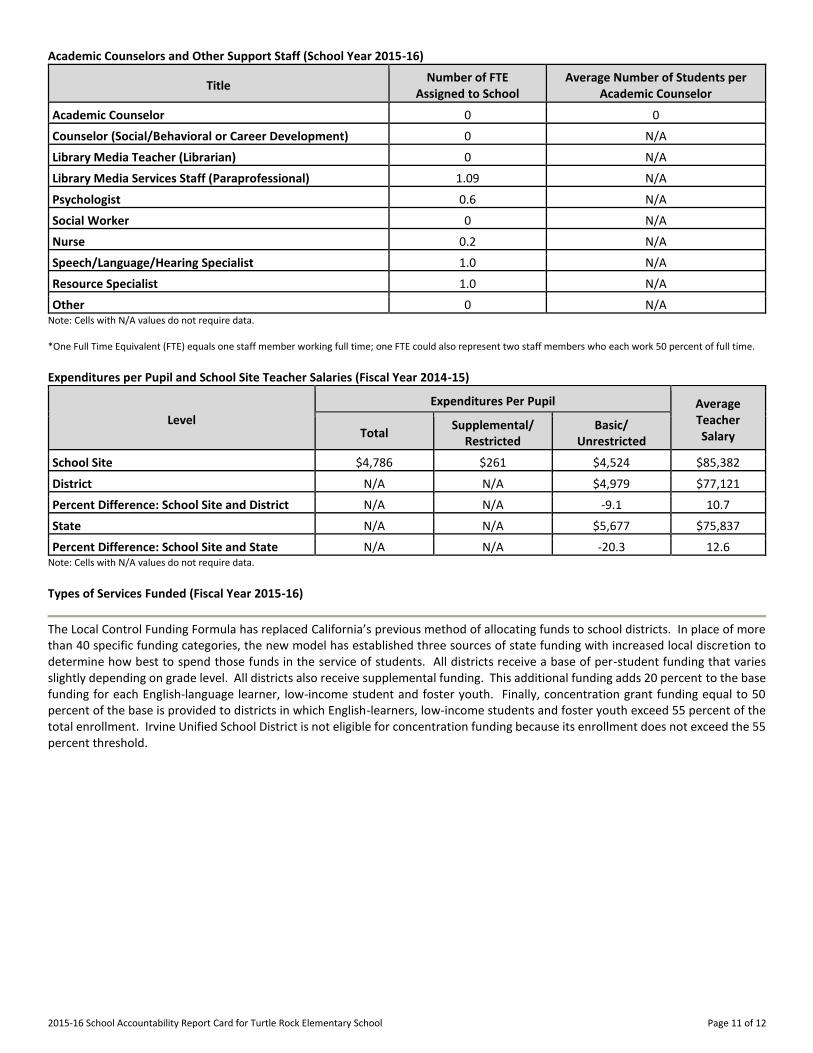
Academic Counselors and Other Support Staff (School Year 2015-16)
Title Number of FTE
Assigned to School Average Number of Students per
Academic Counselor
Academic Counselor------- 0 0
Counselor (Social/Behavioral or Career Development) 0 N/A
Library Media Teacher (Librarian) 0 N/A
Library Media Services Staff (Paraprofessional) 1.09 N/A
Psychologist------- 0.6 N/A
Social Worker------- 0 N/A
Nurse------- 0.2 N/A
Speech/Language/Hearing Specialist 1.0 N/A
Resource Specialist------- 1.0 N/A
Other------- 0 N/A Note: Cells with N/A values do not require data. *One Full Time Equivalent (FTE) equals one staff member working full time; one FTE could also represent two staff members who each work 50 percent of full time.
Expenditures per Pupil and School Site Teacher Salaries (Fiscal Year 2014-15)
Level
Expenditures Per Pupil Average Teacher Salary Total
Supplemental/ Restricted
Basic/ Unrestricted
School Site------- $4,786 $261 $4,524 $85,382
District------- N/A N/A $4,979 $77,121
Percent Difference: School Site and District N/A N/A -9.1 10.7
State------- N/A N/A $5,677 $75,837
Percent Difference: School Site and State N/A N/A -20.3 12.6 Note: Cells with N/A values do not require data.
Types of Services Funded (Fiscal Year 2015-16)
The Local Control Funding Formula has replaced California’s previous method of allocating funds to school districts. In place of more than 40 specific funding categories, the new model has established three sources of state funding with increased local discretion to determine how best to spend those funds in the service of students. All districts receive a base of per-student funding that varies slightly depending on grade level. All districts also receive supplemental funding. This additional funding adds 20 percent to the base funding for each English-language learner, low-income student and foster youth. Finally, concentration grant funding equal to 50 percent of the base is provided to districts in which English-learners, low-income students and foster youth exceed 55 percent of the total enrollment. Irvine Unified School District is not eligible for concentration funding because its enrollment does not exceed the 55 percent threshold.
2015-16 School Accountability Report Card for Turtle Rock Elementary School Page 12 of 12
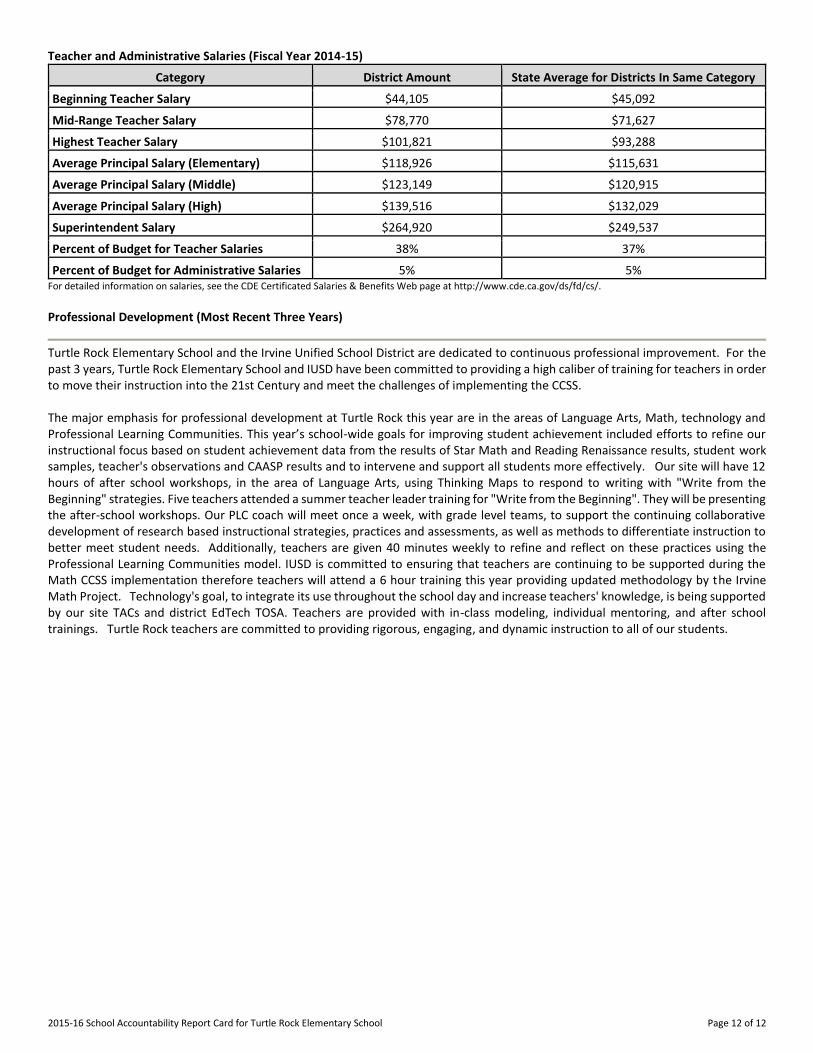
Teacher and Administrative Salaries (Fiscal Year 2014-15)
Category District Amount State Average for Districts In Same Category
Beginning Teacher Salary $44,105 $45,092
Mid-Range Teacher Salary $78,770 $71,627
Highest Teacher Salary $101,821 $93,288
Average Principal Salary (Elementary) $118,926 $115,631
Average Principal Salary (Middle) $123,149 $120,915
Average Principal Salary (High) $139,516 $132,029
Superintendent Salary $264,920 $249,537
Percent of Budget for Teacher Salaries 38% 37%
Percent of Budget for Administrative Salaries 5% 5% For detailed information on salaries, see the CDE Certificated Salaries & Benefits Web page at http://www.cde.ca.gov/ds/fd/cs/. Professional Development (Most Recent Three Years)
Turtle Rock Elementary School and the Irvine Unified School District are dedicated to continuous professional improvement. For the past 3 years, Turtle Rock Elementary School and IUSD have been committed to providing a high caliber of training for teachers in order to move their instruction into the 21st Century and meet the challenges of implementing the CCSS. The major emphasis for professional development at Turtle Rock this year are in the areas of Language Arts, Math, technology and Professional Learning Communities. This year’s school-wide goals for improving student achievement included efforts to refine our instructional focus based on student achievement data from the results of Star Math and Reading Renaissance results, student work samples, teacher's observations and CAASP results and to intervene and support all students more effectively. Our site will have 12 hours of after school workshops, in the area of Language Arts, using Thinking Maps to respond to writing with "Write from the Beginning" strategies. Five teachers attended a summer teacher leader training for "Write from the Beginning". They will be presenting the after-school workshops. Our PLC coach will meet once a week, with grade level teams, to support the continuing collaborative development of research based instructional strategies, practices and assessments, as well as methods to differentiate instruction to better meet student needs. Additionally, teachers are given 40 minutes weekly to refine and reflect on these practices using the Professional Learning Communities model. IUSD is committed to ensuring that teachers are continuing to be supported during the Math CCSS implementation therefore teachers will attend a 6 hour training this year providing updated methodology by the Irvine Math Project. Technology's goal, to integrate its use throughout the school day and increase teachers' knowledge, is being supported by our site TACs and district EdTech TOSA. Teachers are provided with in-class modeling, individual mentoring, and after school trainings. Turtle Rock teachers are committed to providing rigorous, engaging, and dynamic instruction to all of our students.