Embed Size (px)
Citation preview
Tutorial
on
Simulation using ISim
ver. 2.0
Updated: Spring 2014
Software Requirements:
To use this tutorial, you need the following software:
GUI/Environment: Xilinx ISE 14.6 VHDL Simulator: ISim
For instructions on how to set up Xilinx environment at school and home, please view the instructions posted at
http://ece.gmu.edu/sites/ece/files/student-resource/7969/detailed-instructions-how-configure-your-
fpga-tools-school-and-install-and-configure-your-fpga-tools_0.html
Note: To set up Xilinx ISE Webpack at home, you will also need to acquire license for the webpack version you installed. To view detailed steps, please see the appendix.
Preparing the Input:
Download examples associated with this tutorial posted at
http://ece.gmu.edu/tutorials-and-lab-manuals?destination=tutorials-and-lab-manuals
as simulator_examples.zip
VHDL Source Files: Unzip the folder “simulator_examples.zip” and download
following files under folder “count_test”.
1. jk_ff.vhd 2. four_bit_counter.vhd 3. count_test.vhd
This tutorial has been tested using Xilinx ISE versions: 14.2 and 14.6

Introduction:
ISim is a simulation tool integrated into Xilinx ISE. Like Modelsim and ActiveHDL
simulation tool, ISim can be used by students to debug and verify their design.
Objective:
This tutorial is meant to show students how to perform basic simulation tasks using
ISim. This tutorial assumes that students have a working knowledge of the Xilinx ISE
design flow and are able to create and manage projects in ISE.
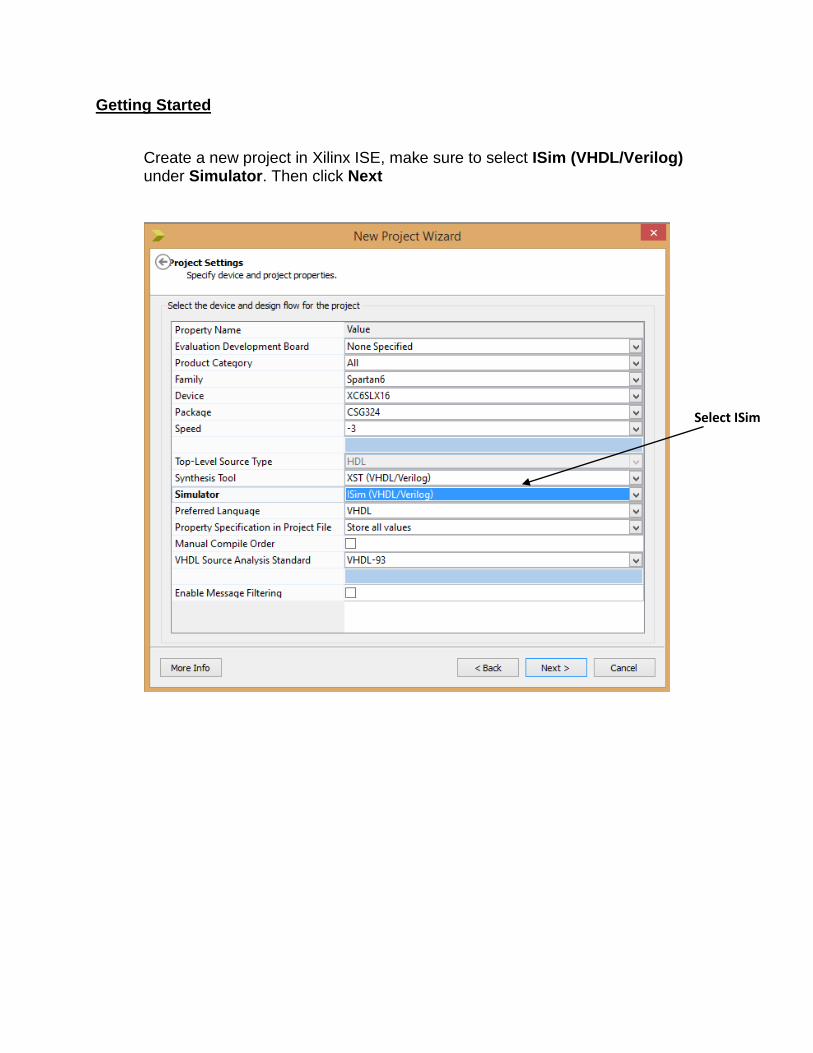
Getting Started
Create a new project in Xilinx ISE, make sure to select ISim (VHDL/Verilog) under Simulator. Then click Next
Select ISim
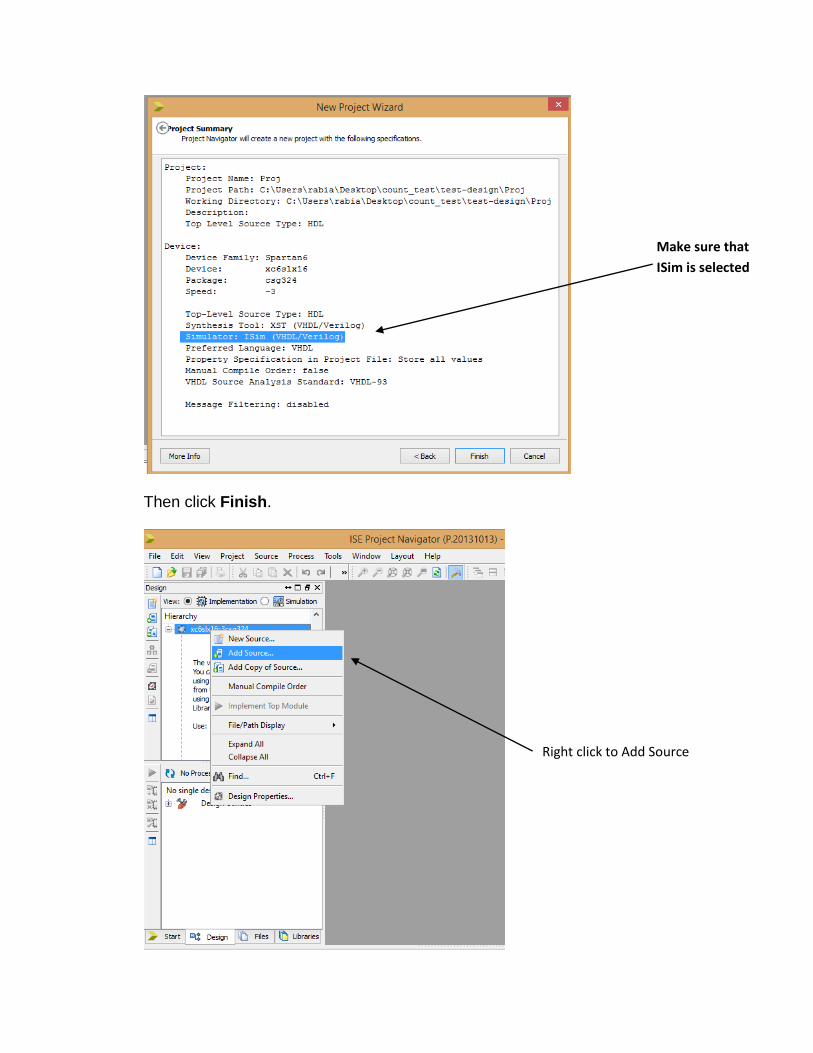
Then click Finish.
Make sure that
ISim is selected
Right click to Add Source
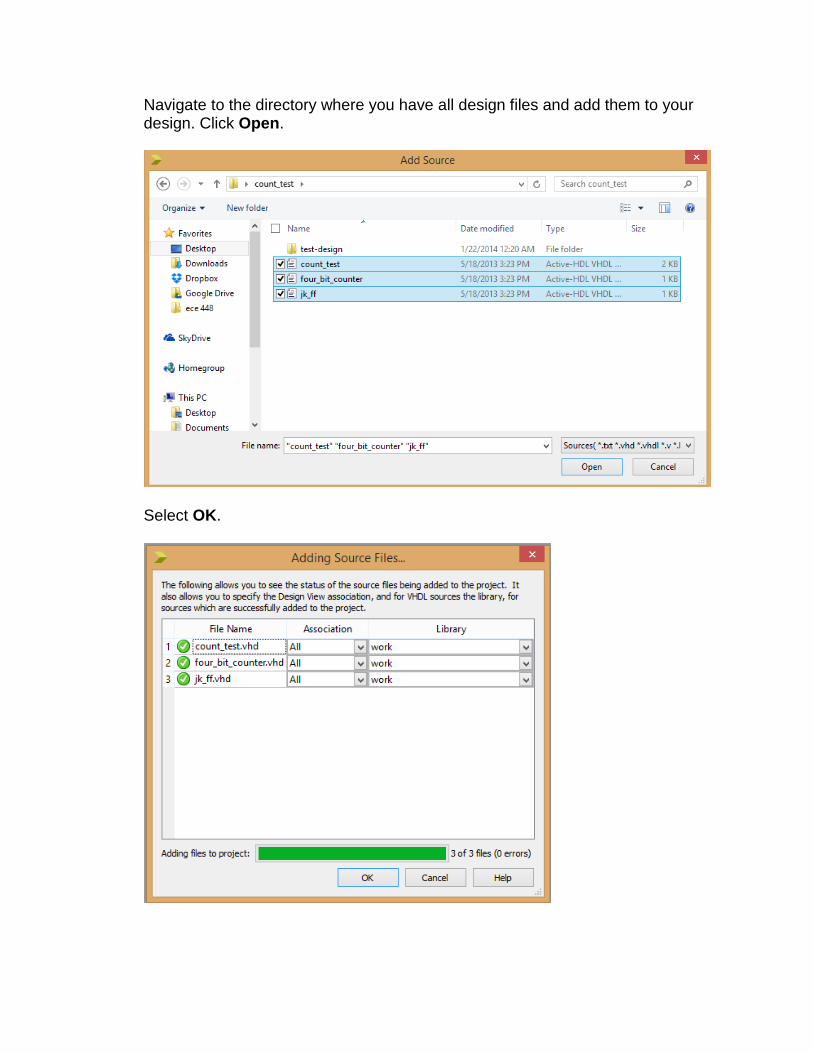
Navigate to the directory where you have all design files and add them to your design. Click Open.
Select OK.
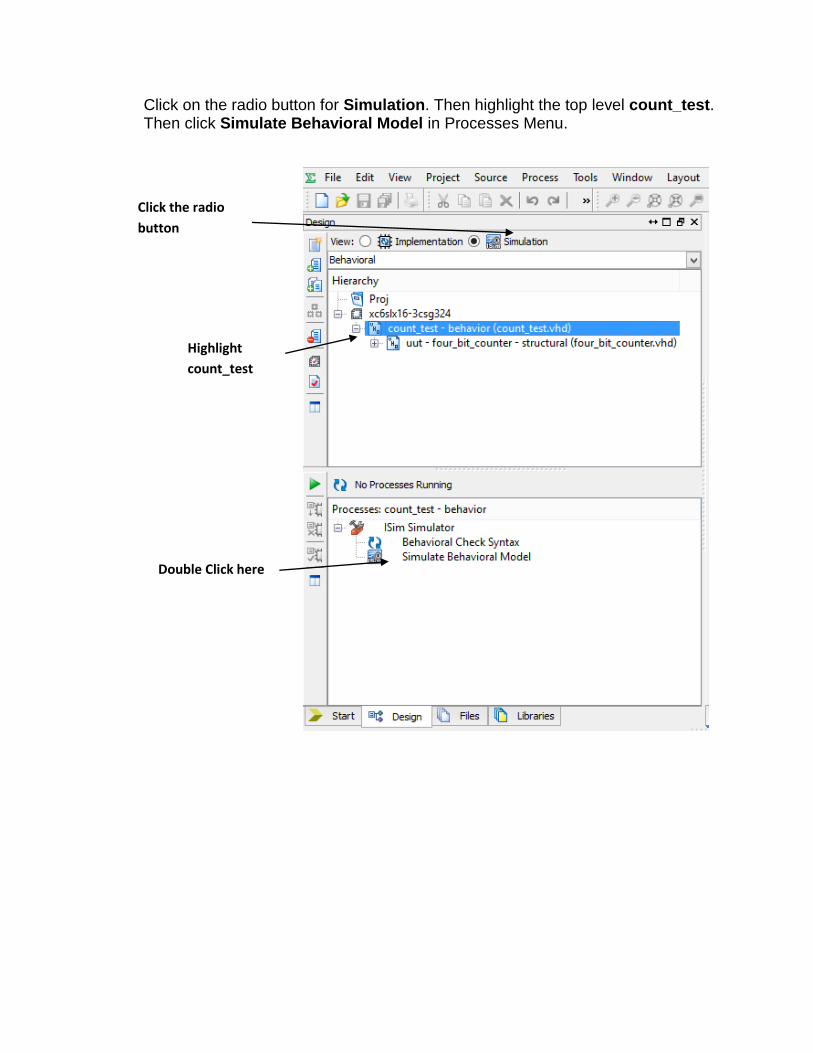
Click on the radio button for Simulation. Then highlight the top level count_test. Then click Simulate Behavioral Model in Processes Menu.
Click the radio
button
Highlight
count_test
Double Click here
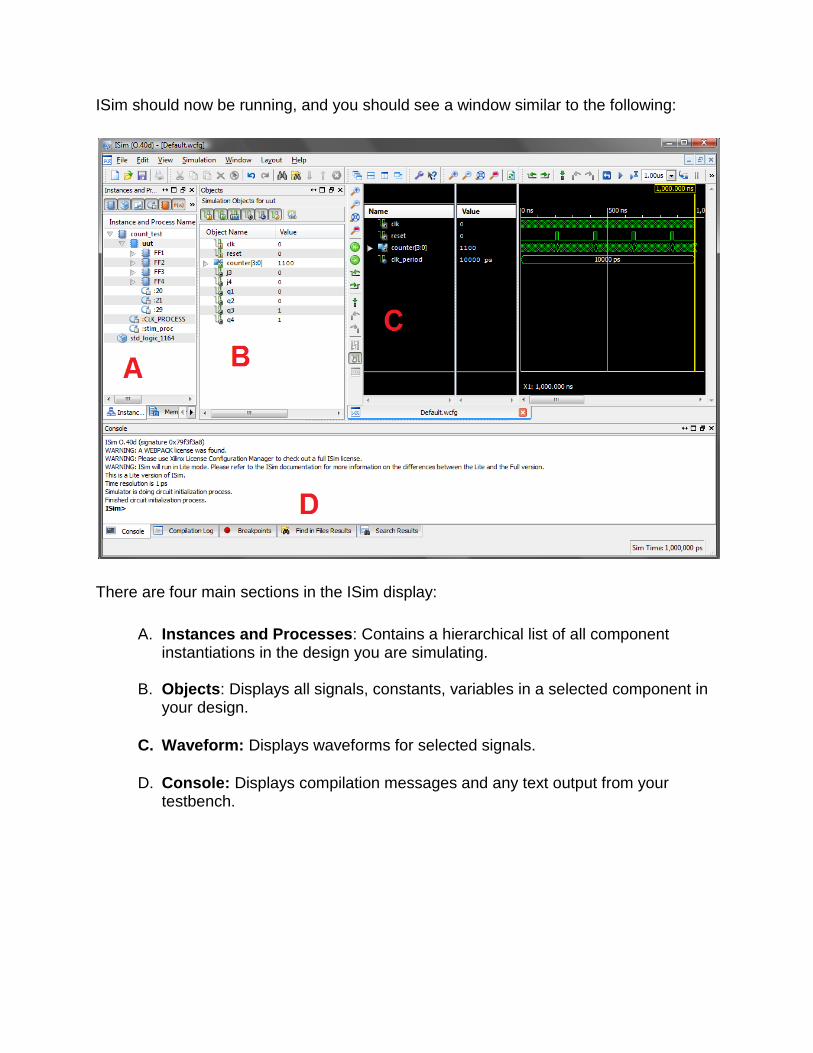
ISim should now be running, and you should see a window similar to the following:
There are four main sections in the ISim display:
A. Instances and Processes: Contains a hierarchical list of all component instantiations in the design you are simulating.
B. Objects: Displays all signals, constants, variables in a selected component in
your design.
C. Waveform: Displays waveforms for selected signals.
D. Console: Displays compilation messages and any text output from your testbench.
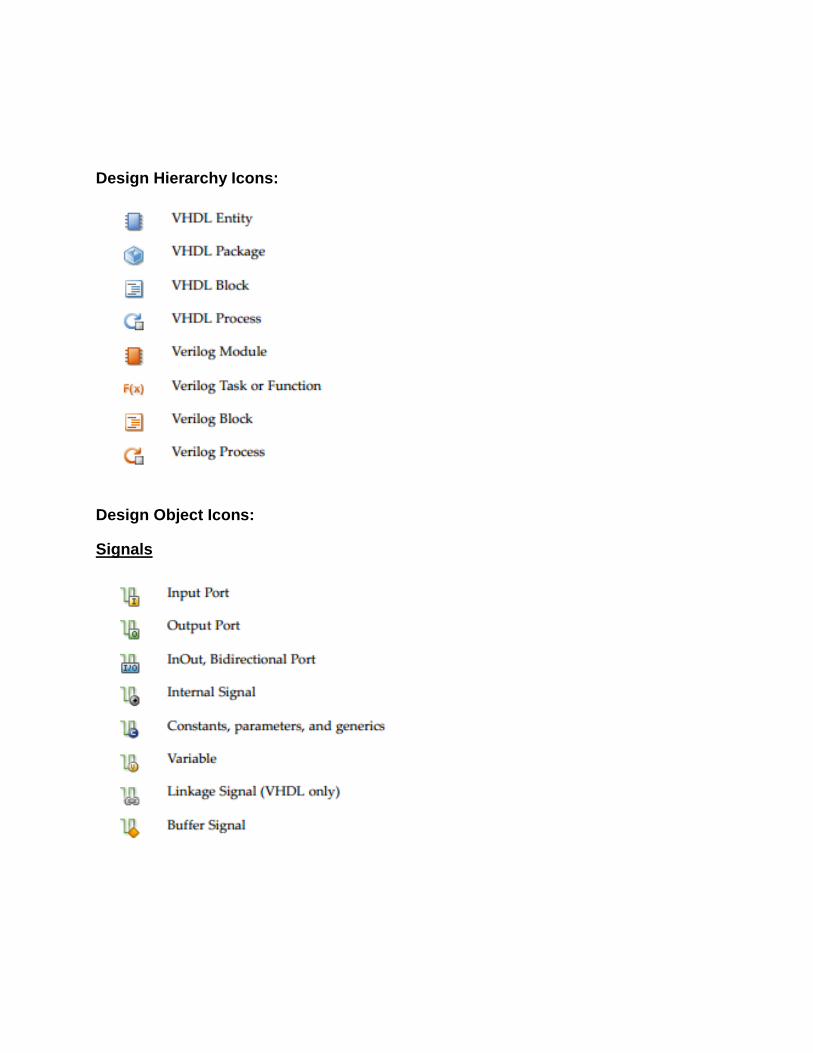
Design Hierarchy Icons:
Design Object Icons:
Signals
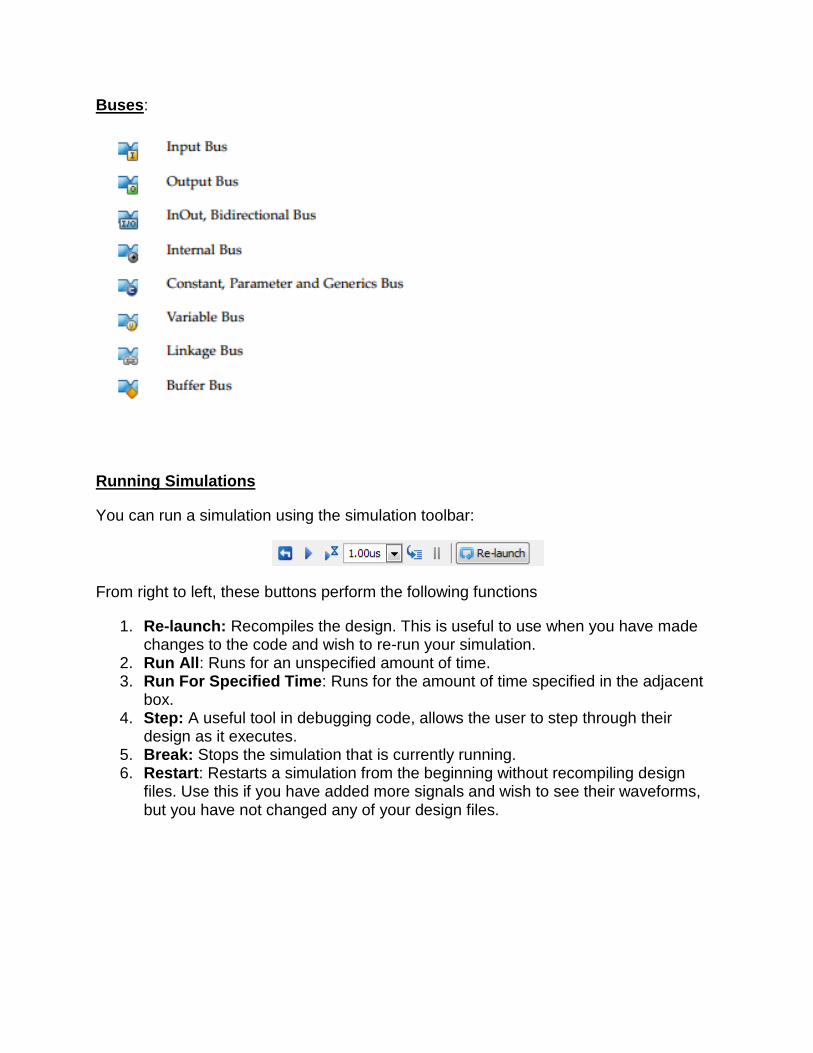
Buses:
Running Simulations
You can run a simulation using the simulation toolbar:
From right to left, these buttons perform the following functions
1. Re-launch: Recompiles the design. This is useful to use when you have made changes to the code and wish to re-run your simulation.
2. Run All: Runs for an unspecified amount of time. 3. Run For Specified Time: Runs for the amount of time specified in the adjacent
box. 4. Step: A useful tool in debugging code, allows the user to step through their
design as it executes. 5. Break: Stops the simulation that is currently running. 6. Restart: Restarts a simulation from the beginning without recompiling design
files. Use this if you have added more signals and wish to see their waveforms, but you have not changed any of your design files.
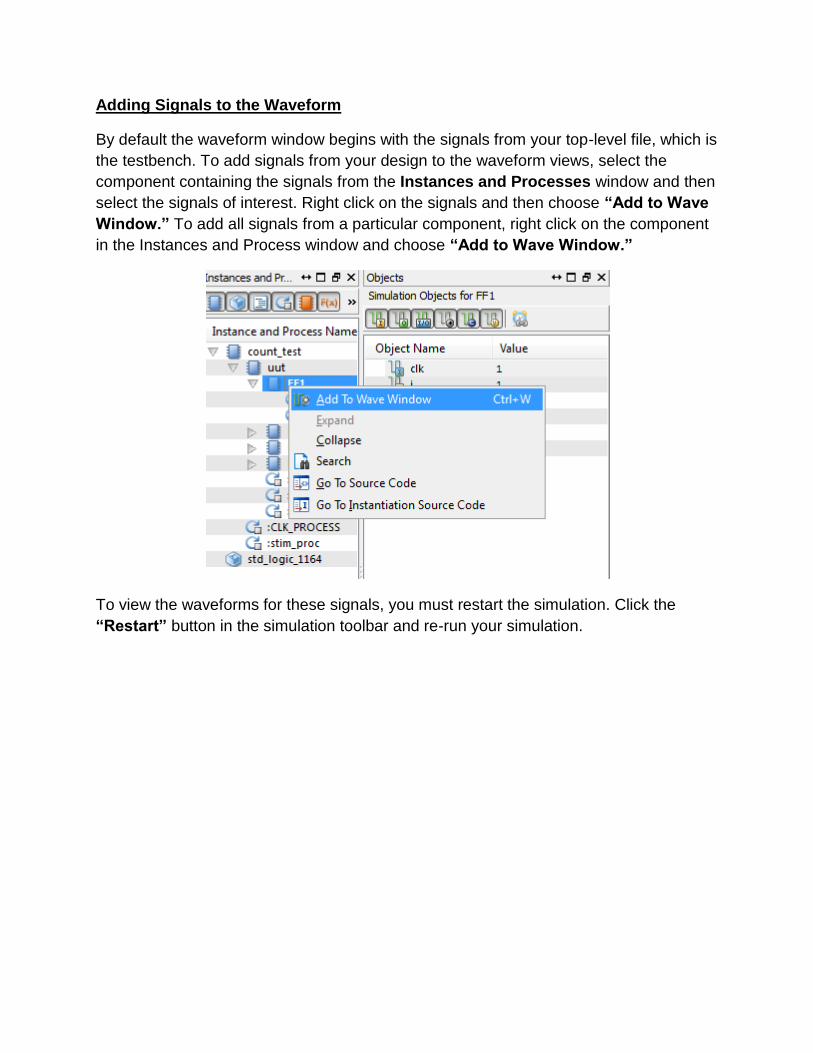
Adding Signals to the Waveform
By default the waveform window begins with the signals from your top-level file, which is
the testbench. To add signals from your design to the waveform views, select the
component containing the signals from the Instances and Processes window and then
select the signals of interest. Right click on the signals and then choose “Add to Wave
Window.” To add all signals from a particular component, right click on the component
in the Instances and Process window and choose “Add to Wave Window.”
To view the waveforms for these signals, you must restart the simulation. Click the
“Restart” button in the simulation toolbar and re-run your simulation.
Waveform Format
In the screenshot on the previous page, the timescale of the waveform is such that you
cannot read the values of some of the signals. To zoom in, use the “Zoom” toolbar:
The functions in this toolbar are (left to right):
1. Zoom In 2. Zoom Out 3. Zoom Fit: Fits entire waveform into window 4. Zoom to Cursor: Zooms in, centered at the location of the cursor.
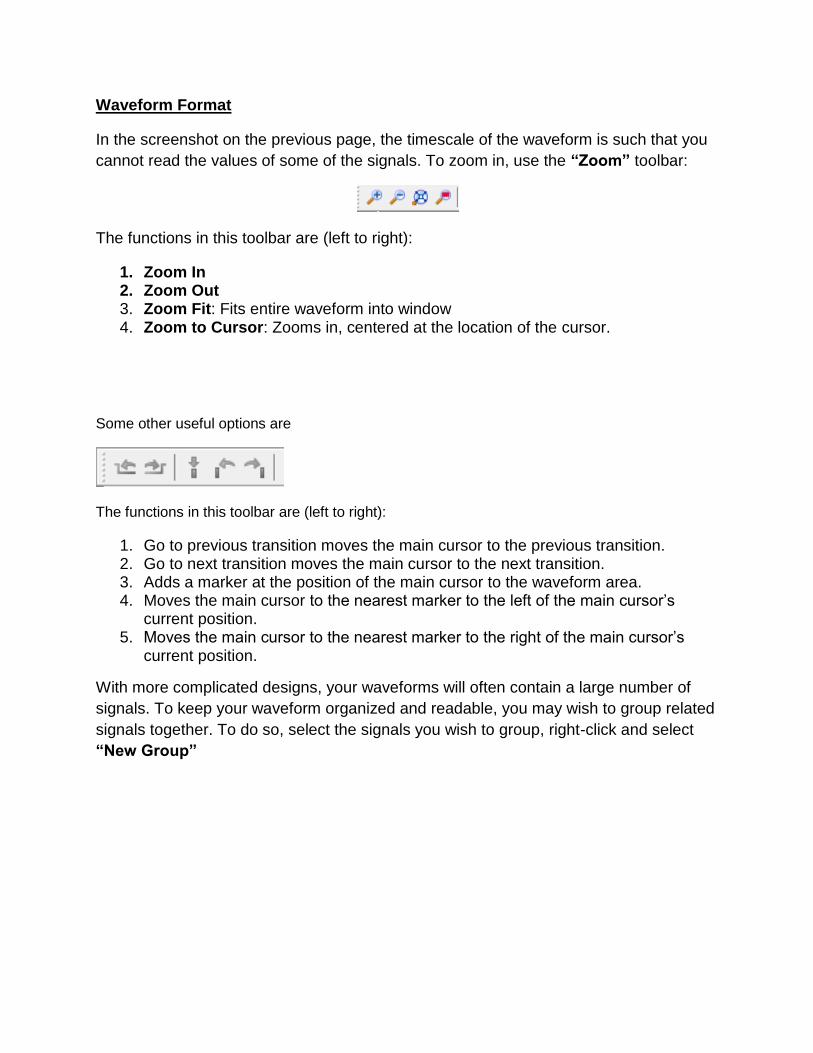
Some other useful options are
The functions in this toolbar are (left to right):
1. Go to previous transition moves the main cursor to the previous transition. 2. Go to next transition moves the main cursor to the next transition. 3. Adds a marker at the position of the main cursor to the waveform area. 4. Moves the main cursor to the nearest marker to the left of the main cursor’s
current position. 5. Moves the main cursor to the nearest marker to the right of the main cursor’s
current position.
With more complicated designs, your waveforms will often contain a large number of
signals. To keep your waveform organized and readable, you may wish to group related
signals together. To do so, select the signals you wish to group, right-click and select
“New Group”
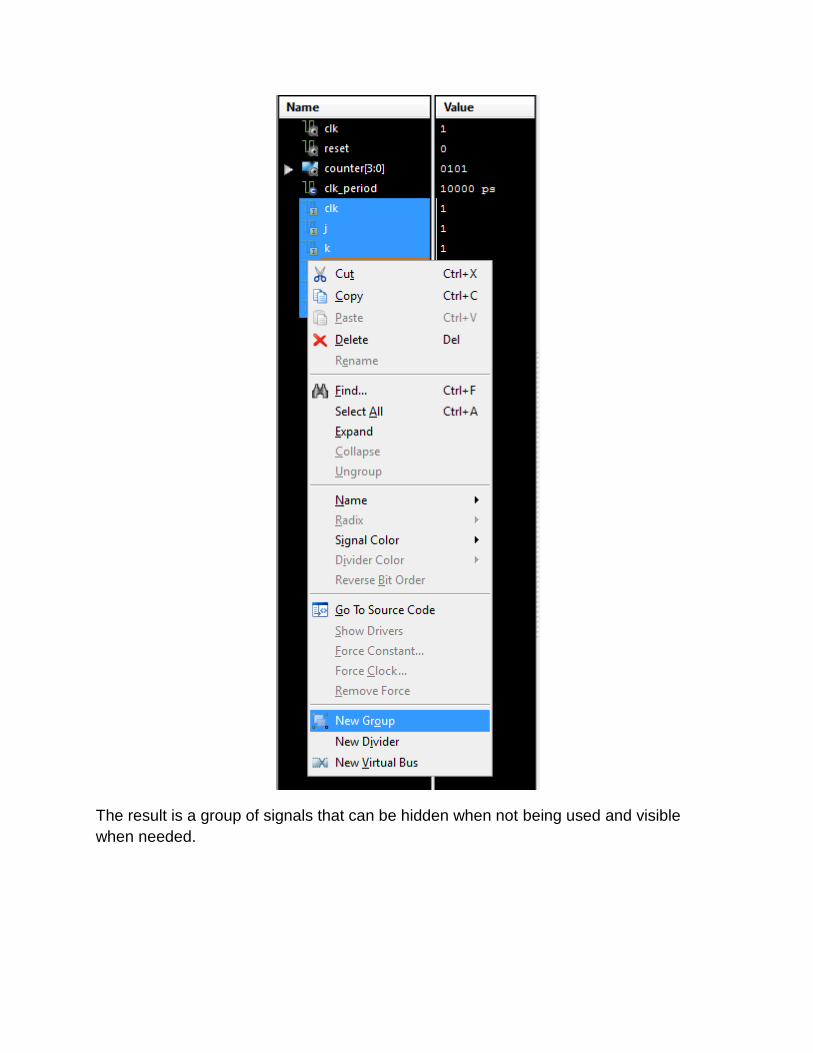
The result is a group of signals that can be hidden when not being used and visible
when needed.
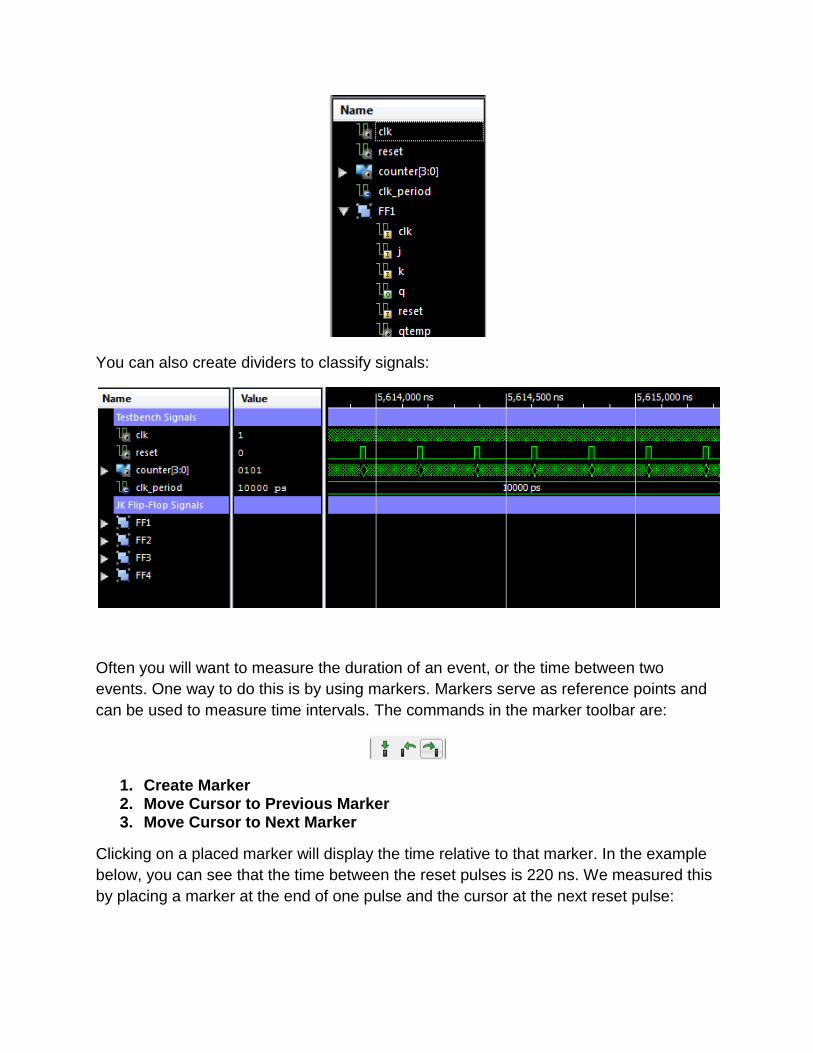
You can also create dividers to classify signals:
Often you will want to measure the duration of an event, or the time between two
events. One way to do this is by using markers. Markers serve as reference points and
can be used to measure time intervals. The commands in the marker toolbar are:
1. Create Marker 2. Move Cursor to Previous Marker 3. Move Cursor to Next Marker
Clicking on a placed marker will display the time relative to that marker. In the example
below, you can see that the time between the reset pulses is 220 ns. We measured this
by placing a marker at the end of one pulse and the cursor at the next reset pulse:
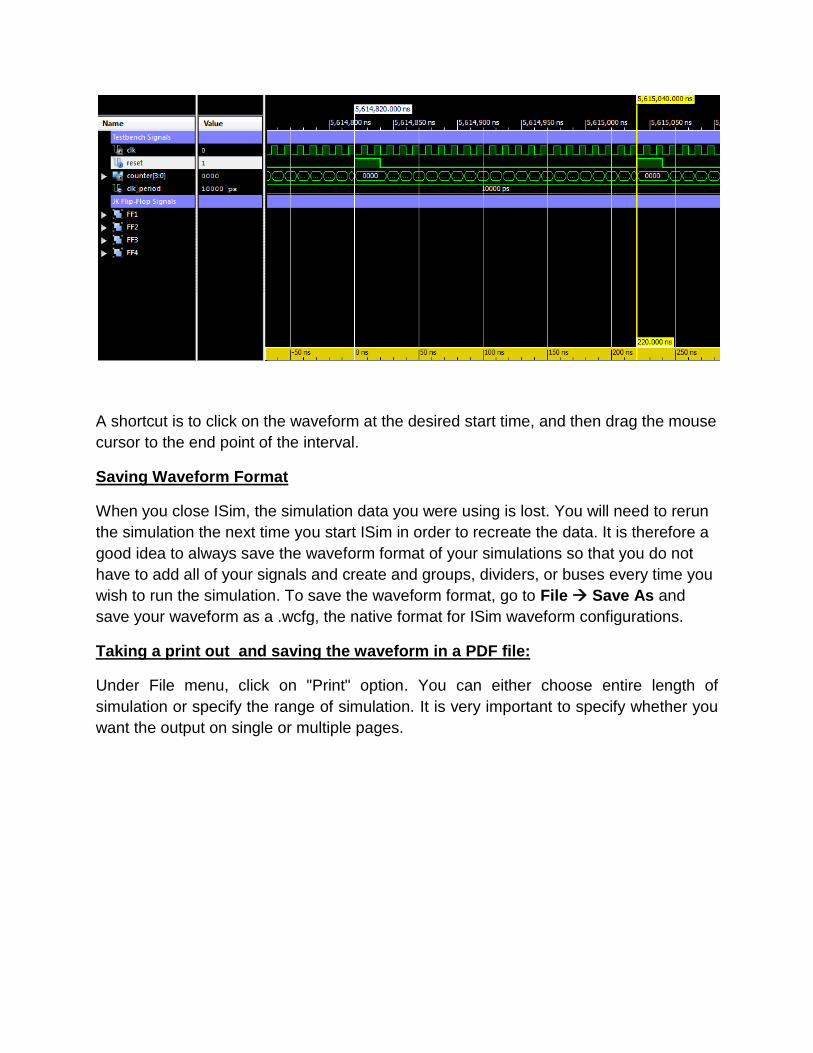
A shortcut is to click on the waveform at the desired start time, and then drag the mouse
cursor to the end point of the interval.
Saving Waveform Format
When you close ISim, the simulation data you were using is lost. You will need to rerun
the simulation the next time you start ISim in order to recreate the data. It is therefore a
good idea to always save the waveform format of your simulations so that you do not
have to add all of your signals and create and groups, dividers, or buses every time you
wish to run the simulation. To save the waveform format, go to File Save As and
save your waveform as a .wcfg, the native format for ISim waveform configurations.
Taking a print out and saving the waveform in a PDF file:
Under File menu, click on "Print" option. You can either choose entire length of
simulation or specify the range of simulation. It is very important to specify whether you
want the output on single or multiple pages.
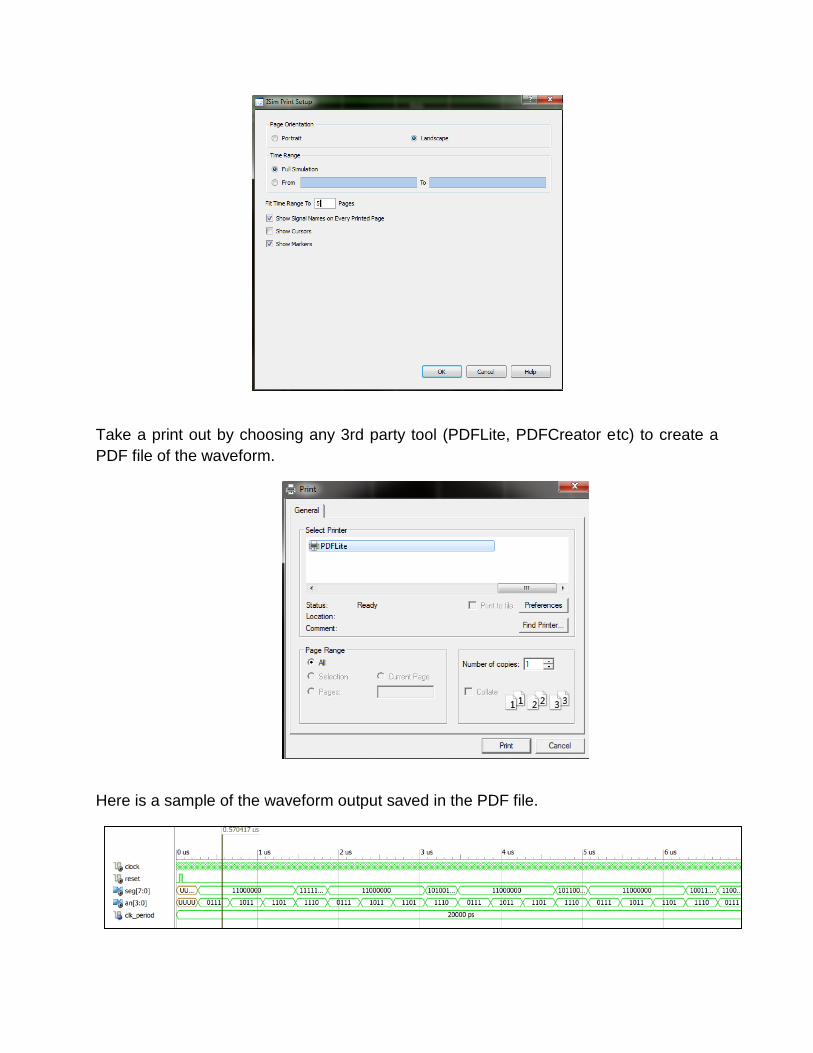
Take a print out by choosing any 3rd party tool (PDFLite, PDFCreator etc) to create a
PDF file of the waveform.
Here is a sample of the waveform output saved in the PDF file.
Appendix
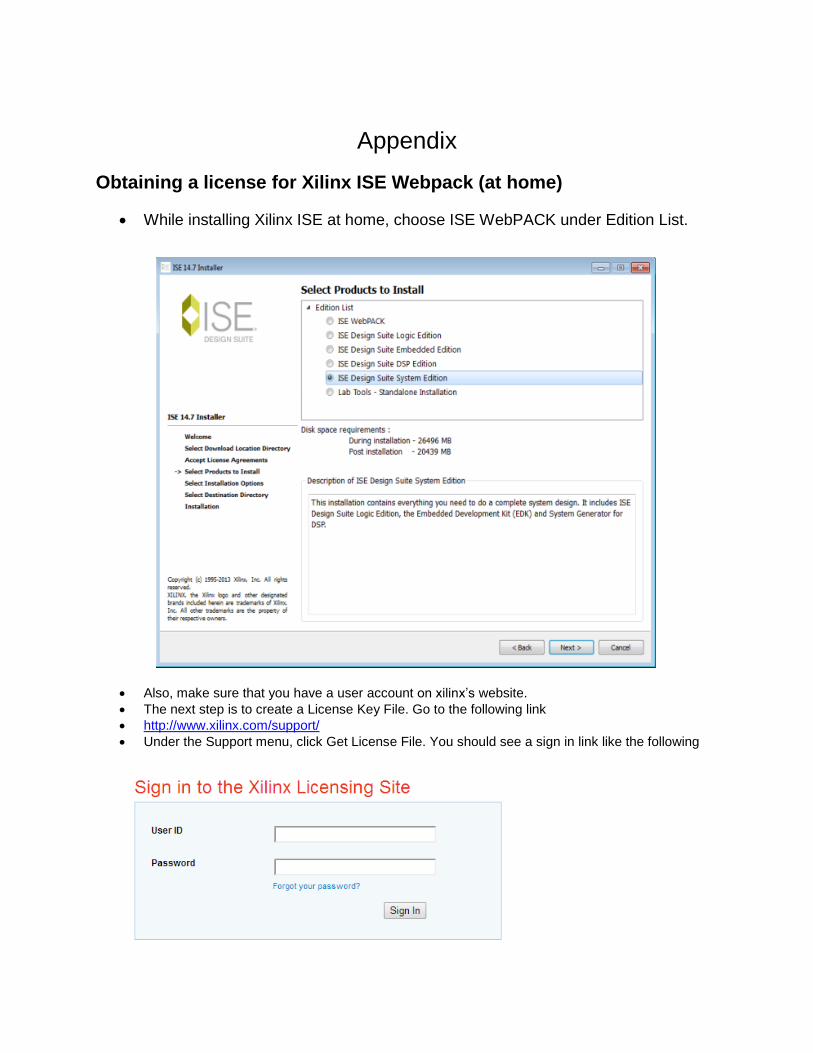
Obtaining a license for Xilinx ISE Webpack (at home)
While installing Xilinx ISE at home, choose ISE WebPACK under Edition List.
Also, make sure that you have a user account on xilinx’s website.
The next step is to create a License Key File. Go to the following link
http://www.xilinx.com/support/
Under the Support menu, click Get License File. You should see a sign in link like the following
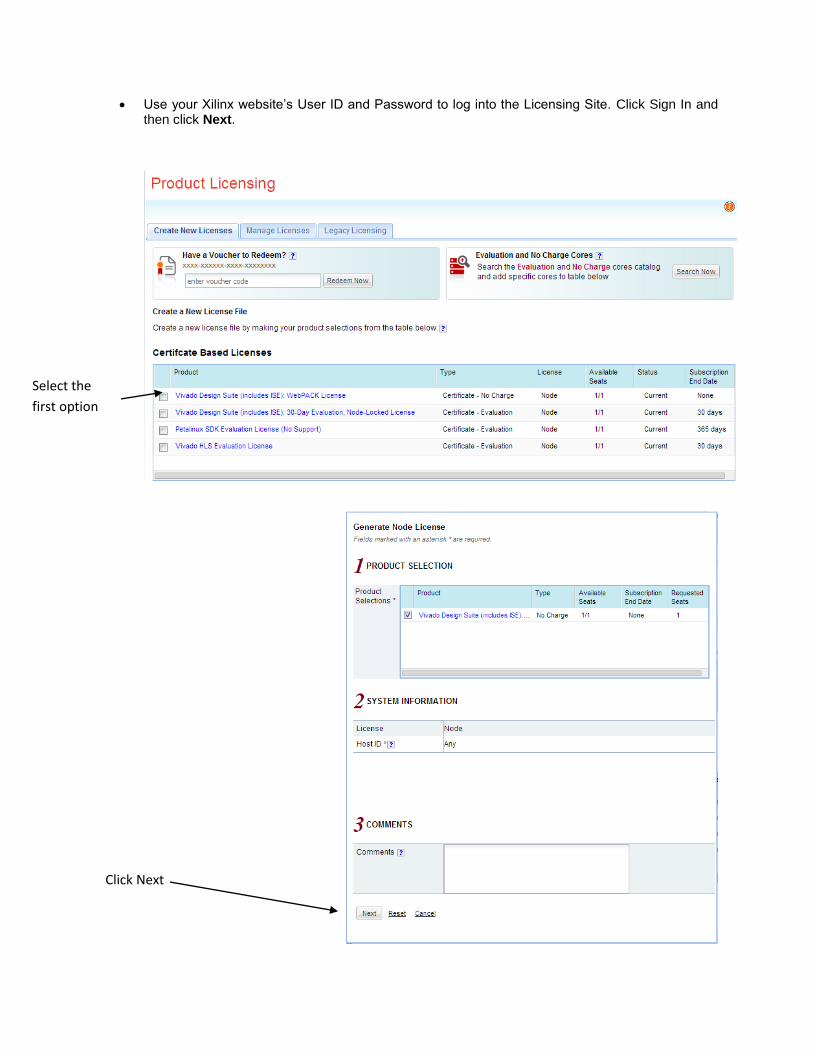
Use your Xilinx website’s User ID and Password to log into the Licensing Site. Click Sign In and then click Next.
Select the
first option
Click Next
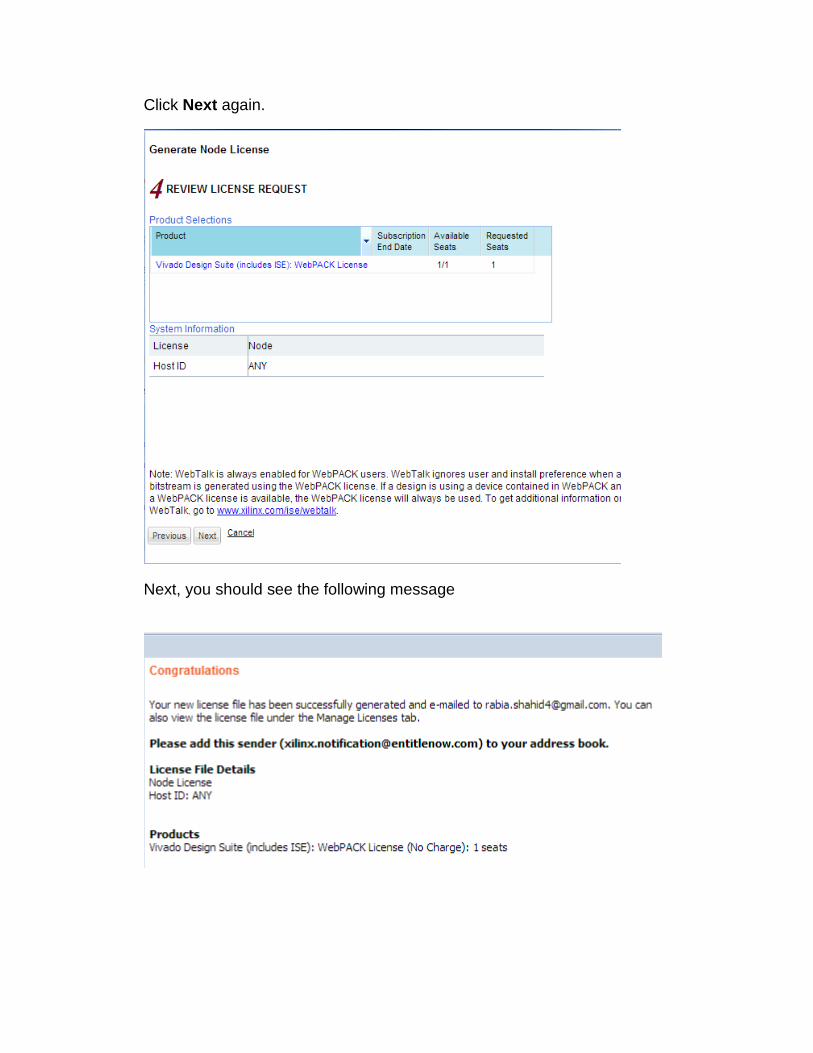
Click Next again.
Next, you should see the following message
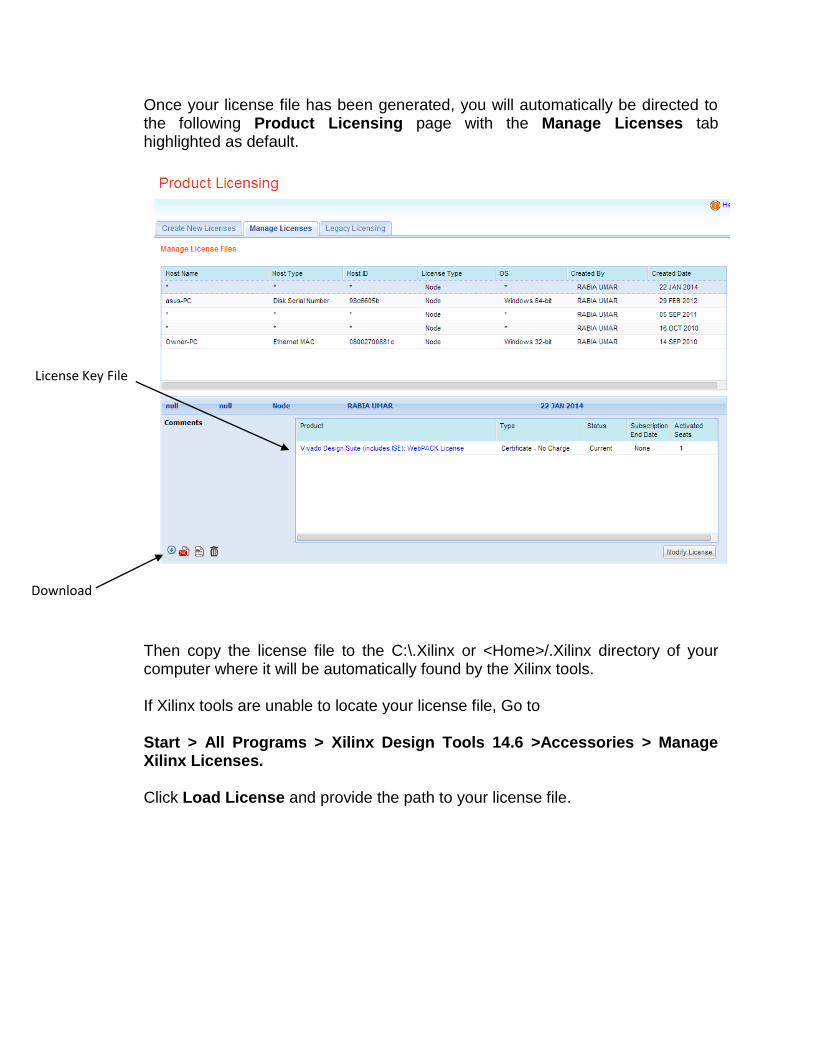
Once your license file has been generated, you will automatically be directed to the following Product Licensing page with the Manage Licenses tab highlighted as default.
Then copy the license file to the C:\.Xilinx or <Home>/.Xilinx directory of your computer where it will be automatically found by the Xilinx tools. If Xilinx tools are unable to locate your license file, Go to Start > All Programs > Xilinx Design Tools 14.6 >Accessories > Manage Xilinx Licenses. Click Load License and provide the path to your license file.
License Key File
Download
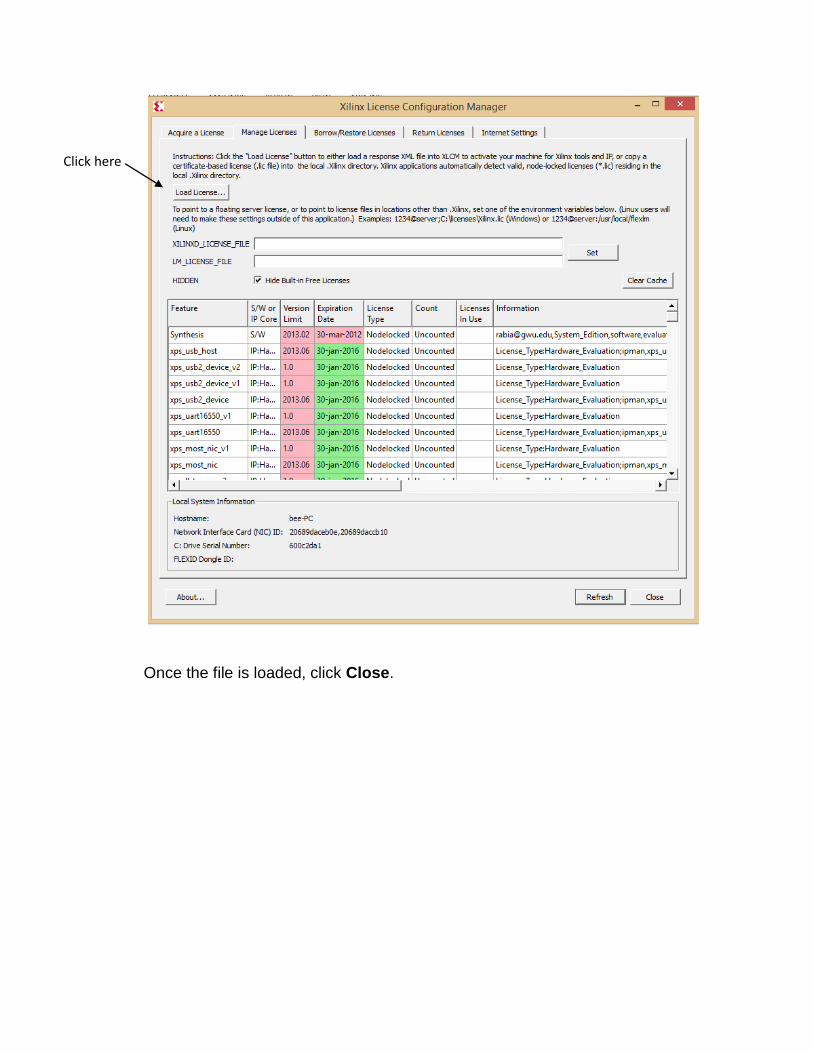
Once the file is loaded, click Close.
Click here