Embed Size (px)
Citation preview

564 | CANCER DISCOVERY�MAY 2013 www.aacrjournals.org
RESEARCH ARTICLE
TYK2–STAT1–BCL2 Pathway Dependence in T-cell Acute Lymphoblastic Leukemia Takaomi Sanda 1 , Jeffrey W. Tyner 6 , Alejandro Gutierrez 1 , 4 , Vu N. Ngo 9 , Jason Glover 7 , Bill H. Chang 7 , Arla Yost 11 , Wenxue Ma 10 , Angela G. Fleischman 6 , Wenjun Zhou 2 , Yandan Yang 12 , Maria Kleppe 13 , Yebin Ahn 1 , Jessica Tatarek 5 , Michelle A. Kelliher 5 , Donna S. Neuberg 3 , Ross L. Levine 13 , Richard Moriggl 14 , Mathias Müller 15 , Nathanael S. Gray 2 , Catriona H.M. Jamieson 10 , Andrew P. Weng 11 , Louis M. Staudt 12 , Brian J. Druker 6 ,8 , and A. Thomas Look 1 , 4
Authors’ Affi liations: Departments of 1 Pediatric Oncology, 2 Cancer Biology, and 3 Biostatistics and Computational Biology, Dana-Farber Cancer Institute; 4 Division of Hematology/Oncology, Children’s Hos-pital Boston, Boston; and 5 Department of Cancer Biology, University of Massachusetts Medical School, Worcester, Massachusetts; 6 Divi-sion of Hematology and Medical Oncology, Knight Cancer Institute, and 7 Division of Pediatric Hematology and Oncology, Department of Pedi-atrics, Oregon Health & Science University; 8 Howard Hughes Medical Institute, Portland, Oregon; 9 Division of Hematopoietic Stem Cell and Leukemia Research, Beckman Research Institute, City of Hope National Medical Center, Duarte; and 10 Department of Medicine and Moores Cancer Center, University of California San Diego, La Jolla, California; 11 Department of Pathology, Terry Fox Laboratory, BC Cancer Agency, Vancouver, British Columbia, Canada; 12 Metabolism Branch, National Cancer Institute, Bethesda, Maryland; 13 Human Oncology and Pathogen-esis Program, Memorial Sloan-Kettering Cancer Center, New York, New York; 14 Ludwig Boltzmann Institute for Cancer Research; and 15 Institute
of Animal Breeding and Genetics, University of Veterinary Medicine Vienna, Vienna, Austria
Note: Supplementary data for this article are available at Cancer Discovery Online (http://cancerdiscovery.aacrjournals.org/). T. Sanda and J.W. Tyner contributed equally to this work.
Corresponding Authors: A. Thomas Look, Department of Pediatric Oncol-ogy, Dana-Farber Cancer Institute, Mayer Building, Rm 630, 450 Brookline Avenue, Boston, MA 02215. Phone: 617-632-4954; Fax: 617-632-6989; E-mail: [email protected]; and Brian J. Druker, Division of Hematology and Medical Oncology, Oregon Health & Science University Knight Cancer Institute, OHSU BRB 553, Mail code L592, 3181 SW Sam Jackson Park Road, Portland, OR 97239. Phone: 503-494-1288; Fax: 503-494-3688; E-mail: [email protected]
doi: 10.1158/2159-8290.CD-12-0504 ©2013 American Association for Cancer Research.
ABSTRACT Targeted molecular therapy has yielded remarkable outcomes in certain cancers, but specifi c therapeutic targets remain elusive for many others. As a result of two inde-
pendent RNA interference (RNAi) screens, we identifi ed pathway dependence on a member of the Janus-activated kinase (JAK) tyrosine kinase family, TYK2, and its downstream effector STAT1, in T-cell acute lymphoblastic leukemia (T-ALL). Gene knockdown experiments consistently showed TYK2 dependence in both T-ALL primary specimens and cell lines, and a small-molecule inhibitor of JAK activity induced T-ALL cell death. Activation of this TYK2–STAT1 pathway in T-ALL cell lines occurs by gain-of-function TYK2 mutations or activation of interleukin (IL)-10 receptor signaling, and this pathway mediates T-ALL cell sur-vival through upregulation of the antiapoptotic protein BCL2. These fi ndings indicate that in many T-ALL cases, the leukemic cells are dependent upon the TYK2–STAT1–BCL2 pathway for continued survival, sup-porting the development of molecular therapies targeting TYK2 and other components of this pathway.
SIGNIFICANCE: In recent years, “pathway dependence” has been revealed in specifi c types of human cancer, which can be important because they pinpoint proteins that are particularly vulnerable to antitumor-targeted inhibition (so-called Achilles’ heel proteins). Here, we use RNAi technology to iden-tify a novel oncogenic pathway that involves aberrant activation of the TYK2 tyrosine kinase and its downstream substrate, STAT1, which ultimately promotes T-ALL cell survival through the upregulation of BCL2 expression. Cancer Discov; 3(5); 564–77. ©2013 AACR. See related commentary by Fontan and Melnick, p. 494.
on June 18, 2019. © 2013 American Association for Cancer Research. cancerdiscovery.aacrjournals.org Downloaded from
Published OnlineFirst March 7, 2013; DOI: 10.1158/2159-8290.CD-12-0504

MAY 2013�CANCER DISCOVERY | 565
The prosurvival members of the BCL2 family as well as pathways that signal upstream of these proteins are attrac-tive candidate targets in T-ALL, as these proteins are known to determine whether developing T cells undergo apoptosis in the thymus or survive to reach peripheral organs ( 12, 13 ). Normally, thymocytes will only survive to maturity if they can productively rearrange their T-cell receptors (TCR) such that they react with foreign antigens and do not react with self-antigens. In contrast, the vast majority of thymocytes that fail to rearrange their TCRs in this manner are eliminated by activation of proapoptotic BCL2 family members followed by caspase-mediated cell death. Defective signaling through this pathway would enable thymocytes slated for destruction to survive and acquire additional lesions that promote full malignant transformation. This suggests that T-ALL cells may have acquired a dependence on this specifi c pathway whose actions perturb the normal balance between thymo-cyte life and death signaling cues.
Here, we identify pathway dependence in T-ALL on the aberrant activation of tyrosine kinase 2 (TYK2), a member of
INTRODUCTION
Tyrosine kinase abnormalities are widely implicated in the genesis of human cancers ( 1 ). Although small-molecule tyro-sine kinase inhibitors have produced remarkable clinical results against certain malignancies ( 2–5 ), the impact of such therapy has been restricted by our lack of knowledge of the pathogenic tyrosine kinases and associated signaling pathways that are required by malignant cells for continued survival and prolifera-tion (“pathway dependence”). This defi cit is especially apparent in T-cell acute lymphoblastic leukemia (T-ALL), which results from the leukemic transformation of thymic T-cell precursors and shows resistance to fi rst-line therapy in 25% of children and more than 50% of adults ( 6, 7 ). A variety of genetic lesions have been identifi ed in T-ALL, including aberrant expression of TAL1 , LYL1 , TLX1/HOX11 , and TLX3/HOX11L2 ( 8, 9 ), activating mutations of NOTCH1 ( 10 ), and genomic duplication of MYB ( 11 ), but so far, these advances have led to relatively few candi-dates for molecularly targeted therapies to improve remission rates or survival for patients with this disease.
on June 18, 2019. © 2013 American Association for Cancer Research. cancerdiscovery.aacrjournals.org Downloaded from
Published OnlineFirst March 7, 2013; DOI: 10.1158/2159-8290.CD-12-0504
566 | CANCER DISCOVERY�MAY 2013 www.aacrjournals.org
Sanda et al.RESEARCH ARTICLE
the Janus-activated kinase (JAK ) family that phosphorylates and activates STAT1 and leads to the upregulation of BCL2, which is then required for T-ALL cell survival.
RESULTS
Loss-of-Function RNAi Screens To understand the oncogenic contribution of tyro-
sine kinases in T-ALL, we conducted an RNA interfer-ence (RNAi)–assisted protein target identifi cation (RAPID) screen of primary leukemic cells from a pediatric patient with T-ALL, applying validated siRNAs to silence each mem-ber of the tyrosine kinome ( 14 ). The result showed clear dependence of these leukemic cells on the TYK2 tyrosine kinase for their viability ( Fig. 1A and Supplementary Table S1). We independently conducted an RNAi screen in which 5,000 inducible short-hairpin RNAs (shRNA) targeting 1,740 genes ( 15, 16 ) were introduced into 3 T-ALL cell lines (JURKAT, CCRF-CEM, and SKW-3/KE-37). By determining the relative abundance of each shRNA in shRNA-induced versus uninduced samples after 3 weeks of induction, we identifi ed shRNAs that were signifi cantly depleted in T-ALL cell lines (Supplementary Table S2). Notably, an shRNA targeting TYK2 was depleted from cultures of these T-ALL cell lines ( Fig. 1B ), indicating that this gene is required for T-ALL cell survival or proliferation, whereas control diffuse large B-cell lymphoma cells showed little to no depletion of cells harboring TYK2 -specifi c shRNA.
We then asked whether this activity was restricted to TYK2 or if it might be shared with other members of the JAK family tyrosine kinases. By testing multiple lentiviral shRNA con-structs targeting JAK1 , JAK2 , JAK3 , or TYK2 in JURKAT cells (Supplementary Fig. S1 and Supplementary Table S3), we found that knockdown of TYK2 , but not of other JAK family genes, reduced cell growth ( Fig. 1C ), indicating that the cells specifi cally depend on TYK2 within the JAK family kinases. Signifi cantly, we observed growth inhibition for each of the 3 independent shRNAs in a long-term culture ( Fig. 1D ). After analyzing additional T-ALL cell lines, we found that the growth of 14 (88%) of 16 successfully transduced cell lines was signifi cantly inhibited after silencing of TYK2 (“TYK2-dependent” cells), whereas 2 others (LOUCY and TALL-1) were unaffected (“TYK2-independent” cells; Supplementary Table S4). Representative results with 5 cell lines are shown in Fig. 1E . To further explore TYK2 dependence in primary T-ALL specimens, we transfected TYK2 or control siRNA ex vivo into leukemic cells derived from patients with T-ALL that had been directly expanded in immunocompromised mice (“primagraft” samples). We found that 5 (62.5%) of 8 primagraft samples (#1–5) showed sensitivity to silencing of TYK2 ( Fig. 1F ). These results indicate that a signifi cant frac-tion of T-ALL cells from human patients depend on TYK2 for sustained growth.
To determine the mechanism(s) underlying the impaired cell growth observed after TYK2 silencing, we stained cells with Annexin V and found increased percentages of apoptotic cells in the TYK2-dependent cell lines JURKAT, RPMI-8402, and HPB-ALL, but not in the TYK2-independent cell line LOUCY ( Fig. 1G ). TYK2 knockdown had little effect on cell-cycle distribution (Supplementary Fig. S2), indicating that
the T-ALL cells primarily require TYK2 for survival rather than proliferation. Expression of the cDNA containing only the coding region of wild-type TYK2 rescued the JURKAT cells from apoptosis ( Fig. 1H , left, as indicated by PARP cleav-age) and growth inhibition ( Fig. 1H , right), confi rming that shRNA targeting TYK2 induces apoptosis due to its silencing of TYK2 and not to any off-target effects.
TYK2 Pathway Includes STAT1 and BCL2 On the basis of our results implicating TYK2 signaling as
essential for T-ALL cell survival, we investigated downstream mediators of the TYK2 pathway. STAT1 is an attractive candidate effector of TYK2 signaling, as STAT1 is phos-phorylated on tyrosine and activated downstream of TYK2 activation in cytokine signaling pathways such as the inter-leukin (IL)-10 pathway ( Fig. 2A ; ref. 17 ). Indeed, tyrosine phosphorylation of STAT1 was observed in 16 of 19 T-ALL cell lines, most of which were TYK2 dependent (Supplemen-tary Table S4), whereas tyrosine phosphorylation of STAT2, for example, was not observed (Supplementary Fig. S3A). STAT1 was also phosphorylated in the LOUCY and TALL-1 TYK2-independent cell lines, presumably due to activation by other pathways, indicating that these cell lines do not depend on the TYK2 pathway for survival. Further investiga-tion showed that silencing of endogenous TYK2 resulted in decreased STAT1 phosphorylation in JURKAT cells, whereas overexpression of wild-type TYK2 caused increased STAT1 phosphorylation ( Fig. 2B ). We also observed constitutive phosphorylation of STAT3 in many T-ALL cell lines (Supple-mentary Fig. S3), although knockdown or overexpression of TYK2 did not change the phosphorylation status of STAT3 ( Fig. 2B ). STAT5 phosphorylation has been associated with other genetic abnormalities, such as mutation of IL-7R (DND-41; ref. 18 ), NUP214–ABL fusion (ALL–SIL and PEER; ref. 19 ), and LCK–TCR fusion (H-SB2; ref. 20 ), whereas AKT phosphorylation has been mostly associated with dele-tion/mutation of the PTEN gene ( 21 ). Phosphorylation of extracellular signal–regulated kinase (ERK) 1/2 was detected only in some cell lines. Importantly, knockdown of STAT1 decreased the growth of each of 2 TYK2-dependent cell lines (JURKAT and HPB-ALL) but not that of the LOUCY TYK2-independent cell line ( Fig. 2C and Supplementary Fig. S4A). Thus, STAT1 seems to be a component of the TYK2-mediated pathway that promotes cell survival in T-ALL. This activity stands in marked contrast to type 1 IFN signaling through TYK2, which leads to tyrosine phosphorylation of both STAT1 and STAT2 (Supplementary Fig. S3B).
To identify the effector molecules downstream of the TYK2–STAT1 pathway in T-ALL, we analyzed global gene expression profi les in JURKAT cells after silencing of TYK2 or STAT1 . Gene set enrichment analysis (GSEA) revealed that a shared set of genes was downregulated after either TYK2 or STAT1 silencing ( Fig. 2D ). Importantly, we found that mRNA encoding the BCL2 antiapoptotic protein was signifi cantly downregulated after silencing of both TYK2 and STAT1 ( Fig. 2E ). Other antiapoptotic BCL2 family proteins and inhibitor of apoptosis (IAP) family proteins were not signifi cantly downregulated after silencing of TYK2 or STAT1 , and proapoptotic BCL2 family proteins were not upregulated after TYK2 knockdown (Supplementary Table S5). Analysis
on June 18, 2019. © 2013 American Association for Cancer Research. cancerdiscovery.aacrjournals.org Downloaded from
Published OnlineFirst March 7, 2013; DOI: 10.1158/2159-8290.CD-12-0504

MAY 2013�CANCER DISCOVERY | 567
Pathway Dependence in T-cell Acute Lymphoblastic Leukemia RESEARCH ARTICLE
Figure 1. TYK2 is required for the survival of T-ALL cells. A, primary cells from a pediatric patient with T-ALL were electroporated with siRNAs targeting each member of the tyrosine kinome as well as N-RAS , K-RAS , and control scrambled siRNA. Cell viability values are shown in relation to the group mean ± 2 SDs. Values above or below the 2-SD threshold were considered signifi cant. B, shRNA screen with approximately 5,000 inducible shRNAs that collectively target 1,740 genes were conducted on 3 T-ALL cell lines (JURKAT, CCRF-CEM, and SKW-3/KE-37) and 4 diffuse large B-cell lymphoma (DLBCL) cell lines (Ly3, Ly10, Ly7, and Ly19). Depletion of TYK2 shRNA from the cell population was calculated as shRNA-uninduced/induced (log2), and is shown as the mean ± SEM of 4 independent experiments. C, validated shRNAs targeting JAK1 , JAK2 , JAK3 , or TYK2 as well as 2 control shRNAs ( GFP and Luc ) were transduced by lentivirus infection into JURKAT cells. The number of shRNAs tested is indicated in parentheses. Cell viability was measured after 3 and 7 days of infec-tion. Growth rate (day 7/day 3) relative to the mean of control samples is reported as the mean ± SEM ( n = 2–6). *, P < 0.05 by 2-sample, 2-tailed t test. D, the 3 TYK2 -targeting shRNAs as well as control GFP shRNA were transduced by lentivirus infection into JURKAT cells. Relative cell growth values (means ± SEM of triplicate experiments) at days 3, 5, 7, and 9 after infection are shown. E, the 3 TYK2 -targeting shRNAs as well as control GFP shRNA were transduced in 5 T-ALL cell lines (JURKAT, RPMI-8402, HPB-ALL, MOLT-4, and LOUCY). Growth rate (day 7/day 3) relative to control is shown as the mean ± SEM of triplicate experiments. *, P < 0.05; **, P < 0.01; ***, P < 0.001 by 2-sample, 2-tailed t-test. F, primary T-ALL cells were initially expanded by primagraft into Rag2 −/ − γc −/− or NOD/Scid/ Il2rg −/− mice, subsequently expanded on OP9-DL1 or MS5-DL1 cells, and electroporated with nonspecifi c siRNA (control) or siRNA targeting TYK2 followed by a 4-day culture. Values represent mean percent cell viability (normalized to viability of control siRNA) ± SEM of quadruplicate experiments. *, P < 0.05 by 2-sample, 2-tailed t test. G, JURKAT, RPMI-8402, HPB-ALL, or LOUCY cells harboring GFP or TYK2 shRNAs were analyzed for rate of apoptosis after 4 days of lentiviral infection by fl ow cytometric analysis of cells stained with Annexin V-FITC. The values are means ± SEM of tripli-cate experiments. *, P < 0.05; **, P < 0.01 by 2-sample, 2-tailed t test. H, cDNA containing the wild-type (WT) TYK2 was transduced by retroviral infection in JURKAT cells. The cells were then transduced by lentivirus infection with control GFP or TYK2 #2 shRNA, which targets the 3′ untranslated region of TYK2 mRNA. Whole-cell extracts were harvested and subjected to immunoblot analysis with antibodies specifi c for total TYK2, PARP, and α-tubulin (internal control). Growth rate (day 7/day 3) relative to control is shown as the mean ± SEM of triplicate experiments. ***, P < 0.001 by 2-sample, 2-tailed t test.
+ 2 SD
T-ALL (3) DLBCL (4)
JUR
KAT
TY
K2-
shR
NA
Dep
letio
n(u
nind
uced
/indu
ced,
log2
)
CC
RF
-CE
M
SK
W-3
/KE
-37
Ly3
Ly10 Ly
7
Ly19
Mean
2 SD
Control shRNAControl shRNA TYK2 #2 shRNA
TYK2 #2 shRNA
TYK2 #1 shRNA
TYK2 #1 shRNA
TYK2 #3 shRNA
TYK2 #3 shRNA
Control shRNA
Control siRNA
Con
trol
(2)
Cel
l via
bilit
y(%
of c
ontr
ol)
Gro
wth
rat
e (d
ay7/
day3
:%
of c
ontr
ol s
hRN
A)
JAK
1 (5
)
JAK
2 (5
)
JAK
3 (6
)
TY
K2
(3)
TYK2 #2 shRNATYK2 #1 shRNATYK2 #3 shRNATYK2 siRNA
1.5
1.0
0.5
0.0
–0.5
–1.0
100
30
20
10
0
75
50
25
0JURKAT RPMI-
8402HPB-ALL
MOLT-4 LOUCY
JURKAT
JURKAT
TYK2 WT cDNA
TYK2 WT cDNA
––
––
––
– –– –
––
+ +
++
++
+
+
++
++
Control shRNA
Control shRNA
TYK2 #2 shRNA
TYK2 #2 shRNA
TYK2
PARP
Cleaved-PARP
α-Tubulin
RPMI-8402
HPB-ALL
LOUCY
Via
bilit
y (%
of m
edia
nva
lue
on p
late
)G
row
th r
ate
(day
7/da
y3:
% o
f con
trol
shR
NA
s)
Cel
l gro
wth
(Fol
d ch
ange
from
day
3)
Gro
wth
rat
e (d
ay7/
day3
:%
of c
ontr
ol s
hRN
A)
Apo
ptos
is (
%)
125
150
A B
G
D EC
F
H
100
75
50
25
TY
K2
0
100 6
5
4
3
2
1
03 5
Days after infection7 9
75 *
* ** * *
50
25
0
150
100
50
120
100
80
60
40
20
0
0#3#2#1 #5 #6 #7 #8#4
ValidatedshRNAs (n)
Primagraftsamples
Controlscrambled
siRNA
∗∗∗
∗∗∗
∗∗
∗∗
∗∗∗∗
∗∗
∗∗
∗∗∗∗∗∗
∗∗∗∗∗∗
∗∗∗
∗∗∗∗
∗∗ ∗∗ ∗∗∗∗
∗
on June 18, 2019. © 2013 American Association for Cancer Research. cancerdiscovery.aacrjournals.org Downloaded from
Published OnlineFirst March 7, 2013; DOI: 10.1158/2159-8290.CD-12-0504

568 | CANCER DISCOVERY�MAY 2013 www.aacrjournals.org
Sanda et al.RESEARCH ARTICLE
Figure 2. TYK2–STAT1 pathway upregulates the antiapoptotic protein BCL2 in T-ALL. A, diagram of proposed TYK2 pathway. B, JURKAT cells express-ing an empty vector or wild-type (WT) TYK2 cDNA were transduced with TYK2 or control GFP shRNA. Whole-cell extracts were harvested and subjected to immunoblot analysis with antibodies specifi c for total TYK2, phospho-STAT1 (Y701), STAT1, phospho-STAT3 (Y705), STAT3, and α-tubulin. C, the 2 STAT1 -targeting shRNAs as well as control GFP shRNA were transduced into JURKAT, HPB-ALL, and LOUCY cells. Cell viability was measured after 3 and 7 days of infection. Growth rate (day 7/day 3) relative to control is shown as the mean ± SEM of triplicate experiments. *, P < 0.05; ***, P < 0.001 by 2-sample, 2-tailed t test. D, global gene expression in JURKAT cells transduced with TYK2 , STAT1 , or control shRNAs ( GFP and Luc ) was measured by microarray analysis. The genes signifi cantly downregulated by TYK2 or STAT1 knockdown (KD) compared with control were determined and used as gene sets for the GSEA. GSEA plots indicate the degree to which genes are overrepresented at the extreme left (downregulated by KD) or right (upregulated by KD) of the entire ranked list. Solid bars represent genes. Normalized enrichment score (NES) and P values are indicated. E, BCL2 mRNA expression levels in each shRNA-transduced sample were determined by microarray analysis. Values are means ± SEM of duplicate experiments. ***, P < 0.001 by 2-sample, 2-tailed t test. F, the TYK2 shRNA as well as control GFP shRNA were transduced into T-ALL cell lines. BCL2 mRNA expression was measured by quantitative RT-PCR and normalized by glyceraldehyde-3-phosphate dehydrogenase (GAPDH) expression. Gene expression changes (KD/control) were shown as mean ± SEM of duplicate experiments. G, the WT or kinase-dead form of TYK2 cDNA was transduced into MOLT-4 cells by retrovirus infection. The selected clone was then transduced with GFP or TYK2 shRNA by lentivirus infection. Whole-cell extracts were subjected to immunoblot analysis with antibodies specifi c for TYK2, BCL2, and α-tubulin. H, apoptosis was measured after 4 days of infection by fl ow cytometric analysis of cells stained with Annexin V-Phycoerythrin (PE) . Values are means ± SEM of duplicate experiments. ***, P < 0.001 by 2-sample, 2-tailed t test. I, the WT or Y701F STAT1α cDNA was transduced in JURKAT cells by retrovirus infection. The selected clone was transduced with GFP or STAT1 shRNA by lentivirus infection. Whole-cell extracts were subjected to immunoblot analysis with antibodies specifi c for total STAT1, phospho-STAT1 (Y701), BCL2, and α-tubulin. Arrowhead indicates STAT1α isoform. J, apoptosis was measured after 4 days of infection by fl ow cytometric analysis of cells stained with Annexin V–PE. Values are means ± SEM of duplicate experiments. *, P < 0.05 by 2-sample, 2-tailed t test.
Cytokine receptor
TYK2
STAT1
JURKAT
TYK2 WT cDNA
Control shRNATYK2 #2 shRNA
TYK2
BCL2
Empt
y vec
tor
Empt
y vec
tor
STAT1α W
TSTA
T1α Y70
1F
TYK2 WT
TYK2
Kinase
-dea
d
α-Tubulin
120
100
80
60
40
20
0Gro
wth
rat
e (d
ay 7
/day
3:
% o
f con
trol
shR
NA
)
1,0000.7NES
P1.86
<0.001NES P
1.79<0.001
0.60.50.4
0.20.10.0
0.3
Enr
ichm
ent s
core
0.60.7
0.50.4
0.20.10.0
0.3
800
600
200
0
400
shRNA
JURKAT
Control shRNASTAT1 #3 shRNA
STAT1
pSTAT1 (Y701)
BCL2
100
120
80
Gen
e ex
pres
sion
cha
nge
(TY
K2
KD
/con
trol
)
BC
L2 E
xpre
ssio
n60
40
200
30
25
20
15
10
5
0
Apo
ptos
is (
%)
TYK2independent
TYK2dependent
shRNA
JURKAT HPB-ALL LOUCY
TYK2TYK2dependent independent
Con
trol
Con
trol
STA
T1
#2
RP
MI-
8402
GF
P
Em
pty
vect
or
TY
K2
WT
TY
K2
Kin
ase-
dead
50Control shRNAControl shRNA STAT1 #3 shRNATYK2 #2 shRNA
40
30
20MOLT-4
Apo
ptos
is (
%)
10
0
Luc
TY
K2
#2
Em
pty
vect
or
STA
T1α
WT
α-Tubulin
STA
T1α
Y70
1FT
YK
2 #3
STA
T1
#2
STA
T1
#3 KO
PT-
K1
MO
LT-1
6
PF
-382
CC
RF
-CE
M
LOU
CY
SK
W-3
/KE
-37
STA
T1
#2
STA
T1
#3
STA
T1
#3
Con
trol
STA
T1
#2S
TAT
1 #3
Control shRNATYK2 #2 shRNATYK2pSTAT1 (Y701)
pSTAT3 (Y705)STAT3α-Tubulin
STAT1Other
pathways?
Cell survival
Tyrosinephosphorylation
Downregulatedby STAT1 KD
Upregulatedby STAT1 KD
Downregulatedby TYK2 KD
Upregulatedby TYK2 KD
Genes downregulatedby STAT1 KD
Genes downregulatedby TYK2 KD
–+
–+ –+ –+– + – + – +++
+ ++– –
–––
***
*** **
*
***
***
******
∗
A B C
D E F
G H I J
– ––
– ––
+ ++ +
++
on June 18, 2019. © 2013 American Association for Cancer Research. cancerdiscovery.aacrjournals.org Downloaded from
Published OnlineFirst March 7, 2013; DOI: 10.1158/2159-8290.CD-12-0504

MAY 2013�CANCER DISCOVERY | 569
Pathway Dependence in T-cell Acute Lymphoblastic Leukemia RESEARCH ARTICLE
by quantitative PCR of additional T-ALL cell lines revealed that silencing of TYK2 resulted in signifi cant reductions of BCL2 mRNA expression in multiple TYK2-dependent cell lines, but not in the LOUCY TYK2-independent T-ALL cell line ( Fig. 2F ), which seems to have constitutively upregulated BCL2 through a pathway independent of TYK2. Expression of wild-type but not kinase-dead TYK2 (M978F) protein was suffi cient to rescue BCL2 protein expression and to prevent apoptosis after knockdown of endogenous TYK2 in the TYK2-dependent line ( Fig. 2G and H ). In fact, expression of the kinase-dead TYK2 protein repressed BCL2 expression ( Fig. 2G ) and increased baseline levels of apoptosis ( Fig. 2H ), suggesting that it could be interfering with residual endog-enous TYK2 activity. Similarly, expression of the shRNA-resistant wild-type STAT1α protein partially rescued BCL2 protein expression ( Fig. 2I ) and prevented apoptosis ( Fig. 2J ), whereas STAT1α Y701F (which is incapable of being activated by phosphorylation) did not rescue BCL2 levels and caused increased levels of apoptosis. Taken together, these results show that TYK2 effects are in part mediated through STAT1, and that the TYK2–STAT1 pathway acts at least in part by upregulating BCL2 expression in T-ALL cells, thereby pro-moting their aberrant survival.
Activating TYK2 Mutations in T-ALL To investigate the possibility that the TYK2 kinase might
be mutationally activated, we sequenced the TYK2 coding regions in 17 T-ALL cell lines and 45 primary pediatric T-ALL patient samples (Supplementary Tables S6 and S7). This anal-ysis identifi ed novel nonsynonymous sequence variants of TYK2 in 4 cell lines (21.1%), none of which represents known single-nucleotide polymorphisms based on the dbSNP137 and the 1000 Genomes databases ( 22, 23 ). These included point mutations in the TYK2 FERM domain ( G36D, S47N and R425H ), the JH2 domain ( V731I ), and the kinase domain ( E957D and R1027H ; Fig. 3A and 3B and Supplementary Table S6). The functional consequence of each point mutation was then determined by testing its ability to transform IL-3–dependent murine pro-B Ba/F3 cells to cytokine-independent growth. We observed that expression of 5 of the 6 TYK2 cDNA mutants ( G36D , S47N , V731I , E957D , and R1027H ) con-verted the Ba/F3 cells to IL-3–independent growth ( Fig. 3C ). Expression of the wild-type TYK2 did not transform Ba/F3 cells, nor did TYK2-R425H , suggesting that this sequence variant represents a rare SNP or a “passenger” mutation. Analysis of whole-cell extracts from Ba/F3 cells transformed by mutant TYK2 proteins showed a marked increase in TYK2 tyrosine phosphorylation ( Fig. 3D , lanes 4–8) compared with that observed in wild-type TYK2–expressing cells starved of IL-3 ( Fig. 3D , lane 3). An increase in tyrosine phosphorylation of STAT1 was also observed ( Fig. 3D ). Overall, levels of STAT1 were also increased in mutant TYK2–expressing cells, consist-ent with previous observations of STAT1 activation lead-ing to enhanced nascent STAT1 expression ( 24 ). Expression of TYK2-V678F (equivalent of JAK2-V617F ; ref. 25 ), which induces constitutive activation of the TYK2 kinase, served as a positive control ( Fig. 3D , lane 1). Importantly, introduction of the kinase-dead mutation ( M978Y or M978F ) into the TYK2 cDNA that also had an activating mutation ( E957D ) resulted in failure to transform Ba/F3 cells ( Fig. 3E ), confi rming that
kinase activity of TYK2 is required for cell transformation. Phosphorylation of each of the TYK2 and STAT1 proteins was also abrogated by introduction of the kinase-dead muta-tion into HEK293 cells ( Fig. 3F ). Finally, we tested the ability of the TYK2-E957D point mutant to promote the expansion of primary murine T-lineage cells in murine bone marrow cells plated on OP9 DL1 stromal cells. Transduction of TYK2-E957D together with GFP into bone marrow cells sig-nifi cantly fostered cell growth compared with the result for cells expressing an empty vector or wild-type TYK2 ( Fig. 3G ); fl ow cytometric analysis of the expanded cells confi rmed the expression of both CD3 and GFP (Supplementary Fig. S5).
TYK2 Pathway Activation by IL-10 Signaling Mutations of the TYK2 gene provide a mechanism for aber-
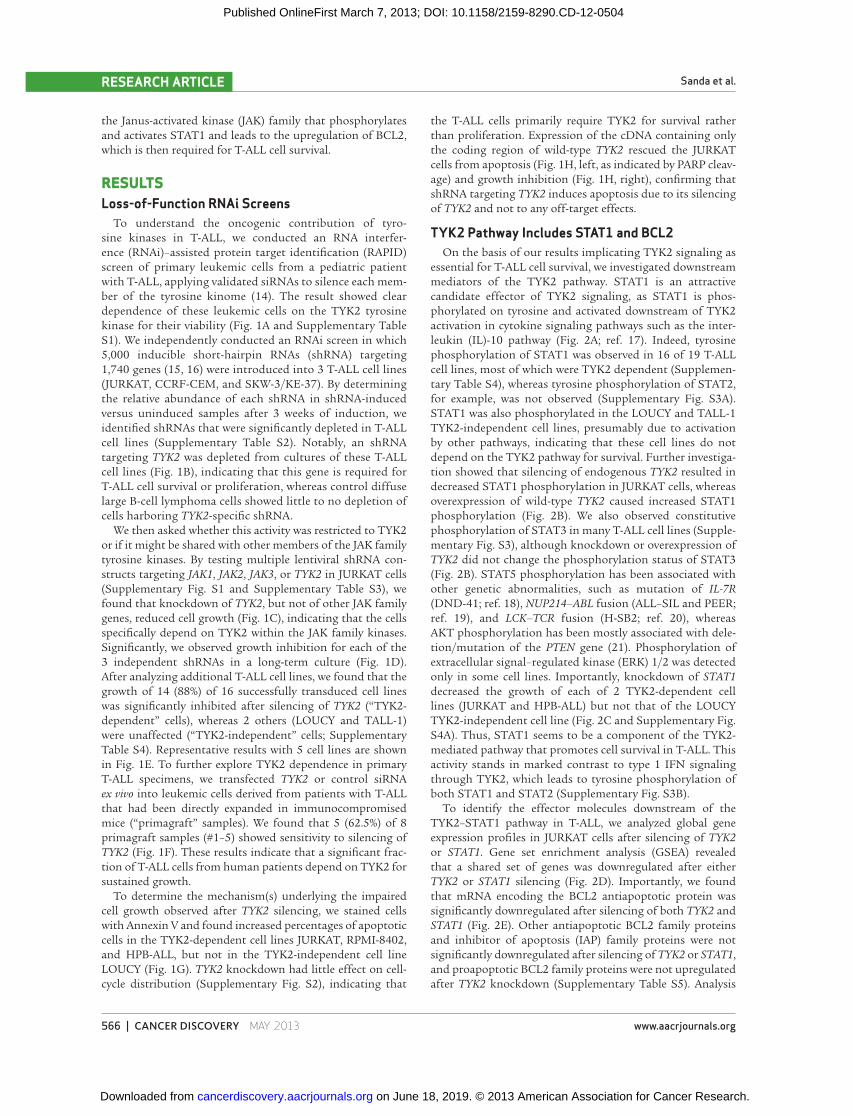
rant TYK2 activation in some T-ALL cell lines; however, many T-ALL samples that were TYK2 dependent lacked mutations within this gene, implicating an alternative mechanism(s) of kinase activation that drive pathway dependence. In the con-text of cytokine signaling, TYK2 is known to be activated by upstream receptors, including the type 1 IFN (IFNα/β), IL-6, IL-10, IL-11, IL-12, IL-23, and IL-27 receptors ( 17 , 26 ). Thus, we hypothesized that autocrine activation of one or more of these receptors might be responsible for activating the TYK2 pathway. Among the known cytokine pathways, autocrine IL-10 receptor signaling was an attractive possibility because IL-10 has been reported to increase BCL2 expression and cell survival in hematopoietic progenitor cells ( 27 ), primary T cells ( 28 ), and germinal center B-cells ( 29 ). To test this notion, we evaluated the effects on cell growth of shRNAs specifi c for the IL-10 and for IL-10 receptor genes (IL10RA and IL10RB ; Supplementary Fig. S4A), which are endogenously expressed in all cell lines examined (Supplementary Fig. S6A and S6B). In 2 T-ALL cell lines that are TYK2-dependent but lacking a mutation of the TYK2 gene (HPB-ALL and JURKAT), knock-down of IL10 , IL10RA , or IL10RB resulted in a reduction of cell growth ( Fig. 4A ) and the induction of apoptosis ( Fig. 4B ), coincident with downregulation of BCL2 expression ( Fig. 4C ), indicating that IL-10 signaling is required for T-ALL cell survival. Of note, knockdown of other cytokine receptor genes ( IFNAR1 , IFNAR2 , IL6ST , IL11RA , IL12RB1 , IL12RB2 , and IL27RA ) did not downregulate BCL2 expression in T-ALL cells (Supplementary Fig. S4B). IL6R and IL23R , which encode other cytokine receptors that can interact with TYK2, were not expressed in T-ALL cell lines.
Knockdown of the IL-10 receptor genes in these cell lines resulted in downregulation of STAT1 phosphorylation ( Fig. 4D ), indicating that the IL-10 receptor is required for activa-tion of the TYK2–STAT1 pathway. Treatment of these cell lines with an anti-IL-10–neutralizing antibody did not show any effects on cell growth (Supplementary Fig. S6C), suggest-ing that this pathway may be activated during intracellular traffi cking of the ligand and receptor. In contrast, little or no effect on cell growth or survival was observed when these shRNAs were introduced into the LOUCY TYK2-independ-ent cell line. In MOLT-4 cells that harbor an activating TYK2 mutation ( E957D ), knockdown of the IL-10 receptor genes resulted in lower levels of BCL2 and induced apoptosis, sug-gesting that the IL-10 receptor proteins may still be required as a scaffold when the TYK2 protein is mutationally activated.
on June 18, 2019. © 2013 American Association for Cancer Research. cancerdiscovery.aacrjournals.org Downloaded from
Published OnlineFirst March 7, 2013; DOI: 10.1158/2159-8290.CD-12-0504

570 | CANCER DISCOVERY�MAY 2013 www.aacrjournals.org
Sanda et al.RESEARCH ARTICLE
Pharmacologic Inhibition of TYK2 To assess the effi cacy of JAK inhibitors for impairing the
growth and viability of TYK2-dependent T-ALL cells, we chose 3 compounds (JAK inhibitor I, AG490, and CP-690550) with differing degrees of effi cacy against TYK2 compared with other JAK family members. JAK Inhibitor I has been shown to exhibit potent activity against all JAK family kinases, includ-
ing TYK2 ( 30 ). Indeed, Ba/F3 cells transformed by constitu-tively active JAK kinases ( TYK2-E957D , TEL-JAK1 , TEL-JAK2 , and TEL-JAK3 ) were consistently sensitive to this inhibitor compared with a negative control Ba/F3 cell line transformed by an alternative tyrosine kinase, TEL-ABL ( Fig. 5A ). Further use of JAK inhibitor I against T-ALL cell lines revealed that the TYK2-dependent cell lines were sensitive to this inhibitor,
N-lobe
a.a.
6 × 10⁷ pTYK2
TYK2
pSTAT1
pSTAT3
STAT1
STAT3
pSTAT5
pERK1/2
ERK1/2
pTYK2
TYK2
pSTAT1
STAT1
pSTAT3
STAT3
pSTAT5
STAT5
1
8
6
4
2
00 2 4 6 8
00
2 4 6 8 10 14 1612
2 3 4 5 6 7 8 Lane
β-Actin
β-Actin
STAT5
4 × 10⁷
2 × 10⁷
4.5 × 10⁷
3.0 × 10⁷
1.5 × 10⁷
00 5 10 15
FERM Pseudo-kinaseSH2 Kinase
G36
D26 431
450
529
589
866
897
1169
S47
N
R42
5H
V73
11
E95
7D
R10
27H
p-loop
Hinge
R1027H
Catalyticloop
C-lobe
M978F/YWT
WT
+ IL
-3
TY
K2
E95
7D
TY
K2
E95
7D/M
978Y
TY
K2
E95
7D/M
978F
WT
– IL
-3
G36
DS
47N
V73
1IE
957D
R10
27H
V67
8F
G36D
Vector
TYK2 WT
TYK2 E957D
TYK2 E957D
TYK2 E957D/M978Y
TYK2 E957D/M978F
S47NR425HV731TE957DR1027H
E957D
A-loop
Tota
l via
ble
cells
Days after IL-3 withdrawal
Days after IL-3 withdrawalDays in culture
Tota
l via
ble
cells
(fol
d ch
ange
from
day
2)
Tota
l via
ble
cells
α C-Helix
A
B C D
E F G
Figure 3. Activating mutations of the TYK2 gene in T-ALL. A, diagram of TYK2 functional domains with locations of point mutations (arrows) that were identifi ed in T-ALL specimens. Amino acid (a.a.) positions are indicated. B, crystal structure of TYK2 depicting the positions of 2 of the tumor-associated, activating mutations ( E957D and R1027H ) within the TYK2 kinase domain (red sphere). Also shown is the location of the M978 residue that impairs TYK2 kinase activity when mutated to tyrosine or phenylalanine (blue sphere). C, Ba/F3 cells infected with retrovirus expressing mutant or wild-type (WT) TYK2 cDNA were cultured in the absence of IL-3 for 16 days, with cell density measurements made daily. Total cell numbers, plotted as means ± SEM of triplicate experiments, are shown. D, Ba/F3 cells expressing WT TYK2 , different TYK2 mutants, or the positive control mutant TYK2-V678F , all in the absence of IL-3 or WT TYK2 in the presence of IL-3, were subjected to immunoblot analysis with antibodies specifi c for total or phospho-TYK2, STAT1, STAT3, STAT5, and ERK1/2 as well as β-actin (internal control). E, Ba/F3 cells expressing TYK2-E957D , TYK2-E957D/M978Y , or TYK2-E957D/M978F cDNA were cultured in the absence of IL-3 with cell density measurements made daily. Total cell numbers were plotted as the means ± SEM of triplicate experiments. F, single and double TYK2 mutants were transiently transfected into HEK293 cells, and whole-cell extracts were subjected to immunoblot analysis with antibodies specifi c for total and phospho-TYK2, STAT1, STAT3, and STAT5 as well as β-actin. G, murine bone marrow cells were infected with retrovirus-expressing empty vector, TYK2-WT , or TYK2-E957D cDNA. The infected cells were cocultured with OP9 DL1 cells in the presence of IL-7 and FLT3 ligand. Viable cells from these cultures were counted by propidium iodide exclusion, as were cells from wells containing only OP9 DL1 stromal cells (to establish a gate that excludes OP9 DL1 cells from the counts). Values are the mean fold changes ± SEM relative to day 2 ( n = 3).
on June 18, 2019. © 2013 American Association for Cancer Research. cancerdiscovery.aacrjournals.org Downloaded from
Published OnlineFirst March 7, 2013; DOI: 10.1158/2159-8290.CD-12-0504
MAY 2013�CANCER DISCOVERY | 571
Pathway Dependence in T-cell Acute Lymphoblastic Leukemia RESEARCH ARTICLE
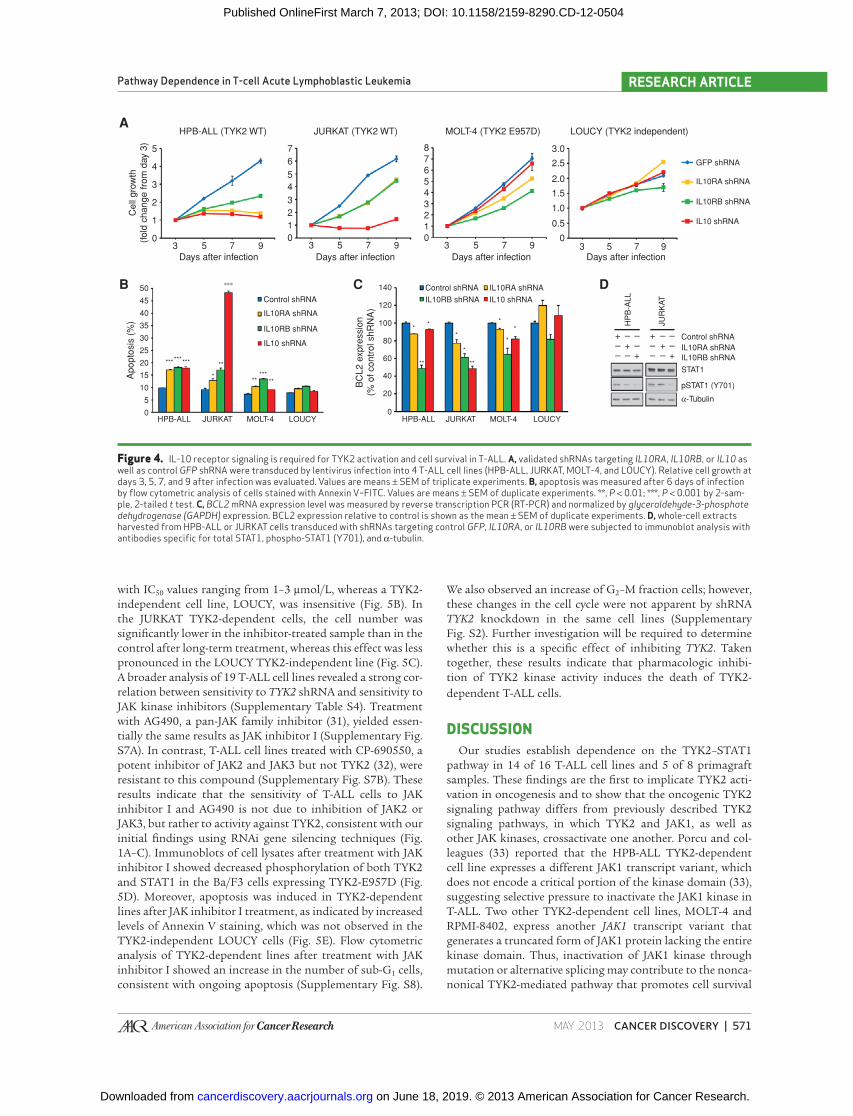
with IC 50 values ranging from 1–3 μmol/L, whereas a TYK2-independent cell line, LOUCY, was insensitive ( Fig. 5B ). In the JURKAT TYK2-dependent cells, the cell number was signifi cantly lower in the inhibitor-treated sample than in the control after long-term treatment, whereas this effect was less pronounced in the LOUCY TYK2-independent line ( Fig. 5C ). A broader analysis of 19 T-ALL cell lines revealed a strong cor-relation between sensitivity to TYK2 shRNA and sensitivity to JAK kinase inhibitors (Supplementary Table S4). Treatment with AG490, a pan-JAK family inhibitor ( 31 ), yielded essen-tially the same results as JAK inhibitor I (Supplementary Fig. S7A). In contrast, T-ALL cell lines treated with CP-690550, a potent inhibitor of JAK2 and JAK3 but not TYK2 ( 32 ), were resistant to this compound (Supplementary Fig. S7B). These results indicate that the sensitivity of T-ALL cells to JAK inhibitor I and AG490 is not due to inhibition of JAK2 or JAK3, but rather to activity against TYK2, consistent with our initial fi ndings using RNAi gene silencing techniques ( Fig. 1A–C ). Immunoblots of cell lysates after treatment with JAK inhibitor I showed decreased phosphorylation of both TYK2 and STAT1 in the Ba/F3 cells expressing TYK2-E957D ( Fig. 5D ). Moreover, apoptosis was induced in TYK2-dependent lines after JAK inhibitor I treatment, as indicated by increased levels of Annexin V staining, which was not observed in the TYK2-independent LOUCY cells ( Fig. 5E ). Flow cytometric analysis of TYK2-dependent lines after treatment with JAK inhibitor I showed an increase in the number of sub-G 1 cells, consistent with ongoing apoptosis (Supplementary Fig. S8).
We also observed an increase of G 2 –M fraction cells; however, these changes in the cell cycle were not apparent by shRNA TYK2 knockdown in the same cell lines (Supplementary Fig. S2). Further investigation will be required to determine whether this is a specifi c effect of inhibiting TYK2 . Taken together, these results indicate that pharmacologic inhibi-tion of TYK2 kinase activity induces the death of TYK2-dependent T-ALL cells.
DISCUSSION
Our studies establish dependence on the TYK2–STAT1 pathway in 14 of 16 T-ALL cell lines and 5 of 8 primagraft samples. These fi ndings are the fi rst to implicate TYK2 acti-vation in oncogenesis and to show that the oncogenic TYK2 signaling pathway differs from previously described TYK2 signaling pathways, in which TYK2 and JAK1, as well as other JAK kinases, crossactivate one another. Porcu and col-leagues ( 33 ) reported that the HPB-ALL TYK2-dependent cell line expresses a different JAK1 transcript variant, which does not encode a critical portion of the kinase domain ( 33 ), suggesting selective pressure to inactivate the JAK1 kinase in T-ALL. Two other TYK2-dependent cell lines, MOLT-4 and RPMI-8402, express another JAK1 transcript variant that generates a truncated form of JAK1 protein lacking the entire kinase domain. Thus, inactivation of JAK1 kinase through mutation or alternative splicing may contribute to the nonca-nonical TYK2-mediated pathway that promotes cell survival
Figure 4. IL-10 receptor signaling is required for TYK2 activation and cell survival in T-ALL. A, validated shRNAs targeting IL10RA , IL10RB , or IL10 as well as control GFP shRNA were transduced by lentivirus infection into 4 T-ALL cell lines (HPB-ALL, JURKAT, MOLT-4, and LOUCY). Relative cell growth at days 3, 5, 7, and 9 after infection was evaluated. Values are means ± SEM of triplicate experiments. B, apoptosis was measured after 6 days of infection by fl ow cytometric analysis of cells stained with Annexin V–FITC. Values are means ± SEM of duplicate experiments. **, P < 0.01; ***, P < 0.001 by 2-sam-ple, 2-tailed t test. C, BCL2 mRNA expression level was measured by reverse transcription PCR (RT-PCR) and normalized by glyceraldehyde-3-phosphate dehydrogenase (GAPDH) expression. BCL2 expression relative to control is shown as the mean ± SEM of duplicate experiments. D, whole-cell extracts harvested from HPB-ALL or JURKAT cells transduced with shRNAs targeting control GFP , IL10RA , or IL10RB were subjected to immunoblot analysis with antibodies specifi c for total STAT1, phospho-STAT1 (Y701), and α-tubulin.
HPB-ALL (TYK2 WT)
Days after infection
BC
L2 e
xpre
ssio
n(%
of c
ontr
ol s
hRN
A)
Apo
ptos
is (
%)
HPB-ALL JURKAT MOLT-4 LOUCY HPB-ALL JURKAT MOLT-4 LOUCY
Days after infection Days after infection Days after infection
GFP shRNA
IL10RA shRNA
IL10RB shRNA
IL10 shRNA
STAT1
pSTAT1 (Y701)
IL10RA shRNAControl shRNA
HP
B-A
LL
JUR
KAT
IL10RB shRNA
α-Tubulin
IL10RA shRNA
IL10RA shRNA
IL10RB shRNA
IL10RB shRNA
IL10 shRNA
IL10 shRNAControl shRNA
Control shRNA
JURKAT (TYK2 WT) MOLT-4 (TYK2 E957D) LOUCY (TYK2 independent)C
ell g
row
th(fo
ld c
hang
e fr
om d
ay 3
)5 7 8
765
6543210
43210
3 5 7 9 3 5 7 9 3
3.0
2.5
2.0
1.5
1.0
0.5
05 7 9
4
3
2
1
03 5
50 140
120
100
80
60
40
20
0
45
40
35
30
25
20
15
10
5
0
7 9
– –
– –
+ ––
––
––
++
++–– +
*** ******
***** **
∗∗∗
**
*
*
*
*
*
*
**
*
*
**
A
B C D
on June 18, 2019. © 2013 American Association for Cancer Research. cancerdiscovery.aacrjournals.org Downloaded from
Published OnlineFirst March 7, 2013; DOI: 10.1158/2159-8290.CD-12-0504

572 | CANCER DISCOVERY�MAY 2013 www.aacrjournals.org
Sanda et al.RESEARCH ARTICLE
100
75
50
25
0
120 12
10
8
6
4
2
00
20
15
10
5
0JURKAT
****
***
***
HPB-ALL LOUCY
TYK2dependent
TYK2independent
1 3 5 7
100
80
40
20
60
00 1 3
0 1 3
5 7
100
LOUCYTEL-ABL
TEL-JAK1
TEL-JAK3
TEL-JAK2
TYK2-E957D
JURKAT
MOLT-4
RPMI-8402
HPB-ALL
75
50
25
0
[JAK Inhibitor I] (nmol/L)
No treatment
[JAK inhibitor I] ( μmol/L)
JAK inhibitor I ( 3 μmol/L)
pTYK2
pSTAT1
PARP
1 3 Lane2
cleaved PARP
α-Tubulin
3 μmol/L 10 μmol/L
[JAK Inhibitor I] (nmol/L)
Days after treatment
Ba/F3 TYK2 E957D
Days after treatment
No treatment
JURKAT(TYK2 dependent)
LOUCY(TYK2 independent)
Cel
l via
bilit
y(%
of u
ntre
ated
cel
ls)
Cel
l via
bilit
y(%
of u
ntre
ated
cel
ls)
Cel
l num
ber
(fol
d ch
ange
from
day
0)
Apo
ptos
is (
%)
0 30 100
300
10,0
00
30,0
00
1,00
0
3,00
0 0 50 100
195
780
390
1,56
03,
125
6,25
012
,500
25,0
00
A B
C
D E
Figure 5. Activity of small-molecule inhibitors of TYK2 against transformed Ba/F3 and T-ALL cells. A, Ba/F3 cells transformed by TEL–ABL , TEL–JAK1 , TEL–JAK2 , TEL–JAK3 , or TYK2–E957D and cultured with graded concentrations of JAK Inhibitor I for 3 days. Cell viability values are means ± SEM percentage of the untreated control values in triplicate experiments. B, LOUCY, JURKAT, MOLT-4, HPB-ALL, and RPMI-8402 cells cultured with graded concentrations of JAK Inhibitor I for 3 days. Cell viability values are means ± SEM percentages of the untreated control in 6 experiments. C, JURKAT and LOUCY cells were cultured in the absence or presence of JAK inhibitor I (3 μmol/L) for 7 days. The cell number is shown as fold change from day 0 for each cell line (means ± SEM of duplicate experiments). D, Ba/F3 cells expressing TYK2-E957D cultured with graded concentrations of JAK inhibi-tor I and subjected to immunoblot analysis with antibodies specifi c for phospho-TYK2, phospho-STAT1, PARP, and α-tubulin. E, JURKAT, HPB-ALL, and LOUCY cells cultured with graded concentrations of JAK inhibitor I for 24 hours, and assessed for apoptosis by fl ow cytometric analysis after staining with Annexin V–FITC. Values are means ± SEM percentages for duplicate experiments. *, P < 0.05; ***, P < 0.001 by 2-sample, 2-tailed t test.
on June 18, 2019. © 2013 American Association for Cancer Research. cancerdiscovery.aacrjournals.org Downloaded from
Published OnlineFirst March 7, 2013; DOI: 10.1158/2159-8290.CD-12-0504

MAY 2013�CANCER DISCOVERY | 573
Pathway Dependence in T-cell Acute Lymphoblastic Leukemia RESEARCH ARTICLE
in T-ALL. Alternatively, activating mutations of JAK1 have also been observed in some cases of T-ALL, mostly in adult patients—1 of 49 (2%; ref. 34 ), 4 of 108 (4%; ref. 35 ), 8 of 38 (21%; ref. 34 ), and 3 of 11 (27%; ref. 36 ). Hence, although acti-vated JAK1 may contribute to T-ALL pathogenesis in some cases, in other T-ALL cases dependent on TYK2 signaling for cell survival, there seems to be concomitant selective pressure to inactivate signaling molecules downstream of JAK1.
We found that the TYK2–STAT1 pathway positively regu-lates BCL2 expression in T-ALL cells, contributing to aber-rant cell survival. It has been reported that mitochondria from chemosensitive cancer cells such as ALL are consistently more “primed,” so that the cells are more prone to undergo apoptosis than are those from normal tissues ( 37 ). Leukemia cells require BCL2 in addition to other antiapoptotic BCL2 family members to sequester proapoptotic proteins such as BIM, indicating that inhibition of BCL2 protein is a useful strategy to induce apoptosis in already “primed” leukemia cells. The fact that the ABT-737 BCL2 antagonist induces apoptosis in BCL2 -overexpressing chronic lymphoid leuke-mia cells ( 38 ) supports this fi nding. Our results are consist-ent with the dependence of T-ALL cells that are “primed” to undergo apoptosis on upregulated levels of BCL2 expression induced by TYK2, and this model explains why the T-ALL cells die when TYK2 is silenced and BCL2 levels fall. BCL2 is normally not detectable in immature thymocytes in the thymic cortex but is markedly upregulated in more mature single-positive T-cells that migrate into the thymic medulla ( 12 , 39 ), thereby enabling functionally selected thymocytes to survive. This antiapoptotic protein is also frequently over-expressed in T-ALL as well as in T-cell lymphoblastic lym-phoma (T-LBL), a distinct clinical presentation of thymocyte malignancy ( 39 ). Of note, in Tyk2 knockout mice ( 40 ), blood cell counts, thymic morphology, and size are all normal ( 41 ), and there is no difference in BCL2 protein expression in the thymus between Tyk2 knockout and wild-type mice (Supplementary Fig. S9). Thus, TYK2 is not required for the upregulation of BCL2 expression by normal medullary thymocytes, but its aberrant gain-of-function activity in immature double-positive T-ALL/T-LBL cells can neverthe-less promote BCL2 overexpression and aberrant cell survival, leading to clonal expansion of fully transformed leukemic lymphoblasts.
Our work indicates that in a subset of T-ALLs lacking TYK2 -activating mutations, the TYK2 prosurvival pathway could be activated downstream of autocrine activation of IL-10 and its receptors. IL-10 is a multifunctional cytokine with pleiotropic effects on different hematopoietic cell types ( 42 ). IL-10 signaling is primarily involved in limiting or termi-nating infl ammatory responses, at least in part, by promoting the activity of regulatory T-cells. In other contexts, IL-10 has been shown to enhance the survival of hematopoietic stem cells, B-cells, T-cells, and tumor cells ( 27–29 ) through its abil-ity to upregulate BCL2. The IL-10 ligand–receptor interaction normally engages both JAK1 and TYK2, which are constitu-tively associated with IL-10RA and IL-10RB, respectively. In T-ALLs that depend on TYK2 activity for cell survival, we determined that JAK1 activity is not required ( Fig. 1A–C ), and in some of these cases, JAK1 is actually inactivated by muta-tion or alternative splicing ( 33 ), suggesting a noncanonical
independent role for TYK2 in the aberrant survival of T-ALL cells.
We hypothesize that autocrine expression of IL-10 or, rarely, TYK2 -activating mutations is acquired during thymocyte transformation, presumably at the point when mitochondria have become “primed” due to cooperating oncogenic muta-tions so that the cells are prone to undergo apoptosis ( 37 ). Our study has identifi ed dependence on TYK2 kinase activity as a requirement for the survival of a substantial fraction of human T-ALL cell lines and primagraft T-ALL samples. This discovery adds a novel mechanism to the repertoire by which cancer cells block pathways leading to cell death in particular lineages. Indeed, the promotion of tumor cell survival is now an established step in the molecular pathogenesis of human cancers, including leukemias, which is distinct from changes leading to the initiation, repopulation, self-renewal, or prolif-eration of transformed cells. Unless apoptosis is blocked, and the emerging precancerous clone is able to survive, it will not be possible for the evolving malignant cells to select for addi-tional mutations and acquire a fully transformed phenotype.
Our study also shows that pharmacologic inhibition of TYK2 kinase activity induces the death of TYK2-dependent T-ALL cells, which, combined with TYK2 knockdown experi-ments, indicates dependence on the TYK2–STAT1 pathway. A clear implication of these results is that drugs able to potently inhibit TYK2 are likely to provide a therapeutic advantage in patients with T-ALL. A loss-of-function mutation in the TYK2 gene was identifi ed in a patient with hyperimmunoglobulin E syndrome ( 43 ), a primary immunodefi ciency characterized by elevated serum immunoglobulin E, which in this case was associated with an increased susceptibility to infection by various microorganisms. These fi ndings support the notion that TYK2 inhibition would not have a signifi cant effect on the development of normal T cells or these precursors or hematopoietic stem/progenitor cells, although it might cause susceptibility to viral infections after prolonged exposure. The only effective inhibitor of TYK2 that we have identifi ed is JAK inhibitor I, a “tool” compound that remains suboptimal for use in patients. Unfortunately, the JAK kinase inhibitors now in clinical use were developed against alternative JAK kinases, so they are not potent inhibitors of TYK2. Hence, there is a need to identify potent new drugs with tolerable side effects that could be used to target TYK2 in T-ALL cells dependent on this kinase.
METHODS
Collection of Primary T-ALL Specimen For RAPID assay, T-ALL diagnostic specimens were collected with
informed consent and Institutional Review Board (IRB) approval of Oregon Health & Science University (Portland, OR). Bone marrow cells from patients were separated on a Ficoll gradient, and mono-nuclear cells were treated with ammonium-chloride-potassium lysis buffer. For TYK2 genotyping, T-ALL diagnostic specimens were col-lected with informed consent and IRB approval of Dana-Farber Cancer Institute (Boston, MA; clinical trial 00–001) and Children’s Oncol-ogy Group (Boston, MA; clinical trial 9404; Clinicaltrials.gov identi-fi er: NCT00165178). For the primagraft experiment, diagnostic T-ALL patient samples were obtained with informed consent and IRB approval of Dana-Farber Cancer Institute study 05-01, BC Cancer Agency (BCCA; British Columbia, Canada) study H06-00028, and were used with
on June 18, 2019. © 2013 American Association for Cancer Research. cancerdiscovery.aacrjournals.org Downloaded from
Published OnlineFirst March 7, 2013; DOI: 10.1158/2159-8290.CD-12-0504

574 | CANCER DISCOVERY�MAY 2013 www.aacrjournals.org
Sanda et al.RESEARCH ARTICLE
IRB approvals by the University of California, San Diego (UCSD; San Diego, CA) Human Research Protections Program and BCCA.
Primagrafts Mouse studies were carried out in strict accordance with the rec-
ommendations of the Institutional Animal Care and Use Committee, and the protocols were approved by the Committee at the UCSD (Protocol S06015) and the University of British Columbia (Proto-col A09-0771). T-ALL diagnostic specimens were transplanted into Rag2 −/− γc −/− or nonobese diabetic (NOD)/Scid/ Il2rg −/− (NSG) mice to propagate the cells as “primagrafts.” Mononuclear cells were puri-fi ed by Ficoll-Hypaque centrifugation before fl uorescence-activated cell sorting (FACS) analysis and viable cryopreservation in liquid nitrogen. Approximately 50,000 human CD34+ cells selected from above T-ALL samples with the aid of FACSAria II (BD Biosciences) or immunomagnetic beads (Miltenyi Biotec) were transplanted intra-hepatically into Rag2 −/− γc −/− neonatal mice within 48 hours of birth. Mice were sacrifi ced at 8 weeks after transplantation. Bone marrow, spleen, thymus, liver, and peripheral blood were collected for FACS analysis of human CD45, CD34, CD2, and CD7 expression. Serial transplantation was done by intrahepatically injecting 50,000 human CD34 + cells selected from the T-ALL primary engrafted bone marrow or thymus into the neonatal Rag2 −/− γc −/− mice to propagate the cells. NSG primagrafts performed at BCCA were carried out by injection of 1–2 × 10 6 unsorted patient bone marrow cells either intravenously (tail vein) or intrafemorally into sublethally irradiated adult recipient NSG mice. Human leukemia cells were harvested from bone marrow and spleen of morbid animals and characterized by FACS and/or TCRγ HDA clonality assay, as previously described ( 44 ).
Cell Culture All T-ALL cell lines were stocked in our laboratory and were
confi rmed by DNA fi ngerprinting using the PowerPlex 1.2 system (Promega) in January 2013. HEK293T and Ba/F3 cells were recently obtained from American Type Culture Collection. HEK293T17 cells were kindly provided by Dr. Richard Van Etten (Tufts-New England Medical Center, Boston, Massachusetts). Ba/F3 derivatives express-ing various oncogenic fusion kinases, namely, TEL–JAK1, TEL–JAK2, TEL–JAK3 and TEL–ABL, were obtained from Dr. Richard Moriggl and were described previously ( 45 ). T-ALL cells were maintained in “R10” (RPMI-1640 medium supplemented with 10% FBS, L -glutamine, and penicillin/streptomycin; Invitrogen. Ba/F3 cells were maintained in R10 supplemented with 15% WEHI -conditioned media. HEK293T17 cells were maintained in Dulbecco’s modifi ed Eagle’s medium supplemented with 10% FBS, L -glutamine, penicillin/streptomycin, and fungizone.
RNAi-Assisted Protein Target Identifi cation Screen The RAPID screen was conducted as previously described ( 14 , 46 ).
Briefl y, primary T-ALL cells (2.25 × 10 7 ) were washed in PBS (Inv-itrogen) and resuspended in 4.2 mL of siPORT buffer (Ambion). Cells were aliquoted at 42 μL per well onto a 96-well electropora-tor (Ambion) and 2 μL of siRNA at 20 μmol/L was added to each well (tyrosine kinase library purchased from Dharmacon/Thermo Fisher Scientifi c). Single and pooled nonspecifi c siRNA as well as siRNA against EPHA5 , EPHA6 , SRMS, AATK, LMTK3 , N-RAS , and K-RAS (all from Dharmacon) were added separately because they are not included in the tyrosine kinase library. Cells were electroporated at 1,110 V (equivalent of 150 V per well), 200 μsec, 2 pulses, and 50,000 cells per well were replated into triplicate plates containing 100 μL per well of culture media [RPMI-1640 supplemented with 20% FBS, L -glutamine, penicillin/streptomycin, fungizone, ×1 insulin-transferrin-sodium selenite (Invitrogen), and 10 −4 mol/L 2-mercaptoethanol (Sigma-Aldrich)]. For determina-tion of cell viability, cells were subjected to the CellTiter 96 AQ ueous
One solution cell proliferation assay (MTS; Promega). All values were normalized to the median value on the plate.
Inducible shRNA Screen The inducible shRNA screen was conducted as previously
described ( 15, 16 ). Briefl y, T-ALL cell lines were fi rst transduced with an ecotropic retrovirus receptor. The host cells were then transduced with the tetracycline repressor gene and separated into single clones. Ecotropic retrovirus library was made by cotransfec-tion of 1,000 retrovirus constructs into HEK293T cells with pHIT/EA6 × 3* and pHIT60 plasmids. Each T-ALL cell line was infected with each of 5 retrovirus pools (1,000 shRNAs/pool) separately in biologic quadruplicate, selected by puromycin, divided into 2 groups, and cultured with or without doxycycline for 3 weeks to induce shRNA. Genomic DNAs were then harvested and bar-code sequences amplifi ed by PCR. Samples from the shRNA-induced cells and the matched uninduced cells were labeled with Cy3 or Cy5, respectively, and hybridized onto the microarray chip for quantita-tion of their relative abundance in each population. P values were determined by paired t test and adjusted for multiple comparisons; shRNA depletion (uninduced/induced) was then calculated for each shRNA. The shRNAs that are signifi cantly depleted [adjusted P < 0.1, and shRNA depletion ≥0.585 (log2)] in T-ALL cell lines are selected (Supplementary Table S2).
Individual shRNA and siRNA Knockdown Analysis All shRNA constructs cloned into the lentiviral vector pLKO.1-
puro were obtained from the RNAi Consortium (Broad Institute, Cambridge, MA). Each construct was cotransfected into HEK293T cells with packaging plasmid delta 8.9 and envelope plasmid VSV-G using FuGENE 6 reagent (Roche). Supernatants containing the lentivirus were collected and fi ltered through a 0.45-μm cellulose acetate membrane fi lter. T-ALL cells were infected with lentivirus in the presence of polybrene (8 μg/mL) and HEPES (10 mmol/L) by centrifugation at 2,500 rpm for 1.5 hours at 30°C, and the infected cells were selected by puromycin for at least 36 hours. For siRNA primagraft studies, primagraft cells that were expanded in Rag2 −/− γc −/− or NSG mice and subsequently on OP9-DL1 or MS5-DL1 coculture were freshly harvested, washed with PBS, and incu-bated with nonspecifi c (control) or TYK2 siRNA in siPORT buffer (Ambion). Cells were electroporated at 200 V, 0.2 μsecs for 2 pulses, and then replated in culture media [RPMI-1640 supplemented with 20% FBS, L -glutamine, penicillin/streptomycin, fungizone, ×1 insulin-transferrin-sodium selenite (Invitrogen), and 10 −4 mol/L 2-mercaptoethanol (Sigma-Aldrich)].
Cell Viability, Apoptosis Assays, and Reagents For siRNA knockdown experiment, cells were subjected to the
CellTiter 96 AQ ueous One solution cell proliferation assay (Promega). All values were normalized to the mean of control siRNA cell viabil-ity values for each sample. For the shRNA knockdown experiment, cells were subjected to the CellTiter Glo assay (Promega). For drug treatment, cells were incubated in the presence of graded doses of JAK inhibitor I (EMD Biosciences) for 72 hours. The number of viable cells was determined with the CellTiter 96 AQ ueous One solu-tion cell proliferation assay. For determination of factor-independ-ent growth, Ba/F3 cells were washed 3 times in R10, and 1 million cells were seeded into triplicate fl asks in 2 mL of R10. Total viable cells were determined every day for 16 days using propidium iodide exclusion on a Guava cell counter (Guava Technologies). To analyze apoptosis, we washed the cells with PBS, incubated them in stain-ing buffer containing fl uorescein isothiocynate (FITC)-conjugated anti–Annexin V antibody (MBL International), and analyzed them by BD FACSCalibur (BD Biosciences). For the rescue study, we used a PE-conjugated Annexin V antibody (MBL International) because
on June 18, 2019. © 2013 American Association for Cancer Research. cancerdiscovery.aacrjournals.org Downloaded from
Published OnlineFirst March 7, 2013; DOI: 10.1158/2159-8290.CD-12-0504

MAY 2013�CANCER DISCOVERY | 575
Pathway Dependence in T-cell Acute Lymphoblastic Leukemia RESEARCH ARTICLE
the cells had been transduced with GFP as a selection marker for generation of a cell line that overexpresses TYK2 .
Immunoblotting T-ALL cell lines were lysed in radioimmunoprecipitation assay
buffer [50 mmol/L Tris (Ph 8.0), 10 mmol/L EDTA, 150 mmol/L NaCl, 0.5% deoxycholic acid, 0.1% SDS, 1% NP-40] with phosphatase inhibitors (1 mmol/L sodium pyrophosphate, 1 mmol/L sodium orthovanadate) and protease inhibitors [protease inhibitor cocktail (Roche) and 1 mmol/L phenylmethylsulfonylfl uoride]. Ba/F3 and HEK293T17 cells were lysed in ×1 lysis buffer (Cell Signaling Tech). Equivalent amounts of protein were diluted in sample buffer (75 mmol/L Tris pH 6.8, 3% SDS, 15% glycerol, 8% 2-mercaptoethanol, 0.1% bromophenol blue) and separated by SDS-PAGE. Proteins were transferred to polyvinylidene difl uoride membranes (Millipore) and subjected to immunoblot analysis with antibodies specifi c for TYK2, phospho-TYK2 (Y1054/1055), STAT1, phospho-STAT1 (Y701), STAT3, phospho-STAT3 (Y705), STAT5, phospho-STAT5 (Y694), ERK1/2, phospho-ERK1/2 (T202/Y204), PARP, α-tubulin (Cell Sign-aling Tech), or β-actin (Millipore).
Microarray Gene Expression Analysis and Gene Set Enrichment Analysis
JURKAT cells were transduced with control shRNA or shRNA tar-geting TYK2 or STAT1 in biologic duplicate. Total RNA was harvested by TRIzol followed by a column purifi cation using the RNeasy Mini kit (Qiagen). A total of 12 RNA samples (4 controls, 4 TYK2 knock-down, 4 STAT1 knockdown) were used for microarray expression analysis. Genome-wide RNA expression analysis was conducted by HG U133 plus 2.0 microarray chip (Affymetrix) at the Dana-Farber Cancer Institute. Expression data can be found at http://www.ncbi.nlm.nih.gov/geo/ under accession number GSE44652. After normali-zation using dChip (Dana-Farber Cancer Institute; ref. 47 ), 30,988 probes with presence-call more than 33% (4/12 arrays) were fi ltered. The genes differentially expressed between 4 control and 4 knock-down samples were selected on the basis of a lower 90% confi dence bound of fold-change >1.4, P < 0.05 by 2-sample t test (two-tailed) and mean difference more than 50, by which the 90th percentile false discovery rates by 1,000 permutations were 1.1% (for TYK2 knock-down) and 1.9% (for STAT1 knockdown). GSEA (Broad Institute) was conducted by comparing 4 control samples with 4 knockdown samples. The genes that were signifi cantly downregulated upon TYK2 or STAT1 knockdown were defi ned as described above and used as gene sets.
Quantitative RT-PCR Analysis Total RNA from T-ALL cell lines was harvested by RNeasy (Qiagen)
after 3 days of shRNA lentivirus infection and transcribed to cDNA by Quantitect (Qiagen). Quantitative PCR analysis was conducted by AB 7300 system (Applied Biosystems) using Power SYBR Green PCR Master Mix (Applied Biosystems) and specifi c primers for each gene (Supplementary Table S8).
Cloning of Mutant STAT1 Construct and Rescue Study The retrovirus construct encoding the mutant STAT1α ( Y701F )
cDNA as well as GFP , pMSCV-NP-hSTAT1-Y701F-FLAG, was obtained from Dr. Richard Moriggl. In order not to be recognized by STAT1 shRNA #3 that targets the coding region of STAT1 , 3 point mutations (“wobble-base” mutations) were introduced with the Quikchange Lightning mutagenesis kit (Stratagene/Agilent Tech) using the following mutagenesis primers: forward, 5′-CGG ATA GTG GGC TCT GTA GAA TTT GAT AGC ATG ATG AAC ACA GTA GAC T-3′; reverse, 5′-AGT CTA CTG TGT TCA TCA TGC TAT CAA ATT CTA CAG AGC CCA CTA TCC G-3′. To make the wild-type
STAT1α construct with 3 wobble-base mutations, Y701F mutation was repaired using the following mutagenesis primers: forward, 5′-GGC CCT AAA GGA ACT GGA TAT ATC AAG ACT GAG TTG ATT-3′; reverse, 5′-AAT CAA CTC AGT CTT GAT ATA TCC AGT TCC TTT AGG GCC-3′. Each construct was cotransfected into HEK293T cells with packaging plasmid pMD-MLV and envelope plasmid VSV-G using FuGENE 6 reagent (Roche). Supernatants containing the retrovirus were collected and fi ltered through a 0.45-μm cellulose acetate membrane fi lter. T-ALL cells were then infected with retrovirus in the presence of polybrene (8 μg/mL) and HEPES (10 mmol/L) by centrifugation at 2,500 rpm for 1.5 hours at 30°C. GFP-positive cells were sorted by FACSAria (BD Biosciences), and the single clone that expresses the same amount of exogenous STAT1α protein as the endogenous one was selected and infected with lentivirus encoding STAT1 shRNA #3.
Cloning of Mutant TYK2 Genes and Creation of Stable Ba/F3 Clones
For cloning of TYK2 , cDNA was purchased from Origene and cloned into the EcoRI site of MSCV-IRES-GFP (MIG). Point mutations were introduced with the Quikchange XL-II mutagenesis kit (Strata-gene/Agilent Tech). Retrovirus expressing TYK2-WT, TYK2-V15A, TYK2-G36D, TYK2-S47N, TYK2R-425H, TYK2-V731I, TYK2-E957D, TYK2-R1027H, TYK2-E957D/M978Y, or TYK2-E957D/M978F was propagated in HEK293T17 cells by cotransfection of each respec-tive TYK2 construct with the EcoPak plasmid (kindly provided by Dr. Richard Van Etten) using FUGENE 6 (Roche). One milliliter of viral supernatant was mixed with polybrene (5 μg/mL), HEPES (7.5 mmol/L), and 1 × 10 6 Ba/F3 cells and placed in a centrifuge at 2,500 rpm for 1.5 hours at 30°C. GFP-positive cells were sorted on a FACSAria (BD Biosciences) after 48 hours of infection.
Transient TYK2 Expression in HEK293T17 Cells Constructs (MSCV-IRES-GFP) expressing TYK2-E957D, TYK2-
E957D/M978Y, or TYK2-E957D/M978F were transfected into HEK293T17 cells using FUGENE 6 (Roche). After 48 hours, cells were lysed and whole-cell extracts were subjected to immunoblot analysis as described above.
Primary T-lineage Outgrowth Assay Murine bone marrow cells were harvested from 6-week-old C57BL/6
mice (The Jackson Laboratory) and infected with 2 rounds of MIG retrovirus expressing empty vector, TYK2-WT , or TYK2-E957D as previ-ously described ( 48 ). GFP-positive cells were sorted on a FACSAria (BD Biosciences) and plated into triplicate wells of 24-well plates (10 5 cells per well) that had been seeded with OP9-DL1 cells (kindly provided by Dr. Juan-Carlos Zúñiga-Pfl ücker, University of Toronto, Sunnybrook Research Institute, Toronto, Ontario, Canada). Cells were cocultured in α-minimum essential media supplemented with 20% FBS, L -glutamine, penicillin/streptomycin, IL-7 (10 ng/mL), and FLT3 ligand (10 ng/mL; Peprotech). Viable cells from each well were counted every 2 days by PI exclusion on a Guava cell counter. Wells containing only OP9-DL1 cells without bone marrow cells were also counted, and these numbers were subtracted from total viable cells in coculture wells (most OP9-DL1 cells could be gated out by forward scatter). All numbers were normal-ized to the cell counts obtained after 2 days of culture to control for minor differences in seeding density of cells. At the end of the experi-ment, outgrowth cells were stained with an antibody specifi c for CD3 (BD Biosciences) and analyzed on a FACSAria (BD Biosciences).
Sequencing Analyses Genomic DNA from patient samples and cell lines was prepared
by DNeasy (Qiagen) and used to sequence the TYK2 gene (Genewiz) using previously described primers ( 49 ).
on June 18, 2019. © 2013 American Association for Cancer Research. cancerdiscovery.aacrjournals.org Downloaded from
Published OnlineFirst March 7, 2013; DOI: 10.1158/2159-8290.CD-12-0504

576 | CANCER DISCOVERY�MAY 2013 www.aacrjournals.org
Sanda et al.RESEARCH ARTICLE
Statistical Analyses For RAPID functional screens, we calculated the mean cell viability
for all data points. Values that were greater than 2 SDs from the mean were considered signifi cant. For cell proliferation and viability assays, a difference in treatment, dose, or time point compared with the relevant control treatment or the no-drug control was determined by analysis with a Student t test. IC 50 values with a small-molecule inhibitor for each cell line were calculated by nonlinear regression using GraphPad Prism software.
Disclosure of Potential Confl icts of Interest A.G. Fleischman has received honoraria for serving on the speak-
ers’ bureau for Incyte. No potential confl icts of interest were dis-closed by the other authors .
Authors’ Contributions Conception and design: T. Sanda, J.W. Tyner, A. Gutierrez, N.S. Gray, L.M. Staudt, B.J. Druker, A.T. Look Development of methodology: T. Sanda, J.W. Tyner, V.N. Ngo, Y. Yang, L.M. Staudt Acquisition of data (provided animals, acquired and managed patients, provided facilities, etc.): J.W. Tyner, A. Gutierrez, J. Glover, B.H. Chang, A. Yost, A.G. Fleischman, W. Zhou, Y. Ahn, J. Tatarek, M. Kelliher, R.L. Levine, R. Moriggl, M. Muller, C.H.M. Jamieson, A.P. Weng, L.M. Staudt Analysis and interpretation of data (e.g., statistical analysis, biosta-tistics, computational analysis): T. Sanda, J.W. Tyner, A. Gutierrez,J. Glover, D. Neuberg, R. Moriggl, M. Muller, C.H.M. Jamieson, L.M. Staudt, B.J. Druker Writing, review, and/or revision of the manuscript: T. Sanda, J.W. Tyner, J. Glover, B.H. Chang, A.G. Fleischman, M. Kleppe, D. Neuberg, R. Moriggl, M. Muller, N.S. Gray, C.H.M. Jamieson, L.M. Staudt, B.J. Druker, A.T. Look Administrative, technical, or material support (i.e., reporting or organizing data, constructing databases): J.W. Tyner, W. Ma, B.J. Druker Study supervision: N.S. Gray, L.M. Staudt, B.J. Druker, A.T. Look
Acknowledgments The authors thank the children with T-ALL and their families;
Drs. Stuart S. Winter, Richard S. Larson, Stephen Hunger, Lewis B. Silverman, and Stephen E. Sallan; and members of the Oregon Health & Science University, Children’s Oncology Group, and Dana-Farber Cancer Institute Acute Lymphoblastic Leukemia Consortium, for the samples analyzed in these studies. The authors also thank the RNAi Consortium for providing lentivirus shRNA constructs; Dr. V. Penard-Lacronique for providing us with the TEL-fusion constructs used in the Ba/F3 cell experiments, Dr. Dong-Er Zhang for suggesting the possibil-ity of TYK2 activation by autocrine signaling; and Mr. John R. Gilbert for critical review of the manuscript and helpful editorial suggestions.
Grant Support This work was supported in part by the William Lawrence and
Blanche Hughes Fund, the Leukemia & Lymphoma Society, and the Intramural Research Program of the NIH, National Cancer Institute, Center for Cancer Research. J.W. Tyner is supported by grants from the National Cancer Institute (4R00CA151457-03) and the Oregon Clini-cal and Translational Research Institute (OCTRI), grant number UL1 RR024140 from the National Center for Research Resources (NRCC), a component of the NIH, and the NIH Roadmap for Medical Research. T. Sanda is supported by NIH grant NCI 1K99CA157951, Children’s Leukemia Research Association, and the Japan Society for the Promotion of Science. A. Gutierrez is supported by NIH grant NCI 1K08CA133103 and is a scholar of the American Society of Hematology–Amos Medi-
cal Faculty Development Program. B.H. Chang is supported by the Oregon Child Health Research Center and is a St. Baldrick’s Scholar. R. Moriggl and M. Müller are supported by grant SFB F28 of the Aus-trian Science Fund FWF. A.T. Look and D.S. Neuberg are supported by NCI grants 5P01CA109901 and NCI 5P01CA68484, and A.T. Look is supported by an Alex’s Lemonade Stand Foundation Bridge grant. B.J. Druker is an investigator of the Howard Hughes Medical Institute and principal investigator of the OHSU cancer center support grant 5P30CA069533. M. Kleppe is supported by the European Molecular Biology Organization (EMBO) long-term fellowship. R.L. Levine is a Scholar of the Leukemia and Lymphoma Society. A. Yost and A.P. Weng are supported by a CIHR/Terry Fox Foundation program project grant. W. Ma and C.H.M. Jamieson are supported by the California Institute for Regenerative Medicine (CIRM) grants (TR21789; RN2-00910-1; DR1-01430) as well as the Leichtag Family Foundation and the Ratner Family Foundation.
Received November 1, 2012; revised February 26, 2013; accepted February 27, 2013; published OnlineFirst March 7, 2013.
REFERENCES 1. Krause DS , Van Etten RA . Tyrosine kinases as targets for cancer
therapy . N Engl J Med 2005 ; 353 : 172 – 87 . 2. Druker BJ , Guilhot F , O’Brien SG , Gathmann I , Kantarjian H , Gat-
termann N , et al. Five-year follow-up of patients receiving imatinib for chronic myeloid leukemia . N Engl J Med 2006 ; 355 : 2408 – 17 .
3. Lynch TJ , Bell DW , Sordella R , Gurubhagavatula S , Okimoto RA , Brannigan BW , et al. Activating mutations in the epidermal growth factor receptor underlying responsiveness of non-small-cell lung can-cer to gefi tinib . N Engl J Med 2004 ; 350 : 2129 – 39 .
4. Paez JG , Janne PA , Lee JC , Tracy S , Greulich H , Gabriel S , et al. EGFR mutations in lung cancer: correlation with clinical response to gefi t-inib therapy . Science 2004 ; 304 : 1497 – 500 .
5. Smith BD , Levis M , Beran M , Giles F , Kantarjian H , Berg K , et al. Single-agent CEP-701, a novel FLT3 inhibitor, shows biologic and clinical activity in patients with relapsed or refractory acute myeloid leukemia . Blood 2004 ; 103 : 3669 – 76 .
6. Goldberg JM , Silverman LB , Levy DE , Dalton VK , Gelber RD , Leh-mann L , et al. Childhood T-cell acute lymphoblastic leukemia: the Dana-Farber Cancer Institute Acute Lymphoblastic Leukemia Con-sortium experience . J Clin Oncol 2003 ; 21 : 3616 – 22 .
7. Marks DI , Paietta EM , Moorman AV , Richards SM , Buck G , DeWald G , et al. T-cell acute lymphoblastic leukemia in adults: clinical features, immu-nophenotype, cytogenetics, and outcome from the large randomized prospective trial (UKALL XII/ECOG 2993) . Blood 2009 ; 114 : 5136 – 45 .
8. Aifantis I , Raetz E , Buonamici S . Molecular pathogenesis of T-cell leukaemia and lymphoma . Nat Rev Immunol 2008 ; 8 : 380 – 90 .
9. Armstrong SA , Look AT . Molecular genetics of acute lymphoblastic leukemia . J Clin Oncol 2005 ; 23 : 6306 – 15 .
10. Weng AP , Ferrando AA , Lee W , Morris JPt , Silverman LB , Sanchez-Irizarry C , et al. Activating mutations of NOTCH1 in human T cell acute lymphoblastic leukemia . Science 2004 ; 306 : 269 – 71 .
11. O’Neil J , Tchinda J , Gutierrez A , Moreau L , Maser RS , Wong KK , et al. Alu elements mediate MYB gene tandem duplication in human T-ALL . J Exp Med 2007 ; 204 : 3059 – 66 .
12. Sentman CL , Shutter JR , Hockenbery D , Kanagawa O , Korsmeyer SJ . bcl-2 inhibits multiple forms of apoptosis but not negative selection in thymocytes . Cell 1991 ; 67 : 879 – 88 .
13. Strasser A . The role of BH3-only proteins in the immune system . Nat Rev Immunol 2005 ; 5 : 189 – 200 .
14. Tyner JW , Deininger MW , Loriaux MM , Chang BH , Gotlib JR , Willis SG , et al. RNAi screen for rapid therapeutic target identifi cation in leukemia patients . Proc Natl Acad Sci U S A 2009 ; 106 : 8695 – 700 .
15. Ngo VN , Davis RE , Lamy L , Yu X , Zhao H , Lenz G , et al. A loss-of-function RNA interference screen for molecular targets in cancer . Nature 2006 ; 441 : 106 – 10 .
on June 18, 2019. © 2013 American Association for Cancer Research. cancerdiscovery.aacrjournals.org Downloaded from
Published OnlineFirst March 7, 2013; DOI: 10.1158/2159-8290.CD-12-0504

MAY 2013�CANCER DISCOVERY | 577
Pathway Dependence in T-cell Acute Lymphoblastic Leukemia RESEARCH ARTICLE
16. Shaffer AL , Emre NC , Lamy L , Ngo VN , Wright G , Xiao W , et al. IRF4 addiction in multiple myeloma . Nature 2008 ; 454 : 226 – 31 .
17. Ghoreschi K , Laurence A , O’Shea JJ . Janus kinases in immune cell signaling . Immunol Rev 2009 ; 228 : 273 – 87 .
18. Porcu M , Kleppe M , Gianfelici V , Geerdens E , De Keersmaecker K , Tartaglia M , et al. Mutation of the receptor tyrosine phosphatase PTPRC (CD45) in T-cell acute lymphoblastic leukemia . Blood 2012 ; 119 : 4476 – 9 .
19. Quintas-Cardama A , Tong W , Manshouri T , Vega F , Lennon PA , Cools J , et al. Activity of tyrosine kinase inhibitors against human NUP214-ABL1-positive T cell malignancies . Leukemia 2008 ; 22 : 1117 – 24 .
20. Wright DD , Sefton BM , Kamps MP . Oncogenic activation of the Lck protein accompanies translocation of the LCK gene in the human HSB2 T-cell leukemia . Mol Cell Biol 1994 ; 14 : 2429 – 37 .
21. Gutierrez A , Sanda T , Grebliunaite R , Carracedo A , Salmena L , Ahn Y , et al. High frequency of PTEN, PI3K, and AKT abnormalities in T-cell acute lymphoblastic leukemia . Blood 2009 ; 114 : 647 – 50 .
22. NCBI Short Genetic Variations. Available from: http://www.ncbi.nlm.nih.gov/projects/SNP . [cited 2012 Dec 12].
23. 1000 Genomes [cited 2012 Dec 12]. Available at: http://browser.1000genomes.org .
24. Hu X , Herrero C , Li WP , Antoniv TT , Falck-Pedersen E , Koch AE , et al. Sensitization of IFN-gamma Jak-STAT signaling during macrophage activation . Nat Immunol 2002 ; 3 : 859 – 66 .
25. Shide K , Shimoda K , Kamezaki K , Kakumitsu H , Kumano T , Numata A , et al. Tyk2 mutation homologous to V617F Jak2 is not found in essential thrombocythaemia, although it induces constitutive signaling and growth factor independence . Leuk Res 2007 ; 31 : 1077 – 84 .
26. Ihle JN . The Janus protein tyrosine kinases in hematopoietic cytokine signaling . Semin Immunol 1995 ; 7 : 247 – 54 .
27. Weber-Nordt RM , Henschler R , Schott E , Wehinger J , Behringer D , Mertelsmann R , et al. Interleukin-10 increases Bcl-2 expression and survival in primary human CD34 +hematopoietic progenitor cells . Blood 1996 ; 88 : 2549 – 58 .
28. Cohen SB , Crawley JB , Kahan MC , Feldmann M , Foxwell BM . Inter-leukin-10 rescues T cells from apoptotic cell death: association with an upregulation of Bcl-2 . Immunology 1997 ; 92 : 1 – 5 .
29. Alas S , Bonavida B . Rituximab inactivates signal transducer and activation of transcription 3 (STAT3) activity in B-non-Hodgkin’s lymphoma through inhibition of the interleukin 10 autocrine/para-crine loop and results in down-regulation of Bcl-2 and sensitization to cytotoxic drugs . Cancer Res 2001 ; 61 : 5137 – 44 .
30. Thompson JE , Cubbon RM , Cummings RT , Wicker LS , Frankshun R , Cunningham BR , et al. Photochemical preparation of a pyridone con-taining tetracycle: a Jak protein kinase inhibitor . Bioorg Med Chem Lett 2002 ; 12 : 1219 – 23 .
31. Meydan N , Grunberger T , Dadi H , Shahar M , Arpaia E , Lapidot Z , et al. Inhibition of acute lymphoblastic leukaemia by a Jak-2 inhibitor . Nature 1996 ; 379 : 645 – 8 .
32. Karaman MW , Herrgard S , Treiber DK , Gallant P , Atteridge CE , Campbell BT , et al. A quantitative analysis of kinase inhibitor selectiv-ity . Nat Biotechnol 2008 ; 26 : 127 – 32 .
33. Porcu M , Gielen O , Cools J , De Keersmaecker K . JAK1 mutation anal-ysis in T-cell acute lymphoblastic leukemia cell lines . Haematologica 2009 ; 94 : 435 – 7 .
34. Flex E , Petrangeli V , Stella L , Chiaretti S , Hornakova T , Knoops L , et al. Somatically acquired JAK1 mutations in adult acute lymphob-lastic leukemia . J Exp Med 2008 ; 205 : 751 – 8 .
35. Asnafi V , Le Noir S , Lhermitte L , Gardin C , Legrand F , Vallantin X , et al. JAK1 mutations are not frequent events in adult T-ALL: a GRAALL study . Br J Haematol 2010 ; 148 : 178 – 9 .
36. Jeong EG , Kim MS , Nam HK , Min CK , Lee S , Chung YJ , et al. Somatic mutations of JAK1 and JAK3 in acute leukemias and solid cancers . Clin Cancer Res 2008 ; 14 : 3716 – 21 .
37. Ni Chonghaile T , Sarosiek KA , Vo TT , Ryan JA , Tammareddi A , Moore Vdel G , et al. Pretreatment mitochondrial priming correlates with clin-ical response to cytotoxic chemotherapy . Science 2011 ; 334 : 1129 – 33 .
38. Del Gaizo Moore V , Brown JR , Certo M , Love TM , Novina CD , Letai A . Chronic lymphocytic leukemia requires BCL2 to sequester prode-ath BIM, explaining sensitivity to BCL2 antagonist ABT-737 . J Clin Invest 2007 ; 117 : 112 – 21 .
39. Feng H , Stachura DL , White RM , Gutierrez A , Zhang L , Sanda T , et al. T-lymphoblastic lymphoma cells express high levels of BCL2, S1P1, and ICAM1, leading to a blockade of tumor cell intravasation . Cancer Cell 2010;18 : 353 – 66 .
40. Karaghiosoff M , Neubauer H , Lassnig C , Kovarik P , Schindler H , Pircher H , et al. Partial impairment of cytokine responses in Tyk2-defi cient mice . Immunity 2000 ; 13 : 549 – 60 .
41. German Mouse Clinic. Available at: http://www.mouseclinic.de/index.php?id =11119.
42. Moore KW , de Waal Malefyt R , Coffman RL , O’Garra A . Inter-leukin-10 and the interleukin-10 receptor . Annu Rev Immunol 2001 ; 19 : 683 – 765 .
43. Minegishi Y , Saito M , Morio T , Watanabe K , Agematsu K , Tsuchiya S , et al. Human tyrosine kinase 2 defi ciency reveals its requisite roles in multiple cytokine signals involved in innate and acquired immunity . Immunity 2006 ; 25 : 745 – 55 .
44. Medyouf H , Gao X , Armstrong F , Gusscott S , Liu Q , Gedman AL , et al. Acute T-cell leukemias remain dependent on Notch signaling despite PTEN and INK4A/ARF loss . Blood ; 115 : 1175 – 84 .
45. Lacronique V , Boureux A , Monni R , Dumon S , Mauchauffe M , Mayeux P , et al. Transforming properties of chimeric TEL-JAK pro-teins in Ba/F3 cells . Blood 2000 ; 95 : 2076 – 83 .
46. Tyner JW , Walters DK , Willis SG , Luttropp M , Oost J , Loriaux M , et al. RNAi screening of the tyrosine kinome identifi es therapeutic targets in acute myeloid leukemia . Blood 2008 ; 111 : 2238 – 45 .
47. Li C , Wong WH . Model-based analysis of oligonucleotide arrays: expression index computation and outlier detection . Proc Natl Acad Sci U S A 2001 ; 98 : 31 – 6 .
48. Bumm TG , Elsea C , Corbin AS , Loriaux M , Sherbenou D , Wood L , et al. Characterization of murine JAK2V617F-positive myeloprolifera-tive disease . Cancer Res 2006 ; 66 : 11156 – 65 .
49. Sjoblom T , Jones S , Wood LD , Parsons DW , Lin J , Barber TD , et al. The consensus coding sequences of human breast and colorectal cancers . Science 2006 ; 314 : 268 – 74 .
on June 18, 2019. © 2013 American Association for Cancer Research. cancerdiscovery.aacrjournals.org Downloaded from
Published OnlineFirst March 7, 2013; DOI: 10.1158/2159-8290.CD-12-0504

2013;3:564-577. Published OnlineFirst March 7, 2013.Cancer Discovery Takaomi Sanda, Jeffrey W. Tyner, Alejandro Gutierrez, et al. Lymphoblastic Leukemia
BCL2 Pathway Dependence in T-cell Acute−STAT1−TYK2
Updated version
10.1158/2159-8290.CD-12-0504doi:
Access the most recent version of this article at:
Material
Supplementary
http://cancerdiscovery.aacrjournals.org/content/suppl/2013/03/07/2159-8290.CD-12-0504.DC1
Access the most recent supplemental material at:
Cited articles
http://cancerdiscovery.aacrjournals.org/content/3/5/564.full#ref-list-1
This article cites 45 articles, 22 of which you can access for free at:
Citing articles
http://cancerdiscovery.aacrjournals.org/content/3/5/564.full#related-urls
This article has been cited by 14 HighWire-hosted articles. Access the articles at:
E-mail alerts related to this article or journal.Sign up to receive free email-alerts
Subscriptions
Reprints and
To order reprints of this article or to subscribe to the journal, contact the AACR Publications Department at
Permissions
Rightslink site. Click on "Request Permissions" which will take you to the Copyright Clearance Center's (CCC)
.http://cancerdiscovery.aacrjournals.org/content/3/5/564To request permission to re-use all or part of this article, use this link
on June 18, 2019. © 2013 American Association for Cancer Research. cancerdiscovery.aacrjournals.org Downloaded from
Published OnlineFirst March 7, 2013; DOI: 10.1158/2159-8290.CD-12-0504


![HISTOSEMINAIRE CARREFOUR PATHOLOGIE 2011 « PIEGES ET ... · [2] Masir N, Campbell LJ, Jones M, Mason DY. Pseudonegative BCL2 protein expression in Pseudonegative BCL2 protein expression](https://img.pdfslide.net/doc/110x75/5e12b339c8a2e1206c7dfe98/histoseminaire-carrefour-pathologie-2011-pieges-et-2-masir-n-campbell.jpg)


![[Notes]STAT1 - Elementary Statistics](https://img.pdfslide.net/doc/110x75/577cdbee1a28ab9e78a976c0/notesstat1-elementary-statistics.jpg)