Embed Size (px)
Citation preview
P1: ARK/dat P2: ARS/NBL/plb QC: NBL
July 2, 1998 2:12 Annual Reviews AR062-02
Annu. Rev. Astron. Astrophys. 1998. 36:17–55Copyright c© 1998 by Annual Reviews. All rights reserved
TYPE Ia SUPERNOVAEAND THE HUBBLE CONSTANT
David BranchDepartment of Physics and Astronomy, University of Oklahoma, Norman, Oklahoma73019; e-mail: [email protected]
KEY WORDS: cosmology, white dwarf
ABSTRACT
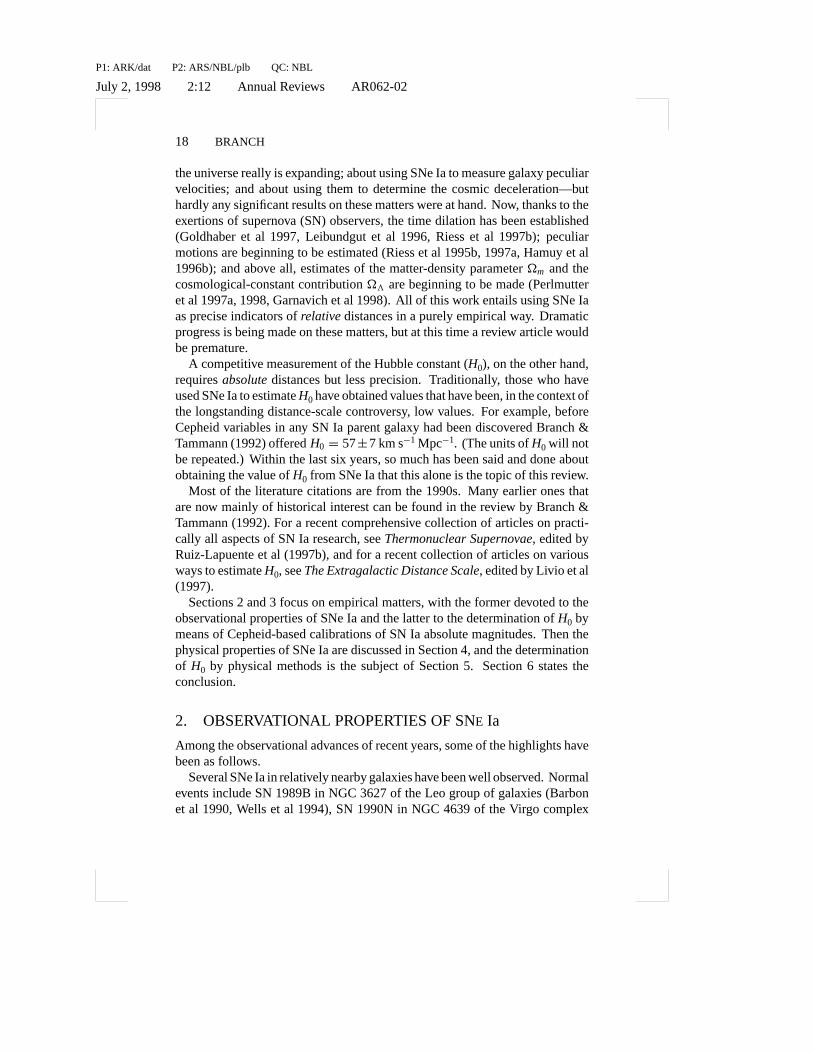
The focus of this review is the work that has been done during the 1990s on usingType Ia supernovae (SNe Ia) to measure the Hubble constant (H0). SNe Ia arewell suited for measuringH0. A straightforward maximum-light color criterioncan weed out the minority of observed events that are either intrinsically sublumi-nous or substantially extinguished by dust, leaving a majority subsample that hasobservational absolute-magnitude dispersions of less thanσobs(MB) ' σobs(MV)' 0.3 mag. Correlations between absolute magnitude and one or more distance-independent SN Ia or parent-galaxy observables can be used to further standard-ize the absolute magnitudes to better than 0.2 mag. The absolute magnitudescan be calibrated in two independent ways: empirically, using Cepheid-baseddistances to parent galaxies of SNe Ia, and physically, by light curve and spec-trum fitting. At present the empirical and physical calibrations are in agreementat MB ' MV ' −19.4 or−19.5. Various ways that have been used to matchCepheid-calibrated SNe Ia or physical models to SNe Ia that have been observedout in the Hubble flow have given values ofH0 distributed throughout the range of54–67 km s−1 Mpc−1. Astronomers who want a consensus value ofH0 from SNeIa with conservative errors could, for now, use 60± 10 km s−1 Mpc−1.
1. INTRODUCTION
One way to illustrate the rapid progress in using Type Ia supernovae (SNe Ia)for cosmology is to compare the situation now with that of six years ago whenthe article “Type Ia Supernovae as Standard Candles” (Branch & Tammann1992) appeared in this series of reviews. At that time, optimism was expressedabout checking that light curves of SNe Ia are time-dilated, as they should be if
170066-4146/98/0915-0017$08.00
P1: ARK/dat P2: ARS/NBL/plb QC: NBL
July 2, 1998 2:12 Annual Reviews AR062-02
18 BRANCH
the universe really is expanding; about using SNe Ia to measure galaxy peculiarvelocities; and about using them to determine the cosmic deceleration—buthardly any significant results on these matters were at hand. Now, thanks to theexertions of supernova (SN) observers, the time dilation has been established(Goldhaber et al 1997, Leibundgut et al 1996, Riess et al 1997b); peculiarmotions are beginning to be estimated (Riess et al 1995b, 1997a, Hamuy et al1996b); and above all, estimates of the matter-density parameterÄm and thecosmological-constant contributionÄ3 are beginning to be made (Perlmutteret al 1997a, 1998, Garnavich et al 1998). All of this work entails using SNe Iaas precise indicators ofrelativedistances in a purely empirical way. Dramaticprogress is being made on these matters, but at this time a review article wouldbe premature.
A competitive measurement of the Hubble constant (H0), on the other hand,requiresabsolutedistances but less precision. Traditionally, those who haveused SNe Ia to estimateH0 have obtained values that have been, in the context ofthe longstanding distance-scale controversy, low values. For example, beforeCepheid variables in any SN Ia parent galaxy had been discovered Branch &Tammann (1992) offeredH0 = 57±7 km s−1 Mpc−1. (The units ofH0 will notbe repeated.) Within the last six years, so much has been said and done aboutobtaining the value ofH0 from SNe Ia that this alone is the topic of this review.
Most of the literature citations are from the 1990s. Many earlier ones thatare now mainly of historical interest can be found in the review by Branch &Tammann (1992). For a recent comprehensive collection of articles on practi-cally all aspects of SN Ia research, seeThermonuclear Supernovae, edited byRuiz-Lapuente et al (1997b), and for a recent collection of articles on variousways to estimateH0, seeThe Extragalactic Distance Scale, edited by Livio et al(1997).
Sections 2 and 3 focus on empirical matters, with the former devoted to theobservational properties of SNe Ia and the latter to the determination ofH0 bymeans of Cepheid-based calibrations of SN Ia absolute magnitudes. Then thephysical properties of SNe Ia are discussed in Section 4, and the determinationof H0 by physical methods is the subject of Section 5. Section 6 states theconclusion.
2. OBSERVATIONAL PROPERTIES OF SNE Ia
Among the observational advances of recent years, some of the highlights havebeen as follows.
Several SNe Ia in relatively nearby galaxies have been well observed. Normalevents include SN 1989B in NGC 3627 of the Leo group of galaxies (Barbonet al 1990, Wells et al 1994), SN 1990N in NGC 4639 of the Virgo complex
P1: ARK/dat P2: ARS/NBL/plb QC: NBL
July 2, 1998 2:12 Annual Reviews AR062-02
SNE Ia AND THE HUBBLE CONSTANT 19
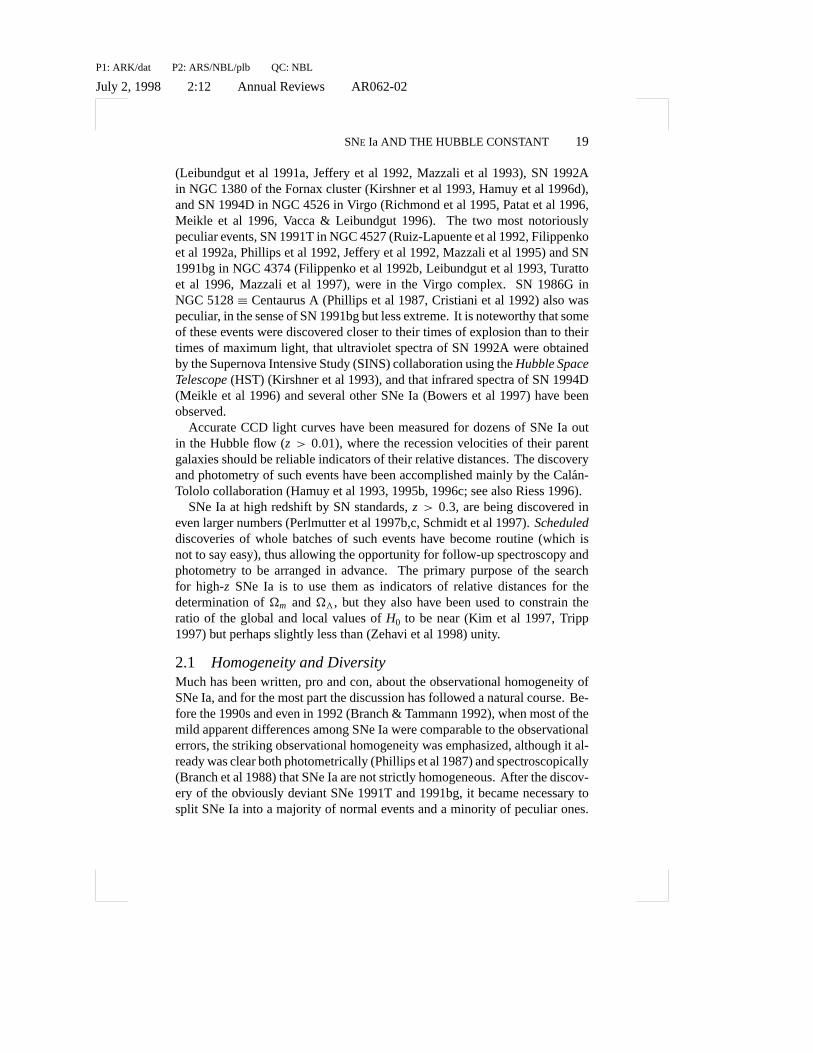
(Leibundgut et al 1991a, Jeffery et al 1992, Mazzali et al 1993), SN 1992Ain NGC 1380 of the Fornax cluster (Kirshner et al 1993, Hamuy et al 1996d),and SN 1994D in NGC 4526 in Virgo (Richmond et al 1995, Patat et al 1996,Meikle et al 1996, Vacca & Leibundgut 1996). The two most notoriouslypeculiar events, SN 1991T in NGC 4527 (Ruiz-Lapuente et al 1992, Filippenkoet al 1992a, Phillips et al 1992, Jeffery et al 1992, Mazzali et al 1995) and SN1991bg in NGC 4374 (Filippenko et al 1992b, Leibundgut et al 1993, Turattoet al 1996, Mazzali et al 1997), were in the Virgo complex. SN 1986G inNGC 5128≡ Centaurus A (Phillips et al 1987, Cristiani et al 1992) also waspeculiar, in the sense of SN 1991bg but less extreme. It is noteworthy that someof these events were discovered closer to their times of explosion than to theirtimes of maximum light, that ultraviolet spectra of SN 1992A were obtainedby the Supernova Intensive Study (SINS) collaboration using theHubble SpaceTelescope(HST) (Kirshner et al 1993), and that infrared spectra of SN 1994D(Meikle et al 1996) and several other SNe Ia (Bowers et al 1997) have beenobserved.
Accurate CCD light curves have been measured for dozens of SNe Ia outin the Hubble flow (z > 0.01), where the recession velocities of their parentgalaxies should be reliable indicators of their relative distances. The discoveryand photometry of such events have been accomplished mainly by the Cal´an-Tololo collaboration (Hamuy et al 1993, 1995b, 1996c; see also Riess 1996).
SNe Ia at high redshift by SN standards,z > 0.3, are being discovered ineven larger numbers (Perlmutter et al 1997b,c, Schmidt et al 1997).Scheduleddiscoveries of whole batches of such events have become routine (which isnot to say easy), thus allowing the opportunity for follow-up spectroscopy andphotometry to be arranged in advance. The primary purpose of the searchfor high-z SNe Ia is to use them as indicators of relative distances for thedetermination ofÄm andÄ3, but they also have been used to constrain theratio of the global and local values ofH0 to be near (Kim et al 1997, Tripp1997) but perhaps slightly less than (Zehavi et al 1998) unity.
2.1 Homogeneity and DiversityMuch has been written, pro and con, about the observational homogeneity ofSNe Ia, and for the most part the discussion has followed a natural course. Be-fore the 1990s and even in 1992 (Branch & Tammann 1992), when most of themild apparent differences among SNe Ia were comparable to the observationalerrors, the striking observational homogeneity was emphasized, although it al-ready was clear both photometrically (Phillips et al 1987) and spectroscopically(Branch et al 1988) that SNe Ia are not strictly homogeneous. After the discov-ery of the obviously deviant SNe 1991T and 1991bg, it became necessary tosplit SNe Ia into a majority of normal events and a minority of peculiar ones.

P1: ARK/dat P2: ARS/NBL/plb QC: NBL
July 2, 1998 2:12 Annual Reviews AR062-02
20 BRANCH
In the 1990s, the observational data have improved so much that it has becomepossible to look seriously at the diversity even among normal SNe Ia. Thishas brought about a natural new emphasis on the diversity—but it would be amistake to lose sight of the fact that even as the new data have illuminated thediversity, they also have confirmed thatnormal SNe Ia are highly homogeneous.When made in the context of using SNe Ia to determineH0, statements such as“SNe Ia are far from standard candles” and “the concept of a normal SN Ia iswithout merit” do more to obscure than to illuminate the reality.
It is clear and uncontroversial that events like SN 1991bg and to a lesserextent SN 1986G are “weak” explosions. They can be readily distinguishedfrom normal SNe Ia on the basis of practically any spectroscopic or photometricobservable, so although they are very interesting physically, they need haveno bearing on the determination ofH0. Even if these intrinsically red, dimevents did not exist, we would still have to deal with red, dim, extinguishedevents. Coping with events like SN 1991T is less straightforward, but they areuncommon and do not pose a serious problem forH0. In the rest of this sectionwe consider the distributions of various observational properties of SNe Ia, withsome emphasis on the extent to which the normal events are homogeneous anddiverse.
2.1.1 SPECTRA Observational aspects of SN spectra and their classificationhave been reviewed in this series by Filippenko (1997). Given a decent spec-trum, deciding whether an event is or is not a Type Ia is practically alwaysunambiguous (except at high redshift). Spectra of three normal SNe Ia andthe peculiar SNe 1991T, 1991bg, and 1986G, all near maximum light, are dis-played in theright panelof Figure 1 (see Section 4.4 for discussion of theleftpanel). Normal SNe Ia undergo a characteristic spectral evolution, showingP Cygni lines of Si II, Ca II, S II, O I, and Mg II prior to and near maximumlight, developing blends of P Cygni permitted Fe II lines shortly thereafter, andfinally developing blends of forbidden emission lines of iron and cobalt ionsduring the late nebular phase. The most conspicuous spectroscopic peculiarityof weak events like SNe 1991bg and 1986G during their photospheric phaseis that they show a broad absorption trough around 4200A, produced by low-excitation Ti II lines (Filippenko et al 1992a). In SN 1991T, prior to and aroundmaximum light, high-excitation lines of Fe III were prominent (Ruiz-Lapuenteet al 1992, Filippenko et al 1992b). By a few weeks after maximum light, thespectra of SN 1991T looked nearly normal.
Looking at line spectra is a good way to study diversity because the strengthsand blueshifts of the lines (in the SN rest frame) are not affected by extinctionor distance. In terms of the general appearance of their spectral features, mostSNe Ia look very similar. For a beautiful illustration of what is meant by SN Ia

P1: ARK/dat P2: ARS/NBL/plb QC: NBL
July 2, 1998 2:12 Annual Reviews AR062-02
SNE Ia AND THE HUBBLE CONSTANT 21
Figure 1 Nonlocal thermodynamic equilibrium (NLTE) spectra calculated for the compositionstructure of model W7, 15 days after explosion and a range of effective temperatures (left), andobserved spectra of SNe Ia near maximum light (right). From Nugent et al (1995c).
spectral homogeneity, see figure 6 of Filippenko (1997). Branch et al (1993)defined what they meant by spectroscopically normal (like SNe 1981B, 1989B,1992A, and 1972E) and peculiar (like SNe 1986G, or 1991bg, or 1991T) andthen found that 83 to 89% of the SNe Ia whose spectra they were able tosubclassify were normal. Subtle differences in the spectra of normal SNe Iawere nevertheless evident. As more SN Ia spectra have been published [G´omezet al (1996) set a record by presenting spectra of 27 different SNe Ia in onepaper], the situation has not changed: Most SNe Ia in the observational sampleare spectroscopically normal in the sense of Branch et al (1993).
Spectroscopic diversity can be quantified by measuring blueshifts of absorp-tion features or monochromatic flux ratios. Branch & van den Bergh (1993)compiled data on the wavelength of the absorption minimum near 6100Aduring the photospheric phase of 36 SNe Ia and converted to velocity on theassumption that the feature is produced by blueshiftedλ6355 of Si II. It should
P1: ARK/dat P2: ARS/NBL/plb QC: NBL
July 2, 1998 2:12 Annual Reviews AR062-02
22 BRANCH
be noted that Fisher et al (1997) suggested that in pre-maximum spectra, thisabsorption feature may be partially produced byλ6580 of C II; if this is cor-rect, then some of the velocities derived on the basis of the Si II identificationwill need to be revised. In any case the measured differences in the featurewavelength at a given phase exceed the observational uncertainties. Branch& van den Bergh (1993) defined a parameterV10(Si), the blueshift at 10 daysafter maximum light (late enough to be unaffected by C II). SNe Ia have 8,000< V10(Si) < 14,000 km s−1. Weak SNe Ia tend to have the very lowest values,but there also are definite differences among normal SNe Ia.
For a small sample of 12 SNe Ia, Fisher et al (1995) defined a parameterVR(Ca) that is based on the wavelength of the red edge of the Ca II H&Kabsorption feature at moderately late times and intended as a measure of theminimum ejection velocity of calcium. The weak SNe 1991bg and 1986G hadexceptionally lowVR(Ca) values, 1600 and 2700 km s−1, respectively, whilenormal SNe Ia had 4000<VR(Ca)<7300 km s−1. For a sample of 8 SNe Ia,Nugent et al (1995c) defined parameters R(Si), based on the relative depthsat maximum light of the Si II absorption features near 5800 and 6150A, andR(Ca), based on the relative heights of the emission peaks on both sides ofthe Ca II H&K absorption feature. Again, SN 1991bg and to a lesser extentSN 1986G had extreme values of both parameters, and clear differences wereobserved among the normal SNe Ia.
Thus, on the basis of the general appearance of their spectra, SNe Ia can bedivided into a majority of normals and a minority of peculiars. When spectralfeatures are quantified, peculiar weak events have extreme values of the param-eters. Moderate spectral diversity among normal SNe Ia also exists, and givengood data, it can be quantified in various ways.
2.1.2 LIGHT-CURVE SHAPES Like spectra, rest-frame light-curve shapes areindependent of distance and of extinction (to first order). And like SN Ia spectra,SN Ia light-curve shapes are impressively homogeneous (Hamuy et al 1991,Leibundgut et al 1991b, Branch & Tammann 1992). The first obviously deviantlight curves were those of SN 1986G (Phillips et al 1987), which was fast,and SN 1991bg (Filippenko et al 1992a, Leibundgut et al 1993), which wasfaster. Now that good photometry is available for numerous SNe Ia, moremoderate differences among light curves can be studied. The parameter thatmost often has been used to quantify light-curve shapes is1m15 (Phillips 1993),the magnitude decline in theB band during the first 15 days after maximumlight. Often, when the data for a direct measurement of1m15 are not available,a value is assigned by fitting the data to template light curves of SNe Ia havingvarious values of1m15. Hamuy et al (1996d) presented a set of six templatesin the B,V, and I bands, ranging from the rather slow light curves of SNe
P1: ARK/dat P2: ARS/NBL/plb QC: NBL
July 2, 1998 2:12 Annual Reviews AR062-02
SNE Ia AND THE HUBBLE CONSTANT 23
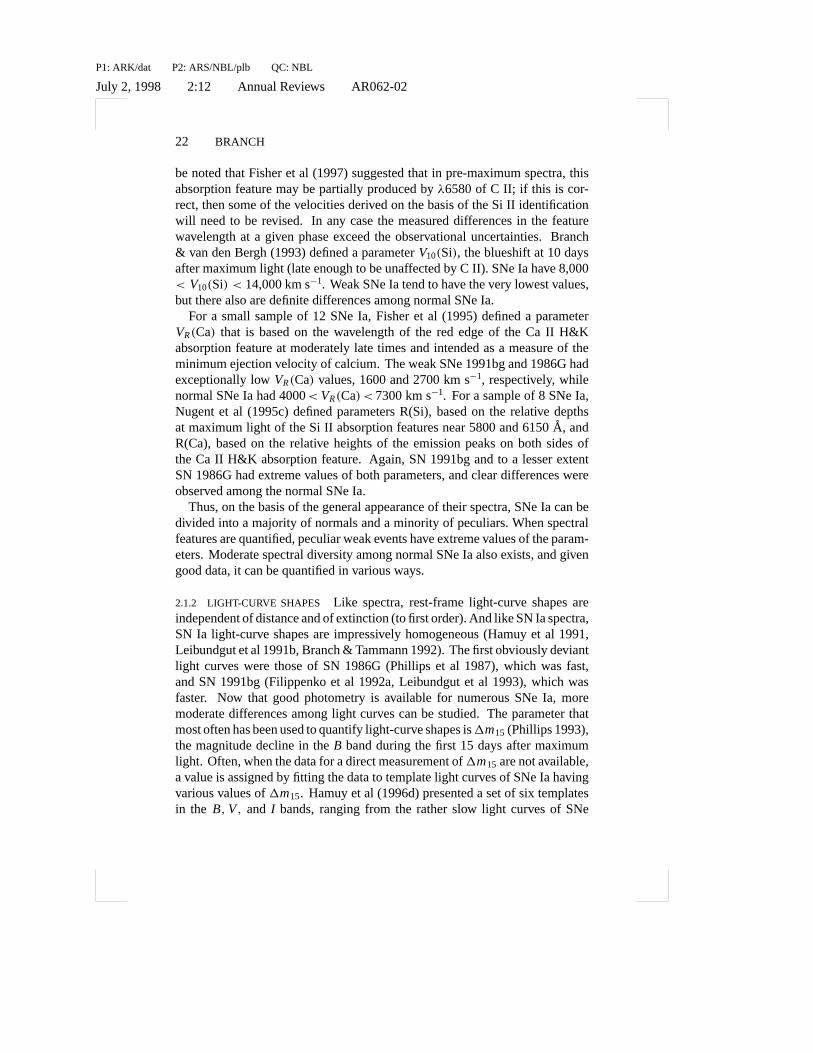
Figure 2 Light curves of SN 1992A. From Hamuy et al (1996d).
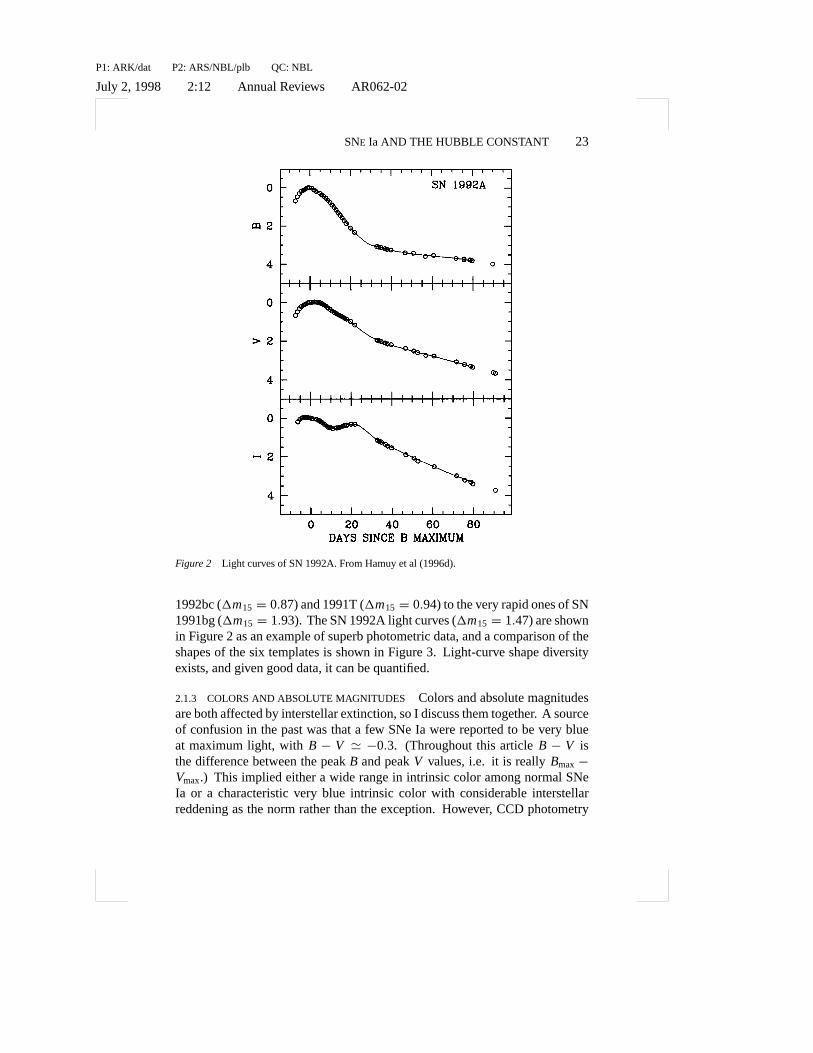
1992bc (1m15 = 0.87) and 1991T (1m15 = 0.94) to the very rapid ones of SN1991bg (1m15 = 1.93). The SN 1992A light curves (1m15 = 1.47) are shownin Figure 2 as an example of superb photometric data, and a comparison of theshapes of the six templates is shown in Figure 3. Light-curve shape diversityexists, and given good data, it can be quantified.
2.1.3 COLORS AND ABSOLUTE MAGNITUDES Colors and absolute magnitudesare both affected by interstellar extinction, so I discuss them together. A sourceof confusion in the past was that a few SNe Ia were reported to be very blueat maximum light, withB − V ' −0.3. (Throughout this articleB − V isthe difference between the peakB and peakV values, i.e. it is reallyBmax−Vmax.) This implied either a wide range in intrinsic color among normal SNeIa or a characteristic very blue intrinsic color with considerable interstellarreddening as the norm rather than the exception. However, CCD photometry
P1: ARK/dat P2: ARS/NBL/plb QC: NBL
July 2, 1998 2:12 Annual Reviews AR062-02
24 BRANCH
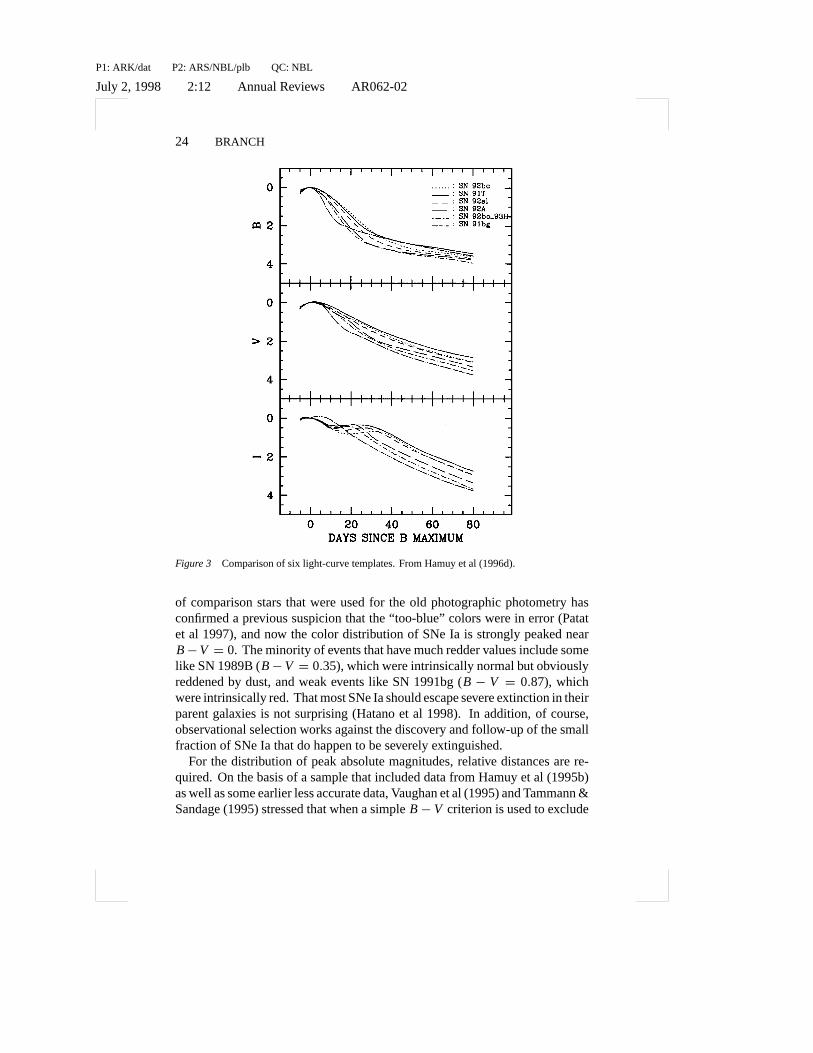
Figure 3 Comparison of six light-curve templates. From Hamuy et al (1996d).
of comparison stars that were used for the old photographic photometry hasconfirmed a previous suspicion that the “too-blue” colors were in error (Patatet al 1997), and now the color distribution of SNe Ia is strongly peaked nearB−V = 0. The minority of events that have much redder values include somelike SN 1989B (B−V = 0.35), which were intrinsically normal but obviouslyreddened by dust, and weak events like SN 1991bg (B − V = 0.87), whichwere intrinsically red. That most SNe Ia should escape severe extinction in theirparent galaxies is not surprising (Hatano et al 1998). In addition, of course,observational selection works against the discovery and follow-up of the smallfraction of SNe Ia that do happen to be severely extinguished.
For the distribution of peak absolute magnitudes, relative distances are re-quired. On the basis of a sample that included data from Hamuy et al (1995b)as well as some earlier less accurate data, Vaughan et al (1995) and Tammann &Sandage (1995) stressed that when a simpleB− V criterion is used to exclude
P1: ARK/dat P2: ARS/NBL/plb QC: NBL
July 2, 1998 2:12 Annual Reviews AR062-02
SNE Ia AND THE HUBBLE CONSTANT 25
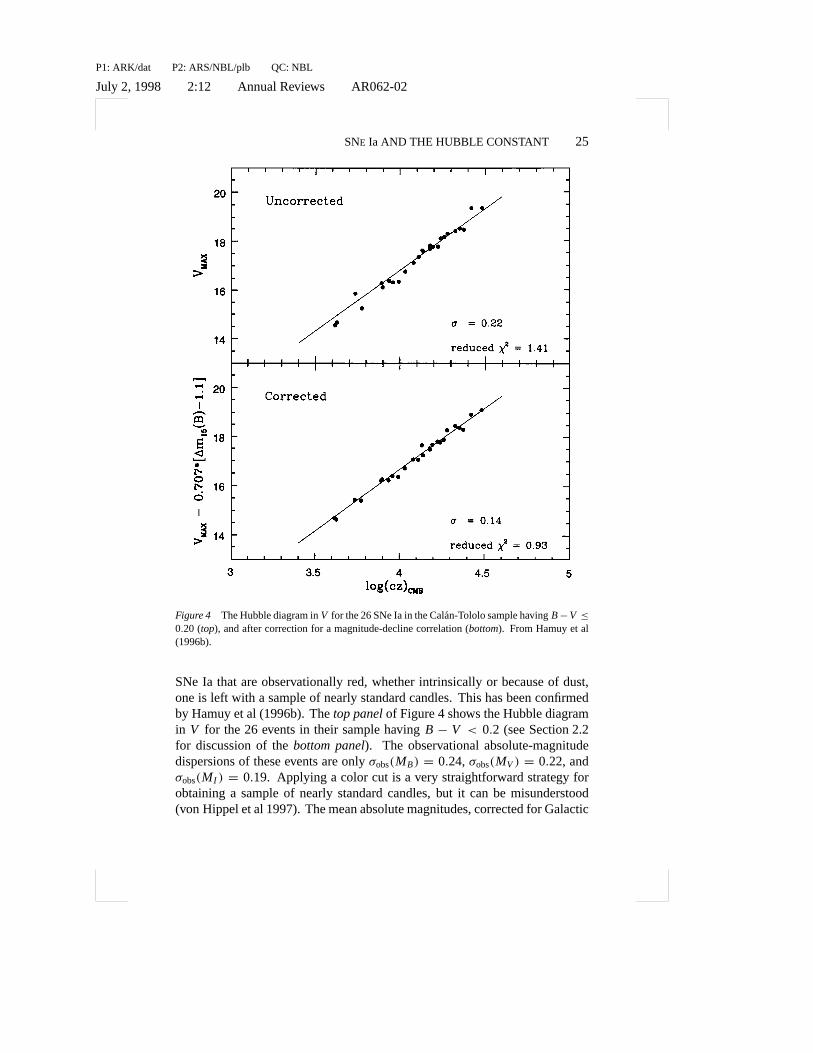
Figure 4 The Hubble diagram inV for the 26 SNe Ia in the Cal´an-Tololo sample havingB−V ≤0.20 (top), and after correction for a magnitude-decline correlation (bottom). From Hamuy et al(1996b).
SNe Ia that are observationally red, whether intrinsically or because of dust,one is left with a sample of nearly standard candles. This has been confirmedby Hamuy et al (1996b). Thetop panelof Figure 4 shows the Hubble diagramin V for the 26 events in their sample havingB − V < 0.2 (see Section 2.2for discussion of thebottom panel). The observational absolute-magnitudedispersions of these events are onlyσobs(MB) = 0.24,σobs(MV ) = 0.22, andσobs(MI ) = 0.19. Applying a color cut is a very straightforward strategy forobtaining a sample of nearly standard candles, but it can be misunderstood(von Hippel et al 1997). The mean absolute magnitudes, corrected for Galactic
P1: ARK/dat P2: ARS/NBL/plb QC: NBL
July 2, 1998 2:12 Annual Reviews AR062-02
26 BRANCH
but not parent-galaxy extinction, of the 26 events of Hamuy et al (1996b) thatpass the color cut are
MB ' MV ' −19.30(±0.03)+ 5 log(H0/60). (1)
Saha et al (1997) show a Hubble diagram (their figure 10) for a larger sampleof 56 SNe Ia that includes some more recent data (Riess 1996) but also someolder data that are not as precise as those of Hamuy et al (1996b); therefore, thedispersions for the Saha et al sample are somewhat higher,σobs(MB) = 0.33 andσobs(MV ) = 0.31. Wang et al (1997a) point out that the scatter in the absolutemagnitudes, uncorrected for extinction, of SNe Ia beyond about 7.5 kpc fromthe centers of their parent galaxies is very small; unfortunately, none of theCepheid-calibrated SNe Ia discussed in Section 3 were that far out.
Figure 5 shows absolute magnitude plotted againstB − V for the Calan-Tololo sample. For the entire sample, including the weak SN 1992K thatresembled SN 1991bg (Hamuy et al 1995a), the weak 1993H that probablywas like SN 1986G (Hamuy et al 1996b), and the moderately extinguishedSN 1990Y (Hamuy et al 1995), a correlation is obvious, and even when thethree red events are excluded a correlation remains. In the past, the correlationbetween color and absolute magnitude seemed to require that the extinctioncharacteristics of the dust that reddens SNe Ia in external galaxies differ fromthose of the dust in our Galaxy (Branch & Tammann 1992 and referencestherein). Recently this problem has been thought to have been due to the old“too-blue” SNe Ia mentioned above and to the adoption of a single intrinsicvalue ofB− V for SNe Ia (Della Valle & Panagia 1992, Sandage & Tammann1993, Vaughan et al 1995, Riess et al 1996b). Strangely enough, the mysteryappears to have resurfaced (Tripp 1998).
2.2 CorrelationsHere we consider correlations between observables other than the one justdiscussed between color and absolute magnitude. As stressed above, weakevents like SN 1991bg are extreme in many of their properties, so when normaland weak SNe Ia are considered together, correlations are obvious. The moreinteresting issue is the extent to which correlations hold among normal SNe Ia.First we consider those among distance-independent observables.
It is clear that there is a correlation between spectrum and light-curve shape.Nugent et al (1995c) found that the spectroscopic observables R(Ca) and R(Si)correlate well with the light-curve decline rate1m15. Therefore the concept ofa one-dimensional photometric/spectroscopic sequence is useful. The situationis not really that simple, though. For example, some events whose spectra looknormal in the sense of Branch et al (1993) do not fit into a one-dimensionalsequence in terms of the Si II blueshifts studied by Branch & van den Bergh

P1: ARK/dat P2: ARS/NBL/plb QC: NBL
July 2, 1998 2:12 Annual Reviews AR062-02
SNE Ia AND THE HUBBLE CONSTANT 27
Figure 5 Absolute magnitudes of the Cal´an-Tololo sample are plotted againstB − V . Theextinction vectors have conventional slopes of 4.1 inB, 3.1 inV , and 1.85 inI. From Hamuy et al(1996b).
P1: ARK/dat P2: ARS/NBL/plb QC: NBL
July 2, 1998 2:12 Annual Reviews AR062-02
28 BRANCH
(1993). SNe 1983G and 1984A had normal looking spectra but exceptionallyhighV10(Si) values. Similarly, Hamuy et al (1996d) found that although in gen-eral their light-curve templates can be arranged in a one-dimensional sequencefrom slow to fast, some light curves having very similar initial decline ratesshow significant differences of detail. SN 1994D had an anomalously negativeU − B color for its decline rate. And although SN 1992bc had a slower lightcurve than the spectroscopically peculiar SN 1991T, SN 1992bc had a normallooking spectrum. This and other evidence suggest that events like SN 1992bcmay represent the “strong” end of the sequence of normals, while SN 1991Tand similar events that have been discovered recently comprise a separate sub-group of powerful SNe Ia, which may be super-Chandrasekhar products ofwhite-dwarf mergers in young populations (see Section 4.4).
Looking for correlations betweenB − V and other distance-independentobservables is difficult because for all but the weak SNe Ia, the intrinsicB−Vdistribution is so strongly peaked near zero. TheU − B color appears to covermore of a range thanB − V (Schaefer 1995b) and to be correlated with otherSN Ia properties (Branch et al 1997), but moreU − B data are needed.
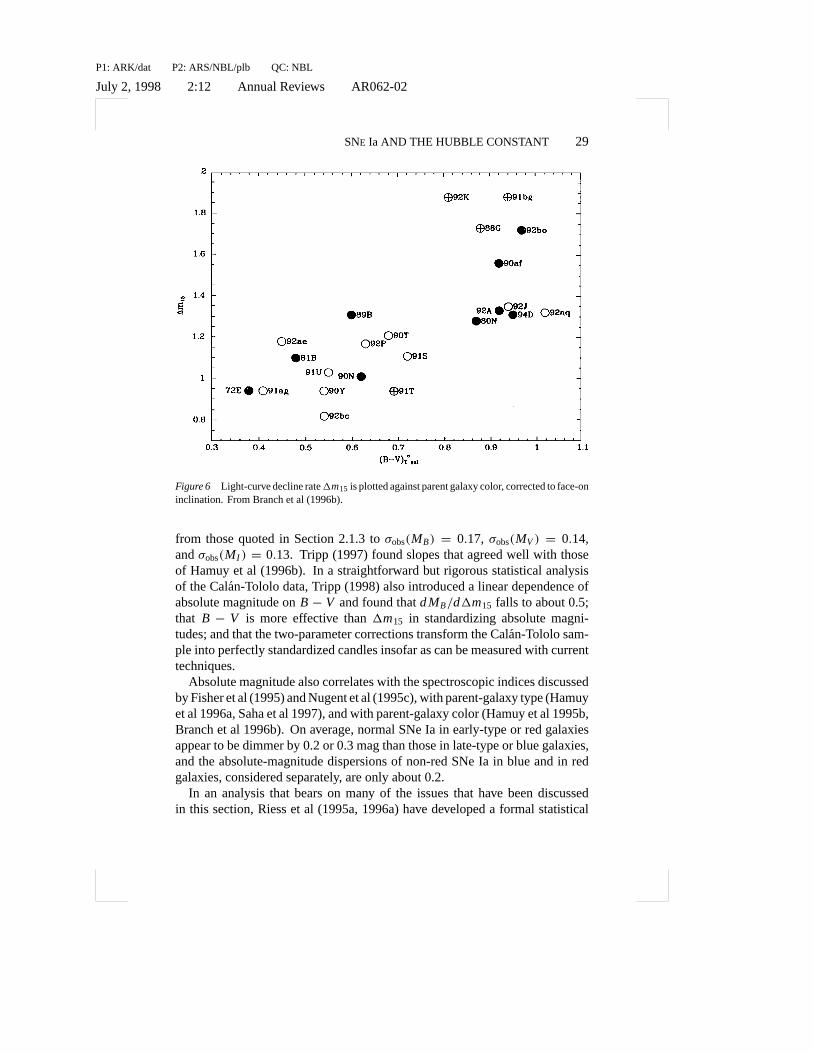
Spectra and light curves of SNe Ia also are correlated with the nature of theparent galaxies. On average, SNe Ia in red or early-type galaxies have lowervalues ofV10(Si) and faster light curves than those in late-type or blue galaxies(Hamuy et al 1995b, 1996a, Branch et al 1996b). The1m15 parameter isplotted against the color of the parent galaxy in Figure 6.
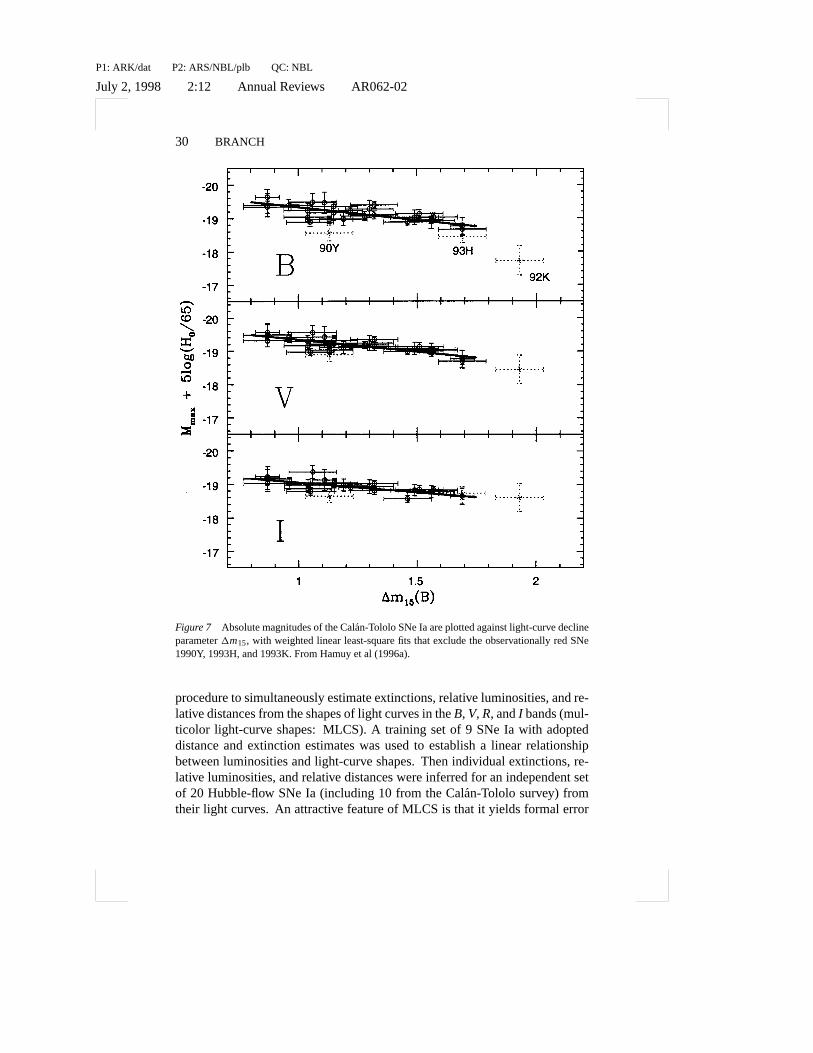
Now we consider correlations with absolute magnitude, which are the onesthat are needed for improving on the standard-candle approach toH0. UsingTully-Fisher (TF) and surface-brightness-fluctuation (SBF) distances for a sam-ple of nine SNe Ia, including the peculiar SNe 1991T, 1986G, and 1991bg andthe not-so-well-observed SN 1971I, Phillips (1993) found correlations betweenabsolute magnitude (MB, MV , andMI ) and1m15. At one extreme SN 1991Twas overluminous and somewhat slow to decline, and at the other SN 1991bgwas extremely subluminous and quick to decline. The correlation was in thesame sense as that proposed by Pskovskii (1977). Subsequently, the Cal´an-Tololo data on SNe Ia in the Hubble flow, for which the relative distances aremore secure, showed that the correlation indicates considerable scatter amongthe dim, red, rapidly-declining events. After adopting a color cut to eliminatethe three observationally red events in their sample, Hamuy et al (1996b) de-rived slopesd MB/d1m15 = 0.78± 0.17, d MV/d1m15 = 0.71± 0.14, andd MI /d1m15 = 0.58± 0.13 (Figure 7). These slopes are much less steep thanthose that were obtained by Phillips (1993), yet definitely greater than zero.The Hubble diagram inV for the 26 non-red events, standardized by meansof 1m15, is shown in thebottom panelof Figure 4. When the correlationswith 1m15 were taken into account, the absolute-magnitude dispersions fell
P1: ARK/dat P2: ARS/NBL/plb QC: NBL
July 2, 1998 2:12 Annual Reviews AR062-02
SNE Ia AND THE HUBBLE CONSTANT 29
Figure 6 Light-curve decline rate1m15 is plotted against parent galaxy color, corrected to face-oninclination. From Branch et al (1996b).
from those quoted in Section 2.1.3 toσobs(MB) = 0.17, σobs(MV ) = 0.14,andσobs(MI ) = 0.13. Tripp (1997) found slopes that agreed well with thoseof Hamuy et al (1996b). In a straightforward but rigorous statistical analysisof the Calan-Tololo data, Tripp (1998) also introduced a linear dependence ofabsolute magnitude onB − V and found thatd MB/d1m15 falls to about 0.5;that B − V is more effective than1m15 in standardizing absolute magni-tudes; and that the two-parameter corrections transform the Cal´an-Tololo sam-ple into perfectly standardized candles insofar as can be measured with currenttechniques.
Absolute magnitude also correlates with the spectroscopic indices discussedby Fisher et al (1995) and Nugent et al (1995c), with parent-galaxy type (Hamuyet al 1996a, Saha et al 1997), and with parent-galaxy color (Hamuy et al 1995b,Branch et al 1996b). On average, normal SNe Ia in early-type or red galaxiesappear to be dimmer by 0.2 or 0.3 mag than those in late-type or blue galaxies,and the absolute-magnitude dispersions of non-red SNe Ia in blue and in redgalaxies, considered separately, are only about 0.2.
In an analysis that bears on many of the issues that have been discussedin this section, Riess et al (1995a, 1996a) have developed a formal statistical
P1: ARK/dat P2: ARS/NBL/plb QC: NBL
July 2, 1998 2:12 Annual Reviews AR062-02
30 BRANCH
Figure 7 Absolute magnitudes of the Cal´an-Tololo SNe Ia are plotted against light-curve declineparameter1m15, with weighted linear least-square fits that exclude the observationally red SNe1990Y, 1993H, and 1993K. From Hamuy et al (1996a).
procedure to simultaneously estimate extinctions, relative luminosities, and re-lative distances from the shapes of light curves in theB, V, R, andI bands (mul-ticolor light-curve shapes: MLCS). A training set of 9 SNe Ia with adopteddistance and extinction estimates was used to establish a linear relationshipbetween luminosities and light-curve shapes. Then individual extinctions, re-lative luminosities, and relative distances were inferred for an independent setof 20 Hubble-flow SNe Ia (including 10 from the Cal´an-Tololo survey) fromtheir light curves. An attractive feature of MLCS is that it yields formal error

P1: ARK/dat P2: ARS/NBL/plb QC: NBL
July 2, 1998 2:12 Annual Reviews AR062-02
SNE Ia AND THE HUBBLE CONSTANT 31
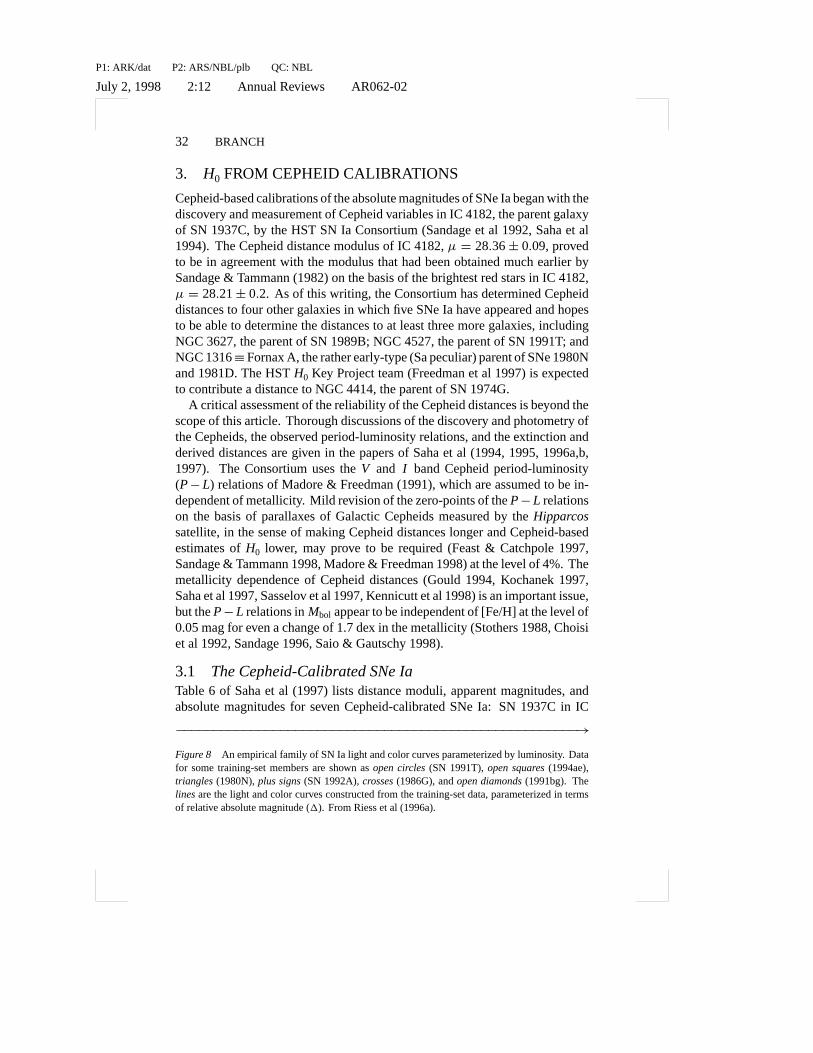
estimates. The analysis gave results for various SN Ia properties such as rela-tions betweenB−V , V−R, andR− I color curves and luminosity (Figure 8),and the dispersion in the MLCS distance moduli was found to be only 0.12mag. These SN Ia properties are less directly “observational” than those dis-cussed earlier in this section because they depend on the adopted propertiesof the training set, including TF and SBF relative distances, and on an as-sumed a priori probability distribution of the extinction. Of the 9 training-setevents, 8 also were in the sample of 9 that was used by Phillips (1993) to derivemagnitude-decline slopes that proved to be too steep, and the maximum-lightB−V as parameterized by Riess et al (1996a) correlates with luminosity (Lira1996) and1m15 (R Tripp, private communication) in ways that the Hubble-flow events of the Cal´an-Tololo sample do not. Assessing the consequencesof changing the MLCS input data is not trivial; it will be interesting to seewhether and how the results of MLCS change when the nearby training setis replaced by a subset of the Hubble-flow SNe Ia, whose relative distanceswill be more secure. See Riess et al (1998) for an interesting proposal tocircumvent the labor of obtaining accurate multicolor light-curve shapes bycombining the information carried in a single spectrum and a single-epochmeasurement ofB and V magnitudes to determine “snapshot” distances toSNe Ia.
2.3 SummarySNe Ia can be divided into a majority of “normal” events that have highlyhomogeneous properties and a minority that are “peculiar.” When normalsand peculiars are considered together, correlations among their observationalproperties are obvious. To a certain extent, the correlations hold among normalSNe Ia, and the concept of a sequence of SNe Ia ranging from those havinghigh-excitation spectra, high blueshifts of spectral features, slow light curves,and high luminosities to those having low-excitation spectra, low blueshifts, fastlight curves, and low luminosities is useful. The former tend to occur in blue,late-type galaxies and the latter in red, early-type galaxies. A one-dimensionalsequence of SNe Ia is not, however, the whole story.
A simple B − V cut that eliminates events that are observationally red atmaximum light yields a sample of nearly standard candles havingσobs(MB) 'σ(MV )obs less than 0.3. Correlations between absolute magnitude and one ormore SN Ia or parent-galaxy observables can be used to further standardize theabsolute magnitudes to better than 0.2 mag. As far as determining the value ofH0 by means of Cepheid-calibrated SNe Ia is concerned, the accuracy of theresult will depend not only on the tightness of the intrinsic correlation amongnormal SNe Ia but also on the degree to which the relevant distance-independentobservables happen to be known for the Cepheid-calibrated SNe Ia.
P1: ARK/dat P2: ARS/NBL/plb QC: NBL
July 2, 1998 2:12 Annual Reviews AR062-02
32 BRANCH
3. H0 FROM CEPHEID CALIBRATIONS
Cepheid-based calibrations of the absolute magnitudes of SNe Ia began with thediscovery and measurement of Cepheid variables in IC 4182, the parent galaxyof SN 1937C, by the HST SN Ia Consortium (Sandage et al 1992, Saha et al1994). The Cepheid distance modulus of IC 4182,µ = 28.36± 0.09, provedto be in agreement with the modulus that had been obtained much earlier bySandage & Tammann (1982) on the basis of the brightest red stars in IC 4182,µ = 28.21± 0.2. As of this writing, the Consortium has determined Cepheiddistances to four other galaxies in which five SNe Ia have appeared and hopesto be able to determine the distances to at least three more galaxies, includingNGC 3627, the parent of SN 1989B; NGC 4527, the parent of SN 1991T; andNGC 1316≡Fornax A, the rather early-type (Sa peculiar) parent of SNe 1980Nand 1981D. The HSTH0 Key Project team (Freedman et al 1997) is expectedto contribute a distance to NGC 4414, the parent of SN 1974G.
A critical assessment of the reliability of the Cepheid distances is beyond thescope of this article. Thorough discussions of the discovery and photometry ofthe Cepheids, the observed period-luminosity relations, and the extinction andderived distances are given in the papers of Saha et al (1994, 1995, 1996a,b,1997). The Consortium uses theV and I band Cepheid period-luminosity(P− L) relations of Madore & Freedman (1991), which are assumed to be in-dependent of metallicity. Mild revision of the zero-points of theP− L relationson the basis of parallaxes of Galactic Cepheids measured by theHipparcossatellite, in the sense of making Cepheid distances longer and Cepheid-basedestimates ofH0 lower, may prove to be required (Feast & Catchpole 1997,Sandage & Tammann 1998, Madore & Freedman 1998) at the level of 4%. Themetallicity dependence of Cepheid distances (Gould 1994, Kochanek 1997,Saha et al 1997, Sasselov et al 1997, Kennicutt et al 1998) is an important issue,but theP− L relations inMbol appear to be independent of [Fe/H] at the level of0.05 mag for even a change of 1.7 dex in the metallicity (Stothers 1988, Choisiet al 1992, Sandage 1996, Saio & Gautschy 1998).
3.1 The Cepheid-Calibrated SNe IaTable 6 of Saha et al (1997) lists distance moduli, apparent magnitudes, andabsolute magnitudes for seven Cepheid-calibrated SNe Ia: SN 1937C in IC
−−−−−−−−−−−−−−−−−−−−−−−−−−−−−−−−−−−−−−−−−−−−−−−−−−−−−−→Figure 8 An empirical family of SN Ia light and color curves parameterized by luminosity. Datafor some training-set members are shown asopen circles(SN 1991T),open squares(1994ae),triangles(1980N),plus signs(SN 1992A),crosses(1986G), andopen diamonds(1991bg). Thelinesare the light and color curves constructed from the training-set data, parameterized in termsof relative absolute magnitude (1). From Riess et al (1996a).

P1: ARK/dat P2: ARS/NBL/plb QC: NBL
July 2, 1998 2:12 Annual Reviews AR062-02
SNE Ia AND THE HUBBLE CONSTANT 33
P1: ARK/dat P2: ARS/NBL/plb QC: NBL
July 2, 1998 2:12 Annual Reviews AR062-02
34 BRANCH
4182, SNe 1895B and 1972E in NGC 5253, SN 1981B in NGC 4536, SN1960F in NGC 4496A, SN 1990N in NGC 4639, and SN 1989B in NGC3627. The Cepheid distance of the last galaxy has not yet been determineddirectly; it is assigned the mean Cepheid distance of three fellow members ofthe Leo group of galaxies. There has been little disagreement about the apparentmagnitudes of these calibrator SNe Ia except in the case of SN 1937C (Schaefer1994, 1996a, Pierce & Jacoby 1995, Jacoby & Pierce 1996). Extinction of thecalibrators by dust in our Galaxy is low. Estimates of the extinction of theSNe Ia by dust in the parent galaxies are not so easy to come by, but parent-galaxy extinction of at least four of the calibrators, SNe 1895B, 1937C, 1960F,and 1972E, is likely to have been quite low. Saha et al (1997) assumed thatthe total extinction of these four was the same as the (low) mean extinctionof the corresponding Cepheids, in which case the apparent distance modulusof the Cepheids combined with the apparent magnitude of the SN Ia givesthe extinction-free SN Ia absolute magnitude. For SNe 1981B, 1989B, and1990N, Saha et al (1997) obtained absolute magnitudes using the extinction-corrected distance moduli of the Cepheids together with assumed SN extinctionsof E(B− V) = 0.1, 0.37 (Wells et al 1994), and 0.00, respectively. The meanabsolute magnitudes listed by Saha et al (1997) areMB = −19.52 ± 0.07based on seven events andMV = −19.48± 0.07 based on six events.
Spectroscopically, SNe 1960F, 1981B, 1989B, and 1990N were observed atmaximum light and they were normal. The earliest spectra of SNe 1937C and1972E were obtained long enough after maximum light to raise the issue ofwhether they could have been peculiar in the sense of SN 1991T; argumentsthat they were spectroscopically normal have been made by Branch et al (1993,1994). The single spectrum of SN 1895B (Schaefer 1995a) is consistent withnormal, but an SN 1991T–type peculiarity cannot be excluded.
The inclusion of SN 1895B as a calibrator has been questioned on the groundsthat its apparent magnitude may be unreliable, but Saha et al (1995) arguedthat it would be arbitrary to exclude it because there is no reason to expect asystematicerror in its apparent magnitude. Also, it must be remembered that theuncertainty in a calibrator’s absolute magnitude depends on the uncertaintiesnot only in the apparent magnitude but also in the extinction and in the distancemodulus; thus the uncertainties in the absolute magnitudes of the calibratorslisted by Saha et al (1997) turn out to be of comparable size. The possibilitythat SN 1895B was a peculiar event like SN 1991T may be a better argumentfor its exclusion. If it is excluded, and if the most recent (and fainter) estimatesof the apparent magnitudes of SN 1937C (Jacoby & Pierce 1996) and SN1990N (Lira et al 1998) are adopted, the mean absolute magnitudes of theseven calibrators only drop from the values of Saha et al (1997),MB = −19.52andMV = −19.48, toMB = MV = −19.44.
P1: ARK/dat P2: ARS/NBL/plb QC: NBL
July 2, 1998 2:12 Annual Reviews AR062-02
SNE Ia AND THE HUBBLE CONSTANT 35
In principle, the calibrators could provide an independent test of the magni-tude-decline relation found for the Hubble-flow SNe Ia, but considering theuncertainties in the absolute magnitudes and the decline rates of the calibrators,the shallow slopes found by Tammann & Sandage (1995) and Hamuy et al(1996a) can be neither confirmed nor denied. It is worth noting, though, thatinvoking a strong metallicity dependence of the Cepheid zero point, in thesense of reducing the Cepheid distances to metal-deficient galaxies (IC 4182,NGC 5253) relative to the distances of more metal-rich galaxies, would leadto aninversemagnitude-decline relation that is not plausible. This is a reasonto doubt that introducing a metallicity dependence will cause any substantialrevision of the results discussed in the next section.
3.2 Matching the Calibrators to the Hubble FlowThe ways that have been used to obtainH0 by comparing the local Cepheid-calibrated SNe Ia to Hubble-flow SNe Ia are considered here more or less inorder of increasing complexity.
The intent of the HST SN Ia Consortium all along has been to simply treatSNe Ia as nearly standard candles. In their most recent paper, Saha et al(1997) assigned mean values forMB and MV of the calibrators to the meanvalues of 56 non-red (B− V < 0.2) Hubble-flow SN Ia to obtainH0 = 58+7
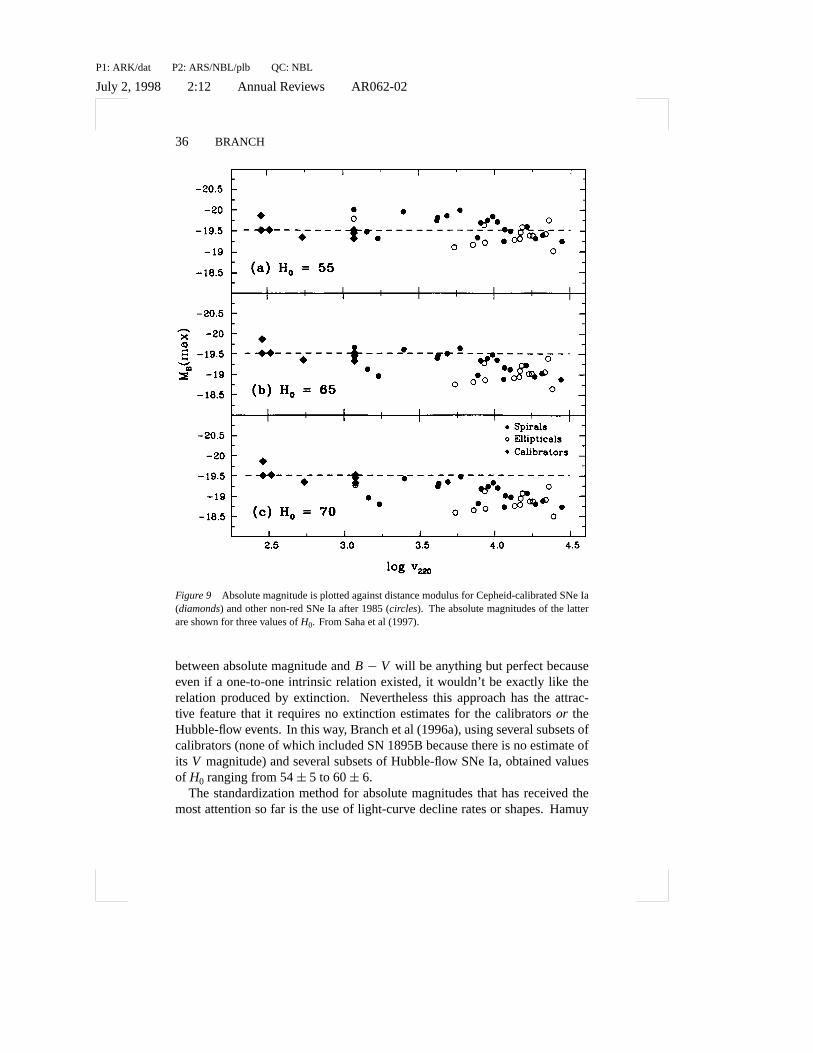
−8,where extinction of the non-red Hubble-flow SN Ia is neglected. Saha et alemphasized that forH0 higher than 65, nearly all of the Hubble-flow SNe Iawould be intrinsically dimmer than nearly all of the Cepheid-calibrated SNe Ia(Figure 9), in spite of the observational bias in favor of discovering the mostluminous of the Hubble-flow SNe Ia. The larger the SN Ia absolute-magnitudedispersion actually is (cf van den Bergh 1996), the stronger an argument this isfor a low value ofH0 because the effect of the bias increases with the size ofthe dispersion. For an insightful discussion of the effects of selection bias ondistance determinations, see Teerikorpi (1997) in this series.
Others have used Saha et al’s Cepheid distances, together with slightly dif-ferent adopted apparent magnitudes of the SN Ia calibrators and in some casesusing only subsets of the calibrators, to make their own estimates ofH0. Forexample, the local calibrators are in blue galaxies, and since SNe Ia in bluegalaxies tend to be more luminous than those in red galaxies, it would seemto be appropriate to match the calibrators only to Hubble-flow SNe Ia in bluegalaxies. Branch et al (1996b) obtainedH0 = 57 ± 4 in this way, and Sahaet al (1997) showed that this hardly affects their result forH0. If a Cepheiddistance to NGC 1316 can be obtained, it will provide a valuable calibration oftwo SNe Ia in an early-type red galaxy.
Another way to match the calibrators to Hubble-flow SNe Ia is to use thesupernovaB−V color to standardize the absolute magnitudes. The correlation
P1: ARK/dat P2: ARS/NBL/plb QC: NBL
July 2, 1998 2:12 Annual Reviews AR062-02
36 BRANCH
Figure 9 Absolute magnitude is plotted against distance modulus for Cepheid-calibrated SNe Ia(diamonds) and other non-red SNe Ia after 1985 (circles). The absolute magnitudes of the latterare shown for three values ofH0. From Saha et al (1997).
between absolute magnitude andB − V will be anything but perfect becauseeven if a one-to-one intrinsic relation existed, it wouldn’t be exactly like therelation produced by extinction. Nevertheless this approach has the attrac-tive feature that it requires no extinction estimates for the calibratorsor theHubble-flow events. In this way, Branch et al (1996a), using several subsets ofcalibrators (none of which included SN 1895B because there is no estimate ofits V magnitude) and several subsets of Hubble-flow SNe Ia, obtained valuesof H0 ranging from 54± 5 to 60± 6.
The standardization method for absolute magnitudes that has received themost attention so far is the use of light-curve decline rates or shapes. Hamuy
P1: ARK/dat P2: ARS/NBL/plb QC: NBL
July 2, 1998 2:12 Annual Reviews AR062-02
SNE Ia AND THE HUBBLE CONSTANT 37
et al (1996b) matched the calibrators to their non-red Hubble-flow SNe Iausing their linear relations between absolute magnitude and1m15 and obtainedH0 = 63± 3.4 (internal)±2.9 (external). The requirement of an accuratevalue of1m15 restricted the number of calibrators to four: SNe 1937C, 1972E,1981B, and 1990N; extinction of the non-red Hubble-flow SNe Ia was neglected.Schaefer (1996b) considered the apparent magnitudes of the calibrators in theU , B, V , andH bands (where possible) and obtainedH0 = 55± 3. Kim et al(1997) matched the calibrators to five of Perlmutter et al’s (1997c) high-redshiftSNe Ia with the two samples adjusted to a common mean value of1m15 andobtained estimates ofH0 that depend slightly on the values ofÄm andÄ3 (seetheir figure 3). For example, forÄm = 1 andÄ3 = 0, their result forH0was 59± 3, whereas forÄm = 0.3 andÄ3 = 0, it was 62± 4. Tripp (1997)matched the calibrators to a combination of the Cal´an-Tololo and high-redshiftsamples, all adjusted to a common mean1m15, and obtainedH0 = 60± 5.When Tripp (1998) allowed absolute magnitude to depend linearly on bothB − V and1m15, he obtainedH0 = 60± 6. Freedman et al (1997) assumedthat a Cepheid-based distance to the spiral galaxy NGC 1365 gives the distanceto the Fornax cluster and to the early-type galaxies NGC 1380, the parent ofSN 1992A, and NGC 1316, the parent of SN 1980N; by applying a magnitude-decline relation to these two events together with some of the other calibrators,they obtainedH0 = 67± 8. But assigning the distance of NGC 1365 to theearly-type parent galaxies of SNe 1992A and 1980N is highly controversial(Freedman 1997, Saha et al 1997, Sandage & Tammann 1997, Tammann &Federspiel 1997).
Riess et al (1996a) used their MLCS technique with three calibrators, SNe1972E, 1981B, and 1990N, to calibrate the absolute distances to their sample of20 Hubble-flow SNe Ia and obtainedH0 = 64± 3 (statistical)±6 (total error).In this approach, individual extinctions of the Hubble-flow events are derivedrather than assumed or neglected.
3.3 SummaryThe mild differences between the results forH0 quoted in this section are due todifferences in the numbers of calibrators that are used and in the ways that theyare matched to Hubble-flow SNe Ia. Different people would assign differentrelative weights to these analyses. In principle, the analyses that try to takediversity into account are preferred, but at present, some of these can use only asmall number of calibrators. Suffice it to say that present Cepheid calibrationsof SNe Ia give values ofH0 near 60. Mild revision is to be expected as moreCepheid-calibrated and Hubble-flow SNe Ia become available, as the zero-points of the CepheidP− L relations are revised, and as a Cepheid metallicitydependence is taken into account if needed.
P1: ARK/dat P2: ARS/NBL/plb QC: NBL
July 2, 1998 2:12 Annual Reviews AR062-02
38 BRANCH
4. PHYSICAL PROPERTIES
The immediate progenitors of SNe Ia are believed to be carbon-oxygen (C-O)white dwarfs in close binary systems, and no other kind of progenitor hasbeen under serious consideration for some time. During the 1980s, generalconsensus was also that the first nuclear ignition was of carbon, deep insidethe white dwarf. This event would be followed by the outwards propagationof a subsonic nuclear flame (a “deflagration”), the velocity of which had tobe (and still has to be) parameterized. One particular nuclear-hydrodynamicaldeflagration model called W7 (Nomoto et al 1984) was parameterized in sucha way that its radial composition structure with (Branch et al 1985) or without(Harkness 1991a) ad hoc compositional mixing of its outer layers was able togive a good account of the spectral features of normal SNe Ia. Thus W7 becamethe standard SN Ia model, and this is where matters stood when the physics ofSNe was reviewed in this series by Woosley & Weaver (1986) and still at thetime of Branch & Tammann (1992). Since then, many people have put mucheffort into seeking the nature of the progenitor binary systems, constructinghydrodynamical explosion models, and calculating light curves and spectra ofmodels.
4.1 ProgenitorsAlthough numerous articles and several recent reviews (Branch et al 1995,Renzini 1996, Iben 1997, Ruiz-Lapuente et al 1997a) have been written aboutSN Ia progenitors, we still do not know even whether (or how often) the pro-genitor binary system contains one white dwarf or two.
In the standard “single-degenerate” scenario, the white dwarf accretes fromthe Roche lobe or wind of a nondegenerate companion until it approachesthe Chandrasekhar mass and ignites carbon deep in its interior. There hasbeen much recent interest in the possibility that single-degenerate pre–SN Iasystems are being observed as supersoft X-ray sources (van den Heuvel et al1992, Rappaport et al 1994, Yungelson et al 1996), especially since Hachisuet al (1996) found a new strong-wind solution for mass transfer from a lobe-filling companion. According to Hachisu et al, the formation and expulsion ofa common envelope can be avoided more easily than previously believed. Thismay open up two promising channels (Figure 10) for the accretor to reach theChandrasekhar mass, and both could be observed as supersofts: close systemsin which the donor is a main sequence or subgiant star in the range 2–3.5 M¯ andwide systems in which the donor is a red giant of'1 M¯ (Hachisu et al 1996,Nomoto et al 1997, Li & van den Heuvel 1997, but see Yungelson & Livio 1998).In the single-degenerate scenario, a significant amount of circumstellar matteris expected to be in the vicinity of the explosion. So far, no convincing evidence

P1: ARK/dat P2: ARS/NBL/plb QC: NBL
July 2, 1998 2:12 Annual Reviews AR062-02
SNE Ia AND THE HUBBLE CONSTANT 39
Figure 10 Donor masses are plotted against orbital period for candidate single-degenerate SN Iaprogenitor binary systems.Filled circlesare for an initial white-dwarf accretor of 1.2 Mandopencirclesare for 1.0 M . Thedotted linesrepresent the boundaries of mass transfer in case A (left)and case B (right). From Li & van den Heuvel (1997).
for narrow circumstellar hydrogen or helium lines in SN Ia spectra has beenfound (Ho & Filippenko 1995, Cumming et al 1996), nor has X-ray (Schlegel& Petre 1993) or radio (Eck et al 1996) emission from circumstellar interactionbeen seen. These nondetections are not yet quite stringent enough, however, torule out single-degenerate progenitor systems (Lundqvist & Cumming 1997).So far, only one SN Ia has been found to be polarized (Wang et al 1997b);the general lack of polarization may lead to constraints on the presence ofcircumstellar matter and the nature of the progenitor systems (Wang et al 1996).
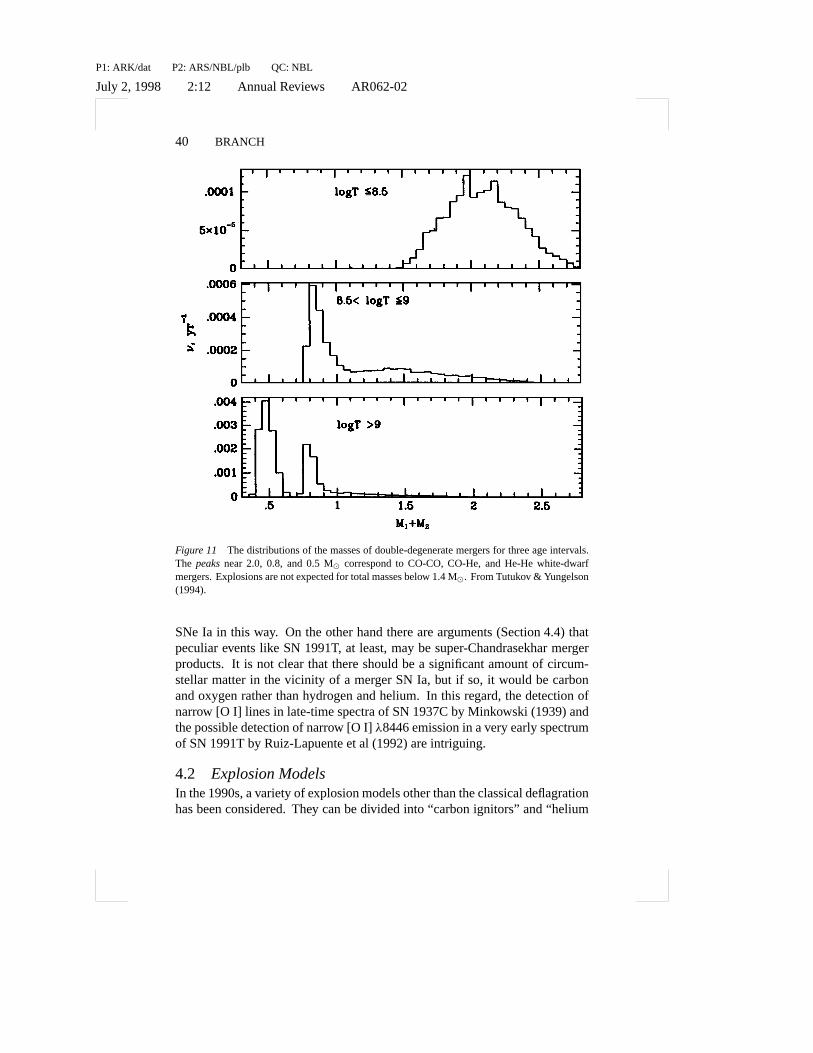
In the standard “double-degenerate” scenario, two white dwarfs spiral to-gether as a consequence of the emission of gravitational radiation to form asuper-Chandrasekhar merger product. According to a population-synthesisstudy by Tutukov & Yungelson (1994), mergers that form within 3× 10⁸ yearsof star formation have a mean mass that is greater than 2 M¯ (Figure 11). Thoseresearchers who have made recent attempts to model the merging process usingSPH calculations (Mochkovitch & Livio 1990, Benz et al 1990, Rasio & Shapiro1995, Mochkovitch et al 1997) are not uniformly optimistic about producing
P1: ARK/dat P2: ARS/NBL/plb QC: NBL
July 2, 1998 2:12 Annual Reviews AR062-02
40 BRANCH
Figure 11 The distributions of the masses of double-degenerate mergers for three age intervals.The peaksnear 2.0, 0.8, and 0.5 Mcorrespond to CO-CO, CO-He, and He-He white-dwarfmergers. Explosions are not expected for total masses below 1.4 M¯. From Tutukov & Yungelson(1994).
SNe Ia in this way. On the other hand there are arguments (Section 4.4) thatpeculiar events like SN 1991T, at least, may be super-Chandrasekhar mergerproducts. It is not clear that there should be a significant amount of circum-stellar matter in the vicinity of a merger SN Ia, but if so, it would be carbonand oxygen rather than hydrogen and helium. In this regard, the detection ofnarrow [O I] lines in late-time spectra of SN 1937C by Minkowski (1939) andthe possible detection of narrow [O I]λ8446 emission in a very early spectrumof SN 1991T by Ruiz-Lapuente et al (1992) are intriguing.
4.2 Explosion ModelsIn the 1990s, a variety of explosion models other than the classical deflagrationhas been considered. They can be divided into “carbon ignitors” and “helium

P1: ARK/dat P2: ARS/NBL/plb QC: NBL
July 2, 1998 2:12 Annual Reviews AR062-02
SNE Ia AND THE HUBBLE CONSTANT 41
ignitors” according to whether the first nuclear ignition is of carbon, deep insidethe accretor, or of helium near the surface.
Among the carbon-ignitor models, deflagrations, “delayed detonations”(Khokhlov et al 1993, Arnett & Livne 1994a,b, Woosley & Weaver 1994b,Hoflich 1995, Nomoto et al 1997), and “pulsating delayed detonations”(Khokhlov et al 1993) could be applicable in the single-degenerate case, sothese have been constructed for Chandrasekhar-mass ejection. In the double-degenerate case, the classical idea (see Iben 1997 for a review) is that the mergerleads to a super-Chandrasekhar configuration consisting of a white-dwarf core,a quasispherical pressure-supported envelope, and a low-density thick disk.Whether this flying saucer (Iben & Tutukov 1984) eventually explodes or col-lapses is thought to depend on, among other things, whether carbon ignites atthe core-disk boundary and burns steadily inward to produce an oxygen-neon-magnesium configuration that will simply collapse to a neutron star. A differentposssibility is that explosion of one and then the other white dwarf occurs dur-ing or even just before the merger, owing to tidal or shear heating (Iben 1997).Shigayama et al (1992) and Khokhlov et al (1993) constructed some spheri-cally symmetric explosion models with super-Chandrasekhar merger productsin mind.
In the 1990s, there has been much interest in sub-Chandrasekhar helium-ignitor models, as constructed by Woosley & Weaver (1994a), Livne & Arnett(1995), and H¨oflich & Khokhkov (1996). The first nuclear ignition is near thebottom of a helium layer of about 0.2 Maccumulated on top of a C-O whitedwarf. A prompt detonation propagates outwards through the helium whilean inward nonburning pressure wave compresses and ignites the underlyingC-O (perhaps well off center) and drives a second detonation outwards throughthe C-O. Owing to the difference between the nuclear kinetics of carbon andhelium burning, these models have a composition structure that is fundamentallydifferent from that of carbon ignitors.4He burns to12C by the slow triple alphaprocess, and as soon as12C is formed, it rapidly captures alpha particles to form56Ni, so the original helium layer ends up as a high-velocity mixture of56Niand leftover4He. In these models intermediate-mass elements such as siliconand sulfur, produced by low-density carbon burning, are ejected in a relativelynarrow range of velocity around 10,000 km s−1.
4.3 Light CurvesHarkness (1991b) first carried out light-curve calculations that took into accountthe dependence of the opacity on temperature, density, and composition, andhe found that the light curve of model W7 was about right for normal SNeIa. Machinery developed for calculating gamma-ray deposition (H¨oflich et al1992) and bolometric and monochromatic light curves (H¨oflich et al 1993) led
P1: ARK/dat P2: ARS/NBL/plb QC: NBL
July 2, 1998 2:12 Annual Reviews AR062-02
42 BRANCH
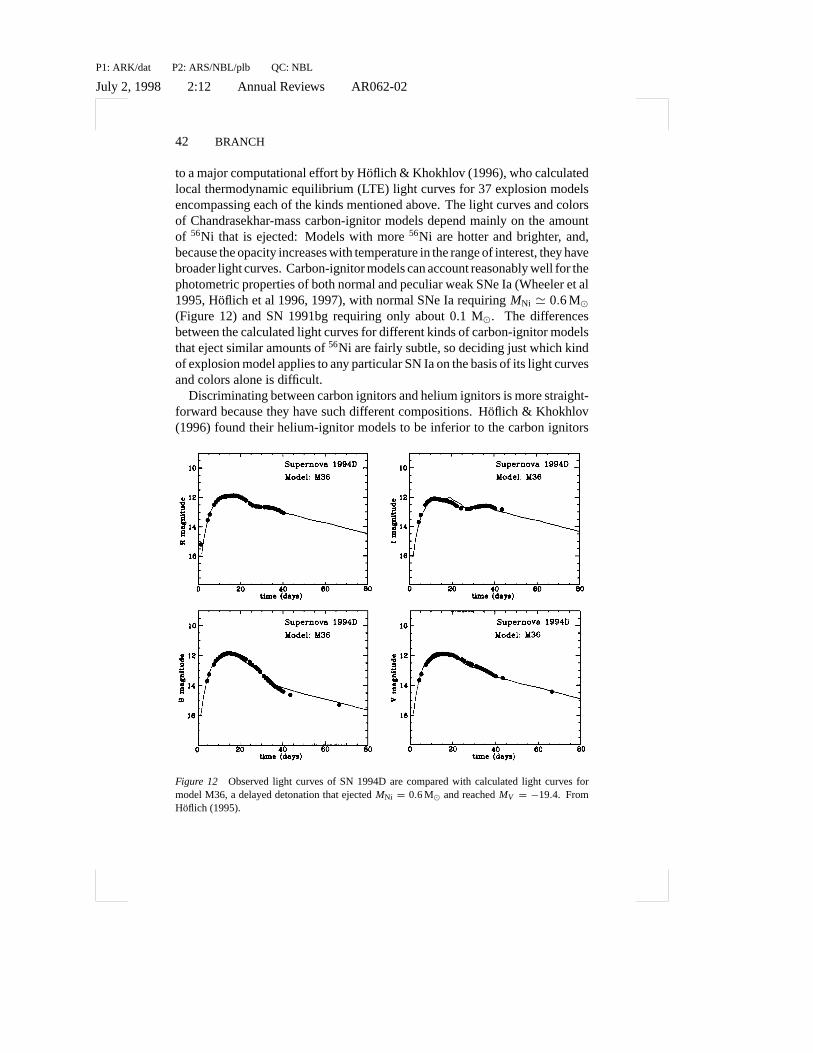
to a major computational effort by H¨oflich & Khokhlov (1996), who calculatedlocal thermodynamic equilibrium (LTE) light curves for 37 explosion modelsencompassing each of the kinds mentioned above. The light curves and colorsof Chandrasekhar-mass carbon-ignitor models depend mainly on the amountof 56Ni that is ejected: Models with more56Ni are hotter and brighter, and,because the opacity increases with temperature in the range of interest, they havebroader light curves. Carbon-ignitor models can account reasonably well for thephotometric properties of both normal and peculiar weak SNe Ia (Wheeler et al1995, Hoflich et al 1996, 1997), with normal SNe Ia requiringMNi ' 0.6 M¯(Figure 12) and SN 1991bg requiring only about 0.1 M¯. The differencesbetween the calculated light curves for different kinds of carbon-ignitor modelsthat eject similar amounts of56Ni are fairly subtle, so deciding just which kindof explosion model applies to any particular SN Ia on the basis of its light curvesand colors alone is difficult.
Discriminating between carbon ignitors and helium ignitors is more straight-forward because they have such different compositions. H¨oflich & Khokhlov(1996) found their helium-ignitor models to be inferior to the carbon ignitors
Figure 12 Observed light curves of SN 1994D are compared with calculated light curves formodel M36, a delayed detonation that ejectedMNi = 0.6 M¯ and reachedMV = −19.4. FromHoflich (1995).
P1: ARK/dat P2: ARS/NBL/plb QC: NBL
July 2, 1998 2:12 Annual Reviews AR062-02
SNE Ia AND THE HUBBLE CONSTANT 43
in producing the light curve and colors of a normal bright SN Ia. The heliumignitors do not work at all for subluminous SN Ia like SN 1991bg because the56Ni in the outer layers keeps the photosphere hot and the colors too blue.
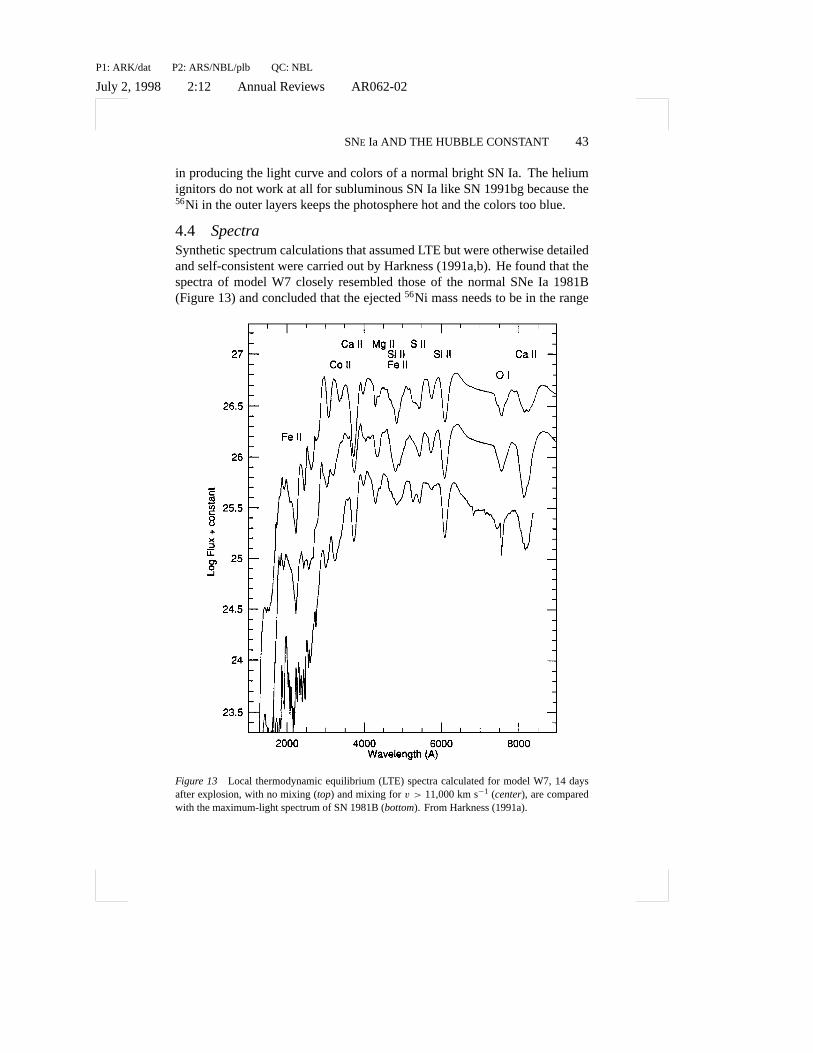
4.4 SpectraSynthetic spectrum calculations that assumed LTE but were otherwise detailedand self-consistent were carried out by Harkness (1991a,b). He found that thespectra of model W7 closely resembled those of the normal SNe Ia 1981B(Figure 13) and concluded that the ejected56Ni mass needs to be in the range
Figure 13 Local thermodynamic equilibrium (LTE) spectra calculated for model W7, 14 daysafter explosion, with no mixing (top) and mixing forv > 11,000 km s−1 (center), are comparedwith the maximum-light spectrum of SN 1981B (bottom). From Harkness (1991a).

P1: ARK/dat P2: ARS/NBL/plb QC: NBL
July 2, 1998 2:12 Annual Reviews AR062-02
44 BRANCH
0.5–0.8 M , with the W7 value, 0.6 M, appearing to be optimum. Recently,detailed nonlocal thermodynamic equilibrium (NLTE) spectrum calculationshave begun to be made (e.g. Baron et al 1996, Pauldrach et al 1996). H¨oflich(1995) compared synthetic spectra of delayed-detonation models with spectraof SN 1994D and found that models havingMNi ' 0.6 provided the best fits.Nugent et al (1995a, 1997) found that W7 models provided good fits to thespectra of SNe 1981B, 1992A, and 1994D (Figure 14). Nugent et al (1995c)adopted the W7 composition structure and varied just the effective temperature
Figure 14 NLTE spectra calculated for model W7 are compared to spectra of SN 1994D atmaximum light and SN 1992A 5 days after maximum light. From Nugent et al (1997).
P1: ARK/dat P2: ARS/NBL/plb QC: NBL
July 2, 1998 2:12 Annual Reviews AR062-02
SNE Ia AND THE HUBBLE CONSTANT 45
to generate a sequence of maximum-light spectra that resembled the sequenceof observed maximum-light spectra all the way from SN 1991bg through SN1986G and normal SN Ia to SN 1991T (Figure 1,left panel). This means that thedifferences between the maximum-light spectra of SNe Ia, like the differencesbetween the spectra of stars, are mainly due to differences in temperature. Theroot cause of the temperature range in real SNe Ia presumably is a range inMNi,and the whole composition structure surely also varies along the sequence in away that has yet to be determined.
Hoflich et al (1997) and Nugent et al (1997) also calculated spectra of helium-ignitor models and found that they did not give satisfactory fits to the spectraof SNe Ia. The exploration of helium-ignitor models was well motivated onphysical grounds (Livne 1990, Woosley & Weaver 1994a), so the interestingquestion about them is why do we not see them? It should be acknowledgedhere that on the basis of their calculations of late nebular spectra of explosionmodels, Liu et al (1997a,b) favored sub-Chandrasekhar mass ejection for normalSNe Ia and even SN 1991T; Ruiz-Lapuente (1996) did not. The calculationof nebular spectra is hampered by a lack of reliable atomic data, although thesituation is improving (Liu et al 1997c). In any case, it is not clear why sub-Chandrasekhar C-O white dwarfs that lack the deadly surface helium layer ofthe helium-ignitor models should explode. Another issue with respect to thenebular phase is that there are indications from light-curve shapes (Cappellaroet al 1998, Colgate et al 1997, Milne et al 1998) that at late times, positronsfrom Co56 decay are not completely trapped, as is usually assumed.
Detailed NLTE spectrum calculations are invaluable for falsifying hydrody-namical models, but since the number of parameterized hydro models that canbe imagined is infinite and the number of spectra that can be calculated in NLTEis limited by computational complexity, a much more empirical approach to SNspectroscopy also is useful. Fisher et al (1997) used a fast, parameterized spec-trum synthesis code to study a high-quality spectrum of the normal SN Ia 1990Nthat was obtained 14 days before maximum light by Leibundgut et al (1991a).Fisher et al (1997) suggested that the absorption observed near 6040A, whichhad been attributed toλ6355 of Si II, actually was produced byλ6580 of C IIin a high-velocity (v > 26,000 km s−1) carbon-rich region. Such a layer wouldbe consistent with published delayed-detonation models. A Fisher, D Branch,K Hatano, and E Baron (manuscript in preparation) suggest that in the peculiarSN 1991T, the “Si II” absorption is dominated by C IIλ6580 before and per-haps even at maximum light. On the basis of the empirical constraints on thecomposition structure of SN 1991T together with estimates of the luminosityof SN 1991T, which must be checked with a Cepheid distance, Branch (1998)and Fisher et al (manuscript in preparation, noted above) suggest that peculiarevents like SN 1991T are superluminous, usually extinguished, substantially

P1: ARK/dat P2: ARS/NBL/plb QC: NBL
July 2, 1998 2:12 Annual Reviews AR062-02
46 BRANCH
super-Chandrasekhar mergers from the youngest populations that are able toproduce SNe Ia in this way,∼108 years (Tutukov & Yungelson 1994).
4.5 SummarySNe Ia appear to be carbon ignitors. If normal SNe Ia are Chandrasekhar-mass explosions in single-degenerate progenitor systems, their light curvesand spectra indicate that they ejectMNi ' 0.6 M¯. If they are mergers ofdouble degenerates, they should be at least mildly super-Chandrasekhar andthen should eject somewhat more56Ni to achieve the temperature needed toaccount for their spectra.
5. H0 FROM PHYSICAL CONSIDERATIONS
To first order, there is a natural SN Ia peak luminosity—the instantaneousradioactivity luminosity, i.e. the rate at which energy is released by56Ni and56Co decay at the time of maximum light (Arnett 1982, Arnett et al 1985, Branch1992). With certain simplifying assumptions, the peak luminosity is predictedto be identical to the instantaneous radioactivity luminosity. The extent towhich they differ, for a hydrodynamical explosion model, can be determinedonly by means of detailed light curve calculations that take into account thedependence of the opacity on the composition and the physical conditions. Thestate of the art is represented by the calculations of H¨oflich & Khokhlov (1996).The calculated peak luminosity of the models turns out to be proportional toMNi within uncertainties, and for models that can be considered to be in therunning as representations of normal SNe Ia (carbon ignitors that take longerthan 15 days to reach maximum light in theV band), the characteristic ratio ofthe peak luminosity to the radioactivity luminosity is about 1.2 (Branch et al1997). The physical reason that the ratio exceeds unity in such models wasexplained by Khokhlov et al (1993) in terms of the dependence of the opacityon the temperature, which is falling around the time of maximum light.
Hoflich & Khokhlov’s (1996) light-curve calculations can be used to estimateH0 in various ways. H¨oflich & Khokhlov (1996) themselves compared theobserved light curves of 26 SNe Ia (9 in galaxies having radial velocities greaterthan 3000 km s−1) to their calculated light curves in two or more broadbands,to determine the acceptable model(s), the extinction, and the distance for eachevent. From the distances and the parent-galaxy radial velocities, they obtainedH0 = 67 ± 9. Like the empirical MLCS method, this approach has the attrac-tive feature of deriving individual extinctions. But identifying the best model(s)for a SN while simultaneously extracting its extinction and distance, all fromthe shapes of its light curves, is a tall order. This requires not only accuratecalculations but also accurate light curves, and the photometry of some of the
P1: ARK/dat P2: ARS/NBL/plb QC: NBL
July 2, 1998 2:12 Annual Reviews AR062-02
SNE Ia AND THE HUBBLE CONSTANT 47
SNe Ia that were used by H¨oflich & Khokhlov (1996) has since been revised(Patat et al 1997). And because H¨oflich & Khokhlov’s (1996) models includedmany more underluminous than overluminous SNe (the former being of interestin connection with weak SN Ia like SN 1991bg) while the formal light-curvefitting technique has a finite “model resolution,” a bias towards deriving lowluminosities and short distances for the observed SNe Ia is possible.
There are less ambitious but perhaps safer ways to use H¨oflich & Khokhlov’s(1996) models to estimateH0 that involve an appeal to the homogeneity ofnormal SNe Ia and rely only on the epoch of maximum light when both themodels and the data are at their best. The 10 Chandrasekhar-mass modelshaving 0.49≤ MNi ≤ 0.67—i.e. those havingMNi within the acceptable rangefor normal SNe Ia—have a meanMNi = 0.58 M¯ and a meanMV = −19.44.Alternatively, the five models (W7, N32, M35, M36, PDD3) that H¨oflich &Khokhlov (1996) found to be most often acceptable for observed SNe Ia have ameanMNi = 0.58 and a meanMV = −19.50. UsingMV = −19.45 ± 0.2 inEquation 1 givesH0 = 56 ± 5, neglecting extinction of the non-red Hubble-flow SNe Ia.
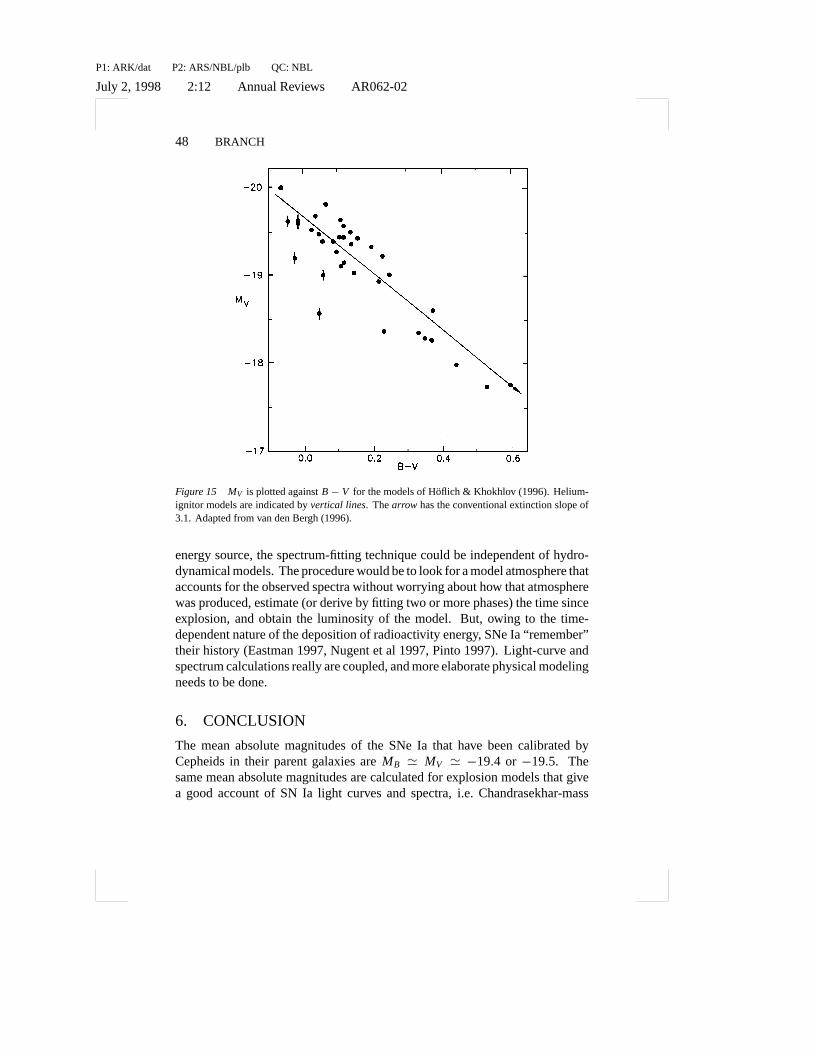
Hoflich & Khokhlov’s (1996) light-curve calculations were used in anotherway by van den Bergh (1995). Noting that the maximum lightMV andB− Vvalues of the models obey a relation that mimics that which would be producedby extinction (Figure 15), he matched the model relation betweenMV andB − V to the relation of the observed Hubble-flow SN Ia and obtained valuesof H0 in the range of 55–60, depending on how the models were weighted. Ifhelium-ignitor models had been excluded, the resultingH0 would have been abit lower because the models are underluminous for theirB − V colors. Thisprocedure has the virtue of needing no estimates of extinction. The same resultcan be seen from figure 3 of H¨oflich et al (1996), who plottedMV versusB−Vfor Hoflich & Khokhlov (1996) models and for the Cal´an-Tololo SNe Ia. Forthe assumed value ofH0 = 65, the relations betweenMV and B − V for themodels and the observed SNe Ia are offset, andH0 would need to be loweredto about 55 to bring them into agreement.
In their figure 2, Hoflich et al (1996) also plotMV versus aV-band light-curvedecline parameter that is analogous to1m15, for the models and for the Cal´an-Tololo SNe Ia. Again withH0 = 65, the models and the observed SNe I areoffset, withH0 needing to be lowered to about 55 to bring them into agreement.
Distances to SNe Ia also can be derived by fitting detailed NLTE syntheticspectra to observed spectra. Nugent et al (1995b) used the fact that the peak lu-minosities inferred from radioactivity-powered light curves and from spectrumfitting depend on the rise time in opposite ways, in order to simultaneously de-rive the characteristic rise time and luminosity of normal SNe Ia and obtainedH0 = 60+14
−11. If SN Ia atmospheres were not powered by a time-dependent
P1: ARK/dat P2: ARS/NBL/plb QC: NBL
July 2, 1998 2:12 Annual Reviews AR062-02
48 BRANCH
Figure 15 MV is plotted againstB− V for the models of H¨oflich & Khokhlov (1996). Helium-ignitor models are indicated byvertical lines. Thearrow has the conventional extinction slope of3.1. Adapted from van den Bergh (1996).
energy source, the spectrum-fitting technique could be independent of hydro-dynamical models. The procedure would be to look for a model atmosphere thataccounts for the observed spectra without worrying about how that atmospherewas produced, estimate (or derive by fitting two or more phases) the time sinceexplosion, and obtain the luminosity of the model. But, owing to the time-dependent nature of the deposition of radioactivity energy, SNe Ia “remember”their history (Eastman 1997, Nugent et al 1997, Pinto 1997). Light-curve andspectrum calculations really are coupled, and more elaborate physical modelingneeds to be done.
6. CONCLUSION
The mean absolute magnitudes of the SNe Ia that have been calibrated byCepheids in their parent galaxies areMB ' MV ' −19.4 or −19.5. Thesame mean absolute magnitudes are calculated for explosion models that givea good account of SN Ia light curves and spectra, i.e. Chandrasekhar-mass
P1: ARK/dat P2: ARS/NBL/plb QC: NBL
July 2, 1998 2:12 Annual Reviews AR062-02
SNE Ia AND THE HUBBLE CONSTANT 49
carbon-ignitor models that eject about 0.6 M¯ of 56Ni. UsingMB = −19.45±0.2 in Equation 1, based on the 26 non-red Cal´an-Tololo Hubble-flow events,would giveH0 = 56± 5, but various workers using the Cepheid-based SN Iaabsolute magnitudes and physical models in various ways have obtained valuesof H0 ranging from about 54 to 67. Those who want a consensus value fromSNe Ia with conservative errors could use, for now,H0 = 60± 10.
This value depends heavily on three things: the Cepheid distances of the HSTSN Ia Consortium, the light-curve calculations of H¨oflich & Khokhlov (1996),and the observed light curves of the Cal´an-Tololo Hubble-flow SNe Ia. Atpresent, the main issue about the Cepheid distances appears to be the possibilityof a significant metallicity dependence. Some technical issues that bear on theaccuracy of the complex light-curve calculations remain to be resolved, but themain issue here is the value of the ejected nickel mass, which in turn dependson whether the total ejected mass is Chandrasekhar, super-Chandrasekhar, orsub-Chandrasekhar. The main issue about the Hubble-flow SNe Ia probablyhas to do with selection bias. For example, many of the Cal´an-Tololo eventspeaked not far above the detection limit. If the Cal´an-Tololo events are selectedfrom the bright end of the non-red SN Ia absolute-magnitude distribution, thenthe absolute-magnitude dispersions from the Cal´an-Tololo survey are probablytoo low, the mean absolute magnitude of non-red SNe Ia in Equation 1 is toobright (for a fixedH0), and most of our current estimates ofH0 from SNe Iaprobably are too high.
This particular reviewer, chock full of opinions and suspicions about wherethe errors and biases in the present analyses are likely to be, goes out on a limb(where a branch belongs) and suggests that when all has been said and done,H0 from SNe Ia will be in the 50s.
ACKNOWLEDGMENTS
The names of colleagues from whom I have learned about SNe Ia range fromAbi to Zalman and would a fill a page, but for numerous discussions at theUniversity of Oklahoma, I must thank Eddie Baron, Adam Fisher, and PeterNugent. Part of this review was written in Trieste during a stimulating visitto the International School of Advanced Studies (SISSA), for which I am in-debted to my host, Dennis Sciama. I want to conclude by expressing myappreciation of Allan Sandage and Gustav Tammann for their insights and theirperseverance.
Visit the Annual Reviews home pageathttp://www.AnnualReviews.org.
P1: ARK/dat P2: ARS/NBL/plb QC: NBL
July 2, 1998 2:12 Annual Reviews AR062-02
50 BRANCH
Literature Cited
Arnett WD. 1982. Type I supernovae. I. Ana-lytic solutions for the early part of the lightcurve.Ap. J.253:785–97
Arnett WD, Branch D, Wheeler JC. 1985. Hub-ble’s constant and exploding carbon-oxygenwhite dwarf models for Type Ia supernovae.Nature314:337–38
Arnett WD, Livne E. 1994a. The delayed det-onation model of Type Ia supernovae. I. Thedeflagration phase.Ap. J.427:315–29
Arnett WD, Livne E. 1994b. The delayed deto-nation model of Type Ia supernovae. II. Thedetonation phase.Ap. J.427:330–41
Barbon R, Benetti S, Cappellaro E, Rosino L,Turatto M. 1990. Type Ia supernova 1989Bin NGC 3627.Astron. Astrophys.237:79–90
Baron E, Hauschildt PH, Nugent P, Branch D.1996. Non-local thermodynamic equilibriumeffects in modeling of supernovae near max-imum light.MNRAS283:297–315
Benz W, Cameron AGW, Bowers RL, PressWH. 1990. Dynamic mass exchange in dou-bly degenerate binaries. I. 0.9 and 1.2 M¯stars.Ap. J.348:647–67
Bowers EJC, Meikle WPS, Geballe TR, WaltonNA, Pinto PA, et al. 1997. Infrared and op-tical spectroscopy of Type Ia supernovae inthe nebular phase.MNRAS290:663–79
Branch D. 1992. The Hubble constant fromnickel radioactivity in Type Ia supernovae.Ap J.392:35–40
Branch D. 1998. Early-time spectra of TypeIa supernovae and the nature of the peculiarSN 1991T. InSupernovae and Cosmology,ed. L Labhardt, B Bingelli, R Buser. SchaubDruck: Sissach. In press
Branch D, Doggett JB, Nomoto K, ThielemannF-K. 1985. Accreting white dwarf modelsfor Type I supernovae. IV. The optical spec-tra of carbon deflagration supernovae.Ap. J.294:619–25
Branch D, Drucker W, Jeffery DJ. 1988. Differ-ences among expansion velocities of Type Iasupernovae.Ap. J. Lett.330:L117–18
Branch D, Fisher A, Baron E, Nugent P. 1996a.On van den Bergh’s method for measuring theHubble constant from Type Ia supernovae.Ap. J. Lett.470:L7–L9
Branch D, Fisher A, Herczeg TH, Miller DL,Nugent P. 1994. The distance to the Type Iasupernova 1972E and its parent galaxy NGC5253: a prediction.Ap. J. Lett.421:L87–L90
Branch D, Fisher A, Nugent P. 1993. On therelative frequencies of spectroscopically nor-mal and peculiar Type Ia supernovae.Astron.J. 106:2383–91
Branch D, Livio M, Yungelson LR, Boffi FR,Baron E. 1995. In search of the progenitors
of Type Ia supernovae.Publ. Astron. Soc. Pac.107:1019–29
Branch D, Nugent P, Fisher A. 1997. Type Ia su-pernovae as extragalactic distance indicators.See Ruiz-Lapuente et al, 1997b, pp. 715–34
Branch D, Romanishin W, Baron E. 1996b. Sta-tistical connections between the properties ofType Ia supernovae and theB− V colors oftheir parent galaxies, and the value ofH0. Ap.J. 465:73–78
Branch D, Tammann GA. 1992. Type Ia super-novae as standard candles.Annu. Rev. Astron.Astrophys.30:359–89
Branch D, van den Bergh S. 1993. Spectro-scopic differences between supernovae ofType Ia in early-type and in late-type galax-ies.Astron. J.105:2231–35
Cappellaro E, Mazzali PA, Benetti S, DanzigerIJ, Turatto M, et al. 1998. SN Ia light curvesand radioactive decay.Astron. Astrophys.328:203–10
Chiosi C, Wood PR, Capitanio N. 1993. Theore-tical models of Cepheid variables and theircolors and magnitudes.Ap. J. Suppl.86:541–98
Colgate SA, Fryer CL, Hand KP. 1997. Lowmass SNe Ia and the late light curve. SeeRuiz-Lapuente et al, 1997b, pp. 273–302
Cristiani S, Cappellaro E, Turatto M, BergeronJ, Bues I, et al. 1992. The SN 1986G in Cen-taurus A.Astron. Astrophys.259:63–70
Cumming RJ, Lundqvist P, Smith LJ, PettiniM, King DL. 1996. Circumstellar Hα fromSN 1994D and future Type Ia supernovae:an observational test of progenitor models.MNRAS283:1355–60
Della Valle M, Panagia N. 1992. Type Ia super-novae in late type galaxies: reddening cor-rection, scale height, and absolute maximummagnitude.Astron. J.104:696–703
Eastman RG. 1997. Radiation transport in TypeIa supernovae. See Ruiz-Lapuente et al,1997b, pp. 571–88
Eck C, Cowan JJ, Roberts D, Boffi FR, BranchD. 1996. Radio observations of the Type Iasupernova 1986G as a test of a symbiotic-starprogenitor.Ap. J. Lett.451:L53–L55
Feast MW, Catchpole RM. 1997. The Cepheidperiod-luminosity zero-point from Hipparcostrigonometrical parallaxes.MNRAS286:L1–L5
Filippenko AV. 1997. Optical spectra of super-novae.Annu. Rev. Astron. Astrophys.35:309–55
Filippenko AV, Richmond MW, Branch D,Gaskell CM, Herbst W, et al. 1992a. The sub-luminous, spectroscopically peculiar Type Ia
P1: ARK/dat P2: ARS/NBL/plb QC: NBL
July 2, 1998 2:12 Annual Reviews AR062-02
SNE Ia AND THE HUBBLE CONSTANT 51
supernova 1991bg in the elliptical galaxyNGC 4374.Astron. J.104:1543–55
Filippenko AV, Richmond MW, Matheson T,Shields JC, Burbidge EM, et al. 1992b. Thepeculiar Type Ia SN 1991T: detonation of awhite dwarf?Ap. J.384:L15–L18
Fisher A, Branch D, H¨oflich PA, Khokhlov A.1995. The minimum ejection velocity of cal-cium in Type Ia supernovae and the value ofthe Hubble constant.Ap. J. Lett.447:L73–L76
Fisher A, Branch D, Nugent P, Baron E. 1997.Evidence for a high-velocity carbon-richlayer in the Type Ia SN 1990N.Ap. J. Lett.481:L89–L92
Freedman WL. 1997. Determination of the Hub-ble constant. InCritical Dialogues in Cos-mology, ed. N Turok, pp. 92–129. Singapore:World Sci.
Freedman WL, Madore BF, Kennicutt RC.1997. Hubble Space Telescope key projecton the extragalactic distance scale. See Livioet al, 1997, pp. 171–85
Garnavich PM, Kirshner RP, Challis P, Tonry J,Gilliland RL, et al. 1998. Constraints on cos-mological models from Hubble Space Tele-scope observations of high-zsupernovae.Ap.J. Lett.In press
Goldhaber G, Deustra S, Gabi S, Groom DE,Hook I, et al. 1997. Observations of cosmo-logical time dilation using Type Ia super-novae as clocks. See Ruiz-Lapuente et al,1997b, pp. 777–84
Gomez G, Lopez R, S´anchez F. 1996. The Ca-narias Type Ia supernova archive.Astron. J.112:2094–109
Gould A. 1994. The metallicity dependence ofinferred Cepheid distances.Ap. J.426:542–52
Hachisu I, Kato M, Nomoto K. 1996. A newmodel for progenitor systems of Type Ia su-pernovae.Ap. J. Lett.470:L97–100
Hamuy M, Maza J, Phillips MM, Suntzeff NB,Wischnjewsky M, et al. 1993. The 1990Calan/Tololo supernova search.Astron. J.106:2392–407
Hamuy M, Phillips MM, Maza J, Suntzeff NB,Della Valle M, et al. 1995a. SN 1992K: a twinto the subluminous Type Ia SN 1991bg.As-tron. J.108:2226–32
Hamuy M, Phillips MM, Maza J, WischnjewskyM, Uomoto A, et al. 1991. The optical lightcurves of SN 1980N and SN 1981D in NGC1316 (Fornax A).Astron. J.102:208–17
Hamuy M, Phillips MM, Schommer RA,Suntzeff NB, Maza J, Avil´es R. 1996a. Theabsolute luminosities of the Cal´an/TololoType Ia supernovae.Astron. J. 112:2391–97
Hamuy M, Phillips MM, Suntzeff NB, Schom-mer RA, Maza J, Aviles R. 1995b. A Hub-
ble diagram of distant supernovae.Astron. J.109:1–13
Hamuy M, Phillips MM, Suntzeff NB, Schom-mer RA, Maza J, Aviles R. 1996b. The Hub-ble diagram of the Cal´an/Tololo Type Ia su-pernovae and the value ofH0. Astron. J.112:2398–407
Hamuy M, Phillips MM, Suntzeff NB, Schom-mer RA, Maza J, et al. 1996c.BVRI lightcurves for 29 Type Ia supernovae.Astron. J.112:2408–37
Hamuy M, Phillips MM, Suntzeff NB, Schom-mer RA, Maza J, et al. 1996d. The morphol-ogy of Type Ia supernova light curves.Astron.J. 112:2438–47
Harkness R. 1991a. A comparison of carbondeflagration models for SNe Ia. InSuper-novae, ed. SE Woosley, pp. 454–63. NewYork: Springer
Harkness R. 1991b. Type Ia supernovae. InSN 1987A and Other Supernovae, ed. IJDanziger, K Kjar, pp. 447–56. Dordrecht:Kluwer
Hatano K, Deaton J, Branch D. 1998.Ap. J. Lett.In press
Ho LC, Filipppenko AV. 1995. Probing the inter-stellar medium along the lines of site to super-novae 1994D and 1994I.Ap. J.444:165-74;Erratum: 463:818
Hoflich P. 1995. Analysis of the Type Ia super-nova 1994D.Ap. J.443:89–108
Hoflich P, Khokhlov A. 1996. Explosion modelsfor Type Ia supernovae: a comparison withobserved light curves, distances,H0, andq0.Ap. J.457:500–28
Hoflich P, Khokhlov A, Muller E. 1992.Gamma-ray light curves and spectra of TypeIa supernovae.Astron. Astrophys.259:549–66
Hoflich P, Khokhlov A, Muller E. 1993. Lightcurve models for Type Ia supernovae: physi-cal assumptions, their influence and validity.Astron. Astrophys.268:570–90
Hoflich P, Khokhlov A, Wheeler JC, NomotoK, Thielemann F-K. 1997. Explosion mod-els, light curves, spectra, andH0. See Ruiz-Lapuente et al, 1997b, pp. 659–79
Hoflich P, Khokhlov A, Wheeler JC, PhillipsMM, Suntzeff NB, Hamuy M. 1996. Max-imum brightness and postmaximum declineof light curves of Type Ia supernovae: a com-parison of theory and observations.Ap. J.472:L81–L84
Iben II. 1997. Scenarios for Type Ia supernovae.See Ruiz-Lapuente et al, 1997b, pp. 111–26
Iben II, Tutukov AV. 1984. Supernovae of TypeI as end products of the evolution of binarieswith components of moderate initial mass(M ≤ 9 M¯). Ap. J. Suppl.54:335–72
Jacoby GH, Pierce MJ. 1996. Response toSchaefer’s comments on Pierce & Jacoby

P1: ARK/dat P2: ARS/NBL/plb QC: NBL
July 2, 1998 2:12 Annual Reviews AR062-02
52 BRANCH
(1995) regarding the Type Ia supernova1937C.Astron. J.112:723–31
Jeffery DJ, Leibundgut B, Kirshner RP, BenettiS, Branch D, Sonneborn G. 1992. Analysis ofthe photospheric epoch spectra of Type Ia su-pernovae 1990N and 1991TAp. J.397:304–28
Kennicutt RC, Stetson PB, Saha A, Kelson D,Rawson D, et al. 1998. TheHSTkey projecton the extragalactic distance scale XIII. Themetallicity dependence of the Cepheid dis-tance scale.Ap. J.In press
Khokhlov A, Muller E, Hoflich P. 1993. Lightcurves of Type Ia supernova models with dif-ferent explosion mechanisms.Astron. Astro-phys.270:223–48
Kim AG, Gabi S, Goldhaber G, Groom DE,Hook IM, et al. 1997. Implications for theHubble constant from the first seven super-novae atz≥ 0.35.Ap. J. Lett.476:L63–66
Kirshner RP, Jeffery DJ, Leibundgut B, Son-neborn G, Phillips MM, et al. 1993. SN1992A: ultraviolet and optical observationsbased on HST, IUE, and CTIO observations.Ap. J.415:589–615
Kochanek CS. 1997. Rebuilding the Cepheiddistance scale. I. A global analysis of Cepheidmean magnitudes.Ap. J. 491:13–28
Leibundgut B, Kirshner RP, Filippenko AV,Shields JC, Foltz CB, et al. 1991a. Premax-ium observations of the Type Ia SN 1990N.Ap. J. Lett.371:L23–26
Leibundgut B, Kirshner RP, Phillips MM, WellsLA, Suntzeff NB, et al. 1993. SN 1991bg: aType Ia supernova with a difference.Astron.J. 105:301–13
Leibundgut B, Schommer R, Phillips MM,Riess A, Schmidt B, et al. 1996. Time di-lation in the light curve of the distant Type Iasupernova 1995K.Ap. J. Lett.466:L21–L24
Leibundgut B, Tammann GA, Cadonau R, Cer-rito D. 1991b. Supernova studies. VII. An at-las of the light curves of supernovae Type I.Astron. Astrophys. Suppl.89:537–79
Li X-D, van den Heuvel EPJ. 1997. Evolu-tion of white dwarf binaries: supersoft X-ray sources and progenitors of Type Ia super-novae.Astron. Astrophys.322:L9–12
Lira P. 1996.Light curves of the supernovae1990N and 1991T.MS thesis. Univ. Chile
Lira P, Suntzeff NB, Phillips MM, Hamuy M,Maza J, et al. 1998. Optical light curves ofthe Type Ia supernovae 1990N and 1991T.Astron. J.115:234–46
Liu W, Jeffery DJ, Schultz DR. 1997a. Nebu-lar spectra of Type Ia supernovae.Ap. J. Lett.483:L107–10
Liu W, Jeffery DJ, Schultz DR. 1997b. Nebu-lar spectra of the unusual Type Ia supernova1991T.Ap. J. Lett.486:L35–38
Liu W, Jeffery DJ, Schultz DR, Quinet P, Shaw
J, Pindzola MS. 1997c. Emission from cobaltin type Ia supernovae.Ap. J. Lett.489:L141–43
Livio M, Donahue M, Panagia N, eds. 1997.TheExtragalactic Distance Scale.Cambridge:Cambridge Univ. Press
Livne E. 1990. Successive detonations in accret-ing white dwarfs as an alternative mechanismfor Type Ia supernovae.Ap. J.354:L53–55
Livne E, Arnett WD. 1995. Explosions of sub-Chandrasekhar mass white dwarfs in two di-mensions.Ap. J.452:62–74
Lundqvist P, Cumming RJ. 1997. Supernovaprogenitor constraints from circumstellar in-teraction: Type Ia. InAdvances in StellarEvolution, ed. RT Rood, A Renzini, pp. 293–97. Cambridge: Cambridge Univ. Press
Madore BF, Freedman WL. 1991. The Cepheiddistance scale.Publ. Astron. Soc. Pac.103:933–57
Madore BF, Freedman WL. 1998. Hipparcosparallaxes and the Cepheid distance scale.Ap.J. Lett.492:110–15
Mazzali PA, Chugai N, Turatto M, Lucy LB,Danziger IJ, et al. 1997. The properties ofthe peculiar Type Ia supernova 1991bg. II.The amount of56Ni and the total ejecta massdetermined from spectrum synthesis and en-ergetics considerations.MNRAS284:151–71
Mazzali PA, Danziger IJ, Turatto M. 1995. Astudy of the properties of the peculiar SN Ia1991T through models of its evolving early-time spectra.Astron. Astrophys.297:509–34
Mazzali PA, Lucy LB, Danziger IJ, Gouiffes C,Cappellaro E, Turatto M. 1993. Models forthe early-time spectral evolution of the stan-dard type Ia supernova 1990N.Astron. Astro-phys.269:423–45
Meikle WPS, Cumming RJ, Geballe TR, LewisJR, Walton NA, et al. 1996. An early-time in-frared and optical study of the Type Ia super-novae 1994D and 1991T.MNRAS281:263–80
Milne PA, The L-S, Leising MD. 1998. Ispositron escape seen in the light curves ofType Ia supernovae?Ap. J.In press
Minkowski R. 1939. The spectra of the super-novae in IC 4182 and NGC 1003.Ap. J.89:156–217
Mochkovitch R, Guerrero J, Segretain L. 1997.The merging of white dwarfs. See Ruiz-Lapuente et al, 1997b, pp. 187–204
Mochkovitch R, Livio M. 1990. The coales-cence of white dwarfs and Type I supernovae.The merged configuration.Astron. Astrophys.236:378–84
Nomoto K, Iwamoto K, Nakasato N, Thiele-mann F-K, Brachwitz F, et al. 1997. TypeIa supernovae: progenitors and constraintson nucleosynthesis. See Ruiz-Lapuente et al1997b, pp. 349–78
P1: ARK/dat P2: ARS/NBL/plb QC: NBL
July 2, 1998 2:12 Annual Reviews AR062-02
SNE Ia AND THE HUBBLE CONSTANT 53
Nomoto K, Thielemann F-K, Yokoi K. 1984.Accreting white dwarf models for Type Iasupernovae. III. Carbon deflagration super-novae.Ap. J.286:644–58
Nugent P, Baron E, Branch D, Fisher A,Hauschildt PH. 1997. Synthetic spectra of hy-drodynamical models of Type Ia supernovae.Ap. J.485:812–19
Nugent P, Baron E, Hauschildt PH, Branch D.1995a. Spectrum synthesis of the Type Ia su-pernovae 1992A and 1981B.Ap. J.441:L33–36
Nugent P, Branch D, Baron E, Fisher A,Vaughan TE, Hauschildt PH. 1995b. LowHubble constant from the physics of Type Iasupernovae.Phys. Rev. Lett.75:394–97; Er-ratum: 75:1874
Nugent P, Phillips M, Baron E, Branch D,Hauschildt PH. 1995c. Evidence for a spec-troscopic sequence among Type Ia super-novae.Ap. J. Lett.455:L147–50
Patat F, Barbon R, Cappellaro E, Turatto M.1997. Revised photometry and color distri-bution of Type Ia supernovae observed atAsiago in the seventies.Astron. Astrophys.317:423–31
Patat F, Benetti S, Cappellaro E, Danziger IJ,Della Valle M, et al. 1996. The Type Ia sup-pernova 1994D in NGC 4526: the earlyphases.MNRAS278:111–24
Pauldrach AWA, Duschinger M, Mazzali PA,Puls J, Lennon M, Miller DL. 1996. NLTEmodels for synthetic spectra of Type Ia su-pernovae.Astron. Astrophys.312:525–38
Perlmutter S, Aldering G, Della Valle M,Deustua S, Ellis RS, et al. 1998. Discovery ofa supernova explosion at half the age of theUniverse and its cosmological implications.Nature391:51–54
Perlmutter S, Deustua S, Goldhaber G, GroomD, Hook I, et al. 1997a.Supernovae. IAUCirc. No. 6621
Perlmutter S, Gabi S, Goldhaber S, Groom DE,Hook IM, et al. 1997b. Measurements of thecosmological parametersÄ and3 from thefirst seven supernovae atz ≥ 0.35. Ap. J.483:565–81
Phillips MM. 1993. The absolute magnitudes ofType Ia supernovae.Ap. J. Lett.413:L105–8
Phillips MM, Phillips AC, Heathcote SR,Blanco VM, Geisler D. 1987. The Type Iasupernova 1986G in NGC 5128: optical pho-tometry and spectroscopy.Publ. Astron. Soc.Pac.99:592–605
Phillips MM, Wells LA, Suntzeff NB, HamuyM, Leibundgut B, et al. 1992. SN 1991T: fur-ther evidence of the heterogeneous nature ofType Ia supernovae.Astron. J.103:1632–37
Pierce MJ, Jacoby GH. 1995. “New”B andV photometry of the “old” Type Ia super-
nova 1937C: implications forH0. Astron. J.110:2885–909
Pinto PA. 1997. Time dependence and the opac-ity of Type Ia supernovae. See Ruiz-Lapuenteet al, 1997b, pp. 607–25
Pskovskii YP. 1977. Brightness, color, and ex-pansion velocity of SNe I as functions of therate of brightness decline.Sov. Astron. AJ.21:675
Rappaport SA, Di Stefano R, Smith M. 1994.Formation and evolution of supersoft X-raysources.Ap. J.426:692–703
Rasio FA, Shapiro SL. 1995. Hydrodynamicsof binary coalescence. II. Polytropes with0 = 5/3. Ap. J.438:887–903
Renzini A. 1996. Searching for Type Ia super-nova progenitors. InSupernovae and Super-nova Remnants, ed. R McCray, Z Wang, pp.77–85. Cambridge: Cambridge Univ. Press
Richmond MW, Treffers RR, Filippenko AV,Van Dyk SD, Paik Y, et al. 1995.UBVRIpho-tometry of the Type Ia SN 1994D in NGC4526.Astron. J.109:2121–33
Riess AG. 1996.Type Ia supernova multicolorlight curve shapes.PhD thesis. Harvard Univ.
Riess AG, Davis M, Baker J, Kirshner RP.1997a. The velocity field from Type Ia super-novae matches the gravity field from galaxysurveys.Ap. J.488:L1–L5
Riess AG, Filippenko AV, Leonard DC, SchmidtBP, Suntzeff N, et al. 1997b. Time dilationfrom spectral feature age measurements ofType Ia supernovae.Astron. J.114:722–29
Riess AG, Nugent P, Filippenko AV, KirshnerRP, Perlmutter S. 1998. Snapshot distancesto SNe Ia—all in “one” night’s work.Ap. J.In press
Riess AG, Press WH, Kirshner RP. 1995a. Us-ing Type Ia supernova light curve shapes tomeasure the Hubble constant.Ap. J. Lett.438:L17–20
Riess AG, Press WH, Kirshner RP. 1995b. De-termining the motion of the local group usingType Ia supernova light curve shapes.Ap. J.Lett.445:L91–94
Riess AG, Press WH, Kirshner RP. 1996a. Aprecise distance indicator: Type Ia supernovamulticolor light-curve shapes.Ap. J.473:88–109
Riess AG, Press WH, Kirshner RP. 1996b. Is thedust obscuring supernovae in distant galaxiesthe same as the dust in the Milky Way?Ap.J. 473:588–94
Ruiz-Lapuente P. 1996. The Hubble constantfrom 56Co-powered nebular candles.Ap. J.465:L83–86
Ruiz-Lapuente P, Canal R, Burkert A. 1997a.SNe Ia: on the binary progenitors and ex-pected statistics. See Ruiz-Lapuente et al1997b, pp. 205–30
Ruiz-Lapuente P, Canal R, Isern J, eds. 1997b.
P1: ARK/dat P2: ARS/NBL/plb QC: NBL
July 2, 1998 2:12 Annual Reviews AR062-02
54 BRANCH
Thermonuclear Supernovae.Dordrecht:Kluwer
Ruiz-Lapuente P, Cappellaro E, Turatto M,Gouiffes C, Danziger IJ, et al. 1992. Mod-eling the iron-dominated spectra of the TypeIa supernova 1991T at premaximum.Ap. J.Lett.387:L33–36
Saha A, Labhardt L, Schwengeler H, MacchettoFD, Panagia N, et al. 1994. Discovery ofCepheids in IC 4182: absolute peak bright-ness of SN Ia 1937C and the value ofH0. Ap.J. 425:14–34
Saha A, Sandage A, Labhardt L, SchwengelerH, Tammann GA, et al. 1995. Discoveryof Cepheids in NGC 5253: absolute peakbrightness of SNe Ia 1895B and 1972E andthe value ofH0. Ap. J.438:8–26
Saha A, Sandage A, Labhardt L, Tammann GA,Macchetto FD, Panagia N. 1996a. Cepheidcalibration of the peak brightness of SNe Ia.V. SN 1981B in NGC 4536.Ap. J.466:55–91
Saha A, Sandage A, Labhardt L, Tammann GA,Macchetto FD, Panagia N. 1996b. Cepheidcalibration of the peak brightness of Type Iasupernovae. VI. SN 1960F in NGC 4496A.Ap. J. Suppl.107:693
Saha A, Sandage A, Labhardt L, Tammann GA,Macchetto FD, Panagia N. 1997. Cepheidcalibration of the peak brightness of Type Iasupernovae. VII. SN 1990N in NGC 4639.Ap. J.486:1–20
Saio H, Gautschy A. 1998. On the theoreticalperiod-luminosity relations of Cepheids.Ap.J. In press
Sandage A. 1996. Annual report of the CarnegieObservatories.BAAS28(1):52
Sandage A, Saha A, Tammann GA, PanagiaN, Macchetto FD. 1992. The Cepheid dis-tance to IC 4182; calibration ofMV for SNIa 1937C and the value ofH0. Ap. J. Lett.401:L7–10
Sandage A, Tammann GA. 1982. Steps towardthe Hubble constant. VIII. The global value.Ap. J.256:339–45
Sandage A, Tammann GA. 1993. The Hubblediagram inV for supernovae of Type Ia andthe value ofH0 therefrom.Ap. J.415:1–9
Sandage A, Tammann GA. 1997. The evidencefor the long distance scale withH0 < 65.In Critical Dialogues in Cosmology, ed. NTurok, pp. 130–55. Singapore: World Sci.
Sandage A, Tammann GA. 1998. Confirmationof previous ground-based Cepheid P-L zero-points using Hipparcos trigonometric paral-laxes.MNRASIn press
Sasselov DD, Beaulieu JP, Renault C, GrisonP, Ferlet R, et al. 1997. Metallicity effectson the Cepheid extragalactic distance scalefrom EROS photometry in the Large Magel-lanic Cloud and the Small Magellanic Cloud.Astron. Astrophys.324:471–82
Schaefer BE. 1994. The peak brightness of SN1937C in IC 4182 and the Hubble constant.Ap. J.426:493–501
Schaefer BE. 1995a. The peak brightness of SN1895B in NGC 5253 and the Hubble constant.Ap. J. Lett.447:L13–16
Schaefer BE. 1995b. The peak brightness of su-pernovae in theU band and the Hubble con-stant.Ap. J. Lett.450:L5–9
Schaefer BE. 1995c. The peak brightness of SN1981B in NGC 4536 and the Hubble constant.Ap. J. Lett.449:L9–12
Schaefer BE. 1996a. The peak brightness ofSN 1937C and the Hubble constant: com-ments on Pierce & Jacoby (1995).Astron. J.111:1668–74
Schaefer BE. 1996b. The peak brightness of SN1960F in NGC 4496 and the Hubble constant.Ap. J. Lett.460:L19–23
Schlegel EM, Petre R. 1993. AROSATupperlimit on X-ray emission from SN 1992A.Ap.J. Lett.412:L29–32
Schmidt B, Phillips M, Hamuy M, Avil´es R,Suntzeff N, et al. 1997.Supernovae. IAUCirc. No. 6646
Shigeyama T, Nomoto K, Yamaoka H, Thiele-mann F-K. 1992. Possible models for the typeIa supernova 1990N.Ap. J. Lett.386:L13–16
Stothers RB. 1988. Abundance effects on theCepheid distance scale.Ap. J.329:712–19
Tammann GA, Federspiel M. 1997. Focusing inonH0. See Livio et al, 1997, pp. 137–70
Tammann GA, Sandage A. 1995. The Hubblediagram for supernovae of Type Ia. II. The ef-fects on the Hubble constant of a correlationbetween absolute magnitude and light curvedecay rate.Ap. J.452:16–24
Teerikorpi P. 1997. Observational selection biasaffecting the determination of the extragalac-tic distance scale.Annu. Rev. Astron. Astro-phys.35:101–36
Tripp R. 1997. Using distant Type Ia supernovaeto measure the cosmological expansion pa-rameters.Astron. Astrophys.325:871–76
Tripp R. 1998. A two-parameter luminosity cor-rection for Type Ia supernovae.Astron. Astro-phys.In press
Turatto M, Benetti S, Cappellaro E, DanzigerIJ, Della Valle M, et al. 1996. The propertiesof the peculiar Type Ia supernova 1991bg. I.Analysis and discussion of two years of ob-servations.MNRAS283:1–17
Tutukov A, Yungelson LR. 1994. Merging ofbinary white dwarfs, neutron stars, and blackholes under the influence of gravitationalwave radiation.MNRAS268:871–79
Vacca WD, Leibundgut B. 1996. The rise timesand bolometric light curve of SN 1994D: con-straints on models of Type Ia supernovae.Ap.J. Lett.471:L37–40
van den Bergh S. 1995. A new method for the

P1: ARK/dat P2: ARS/NBL/plb QC: NBL
July 2, 1998 2:12 Annual Reviews AR062-02
SNE Ia AND THE HUBBLE CONSTANT 55
determination of the Hubble parameter.Ap.J. Lett.453:L55–56
van den Bergh S. 1996. The luminosities of su-pernovae of Type Ia derived from Cepheidcalibrations.Ap. J.472:431–34
van den Heuvel EPJ, Bhattacharya D, NomotoK, Rappaport SA. 1992. Accreting whitedwarf models for CAL83, CAL87, and otherultrasoft X-ray sources in the LMC.Astron.Astrophys.262:97–105
Vaughan TE, Branch D, Miller DL, PerlmutterS. 1995. The blue and visual absolute magni-tude distributions of Type Ia supernovae.Ap.J. 439:558–64
von Hippel T, Bothun GD, Schommer RA.1997. Stellar populations and the white dwarfmass function: connections to supernova Ialuminosities.Astron. J.114:1154–64
Wang L, Hoflich P, Wheeler JC. 1997a. Super-novae and their host galaxies.Ap. J.483:L29–L32
Wang L, Wheeler JC, H¨oflich P. 1997b. Po-larimetry of the Type Ia supernova 1996X.Ap. J.476:L27–30
Wang L, Wheeler JC, Li Z, Clocchiatti A.1996. Broadband polarimetry of supernovae:1994D, 1994Y, 1994ae, 1995D, and 1995H.Ap. J.467:435–45
Wells LA, Phillips MM, Suntzeff NB, Heath-
cote SR, Hamuy M, et al. 1994. The Type Iasupernova 1989B in NGC 3627 (M66).As-tron. J.108:2233–50
Wheeler JC, Harkness RP, Khokhlov AM,Hoflich P. 1995. Stirling’s supernovae: asurvey of the field.Phys. Rep.256:211–35
Woosley SE, Weaver TA. 1986. The physics ofsupernova explosions.Annu. Rev. Astron. As-trophys.24:205–53
Woosley SE, Weaver TA. 1994a. Sub-Chandra-sekhar models for Type Ia supernovae.Ap. J.423:371–79
Woosley SE, Weaver TA. 1994b. Massive stars,supernovae, and nucleosynthesis. InSuper-novae, ed. S Bludman, R Mochkovitch, JZinn-Justin, pp. 63–154. Amsterdam: Else-vier
Yungelson LR, Livio M. 1998. Type Ia super-novae: an examination of potential progen-itors and the redshift distribution.Ap. J. Inpress
Yungelson LR, Livio M, Truran JW, Tutukov A,Fedorova A. 1996. A model for the Galacticpopulation of binary supersoft X-ray sources.Ap. J.466:890–910
Zehavi I, Riess AG, Kirshner RP, Dekel A. 1998.A local Hubble bubble from SNe Ia?Ap. J.In press


![arXiv:1004.1856v1 [astro-ph.CO] 11 Apr 2010. 48,2010 1 THE HUBBLE CONSTANT ... Age of Uni-verse Abstract Considerable progress has been made in determining the Hubble constant over](https://img.pdfslide.net/doc/110x75/5af79eb47f8b9a8d1c907abd/arxiv10041856v1-astro-phco-11-apr-2010-482010-1-the-hubble-constant-.jpg)


![Type Ia Supernovae, Dark Energy, and the Hubble Constant · Wikipedia: “He proposed the theory of the expansion of the universe, widely misattributed to Edwin Hubble.[3][4] He was](https://img.pdfslide.net/doc/110x75/5b8708df7f8b9af12d8e3733/type-ia-supernovae-dark-energy-and-the-hubble-wikipedia-he-proposed-the.jpg)