Embed Size (px)
Citation preview
UC ENTERPRISE ARCHITECTUREFRAMEWORK (EAF): THE BUSINESS VALUEUC-ITAG

ITAG Purpose The primary responsibility of ITAG is
to enable integration and interoperability of shared IT services across the UC.
Foundation for Collaboration
UC-ITAG and EAF Mission
Pillar I — Formalize partnerships with UC Leadership groups to jointly establish principles for common or shared solutions and to develop and regularly maintain shared roadmaps of future direction.
Pillar II — Establish the enterprise architecture and technology infrastructure necessary to promote and support interoperability and sharing of IT solutions among and between campuses.

EA Framework Purpose
UC CIOs
ITAG andUCOP EA Team
SharedServices
Align Campus andSystem-wide
Strategy and Plans
Current State Start from scratch Redundancy in
Data Infrastructure Applications Costs
Variances with no standards
One-offimplementations
New State Reuse of
approaches and assets
Increased interoperability
Deliberate variances
Easier UC collaboration
How EAF Addresses Business Needs
Standardized Data Models Metadata Repository Architecture Artifacts “In a Box” Services, i.e. SSO In a Box, ESB In a
Box “Shareable Upon Delivery” initiative, i.e. Cross-
Campus Enrollment System will leverage the Web Services guidelines.
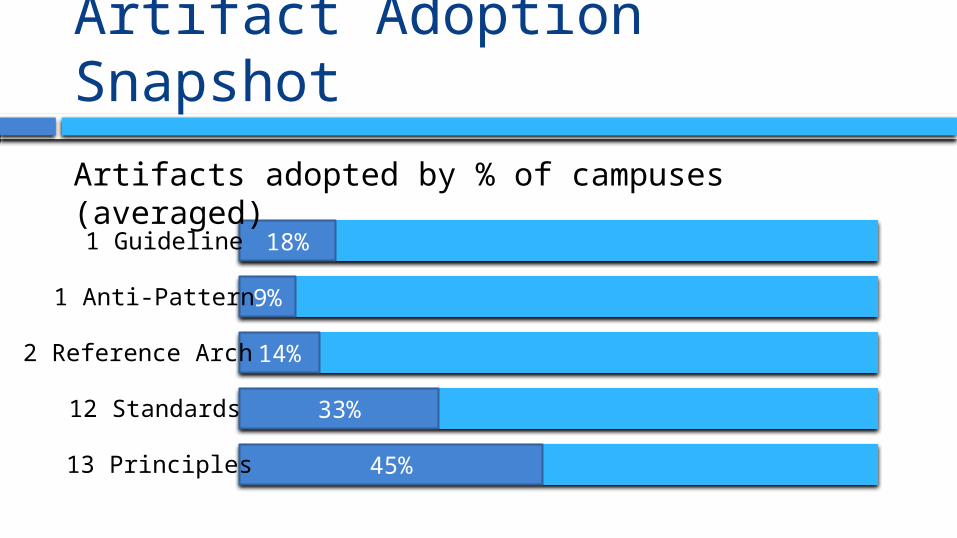
Artifact Adoption Snapshot
18%
9%
14%
33%
45%
1 Guideline
1 Anti-Pattern
2 Reference Arch
12 Standards
13 Principles
Artifacts adopted by % of campuses (averaged)
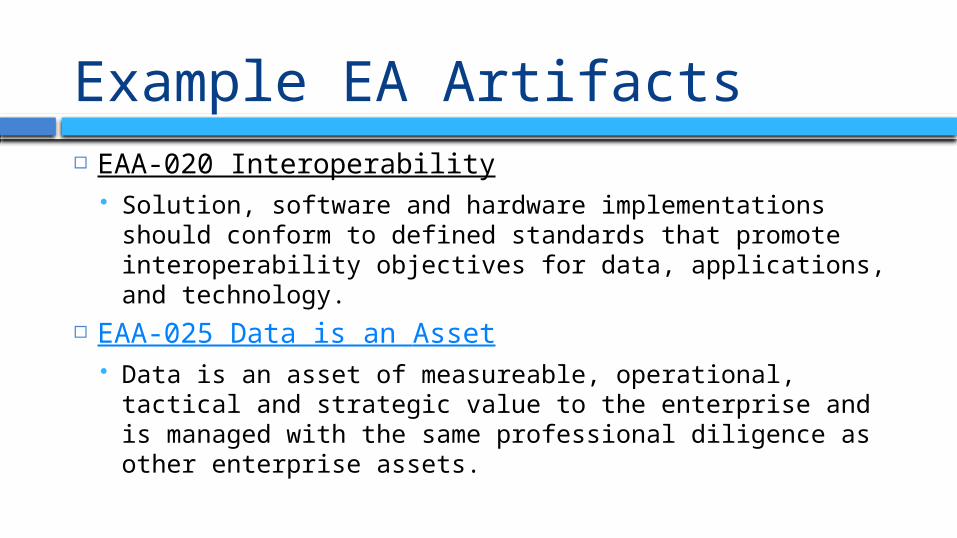
Example EA Artifacts EAA-020 Interoperability
Solution, software and hardware implementations should conform to defined standards that promote interoperability objectives for data, applications, and technology.
EAA-025 Data is an Asset Data is an asset of measureable, operational, tactical and
strategic value to the enterprise and is managed with the same professional diligence as other enterprise assets.
How Do We Know We Are Successful?
Improved Interoperability, Less Build, Less Buy
Faster delivery of systems using shared services
Cost, resource, or time savings
How Will We Measure Success? Evaluate services for alignment to EAF Measure efficiency of system integration
efforts Track reduction of “one-off” point-to-point
links Compare total cost of rollout Map Adoption vs. Satisfaction values
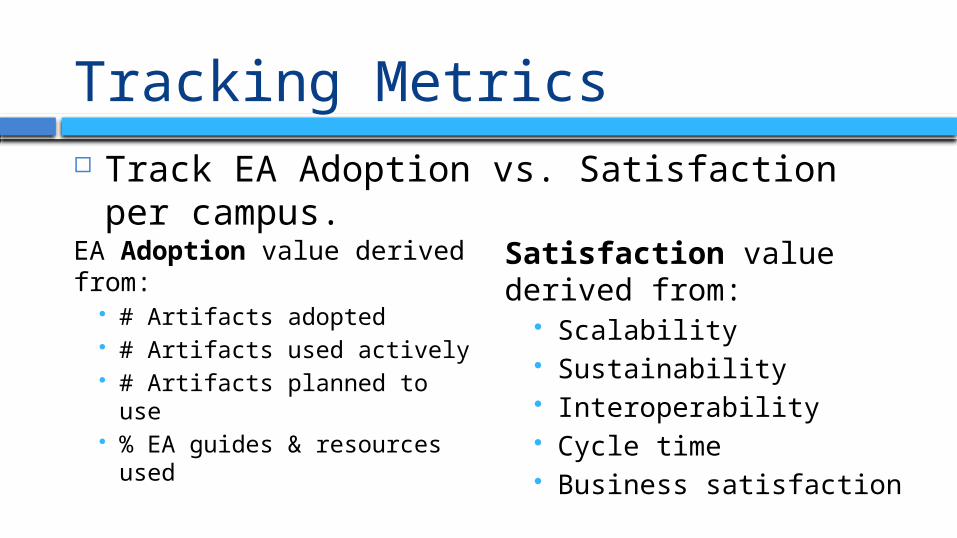
Tracking Metrics
EA Adoption value derived from:
# Artifacts adopted # Artifacts used actively # Artifacts planned to use % EA guides & resources
used
Satisfaction value derived from:
Scalability Sustainability Interoperability Cycle time Business satisfaction
Track EA Adoption vs. Satisfaction per campus.
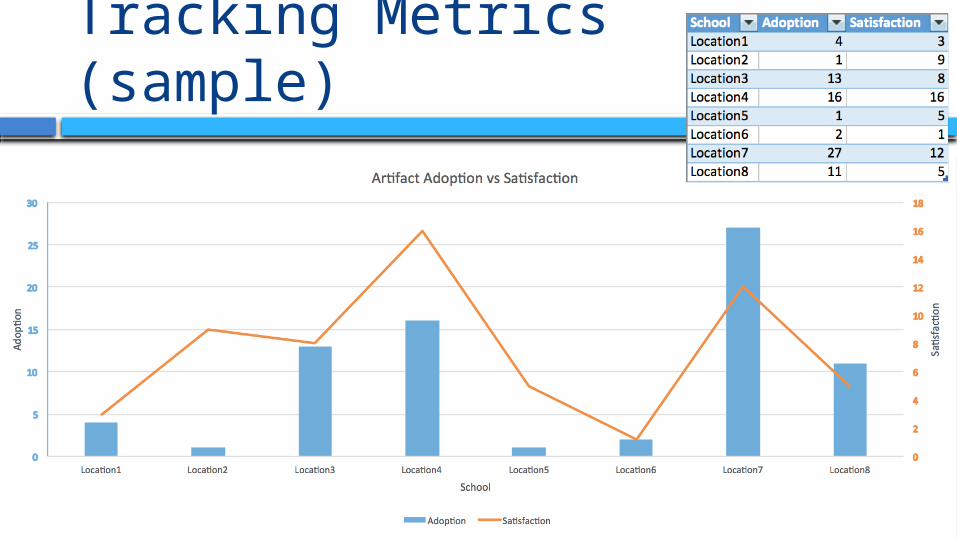
Tracking Metrics (sample)
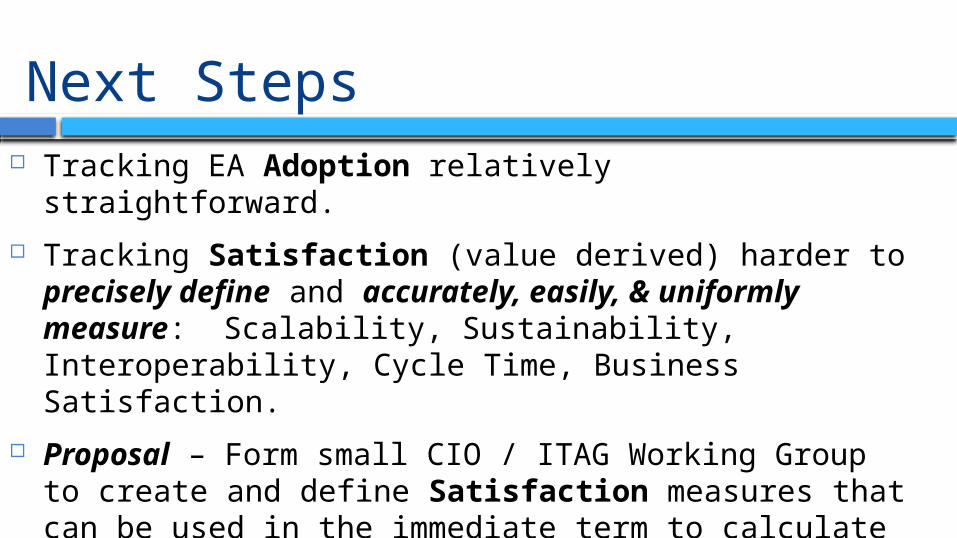
Next Steps Tracking EA Adoption relatively straightforward.
Tracking Satisfaction (value derived) harder to precisely define and accurately, easily, & uniformly measure: Scalability, Sustainability, Interoperability, Cycle Time, Business Satisfaction.
Proposal – Form small CIO / ITAG Working Group to create and define Satisfaction measures that can be used in the immediate term to calculate EAF benefit.
Based on this effort, pilot Tracking Metrics as a Measurement of EAF Success for one year.

UC IT Architecture Group (ITAG) https://spaces.ais.ucla.edu/display/ucitag/Home
Shared Services
Supplemental Slides
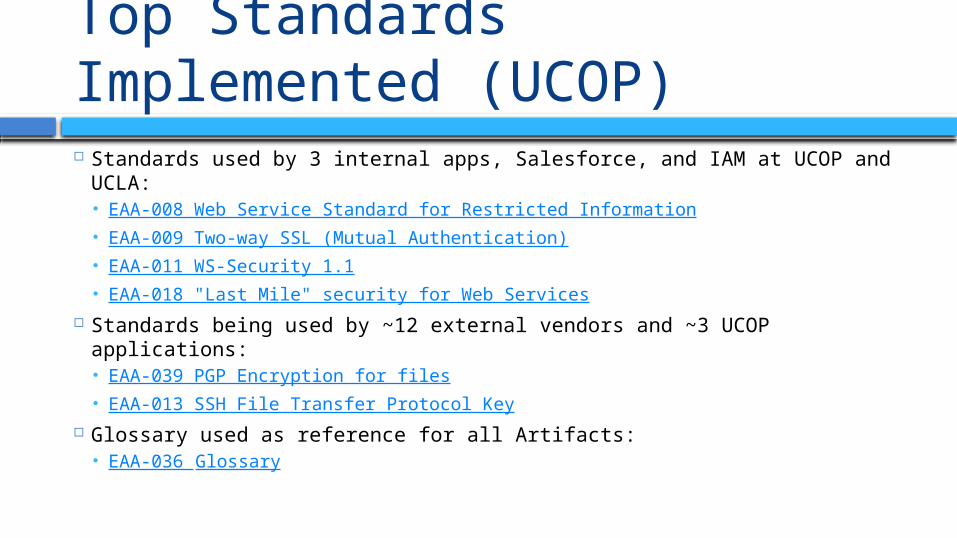
Top Standards Implemented (UCOP) Standards used by 3 internal apps, Salesforce, and IAM at UCOP and
UCLA: EAA-008 Web Service Standard for Restricted Information EAA-009 Two-way SSL (Mutual Authentication) EAA-011 WS-Security 1.1 EAA-018 "Last Mile" security for Web Services
Standards being used by ~12 external vendors and ~3 UCOP applications: EAA-039 PGP Encryption for files EAA-013 SSH File Transfer Protocol Key
Glossary used as reference for all Artifacts: EAA-036 Glossary

Tracking Artifact Usage (UCOP)