Embed Size (px)
Citation preview

UK Power Networks Overall Cost Benefit Analysis
Contents Page 2
Contents
1 Executive Summary 3 1.1 Analysis Conclusions 3 1.2 Summary Table 4
2 Introduction 5 2.1 Scope 5 2.2 Input Parameters 6 2.3 Asset Replacement/Refurbishment 6 2.4 Low Carbon Generation 6 2.5 Low Loss Equipment 7 2.6 Smart Grid Solutions 7 2.7 Quality of Supply 7 2.8 High Value Projects 7 2.9 Limitations 7
3 Methodology 9 3.1 Asset Replacement/Refurbishment 9 3.2 Probability of Failure and Impact 9 3.3 Low Carbon Generation Reinforcement 13 3.4 Smart Grid Solutions 13 3.5 Losses 14 3.6 Quality of Supply 14 3.7 High Value Projects 15
4 CBA Results 16 4.1 Introduction 16 4.2 Asset Replacement 16 4.3 EHV and 132kV Transformers 19 4.4 EHV Switchgear 26 4.5 11kV Switchgear 32 4.6 Distribution Switchgear 37 4.7 Low Carbon Generation 38 4.8 Losses 42 4.9 Smart Grid Solutions 42 4.10 Quality of Supply 44 4.11 High Value Projects 45
5 Conclusions 46 5.1 Asset Replacement 46 5.2 Reinforcement for low carbon generation 46 5.3 Loss Reduction 46 5.4 Smart Grid Solutions 46 5.5 Quality of Supply 46 5.6 High Value Projects 46 5.7 Summary 47

Executive Summary Page 3
1 Executive Summary
This document sets out UK Power Networks approach to using Cost Benefit Analysis to evaluate and
justify a number of our key investment areas, in order to ensure a robust and justifiable expenditure
plan. Extensive Cost Benefit Analysis (CBA) has been undertaken, based on Ofgem’s guidance, to
measure and quantify the benefits associated with key areas of our investment plan. Analysis has
been focused on the major areas where we are proposing changes from the investment profile in
DPCR5.
This document describes the process we undertook, setting out the parameters and methodology we
used in calculating the benefits, and our approach to treatment of these benefits within the CBAs.
1.1 Analysis Conclusions
1.1.1 Asset Replacement
In carrying out assessments of the actual projects that our asset replacement intervention strategies
have identified, we have demonstrated that our intervention strategies produce robust investment
plans which provide positive benefits for customers and maintain the condition of the distribution
networks. The results of the sensitivities around duration of interruption strongly support investing to
avoid the potentially long outages that can occur should there be the failure of multiple items of
equipment at higher voltages. The assessments have then been summarised and presented in line
with RIGs costs in Section 4.
We have carried out assessments aimed at identifiable projects covering fluid filled cables, 132kV,
66kV and 33kV transformers, 132kV, 66kV, 33kV and 11kV Primary switchgear.
1.1.2 Reinforcement for low carbon generation
We have used CBA to justify investment in EPN of £15.4m of reinforcement which will increase
network capacity by 187MVA.
1.1.3 Loss Reduction
We have used CBA to value the impact of our loss reduction initiative and identify the tipping point for
investing in low loss transformers ahead of any limits being imposed by EU directives.
1.1.4 Smart Grid Solutions
We have used CBA to test the parameters we have used to assess the implementation smart
technologies will have on our investment plans. These support using
Demand side response to defer investment. Separate parameters have been define around
2MVA in deferring reinforcement for at least 3 years in EPN and SPN and 5MVA of DSR
deferring reinforcement for 4 years in LPN.
Partial Discharge testing provides benefits in deferring switchgear replacement
Smart adaptation of overhead line ratings will allow reinforcement to be managed more
effectively
Equipment to allow real time transformer rating provides benefits in allowing capacity increases
to be deferred.

Executive Summary Page 4
These technologies will allow our investment plans to be better optimised and uncertainties better
managed.
1.1.5 Quality of Supply
We have demonstrated that our proposed additional investments in quality of supply provide
substantial benefits to customers.
1.1.6 High Value Projects
We have demonstrated that the replacement of gas filled cables between Sydenham and Eltham in
south east London should be carried out in RIIO-ED1 rather than being deferred until RIIO-ED2
1.2 Summary Table
The table below summarises the results where CBA assessment has been used to justify specific
investment
kV EPN LPN SPN
FFC Replacement 132
66
33
Transformer Replacement 132
66
33
Transformer Refurbish 132
66
33
Switchgear Replacement 132
66
33
11
Switchgear Refurbish 33
11
QoS
High Value Projects
Key
CBA results positive
Partial support
No projects

Introduction Page 5
2 Introduction
A Cost Benefit Analysis (CBA) is a systematic way of calculating and comparing benefits and costs of
a project. A CBA has two purposes:
1. To determine if a project is a sound investment decision
2. To provide a basis for comparing projects or project options considering both the costs and
benefits.
For the purposes of assessing our investment plans, and in line with Ofgem’s guidance, CBA
assessments have been used to consider the costs against the benefits of changes to timing of
investments.
All costs and benefits assessments are presented in millions of pounds at 12/13 prices.
2.1 Scope
Cost benefit analysis has been completed on the following areas of spend:
Asset Replacement/refurbishment: Replacing/refurbishing these assets facilitates a reduction
in the probability of failure, which ensures fewer customers will experience a loss of supply.
Low Carbon Generation Reinforcement: Investing in reinforcement to allow more low carbon
generation to connect and displace higher carbon generation creating benefits from reduced
carbon emissions.
Low Loss Equipment: Newer, more efficient equipment with lower losses ratings not only
provides a financial benefit of the reduced cost of generating the lost energy, but also an
environmental benefit, in the associated reduced carbon emissions.
Smart Grid Solutions: Employing innovative techniques to help manage our network can help
us defer investment to a point where we have more information about the future and what is
needed.
High Value Projects: Discretionary replacement projects with abnormally high investment
costs require more justification as to why they need to be completed now, rather than deferred
until a later date.

Introduction Page 6
2.2 Input Parameters
The key parameters that were used for the CBA are shown in Table 1:
Table 1 CBA Parameters
Parameter Value Comments
Cost of Capital 4.2% RIIO ED1 UKPN Value
Discount rate 3.5% Treasury Green Book/Ofgem guidance
CI £15.44 Ofgem’s recommended values
CML £0.38 Ofgem’s recommended values
Losses £/MWh £48.42 Ofgem’s recommended values
Oil Leakage £/Litre £36.08 ARP Model/ Ofgem guidance
Capitalization rate
(split between fast & slow money)
70% RIIO ED1 UKPN Value
Asset Life 45 Years Ofgem Guidance
2.3 Asset Replacement/Refurbishment
The CBAs are focused on the most significant categories of expenditure in which CBAs could be
effectively applied; Fluid Filled Cables, 11kV Switchgear, EHV and 132kV Switchgears and EHV and
132kV transformers.
CBAs for these investments were undertaken at an individual project level and subsequently
summarised by combining all costs and benefits, as this aligns all relevant costs with the associated
benefits. Project costs are mapped to multiple associated RIGs lines to reflect all the works necessary
to carry out that project; a simple RIGs line level analysis would result in not all costs being considered
for the benefits being included.
The CBAs were grouped by voltage and activity, so that the costs covered by the CBAs could be
directly matched to the relevant RIGs lines.
We have also conducted a policy level CBA on our Distribution Switchgear replacement programme,
comparing the benefits of the average Probability of Failure of one of our assets against our target unit
cost of an RMU replacement,
The key costs and benefits that have been compared are as follows:
Table 2 Asset Replacement Inputs
Price Control Costs/Benefits Society Costs/Benefits
Investment Costs Carbon Emissions
Costs Avoided Unsupplied Energy (Loss of supply)
Oil Leakage
Network Losses
2.4 Low Carbon Generation
We have used cost benefit assessment of a number of potential projects to enable additional
distributed generation connection to assess which would be included in our RIIO-ED1 business plan.
The benefits included were the reduced emissions associated with low carbon generation displacing
more traditional generation. Ofgem’s recommended traded carbon values were used to quantify this.
In order to estimate the amount of low carbon generation each project would enable, the following
parameters were used:

Introduction Page 7
Table 3 Low Carbon Generation Inputs
Parameter Comments
Capacity of the site Measured in MVA
Load Factor -0.4 Used to estimate an average loading
Power Factor- 1 (At/near unity) To convert the MVA into MWh
2.5 Low Loss Equipment
UK Power Networks has a strategy for managing technical losses as set out in the Losses Strategy
Annex. A range of opportunistic measures have been planned within our proposed costs, and the
CBA model has been used in order to determine the economic benefits.
In addition, a new possible EU directive may lead to new, tougher standards for electrical losses in our
distribution transformers. A CBA assessment has been carried out and sensitivities were run to
establish a threshold for the price of a new low loss transformer that would produce a positive CBA
result. This is essentially a ‘tipping point’ price, where if these new transformers are below a certain
price, installation of them can be considered justifiable, whereas if they turn out to be more expensive,
it will not.
2.6 Smart Grid Solutions
A number of Smart technologies have been tested through Ofgem’s CBA model, looking at whether
the use of these technologies to defer conventional investment, provides sufficient justification for their
utilisation. The technologies that were considered were:
Demand Side Response
Partial Discharge Testing (switchgear)
OHL Ratings
Real Time Transformer Ratings
2.7 Quality of Supply
Our proposed investment in Quality of Supply related projects have been assessed against the
improvements in forecast CIs & CMLs. The QoS schemes that were considered are:
Algorithmic Automation
ASL Programme
Auto Recloser Programme
Switchgear Change Programme
Improved Operational Response
A detailed discussion of the benefits is included in the Quality of Supply Annex.
2.8 High Value Projects
A CBA has been carried out for the High Value Project at Eltham/Sydenham, where replacement of
gas cables is planned. The value of deferring the investment for five years has been tested against the
potential impact of failure, considering the impact of the increased probability of failure on the 16,000
customers affected, with the aim to show that deferring investment would not be advisable (i.e. a
negative NPV), as gas cable are significantly more prone to failure under abnormal running conditions.
2.9 Limitations
CBAs have not been applied where specific, measurable benefits were not determinable.
EHV solid cables and Tower lines are a significant category of expenditure, but there were no specific
schemes for EHV cables and it was difficult to quantify the benefits of Tower line refurbishment in such
a way that would be useful in a CBA. It was therefore decided not to pursue Cost Benefit Analysis for
these categories.

Introduction Page 8
A number of schemes which have been selected for asset replacement/refurbishment were customer
specific sites. Because of this, these projects have been removed from the CBA assessment.
The CBAs consider only significant costs and benefits. We have excluded a number of costs/benefits
that were because they would have an insignificant effect on the overall outcome. After assessing
costs per asset unit we have excluded costs and benefits were Fault Opex, Repair Opex, Maintenance
costs and Inspections costs. Minor repair costs per item on major plant items are currently low
compared to scheme replacement costs and benefits.

Methodology Page 9
3 Methodology
3.1 Asset Replacement/Refurbishment
3.1.1 Project Costs
Projects for each asset type were identified from the UK Power Networks’ Network Asset Management
Plan (NAMP), which identifies total forecast expenditure for each of the projects. All of the benefits
and costs were collated for each asset, as well as secondary data such as health indexes, failure
rates, leakage rates, degradation rates, and other values related to the assets that would allow the
calculation of a financial value for benefits. All the data was analysed using the CBA model to give an
absolute Net Present Value for the projects.
All projects within the selected categories in the NAMP were reviewed and only selected if the majority
of the project costs occurred in RIIO ED1 period (2015-2023). Where there was an overlap with
DPCR5 (2010-2015) or ED2 periods (2023-2031), the deciding factor was which period the majority of
the costs were incurred in. If majority of the costs were incurred in the ED1 period, the project was
included into the process, and the costs that fall into the other periods were included in the RIIO ED1
CBA.
3.1.2 Baseline scenarios
The baseline scenario option has been taken as a ‘defer investment’ scenario, until intervention is
absolutely necessary. We have defined this as the point that the asset gets to an ARP score of 10 out
of a maximum of 15. For reference, an ARP score of 7.5 equates to an Ofgem HI score of HI5.
Bearing in mind the condition of an asset degrades non-linearly, an ARP score of 10 is a reasonable
point at which intervention would become necessary, as the risk of failure would become
unsatisfactorily high.
‘Option 1’ is a ‘replace/refurbish during ED1’ option, where the benefits of replacement/refurbishment
are accrued only from the year after investment, up until the asset gets an ARP score of HI10 (i.e. it
will have to be replaced anyway), at which point there is an ‘avoided cost’ of investment.
Where the NPV of Option 1 is positive, the asset should be replaced or refurbished during ED1,
whereas if it is negative, the benefits are not substantial enough to outweigh the discounted value of
deferral.
3.2 Probability of Failure and Impact
3.2.1 Probability of Failure
Initially we applied a linear degradation to the Probability of Failure (PoF) so as to increase the chance
of failure as an asset ages in a straightforward way. Linear degradation rates proved either to produce
too low a potential future failure rate i.e. too long an asset life before failure became likely, or a very
aggressive likelihood of failure, as shown in Figure 1 below. We therefore decided to replicate the
complex ARP failure rate calculation was in the models to reflect a more accurate probability of failure
as an asset reaches the end of its life. This is consistent with the industry accepted ‘bathtub’ failure
degradation models.

Methodology Page 10
Figure 1 Failure Rate Assumptions and Asset Life
The PoF was used for 11kV Switchgear, EHV Switchgear and 132kV and 33kV Transformers, whilst the Oil Leakage Rate was used for the Fluid Filled Cables.
We have used Health Index data from the ARP model (which uses a 1-15 scale) which takes into account different factors such as the age of equipment, the make, the model, location etc. The implications are that the higher the Health Index value or the older the asset gets, the higher the Probability of Failure or leakage rate.
The Probability of Failure has been calculated using the same approach as used in the ARP model (as this is an industry standard model). This is calculated as follows:
3
0
32
!!3!21
i
i
i
cHIk
cHIcHIcHIkPoF
Where:
PoF = probability of failure per annum
HI = health index
k & c = constants (c=1.35)
The following allows the calculation of k:
In
i
iii annumperfailuresofnoAverage
cHIcHIcHIk .
!3!21
1
32
Where:
n = the number of assets in asset group
The above calculations allow the use of 25 years of forecast Health Index (HI) data to calculate the PoF for a given asset. A typical relationship between the HI score and the PoF can be seen below, showing how the failure rate kicks up towards the end of its life.
0.00
0.20
0.40
0.60
0.80
1.00
1.20
1.40
35 40 45 50 55 60 65 70
Pro
bab
ility
of F
ailu
re
Asset Age
ARP Model Original Linear Degradation Linear Degradation to match EoL failure rate
Excess benefitsif linear rate used to EoL
Low benefitsif linear rate based on initial degradation

Methodology Page 11
Figure 2 Failure rate relationship to asset condition
Where required we use the GROWTH function in Excel to extend the PoF values out to 45 years, by
estimating a growth rate based on the previous 25 years’ HI numbers.
The PoF was calculated on an asset by asset basis, and then an overall site PoF is calculated from
the sum of the component assets. This ensures that we have not overestimates the probability of
failure from, for example, choosing the highest asset failure rate for a site. It should be noted that the
CBAs are negatively affected where a poor condition asset is in parallel with a good condition asset;
one asset could be very likely to fail but the likelihood this would result in supply loss is low.
3.2.2 132kV and EHV Switchgear
For 132kV and EHV Switchgear, should one asset on a site fail, the whole site would not experience a
loss of supply. A probability of failure was therefore developed considering the failure of a second
asset whilst the first was out of service. For switchgear a return to service duration on 4 weeks was
assumed for EPN and SPN and 8 weeks for LPN reflecting the additional complexity of replacing
indoor assets in an urban environment. Outage durations of 2 hours and 12 hours have been
modelled for 132kV and EHV switchgear.
3.2.3 132kV and EHV Transformers
For 132kV and EHV transformers, should one asset on a site fail, the whole site would not experience
a loss of supply. A probability of failure was therefore developed considering the failure of a second
asset whilst the first was out of service. For transformers a return to service duration of 8 weeks was
assumed for EPN and SPN and 16 weeks for LPN, reflecting the additional complexity of replacing
indoor or enclosed assets in an urban environment. Outage durations of 12, 24 and 48 hours have
been modelled for 132kV and EHV transformers.
3.2.4 11kV Switchgear
For 11kV switchgear, the failure of an asset would directly affect supplies to customers, but only for a
proportion of the customers supplied from the substation. As a general rule the number of customers
affected would be the number of customers on the site divided by the number of transformers
supplying the site.
We have carried out an example CBA to assess refurbishing switchgear rather than replacing based
on a known site with 26 circuit breakers.
3.2.5 Distribution switchgear – Ring Main Units
For distribution switchgear, we took an average PoF from all of our Ofgem HI4&5 assets.
3.2.6 Oil Leakage
For Fluid Filled cables, as oil leakage does not necessarily follow the probability of electrical failure
(which is captured in the PoF data), a different method was used. It was assumed that the HI of a
cable was directly linked to the amount of oil it would leak, so as the HI increased, so did the leakage
rate accordingly.
Leakage rate for each year = (6 year leakage average) x (leakage multiple for desired year)
0.0
0.5
1.0
1.5
1 2 3 4 5 6 7 8 9 10 11 12 13 14 15
Pro
ba
bil
ity o
f F
ail
ure
ARP HI Score

Methodology Page 12
Leakage Multiple = (HI*e(Logest -1)x(year))/HI
Project specific rates were then scaled up to match the Asset Management calculated oil leakage at a
total level.
Fluid filled cables can be maintained in service by continuing to top up cable fluid. This makes
electrical failure and loss of supply very low likelihood events.
Fluid filled cable replacement has considered only the value of loss of oil, however allowing excessive
leakage could result in prosecution for beach of environmental regulations.
3.2.7 Loss of Supply Calculations and Assumptions
The probability of failure of an asset was multiplied by the number of customers connected to a site, to
get an annual ‘average customers off supply’. Depending on which ‘time off supply’ sensitivity was
run, customer minutes lost were obtained from the product of the customers interrupted and the length
of time off supply.
For Distribution Switchgear, an average number of customers connected to each switchgear was
obtained by dividing the total number of customers on each of our networks, by the total number of
distribution switchgear. This was then multiplied by the PoF, as above, to obtain the impacts.
3.2.8 Transformer Losses Calculation
Transformer replacements have an additional benefit from the reduced losses they get as a result of a
newer, often more efficient asset replacing it. A total annual electrical losses number, in MWh, was
calculated for both the existing asset, and the new one replacing it, to enable the calculation of an
overall ‘reduced losses’ amount. A typical average value for new transformer losses was taken from
the UK Power Networks’ transformer specification documents, depending on the MVA rating of the
transformer.
3.2.9 Safety Assumptions
Safety benefits have only been included in our analysis of Distribution Switchgear, given the large
number of these assets that are in public areas. We have used a probability of injury of 5%, and a
probability of fatality of 1%. These are then multiplied by the probability of failure of the asset to get an
overall risk of injury/fatality.
3.2.10 Sensitivities
We have run a number of sensitivities on each asset type to be sure we have a robust set of data, in
order to make a well-justified decision. The sensitivities were run as follows:
FFC:
Sensitivities were run on the leakage rate, producing scenarios where it is 50%
higher, and 50% lower than our ‘standard’ scenario. (These are shown in the CBA
files by the designation ‘High’ and ‘Low’, respectively).
11kV Switchgear:
Sensitivities were run on the probability of failure, producing outcomes where the PoF
is 10% higher or lower than the ‘standard’ scenario.
Additional sensitivities have been undertaken on the time off supply, using 2 hours,
reflecting faster restoration times following a non-damage event such as stuck
breakers, 6 hours and 12 hours for longer restoration due to equipment damage.
EHV Switchgear:
As with 11kV Switchgear, sensitivities of 10% around the original PoF have been run.
The time off supply sensitivities of 2 hours and 12 hours have been run, again
reflecting scenarios for both damage and non-damage failure events.
EHV Transformers:

Methodology Page 13
Again, a 10% sensitivity around the PoF has been run as with Switchgear assets.
Reflecting a longer estimated restoration time due to the fact only the probability of
two or more transformers failing is used, sensitivities on the time off supply have been
run for 12 hours, 24 hours and 48 hours.
3.3 Low Carbon Generation Reinforcement
3.3.1 Carbon Emissions
In order to calculate the amount of Low Carbon Generation each project would produce, the capacity
of the site was multiplied by a loading factor of 0.4, to get an ‘average loading’. A power factor of 1 is
used to convert the MVA capacity into MW, and then a subsequent annual MWh of generation can be
calculated. This is then put through Ofgem’s model to convert into tCO2e, so the value of the benefits
can be calculated.
3.3.2 Baseline
The reinforcement of our network is a necessity, and it is only the technology we use to achieve this
that we can decide. Therefore, the baseline scenario has been defined as a ‘high carbon’ scenario,
where the reinforcement is completed through other means, not utilising low carbon technologies. This
creates large environmental benefits in the other options, which are compared against the additional
costs of employing these newer technologies.
3.3.3 Sensitivities
Sensitivities were run on the amount of capacity utilised, introducing a ‘phased utilisation’ period,
where only a certain proportion of the capacity was employed at first, ramping up to the full amount
over several years. The exact sensitivities can be seen in the results section.
Sensitivities have also been modelled around the amount of planned low carbon generation. Whilst it
is expected all of the planned capacity will come from Low Carbon generation, scenarios have been
modelled where only 50% or 75% of the capacity comes from low carbon sources.
3.3.4 Project Selection
As not all of the potential low carbon generation schemes would have been likely to go ahead, there
was a need to select only the most beneficial projects. As the resulting CO2 benefits are very high, a
benefit to cost ratio for each project was calculated, and only the schemes with the highest ratios were
chosen to be included in our investment plan. We chose the ‘cut off line’ as the upper quartile, in order
to ensure we gain the most beneficial outcome for the expenditure.
3.4 Smart Grid Solutions
3.4.1 Baseline & Sensitivities
For all Smart Grid solution schemes except Partial Discharge Monitoring, the baseline scenario is set
as network reinforcement during RIIO-ED1, with the options examining the effects of employing these
Smart Grid Solutions in order to defer investment by a number of years, depending on the technology.
The deferral lengths are shown below.
Table 4 CBA Parameters
Smart Grid Solution Deferral Length
Demand Side Response- EPN & SPN 3 years/6 years, depending on sensitivity
Demand Side Response- LPN 4 years
33kV OHL Ratings 3 years
132kV OHL Ratings 2/4/6 years, depending on sensitivity
Real Time Transformer Rating 3 years

Methodology Page 14
For Partial Discharge Monitoring, as installation of this equipment does not guarantee the ability to
defer reinforcement, the baseline scenario has been set as 35% of sites equipped with monitoring
devices are able to defer further investment by 5 years, with sensitivities run around this of 20%, 50%
and 60%.
For more information on the Smart Grid Solutions Cost Benefit Assessments, please refer to Annex 9:
Smart Grid Strategy.
3.5 Losses
3.5.1 Losses and Costs Calculations
The CBA model has been used to calculate a benefit for all the loss reduction initiatives we have
identified for RIIO-ED1. For all of the measures set out in the Losses Strategy, an overall ‘reduced
losses’ amount was calculated for each year of RIIO-ED1, and then flat-lined beyond this. This was
then run through the CBA model, and a financial value for the reduced losses attained. The costs of
these projects are estimated to be minimal, since they are planned to be in conjunction with other
investment works.
When running the CBA for the new EU losses standards, standard losses ratings for our current
transformers were compared against the losses ratings for the new, proposed transformers. An
annual MWh was then calculated for each, and the two compared to get a ‘reduction in losses’ benefit.
Various hypothetical investment costs were then input into the model, in order to find out the point at
which the CBA turned from negative to positive. This was then taken as the ‘tipping point’ price in
which it was justifiable to invest in the lower-loss transformers.
3.5.2 Baseline & Sensitivities
As our Losses strategy is very much an ‘opportunistic’ approach, where reduced losses investment is
often in conjunction with other investment drivers, only the incremental costs of these initiatives are
taken into account in the options. Therefore, the baseline scenario is a ‘business as usual’ approach,
assuming these other investment drivers are undertaken anyway, without the added costs of the loss
reduction projects.
When calculating the benefits of moving to the low EU losses standard, the baseline scenario is where
more traditional, higher loss transformers continue to be installed. The multiple options are modelled
around various ratings and types of low loss transformers (315kVA transformer, 500kVA transformer,
800kVA transformer, 1000kVA transformer, 25kVA Pole Mounted Transformer (PMT), 50kVA PMT
and 100kVA PMT), looking at the additional cost of a low loss transformer, against the benefits of
reduced losses.
3.6 Quality of Supply
3.6.1 CI and CML benefits
Forecasted CI and CML benefits resulting from investments which will result in quality of supply
improvements taken from the RIGs table CV106, and then multiplied by the number of customers on
the network, to get a total number of customers interrupted and customer minutes lost.
The benefits were assumed to continue only through RIIO-ED1 and RIIO-ED2.
3.6.2 Costs
The costs were taken from CV106 with an additional 10% of the switchgear change costs added to
represent the additional value from additional remote control which will be installed as standard. This
is representative of the historic costs booked to quality of supply for the addition of secondary remote
control to distribution switchgear.
3.6.3 Baseline
The baseline we have selected is, again, a ‘business as usual’ option, where none of the Quality of
Supply initiatives are undertaken, and therefore, no investment, and no CI/CML benefits. The
baseline assumes no degradation in service.

Methodology Page 15
3.7 High Value Projects
3.7.1 Probability of Failure
Replacement of the gas cables at Eltham/Sydenham brings with it a reduced probability of failure.
Because of the nature of gas cables, there is a significantly higher risk of failure once one circuit
already fails, and this is reflected in the model with an increase risk multiplier of 6 (i.e. the circuit is 6
times more likely to fail than previously). Recent experience with the replacement of gas cables in
SPN indicates that this is a reasonable assumption. In this instance a gas cable was taken out of
service for replacement and the second circuit failed almost immediately; supply loss being averted
only because alternative supply arrangements have been put in place before the first circuit was taken
out of service.
3.7.2 Baseline
The baseline scenario in this case is to replace the cables during RIIO-ED1, with the options testing
whether a deferral of 5 years into RIIO-ED2 is justifiable, given an increased probability of failure from
delaying.

CBA Results Page 16
4 CBA Results
4.1 Introduction
The CBA assessments consider the costs of bringing works forward over deferral. In the CBA
assessments the costs of any scheme are represented as the return and depreciation over 45 years.
The CBA results over 45 years therefore best represent the comparison of total costs and benefits; we
have therefore chosen to present the CBA model output over 32 and 45 years.
4.2 Asset Replacement
In the following section we present the results of the CBA assessments for Fluid Filled Cables, 11kV
Switchgear, EHV and 132kV Switchgear and EHV and 132kV transformers. For each of the
assessments we have carried out we have summarised the costs against covered by the projects
included in the assessment and the resulting overall CBA outputs.
4.2.1 Assessments carried out
Table 5 Number of projects assessed
Total Schemes
considered
Schemes without
sufficient data Total schemes assessed
Fluid Filled Cables 37 0 37
EHV and 132kV Transformer 128 3 125
11kV Switchgear 171 0 171
EHV Switchgear 56 3 53
Overall there were 392 projects considered in four different asset categories. However 6 projects
addressed customer specific sites and were excluded from the assessment.
These schemes were grouped by voltage (132kV, 66kV, 33kV or 11kV) and activity (replacement or
refurbishment) in order to test how justifiable they are at an activity level that aligned closely to the
RIGs categories.
The costs of each project are allocated to multiple lines in the RIGs, but the benefits from each project
cannot be split by RIGs line. Therefore, the CBAs have been carried out at a project level, with a
breakdown of the costs by RIGs line shown before the CBA results.
The total amount of expenditure that has been assessed from each RIGs table is shown in Table 6
below.
Results of the CBA assessments for each category are presented by voltage, replacement and
refurbishment. A total CBA has been carried out for each category and is included in the results.

CBA Results Page 17
Table 6 CBA Assessments by % value of key RIGs tables
EPN LPN SPN
CV3 Asset Replacement 35.16% 48.90% 27.54%
CV5 Refurbishment 10.58% 17.45% 24.69%
CV6 Civil Works 42.22% 10.78% 31.57%
CV8 Legal & Safety 13.68% 12.14% 10.06%
CV101 Reinforcements & DSM 0.31% 0.95% 0.60%
CV105 Op. IT & Telecoms 4.24% 1.06% 2.00%
4.2.2 EPN Fluid Filled Cables
Fluid filled cables are replaced by solid cables with costs attributed to oil pressurised cables for the
decommissioning of these assets.
Table 7 EPN 132kV Replacement
Table Line Total
Assessed
Total RIGs
Line
% of RIGs
line
assessed
CV3 92 132kV UG Cable (Non
Pressurised)
132kV £8.29 £29.46 28.14%
CV3 93 132kV UG Cable (Oil) 132kV £3.87 £5.70 67.97%
Table 8 EPN 33kV Replacement
Table Line Total
Assessed
Total RIGs
Line
% of RIGs
line
assessed
CV3 62 33kV UG Cable (Non Pressurised) EHV £1.55 £13.07 11.86%
CV3 63 33kV UG Cable (Oil) EHV £1.98 £5.68 34.90%
Table 9 EPN Fluid Filled Cable Summary
32 Years 45 Years
CBA Low CBA Std CBA High CBA Low CBA Std CBA High
Total 132kV (£0.54) £0.12 £0.78 (£0.38) £0.28 £0.94
Total 33kV (£0.06) £0.54 £1.14 (£0.05) £0.56 £1.16
Total (£0.66) £0.61 £1.87 (£0.46) £0.81 £2.07
Projects returning + ve
CBAs
3/6 5/6 5/6 4/6 5/6 5/6
There is a single scheme in EPN that gives a negative result. Overall investment in fluid filled cable
replacement shows a positive benefit and we consider that this demonstrates that our proposed
investments represent value for money.
4.2.3 LPN Fluid Filled Cables
Fluid filled cables are replaced by solid cables with costs attributed to oil pressurised cables for the
decommissioning of these assets.

CBA Results Page 18
Table 10 LPN 132kV Replacement
Table Line Total
Assessed
Total RIGs
Line
% of RIGs
line
assessed
CV3 92 132kV UG Cable (Non
Pressurised)
132kV £39.13 £61.26 63.88%
CV3 93 132kV UG Cable (Oil) 132kV £9.24 £9.65 95.71%
Table 11 LPN 66kV Replacement
Table Line Total
Assessed
Total RIGs
Line
% of RIGs
line
assessed
CV3 65 66kV UG Cable (Non Pressurised) EHV £18.72 £31.48 59.45%
CV3 66 66kV UG Cable (Oil) EHV £1.04 £1.04 100.00%
Table 12 LPN 33kV Replacement
Table Line Total
Assessed
Total RIGs
Line
% of RIGs
line
assessed
CV3 62 33kV UG Cable (Non Pressurised) EHV £5.55 £8.54 64.91%
CV3 63 33kV UG Cable (Oil) EHV £0.11 £2.66 4.26%
Table 13 LPN Fluid Filled Cable Summary
32 Years 45 Years
CBA Low CBA Std CBA High CBA Low CBA Std CBA High
Total 132kV £4.29 £5.00 £5.70 £4.22 £4.93 £5.63
Total 66kV (£0.73) £0.59 £1.90 (£0.56) £0.76 £2.07
Total 33kV £0.77 £3.14 £5.51 £0.91 £3.28 £5.66
Total £4.33 £8.72 £13.12 £4.57 £8.97 £13.36
Projects returning +ve
CBAs
15/21 17/21 18/21 16/21 17/21 19/21
Over 45 years the CBA results are strongly positive for our proposed investments under all
sensitivities. We have included a small number of projects in our programme that do not return
positive CBAs on an individual basis as these have a sound engineering basis for replacement given
their age and condition, but where the amount of oil leakage would have to be unacceptably high to
give benefits higher than the costs of the projects.
4.2.4 SPN Fluid Filled Cables
Fluid filled cables are replaced by solid cables with costs attributed to oil pressurised cables for the
decommissioning of these assets.
Table 14 SPN 132kV Replacement
Table Line Total
Assessed
Total RIGs
Line
% of RIGs
line
assessed
CV3 92 132kV UG Cable (Non
Pressurised)
132kV £12.36 £13.35 92.58%
CV3 93 132kV UG Cable (Oil) 132kV £1.46 £2.51 58.06%

CBA Results Page 19
Table 15 SPN 33kV Replacement
Table Line Total
Assessed
Total RIGs
Line
% of RIGs
line
assessed
CV3 62 33kV UG Cable (Non Pressurised) EHV £5.91 £8.13 72.68%
CV3 63 33kV UG Cable (Oil) EHV £1.60 £10.04 15.98%
Table 16 SPN Fluid Filled Cable Summary
32 Years 45 Years
CBA Low CBA Std CBA High CBA Low CBA Std CBA High
Total 132kV (£2.74) (£2.27) (£1.81) (£2.45) (£1.98) (£1.52)
Total 33kV (£0.28) £0.53 £1.34 (£0.17) £0.64 £1.45
Total (£3.02) (£1.74) (£0.47) (£2.62) (£1.34) (£0.07)
Projects returning + ve CBAs 6/10 7/10 8/10 6/10 7/10 8/10
There is one high cost scheme that is causing the both the 132kV replacement and the overall activity
level CBA to go negative. We consider that this scheme is technically justified but is sufficiently
expensive that the amount of oil leakage would have to be unacceptably high for the CBA to become
positive.
4.3 EHV and 132kV Transformers
4.3.1 EPN
Transformer replacement projects include costs across a number of RIGs lines as such works include
the replacement of associated switchgear costs and auxiliaries. Table 17 below sets out the costs
covered by these assessments.
Table 17 EPN 132kV Transformers Replace
Table Line Total
Assessed
Total
RIGs Line
% of RIGs line
assessed
CV3 48 6.6/11kV Transformer (GM) HV £0.04 £12.52 0.28%
CV3 70 33kV CB (Air Insulated Busbars)(OD) (GM) EHV £0.05 £3.98 1.25%
CV3 83 33kV Transformer (GM) EHV £0.50 £19.41 2.57%
CV3 89 132kV OHL (Tower Line) Conductor 132kV £0.91 £40.55 2.24%
CV3 97 132kV CB (Air Insulated Busbars)(OD) (GM) 132kV £0.37 £0.74 50.55%
CV3 100 132kV Switchgear - Other 132kV £0.69 £0.78 87.35%
CV3 101 132kV Transformer 132kV £23.73 £23.73 100.00%
CV6 33 Plinths and Groundworks 132kV £1.95 £3.31 59.13%
CV6 34 Building 132kV £0.19 £17.05 1.11%
CV6 35 Enclosures and Surrounds 132kV £0.93 £2.62 35.49%
CV8 8 Site Security £0.83 £10.17 8.20%
CV8 13 Earthing Upgrades £1.17 £2.62 44.55%

CBA Results Page 20
Table 18 EPN 33kV Transformers Replace
Table Line Total
Assessed
Total
RIGs Line
% of RIGs line
assessed
CV3 29 6.6/11kV UG Cable HV £0.90 £17.58 5.10%
CV3 48 6.6/11kV Transformer (GM) HV £0.56 £12.52 4.49%
CV3 62 33kV UG Cable (Non Pressurised) EHV £0.33 £13.07 2.52%
CV3 83 33kV Transformer (GM) EHV £15.63 £19.41 80.52%
CV6 30 Plinths and Groundworks EHV £1.46 £4.75 30.67%
CV6 32 Enclosures and Surrounds EHV £2.95 £7.31 40.37%
CV8 7 Site Security £1.65 £9.40 17.51%
CV101 7 Secondary network HV to
LV
£0.05 £1.64 3.15%
CV101 14 Primary network (n-1) 132kV to
EHV
£0.81 £19.40 4.17%
Table 19 EPN 132kV Transformers Refurbish
Table Line Total
Assessed
Total
RIGs Line
% of RIGs line
assessed
CV5 52 132kV Transformer 132kV £0.60 £0.75 80.00%
Table 20 EPN 33kV Transformers Refurbish
Table Line Total
Assessed
Total
RIGs Line
% of RIGs line
assessed
CV5 32 33kV Transformer (GM) EHV £3.39 £3.42 99.25%
CBA Outputs
Table 21 EPN Transformers CBA Results 12 hours
32 Years 45 Years
CBA Low CBA Std CBA High CBA Low CBA Std CBA High
Total 132kV Replacement £0.07 £0.73 £1.39 £0.66 £1.32 £1.98
Total 33kV Replacement (£2.04) (£1.19) (£0.33) £0.64 £1.70 £2.76
Total 132kV Refurbishment £47.78 £52.73 £57.69 £47.81 £52.76 £57.72
Total 33kV Refurbishment £7.87 £8.61 £9.35 £35.97 £39.80 £43.63
Total £52.84 £60.05 £67.25 £83.75 £94.26 £104.76
Projects returning + ve CBAs 25/55 26/55 26/55 28/55 28/55 28/55
Table 22 EPN Transformers CBA Results 24 hours
32 Years 45 Years
CBA Low CBA Std CBA High CBA Low CBA Std CBA High
Total 132kV Replacement £5.68 £6.96 £6.68 £6.27 £7.55 £8.83
Total 33kV Replacement £5.23 £6.90 £5.73 £9.67 £11.73 £13.79
Total 132kV Refurbishment £89.97 £99.61 £45.14 £90.00 £99.65 £109.29

CBA Results Page 21
32 Years 45 Years
CBA Low CBA Std CBA High CBA Low CBA Std CBA High
Total 33kV Refurbishment £14.17 £15.61 £5.30 £68.59 £76.05 £83.51
Total £114.21 £128.24 £142.27 £173.21 £193.65 £214.10
Projects returning + ve CBAs 31/55 32/55 32/55 32/55 32/55 32/55
Table 23 EPN Transformers CBA Results 48 hours
32 Years 45 Years
CBA Low CBA Std CBA High CBA Low CBA Std CBA High
Total 132kV Replacement £16.89 £19.42 £21.94 £17.48 £20.01 £22.54
Total 33kV Replacement £19.79 £23.07 £26.35 £27.71 £31.78 £35.85
Total 132kV Refurbishment £174.35 £193.37 £212.39 £174.39 £193.42 £212.44
Total 33kV Refurbishment £26.77 £29.61 £32.45 £133.85 £148.56 £163.27
Total £236.97 £264.63 £292.30 £352.12 £392.44 £432.76
Projects returning + ve CBAs 35/55 37/55 39/55 37/55 39/55 39/55
The EPN CBA results for our programme are all positive in the 24 and 48 hour scenarios. The
strongly positive movements shown in the outage duration sensitivities demonstrate that there is good
justification for replacing transformers before the risk of prolonged outages develops. There are still
projects that give a negative CBA but these are considered technically justifiable based on the
condition of the assets. Our EHV Transformer replacement and refurbishment plan returns a positive
benefit to customers and we consider the CBA supports our investment plans.
4.3.2 LPN
Table 24 LPN 132kV Transformers Replace
Table Line Total
Assessed
Total
RIGs Line
% of RIGs line
assessed
CV3 29 6.6/11kV UG Cable HV £0.40 £12.55 3.21%
CV3 48 6.6/11kV Transformer (GM) HV £0.12 £10.80 1.10%
CV3 83 33kV Transformer (GM) EHV £0.07 £2.58 2.68%
CV3 96 132kV CB (Air Insulated Busbars)(ID) (GM) 132kV £0.05 £1.02 4.69%
CV3 97 132kV CB (Air Insulated Busbars)(OD) (GM) 132kV £0.11 £1.93 5.85%
CV3 100 132kV Switchgear - Other 132kV £0.30 £2.48 11.92%
CV3 101 132kV Transformer 132kV £12.95 £37.26 34.76%
CV6 33 Plinths and Groundworks 132kV £0.81 £4.20 19.34%
CV6 34 Building 132kV £0.08 £36.44 0.22%
CV6 35 Enclosures and Surrounds 132kV £0.39 £1.93 20.24%
CV8 8 132kV Substations £0.36 £2.91 12.38%
CV8 13 Locations £0.08 £0.94 8.51%

CBA Results Page 22
Table 25 LPN 66kV Transformers Replace
Table Line Total
Assessed
Total RIGs
Line
% of RIGs
line
assessed
CV3 29 6.6/11kV UG Cable HV £0.06 £12.55 0.47%
CV3 48 6.6/11kV Transformer (GM) HV £0.01 £10.80 0.07%
CV3 62 33kV UG Cable (Non Pressurised) EHV £0.01 £8.54 0.09%
CV3 70 33kV CB (Air Insulated Busbars)(OD) (GM) EHV £0.01 £0.33 2.62%
CV3 83 33kV Transformer (GM) EHV £0.06 £2.58 2.32%
CV3 84 66kV Transformer EHV £6.04 £6.04 100.00%
CV3 97 132kV CB (Air Insulated Busbars)(OD) (GM) 132kV £0.01 £1.93 0.36%
CV6 30 Plinths and Groundworks EHV £0.05 £0.99 4.87%
CV6 31 Building EHV £0.02 £12.77 0.17%
CV6 32 Enclosures and Surrounds EHV £0.16 £0.99 16.26%
CV8 7 Site security EHV £0.03 £1.94 1.33%
CV8 13 Earthing upgrades £0.02 £0.94 1.90%
CV101 11 Primary network (n-1) EHV to
EHV
£0.97 £2.59 37.34%
CV105 6 Substation RTUs, marshalling kiosks,
receivers
£0.07 £29.32 0.22%
Table 26 LPN 33kV Transformers Replace
Table Line Total
Assessed
Total RIGs
Line
% of RIGs
line
assessed
CV3 29 6.6/11kV UG Cable HV £0.11 £12.55 0.88%
CV3 48 6.6/11kV Transformer (GM) HV £0.12 £10.80 1.10%
CV3 62 33kV UG Cable (Non Pressurised) EHV £0.06 £8.54 0.70%
CV3 70 33kV CB (Air Insulated Busbars)(OD) (GM) EHV £0.02 £0.33 7.32%
CV3 83 33kV Transformer (GM) EHV £1.73 £2.58 67.12%
CV3 92 132kV UG Cable (Non Pressurised) 132kV £1.30 £61.26 2.12%
CV3 96 132kV CB (Air Insulated Busbars)(ID) (GM) 132kV £0.02 £1.02 1.56%
CV3 97 132kV CB (Air Insulated Busbars)(OD) (GM) 132kV £0.16 £1.93 8.49%
CV3 100 132kV Switchgear - Other 132kV £0.33 £2.48 13.32%
CV3 101 132kV Transformer 132kV £23.08 £37.26 61.94%
CV6 30 Plinths and Groundworks EHV £0.18 £0.99 18.26%
CV6 32 Enclosures and Surrounds EHV £0.31 £0.99 31.30%
CV6 33 Plinths and Groundworks 132kV £0.94 £4.20 22.39%
CV6 34 Building 132kV £0.09 £36.44 0.25%
CV6 35 Enclosures and Surrounds 132kV £0.44 £1.93 22.61%
CV8 7 Site security EHV £0.20 £1.94 10.20%
CV8 8 Site security 132kV £0.40 £2.91 13.83%

CBA Results Page 23
Table Line Total
Assessed
Total RIGs
Line
% of RIGs
line
assessed
CV8 13 Earthing upgrades £0.56 £0.94 59.60%
CV101 13 Primary network (n-1) 132kV
to HV
£1.96 £109.31 1.79%
Table 27 LPN 132kV Transformers Refurbish
Table Line Total
Assessed
Total RIGs
Line
% of RIGs
line
assessed
CV5 52 132kV Transformer 132kV £0.67 £0.67 100.00%
Table 28 LPN 66kV Transformers Refurbish
Table Line Total
Assessed
Total RIGs
Line
% of RIGs
line
assessed
CV5 42 66kV Transformer EHV £0.19 £0.19 100.00%
CBA Output
Table 29 LPN Transformers CBA Results 12 hours
32 Years 45 Years
CBA Low CBA Std CBA High CBA Low CBA Std CBA High
Total 132kV Replacement (£5.94) (£5.71) (£5.47) (£0.43) £0.33 £1.09
Total 66kV Replacement (£4.92) (£4.79) (£4.65) (£4.10) (£3.92) (£3.73)
Total 33kV Replacement £24.97 £29.50 £34.04 £27.56 £32.20 £36.84
Total 132kV Refurbishment £0.54 £0.56 £0.58 £0.58 £0.60 £0.62
Total 66kV Refurbishment £0.14 £0.18 £0.21 £0.15 £0.18 £0.22
Total £14.79 £19.74 £24.70 £23.75 £29.39 £35.03
Projects returning + ve CBAs 6/22 6/22 6/22 8/22 8/22 9/22
Table 30 LPN Transformers CBA Results 24 hours
32 Years 45 Years
CBA Low CBA Std CBA High CBA Low CBA Std CBA High
Total 132kV Replacement (£3.95) (£3.49) (£6.04) £6.06 £7.55 £9.03
Total 66kV Replacement (£3.78) (£3.51) (£3.03) (£2.53) (£2.17) (£1.81)
Total 33kV Replacement £63.59 £72.41 £53.07 £67.09 £76.13 £85.16
Total 132kV Refurbishment £0.69 £0.73 £0.65 £0.73 £0.77 £0.80
Total 66kV Refurbishment £0.43 £0.49 £0.55 £0.43 £0.50 £0.56
Total £56.98 £66.63 £76.27 £71.79 £82.77 £93.75
Projects returning + ve CBAs 9/22 9/22 10/22 10/22 11/22 11/22

CBA Results Page 24
Table 31 LPN Transformers CBA Results 48 hours
32 Years 45 Years
CBA Low CBA Std CBA High CBA Low CBA Std CBA High
Total 132kV Replacement £0.05 £0.95 £1.85 £19.06 £21.99 £24.92
Total 66kV Replacement (£1.49) (£0.97) (£0.45) £0.62 £1.33 £2.04
Total 33kV Replacement £140.83 £158.24 £175.65 £146.16 £163.98 £181.80
Total 132kV Refurbishment £0.99 £1.06 £1.13 £1.03 £1.10 £1.17
Total 66kV Refurbishment £0.99 £1.12 £1.25 £1.00 £1.12 £1.25
Total £141.37 £160.39 £179.41 £167.86 £189.52 £211.17
Projects returning + ve CBAs 12/22 12/22 12/22 12/22 12/22 12/22
The CBA results are positive for our programme over 45 years under all sensitivities. The strongly
positive movements shown in the outage duration sensitivities demonstrate that there is good
justification for replacing transformers before the risk of prolonged outages develops, even though a
number of projects remain slightly negative in this assessment. The individual projects that do not
produce a positive CBA are still considered to be valid for asset condition driven replacement based
on the condition of the assets with high costs and lower customer numbers driving lower outputs than
would be expected given the loading of the assets.
4.3.3 SPN
Table 32 SPN 132kV Transformers Replace
Table Line Total Assessed Total RIGs
Line
% of RIGs
line
assessed
CV3 29 6.6/11kV UG Cable HV £0.09 £8.13 1.11%
CV3 48 6.6/11kV Transformer (GM) HV £0.03 £10.91 0.32%
CV3 70 33kV CB (Air Insulated Busbars)(OD) (GM) EHV £0.02 £0.02 100.00%
CV3 83 33kV Transformer (GM) EHV £0.18 £13.35 1.38%
CV3 89 132kV OHL (Tower Line) Conductor 132kV £0.39 £15.99 2.47%
CV3 97 132kV CB (Air Insulated Busbars)(OD) (GM) 132kV £0.16 £1.39 11.63%
CV3 100 132kV Switchgear - Other 132kV £0.30 £1.30 22.85%
CV3 101 132kV Transformer 132kV £10.34 £10.34 100.00%
CV6 30 Plinths and Groundworks EHV £0.01 £2.78 0.32%
CV6 33 Plinths and Groundworks 132kV £0.83 £2.85 29.33%
CV6 34 Building 132kV £0.08 £10.71 0.77%
CV6 35 Enclosures and Surrounds 132kV £0.41 £1.61 25.52%
CV8 7 Site security EHV £0.04 £4.51 0.89%
CV8 8 Site security 132kV £0.32 £9.92 3.24%
CV8 13 Earthing upgrades £0.41 £1.21 34.00%

CBA Results Page 25
Table 33 SPN 33kV Transformers Replace
Table Line Total
Assessed
Total RIGs
Line
% of RIGs
line
assessed
CV3 29 6.6/11kV UG Cable HV £0.69 £8.13 8.49%
CV3 48 6.6/11kV Transformer (GM) HV £0.37 £10.91 3.37%
CV3 62 33kV UG Cable (Non Pressurised) EHV £0.34 £10.84 3.15%
CV3 83 33kV Transformer (GM) EHV £11.61 £13.35 86.96%
CV6 29 Enclosures and Surrounds HV £0.05 £0.05 100.00%
CV6 30 Plinths and Groundworks EHV £1.15 £2.78 41.45%
CV6 32 Enclosures and Surrounds EHV £2.28 £3.46 65.98%
CV8 7 Site security EHV £1.32 £4.51 29.18%
CV10
1
10 Primary network (n-1) EHV
to HV
£0.88 £29.34 2.99%
Table 34 SPN 132kV Transformers Refurbish
Table Line Total
Assessed
Total RIGs
Line
% of RIGs
line
assessed
CV5 52 132kV Transformer 132kV £1.38 £1.38 100.00%
Table 35 SPN 33kV Transformers Refurbish
Table Line Total
Assessed
Total RIGs
Line
% of RIGs
line
assessed
CV5 32 33kV Transformer EHV £4.48 £4.48 100.00%
CBA Output
Table 36 SPN Transformers CBA Results 12 hours
32 Years 45 Years
CBA Low CBA Std CBA High CBA Low CBA Std CBA High
Total 132kV Replacement £27.34 £30.60 £33.87 £33.83 £37.66 £41.49
Total 33kV Replacement £1.68 £2.61 £3.53 £29.15 £33.08 £37.00
Total 132kV Refurbishment £2.49 £2.71 £2.94 £2.53 £2.75 £2.98
Total 33kV Refurbishment £14.95 £16.36 £17.77 £17.16 £18.79 £20.42
Total £46.45 £52.27 £58.09 £82.67 £92.27 £101.87
Projects returning + ve CBAs 29/48 29/48 31/48 31/48 31/48 32/48

CBA Results Page 26
Table 37 SPN Transformers CBA Results 24 hours
32 Years 45 Years
CBA Low CBA Std CBA High CBA Low CBA Std CBA High
Total 132kV Replacement £55.14 £61.50 £19.22 £66.41 £73.86 £81.30
Total 33kV Replacement £9.53 £11.32 £3.40 £62.56 £70.20 £77.83
Total 132kV Refurbishment £4.39 £4.82 £5.22 £4.43 £4.86 £5.29
Total 33kV Refurbishment £26.94 £29.68 £15.97 £31.04 £34.21 £37.38
Total £95.99 £107.31 £118.63 £164.43 £183.12 £201.80
Projects returning + ve CBAs 35/48 35/48 37/48 36/48 37/48 38/48
Table 38 SPN Transformers CBA Results 48 hours
32 Years 45 Years
CBA Low CBA Std CBA High CBA Low CBA Std CBA High
Total 132kV Replacement £110.76 £123.29 £135.83 £131.57 £146.26 £160.94
Total 33kV Replacement £25.22 £28.76 £32.29 £129.37 £144.43 £159.49
Total 132kV Refurbishment £8.18 £9.03 £9.89 £8.22 £9.07 £9.93
Total 33kV Refurbishment £50.92 £56.32 £61.73 £58.80 £65.06 £71.32
Total £195.06 £217.39 £239.72 £327.96 £364.81 £401.67
Projects returning + ve CBAs 39/48 39/48 39/48 39/48 39/48 39/48
SPN’s transformer replacement/refurbishment programme produces positive CBA results over all
sensitivities and all assessment periods. The individual projects that do not produce a positive CBA
are still considered to be valid for asset condition driven replacement based on the condition of the
assets. The strongly positive movements shown in the outage duration sensitivities demonstrate that
there is good justification for replacing transformers before the risk of prolonged outages develops
4.4 EHV Switchgear
4.4.1 EPN
Table 39 EPN 132kV Switchgear Replace
Table Line Total
Assessed
Total RIGs
Line
% of RIGs
line
assessed
CV3 83 33kV Transformer (GM) EHV £0.24 £19.41 1.21%
CV3 92 132kV UG Cable (Non Pressurised) 132kV £18.70 £29.46 63.48%
CV3 96 132kV CB (Air Insulated Busbars)(ID)
(GM)
132kV £0.38 £0.38 100.00%
CV3 97 132kV CB (Air Insulated Busbars)(OD)
(GM)
132kV £0.31 £0.74 41.55%
CV3 98 132kV CB (Gas Insulated Busbars)(ID)
(GM)
132kV £31.81 £32.39 98.21%
CV3 99 132kV CB (Gas Insulated
Busbars)(OD) (GM)
132kV £0.12 £0.12 100.00%
CV3 100 132kV Switchgear - Other 132kV £0.10 £0.78 12.51%
CV3 102 Batteries at 132kV Substations 132kV £0.00 £0.68 0.07%

CBA Results Page 27
Table Line Total
Assessed
Total RIGs
Line
% of RIGs
line
assessed
CV6 33 Plinths and Groundworks 132kV £0.49 £3.31 14.80%
CV6 34 Building 132kV £8.79 £17.05 51.58%
CV6 35 Enclosures and Surrounds 132kV £0.90 £2.62 34.42%
CV8 13 Earthing upgrades £0.30 £2.62 11.29%
CV105 6
Substation RTUs, marshalling kiosks,
receivers £0.00 £41.64 0.00%
Table 40 EPN 33kV Switchgear Replace
Table Line Total
Assessed
Total RIGs
Line
% of RIGs
line
assessed
CV3 51 Batteries at GM HV Substations HV £0.00 £3.61 0.10%
CV3 62 33kV UG Cable (Non Pressurised) EHV £2.01 £13.07 15.38%
CV3 69 33kV CB (Air Insulated Busbars)(ID)
(GM)
EHV
£0.69 £0.69 99.07%
CV3 70 33kV CB (Air Insulated Busbars)(OD)
(GM)
EHV
£3.52 £3.98 88.35%
CV3 71 33kV CB (Gas Insulated Busbars)(ID)
(GM)
EHV
£13.15 £13.90 94.61%
CV3 73 33kV Switch (GM) EHV £0.50 £0.58 86.16%
CV3 83 33kV Transformer (GM) EHV £1.26 £19.41 6.50%
CV3 85 Batteries at 33kV Substations EHV £0.18 £3.58 5.09%
CV3 102 Batteries at 132kV Substations 132kV £0.01 £0.68 1.00%
CV3 104 Pilot Wire Underground Other £0.07 £1.63 4.37%
CV6 30 Plinths and Groundworks EHV £0.28 £4.75 5.92%
CV6 31 Building EHV £7.54 £36.60 20.59%
CV6 32 Enclosures and Surrounds EHV £0.25 £7.31 3.46%
CV6 34 Building 132kV £0.29 £17.05 1.68%
CV6 35 Enclosures and Surrounds 132kV £0.01 £2.62 0.37%
CV105 6 Substation RTUs, marshalling kiosks,
receivers
£0.56 £41.64 1.35%

CBA Results Page 28
CBA Output
Table 41 EPN EHV Switchgear CBA Results 2 hours
32 Years 45 Years
CBA Low CBA Std CBA High CBA Low CBA Std CBA High
Total 132kV Replacement £6.70 £11.47 £16.23 £7.09 £11.86 £16.62
Total 33kV Replacement £180.83 £202.65 £224.47 £181.65 £203.53 £225.41
Total £187.53 £214.12 £240.70 £188.74 £215.39 £242.03
Projects returning + ve CBAs 26/37 27/37 27/37 27/37 27/37 27/37
Table 42 EPN EHV Switchgear CBA Results 12 hours
32 Years 45 Years
CBA Low CBA Std CBA High CBA Low CBA Std CBA High
Total 132kV Replacement £166.49 £189.01 £211.53 £166.88 £189.40 £211.92
Total 33kV Replacement £912.77 £1015.92 £1119.07 £915.48 £1018.89 £1122.31
Total £1079.26 £1204.93 £1330.60 £1082.36 £1208.29 £1334.23
Projects returning + ve CBAs 31/37 33/37 33/37 32/37 33/37 34/37
The cost benefit assessment for our EPN EHV switchgear replacement provides is highly positive
result, providing strong support for our proposed programme of work. The interruption duration
sensitivity indicates that this investment should be made to avoid the risk of prolonged outages over
12 hours.
4.4.2 LPN
Table 43 LPN 132kV Switchgear Replace
Table Line Total
Assessed
Total
RIGs Line
% of RIGs
line
assessed
CV3 83 33kV Transformer (GM) EHV £0.15 £2.58 5.89%
CV3 92 132kV UG Cable (Non Pressurised) 132kV £0.84 £61.26 1.37%
CV3 96 132kV CB (Air Insulated Busbars)(ID) (GM) 132kV £0.96 £1.02 93.75%
CV3 97 132kV CB (Air Insulated Busbars)(OD) (GM) 132kV £1.54 £1.93 79.62%
CV3 98 132kV CB (Gas Insulated Busbars)(ID) (GM) 132kV £3.75 £3.75 100.00%
CV3 100 132kV Switchgear - Other 132kV £1.03 £2.48 41.36%
CV3 102 Batteries at 132kV Substations 132kV £0.00 £0.48 0.14%
CV6 33 Plinths and Groundworks 132kV £0.44 £4.20 10.44%
CV6 34 Building 132kV £1.80 £36.44 4.93%
CV6 35 Enclosures and Surrounds 132kV £0.16 £1.93 8.09%
CV8 13 Earthing upgrades Locations £0.05 £0.94 5.42%

CBA Results Page 29
Table 44 LPN 66kV Switchgear Replace
Table Line Total
Assessed
Total
RIGs Line
% of RIGs
line
assessed
CV3 78 66kV CB (Air Insulated Busbars)(OD) (GM) EHV £6.81 £7.76 87.75%
CV3 79 66kV CB (Gas Insulated Busbars)(ID) (GM) EHV £4.14 £4.14 100.00%
CV3 83 33kV Transformer (GM) EHV £0.06 £2.58 2.32%
CV3 92 132kV UG Cable (Non Pressurised) 132kV £1.42 £61.26 2.32%
CV3 97 132kV CB (Air Insulated Busbars)(OD) (GM) 132kV £0.02 £1.93 0.82%
CV3 99 132kV CB (Gas Insulated Busbars)(OD) (GM) 132kV £0.12 £0.12 100.00%
CV3 100 132kV Switchgear - Other 132kV £0.15 £2.48 6.09%
CV3 102 Batteries at 132kV Substations 132kV £0.00 £0.48 0.14%
CV6 33 Plinths and Groundworks 132kV £0.14 £4.20 3.44%
CV6 34 Building 132kV £0.59 £36.44 1.63%
CV6 35 Enclosures and Surrounds 132kV £0.16 £1.93 8.19%
CV8 13 Earthing upgrades Locations £0.05 £0.94 5.49%
Table 45 LPN 33kV Switchgear Replace
Table Line Total
Assessed
Total
RIGs Line
% of RIGs
line
assessed
CV3 62 33kV UG Cable (Non Pressurised) EHV £0.04 £8.54 0.50%
CV3 70 33kV CB (Air Insulated Busbars)(OD) (GM) EHV £0.28 £0.33 84.21%
CV3 73 33kV Switch (GM) EHV £0.10 £0.15 66.67%
CV3 83 33kV Transformer (GM) EHV £0.03 £2.58 1.20%
CV6 30 Plinths and Groundworks EHV £0.04 £0.99 4.41%
CBA Output
Table 46 LPN EHV Switchgear CBA Results 2 hours
32 Years 45 Years
CBA Low CBA Std CBA High CBA Low CBA Std CBA High
Total 132kV Replacement £24.24 £27.79 £31.34 £24.82 £28.37 £31.93
Total 66kV Replacement £17.15 £19.96 £22.76 £17.43 £20.24 £23.04
Total 33kV Replacement £0.47 £0.54 £0.62 £0.49 £0.57 £0.65
Total £41.85 £48.29 £54.73 £42.74 £49.18 £55.63
Projects returning + ve CBAs 6/8 6/8 6/8 6/8 6/8 6/8

CBA Results Page 30
Table 47 LPN EHV Switchgear CBA Results 12 hours
32 Years 45 Years
CBA Low CBA Std CBA High CBA Low CBA Std CBA High
Total 132kV Replacement £143.31 £160.09 £176.87 £144.17 £160.99 £177.81
Total 66kV Replacement £111.34 £124.61 £137.89 £111.62 £124.90 £138.17
Total 33kV Replacement £3.13 £3.51 £3.88 £3.16 £3.54 £3.91
Total £257.78 £288.21 £318.64 £258.95 £289.42 £319.89
Projects returning + ve CBAs 8/8 8/8 8/8 8/8 8/8 8/8
The cost benefit assessment for LPN EHV switchgear change is positive for all identified projects.
Again the interruption duration sensitivities show that the economic benefits of investing to avoid
prolonged interruptions to supply are high.

CBA Results Page 31
4.4.3 SPN
Table 48 SPN 132kV Switchgear Replace
Table Line Total
Assessed
Total
RIGs
Line
% of RIGs
line
assessed
CV3 83 33kV Transformer (GM) EHV £0.14 £13.35 1.07%
CV3 89 132kV OHL (Tower Line) Conductor 132kV £0.16 £15.99 0.98%
CV3 92 132kV UG Cable (Non Pressurised) 132kV £1.58 £17.48 9.04%
CV3 97 132kV CB (Air Insulated Busbars)(OD) 132kV £1.06 £1.39 76.15%
CV3 98 132kV CB (Gas Insulated Busbars)(ID) 132kV £11.12 £11.12 100.00%
CV3 99 132kV CB(Gas Insulated Busbars)(OD) 132kV £0.12 £0.12 100.00%
CV3 100 132kV Switchgear - Other 132kV £0.60 £1.30 46.43%
CV3 102 Batteries at 132kV Substations 132kV £0.00 £1.32 0.10%
CV6 33 Plinths and Groundworks 132kV £0.45 £2.85 15.75%
CV6 34 Building 132kV £3.63 £10.71 33.89%
CV6 35 Enclosures and Surrounds 132kV £0.32 £1.61 19.62%
CV8 13 Earthing upgrades Locations £0.10 £1.21 8.55%
CV105 6 Substation RTUs, marshalling kiosks,receivers £0.00 £30.33 0.00%
Table 49 SPN 33kV Switchgear Replace
Table Line Total
Assessed
Total
RIGs
Line
% of RIGs
line
assessed
CV3 62 33kV UG Cable (Non Pressurised) EHV £0.16 £10.84 1.51%
CV3 69 33kV CB (Air Insulated Busbars)(ID) (GM) EHV £0.05 £0.05 91.51%
CV3 71 33kV CB (Gas Insulated Busbars)(ID) (GM) EHV £0.79 £0.93 84.93%
CV3 83 33kV Transformer (GM) EHV £0.05 £13.35 0.40%
CV3 85 Batteries at 33kV Substations EHV £0.01 £2.51 0.50%
CV3 104 Pilot Wire Underground Other £0.01 £0.73 0.77%
CV6 30 Plinths and Groundworks EHV £0.00 £2.78 0.02%
CV6 31 Building EHV £0.47 £11.02 4.29%
CV6 32 Enclosures and Surrounds EHV £0.02 £3.46 0.44%
CV8 7 Site security EHV £0.04 £4.51 0.89%
CV105 6 Substation RTUs, marshalling kiosks,
receivers
£0.03 £30.33 0.11%
Table 50 SPN 33kV Switchgear Refurbish
Table Line Total
Assessed
Total RIGs
Line
% of RIGs
line
assessed
CV3 83 33kV Transformer (GM) EHV £0.01 £13.35 0.04%
CV5 33 33kV CB (GM) EHV £0.44 £0.45 99.36%

CBA Results Page 32
CBA Output
Table 51 SPN EHV Switchgear CBA Results 2 hours
32 Years 45 Years
CBA Low CBA Std CBA High CBA Low CBA Std CBA High
Total 132kV Replacement £2.76 £4.42 £6.08 £2.73 £4.39 £6.05
Total 33kV Replacement (£0.11) £0.04 £0.19 £0.60 £0.81 £1.02
Total 33kV Refurbishment £4.81 £5.37 £5.93 £4.84 £5.40 £5.96
Total £12.43 £15.35 £18.26 £13.41 £16.40 £19.40
Projects returning + ve CBAs 6/7 7/7 7/7 7/7 7/7 7/7
Table 52 SPN EHV Switchgear CBA Results 12 hours
32 Years 45 Years
CBA Low CBA Std CBA High CBA Low CBA Std CBA High
Total 132kV Replacement £58.41 £66.25 £74.09 £58.38 £66.22 £74.07
Total 33kV Replacement £5.00 £5.72 £6.44 £7.70 £8.70 £9.70
Total 33kV Refurbishment £23.66 £26.31 £28.97 £23.69 £26.34 £29.00
Total £110.14 £123.91 £137.68 £113.85 £128.00 £142.16
Projects returning + ve CBAs 7/7 7/7 7/7 7/7 7/7 7/7
The cost benefit analysis for SPN EHV switchgear programme is positive for all identified projects.
4.5 11kV Switchgear
4.5.1 Replace v Refurbish
A replace v refurbish cost benefit assessment has been undertaken considering a known site with 26
11kV circuit breakers. An indicative replacement cost of £0.1m per breaker was assumed against the
known cost of refurbishment and ongoing maintenance contract. The CBA considered replacement
against a refurbish baseline and showed that replacement instead of refurbishment would be over
£1m negative. Refurbishment is therefore undertaken where technically possible and the fixed portion
of the switchgear is in good condition.
4.5.2 EPN
Table 53 EPN 11kV Switchgear Replace
Table Line Total
Assessed
Total RIGs
Line
% of RIGs
line
assessed
CV3 29 6.6/11kV UG Cable HV £11.92 £17.58 67.79%
CV3 33 6.6/11kV CB (GM) Primary HV £21.42 £21.42 100.00%
CV3 38 6.6/11kV RMU HV £2.91 £34.77 8.36%
CV3 83 33kV Transformer (GM) EHV £1.15 £19.41 5.91%
CV3 85 Batteries at 33kV Substations EHV £1.19 £3.58 33.29%
CV6 16 Civil Works At 33kV & 66kV
Substations
EHV £0.03 £0.51 5.05%

CBA Results Page 33
Table Line Total
Assessed
Total RIGs
Line
% of RIGs
line
assessed
CV6 30 Plinths and Groundworks EHV £0.33 £4.75 6.92%
CV6 31 Building EHV £19.36 £36.60 52.89%
CV8 7 Site security EHV
Substations
£2.79 £9.40 29.70%
CV8 13 Earthing upgrades Locations £0.38 £2.62 14.67%
CV105 6 Substation RTUs, marshalling
kiosks, receivers
£2.36 £41.64 5.67%
Table 54 EPN 11kV Switchgear Refurbish
Table Line Total
Assessed
Total RIGs
Line
% of RIGs
line
assessed
CV5 19 6.6/11kV CB (GM) Primary HV £1.40 £2.10 66.80%
CBA Output
Table 55 EPN 11kV Switchgear CBA Results 2 hours
32 Years 45 Years
CBA Low CBA Std CBA High CBA Low CBA Std CBA High
Total Replacement £45.56 £54.60 £63.63 £47.93 £57.04 £66.15
Total Refurbishment £12.84 £14.35 £15.86 £13.30 £14.86 £16.42
Total £57.78 £68.26 £78.74 £61.23 £71.90 £82.57
Projects returning + ve
CBAs
69/91 71/91 71/91 71/91 71/91 79/91
Table 56 EPN 11kV Switchgear CBA Results 6 hours
32 Years 45 Years
CBA Low CBA Std CBA High CBA Low CBA Std CBA High
Total Replacement £166.75 £189.25 £211.75 £170.14 £192.83 £215.52
Total Refurbishment £33.14 £36.90 £40.67 £34.21 £38.10 £41.98
Total £198.37 £224.47 £250.56 £204.36 £230.94 £257.51
Projects returning + ve
CBAs
86/91 87/91 87/91 86/91 87/91 87/91
Table 57 EPN 11kV Switchgear CBA Results 12 hours
32 Years 45 Years
CBA Low CBA Std CBA High CBA Low CBA Std CBA High
Total Replacement £348.54 £391.24 £433.94 £353.46 £396.51 £439.57
Total Refurbishment £63.59 £70.74 £77.89 £65.58 £72.95 £80.32
Total £409.24 £458.77 £508.30 £419.06 £469.49 £519.92
Projects returning + ve
CBAs
89/91 89/91 89/91 89/91 89/91 89/91

CBA Results Page 34
Both replacement and refurbishment of 11kV switchgear produce positive CBA results under all
sensitivities. The sensitivity assessment shows that with longer outage durations more of the projects
in the proposed programme of work produce positive results which supports replacement to avoid the
risk of prolonged outages over 12 hours resulting from switchgear failure at primary substations
4.5.3 LPN
Table 58 LPN 11kV Switchgear Replace
Table Line Total
Assessed
Total RIGs
Line
% of RIGs
line
assessed
CV3 29 £2.58 £12.55 20.53% £2.58 £12.55
CV3 33 6.6/11kV CB (GM) Primary HV £12.39 £12.39 99.96%
CV3 38 6.6/11kV RMU HV £0.50 £28.51 1.74%
CV3 51 Batteries at GM HV Substations HV £0.00 £4.14 0.01%
CV3 83 33kV Transformer (GM) EHV £0.43 £2.58 16.79%
CV3 85 Batteries at 33kV Substations EHV £0.17 £0.83 20.60%
CV6 27 Plinths and Groundworks HV £0.00 £0.00 100.00%
CV6 28 Building HV £0.29 £2.00 14.41%
CV6 30 Plinths and Groundworks EHV £0.06 £0.99 6.29%
CV6 31 Building EHV £5.46 £12.77 42.74%
CV8 6 Site security HV
Substations
£0.00 £7.38 0.01%
CV8 7 Site security EHV
Substations
£0.41 £1.94 21.29%
CV8 13 Earthing upgrades Locations £0.05 £0.94 5.81%
CV105 6 Substation RTUs, marshalling
kiosks, receivers
£0.34 £29.32 1.15%
Table 59 LPN 11kV Switchgear Refurbish
Table Line Total
Assessed
Total RIGs
Line
% of RIGs
line
assessed
CV5 19 6.6/11kV CB (GM) Primary HV £1.71 £2.41 71.01%

CBA Results Page 35
CBA Output
Table 60 LPN 11kV Switchgear CBA Results 2 hours
32 Years 45 Years
CBA Low CBA Std CBA High CBA Low CBA Std CBA High
Total Replacement £170.73 £190.89 £211.05 £171.60 £191.75 £211.91
Total Refurbishment £25.61 £28.53 £31.46 £25.67 £28.59 £31.51
Total £196.34 £219.42 £242.50 £197.27 £220.35 £243.43
Projects returning + ve
CBAs
17/18 17/18 17/18 17/18 17/18 17/18
Table 61 LPN 11kV Switchgear CBA Results 6 hours
32 Years 45 Years
CBA Low CBA Std CBA High CBA Low CBA Std CBA High
Total Replacement £441.18 £491.39 £541.60 £442.05 £492.26 £542.46
Total Refurbishment £64.81 £72.09 £79.36 £64.87 £72.14 £79.42
Total £505.99 £563.48 £620.96 £506.91 £564.40 £621.89
Projects returning + ve
CBAs
18/18 18/18 18/18 18/18 18/18 18/18
Table 62 LPN 11kV Switchgear CBA Results 12 hours
32 Years 45 Years
CBA Low CBA Std CBA High CBA Low CBA Std CBA High
Total Replacement £846.86 £942.14 £1037.43 £847.72 £943.01 £1038.29
Total Refurbishment £123.61 £137.42 £151.23 £123.66 £137.47 £151.28
Total £970.47 £1079.56 £1188.65 £971.39 £1080.48 £1189.58
Projects returning + ve
CBAs
18/18 18/18 18/18 18/18 18/18 18/18
The CBA assessment gives positive results for the 11kV switchgear programme for LPN both for the
overall programme and for all projects individually.
4.5.4 SPN
Table 63 SPN 11kV Switchgear Replace
Table Line Total
Assessed
Total RIGs
Line
% of RIGs
line
assessed
CV3 29 6.6/11kV UG Cable HV £4.28 £8.13 52.67%
CV3 33 6.6/11kV CB (GM) Primary HV £9.74 £10.04 97.03%
CV3 38 6.6/11kV RMU HV £1.36 £33.59 4.05%
CV3 51 Batteries at GM HV Substations HV £0.11 £3.68 2.93%
CV3 83 33kV Transformer (GM) EHV £0.48 £13.35 3.59%
CV3 85 Batteries at 33kV Substations EHV £0.36 £2.51 14.48%
CV6 27 Plinths and Groundworks HV £0.01 £0.09 5.84%

CBA Results Page 36
Table Line Total
Assessed
Total RIGs
Line
% of RIGs
line
assessed
CV6 28 Building HV £0.28 £0.35 78.34%
CV6 30 Plinths and Groundworks EHV £0.14 £2.78 5.14%
CV6 31 Building EHV £7.88 £11.02 71.47%
CV6 33 Plinths and Groundworks 132kV £0.00 £2.85 0.02%
CV8 6 Site security HV £0.04 £5.63 0.71%
CV8 7 Site security EHV £1.13 £4.51 24.98%
CV8 13 Earthing upgrades Locations £0.15 £1.21 12.73%
CV101 8 Secondary network HV to HV £0.17 £3.13 5.31%
CV105 6 Substation RTUs, marshalling
kiosks, receivers
£0.99 £30.33 3.28%
Table 64 SPN 11kV Switchgear Refurbish
Table Line Total
Assessed
Total RIGs
Line
% of RIGs
line
assessed
CV5 19 6.6/11kV CB (GM) Primary HV £4.47 £5.51 81.09%
CBA Output
Table 65 SPN 11kV Switchgear CBA Results 2 hours
32 Years 45 Years
CBA Low CBA Std CBA High CBA Low CBA Std CBA High
Total Replacement £23.80 £28.38 £32.96 £24.30 £28.88 £33.46
Total Refurbishment £49.38 £55.14 £60.91 £49.62 £55.38 £61.14
Total £73.17 £83.52 £93.86 £73.92 £84.27 £94.62
Projects returning + ve
CBAs
59/62 59/62 59/62 59/62 59/62 60/62
Table 66 SPN 11kV Switchgear CBA Results 6 hours
32 Years 45 Years
CBA Low CBA Std CBA High CBA Low CBA Std CBA High
Total Replacement £85.24 £96.64 £108.05 £85.73 £97.14 £108.55
Total Refurbishment £126.72 £141.08 £155.44 £126.96 £141.31 £155.67
Total £211.98 £237.75 £263.52 £212.74 £238.51 £264.28
Projects returning + ve
CBAs
60/62 60/62 61/62 60/62 60/62 61/62
CBA Results Page 37
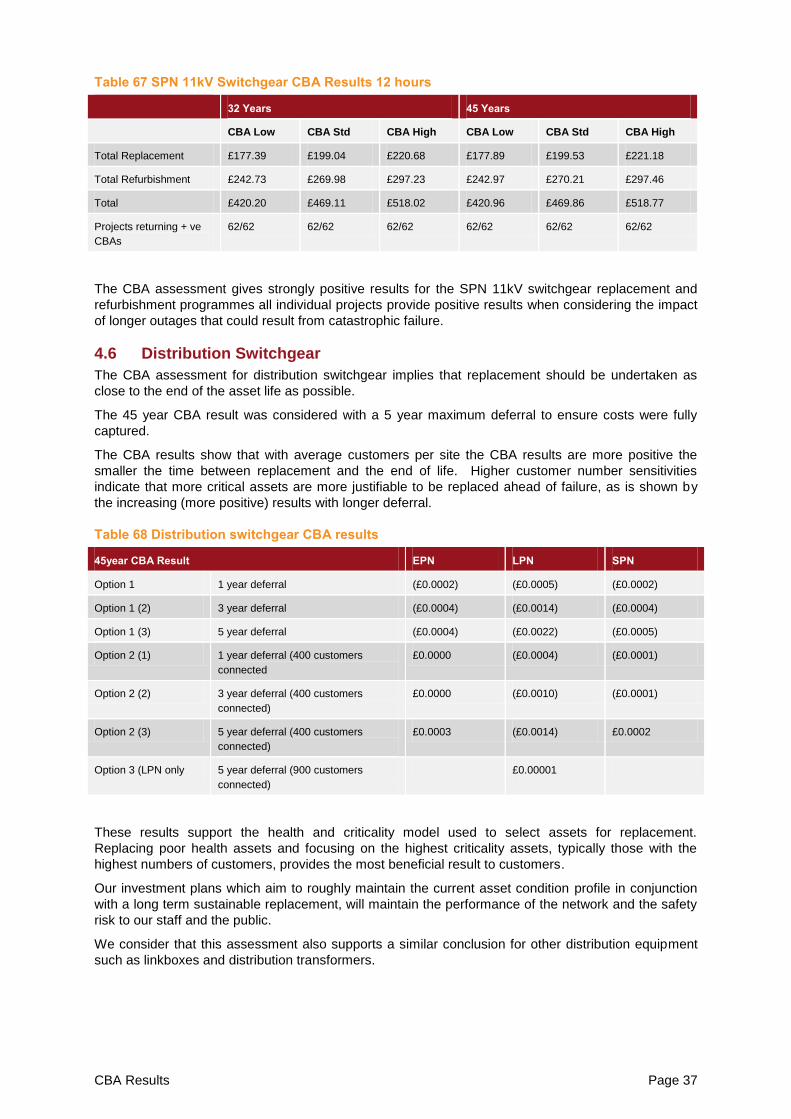
Table 67 SPN 11kV Switchgear CBA Results 12 hours
32 Years 45 Years
CBA Low CBA Std CBA High CBA Low CBA Std CBA High
Total Replacement £177.39 £199.04 £220.68 £177.89 £199.53 £221.18
Total Refurbishment £242.73 £269.98 £297.23 £242.97 £270.21 £297.46
Total £420.20 £469.11 £518.02 £420.96 £469.86 £518.77
Projects returning + ve
CBAs
62/62 62/62 62/62 62/62 62/62 62/62
The CBA assessment gives strongly positive results for the SPN 11kV switchgear replacement and
refurbishment programmes all individual projects provide positive results when considering the impact
of longer outages that could result from catastrophic failure.
4.6 Distribution Switchgear
The CBA assessment for distribution switchgear implies that replacement should be undertaken as
close to the end of the asset life as possible.
The 45 year CBA result was considered with a 5 year maximum deferral to ensure costs were fully
captured.
The CBA results show that with average customers per site the CBA results are more positive the
smaller the time between replacement and the end of life. Higher customer number sensitivities
indicate that more critical assets are more justifiable to be replaced ahead of failure, as is shown by
the increasing (more positive) results with longer deferral.
Table 68 Distribution switchgear CBA results
45year CBA Result EPN LPN SPN
Option 1 1 year deferral (£0.0002) (£0.0005) (£0.0002)
Option 1 (2) 3 year deferral (£0.0004) (£0.0014) (£0.0004)
Option 1 (3) 5 year deferral (£0.0004) (£0.0022) (£0.0005)
Option 2 (1) 1 year deferral (400 customers
connected
£0.0000 (£0.0004) (£0.0001)
Option 2 (2) 3 year deferral (400 customers
connected)
£0.0000 (£0.0010) (£0.0001)
Option 2 (3) 5 year deferral (400 customers
connected)
£0.0003 (£0.0014) £0.0002
Option 3 (LPN only 5 year deferral (900 customers
connected)
£0.00001
These results support the health and criticality model used to select assets for replacement.
Replacing poor health assets and focusing on the highest criticality assets, typically those with the
highest numbers of customers, provides the most beneficial result to customers.
Our investment plans which aim to roughly maintain the current asset condition profile in conjunction
with a long term sustainable replacement, will maintain the performance of the network and the safety
risk to our staff and the public.
We consider that this assessment also supports a similar conclusion for other distribution equipment
such as linkboxes and distribution transformers.

CBA Results Page 38
4.7 Low Carbon Generation
The following projects were looked at as potential low carbon generation schemes
Table 69 Low carbon generation schemes
Scheme Name Estimated
Cost (£m)
Additional
MVA provided
(Winter)
Annual
Low
Carbon
MWh
Trowse Grid 132kV £0.35 40 140160
Kings Lynn- Snettisham £1.50 12 42048
Kings Lynn- Hempton £2.50 12 42048
Kings Lynn South- Dowham Market £1.00 7 24528
Walsoken- Downham Market £1.50 7 24528
Kings Lynn South- Walsoken £1.20 7 24528
Snettisham - Hunstanton – Burnham Thorpe £1.80 12 42048
Swaffham – Hempton £1.70 12 42048
Funtham’s Lane – Chatteris tee point £1.00 12 42048
Sall – Stody – West Beckham £1.80 12 42048
Wroxham – North Walsham No 1 £0.80 7 24528
Wroxham – Scottow - North Walsham No 2 £0.80 7 24528
Sall – Sprowston £1.40 12 42048
March Grid £4.00 45 157680
New Grid Substation between March and Peterborough £10.00 90 315360
Peterborough East £14.00 40 140160
The results of the CBAs are shown below, split by sensitivities. The schemes we selected using the
upper quartile benefit to cost ratio, as discussed earlier, are highlighted orange above.
Table 70 Low Carbon Generation Reinforcement – Immediate Utilisation
Scheme Name CBA NPV
£m (16
Yrs)
CBA NPV
£m (24
Yrs)
CBA NPV
£m (32
Yrs)
CBA NPV
£m (45
Yrs)
Benefit
/Cost
ratio
45 Yrs
Trowse Grid 132kV £20.74 £36.18 £45.34 £47.78 265.5
Kings Lynn- Snettisham £5.17 £9.62 £12.25 £12.86 18.6
Kings Lynn- Hempton £4.42 £8.74 £11.28 £11.81 11.2
Kings Lynn South- Dowham Market £2.92 £5.50 £7.02 £7.37 16.3
Walsoken- Downham Market £2.54 £5.06 £6.54 £6.84 10.8
Kings Lynn South- Walsoken £2.77 £5.33 £6.83 £7.16 13.6
Snettisham - Hunstanton – Burnham Thorpe £4.94 £9.36 £11.96 £12.55 15.5
Swaffham – Hempton £5.02 £9.45 £12.06 £12.65 16.4
Funtham’s Lane – Chatteris tee point £5.55 £10.06 £12.73 £13.39 27.9
Sall – Stody – West Beckham £4.94 £9.36 £11.96 £12.55 15.5

CBA Results Page 39
Scheme Name CBA NPV
£m (16
Yrs)
CBA NPV
£m (24
Yrs)
CBA NPV
£m (32
Yrs)
CBA NPV
£m (45
Yrs)
Benefit
/Cost
ratio
45 Yrs
Wroxham – North Walsham No 1 £3.07 £5.68 £7.22 £7.58 20.3
Wroxham – Scottow - North Walsham No 2 £3.07 £5.68 £7.22 £7.58 20.3
Sall – Sprowston £5.25 £9.71 £12.35 £12.97 19.9
March Grid £20.62 £37.52 £47.51 £49.95 26.1
New Grid Substation between March and Peterborough £39.72 £73.27 £93.08 £97.79 20.9
Peterborough East £10.45 £24.12 £32.11 £33.38 6.6
The capacity is not guaranteed to be taken up in one year. We carried out a number of sensitivities
looking at different take up rates
Scenario 1
Phased Utilisation of Capacity as follows:
Year 1 Year 2 Year 3 Year 4 Year 5
50.00% 80.00% 100.00% 100.00% 100.00%
Table 71 Low Carbon Generation Reinforcement – Phased Utilisation 1
Scheme Name CBA NPV
£m (16
Yrs)
CBA NPV
£m (24
Yrs)
CBA NPV
£m (32
Yrs)
CBA NPV
£m (45
Yrs)
Benefit
/Cost
ratio
45 Yrs
Trowse Grid 132kV £20.39 £35.83 £44.98 £47.43 264.4
Kings Lynn- Snettisham £5.06 £9.52 £12.14 £12.76 18.5
Kings Lynn- Hempton £4.31 £8.63 £11.17 £11.70 11.1
Kings Lynn South- Dowham Market £2.86 £5.44 £6.96 £7.31 16.2
Walsoken- Downham Market £2.48 £5.00 £6.48 £6.78 10.8
Kings Lynn South- Walsoken £2.71 £5.26 £6.77 £7.10 13.5
Snettisham - Hunstanton – Burnham Thorpe £4.84 £9.25 £11.85 £12.44 15.4
Swaffham – Hempton £4.91 £9.34 £11.95 £12.55 16.3
Funtham’s Lane – Chatteris tee point £5.44 £9.96 £12.63 £13.28 27.8
Sall – Stody – West Beckham £4.84 £9.25 £11.85 £12.44 15.4
Wroxham – North Walsham No 1 £3.01 £5.62 £7.16 £7.52 20.2
Wroxham – Scottow - North Walsham No 2 £3.01 £5.62 £7.16 £7.52 20.2
Sall – Sprowston £5.14 £9.60 £12.24 £12.86 19.8
March Grid £20.22 £37.12 £47.11 £49.55 26.0
New Grid Substation between March and Peterborough £38.93 £72.48 £92.29 £97.00 20.8
Peterborough East £10.09 £23.77 £31.75 £33.03 6.6

CBA Results Page 40
Scenario 2
Phased Utilisation of Capacity as follows:
Year 1 Year 2 Year 3 Year 4 Year 5
10.00% 50.00% 90.00% 100.00% 100.00%
Table 72 Low Carbon Generation Reinforcement – Phased Utilisation 2
Scheme Name CBA NPV
£m (16
Yrs)
CBA NPV
£m (24
Yrs)
CBA NPV
£m (32
Yrs)
CBA NPV
£m (45
Yrs)
Benefit
/Cost
ratio
45 Yrs
Trowse Grid 132kV £19.99 £35.43 £44.58 £47.03 263.2
Kings Lynn- Snettisham £4.94 £9.40 £12.02 £12.64 18.4
Kings Lynn- Hempton £4.19 £8.51 £11.05 £11.58 11.1
Kings Lynn South- Dowham Market £2.79 £5.37 £6.89 £7.24 16.1
Walsoken- Downham Market £2.41 £4.93 £6.41 £6.71 10.7
Kings Lynn South- Walsoken £2.64 £5.19 £6.70 £7.03 13.4
Snettisham - Hunstanton – Burnham Thorpe £4.72 £9.13 £11.73 £12.32 15.4
Swaffham – Hempton £4.79 £9.22 £11.83 £12.42 16.3
Funtham’s Lane – Chatteris tee point £5.32 £9.84 £12.51 £13.16 27.6
Sall – Stody – West Beckham £4.72 £9.13 £11.73 £12.32 15.4
Wroxham – North Walsham No 1 £2.94 £5.55 £7.09 £7.45 20.2
Wroxham – Scottow - North Walsham No 2 £2.94 £5.55 £7.09 £7.45 20.2
Sall – Sprowston £5.02 £9.48 £12.12 £12.74 19.7
March Grid £19.77 £36.67 £46.66 £49.10 25.9
New Grid Substation between March and Peterborough £38.02 £71.57 £91.38 £96.09 20.7
Peterborough East £9.69 £23.36 £31.35 £32.63 6.6
Scenario 3
Phased Utilisation of Capacity as follows:
Year 1 Year 2 Year 3 Year 4 Year 5
10.00% 20.00% 40.00% 60.00% 100.00%
Table 73 Low Carbon Generation Reinforcement – Phased Utilisation 3
Scheme Name CBA NPV
£m (16
Yrs)
CBA NPV
£m (24
Yrs)
CBA NPV
£m (32
Yrs)
CBA NPV
£m (45
Yrs)
Benefit
/Cost
ratio
45 Yrs
Trowse Grid 132kV £19.39 £34.83 £43.98 £46.42 261.2
Kings Lynn- Snettisham £4.76 £9.21 £11.84 £12.46 18.3
Kings Lynn- Hempton £4.01 £8.33 £10.87 £11.40 11.0
Kings Lynn South- Dowham Market £2.68 £5.26 £6.79 £7.13 16.0

CBA Results Page 41
Scheme Name CBA NPV
£m (16
Yrs)
CBA NPV
£m (24
Yrs)
CBA NPV
£m (32
Yrs)
CBA NPV
£m (45
Yrs)
Benefit
/Cost
ratio
45 Yrs
Walsoken- Downham Market £2.31 £4.82 £6.30 £6.61 10.7
Kings Lynn South- Walsoken £2.53 £5.09 £6.59 £6.92 13.3
Snettisham - Hunstanton – Burnham Thorpe £4.54 £8.95 £11.55 £12.14 15.2
Swaffham – Hempton £4.61 £9.04 £11.65 £12.24 16.1
Funtham’s Lane – Chatteris tee point £5.14 £9.66 £12.33 £12.98 27.4
Sall – Stody – West Beckham £4.54 £8.95 £11.55 £12.14 15.2
Wroxham – North Walsham No 1 £2.84 £5.44 £6.98 £7.34 20.0
Wroxham – Scottow - North Walsham No 2 £2.84 £5.44 £6.98 £7.34 20.0
Sall – Sprowston £4.84 £9.30 £11.94 £12.56 19.6
March Grid £19.09 £35.99 £45.98 £48.42 25.7
New Grid Substation between March and Peterborough £36.67 £70.22 £90.02 £94.73 20.6
Peterborough East £9.09 £22.76 £30.75 £32.02 6.5
Additionally we tested the immediate utilisation against differing amounts of low carbon generation
taking up the capacity.
Table 74 Low Carbon Generation Reinforcement No Phasing – 75% Low Carbon
Scheme Name CBA NPV
£m (16
Yrs)
CBA NPV
£m (24
Yrs)
CBA NPV
£m (32
Yrs)
CBA NPV
£m (45
Yrs)
Benefit
/Cost
ratio
45 Yrs
Trowse Grid 132kV £15.49 £27.06 £33.92 £35.74 199.2
Kings Lynn- Snettisham £3.60 £6.89 £8.82 £9.25 13.9
Kings Lynn- Hempton £2.84 £6.00 £7.85 £8.20 8.4
Kings Lynn South- Dowham Market £2.00 £3.91 £5.03 £5.26 12.2
Walsoken- Downham Market £1.63 £3.46 £4.54 £4.74 8.1
Kings Lynn South- Walsoken £1.85 £3.73 £4.83 £5.05 10.2
Snettisham - Hunstanton – Burnham Thorpe £3.37 £6.62 £8.53 £8.94 11.6
Swaffham – Hempton £3.44 £6.71 £8.63 £9.04 12.3
Funtham’s Lane – Chatteris tee point £3.97 £7.33 £9.31 £9.78 20.9
Sall – Stody – West Beckham £3.37 £6.62 £8.53 £8.94 11.6
Wroxham – North Walsham No 1 £2.15 £4.08 £5.22 £5.48 15.2
Wroxham – Scottow - North Walsham No 2 £2.15 £4.08 £5.22 £5.48 15.2
Sall – Sprowston £3.67 £6.97 £8.92 £9.36 14.9
March Grid £14.71 £27.26 £34.66 £36.41 19.6
New Grid Substation between March and Peterborough £27.91 £52.74 £67.39 £70.70 15.7
Peterborough East £5.19 £15.00 £20.69 £21.34 5.0

CBA Results Page 42
Table 75 Low Carbon Generation Reinforcement No Phasing – 50% Low Carbon
Scheme Name CBA NPV
£m (16
Yrs)
CBA NPV
£m (24
Yrs)
CBA NPV
£m (32
Yrs)
CBA NPV
£m (45
Yrs)
Benefit
/Cost
ratio
45 Yrs
Trowse Grid 132kV £10.24 £17.94 £22.50 £23.71 132.8
Kings Lynn- Snettisham £2.02 £4.15 £5.40 £5.64 9.3
Kings Lynn- Hempton £1.27 £3.26 £4.43 £4.59 5.6
Kings Lynn South- Dowham Market £1.08 £2.31 £3.03 £3.16 8.1
Walsoken- Downham Market £0.71 £1.87 £2.54 £2.63 5.4
Kings Lynn South- Walsoken £0.93 £2.13 £2.83 £2.95 6.8
Snettisham - Hunstanton – Burnham Thorpe £1.79 £3.88 £5.11 £5.32 7.7
Swaffham – Hempton £1.87 £3.97 £5.20 £5.43 8.2
Funtham’s Lane – Chatteris tee point £2.40 £4.59 £5.88 £6.17 13.9
Sall – Stody – West Beckham £1.79 £3.88 £5.11 £5.32 7.7
Wroxham – North Walsham No 1 £1.23 £2.49 £3.22 £3.37 10.2
Wroxham – Scottow - North Walsham No 2 £1.23 £2.49 £3.22 £3.37 10.2
Sall – Sprowston £2.10 £4.24 £5.49 £5.75 10.0
March Grid £8.80 £16.99 £21.82 £22.86 13.1
New Grid Substation between March and Peterborough £16.09 £32.22 £41.69 £43.62 10.5
Peterborough East -£0.06 £5.87 £9.27 £9.31 3.3
All the scenarios produced positive costs benefit assessments. As we do not expect all generation
projects to progress we have used the benefit to cost ratio to select the projects included in our
proposals. Projects above the upper quartile benefit/cost ratio have been included in our proposals.
The four schemes represent 56% of potential identified capacity, and 34% of identified potential
expenditure.
4.8 Losses
Table 76 Loss Reduction Strategy
Loss Reduction 8 years 16 years 24 years 32 years 45 years
Documented losses strategy £46.87 £129.2 £196.9 £244.6 £293.6
Our proposed loss reduction measures are forecast to bring benefits of over £45m during the RIIO-
ED1 period.
The CBA testing the effects of the new EU directive, requiring new standards for losses in distribution
transformers, found that, for 1000kVA transformers to be considered a justifiable expenditure, they
need to be within 25% (based on 100kVA transformer) of the current cost of a new transformer. Our
current 500kVA transformer specification already provides for low losses until the more stringent EU
standards are available at reasonable costs.
4.9 Smart Grid Solutions
Below are all of the results for each of the proposed Smart Grid solutions.
4.9.1 Demand Side Response
The same assumptions have been tested for EPN and SPN considering the deferral of reinforcement
by 2MVA of demand side response (DSR).
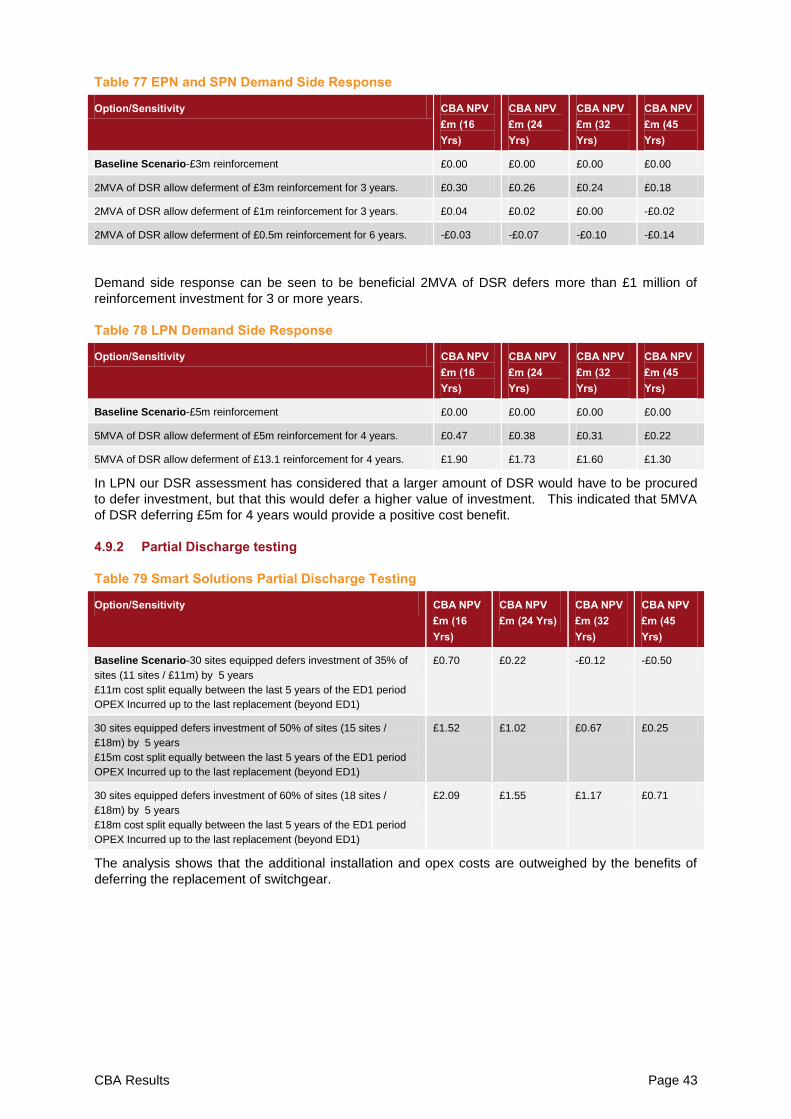
CBA Results Page 43
Table 77 EPN and SPN Demand Side Response
Option/Sensitivity CBA NPV
£m (16
Yrs)
CBA NPV
£m (24
Yrs)
CBA NPV
£m (32
Yrs)
CBA NPV
£m (45
Yrs)
Baseline Scenario-£3m reinforcement £0.00 £0.00 £0.00 £0.00
2MVA of DSR allow deferment of £3m reinforcement for 3 years. £0.30 £0.26 £0.24 £0.18
2MVA of DSR allow deferment of £1m reinforcement for 3 years. £0.04 £0.02 £0.00 -£0.02
2MVA of DSR allow deferment of £0.5m reinforcement for 6 years. -£0.03 -£0.07 -£0.10 -£0.14
Demand side response can be seen to be beneficial 2MVA of DSR defers more than £1 million of
reinforcement investment for 3 or more years.
Table 78 LPN Demand Side Response
Option/Sensitivity CBA NPV
£m (16
Yrs)
CBA NPV
£m (24
Yrs)
CBA NPV
£m (32
Yrs)
CBA NPV
£m (45
Yrs)
Baseline Scenario-£5m reinforcement £0.00 £0.00 £0.00 £0.00
5MVA of DSR allow deferment of £5m reinforcement for 4 years. £0.47 £0.38 £0.31 £0.22
5MVA of DSR allow deferment of £13.1 reinforcement for 4 years. £1.90 £1.73 £1.60 £1.30
In LPN our DSR assessment has considered that a larger amount of DSR would have to be procured
to defer investment, but that this would defer a higher value of investment. This indicated that 5MVA
of DSR deferring £5m for 4 years would provide a positive cost benefit.
4.9.2 Partial Discharge testing
Table 79 Smart Solutions Partial Discharge Testing
Option/Sensitivity CBA NPV
£m (16
Yrs)
CBA NPV
£m (24 Yrs)
CBA NPV
£m (32
Yrs)
CBA NPV
£m (45
Yrs)
Baseline Scenario-30 sites equipped defers investment of 35% of
sites (11 sites / £11m) by 5 years
£11m cost split equally between the last 5 years of the ED1 period
OPEX Incurred up to the last replacement (beyond ED1)
£0.70 £0.22 -£0.12 -£0.50
30 sites equipped defers investment of 50% of sites (15 sites /
£18m) by 5 years
£15m cost split equally between the last 5 years of the ED1 period
OPEX Incurred up to the last replacement (beyond ED1)
£1.52 £1.02 £0.67 £0.25
30 sites equipped defers investment of 60% of sites (18 sites /
£18m) by 5 years
£18m cost split equally between the last 5 years of the ED1 period
OPEX Incurred up to the last replacement (beyond ED1)
£2.09 £1.55 £1.17 £0.71
The analysis shows that the additional installation and opex costs are outweighed by the benefits of
deferring the replacement of switchgear.

CBA Results Page 44
4.9.3 OHL Ratings
Table 80 Smart Solutions 132kV Overhead Line Ratings
Option/Sensitivity CBA NPV
£m (16
Yrs)
CBA NPV
£m (24
Yrs)
CBA NPV
£m (32
Yrs)
CBA NPV
£m (45
Yrs)
Baseline Scenario- £6.36m Reinforcement £0.00 £0.00 £0.00 £0.00
Defer reinforcement for 8 years £1.32 £1.08 £0.89 £0.68
Defer reinforcement for 4 years £0.37 £0.19 £0.06 -£0.08
Defer reinforcement for 2 years -£0.14 -£0.29 -£0.39 -£0.50
Table 81 Smart Solutions 33kV Overhead Line Ratings
Option/Sensitivity CBA NPV
£m (16
Yrs)
CBA NPV
£m (24
Yrs)
CBA NPV
£m (32
Yrs)
CBA NPV
£m (45
Yrs)
Baseline Scenario- £2.7m Reinforcement £0.00 £0.00 £0.00 £0.00
Defer reinforcement for 3 years £0.26 £0.24 £0.23 £0.21
The scenarios assessed indicate that providing deferral is greater than 3 years, the employment of
OHL rating equipment is justified.
4.9.4 Real Time Transformer Ratings
Table 82 Smart Solutions Real Time Transformer Ratings
Option/Sensitivity CBA NPV
£m (16
Yrs)
CBA NPV
£m (24
Yrs)
CBA NPV
£m (32
Yrs)
CBA NPV
£m (45
Yrs)
Baseline Scenario- £1.5m Reinforcement £0.00 £0.00 £0.00 £0.00
RTTR on two transformers at £70k per transformer allow £1.5m
deferment for 3 years
£0.08 £0.05 £0.04 £0.00
Installing equipment to allow real time transformer ratings is beneficial if reinforcement can be deferred
for 3 years.
4.10 Quality of Supply
Table 83 Quality of Supply
Option/Sensitivity CBA NPV
£m (16
Yrs)
CBA NPV
£m (24
Yrs)
CBA NPV
£m (32
Yrs)
CBA NPV
£m (45
Yrs)
EPN Improvement Schemes £28.16 £25.75 £24.14 £22.48
LPN Improvement Schemes £4.26 £3.37 £2.78 £2.17
SPN Improvement Schemes £16.81 £15.70 £14.96 £14.20
All QoS related schemes provide positive benefits.

CBA Results Page 45
4.11 High Value Projects
Table 84 Eltham Sydenham Gas Cable Replacement High value Project
Option/Sensitivity CBA NPV
£m (16
Yrs)
CBA NPV
£m (24
Yrs)
CBA NPV
£m (32
Yrs)
CBA NPV
£m (45
Yrs)
Baseline Scenario-Reinforce in ED1 at cost £26.36m £0.00 £0.00 £0.00 £0.00
Defer 5 years - impact of failure rota disconnections for repair time -£105.95 -£106.22 -£106.46 -£106.81
Defer 5 years - restoration in 4 days using generation - on for 6 week
repair time at £3.1m
-£0.08 -£0.35 -£0.59 -£0.94
Deferral of the High Value Project at Eltham/Sydenham into the RIIO-ED2 period generates a negative
CBA result, demonstrating the project should go ahead within ED1.

Conclusions Page 46
5 Conclusions
At an activity-level, we are confident that the cost benefit assessments we have conducted support
that our current investment plans provide value for money to our customers.
5.1 Asset Replacement
In carrying out assessments of the actual projects that our asset replacement intervention strategies
have identified, we have demonstrated that our intervention strategies produce robust investment
plans which provide positive benefits for customers and maintain the condition of the distribution
networks. The results of the sensitivities around duration of interruption strongly support investing to
avoid the potentially long outages that can occur should there be the failure of multiple items of
equipment at higher voltages. We have demonstrated that refurbishment offers benefits over
replacement where it is technically feasible.
5.2 Reinforcement for low carbon generation
We have used CBA to justify investment in EPN of £15.4m which will increase network capacity by
187MVA.
5.3 Loss Reduction
We have used CBA to value the impact of our loss reduction initiative and identify the tipping point for
investing in low loss transformers ahead of any limits being imposed by EU directives.
5.4 Smart Grid Solutions
We have used CBA to test the parameters we have used to assess the impact smart technologies will
have on our investment plans. These support using
Demand side response to defer investment. Separate parameters have been defined around
2MVA in deferring reinforcement for at least 3 years in EPN and SPN and 5MVA of DSR
deferring reinforcement for 4 years in LPN.
Partial Discharge testing provides benefits in deferring switchgear replacement
Smart adaptation of overhead line ratings will allow reinforcement to be managed more
effectively
Equipment to allow real time transformer rating provides benefits in allowing capacity increases
to be deferred.
These technologies will allow our investment plans to be better optimised and uncertainties better
managed.
5.5 Quality of Supply
We have demonstrated that our proposed additional investments in quality of supply provide
substantial benefits to customers.
5.6 High Value Projects
We have demonstrated that the replacement of gas filled cables between Sydenham and Eltham in
south east London should be carried out in RIIO-ED1 rather than being deferred until RIIO-ED2.

Conclusions Page 47
5.7 Summary
The table below summarises the results where CBA assessment has been used to justify specific
investment
kV EPN LPN SPN
FFC Replacement 132
66
33
Transformer Replacement 132
66
33
Transformer Refurbish 132
66
33
Switchgear Replacement 132
66
33
11
Switchgear Refurbish 33
11
QoS
High Value Projects
Key
CBA results positive
Partial support
No projects