Embed Size (px)
Citation preview

Published by Option Alpha. All Rights Reserved.
Ultimate Earnings Trade Guide

About the Author Kirk Du Plessis is a full-time options trader, real estate investor and entrepreneur.
Before launching Option Alpha more than 8 years ago, he was an Investment Banker for Deutsche Bank in NY with the Mergers & Acquisitions group, a Capital Markets Analyst for BB&T in DC covering REITs and a Senior Loan Officer in the mortgage industry.
His training courses and coaching programs have helped thousands of traders from around the world learn how to make smarter options trades. He was recently featured in Barron’s Magazine as a contributor to the Annual Broker’s Review and is the head trader here at Option Alpha.
Though a long-time resident of Virginia, he currently lives in Pennsylvania with his beautiful wife and daughter.
Published by Option Alpha. All Rights Reserved.
What’s An “Earnings” Trade? Every quarter we go through “earnings season”, a time when public companies announce their performance and give guidance for the coming months. This is a highly anticipated (yet nervous) time for investors because they either get confirmation of a company’s strong growth or news of a slow down in revenues and profits.
As options traders, we frankly don’t care what happens with a company when they announce earnings. The stock could jump higher or drop like a rock. What we are after is the drop in implied volatility that follows.
In the weeks before a company announces it’s quarterly results the options market for that stock sees an increase in overall trading activity and volatility. This is mainly the result of heightened fear of the “unknown”.
Will the company post strong sales growth? Are they laying people off and closing stores? Did their new life-saving drug get FDA approval?
There are literally thousands of unanswered questions which causes option volatility and prices to swell (on both sides) in anticipation of the event. Now, you might assume that we could just buy options in advance of earnings and profit from the rising prices right? Nope. Even during a

seemingly consistent increase in volatility we find that IV will still over-state the expected move. Plus, we have no way of knowing when the IV level will top out before earnings. Some stocks see IV at it’s highest 3 days before earnings and others 10 days before earnings. The data just isn’t consistent enough to make a trade on.
The higher probability trade then, is to profit from what is commonly called the “IV Crush” or the rapid drop in option pricing volatility the day after earnings are announced.
It’s this 1-time IV slide that we are targeting because it’s been proven to happen time and time again. As soon as the company announces it’s earnings (good or bad) volatility in the options drop because now investors have the information they were looking for.
The “unknown” is behind them now and even if the news is really bad at least they know what’s going on. This level of certainty in future stock direction (again even if it’s lower) causes a dramatic drop in option prices on both sides which we can exploit and profit from.
In this guide we’ll break-down our strategy from start to finish for placing profitable earnings trades each quarter. The ability to leverage these trading opportunities with targeted strategies has been very profitable for us over the last couple years and we look forward to sharing the roadmap with you in the pages to follow.

Some text
Part 1: Screening Stocks to Trade
Helping you set some basic guidelines to figure out if a stock is good enough to trade earnings on or not.

Finding Great Stocks. A profitable earnings position starts with your ability to find great stocks to trade. Thankfully this isn’t hard at all. In fact, it’s rather easy once you know what to look for.
Visual Backtesting The first thing you should do once you identify a stock that has earnings coming up is visually backtest the drop in IV. Does the stock actually see a drop in IV after earnings? Is it a small drop or big crush all the way down?

Since we are focused solely on profiting from the IV drop, the bigger and faster the drop the better the trading setup. In the example above, notice that the stock does have a significant drop in IV each time earnings are announced.
The stock below however has a much less dramatic drop. Not to say that you can’t trade the one below but your “edge” isn’t as great as if you were to focus on stocks that show a bigger magnitude drop.
Plus, you’ll notice that the 2nd stock is much less consistent in showing the IV drop. So, it’s in your best interest to use a visual backtest to pre-screen stocks first before going any further in analyzing a trade.

Liquidity Requirements After you have determined that you could consistently get an IV drop it’s time to determine if the underlying stock and options have liquid markets to trade.
Checking liquidity is a step that cannot be skipped. For the underlying stock we like to see at least 1 Million shares traded on average each day. This ensures that the stock is incredibly liquid and the probability numbers we use are derived from an underlying efficient market.
For the options themselves, we ideally like to see the at-the-money (ATM) options trading about 2-3k contracts per day with a minimum of 1k contracts and Bid/Ask spread around 0.10 or less. Regardless of how good a trade setup looks, if there are not liquid markets to easily get in or out it’s not worth trading - period.

Some text.
Part 2: The Best Timeline To Trade
Helping you focus on the best timeline and option contracts to trade to optimize the potential IV crush.

The Best Timeline. Earnings trades are 1 day events. They don’t last over the course of weeks or months (thank God). The company announces earnings and its over - done. Because these “binary” or “targeted” events happen so fast we need to adjust the timeline of our trades to compensate.
Trade Weekly Options The best contracts to use for earnings trades are the front most weekly options. These contracts will generally have the most volume and carry the biggest volatility premium increases before the event.
If they are not available then you can trade the closest monthly contracts but I would only do so if the days until expiration are less than 20 days. Note that during the 3rd week of each month there are no weekly options so you would use the next expiring monthly contract instead.

Enter The “Session” Before Just as we would like to target weekly options to maximize the drop in IV we also should look to enter our trade the session before a company announces earnings to remain as neutral as possible to any post-earnings move.
This means that if a company is due to announce earnings “Before the Open” on Thursday, then we need to enter our strategy as close to the close on Wednesday as possible.
Likewise, if a company will announce “After the Close” on Thursday then we want to enter our strategy the same day near the close of the market.
Some traders try to enter their position 1-3 days in advance
but you run the risk that the stock makes a big move ahead of the event. Doing this challenges your position even before the IV drop that we are targeting and makes you much more of a directional trader (see chart above).

Some text
Part 3: Strategy Over Direction
Helping you select the best non-directional strategies to use for earnings implied volatility drops.

Sell Expensive Options. With a targeted focus on the IV drop we also need to be 100% clear on which strategies to use (and not) use when making an earnings trade.
It should come as no surprise that the best way to profit is to sell expensive options that have been over inflated and buy them back later when they become cheaper after the company announcement.
Short Strangles/Straddles
Our default and 2 favorite option strategies for earnings trades are to sell short strangles or straddles. Both are undefined risk trades that are “pure plays” on volatility because we are don’t buy any options for protection.

These can be more capital intensive since they require margin to hold the positions but also have a much higher total dollar return because we don’t use our credit buying options as part of a spread.
Short Iron Condors If you are unable to trade undefined risk trades (or prefer to have defined risk) then we suggest using iron condors.
These strategies are still net short option premium and have lower capital requirements but also offer much less overall profit potential.
Whichever strategy you choose the steps that follow will be the same since it’s still based on selling OTM options.
And whatever you do please don’t try to buy options ahead of earnings attempting to pick the direction and hit a home run.
It’s not a long-term strategy or business and I guarantee you’ll consistently lose money. Stick to short premium.

some text
Part 4: Expected Move Calculation
Helping you figure out how far the stock might move after it’s announcement based on current options activity.

68% Expected Move. One of the key data points we use when placing earnings trades is found by calculating the stock’s 1-day expected move. In statistics this is equivalent to a 68% confidence or probability range. With this figure we can pin-point our overall probability of success on each trade to more than 70%; dramatically increasing our win rate long-term.
Calculate Using ATM Straddle The most accurate way to calculate the expected move is to use the current value of the ATM straddle on the front-most contracts (weeklies if available).
From there we multiple the value of the ATM by the desired expected range we are looking for. In our example below we’ll continue to use the 68% confidence or probability range. And finally we’ll take this new figure and use it in the next section (Part 5) to help determine the best strike prices to sell for our strategy.
To better drive home this point let’s look at an example with JPM’s stock currently trading at $59.34. As a reminder we always use the “MARK” for determining an option’s current price as this is the theoretical middle price.

Using the option table above we can determine that the closest ATM straddle could be at $59. The MARK of the calls on the left are $1.145 and the MARK of the puts on the right are $0.775 for a total value of $1.92.
Now, if we are looking to capture a 68% expected range we would multiply ($1.92 X .68) = $1.30 possible move UP or DOWN following earnings.
This means that with nearly 70% confidence JPM will stay inside a $1.30 move up or down following it’s earnings release. I’ll give you a minute to really think about how powerful this can be when trading options (start now).
Brining this level of definition to a seemingly “unknown” event is how you consistently beat the market by placing smarter trades.

Visualizing Expect Move What we like to do as a final step (though not required) is to visually look back at the chart of the stock and place lines at the possible expected boundaries.
Using JPM’s stock chart we placed a line approve $1.30 higher and lower than it’s current closing price.
This helps define the trade for us and also shows us the possible “profit window” for our chosen strategy.

some text
Part 5: Strike Prices & Premiums
Helping you select the best strike prices for both the highest premium and the best chance of success.

Setting It All Up. Now that we have the expected move figure from Part 4 above we can use this number to help us select strike prices that will give us the high probably of success we are looking to hit. At this point, determining if we are collecting enough premium also becomes a priority.
Camp “Outside” The Range In order for us to be highly profitable we need to ensure that when the company announces earnings, and stock subsequently moves, we have sold options that are outside of the expected range of $1.30 (JPM example).
Therefore, we should look to sell puts options more than $1.30 below the market and calls options more than $1.30 above the market.
If we can go even further out on each end, great! The more conservative you want to be within reason go ahead and make this fit your risk tolerance and trading style.
From our JPM example, a $1.30 move below it’s current price would be a put option around the $58 strike. And with a $1.30 above it’s current price we would want to sell a call above $61.64 or close to it.

Looking at the puts that JPM has available in the front-most contract we would ideally sell the $58 strikes.
And with the calls that are available we would look to sell the $61 strikes a little further out.
Notice that both short strikes are just outside the expected range of the stock heading into earnings.

Collecting Enough Money Only after you find that there are strikes trading outside the expected range can you now look at ensuring that you are collecting enough premium to make the trade worth your time and energy.
This will be subjective for each trader but as a general rule of thumb, we like to collect about a 5% return on strangles/straddles and roughly 10% with iron condors.
These are not requirements but rather guidelines to help you make a decision. The key is that there is “some value” there to be realized. Don’t put hundreds of dollars at risk just to at most make $10 or $20.
In our JPM example above selling a short strangle we could take in $80 of premium or credit and the margin required is $1,054 (7.59% max possible return).

With an iron condor because we would have to buy protection on either end at the next strike prices out (57.5 puts and 61.5 calls) our total credit goes down to just $22.
But our total return goes up to more than 66% since the margin required to hold the position is only $33.
You can now put context and hard numbers around our previous comments in Part 3 about strategy selection. The strangles offer 3X the total dollar profit but lower % return because of capital usage when compared to iron condors.
Full disclosure, we would not trade the JPM iron condor above because the credit is too low. Instead we would go with the strangle or look for another (higher valued) earnings trade.

Risk Per Trade By Account Size
***Risk per trade is based of the maximum loss on the trade or initial margin requirement to hold the position. For example, if you sell a $1 wide credit spread and take in a $30 credit your max risk is $70. If you sold a $2 wide credit spread taking in the same $30 your max risk would increase to $170. For undefined risk trades we will take the initial margin requirement. For example, if you sell a naked put below the market and take in $90 of credit but the margin requirement is $1,200 then we base the max account size off the $1,200 margin requirement needed to hold the position.
1% 2% 3% 4% 5%
$5,000 $50 $100 $150 $200 $250
$10,000 $100 $200 $300 $400 $500
$15,000 $150 $300 $450 $600 $750
$20,000 $200 $400 $600 $800 $1,000
$25,000 $250 $500 $750 $1,000 $1,250
$50,000 $500 $1,000 $1,500 $2,000 $2,500
$100,000 $1,000 $2,000 $3,000 $4,000 $5,000
$250,000 $2,500 $5,000 $7,500 $10,000 $12,500

some textsome text
Part 6: Exiting The Position
Helping you determine the best time to exit post-earnings announcement to protect your profits.

Don’t Think, Exit. Thus far we’ve been very mechanical and smart about placing the right trade for the right earnings setup. Let’s also be smart about how we maximize our trade exit. After all, the entire goal of these 1-day trades is to profit from the drop in IV that happens after earnings are announced.
Close On The Market Open In order for us to be highly profitable we need to ensure that we quickly exit all earnings trades that are profitable soon after the market opens.
Should the stock move inside the expected range we are very likely to see a profit materialize with IV dropping and have to take action in closing the trade.
Back in January we traded BBBY around earnings and notice our entry and exit timeline of real trades that filled. We entered the trade for a $77 credit and closed it back for a $50 debit take a small $22 profit in less than 1 day.

The Risk of “Letting It Run” As the chart below shows of BBBY, the stock we analyzed closed the day before earnings at $79.5 and had an expected move of $4.50. The next morning the stock opened right at the edge of the expected move and because we exited quickly we were able to bank a profit (though small, it was still a profit).
Then throughout the day the stock continued to move lower heading down below $72.50. Had you waited to exit and “let the small winner run” you would have surely taken a much bigger loss by days end.

some text
Part 7: How To Adjust/Hedge
Helping you make smarter adjustments to stocks that move outside the expected range against your strikes.

When Trades Go Bad. Before we even start to get into the logistics of adjusting or hedging earnings trades that go wrong it’s important to remember that this is NOT a requirement.
As long as you place a lot of trades over the course of a year with a high probability of success, you will be profitable entering trades the session before and closing them out on the market open (win or lose it won’t matter).
Implied volatility will always over-state the expected move of a stock around earnings and those traders who sell options will be the ones left with all the money.
That said, making the right adjustments can improve your overall returns by turning possible losers into winners.
Adjusting for Risk First We’ve already discussed that if you have a profit at the market open you need to take it (big or small).
But if you don’t see a profit right away as a result of the stock making a huge “unexpected move” what steps can you take right away to reduce risk and still leave an opportunity to profit?

The first adjustment you should make is to extend your trading timeline by rolling the “tested” or “challenged” side of the trade to the next monthly contract.
If for example, if we had the $26 strike calls on an earnings trade and the stock opened much higher towards our short strike we would roll them from Jan to Feb.
Rolling creates both more duration and time to be right should the stock come back down as well as additional premium which is used to widen your break-even points.
Notice that we don’t roll further up to say the $27 or $28 strike as this creates exponential loss compounding.
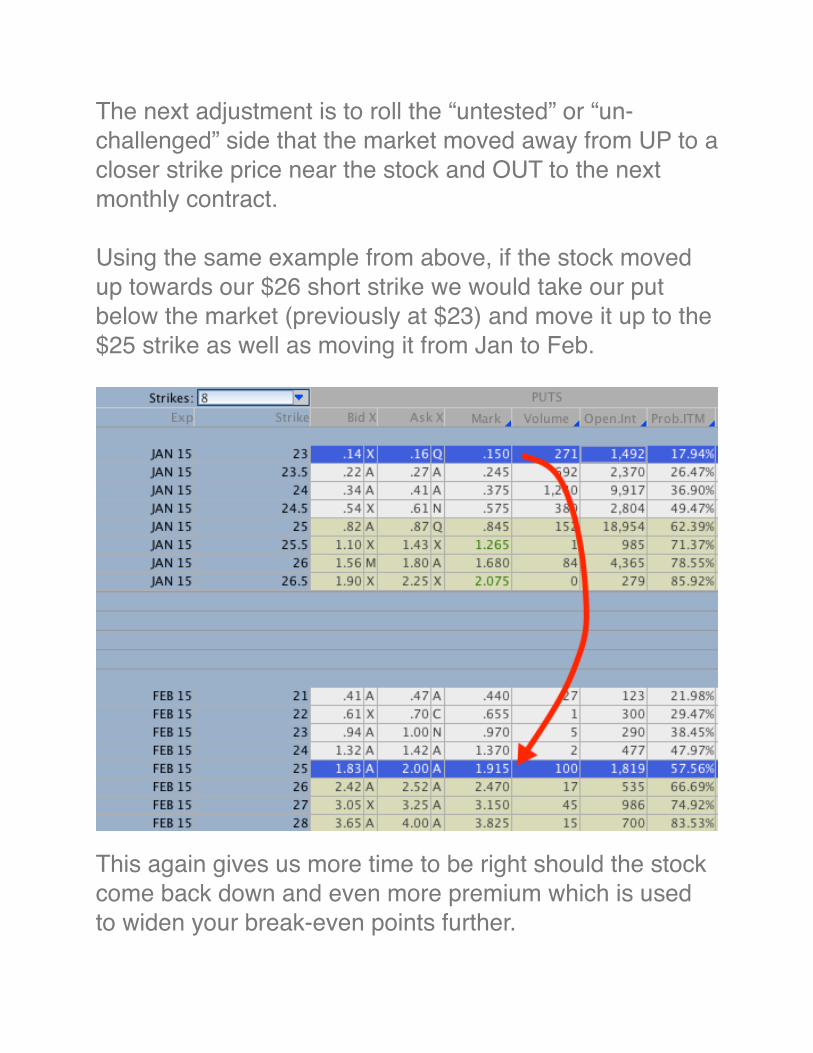
The next adjustment is to roll the “untested” or “un-challenged” side that the market moved away from UP to a closer strike price near the stock and OUT to the next monthly contract.
Using the same example from above, if the stock moved up towards our $26 short strike we would take our put below the market (previously at $23) and move it up to the $25 strike as well as moving it from Jan to Feb.
This again gives us more time to be right should the stock come back down and even more premium which is used to widen your break-even points further.

Roll And Wait for Profits After rolling and adjusting your strike prices, it become a waiting game. From here you should wait to see a profit or close the trade near expiration of the back month contract you rolled to (in this case Feb).
Let the probabilities work themselves out over time and don’t be afraid to hold through a losing trade until it comes back around.
Should the stock never come back then close the trade at expiration in Feb with a loss and move onto the next one.
If you kept your initial position small and didn’t add to the trade when rolling you’ll never (ever) experience a big enough losing trade that knocks you out of the game.
Remember this business is about numbers and math so don’t get emotional with trades that go wrong because they will happen and you will need to be smarter about how you “manage” them.

We help you make “smarter” more profitable trades…
We help educate and coach options traders on all levels: from people just starting out to advanced traders with multi-million dollar portfolios (and everyone in between).
Since 2007 more than 2.3 million people have trusted OptionAlpha.com to bring them the most amazing training on options trading, making us a clear leader in this market.
We believe that there is a huge lack of financial literacy and a gap that we aim to close by delivering the best possible content in multiple formats for you to consume: blog posts, video tutorials, webinars, podcasts, case studies, live events, etc.
Our goal is to pull back the curtain and give you the best online courses and training possible in all the right areas so that you can learn to make decisions for yourself. Because at the end of the day, making smarter trades isn't just our tagline - it's our mission for you.