Embed Size (px)
Citation preview
Ultra Low Level HCl CEMs for Coal Combustion Facilities Using FTIR and
Associated Performance Specifications
Ultra Low Level HCl CEMs for Coal Combustion Facilities Using FTIR and
Associated Performance Specifications
MKS Instruments
On-Line Product Group
2 Tech Drive, Suite 201Andover, MA 01810
Tel: 978-482-5364
MultiGas™ FT-IRAutomated HCl CEM Systems
California Desert Air Working Group
November 13-14, 2013Las Vegas, NV
Peter G. Zemek, Ph.D.

Discussion 40 CFR Parts 60 and 63 - (NESHAP) for the Portland Cement
Manufacturing Industry and Standards of Performance for Portland Cement Plants - Meet Standard by 2015
EPA Utility MACT (40 CFR Part60, Subpart UUUUU, EPA – 1,350 Units Affected
Continuous Monitoring (HCl) from new and existing coal and oil-fired (HF) emissions
Cement - 3 ppmv HCl, (3.8 mg/M3 @ 7% O2), EGU – 1 ppmv HCl – Instrument HCl Quantification - Rule of Thumb 20% below Emissions
Regulation, So need 0.2 ppm Current MKS FTIR is 50 ppb
Use Performance Specification 15, App B and Procedure 1 of Appendix F until new PS (20 yrs. old)
New PS-18 in development specific to HCl (Spring 2014)– Initial Instrument Qualification– On-going QC promulgated separately
MKS Instruments 2

Performance Specifications for FTIR CEMS
• PS-15 For Extractive FTIR CEM Systems in Stationary Sources
• Reference Method RATA Run Comparisons – Follow PS 2 Specifications and Test Procedures for SO2 and NOX CEM in Stationary Sources – WILL BE CHANGED (M320/ASTM D6348-12)
• Draft PS-18 and Test Procedures for HCl CEMS in Stationary Sources - Spring 2014
• Tests on-going at EPA RTP-NC• NIST traceable standards now available 1-20 ppmv Bal N2.
EPA has a 1 ppm NIST traceable standard. We match against HITRAN - High Resolution Transmission -Air Force Research Laboratories (1960s) Harvard-Smithsonian Center for Astrophysics, Cambridge MA, USA. Worldwide standard of atmospheric molecular transmission and region of the EM spectrum

FTIR Reference Methods for CEMS Validation and RATA
Reference Methods:
• Method 301—Field Validation of Pollutant Measurement Methods From Various Waste Media
• Method 320* - Measurement of Vapor Phase Organic and Inorganic Emissions by Extractive (FTIR) (Includes FTIR Protocol)
• Method 321** - Measurement of Gaseous HCl Emissions at Portland Cement Kilns by FTIR Spectroscopy
• ASTM D6348-12 Standard Test Method for Determination of Gaseous Compounds by Extractive Direct Interface Fourier Transform Infrared (FTIR) Spectroscopy
*1 of 2 RM for EGU **Only acceptable RM for Portland Cement MACT

Validation and On-Going HCl CEM PS-18
1. Before Installation, instrument manufacturer must perform:a. Linearity
b. Detection Limit
c. Cross Sensitivity
2. After Installation to Validate must perform:a. RATA Test on Other than HCl compounds
b. Reference Method Test HCl - EPA-M321 RATAa. Includes Dynamic Spike
c. 7 day drift test
3. Daily and On-Going (all automated)a. Zero
b. Dynamic Spike or Dry Cal Span (Wet or Dry)
c. Periodic RATA
d. Provide 30 day rolling avg HCl
MKS Instruments 5

Advantages of FTIR Measurements done Hot-Wet
– Required for polar components HCl, HF– Works with High CO2 and H2O– No Chemical Conversions
Multiple components Simultaneously– THCs, HCl, HF, VOCs, NOx, SO2, etc. – Additional components:
No hardware change Can be added in the field
Simple Operation– No daily maintenance– No Daily Calibration– High sensitivity gas cell
small volume (200mL) long path length (5.11m)
No training needed– Software alerts to any malfunction– Only laser replace and cell cleaning
Fast (1 Hz or 5 Hz)

7
MKS Confidential 8
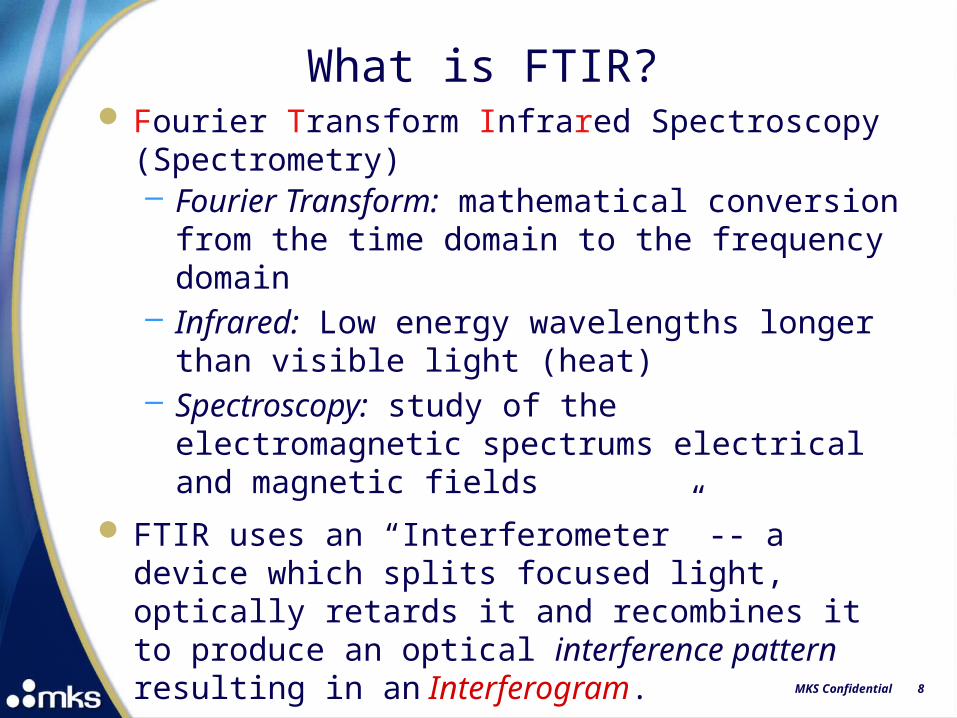
What is FTIR? Fourier Transform Infrared Spectroscopy
(Spectrometry)– Fourier Transform: mathematical conversion from
the time domain to the frequency domain– Infrared: Low energy wavelengths longer than
visible light (heat)– Spectroscopy: study of the electromagnetic
spectrums electrical and magnetic fields
FTIR uses an “Interferometer” -- a device which splits focused light, optically retards it and recombines it to produce an optical interference pattern resulting in an Interferogram.
A computer converts the Interferogram to an Absorbance spectrum which is Linear

MKS Confidential 9
MKS IR Spectroscopy Hardware
• Source: Blackbody (Hot Silicon Carbide ~ 1300 K)
• Modulator: Interferometer
• Sample: Vapor (Gas Cell, 10, 5.11m, 35cm, or 2cm path lengths)
• Detector: Mercury Cadmium Telluride (MCT) Quantum Detector cooled by Thermoelectrically (TE) Peltier
MKS Confidential 10
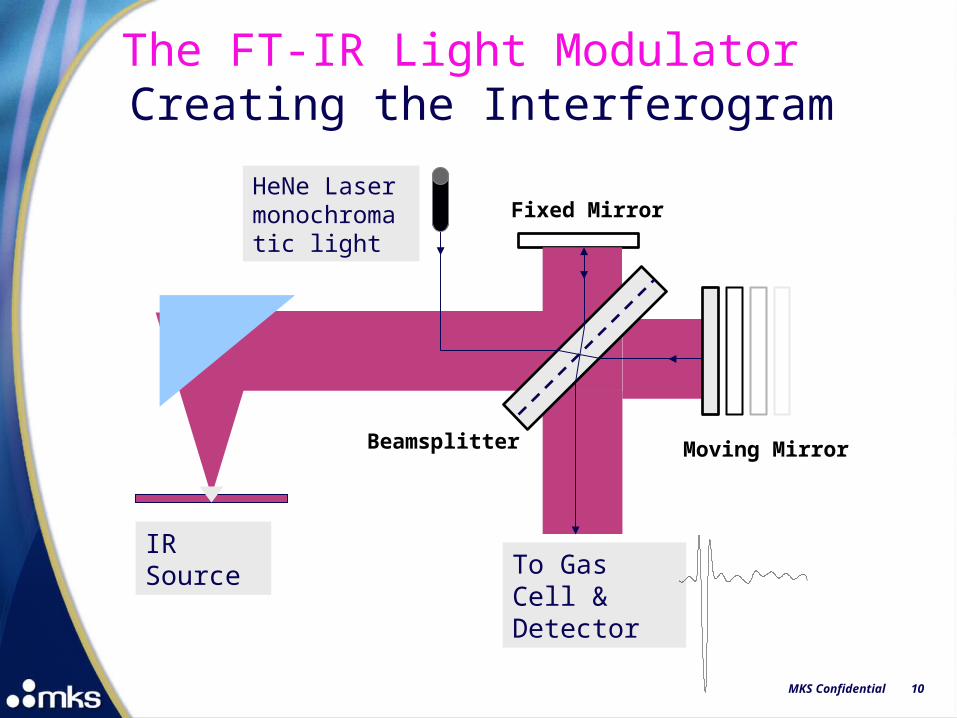
IR SourceTo Gas Cell & Detector
Beamsplitter Moving Mirror
Fixed MirrorHeNe Laser monochromatic light
Creating the InterferogramThe FT-IR Light Modulator

MKS Confidential 11
FTIR From Igram to Spectrum
Interferogram Single Beam Normal ModeAbsorbance Spectrum ready for speciation
Apodizing then FFT
A = -Log(I/Io)
1. Create Interferogram then send to detector (Modulator)2. Amplify Interferogram (preamp) then digitize it (A/D converter)3. Send digital signal to computer (PC)4. Apply Fourier Transform math to Interferogram, result is Spectrum (I)5. Remove background noise signals (Io) from Sample (I) 6. Result is Absorbance gas spectrum (A) used to identify the
different species
MKS Confidential 12
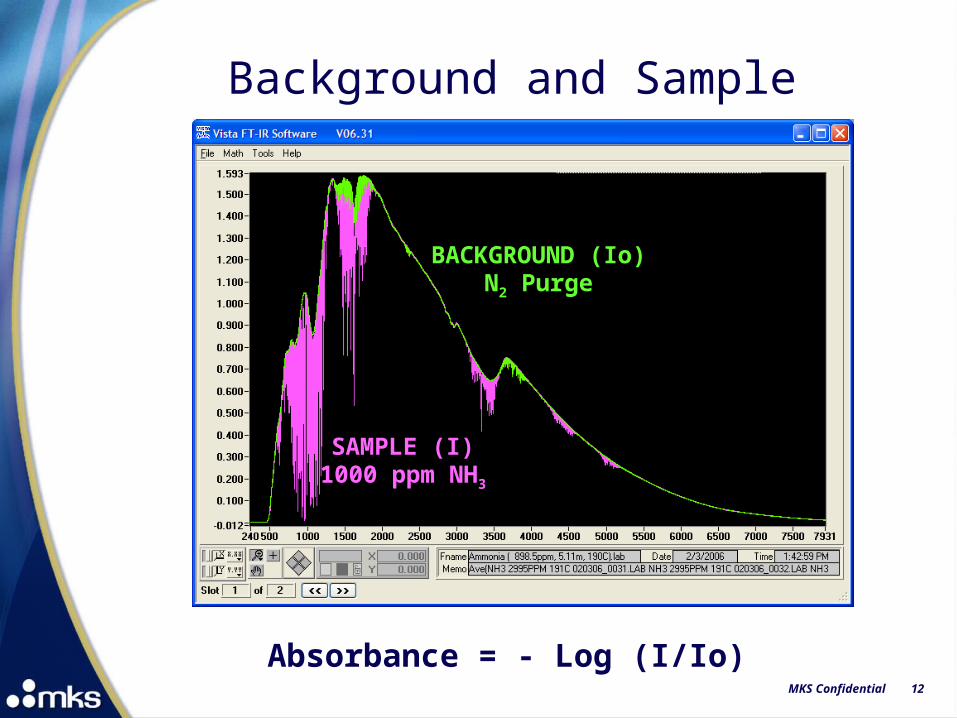
Background and Sample
BACKGROUND (Io)N2 Purge
SAMPLE (I)1000 ppm NH3
Absorbance = - Log (I/Io)

MKS Confidential 13
Absorbance is Proportional to Concentration
FFT of Sample1000 ppm NH3
Absorbance = - Log (I/Io)Absorbance = • C • path

MKS Confidential 14
FTIR Analysis MethodAnalytical Method
– Classical Least Squares (CLS) thenBeers Law, Abs = a b c measured spectruma absorptivity coefficient or ε from calibrationb path length fixed (5.11 meter)c sample concentration (calculated) what we want
– Canned Method - No user input necessary– Hot and Wet, No sample change – No ionization– No pressure drop across sample cell– 1 scan/second - 1 data point every 30 seconds– 40 sample cell turnovers per minute– Self -validating sample method– Cement – Only acceptable reference method EPA
M321
MKS Confidential 15
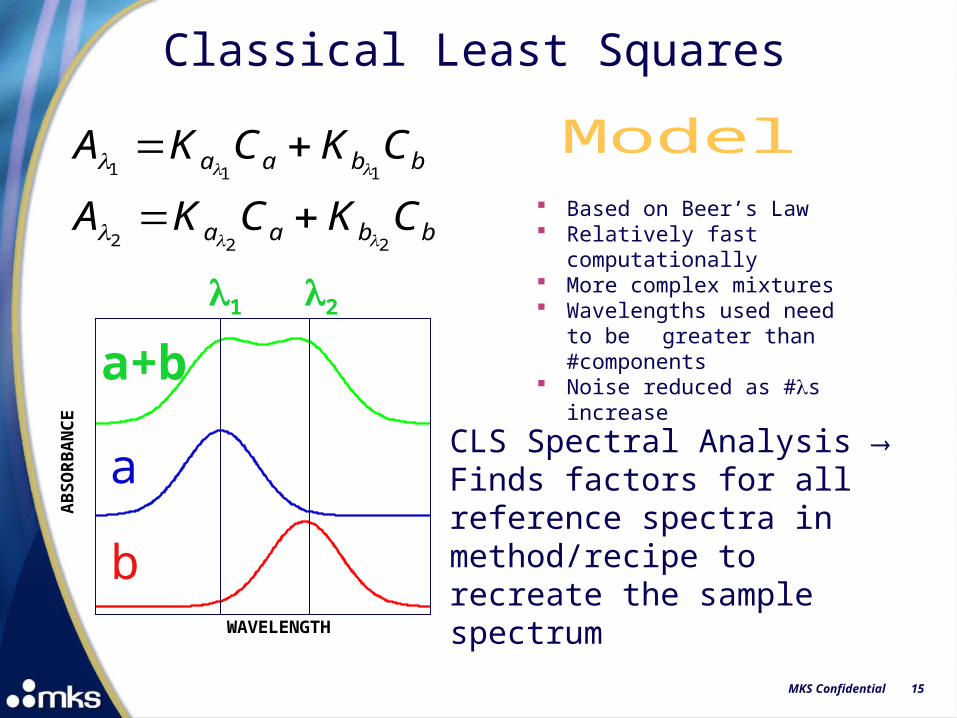
Classical Least Squares
1 1 1
2 2 2
a a b b
a a b b
A K C K C
A K C K C
Based on Beer’s Law Relatively fast computationally More complex mixtures Wavelengths used need to be
greater than #components Noise reduced as #s increase
1 2
a
b
a+b
WAVELENGTH
AB
SO
RB
AN
CE
CLS Spectral Analysis Finds factors for all reference spectra in method/recipe to recreate the sample spectrum

Powerful Technique - CLS for HCl Measurements with FTIR
Sample (white) with 5 ppm HCl and 12% water (red)
HCl peaks clearly visible after H2O subtraction
H2O subtraction
16

Powerful Technique - CLS for HCl Measurements with FTIRHCl calibration peaks (red and green)
After HCl subtraction, only noise left
HCl subtraction
17

Examples of Pre-Abatement Coal Fired (Cement Plant) Gas Concentrations Measured by FTIR
Plant 1 Plant 2 Plant 3 Plant 4 Plant 5 Plant 6
HCl 5-300 0-5 0-4 <1 <1 2-4
SO2 0-60 0-200 0-240 0* 300-400 <1
NOx 250-450* 300-600 100-400 100-300 ~ 150 ~ 800
CH2O 5-25 0-3 3-9 2-3 ~ 20 ~ 3
*NH3 0-150 0-40 0-80 0-50 ~30 0-15
CO 200-400* 100-600* 100-200* 100-600* ~ 300 300-700
CH4 ~ 2 ~ 2 ~ 2 ~ 2 ~ 2 ~ 5
18
* Also includes periodic high concentration spikes
All values in ppmv (or ppm) Includes data from non-US plants Concentration ranges e.g. min reading. Note: max reading, not rolling averages Data spanning few minutes to few days H2O and CO2 also measured with targets (cost effective)
* - Not measured with high sensitivity instrument (but can do high levels)

19 19
Time
HC
l Con
cent
ratio
n (p
pm)
Examples of HCl Concentration Profiles at Cement Plants – RM
On/Off
Raw Mill OFF Raw Mill ON

TÜV ranges & uncertainties MKS 2030D TE9 CEM FTIR
Gas comp.
Cert. range Supp. range 1
Supp. range 2
ELV U/C U/C req.
NH30-10 mg/m3 0-75 mg/m3 - 10 mg/m3 6.2% 30.0%
CO 0-75 mg/m3 0-300 mg/m3 0-1500 mg/m3 50 mg/m3 6.2% 7.5%
SO20-75 mg/m3 0-300 mg/m3 0-2000 mg/m3 50 mg/m3 7.0% 15.0%
NO 0-200 mg/m3 0-400 mg/m3 0-1500 mg/m3 130 mg/m3 6.8% 15.0%
NO20-50 mg/m3 0-100 mg/m3 0-1000 mg/m3 50 mg/m3 4.1% 15.0%
HCl 0-15 mg/m3
0-10 ppmv0-90 mg/m3 0-200 mg/m3 10 mg/m3 8.1% 30.0%
HF 0-3 mg/m3 0-10 mg/m3 - 1 mg/m3 19.3% 30.0%
CH40-15 mg/m3 0-50 mg/m3 - 10 mg/m3 7.0% 22.5%
CO20-25% - - 0-25% 3.3% 7.5%
H2O 0-40% - - 0-40% 3.4% 7.5%
N2O 0-50 mg/m3 0-100 mg/m3 0-500 mg/m3 50 mg/m3 4.5% 15.0%
1 ppm HCl = 1.49 mg/m3
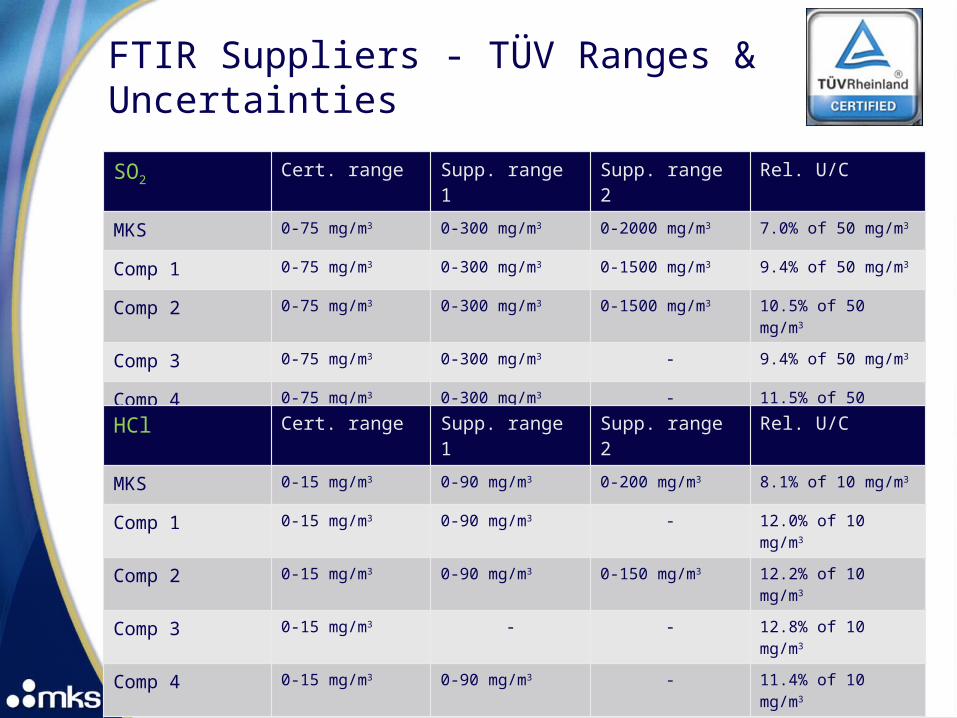
FTIR Suppliers - TÜV Ranges & Uncertainties
SO2Cert. range Supp. range 1 Supp. range 2 Rel. U/C
MKS 0-75 mg/m3 0-300 mg/m3 0-2000 mg/m3 7.0% of 50 mg/m3
Comp 1 0-75 mg/m3 0-300 mg/m3 0-1500 mg/m3 9.4% of 50 mg/m3
Comp 2 0-75 mg/m3 0-300 mg/m3 0-1500 mg/m3 10.5% of 50 mg/m3
Comp 3 0-75 mg/m3 0-300 mg/m3 - 9.4% of 50 mg/m3
Comp 4 0-75 mg/m3 0-300 mg/m3 - 11.5% of 50 mg/m3
HCl Cert. range Supp. range 1 Supp. range 2 Rel. U/C
MKS 0-15 mg/m3 0-90 mg/m3 0-200 mg/m3 8.1% of 10 mg/m3
Comp 1 0-15 mg/m3 0-90 mg/m3 - 12.0% of 10 mg/m3
Comp 2 0-15 mg/m3 0-90 mg/m3 0-150 mg/m3 12.2% of 10 mg/m3
Comp 3 0-15 mg/m3 - - 12.8% of 10 mg/m3
Comp 4 0-15 mg/m3 0-90 mg/m3 - 11.4% of 10 mg/m3
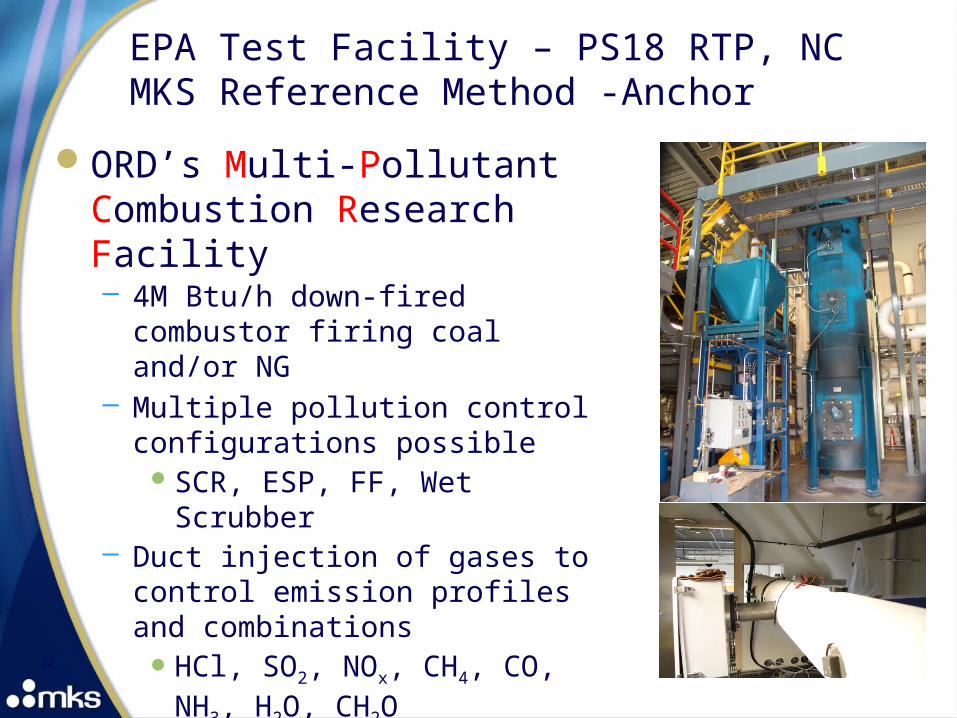
EPA Test Facility – PS18 RTP, NCMKS Reference Method -Anchor
ORD’s Multi-Pollutant Combustion Research Facility– 4M Btu/h down-fired combustor
firing coal and/or NG– Multiple pollution control
configurations possibleSCR, ESP, FF, Wet Scrubber
– Duct injection of gases to control emission profiles and combinations
HCl, SO2, NOx, CH4, CO, NH3, H2O, CH2O
– All CEMS and RM measurements from same basic location
22

EPA REFERENCE METHODS – MKS FTIRs - Anchors for Testing (EPA and Industry)
Looking at 3 different high resolution FTIR analyzers Focus on DLs, measurement quality and RM
performance at very low HCl levels LN2, TE9, HS Point of reference for HCl Gas Standards
23

NEW: High-Sensitivity FTIR HCl Analyzer for CEM
HCl detection limit 0.03 ppm (30 ppbv) plus biasHot and Wet – 200mL Sample VolumeNo liquid nitrogen (LN2) needed
No N2 Background → easier integration than standard FTIR – turn on and go
No Calibration Needed– “Canned” Method
Can measure HCl, CH2O, HF, H2O, N2O, CH4 with similar high sensitivity – or ELIMINATE Spectral Regions of no concern –hardware based
24
MKS Instruments 25
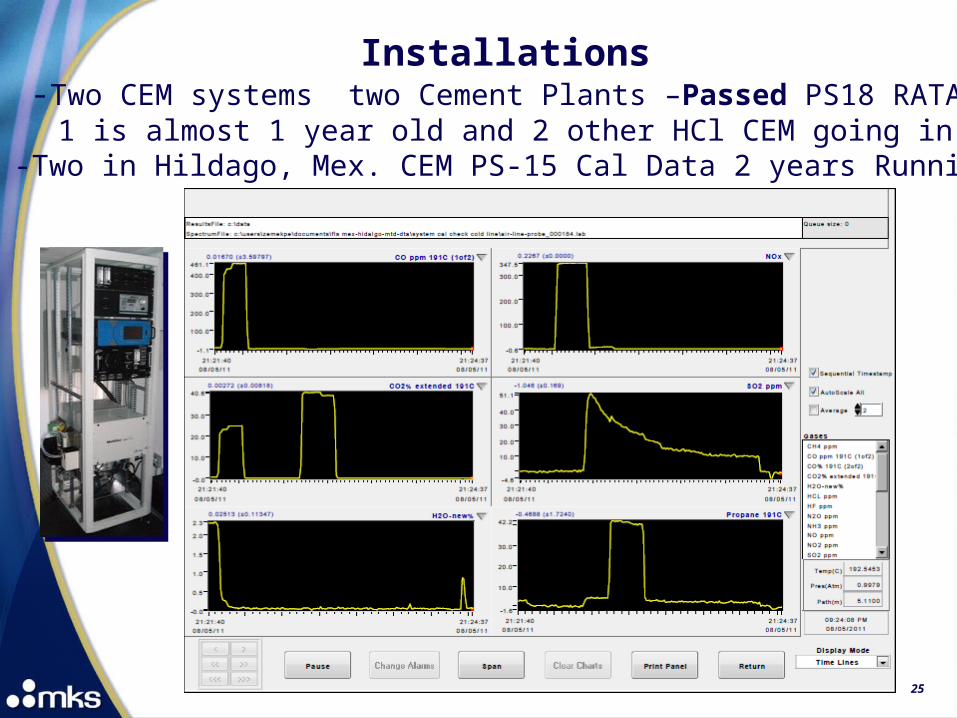
Installations-Two CEM systems two Cement Plants –Passed PS18 RATA
1 is almost 1 year old and 2 other HCl CEM going in-Two in Hildago, Mex. CEM PS-15 Cal Data 2 years Running

Transferrable Hardware & Software
MKS Instruments 26

Detector/Hardware InfluencesHigh Sensitivity System HCl, HF, CH4, H2O, N2O, CH2O
MKS Instruments 27
TE9u CEMLN2-16u MCT (77K)TE-HS CEM
Sensitivity (signal)
<noise
>S/N
IR Band-pass Filters
spectral region

0
20
40
60
80
100
120
140
0
200
400
600
800
1000
1200LN2-16 - HCl
HCl ppm (100) 191C H2O% (40) 191C CH4 (3000) 191C (2of2)
Time
HC
l B
itu
m c
oal
wet
pp
mv
CH
4 ppmv
MKS Instruments 28
EXAMPLE of No Cross Sensitivity
No change in HCl concentrationSpike @ 900 ppm CH4 and 6% H2O

Staged Blowback Filtration 80 psig
MKS Instruments 29
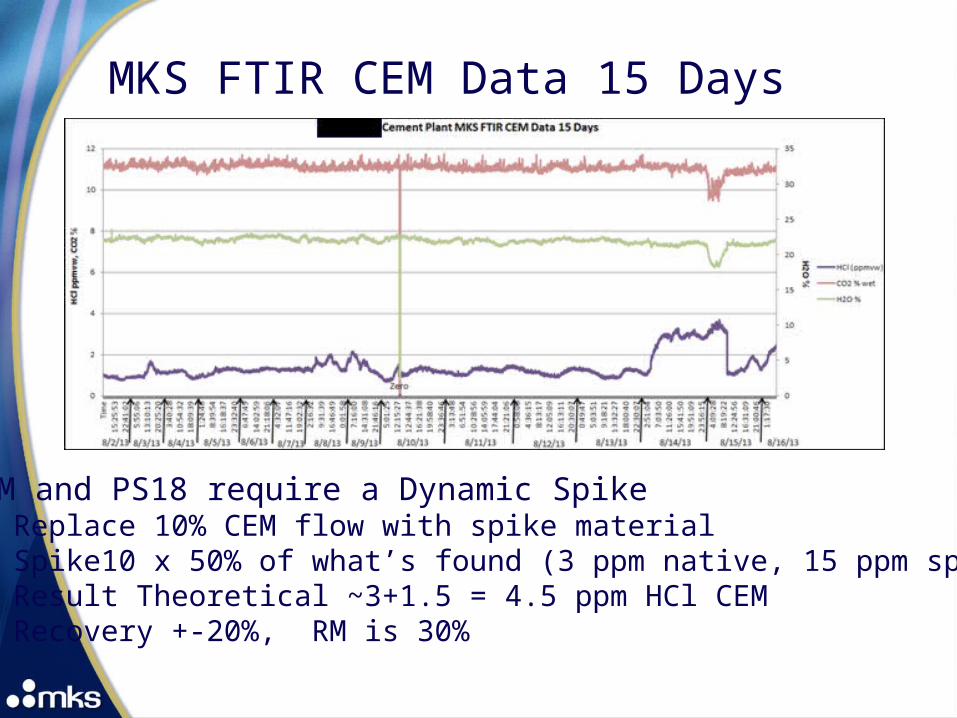
RM and PS18 require a Dynamic Spike• Replace 10% CEM flow with spike material• Spike10 x 50% of what’s found (3 ppm native, 15 ppm spike)• Result Theoretical ~3+1.5 = 4.5 ppm HCl CEM• Recovery +-20%, RM is 30%
MKS FTIR CEM Data 15 Days
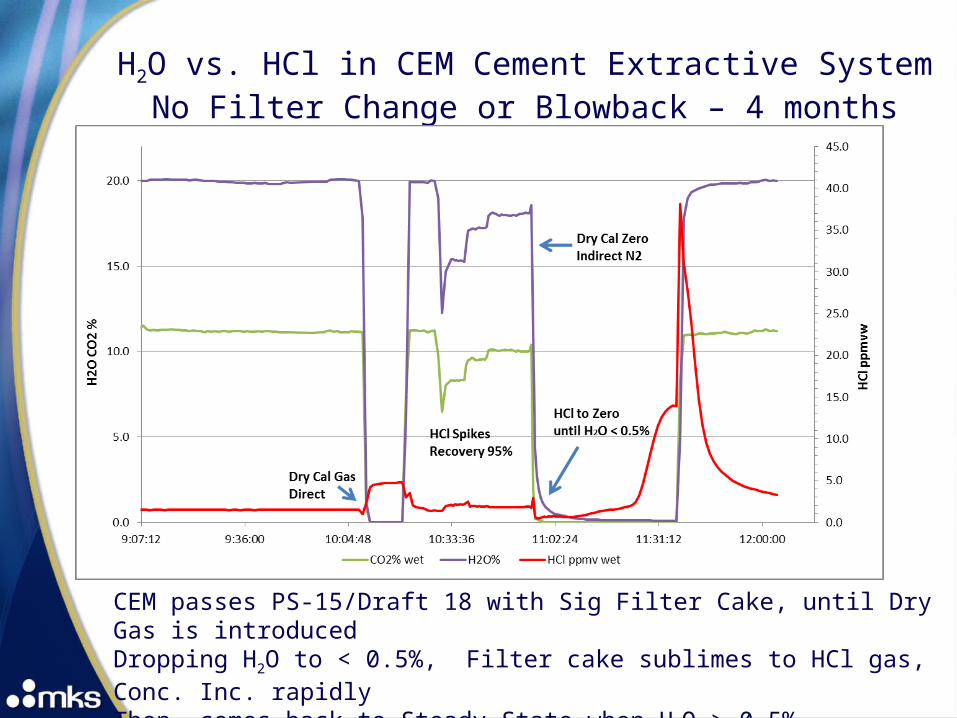
H2O vs. HCl in CEM Cement Extractive SystemNo Filter Change or Blowback – 4 months
CEM passes PS-15/Draft 18 with Sig Filter Cake, until Dry Gas is introduced Dropping H2O to < 0.5%, Filter cake sublimes to HCl gas, Conc. Inc. rapidly Then, comes back to Steady-State when H2O > 0.5%
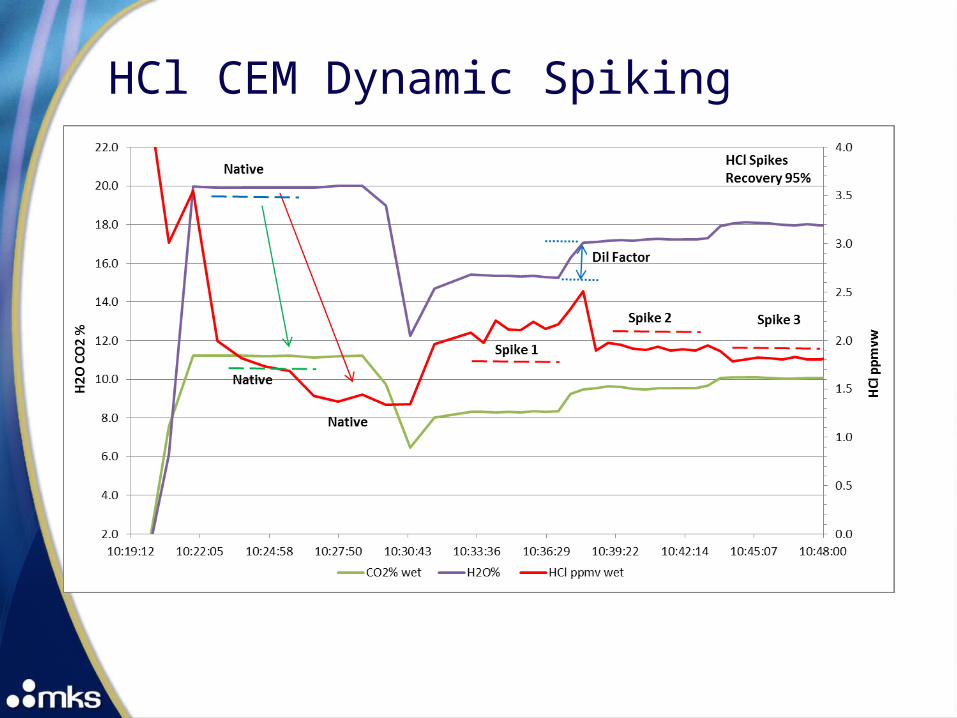
HCl CEM Dynamic Spiking
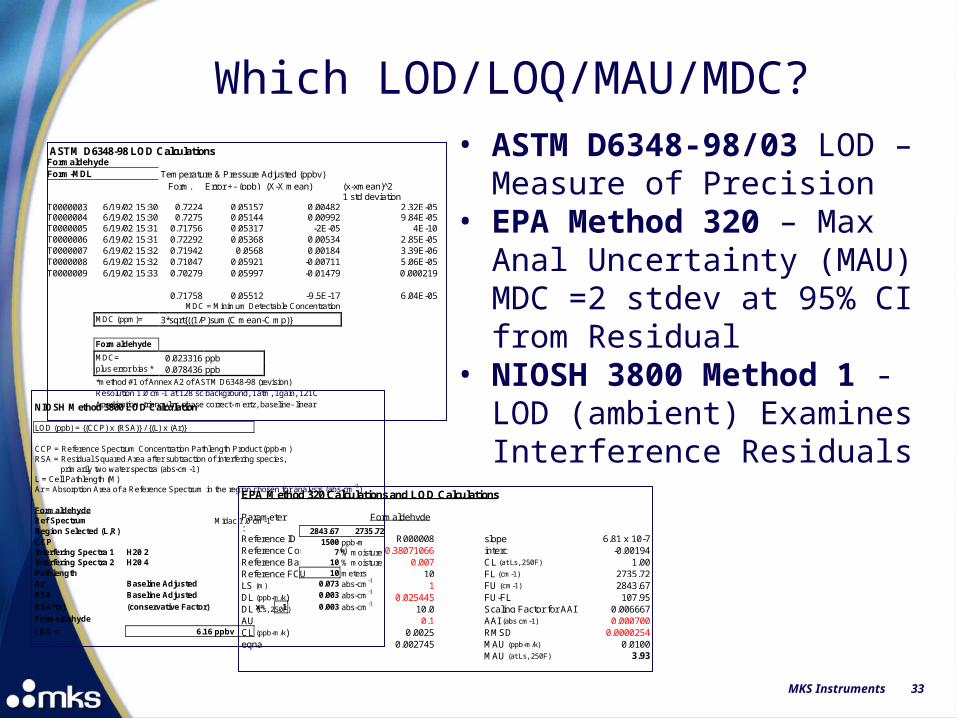
EPA Method 320 Calculations and LOD Calculations
Parameter:
Formaldehyde
Reference ID R000008 slope 6.81 x 10⁻⁷Reference Conc. (ppb-m/k) 0.38071066 interc -0.00194Reference Band Area 0.007 CL (at Ls, 250F) 1.00Reference FCU 10 FL (cm-1) 2735.72LS (m) 1 FU (cm-1) 2843.67DL (ppb-m/k) 0.025445 FU-FL 107.95DL (Ls, 250F) 10.0 Scaling Factor for AAI 0.006667AU 0.1 AAI (abs cm-1) 0.000700CL (ppb-m/k) 0.0025 RMSD 0.0000254eqna 0.002745 MAU (ppb-m/k) 0.0100
MAU (at Ls, 250F) 3.93
Which LOD/LOQ/MAU/MDC?
MKS Instruments 33
• ASTM D6348-98/03 LOD – Measure of Precision
• EPA Method 320 – Max Anal Uncertainty (MAU) MDC =2 stdev at 95% CI from Residual
• NIOSH 3800 Method 1 - LOD (ambient) Examines Interference Residuals
ASTM D6348-98 LOD CalculationsFormaldehydeForm-MDL Temperature & Pressure Adjusted (ppbv)
Form. Error +- (ppb) (X-X mean) (x-xmean)^21 std deviation
T0000003 6/19/02 15:30 0.7224 0.05157 0.00482 2.32E-05T0000004 6/19/02 15:30 0.7275 0.05144 0.00992 9.84E-05T0000005 6/19/02 15:31 0.71756 0.05317 -2E-05 4E-10T0000006 6/19/02 15:31 0.72292 0.05368 0.00534 2.85E-05T0000007 6/19/02 15:32 0.71942 0.0568 0.00184 3.39E-06T0000008 6/19/02 15:32 0.71047 0.05921 -0.00711 5.06E-05T0000009 6/19/02 15:33 0.70279 0.05997 -0.01479 0.000219
0.71758 0.05512 -9.5E-17 6.04E-05MDC = Minimum Detectable Concentration
MDC (ppm)= 3*sqrt{((1/P)sum(C mean-C mp)}
Formaldehyde
MDC= 0.023316 ppbplus error bias * 0.078436 ppb*method #1 of Annex A2 of ASTM D6348-98 (revision)Resolution 1.0 cm-1 at 128 sc background, 1atm, 1gain, 121CApodization- triangular, phase correct- mertz, baseline- linear
NIOSH Method 3800 LOD Calculation
LOD (ppb) = {(CCP) x (RSA)} / {(L) x (Ar)}
CCP = Reference Spectrum Concentration Pathlength Product (ppb-m) RSA = Residual Squared Area after subtraction of interfering species, primarily two water spectra (abs-cm-1) L = Cell Pathlength (M) Ar = Absorption Area of a Reference Spectrum in the region chosen for analysis (abs-cm-1)
Formaldehyde Ref Spectrum Midac 1.0 cm-1 Region Selected (L,R) 2843.67 2735.72 CCP 1500 ppb-m Interfering Spectra 1 H20 2 7 % moisture Interfering Spectra 2 H20 4 10 % moisture Pathlength 10 meters Ar Baseline Adjusted 0.073 abs-cm-1
RSA Baseline Adjusted 0.003 abs-cm-1
RSA*(x) (conservative Factor) x= 1 0.003 abs-cm-1
Formaldehyde
LOD = 6.16 ppbv
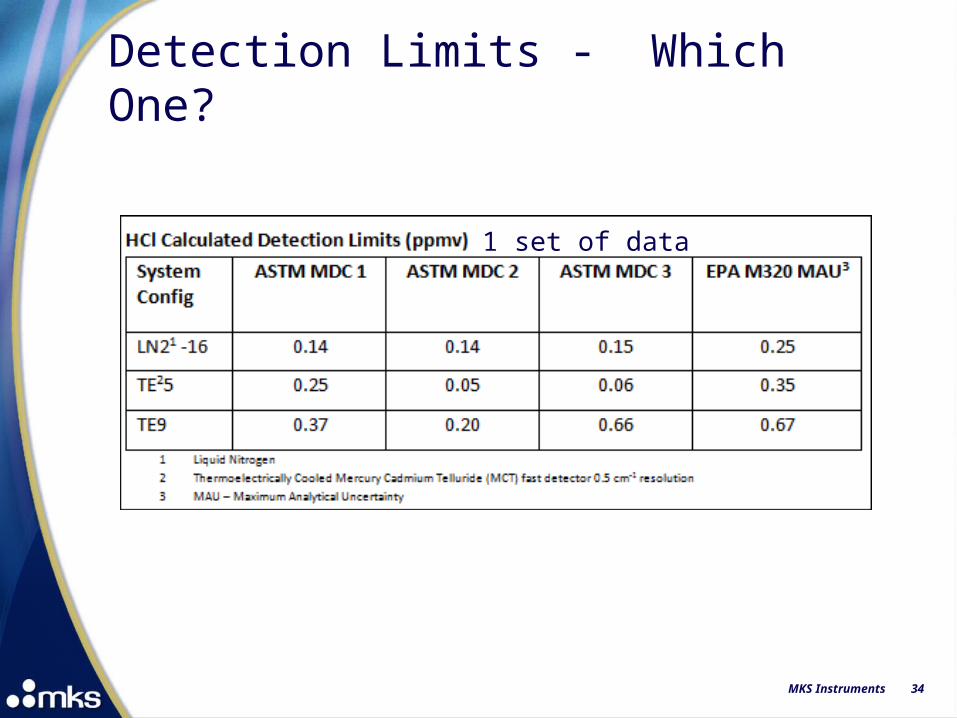
Detection Limits - Which One?
MKS Instruments 34
1 set of data

Compliance SoftwareMDC/LOD/MAU/OFC EPA-M320,ASTM D6348-12
MKS Instruments 35

Manual CheckTE-HS LODSoftware Included
MKS Instruments 36
CH4 12 ppm
HCl 30 ppb
Goodness of Fit-2x sigma
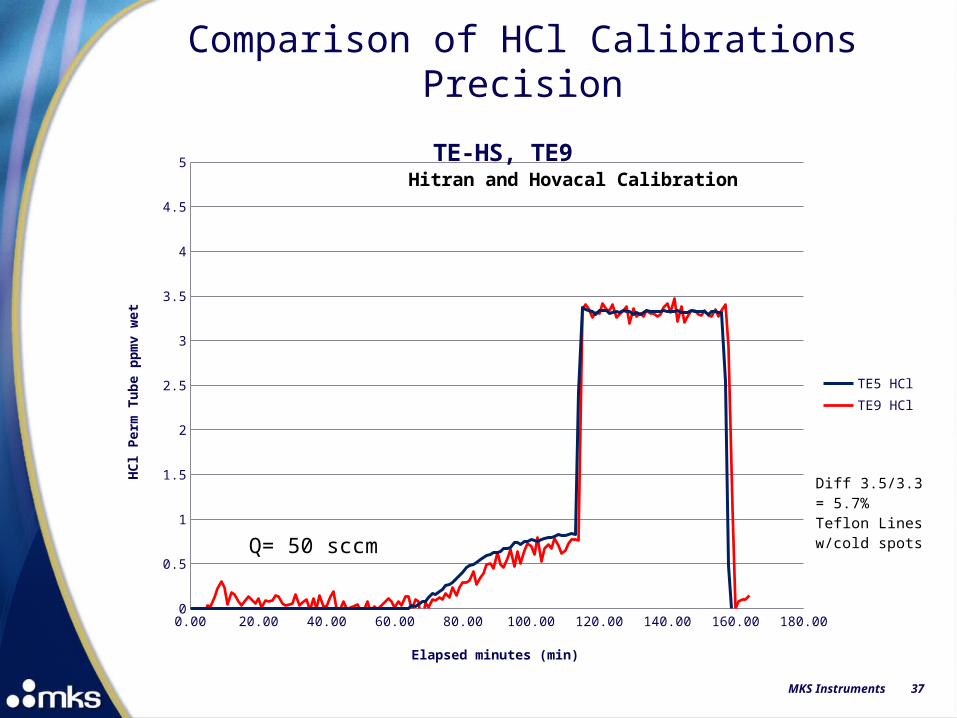
Comparison of HCl CalibrationsPrecision
MKS Instruments 37
0.00 20.00 40.00 60.00 80.00 100.00 120.00 140.00 160.00 180.000
0.5
1
1.5
2
2.5
3
3.5
4
4.5
5TE-HS, TE9
TE5 HCl
TE9 HCl
Elapsed minutes (min)
HC
l P
erm
Tu
be
pp
mv
wet
Diff 3.5/3.3 = 5.7%Teflon Lines w/cold spots
Q= 50 sccm
Hitran and Hovacal Calibration
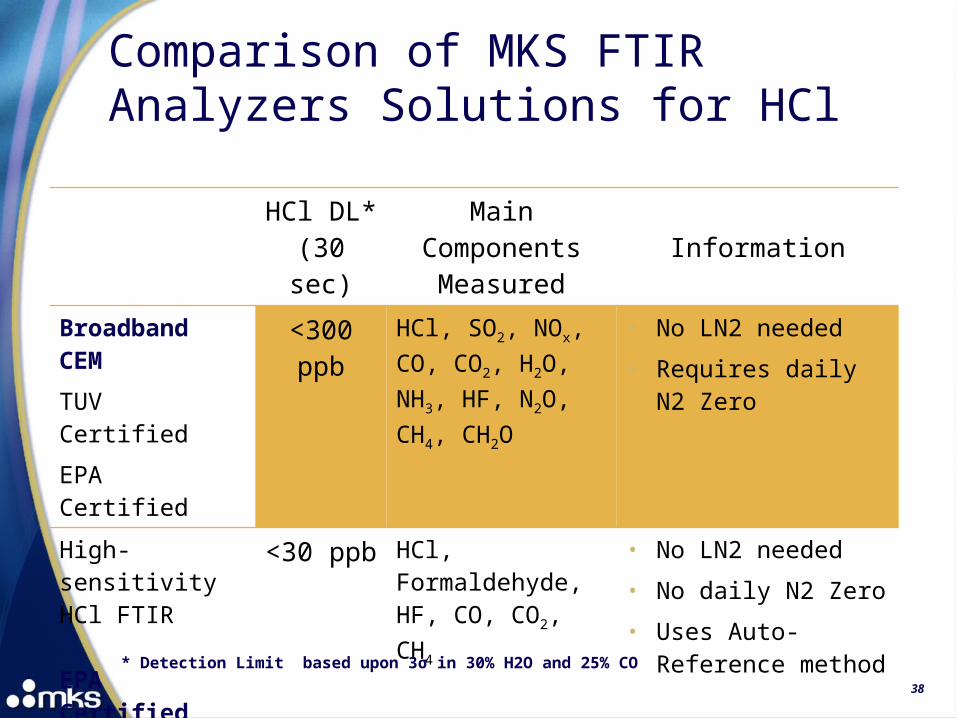
Comparison of MKS FTIR Analyzers Solutions for HCl
HCl DL*(30 sec)
Main Components
MeasuredInformation
Broadband CEM
TUV Certified
EPA Certified
<300 ppb
HCl, SO2, NOx, CO, CO2, H2O, NH3, HF, N2O, CH4, CH2O
• No LN2 needed
• Requires daily N2 Zero
High-sensitivityHCl FTIR
EPA Certified
<30 ppb HCl, Formaldehyde, HF, CO, CO2, CH4
• No LN2 needed
• No daily N2 Zero
• Uses Auto-Reference method
38
* Detection Limit based upon 3σ in 30% H2O and 25% CO