Embed Size (px)
Citation preview
International Journal of Computer Applications (0975 – 8887)
Volume 131 – No.2, December2015
17
UML based Approach for System Reliability Assessment
Bhagat Singh Rajput Department of CSE
Medi-Caps Institute of Technology & Management, Indore, India
Vaishali Chourey Associate Professor, Department of CSE
Medi-Caps Institute of Technology & Management, Indore, India
ABSTRACT
Software Engineering is associated with development of
software products using well defined principles, techniques
and processes. The result of Software Engineering is an
effective and reliable product. The software products have
chances to fail during implementation and design phases. The
design time testing and reliability measurement can enhance
the process of development and their component management
to work more effectively for long time. Software Testing is
evaluation of the software product against system
requirements gathered from users and system specification.
That mainly comprises of validation and verification. The
reliability analysis concerned with analyzing the system and
their functions to get the amount of time when the system and
their components works reliably. In this paper, Reliability
Engineering based case study on software product
development is performed. The concept of Software
Engineering and the component based product development,
use the Unified Modeling Language (UML) diagrams and
create Reliability Block Diagram (RBD). RBDs are used to
evaluate entire software components and their sub
components to find their reliability according to the number of
usages and increasing time factor. Therefore, to analyze the
software system using RBD, UML to RBD conversion is
required. The UML diagram for online shopping is first
explored and then its sub use-case checkout is designed. The
sub-case is then re-organized according to the functionality
that can be similar to component diagram. The component
diagram is used further to convert the software system into the
RBD diagram. The result of RBD analysis defined in terms of
Block failure rate, Block unreliability Vs. Time, Block
Reliability vs. Time, System Reliability vs. Time and the
System Reliability statistics. The finding of the experiments
shows that the system can be improved through the RBD
analysis. Additionally the improvements during the design
phases can refine the productivity and reliability of the
system.
Keywords
Software Engineering, Reliability Engineering, System
Testing, UML, RBD, Blocksim, Case Study.
1. INTRODUCTION Software Engineering comprises all activities, which help the
conversion of requirement into implementation via design [1].
In this proposed work the importance of reliability estimations
during design phase is investigated where a software
component is uniformly distributed and scheduled to perform
an assigned task reliably [2]. The primary benefits of software
analysis are to understand the application actually working
and the detection of errors earlier during the development
process [3] [4].The iterative and incremental development
processes allows us to a degree of parallelism between
development and testing [5] [6].That analysis further helps in
accelerating the development process, improving quality and
tuning for the maximum performance of the software. The
functional and non-functional requirements of software are:
Functional Requirements: The functional
requirements specify system’s behavior or function.
Some typical functional requirements include
authentication, authorization levels, legal or
regulatory requirements, administrative functions,
business rules and external interfaces.
Non-functional Requirements: The non-functional
requirements specify the system's quality
characteristics. Some typical non-functional
requirements are performance, scalability, capacity,
availability, reliability, security, recoverability,
maintainability and usability.
Reliability is an important factor of software quality. There
exist many reliability models to predict the reliability based
on software testing activities. There are many software
reliability growth models (SRGMs) developed to predict the
reliability but they have many unrealistic assumptions and
they are also environment dependent [7].In this paper an
ensemble technique called hybrid ARIMA (ARIMA+NN) is
used for reliability prediction. In this paper computational
intelligence techniques used for prediction of software
reliability are discussed [8]. The paper concludes that
Computational Intelligence approaches also gives better
results in prediction. Reliability of software depends not only
on intrinsic factors such as code properties, but also on
extrinsic factors, that is the properties of the environment it
operates in.In this paper author studied on 200,000 users, they
found that the reliability of system is depend on the users, the
more a system is used, the more likely it is to have negative
impact on his components [9]. As a consequence, software
testers must be careful to design a system according to his
load.
2. SYSTEM DESIGN USING UML AND
RBD This section provides the detailed study on UML (Unified
Modelling Language) and RBD (Reliability Block Diagram).
UML is used to model software systems and also used to
model non software systems similar to procedure stream in an
industrialized component etc. [10]. RBD is used to show the
functional relationship between the items, and indicates which
ones must operate successfully for the system to accomplish
its intended function [11].
2.1 Unified Modeling Language (UML) UML is a graphical language used to make software designs.
It allows people to develop several different types of visual
diagrams that represent various aspects of the system. So it is
clear that UML is used to create a system design which
consist components, activity, data flow, functioning and it’s
not a development language [12]. UML has many types of
diagrams which are divided into two main categories-
International Journal of Computer Applications (0975 – 8887)
Volume 131 – No.2, December2015
18
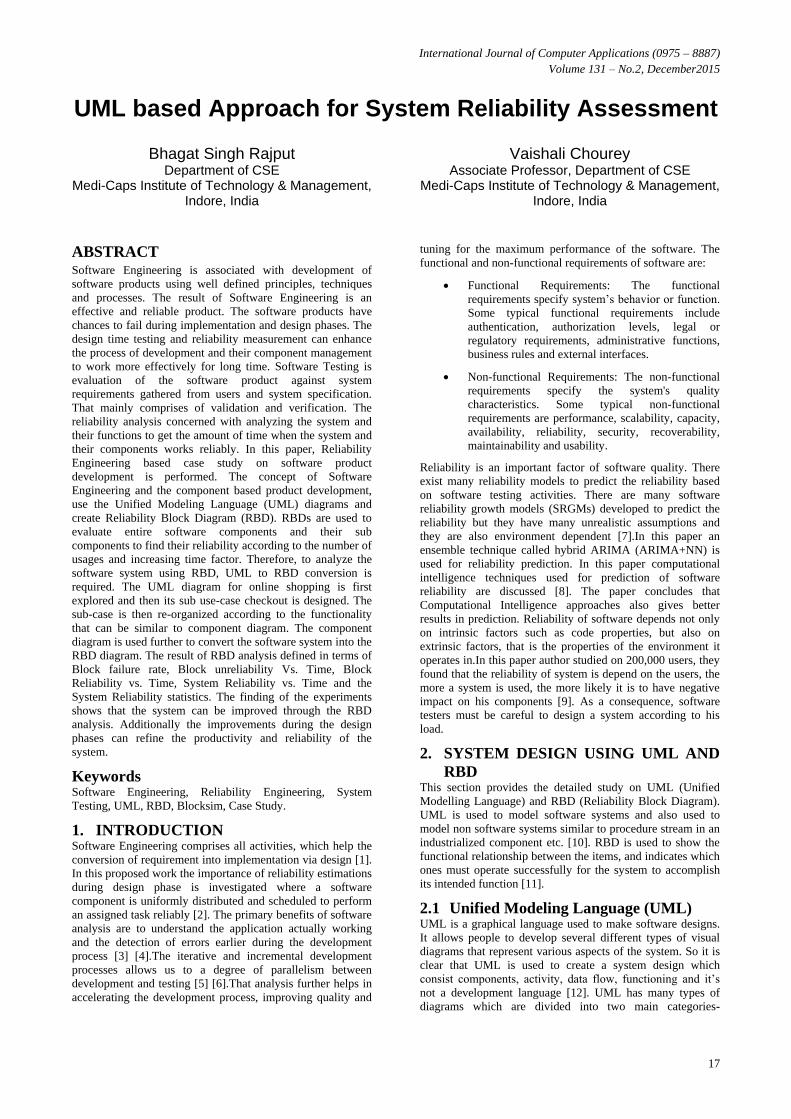
Structure Diagram and Behaviour Diagram is shown in Figure
2.
Fig 1: Unified Modelling Language Hierarchical Diagram
2.2 Use Case Diagram To model a system the main aspect is to capture its dynamic
behavior. Dynamic behavior means the behavior of the system
at the time of processing. So only static behavior is not
enough to model a system somewhat dynamic behavior is also
important than static behavior [13]. The interior and exterior
representatives are known as actors. Major elements which
are used to create use case diagram are actor, use case and
relationships. A single use case diagram captures a particular
functionality of a system. Actor’s shows the behavior of
people and relationship shows the type of connection between
the use cases in a system. Generally two type of relationships
are used include and extend.
2.3 Component Diagram Component diagram is a different type of diagram in UML. It
does not define the functionality of the system but it defines
the components used to make those functionalities. The
purpose of the component diagram is to visualize the
components of a system. A single component diagram cannot
represent the whole system but a collection of diagrams are
used to represent the entire system. In UML component
diagrams are used to get an idea of implementation [14]. It is
very essential from implementation point of view.
2.4 Reliability Block Diagram (RBD) Before any reliability analysis of a system there must be
knowledge of the operational relationships of the various
elements comprising that system. The reliability of a system
cannot be improved or even evaluated unless there is an
understanding of functioning of elements and the system
operations affected by functions. The accurate representation of
these relationships is an integral part of this understanding and
is particularly important for meaningful predictions,
apportionments and assessments. A Reliability Block Diagram
(RBD) provides a method of representing this information in a
form, which is easy to comprehend because it is simple and has
visual impact. Generally system reliability prediction is done by
the help of components that make up the whole system or
product.
2.5 Component Configuration To construct a RBD, the reliability-wise configuration of the
components essential to be determined. Thus, the analysis
method used for computing the reliability of a system is also
depend on the reliability-wise configuration of the components.
That components can be as simply arranged in series, parallel or
combination of both configurations.
Series Configuration: In a series arrangement, a
failure of any component results in the failure of the
whole system. In most cases, when considering
complete systems at their basic subsystem level, it is
found that these are arranged reliability-wise in a
series configuration. These are reliability-wise in
series and a failure of any of these subsystems will
cause a system failure. In a series configuration, the
component with the least reliability has the biggest
effect on the system's reliability.
Parallel Configuration: Redundancy is a very
important characteristic of system design and
reliability in that adding redundancy is one of several
methods of improvising system reliability. On the
other hand, the component with the highest reliability
in a parallel configuration has the biggest effect on
the system's reliability, because the most reliable
component is the one that is most likely failed last.
This property of parallel configuration is very
important in increasing the performance and
reliability of systems.
2.6 Building Reliability Block Diagram
Using BlockSim It provide design space for RBDs to calculate performance and
reliability [15]. Simple drag-and-drop functionality allows you
to drag blocks from a Template into a Diagram Sheet or Fault
Tree Sheet and configure those blocks to create simple or
complex Reliability Block Diagrams (RBDs) or fault tree
diagrams. With the help of BlockSim, the system is configured
in series, parallel and k-out-of-n reliability-wise configurations,
as well as complex combinations. The BlockSim is also used to
create standby and load sharing redundancy configurations.
BlockSim also allows us to customize the size and shape of
component blocks, connecting lines, diagram background,
graphics and text.
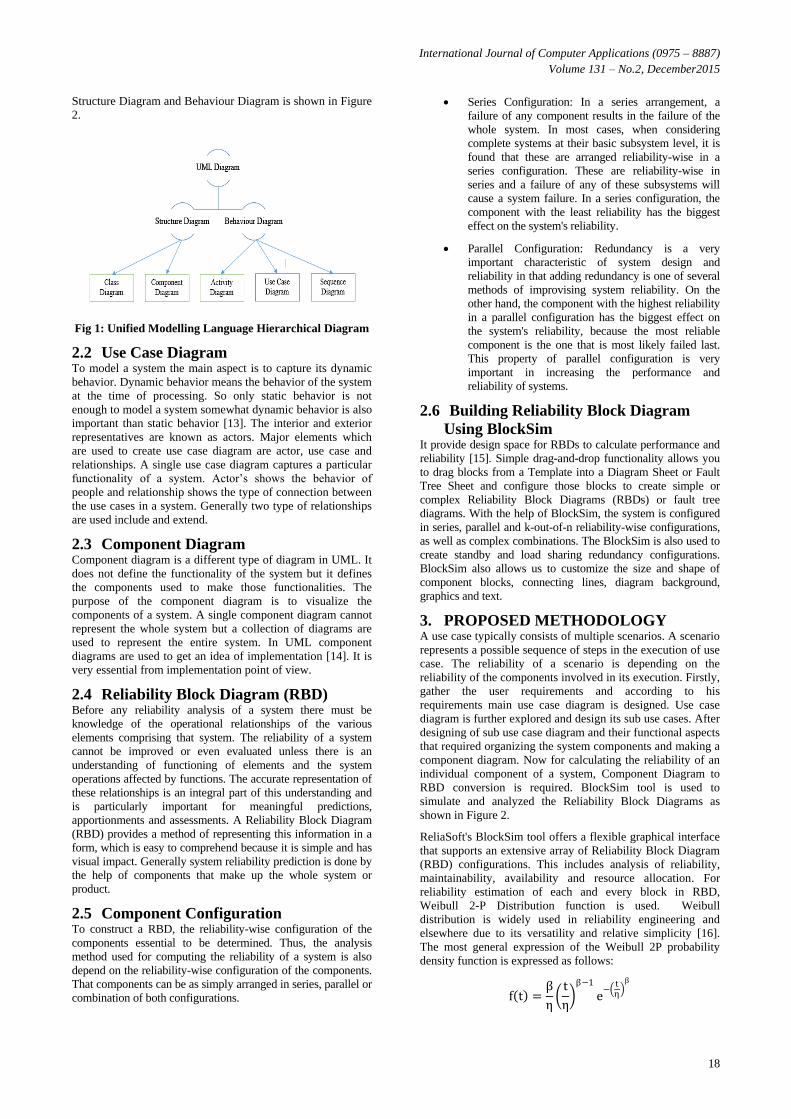
3. PROPOSED METHODOLOGY A use case typically consists of multiple scenarios. A scenario
represents a possible sequence of steps in the execution of use
case. The reliability of a scenario is depending on the
reliability of the components involved in its execution. Firstly,
gather the user requirements and according to his
requirements main use case diagram is designed. Use case
diagram is further explored and design its sub use cases. After
designing of sub use case diagram and their functional aspects
that required organizing the system components and making a
component diagram. Now for calculating the reliability of an
individual component of a system, Component Diagram to
RBD conversion is required. BlockSim tool is used to
simulate and analyzed the Reliability Block Diagrams as
shown in Figure 2.
ReliaSoft's BlockSim tool offers a flexible graphical interface
that supports an extensive array of Reliability Block Diagram
(RBD) configurations. This includes analysis of reliability,
maintainability, availability and resource allocation. For
reliability estimation of each and every block in RBD,
Weibull 2-P Distribution function is used. Weibull
distribution is widely used in reliability engineering and
elsewhere due to its versatility and relative simplicity [16].
The most general expression of the Weibull 2P probability
density function is expressed as follows:
f t =β
η t
η β−1
e−
tη
β
International Journal of Computer Applications (0975 – 8887)
Volume 131 – No.2, December2015
19
Where:
f t ≥ 0, t ≥ 0
β > 0
η > 0
And:
η = Scale parameter, or characteristic life.
β = Shape parameter (or slope).
The System reliability is nearly equal to the target reliability
that means system design is perfect and ready for
implementation phase otherwise on the basis of reliability
importance select the components which are failed very
earlier. The system reliability is increased with the help of
parallel configuration. In this manner the proposed
methodology provide system reliability early in the product
development stages from UML diagrams.
4. CASE STUDY In this section, the proposed system demonstrates the usage of
approach to predict reliability of a system through a case
study.
4.1 System Description The reliability is a very essential characteristic during
application or product development. This ensures that the
developed product how long effectively or reliably work
without any interruption. In order to understand the reliability
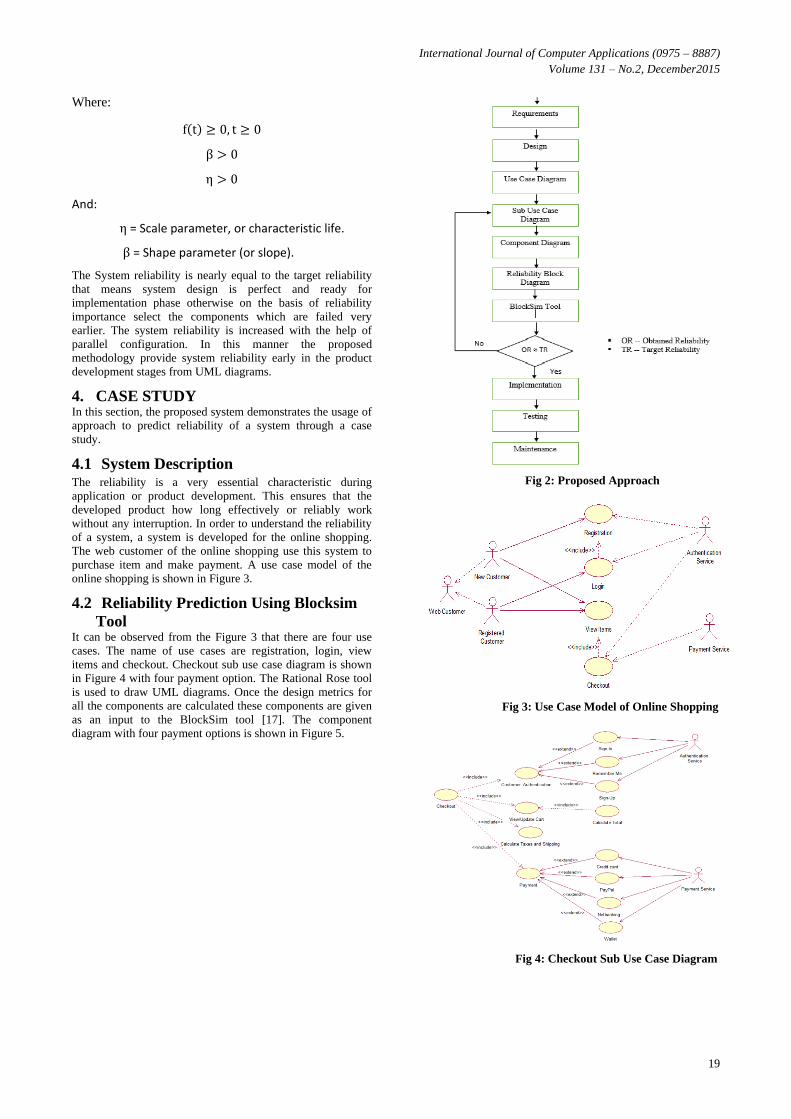
of a system, a system is developed for the online shopping.
The web customer of the online shopping use this system to
purchase item and make payment. A use case model of the
online shopping is shown in Figure 3.
4.2 Reliability Prediction Using Blocksim
Tool It can be observed from the Figure 3 that there are four use
cases. The name of use cases are registration, login, view
items and checkout. Checkout sub use case diagram is shown
in Figure 4 with four payment option. The Rational Rose tool
is used to draw UML diagrams. Once the design metrics for
all the components are calculated these components are given
as an input to the BlockSim tool [17]. The component
diagram with four payment options is shown in Figure 5.
Fig 2: Proposed Approach
Fig 3: Use Case Model of Online Shopping
Fig 4: Checkout Sub Use Case Diagram
International Journal of Computer Applications (0975 – 8887)
Volume 131 – No.2, December2015
20
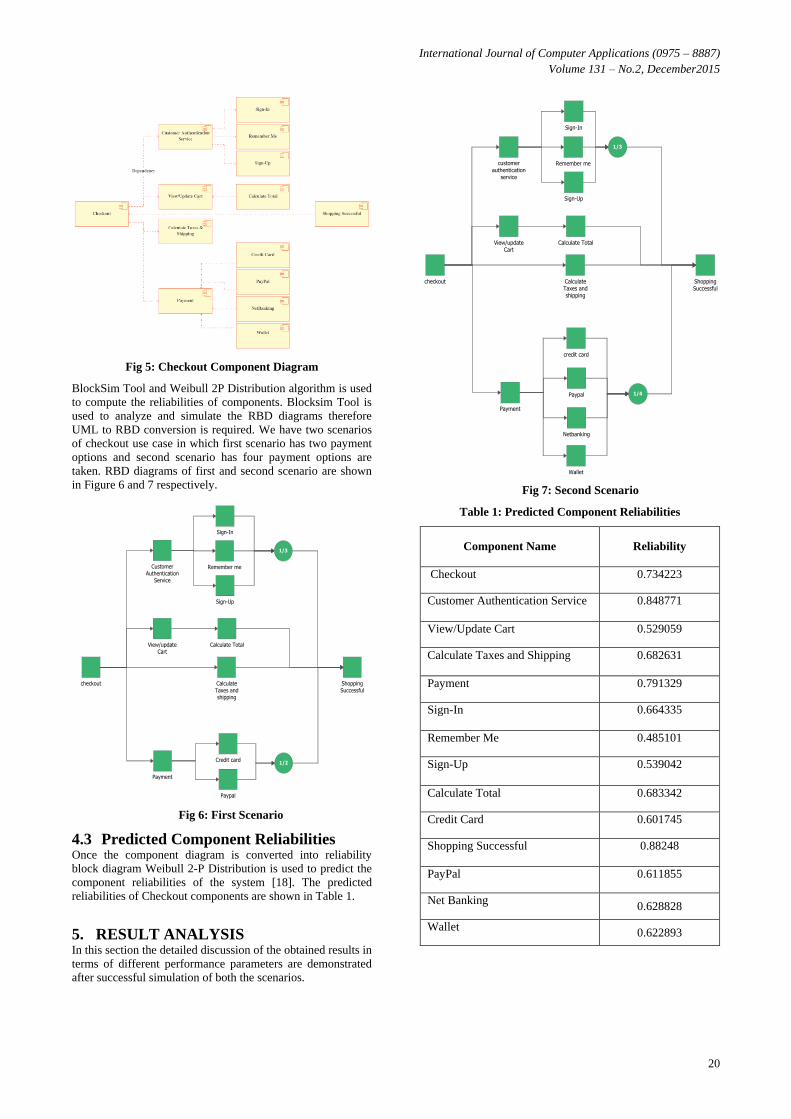
Fig 5: Checkout Component Diagram
BlockSim Tool and Weibull 2P Distribution algorithm is used
to compute the reliabilities of components. Blocksim Tool is
used to analyze and simulate the RBD diagrams therefore
UML to RBD conversion is required. We have two scenarios
of checkout use case in which first scenario has two payment
options and second scenario has four payment options are
taken. RBD diagrams of first and second scenario are shown
in Figure 6 and 7 respectively.
Fig 6: First Scenario
4.3 Predicted Component Reliabilities Once the component diagram is converted into reliability
block diagram Weibull 2-P Distribution is used to predict the
component reliabilities of the system [18]. The predicted
reliabilities of Checkout components are shown in Table 1.
5. RESULT ANALYSIS In this section the detailed discussion of the obtained results in
terms of different performance parameters are demonstrated
after successful simulation of both the scenarios.
Fig 7: Second Scenario
Table 1: Predicted Component Reliabilities
Component Name Reliability
Checkout 0.734223
Customer Authentication Service 0.848771
View/Update Cart 0.529059
Calculate Taxes and Shipping 0.682631
Payment 0.791329
Sign-In 0.664335
Remember Me 0.485101
Sign-Up 0.539042
Calculate Total 0.683342
Credit Card 0.601745
Shopping Successful 0.88248
PayPal 0.611855
Net Banking 0.628828
Wallet 0.622893
International Journal of Computer Applications (0975 – 8887)
Volume 131 – No.2, December2015
21
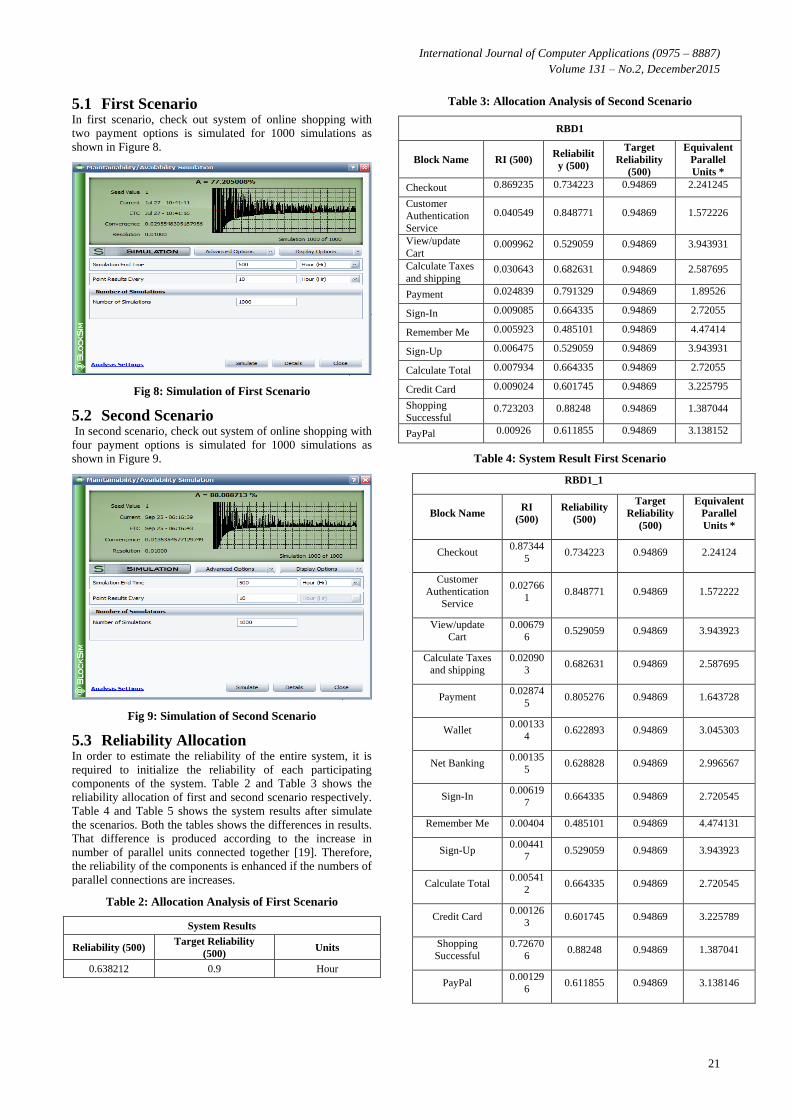
5.1 First Scenario In first scenario, check out system of online shopping with
two payment options is simulated for 1000 simulations as
shown in Figure 8.
Fig 8: Simulation of First Scenario
5.2 Second Scenario In second scenario, check out system of online shopping with
four payment options is simulated for 1000 simulations as
shown in Figure 9.
Fig 9: Simulation of Second Scenario
5.3 Reliability Allocation In order to estimate the reliability of the entire system, it is
required to initialize the reliability of each participating
components of the system. Table 2 and Table 3 shows the
reliability allocation of first and second scenario respectively.
Table 4 and Table 5 shows the system results after simulate
the scenarios. Both the tables shows the differences in results.
That difference is produced according to the increase in
number of parallel units connected together [19]. Therefore,
the reliability of the components is enhanced if the numbers of
parallel connections are increases.
Table 2: Allocation Analysis of First Scenario
System Results
Reliability (500) Target Reliability
(500) Units
0.638212 0.9 Hour
Table 3: Allocation Analysis of Second Scenario
RBD1
Block Name RI (500) Reliabilit
y (500)
Target
Reliability
(500)
Equivalent
Parallel
Units *
Checkout 0.869235 0.734223 0.94869 2.241245
Customer
Authentication
Service
0.040549 0.848771 0.94869 1.572226
View/update
Cart 0.009962 0.529059 0.94869 3.943931
Calculate Taxes
and shipping 0.030643 0.682631 0.94869 2.587695
Payment 0.024839 0.791329 0.94869 1.89526
Sign-In 0.009085 0.664335 0.94869 2.72055
Remember Me 0.005923 0.485101 0.94869 4.47414
Sign-Up 0.006475 0.529059 0.94869 3.943931
Calculate Total 0.007934 0.664335 0.94869 2.72055
Credit Card 0.009024 0.601745 0.94869 3.225795
Shopping
Successful 0.723203 0.88248 0.94869 1.387044
PayPal 0.00926 0.611855 0.94869 3.138152
Table 4: System Result First Scenario
RBD1_1
Block Name RI
(500)
Reliability
(500)
Target
Reliability
(500)
Equivalent
Parallel
Units *
Checkout 0.87344
5 0.734223 0.94869 2.24124
Customer
Authentication
Service
0.02766
1 0.848771 0.94869 1.572222
View/update
Cart
0.00679
6 0.529059 0.94869 3.943923
Calculate Taxes
and shipping
0.02090
3 0.682631 0.94869 2.587695
Payment 0.02874
5 0.805276 0.94869 1.643728
Wallet 0.00133
4 0.622893 0.94869 3.045303
Net Banking 0.00135
5 0.628828 0.94869 2.996567
Sign-In 0.00619
7 0.664335 0.94869 2.720545
Remember Me 0.00404 0.485101 0.94869 4.474131
Sign-Up 0.00441
7 0.529059 0.94869 3.943923
Calculate Total 0.00541
2 0.664335 0.94869 2.720545
Credit Card 0.00126
3 0.601745 0.94869 3.225789
Shopping
Successful
0.72670
6 0.88248 0.94869 1.387041
PayPal 0.00129
6 0.611855 0.94869 3.138146
International Journal of Computer Applications (0975 – 8887)
Volume 131 – No.2, December2015
22
Table 5: System Result Second Scenario
System Results
Reliability
(500)
Target Reliability
(500) Units
0.641303 0.9 Hour
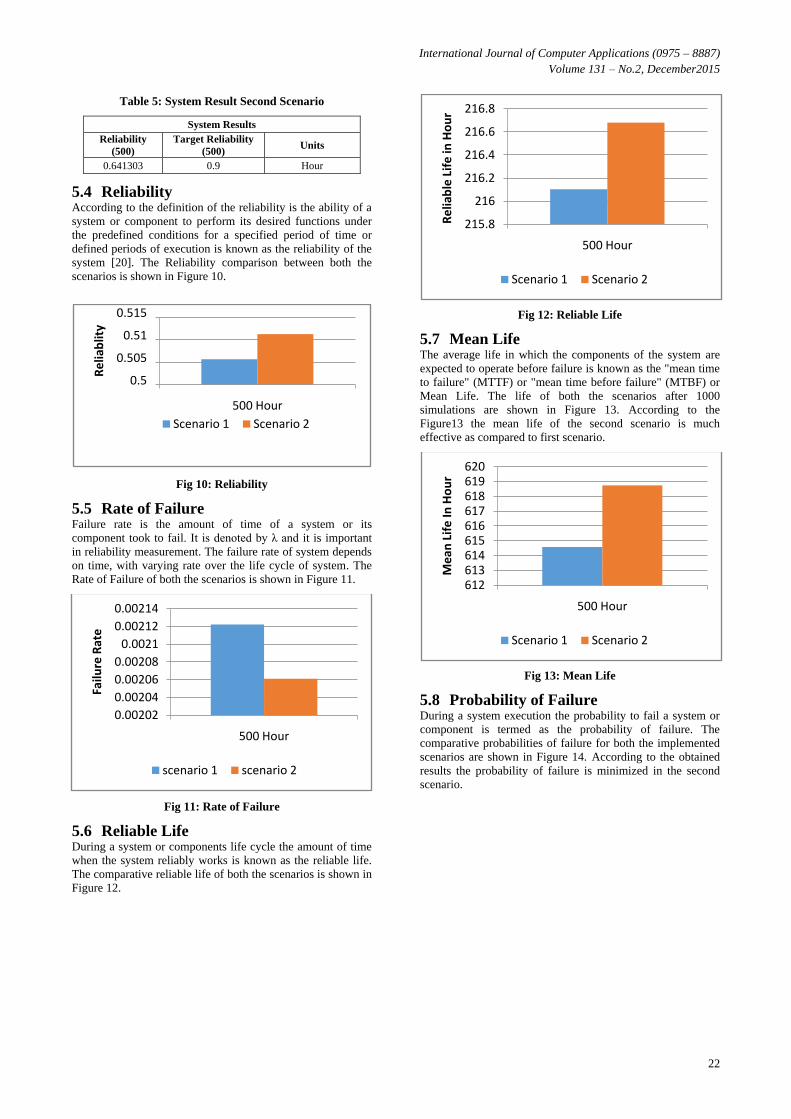
5.4 Reliability According to the definition of the reliability is the ability of a
system or component to perform its desired functions under
the predefined conditions for a specified period of time or
defined periods of execution is known as the reliability of the
system [20]. The Reliability comparison between both the
scenarios is shown in Figure 10.
Fig 10: Reliability
5.5 Rate of Failure Failure rate is the amount of time of a system or its
component took to fail. It is denoted by λ and it is important
in reliability measurement. The failure rate of system depends
on time, with varying rate over the life cycle of system. The
Rate of Failure of both the scenarios is shown in Figure 11.
Fig 11: Rate of Failure
5.6 Reliable Life During a system or components life cycle the amount of time
when the system reliably works is known as the reliable life.
The comparative reliable life of both the scenarios is shown in
Figure 12.
Fig 12: Reliable Life
5.7 Mean Life The average life in which the components of the system are
expected to operate before failure is known as the "mean time
to failure" (MTTF) or "mean time before failure" (MTBF) or
Mean Life. The life of both the scenarios after 1000
simulations are shown in Figure 13. According to the
Figure13 the mean life of the second scenario is much
effective as compared to first scenario.
Fig 13: Mean Life
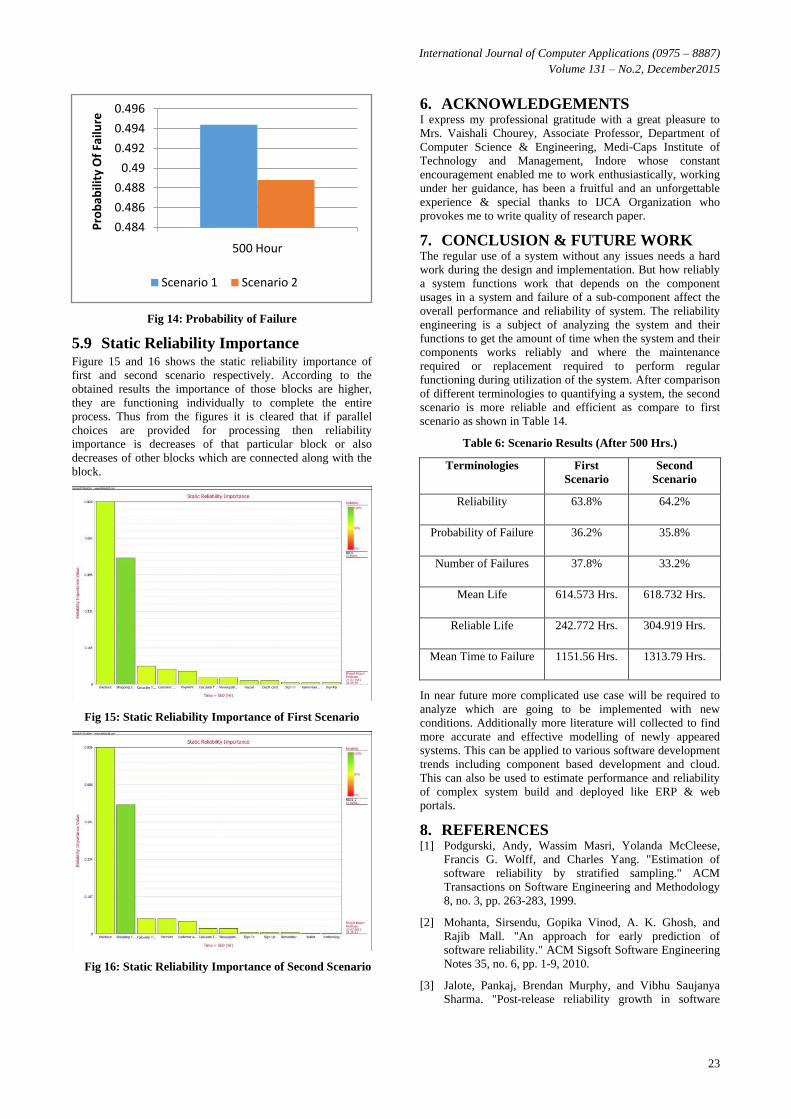
5.8 Probability of Failure During a system execution the probability to fail a system or
component is termed as the probability of failure. The
comparative probabilities of failure for both the implemented
scenarios are shown in Figure 14. According to the obtained
results the probability of failure is minimized in the second
scenario.
0.5
0.505
0.51
0.515
500 Hour
Re
liab
lity
Scenario 1 Scenario 2
0.00202
0.00204
0.00206
0.00208
0.0021
0.00212
0.00214
500 Hour
Failu
re R
ate
scenario 1 scenario 2
215.8
216
216.2
216.4
216.6
216.8
500 Hour
Re
liab
le L
ife
in H
ou
r
Scenario 1 Scenario 2
612613614615616617618619620
500 Hour
Me
an L
ife
In H
ou
r
Scenario 1 Scenario 2
International Journal of Computer Applications (0975 – 8887)
Volume 131 – No.2, December2015
23
Fig 14: Probability of Failure
5.9 Static Reliability Importance Figure 15 and 16 shows the static reliability importance of
first and second scenario respectively. According to the
obtained results the importance of those blocks are higher,
they are functioning individually to complete the entire
process. Thus from the figures it is cleared that if parallel
choices are provided for processing then reliability
importance is decreases of that particular block or also
decreases of other blocks which are connected along with the
block.
Fig 15: Static Reliability Importance of First Scenario
Fig 16: Static Reliability Importance of Second Scenario
6. ACKNOWLEDGEMENTS I express my professional gratitude with a great pleasure to
Mrs. Vaishali Chourey, Associate Professor, Department of
Computer Science & Engineering, Medi-Caps Institute of
Technology and Management, Indore whose constant
encouragement enabled me to work enthusiastically, working
under her guidance, has been a fruitful and an unforgettable
experience & special thanks to IJCA Organization who
provokes me to write quality of research paper.
7. CONCLUSION & FUTURE WORK The regular use of a system without any issues needs a hard
work during the design and implementation. But how reliably
a system functions work that depends on the component
usages in a system and failure of a sub-component affect the
overall performance and reliability of system. The reliability
engineering is a subject of analyzing the system and their
functions to get the amount of time when the system and their
components works reliably and where the maintenance
required or replacement required to perform regular
functioning during utilization of the system. After comparison
of different terminologies to quantifying a system, the second
scenario is more reliable and efficient as compare to first
scenario as shown in Table 14.
Table 6: Scenario Results (After 500 Hrs.)
Terminologies First
Scenario
Second
Scenario
Reliability 63.8% 64.2%
Probability of Failure 36.2% 35.8%
Number of Failures 37.8% 33.2%
Mean Life 614.573 Hrs. 618.732 Hrs.
Reliable Life 242.772 Hrs. 304.919 Hrs.
Mean Time to Failure 1151.56 Hrs. 1313.79 Hrs.
In near future more complicated use case will be required to
analyze which are going to be implemented with new
conditions. Additionally more literature will collected to find
more accurate and effective modelling of newly appeared
systems. This can be applied to various software development
trends including component based development and cloud.
This can also be used to estimate performance and reliability
of complex system build and deployed like ERP & web
portals.
8. REFERENCES [1] Podgurski, Andy, Wassim Masri, Yolanda McCleese,
Francis G. Wolff, and Charles Yang. "Estimation of
software reliability by stratified sampling." ACM
Transactions on Software Engineering and Methodology
8, no. 3, pp. 263-283, 1999.
[2] Mohanta, Sirsendu, Gopika Vinod, A. K. Ghosh, and
Rajib Mall. "An approach for early prediction of
software reliability." ACM Sigsoft Software Engineering
Notes 35, no. 6, pp. 1-9, 2010.
[3] Jalote, Pankaj, Brendan Murphy, and Vibhu Saujanya
Sharma. "Post-release reliability growth in software
0.484
0.486
0.488
0.49
0.492
0.494
0.496
500 Hour
Pro
bab
ility
Of
Failu
re
Scenario 1 Scenario 2
International Journal of Computer Applications (0975 – 8887)
Volume 131 – No.2, December2015
24
products." ACM Transactions on Software Engineering
and Methodology 17, no. 4, pp. 17, 2008.
[4] Peng, Rui, Y. F. Li, W. J. Zhang, and Q. P. Hu. "Testing
effort dependent software reliability model for imperfect
debugging process considering both detection and
correction." Reliability Engineering & System Safety
126, pp. 37-43, 2014.
[5] Dimov, Aleksandar, Senthil Kumar Chandran, and
Sasikumar Punnekkat. "How do we collect data for
software reliability estimation?" In Proceedings of the
11th International Conference on Computer Systems and
Technologies and Workshop for PhD Students in
Computing on International Conference on Computer
Systems and Technologies, pp. 155-160. ACM, 2010.
[6] Fujii, Toshiya, Tadashi Dohi, and Takaji Fujiwara.
"Towards quantitative software reliability assessment in
incremental development processes." In Proceedings of
the 33rd International Conference on Software
Engineering, pp. 41-50. ACM, 2011.
[7] Pati, Jayadeep, and K. K. Shukla. "A Hybrid Technique
for Software Reliability Prediction." In Proceedings of
the 8th India Software Engineering Conference, pp. 139-
146. ACM, 2015.
[8] Bhuyan, Manmath Kumar, Durga Prasad Mohapatra, and
Srinivas Sethi. "A survey of computational intelligence
approaches for software reliability prediction." ACM
Sigsoft Software Engineering Notes 39, no. 2, pp. 1-10,
2014.
[9] Bird, Christian, Venkatesh-Prasad Ranganath, Thomas
Zimmermann, Nachiappan Nagappan, and Andreas
Zeller. "Extrinsic influence factors in software reliability:
A study of 200,000 windows machines." In Companion
Proceedings of the 36th International Conference on
Software Engineering, pp. 205-214. ACM, 2014.
[10] Liu, Chang, Yuan Liu, Zhanyong Ren, and Haifeng Li.
"Software Reliability Modelling Considering both
Testing Effort and Testing Coverage." In 2015
International Symposium on Computers & Informatics.
Atlantis Press, 2015.
[11] Buhnova, Barbora, Stanislav Chren, and Lucie
Fabriková. "Failure data collection for reliability
prediction models: a survey." In Proceedings of the 10th
international ACM Sigsoft conference on Quality of
software architectures, pp. 83-92. ACM, 2014.
[12] Bernardi, Simona, José Merseguer, and Dorina C. Petriu.
"Dependability modeling and analysis of software
systems specified with UML." ACM Computing Surveys
(CSUR) 45, no. 1, pp. 2, 2012.
[13] Distefano, Salvatore, Antonio Puliafito, and Kishor S.
Trivedi. "Dynamic aspects and behaviors of complex
systems in performance and reliability assessment."
ACM Sigmetrics Performance Evaluation Review 39, no.
4, pp. 71-78, 2012.
[14] Ubal, Rafael, Dana Schaa, Perhaad Mistry, Xiang Gong,
Yash Ukidave, Zhongliang Chen, Gunar Schirner, and
David Kaeli. "Exploring the heterogeneous design space
for both performance and reliability." In Design
Automation Conference, 2014 51st ACM/EDAC/IEEE,
pp. 1-6. IEEE, 2014.
[15] Sagar, B. B., R. K. Saket, and Col Gurmit Singh.
"Exponentiated Weibull distribution approach based
inflection S-shaped software reliability growth model."
Ain Shams Engineering Journal 2015.
[16] Tyagi, Kirti, and Arun Sharma. "Reliability of
component based systems: a critical survey." ACM
Sigsoft Software Engineering Notes 36, no. 6, pp. 1-6,
2011.
[17] Singh, Lalit Kumar, Gopika Vinod, and A. K. Tripathi.
"Impact of change in component reliabilities on system
reliability estimation." ACM Sigsoft Software
Engineering Notes 39, no. 3, pp. 1-6, 2014.
[18] Hu, Hai, Chang-Hai Jiang, Kai-Yuan Cai, W. Eric Wong,
and Aditya P. Mathur. "Enhancing software reliability
estimates using modified adaptive testing." Information
and Software Technology 55, no. 2, pp. 288-300, 2013.
[19] Allen M. Johnson Jr., Miroslaw Malek, “Survey of
Software Tools for Evaluating Reliability, Availability,
and Serviceability”, ACM Computing Surveys, Vol. 20,
no. 4, December 1988.
IJCATM : www.ijcaonline.org


![vOCL: A novel approach for UML constraints modelingceur-ws.org/Vol-2245/ocl_paper_7.pdf · extensions to the UML instance model [5]. Practical implications of this approach include](https://img.pdfslide.net/doc/110x75/5fb48a0e226900740e4fa80d/vocl-a-novel-approach-for-uml-constraints-modelingceur-wsorgvol-2245oclpaper7pdf.jpg)
![Risk Analysis Model Using UML and MADS Modelmodel using UML language. Reference [23] presents a model of railway system using UML in order to study its reliability. In [24], the authors](https://img.pdfslide.net/doc/110x75/5e74df3dc7ab7109223136eb/risk-analysis-model-using-uml-and-mads-model-model-using-uml-language-reference.jpg)