Embed Size (px)
Citation preview

© 2010 National Middle School Association 1
Abstract
Understanding the nexus of theorized Teaching Quality Measures (TQMs) and classroom enactments of learning goals is important. Video and student performance data for a two-year period were examined for two sixth grade mathematics teachers. Due to their importance in contributing to the development of mathematical conceptual understanding, the TQMs coded in the videos were probing for student understanding, encouraging curiosity and questioning, and using accurate representational forms. For each of the TQMs, graphical, time-integrated analyses were constructed and used to aid analysis and presentation of the results of coding. Although these middle school teachers generally remained consistent in their delivery of instruction, they modestly increased their enactments of the three TQMs. By the second year, both teachers demonstrated increases from their initial level of enactments, and when comparing each teacher’s performance to the prior year, their increased
enactments were related to improved student performance based on the learning goal of converting fractions, decimals, and percents.
Introduction
Teacher quality has been found to be the single most important factor related to student achievement (Darling-Hammond, 2000; Rice, 2003). Consequently, it is important to understand the nexus of theorized Teaching Quality Measures (TQMs) and classroom enactments of learning goals (Kelly & Lesh, 2000). Numerous researchers (e.g., Goldhaber & Anthony, 2004; Good & Brophy, 2003; Nye, Konstantopoulos, & Hedges, 2004; Wright, Paul, Horn, & Sanders, 1997) have identified and articulated nearly 100 different potential TQMs. Additionally, an agreement as to which measures best indicate teacher quality and which TQMs researchers and practitioners should use remains unclear. Some of the popular measures researchers commonly use to gauge teacher quality are subject knowledge, pedagogical content knowledge, years of experience, level of
Micki M. Caskey, Ph.D., EditorPortland State UniversityPortland, Oregon
2010 • Volume 34 • Number 4 ISSN 1940-4476
Understanding, Questioning, and Representing Mathematics: What Makes a Difference in Middle School Classrooms?
Mary Margaret Capraro Robert M. Capraro Texas A & M University & Aggie STEM Center College Station, TX
Tamara Carter Oklahoma City Community College
Adam Harbaugh University of North Carolina Charlotte

RMLE Online— Volume 34, No. 4
© 2010 National Middle School Association 2
certification, and degree level (cf. Wayne & Youngs, 2003). Each of these measures, however, is more about who the teacher is rather than what the teacher does in the classroom. The aim of this study was to examine what teachers are actually doing during instructional time and which aspects make a difference in student learning of mathematics.
Applicability and interpretability of TQMs are essential to conceptual development, so TQMs devoid of meaningful content expectations in classroom enactments are meaningless to mathematics education research (Le et al., 2006). The three TQMs used in this study were adapted from the American Association for the Advancement of Science (AAAS) Curriculum Quality Measures of the middle grades mathematics textbook analysis (AAAS, 2006). The measures of probing for student understanding, encouraging curiosity and questioning, and using accurate representational forms were deemed essential for this study due to their importance in contributing to student mathematical conceptual understanding (Goldin & Shteingold, 2001; Hiebert & Carpenter, 1992; National Council of Teachers of Mathematics [NCTM], 2000; Weiss & Pasley, 2004; Wood, Cobb, & Yackel, 2000). Although there are a number of varied ways to measure teacher quality, these TQMs, a sampling from the domain, were chosen because of their ties to reform-based curricula used by the teachers in this study and common to the lessons observed. We examine these three TQMs and discuss in detail below how they were promising indicators of student success.
Theoretical Framework for Teacher Quality Measures
Breaking Ranks in the Middle (NASSP, 2006), Turning Points 2000 (Jackson & Davis, 2000), and the National Forum's Schools to Watch criteria (2007) are consistent in reporting that quality teaching makes a difference in creating successful middle schools (Andrews, Caskey, & Anfara, 2007). Further, classrooms should be places where students and teachers are engaged in active, purposeful learning, characterized by students at the center of the learning process; the curriculum is challenging, exploratory, integrative, and relevant, and classroom discussion is encouraged and supported by educators who incorporate multiple learning and teaching approaches that meet the needs of students (National Middle School Association, 2010).
Probing for Student Understanding as a TQM Although teachers have consistently been observed doing most of the talking in classrooms, improved
levels of classroom discourse can be achieved through effective questioning (Cazden, 2001). One of the most common teacher questioning approaches is the IRE sequence where the teacher initiates the sequence with a question, a student or students respond(s), and then the teacher evaluates the response (Mehan, 1979). Edwards and Mercer (1987) suggested an alternative to this sequence whereby the teacher’s evaluation of the student’s response is replaced with, or added to by, an expansion on the student’s response. The differences between these types of interactional sequences are profound. The former reduces students’ knowledge and understanding to being able to respond to their teacher’s questions (Edwards & Mercer) and reduces student knowledge to bits of information. Conversely, the latter IRE sequence has been shown to help create a learning community in which knowledge is “constructed by and with those involved in the learning activities, by teachers and children alike” (Buzzelli, 1996, p. 525). The IRE sequence and its derivatives have been prominent in many studies involving mathematics classroom discourse (e.g., Buzzelli, 1996; Nardi & Steward, 2003).
Cazden (2001) contended that when teachers persistently used the traditional IRE sequence to guide classroom discussions, they placed themselves in an evaluative, authoritarian position, which discouraged students from taking ownership of mathematics and their development as mathematical authorities and promoted a sense that mathematics was all about finding the right answer. For a teacher to establish classroom communication patterns whereby students share in mathematical authority, he or she must go beyond just asking questions (Carpenter & Lehrer, 1999). Additionally, Hufferd-Ackles, Fuson, and Sherin, (2004) proposed that teachers support a community that goes beyond that supported by the more traditional IRE sequences, whereby teachers and students are co-¬questioners with the purposes of understanding each other’s thinking and expanding the nature of discussions. Besides the way teachers ask questions or encourage student questioning, the types of questions teachers ask are important in helping guide students’ constructions of mathematical understanding. Brophy and Good (1997) suggested that teachers adopt this facilitative role in discussions.
“Asking more open-ended questions … can contribute to the construction of more sophisticated mathematical knowledge by students” (Martino & Maher, 1999, pp. 53–54). Classroom experiences need to lead to the formulation of generalizations, justification of thinking, and the search for insights that open new areas of investigation (Blanton & Kaput, 2000). Classroom discourse tends to lose importance for students if the

RMLE Online— Volume 34, No. 4
© 2010 National Middle School Association 3
teacher’s intention is only to transmit knowledge of mathematics (Arlo & Skovsmose, 1998). In encouraging or discouraging future classroom communication, teachers’ reactions to students’ answers are more vital than the questions themselves (Hamm & Perry, 2002). This TQM of probing for student understanding assesses whether the teacher facilitated engagement with questions or tasks that require students to show, use, apply, and explain their understanding. The types of questions teachers ask is important in developing an environment of inquiry and investigation, and students’ curiosity and questioning is a vital part of that environment.
Encouraging Curiosity and Questioning as a TQM Student curiosity and questioning are closely related and have been found to be associated with student learning in mathematics and other subject areas. Generating and asking effective questions has been shown to be a vital part of student learning (Balzer, Evans, & Blosser, 1973). Thoughtful, higher-order questions have been linked to greater content retention (Davey & McBride, 1986; King, 1989), improvement in problem-solving abilities (Dori & Herscovitz, 1999; King, 1991), higher conceptual achievement (Harper, Etkina, & Lin, 2003) and independent learning (Marbach-Ad & Sokolove, 2000).
Curiosity has been the focus of numerous studies in recent decades (e.g., Day, 1982; Gazzaniga, 2005; Maw & Maw, 1964; Reio, Petrosko, Wiswell, & Thongsukmag, 2006) and has been shown to be a strong predictor of students’ academic success (Kashdan & Roberts, 2004). Curiosity can be “broadly defined as a desire to acquire new knowledge and new sensory experience that motivates exploratory behavior” (Litman & Spielberger, 2003, p. 75). Maw and Maw (1964) suggested that curious students show a desire to learn more about themselves and their environment, are attracted to and explore new and mysterious environmental elements, and persist in these explorations. Teachers can foster student motivation by stimulating curiosity or suspense (National Research Council, 2001a).
A persistent dialogue that elicits questions can extend a student’s search for answers and mathematical understanding (Martinello, 1998). Knuth (2002) suggested mathematics instruction laden with problem posing to encourage, develop, and foster curiosity in students can help them form productive mathematical dispositions that can contribute to their future success in mathematics. Teachers can encourage curiosity and questioning by (a) providing opportunities for students to express their curiosity or creativity, defined as seeking justifiable alternative solution methods to problems; (b) providing occasions for students to ask questions
and guiding their search for answers (Martinello, 1998); (c) modeling the types of questions that students should ask (Johnson, Gutkin, & Plake, 1991; Marsh, 1999; Martinello, 1998); and (d) respecting and valuing students’ ideas (Empson, 2003). Each of these facets may potentially show promise as an indicator of encouraging curiosity and questioning as a TQM.
Teacher questioning strongly influences students’ mathematical learning. A learner-centered classroom encourages students’ curiosity and questioning; teachers listen to students’ explanations, probe for justifications, and encourage students to share their solutions with peers when working together to refine, revise, and extend their solutions (Bulgar, Schorr, & Maher, 2002). This TQM of encouraging curiosity and questioning assesses whether the teacher helps to create a classroom environment that welcomes student curiosity, rewards creativity, encourages healthy questioning, and avoids dogmatism. As teachers help foster curiosity in students and help them develop the ability to effectively ask questions, they also model mathematics practices through multiple accurate representations.
Using Accurate Representational Forms as a TQM Students sometimes need help developing their understanding of abstract ideas captured in conventional mathematical representations and symbols (Greeno & Hall, 1997). Teachers need to present mathematical terms, symbols, and procedures accurately for students to develop skills and understandings. Extensive work with symbolic manipulation without an underlying understanding of the ideas they represent results in a failure to progress beyond mechanical manipulations (Wagner & Parker, 1993). Because representations of mathematical ideas are so important to conceptual development (Ball & Osborne, 1998; Hiebert & Wearne, 1986), representations should be carefully developed and connected with earlier knowledge and experiences, which some students may have discovered on their own (Shann, 2006).
Representational forms are essential to teaching mathematical ideas (NCTM, 1991, 2000). Much like the modeling of effective questioning, Goldin and Kaput (1996) postulated that the representational forms modeled by the teacher influence how students develop mathematical understandings. For this reason, the level of a teacher’s use of representational models provides insight into teaching quality. NCTM (2000) recommended that teachers should “encourage students to represent their ideas in ways that make sense to them, even if their first representations are not conventional ones” (p. 67). For students to be able to induct and modify previous

RMLE Online— Volume 34, No. 4
© 2010 National Middle School Association 4
experiences with many different representations (Capraro & Capraro, 2006), teachers must present a cohesive and coherent use of various representational forms. The use of multiple representations encourages conceptual understanding in students (Donovan & Bransford, 2005). Traditionally, some forms of representation, like graphs, symbol representations, and diagrams have been a part of K–12 mathematics. However, these representations have often been taught and learned as ends, in themselves. Using learning representations as ends limits their power and utility as tools for learning and doing mathematics (NCTM, 2000); thus, mathematical power is determined by the utility the representation affords in doing mathematics. This TQM of using accurate representational forms assesses whether teachers accurately and comprehensibly used representations when presenting the content of the learning goal.
Rationale and Research Questions The three TQMs, probing for student understanding, encouraging curiosity and questioning, and using accurate representational forms, play an important role in developing a conceptual understanding of mathematics. How critical these measures are in an analysis of classroom instruction and, ultimately, student achievement is less understood. In this research, we add to this knowledge base with an analysis of these measures in the context of teaching and learning of mathematics in middle school classrooms. We addressed two research questions: (1) To what extent do each of the TQMs provide quantifiable differences of occurrences in classrooms as teachers cover the same content using different curriculum materials? (2) To what extent does the use of certain TQMs influence the improvement of student achievement as measured by students’ understanding of number concepts?
Method
Video and student performance data from the second and third years of a five-year study were used to estimate the effects of probing for student understanding, encouraging curiosity and questioning, and using accurate representational forms on middle school students’ mathematics achievement. The data set consisted of two years of video that was part of a larger collection of records from an NSF-IERI project that collected information on the same four predetermined lessons each year for three years. These lessons were mutually agreed upon by the teachers and researchers in Year 1 and covered the objective of converting among fractions, decimals, and percents. Year 1 was the pilot
year, lessons were taped during years two through four, and student data were collected in the same years during full implementation. We focused on Years 2 and 3 for the purposes of understanding the stability and change in how teachers implemented the TQMs. This in-depth study of two sixth grade mathematics teacher participants (Ms. H and Ms. W) using two different standards-based curricula was conducted with repeated observations for two years covering the same lessons. Thus, this study resulted in a narrow slice of data that was deep and rich with insights about the use and stability of the TQMs. Both participating teachers had more than five years of middle school mathematics teaching experience, similar university preparation, and a similar number of years employed in their districts. Ms. W taught in a predominately middle class community with few minority students. Ms. H taught in a nearby middle class district with nearly half of the students Hispanic. The free and reduced-price lunch statistics of the two schools were similar. These two teachers were purposefully chosen because of the similarity in their characteristics while providing some variability across student demographics that added to the depth of the data. Sixth grade students were administered the 19-item number test, described below, for the two years in this report (Y1, N = 165 and Y2, N = 152) at the beginning and end of the school year (September and May).
Video data was one of the primary sources of information for this study. Jacobs, Kawanaka, and Stigler (1999) found three advantages for using this type of data: (a) it is reasonably raw, (b) it is flexible and can be examined by researchers from diverse backgrounds who might bring fresh perspectives to this type of analysis, and (c) it is everlasting and can be observed and analyzed repeatedly from different dimensions. Each year, the same four purposefully selected lessons within the unit on the concept of number were videotaped. The purpose of selecting these lessons was to investigate the actions of teachers in a real, rich context. These lessons all focused on the one over-arching middle grades objective of converting among fractions, decimals, and percents. Using lesson samples collected over time provides salient information about the teaching and learning process across a range of conditions, classes, and subjects that can then be analyzed (Horsley & Walker, 2003). It was necessary to observe teacher actions from one year to the next to capture additional information. Therefore, combining information from these lessons to interpret teachers’ actions helped to improve the trustworthiness of this study (Denzin & Lincoln, 2000). Additionally, these lessons matched the learning goal of using, interpreting,
RMLE Online— Volume 34, No. 4
© 2010 National Middle School Association 5
and comparing numbers in several equivalent forms, particularly fractions, decimals, and percents. Both school districts provided a scope and sequence that delineated specific time periods for teaching each state objective. The scope and sequence were consulted, and each teacher agreed when initial instruction for the identified learning goal would occur. We observed and videotaped two lessons during the number unit each year, hereafter referred to as W1, W2, H1, and H2 for the two lessons in Year 1 and W3, W4, H3, and H4 for the lessons in Year 2.
Instrumentation The number test was co-developed by researchers from the University of Delaware, Texas A&M University, and staff from the American Association for the Advancement of Science (AAAS) with Project 2061. The test was intended to measure the construct of number as defined in the literature (AAAS, 1993; NCTM, 2000) and matched to the learning goal of converting among fractions, decimals, and percents. The three-part test contained 9 multiple-choice items, 6 short answer items, and a single ‘super’ item consisting of four parts based on the work of Collis and Biggs (1991), for a total of 19 items. The essence of the Biggs and Collis (1991) formulation is that an item begins with a question stem, and each subsequent part requires more complex thinking on the part of the student. Within the learning goal, the concepts of comparing and ordering, multiple meanings and models, and converting forms were assessed by the number test. An outline of the content contained in the number test is included in Table 3.
These same concepts (see lesson objective above) were taught in the lessons that were videotaped as part of the larger study. The Cronbach’s alpha reliabilities for the student data from the instrument for teachers W and H on the pre- and post-tests were .84 and .82 and .86 and .84, respectively, for each year. Score validity was estimated using structural equation modeling (for more details, see Capraro, Willson, Capraro, & Wilson, 2004). For each year, the post-test data fit the hypothesized data structure, and the best-fit model was achieved by using the combined data from both years (Capraro et al., 2004). An exploratory factor analysis with an orthogonal rotation was applied using the eigenvalue greater than 1 rule. The scree plot supported the retention of three factors (comparing and ordering, multiple meanings and models, and converting forms). The correlation between participant scores on number post-test and their state-mandated minimal skills scores for each year were .87 and .92, respectively. The minimal skills scores were obtained for the year before the study began and for each year of this study.
Coding and Psychometrics For purposes of this study, we used three TQMs, (1) probing for student understanding, (2) encouraging curiosity and questioning, and (3) using accurate representational forms adapted from Curriculum Quality Measures of AAAS middle grades textbook analysis (AAAS, 2006). All indicators of these TQMs were applied only to the teacher, rather than to the curriculum materials.
The videos were coded for instances of each indicator in 20-second intervals. This time segment was used because 20 seconds was the most appropriate partition for assessment of TQMs. Longer intervals could lead to aggregation of occurrences within any particular interval. Shorter intervals provided less opportunity to demonstrate TQMs. A two, one, zero, or x code was used across all criteria. For each time interval, the first consideration was whether or not the teacher had the opportunity to meet indicators. As in all school settings, a certain amount of time is expected for administrative duties such as taking attendance or making announcements. Because this time was not being used as instructional time, it was marked with an x to indicate either a lack of opportunity to meet an indicator or time not spent specifically on the learning goal. A two represented that the indicator was fully met, and a one represented that the indicator was partially met. When a teacher failed to engage in any particular indicator, a zero was given for that 20-second interval. A zero does not suggest that the teacher was counterproductive during the interval for that particular indicator. Instead, a zero should be interpreted as the teacher simply not making full or partial use of an opportunity to meet that particular indicator. Further clarification of each TQM and its indicators are listed below (see Appendix for a sample). Although each TQM is a specific measurement of teacher actions, students’ perceptions of those actions in the classroom are more important than researchers’ perceptions of those actions. Therefore, students’ responses were used to gauge each TQM.
Inter- and intra-rater reliabilities were estimated due to the subjectivity involved in coding the videotaped data. Inter-rater reliability is the degree of agreement among raters about a given or specific criterion and is an estimate of homogeneity among raters. Intra-rater reliability is estimated to minimize rater drift within each rater’s coding process. Therefore, by periodically checking one’s own agreement with prior scoring ensures that the raters themselves did not change over time, possibly due to more experience from coding the videotaped lessons. Each rater coded every videotaped lesson with periodic estimates of inter- and intra-rater reliability for

RMLE Online— Volume 34, No. 4
© 2010 National Middle School Association 6
each TQM. Discussions and reconciliations were held for instances when a score of at least 80% or better was not achieved for each indicator (similar to Beatty, 2004). Cumulative results of inter- and intra-rater reliabilities were .80 and 1.0 for probing for understanding, .85 and .90 for encouraging curiosity and questioning, and .88 and 1.00 for using accurate representational forms, respectively.
Coding System for TQMsThe measurable indicator of probing for student understanding was that the teacher engaged students in assessment of their use of the knowledge or skills specified in the learning goal. We paid particular attention to the extent and comprehensiveness of the students’ answer(s) in response to teacher probing. A score of two indicated that the teacher asked questions that required students to apply, explain, express, justify, interpret, describe, predict, design, discuss positions, or summarize what they learned in their own words, or otherwise demonstrate understanding. A one was recorded when teachers initiated discourse related to the learning goal that resulted in a word or phrase requiring little or no individual interpretation on the students’ part. A zero was recorded when the teacher initiated discourse that resulted in students providing just a number or a specific word or phrase similar in responses to cloze questions and when the teacher did not initiate discourse.
Encouraging student curiosity and questioning was the focus of the second teacher quality measure. The overarching question for this measure of quality teaching was whether or not the teacher helped to create a classroom environment that welcomed student curiosity, rewarded creativity, encouraged a spirit of healthy questioning, and avoided dogmatism. If a student was reading or speaking for the entire time interval, one would not expect the teacher to interrupt, so this time was marked with an x. Work time was necessary for students to process information; therefore, time that the students were working without teacher interaction was also marked with an x. Finally, times when the activity of the teacher cannot be ascertained by the videotape were also marked with an x.
The measurable indicator of encouraging curiosity and questioning was whether or not the teacher respected and valued students’ ideas. This indicator was met if the teacher showed respect for and valued student ideas by eliciting or providing an opportunity to share ideas with other classmates. There were three ways to meet this indicator with a score of two. For example, if the teacher praised a student for her effort, solution, or response and/or asked the student to explain or show a fellow
student or students her response or solution, then the teacher met this indicator. Additionally, if the teacher built upon responses or asked classmates to build upon the student’s response, the teacher met this indicator. Finally, by holding a student’s ideas up as evidence, the teacher provided an opportunity to respect and value that student’s ideas and, therefore, met this indicator, receiving a score of two.
A score of one was recorded if the teacher simply asked for student ideas and did not take the opportunity to value or show respect for the ideas given in any of the ways previously mentioned. A score of zero was recorded if the teacher did not appear to respect or value student ideas.
Accurately using representations was the focus of the third TQM. A variety of representations were needed to make abstract ideas intelligible to all students. Some of the ways teachers represented ideas effectively were by (a) using two or more representations (verbal, symbolic, pictorial, and/or manipulatives), (b) presenting representations accurately, (c) connecting the representation used to something else, (d) using representations as “re-presentations” of something else, and (e) making sure that the representation presented was comprehensible to the students.
Measurable indicators were used to evaluate this TQM. The first was that the teacher used at least two representations to make connections for students. A score of two indicated the teacher used one or more from each of the following two groups of representation types: verbal or symbolic and pictorial or kinesthetic. The teacher integrated the two representations to facilitate connection to the mathematics being taught. Additionally, these representations were suitable, used correctly, and limitations were explained in addressing the learning goal; mathematical accuracy was critical to this indicator. A score of one indicated the teacher used a single representation, or two representations within the same category, not necessarily making a connection for students between the representation(s) and the learning goal, indicated by student responses demonstrating that a different representation would have been a better choice. Zero indicated the teacher did not take the opportunity to use a representation in any of the ways specified above, or it was not accurately used; the limitations were not articulated; and mistakes were noted in the use of the representation or in its generalizability.
Design and Data AnalysisQualitative and quantitative methods are often used separately and independently (Lincoln, 2001), but more recently, researchers are using mixed methods
RMLE Online— Volume 34, No. 4
© 2010 National Middle School Association 7
of exploration of complex data sets intended to yield generalizable findings from large-group studies (Johnson & Onwuegbuzie, 2004; Raudenbush, 2004). Thus, the data were analyzed using a graphical, time-integrated analysis. The purpose of this analysis was to broaden interpretability and depict analyses on the same metric so that they could be directly compared. Although this analytic choice does not accommodate traditional dichotomous p-value decision making, it facilitates greater understanding of the degree to which the teacher integrated the TQMs.
Standard linear regression models assume that variance is constant within the population under study. When this is not the case, for example, when cases that are high on some attribute show more variability than cases that are low on that attribute, linear regression using ordinary least squares (OLS) no longer provides optimal model estimates. If the differences in variability can be predicted from another variable, the weight estimation procedure can compute the coefficients of a linear regression model using weighted least squares (WLS) such that the more precise observations (i.e., those with less variability) are given greater weight in determining the regression coefficients. The weight estimation procedure tests a range of weight transformations and indicates which will provide the best fit for the data. The heteroscedasticity variable was the pretest score. The three TQMs were the independent variables, and the dependent variables were post-test scores .
Results
Quantitative AnalysisDuring the first year, there was a modest change in the number test means from pre- to post-test, 14.2 (6.76) and 15.3 (7.19), respectively, with a small Cohen’s d effect of .16. During the second year, the means changed from pre- to post-test, 14.1 (8.21) to 22.3 (3.71), respectively,
with a Cohen’s d effect of 1.38. This estimate of the effect was markedly larger and represented a meaningful practical average gain of 58%. The decrease in standard deviation indicated less variation in students’ scores, or these scores were grouping closer to the mean, and the increase in the mean indicated improved student performance. The combined changes indicated that more scores were clustered closer together toward the higher end of the scale. Change within teachers in Year 1 was modest (unequal ns). Teacher W showed a greater gain (Mpre 14.0, SDpre 5.2; Mpost 15.8, SDpost 6.7, Cohen’s d= .30) as compared to Teacher H (Mpre 14.4, SDpre 8.1; Mpost 14.6, SDpost 9.1, Cohen’s d= .023). Changes between students by teacher in Year 2 were noticeable. Post-test differences revealed important differences (MTeacher W 23.5, SDTeacher W 3.8; MTeacher H 15.2, SDTeacher H 5.7, Cohen’s d= 1.70).
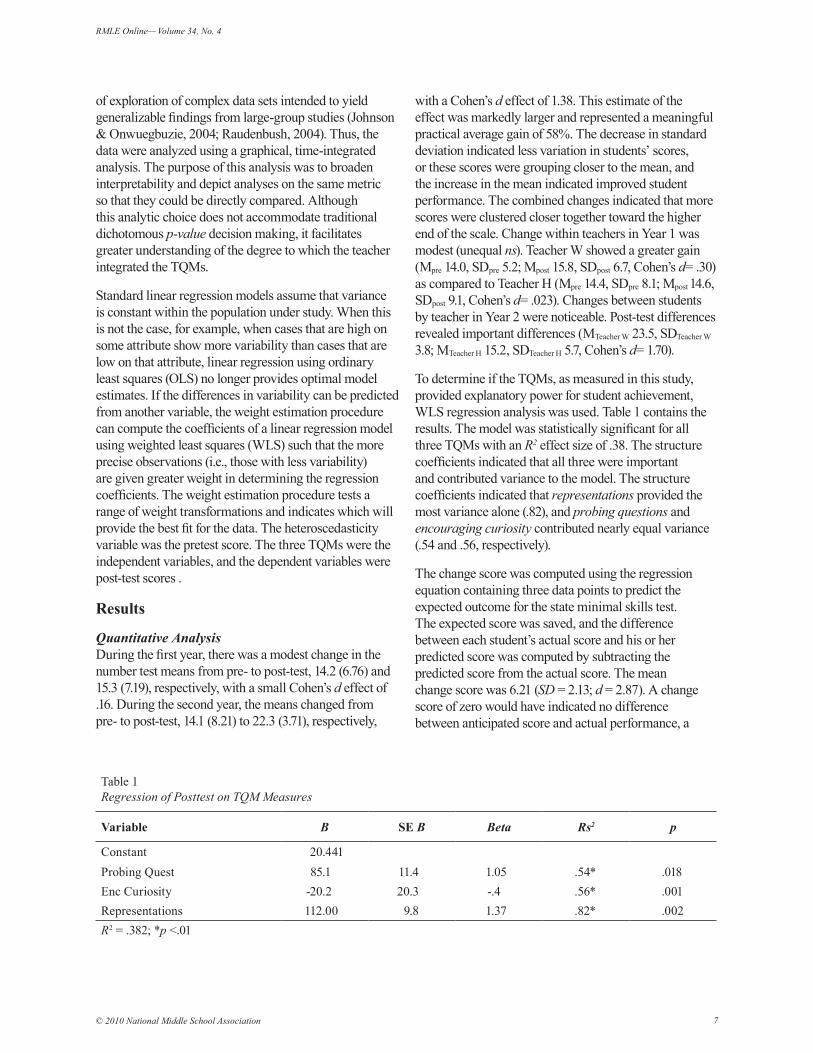
To determine if the TQMs, as measured in this study, provided explanatory power for student achievement, WLS regression analysis was used. Table 1 contains the results. The model was statistically significant for all three TQMs with an R2 effect size of .38. The structure coefficients indicated that all three were important and contributed variance to the model. The structure coefficients indicated that representations provided the most variance alone (.82), and probing questions and encouraging curiosity contributed nearly equal variance (.54 and .56, respectively).
The change score was computed using the regression equation containing three data points to predict the expected outcome for the state minimal skills test. The expected score was saved, and the difference between each student’s actual score and his or her predicted score was computed by subtracting the predicted score from the actual score. The mean change score was 6.21 (SD = 2.13; d = 2.87). A change score of zero would have indicated no difference between anticipated score and actual performance, a
Table 1 Regression of Posttest on TQM Measures
Variable B SE B Beta Rs2 p
Constant 20.441Probing Quest 85.1 11.4 1.05 .54* .018Enc Curiosity -20.2 20.3 -.4 .56* .001Representations 112.00 9.8 1.37 .82* .002R2 = .382; *p <.01

RMLE Online— Volume 34, No. 4
© 2010 National Middle School Association 8
positive difference indicated an increase greater than unmediated learning alone. Given the magnitude of the change score, the difference was statistically significant (p < .001) and practically important.
To examine the relationship between TQMs in study years one and two, structure coefficients from the regression analysis and a correlation matrix were computed. Table 2 shows a relationship between using accurate representational forms and year but relatively small correlations between the other two TQMs. This can, in part, be attributed to teachers’ participation in a summer inservice on representations in this particular area. Encouraging curiosity had a large negative correlation with both probing for understanding and using representations. Given the small relative correlation between structure coefficients and encouraging curiosity, paired with a relatively small Beta weight, it can be assumed that encouraging curiosity contributed little unique variance to the model.
The importance of examining the correlation between year and the other variables is to determine if any particular TQM was susceptible to teachers teaching the same content two years in a row. The correlation matrix shows generally low correlations with the two TQMs not addressed during the inservice, indicating a possible impact for inservice. The moderately high correlation between year and using representation seems to indicate scores on representational indicators improved over the first year, possibly due to inservice or natural lesson improvements incorporated as part of the teachers’ regular practice.
Qualitative AnalysisIn this section, each of the three TQMs, probing for student understanding, encouraging curiosity and questioning, and using accurate representational forms, will be discussed from a qualitative perspective. These results provide an overall view of both teachers through
the lens of the three TQMs and present examples of both teachers’ practice, illuminating the overall results for each TQM. In each lesson, for both teachers, there were noteworthy elements and examples of each of the TQMs. There were also qualitative differences in the way each teacher enacted these TQMs. In this section, these differences will be discussed, and examples will be provided to clarify the findings.
For each of the TQMs, graphical, time-integrated analyses were constructed and were used to aid analysis and presentation of the results of coding. For each TQM, the graphs show frequencies and groupings of where each teacher met the indicators. For the purposes of these graphs, all uncoded time segments (coded as x) during each lesson were eliminated from the data. The remaining time segments (coded as zero, one, or two) were compressed so that comparisons, through the lens of each TQM, used relational class time for that TQM, enabling comparisons between lessons and teachers. A coding of zero or one was converted to zero to allow the graphs to show that the teacher either did or did not meet the indicator in a meaningful way. This simplification was made to increase the clarity of the graphical representation of the data. During data analysis, similar graphs were created using the uncombined coding results. These initial graphs did not provide us with the needed clarity to analyze and compare the teachers’ instructional practices in light of the TQMs, thus necessitating the need for simplification of the graphs. In each collection of graphs, Ms. H’s lessons are on the left (H1, H2, H3, and H4), and Ms. W’s lessons are on the right (W1, W2, W3, and W4). The resulting graphs were helpful in informing the analysis. These series of graphs are depicted within each section.
Probing for student understanding. Both teachers made use of probing questions in every lesson including the introduction, lecture, and exploration. Probing questions were used in whole-class, small-group, and individual
Table 2 Correlation Matrix for TQMs, Year, and Structure Coefficients
Probing Curiosity Representation Year
Constant 1Curiosity .886** 1Representation -.691** -.691** 1Year .531* .627 .790** 1Rs2 .544** .546** .843** .748**Note. * p < . 05; ** p < .001; PfU= probing for understanding; EC= Encouraging Curiosity; R= representations
RMLE Online— Volume 34, No. 4
© 2010 National Middle School Association 9
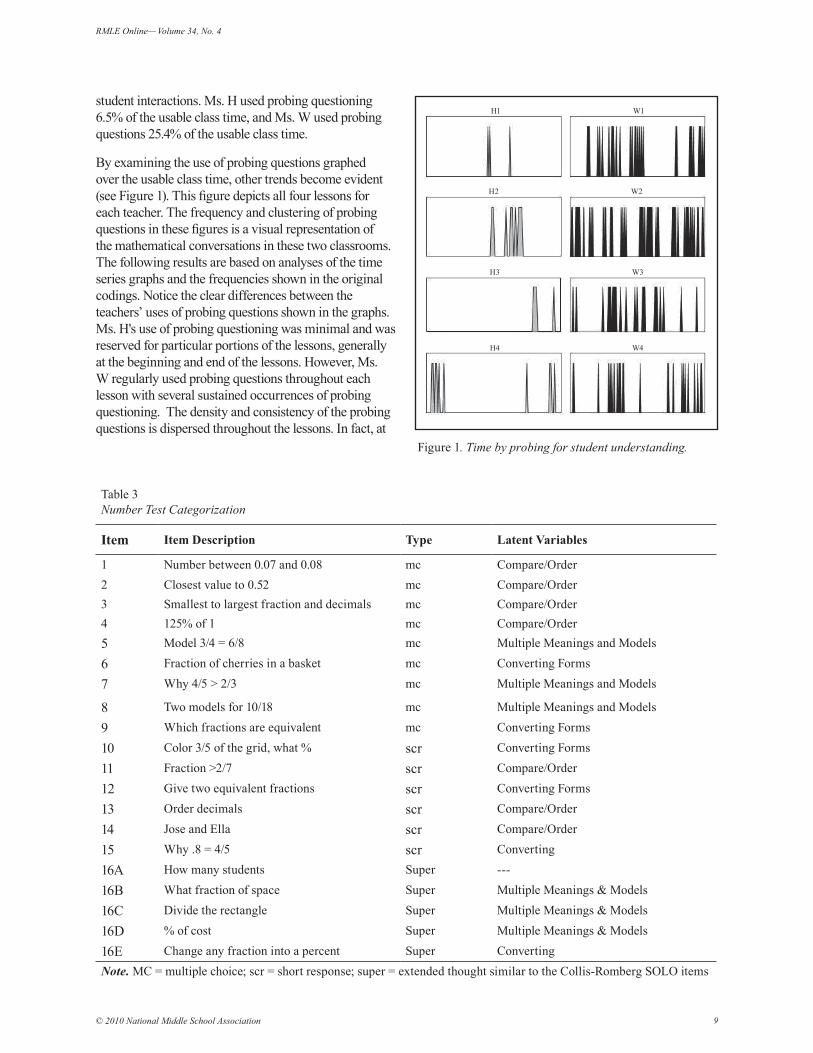
student interactions. Ms. H used probing questioning 6.5% of the usable class time, and Ms. W used probing questions 25.4% of the usable class time.
By examining the use of probing questions graphed over the usable class time, other trends become evident (see Figure 1). This figure depicts all four lessons for each teacher. The frequency and clustering of probing questions in these figures is a visual representation of the mathematical conversations in these two classrooms. The following results are based on analyses of the time series graphs and the frequencies shown in the original codings. Notice the clear differences between the teachers’ uses of probing questions shown in the graphs. Ms. H's use of probing questioning was minimal and was reserved for particular portions of the lessons, generally at the beginning and end of the lessons. However, Ms. W regularly used probing questions throughout each lesson with several sustained occurrences of probing questioning. The density and consistency of the probing questions is dispersed throughout the lessons. In fact, at
Figure 1. Time by probing for student understanding.
H1
H2
H3
H4
W1
W2
W3
W4
Table 3 Number Test Categorization
Item Item Description Type Latent Variables
1 Number between 0.07 and 0.08 mc Compare/Order2 Closest value to 0.52 mc Compare/Order3 Smallest to largest fraction and decimals mc Compare/Order4 125% of 1 mc Compare/Order5 Model 3/4 = 6/8 mc Multiple Meanings and Models
6 Fraction of cherries in a basket mc Converting Forms
7 Why 4/5 > 2/3 mc Multiple Meanings and Models
8 Two models for 10/18 mc Multiple Meanings and Models
9 Which fractions are equivalent mc Converting Forms
10 Color 3/5 of the grid, what % scr Converting Forms
11 Fraction >2/7 scr Compare/Order
12 Give two equivalent fractions scr Converting Forms
13 Order decimals scr Compare/Order
14 Jose and Ella scr Compare/Order
15 Why .8 = 4/5 scr Converting
16A How many students Super ---
16B What fraction of space Super Multiple Meanings & Models
16C Divide the rectangle Super Multiple Meanings & Models
16D % of cost Super Multiple Meanings & Models
16E Change any fraction into a percent Super ConvertingNote. MC = multiple choice; scr = short response; super = extended thought similar to the Collis-Romberg SOLO items

RMLE Online— Volume 34, No. 4
© 2010 National Middle School Association 10
some times during the lesson, the occurrences are densely packed as compared to the intermittent use of Teacher H.
Ms. H probed for understanding at varied, non-contiguous time intervals throughout the lesson. These were times that were set aside for explanations with questions such as, “Mark, will you explain what you did?” “Explain how you got from 72 to 9” and “Who can explain the solution to a third grader?” Ms. H also asked the students to design word problems corresponding to an equation with which they were working. After one student had explained a solution, she asked for other solution methods. Although these were examples of probing questions, the explanations that typically followed were not a consistent part of Ms. H’s teaching style. The atmosphere in Ms. H’s class was one in which the primary voice of the class was that of the teacher, and probing questions were typically stand-alone questions.
In contrast, the students in Ms. W’s class appeared to consider a justification as an expected part of an answer, so probing questions in Ms. W’s class were much less formal than those in Ms. H’s class. Examples of Ms. W’s probing questions included “Why do you think that works?” “Can you give me an example?” and “How?” Ms. W’s class was often engaged in exploration in cooperative group settings. As Ms. W circulated, she asked students to explain what they had learned, taking the opportunity to sit down and use Socratic-style questioning to help a group struggling to make a connection. When students were making fraction strips, she prompted students to physically demonstrate the necessary folds while they explained how they made the folds and why they knew they were correct. Ms. W listened as one student said, “I have the whole,” and another student quickly said, “I did the halves.” There was a long pause. Then Ms. W asked the students how they learned to fold letters into envelopes. Quickly, the group started trying to fold a unit whole into thirds. Another student held his hand up, “Here Ms. W, I did it into three.” She opened the child’s fraction strip. Holding it up carefully, Ms. W folded one, then the next, and the next, showing how each piece exactly covered the previous one. Then she asked, “Is this thirds?” Other students began following the model. The student who folded the halves quickly made fourths by folding his halves in half again. However, when students tried to fold sixths they attempted to fold thirds into thirds. Ms. W asked a series of questions, “When you folded halves, what did you do? How did folding halves help you fold fourths? Can you use the thirds to help you fold sixths? What is similar between halves and fourths that might be the same as with thirds and sixths?” Ms. W would have small- and whole-group conversations, lasting several
minutes, in which each student response would prompt another probe from the teacher. In this manner, Ms. W kept a mathematical conversation going and used probing questions as a consistent part of her teaching style.
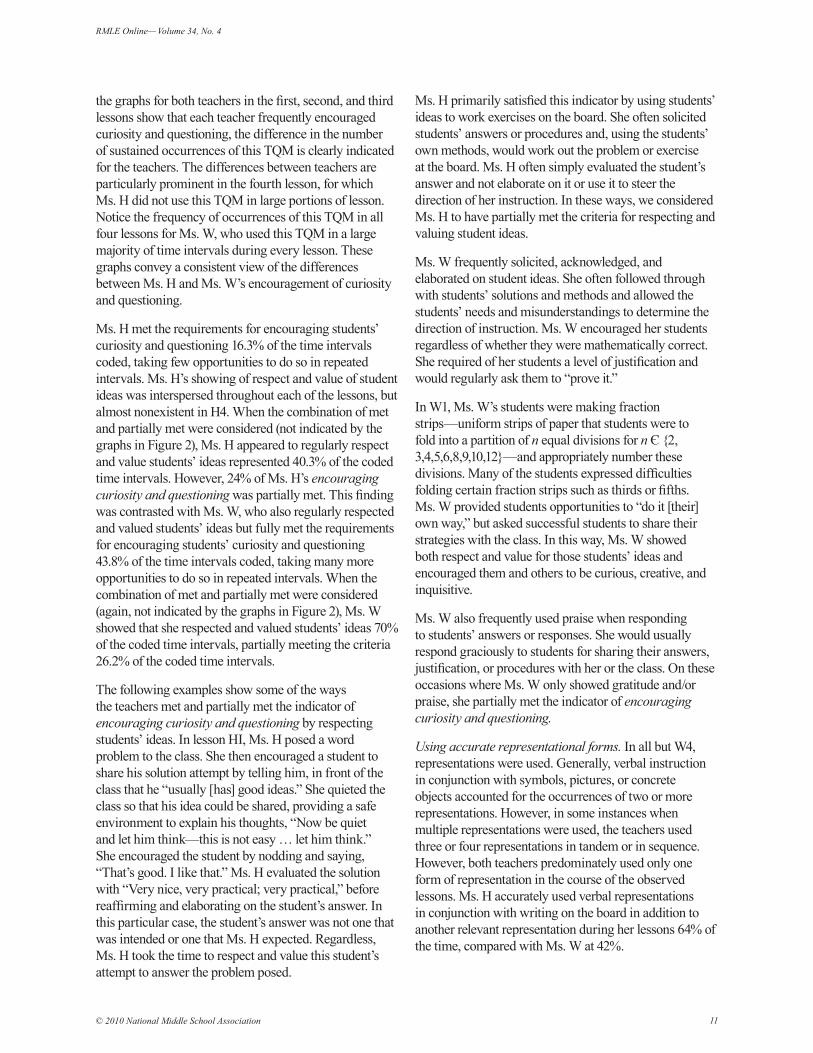
Encouraging curiosity and questioning. Both teachers used whole-class and cooperative-group settings in each of the lessons analyzed. In most lessons, each teacher frequently encouraged student curiosity and questioning. Ms. W made use of several extended time periods to do so, and with notably more frequency, as indicated by the graphs in Figure 2. Ms. W also did not let as many extended periods of time pass without encouraging curiosity and questioning as did Ms. H. These extended periods of encouragement occurred in both small- and whole-class discussions for both teachers. However, major differences exist in the density and frequency for encouraging curiosity and questioning. Teacher H uses it half the time at the onset of the lesson but to a much lesser degree than Teacher W, while it appears that Teacher W uses it throughout the lesson, with it being densely packed early and toward the end of the lesson.
By examining the use of encouraging curiosity and questioning (score of two for the indicator) graphed over the usable class time, trends become evident (see Figure 2). The frequency and clustering of encouraging curiosity and questioning relevant to the learning goal is displayed for each of these two classrooms. Although
Figure 2. Time by encouraging curiosity and questioning.
H1
H2
H3
H4
W1
W2
W3
W4
RMLE Online— Volume 34, No. 4
© 2010 National Middle School Association 11
the graphs for both teachers in the first, second, and third lessons show that each teacher frequently encouraged curiosity and questioning, the difference in the number of sustained occurrences of this TQM is clearly indicated for the teachers. The differences between teachers are particularly prominent in the fourth lesson, for which Ms. H did not use this TQM in large portions of lesson. Notice the frequency of occurrences of this TQM in all four lessons for Ms. W, who used this TQM in a large majority of time intervals during every lesson. These graphs convey a consistent view of the differences between Ms. H and Ms. W’s encouragement of curiosity and questioning.
Ms. H met the requirements for encouraging students’ curiosity and questioning 16.3% of the time intervals coded, taking few opportunities to do so in repeated intervals. Ms. H’s showing of respect and value of student ideas was interspersed throughout each of the lessons, but almost nonexistent in H4. When the combination of met and partially met were considered (not indicated by the graphs in Figure 2), Ms. H appeared to regularly respect and value students’ ideas represented 40.3% of the coded time intervals. However, 24% of Ms. H’s encouraging curiosity and questioning was partially met. This finding was contrasted with Ms. W, who also regularly respected and valued students’ ideas but fully met the requirements for encouraging students’ curiosity and questioning 43.8% of the time intervals coded, taking many more opportunities to do so in repeated intervals. When the combination of met and partially met were considered (again, not indicated by the graphs in Figure 2), Ms. W showed that she respected and valued students’ ideas 70% of the coded time intervals, partially meeting the criteria 26.2% of the coded time intervals.
The following examples show some of the ways the teachers met and partially met the indicator of encouraging curiosity and questioning by respecting students’ ideas. In lesson HI, Ms. H posed a word problem to the class. She then encouraged a student to share his solution attempt by telling him, in front of the class that he “usually [has] good ideas.” She quieted the class so that his idea could be shared, providing a safe environment to explain his thoughts, “Now be quiet and let him think—this is not easy … let him think.” She encouraged the student by nodding and saying, “That’s good. I like that.” Ms. H evaluated the solution with “Very nice, very practical; very practical,” before reaffirming and elaborating on the student’s answer. In this particular case, the student’s answer was not one that was intended or one that Ms. H expected. Regardless, Ms. H took the time to respect and value this student’s attempt to answer the problem posed.
Ms. H primarily satisfied this indicator by using students’ ideas to work exercises on the board. She often solicited students’ answers or procedures and, using the students’ own methods, would work out the problem or exercise at the board. Ms. H often simply evaluated the student’s answer and not elaborate on it or use it to steer the direction of her instruction. In these ways, we considered Ms. H to have partially met the criteria for respecting and valuing student ideas.
Ms. W frequently solicited, acknowledged, and elaborated on student ideas. She often followed through with students’ solutions and methods and allowed the students’ needs and misunderstandings to determine the direction of instruction. Ms. W encouraged her students regardless of whether they were mathematically correct. She required of her students a level of justification and would regularly ask them to “prove it.”
In W1, Ms. W’s students were making fraction strips—uniform strips of paper that students were to fold into a partition of n equal divisions for n Є {2, 3,4,5,6,8,9,10,12}—and appropriately number these divisions. Many of the students expressed difficulties folding certain fraction strips such as thirds or fifths. Ms. W provided students opportunities to “do it [their] own way,” but asked successful students to share their strategies with the class. In this way, Ms. W showed both respect and value for those students’ ideas and encouraged them and others to be curious, creative, and inquisitive.
Ms. W also frequently used praise when responding to students’ answers or responses. She would usually respond graciously to students for sharing their answers, justification, or procedures with her or the class. On these occasions where Ms. W only showed gratitude and/or praise, she partially met the indicator of encouraging curiosity and questioning.
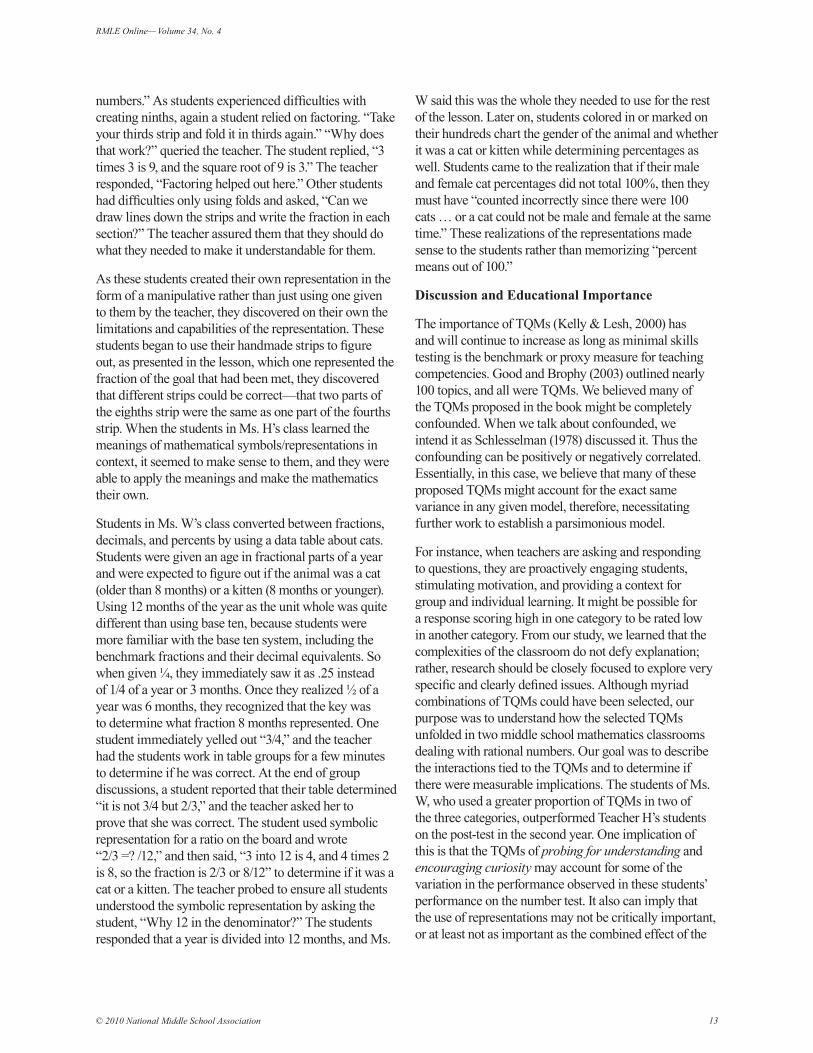
Using accurate representational forms. In all but W4, representations were used. Generally, verbal instruction in conjunction with symbols, pictures, or concrete objects accounted for the occurrences of two or more representations. However, in some instances when multiple representations were used, the teachers used three or four representations in tandem or in sequence. However, both teachers predominately used only one form of representation in the course of the observed lessons. Ms. H accurately used verbal representations in conjunction with writing on the board in addition to another relevant representation during her lessons 64% of the time, compared with Ms. W at 42%.

RMLE Online— Volume 34, No. 4
© 2010 National Middle School Association 12
By examining the accurate use of representations (scores of two) graphed over the usable class time, other trends become evident (see Figure 3). The frequency and clustering of using these multiple representations relevant to the learning goal was displayed in the figure for each of these two classrooms. The graphs for Ms. H show that in H3 and H4, representations were accurately used frequently. Ms. W accurately used representations primarily in W1. The differences between teachers were particularly prominent in the third and fourth lessons, for which Ms. W did not use representations in large portions of the lessons. Notice the prolonged occurrences of this TQM in lesson three for Ms. H. These graphs convey a consistent view of the differences by lessons and by teachers. This could be due to the nature and content of the enacted lesson. In W4, Ms. W had students working in small table groups to complete an assigned task, and the student groups used only one representation at a time, as compared to Ms. H who chose a more teacher-directed approach to the same lesson. With using accurate representational forms, Teacher H uses representations more frequently and more densely in her third lesson than in either of the other three, as compared to Teacher W who used them relatively infrequently but densely and accurately when they were used. In fact, in one lesson, Teacher W did not use them at all. This finding is not surprising because it is not uncommon to perceive middle school students as believing manipulatives are juvenile and useless. Although this may not be true, it is a common perception among teachers.
As students worked with equivalent fractions in Ms. H’s class, she encouraged them to use cross multiplication and other strategies to determine equivalent fractions. At another time during the lesson, she stated, “Some of you can do it the long way if you need to,” and “Some can do it in your head.” Issues arose when the teacher attempted to connect the procedures used with the pattern blocks for identifying equivalent fractions with comparing two rational numbers. Next, the “butterfly” method was introduced. In this method, students are instructed to multiply each denominator by the numerator of the other rational number and write the product above the numerator. If the numbers were the same, the fractions were equivalent. This algorithm was taught without explaining why it worked and without students understanding they were using a common denominator (multiplying the denominators together).
Ms. H continually brought back the pattern blocks and drew the blocks on the board for those who still needed the concrete or pictorial representations. As students placed 2 red trapezoids on top of the yellow hexagon, then 3 blue diamonds on top of 2 red trapezoids, and
then 6 green triangles on top of the 3 blue diamonds, the teacher continuously drew the pictorial representation on the board and wrote the symbolic representation of the fractions. This allowed students to visually understand 1/6, 2/6 (equals 1/3), 3/6 (equals 1/2), 4/6 (equals 2/3), 5/6, and 6/6 (equals 1). Students covered stars with different color blocks as another means of reinforcing equivalent fractions, “Start out with 2 yellow hexagons as your whole. How many red trapezoids will it take to make the same whole? How many blue diamonds? How many green triangles?” After various practice sessions, students began to move flexibly between the representations. Students were then asked by the teacher to make up word problems that mirrored their pattern blocks. Students were not expected at this point to find the answer, but they were attempting to make real-world connections to their pattern-block representations.
From a class discussion, it was clear that Ms. W’s students created fraction strips in a previous lesson and, thus, were familiar with their uses demonstrating the comprehensibility of the representation. However, students were “frustrated” in attempting to make the sixths strip. One student gave another student verbal directions, “Take your thirds strip and fold it in half.” The teacher asked, “Why does that work?” The first student said, “’Cause 3 times 2 is 6.” Another problem arose. The teacher asked, “Why are we missing sevenths and elevenths?” and “Why would those two strips be difficult to make?” A student responds, “They are prime
Figure 3. Time by use of representations.
H1
H2
H3
H4
W1
W2
W3
W4
RMLE Online— Volume 34, No. 4
© 2010 National Middle School Association 13
numbers.” As students experienced difficulties with creating ninths, again a student relied on factoring. “Take your thirds strip and fold it in thirds again.” “Why does that work?” queried the teacher. The student replied, “3 times 3 is 9, and the square root of 9 is 3.” The teacher responded, “Factoring helped out here.” Other students had difficulties only using folds and asked, “Can we draw lines down the strips and write the fraction in each section?” The teacher assured them that they should do what they needed to make it understandable for them.
As these students created their own representation in the form of a manipulative rather than just using one given to them by the teacher, they discovered on their own the limitations and capabilities of the representation. These students began to use their handmade strips to figure out, as presented in the lesson, which one represented the fraction of the goal that had been met, they discovered that different strips could be correct—that two parts of the eighths strip were the same as one part of the fourths strip. When the students in Ms. H’s class learned the meanings of mathematical symbols/representations in context, it seemed to make sense to them, and they were able to apply the meanings and make the mathematics their own.
Students in Ms. W’s class converted between fractions, decimals, and percents by using a data table about cats. Students were given an age in fractional parts of a year and were expected to figure out if the animal was a cat (older than 8 months) or a kitten (8 months or younger). Using 12 months of the year as the unit whole was quite different than using base ten, because students were more familiar with the base ten system, including the benchmark fractions and their decimal equivalents. So when given ¼, they immediately saw it as .25 instead of 1/4 of a year or 3 months. Once they realized ½ of a year was 6 months, they recognized that the key was to determine what fraction 8 months represented. One student immediately yelled out “3/4,” and the teacher had the students work in table groups for a few minutes to determine if he was correct. At the end of group discussions, a student reported that their table determined “it is not 3/4 but 2/3,” and the teacher asked her to prove that she was correct. The student used symbolic representation for a ratio on the board and wrote “2/3 =? /12,” and then said, “3 into 12 is 4, and 4 times 2 is 8, so the fraction is 2/3 or 8/12” to determine if it was a cat or a kitten. The teacher probed to ensure all students understood the symbolic representation by asking the student, “Why 12 in the denominator?” The students responded that a year is divided into 12 months, and Ms.
W said this was the whole they needed to use for the rest of the lesson. Later on, students colored in or marked on their hundreds chart the gender of the animal and whether it was a cat or kitten while determining percentages as well. Students came to the realization that if their male and female cat percentages did not total 100%, then they must have “counted incorrectly since there were 100 cats … or a cat could not be male and female at the same time.” These realizations of the representations made sense to the students rather than memorizing “percent means out of 100.”
Discussion and Educational Importance
The importance of TQMs (Kelly & Lesh, 2000) has and will continue to increase as long as minimal skills testing is the benchmark or proxy measure for teaching competencies. Good and Brophy (2003) outlined nearly 100 topics, and all were TQMs. We believed many of the TQMs proposed in the book might be completely confounded. When we talk about confounded, we intend it as Schlesselman (1978) discussed it. Thus the confounding can be positively or negatively correlated. Essentially, in this case, we believe that many of these proposed TQMs might account for the exact same variance in any given model, therefore, necessitating further work to establish a parsimonious model.
For instance, when teachers are asking and responding to questions, they are proactively engaging students, stimulating motivation, and providing a context for group and individual learning. It might be possible for a response scoring high in one category to be rated low in another category. From our study, we learned that the complexities of the classroom do not defy explanation; rather, research should be closely focused to explore very specific and clearly defined issues. Although myriad combinations of TQMs could have been selected, our purpose was to understand how the selected TQMs unfolded in two middle school mathematics classrooms dealing with rational numbers. Our goal was to describe the interactions tied to the TQMs and to determine if there were measurable implications. The students of Ms. W, who used a greater proportion of TQMs in two of the three categories, outperformed Teacher H’s students on the post-test in the second year. One implication of this is that the TQMs of probing for understanding and encouraging curiosity may account for some of the variation in the performance observed in these students’ performance on the number test. It also can imply that the use of representations may not be critically important, or at least not as important as the combined effect of the

RMLE Online— Volume 34, No. 4
© 2010 National Middle School Association 14
other two TQMs. It is hard to disentangle this effect, but the speculation can lead to testing new theory and the importance of representations alone.
Some in the mathematics education community may feel that more open and less didactic teaching does not yield measurable differences on minimal skills tests. When teachers are engaged in more open, less didactic teaching activities, our results clearly indicate improvements on the number test when controlling for prior performances. Gain scores from the state minimal skills test were positive when controlling for prior performance, indicating that students experienced some improvement in their rate of learning. When controlling for prior performance, one would expect a zero-gain score, meaning no difference between students’ projected performance and their realized performance.
Accurately using representations accounted for the greatest variance while probing for student understanding, and encouraging curiosity and questioning were nearly equal. Therefore, it seems clear that these TQMs in these two middle grades mathematics classrooms supported mathematics teaching and learning. This finding does not mitigate or marginalize any other proposed, enacted, or theorized TQM. Because many TQMs have not yet been tested, it is possible they can yield greatly differing results. In fact, it is possible different results may be obtained for the tested TQMs depending on content and grade level. Although the two teachers differed in their manifestations of the TQMs, we feel the uses by the two teachers interject important variance into the model and facilitate analysis. Regardless, there is a positive relationship between the TQMs, as measured, and student achievement.
When teachers in this study employed these TQMs, their students demonstrated improvement on a specifically designed number test. Although this test is similar in some respects to state minimal skills tests, it also includes more open items and requires a greater level of conceptual understanding. The students of these teachers showed a higher level of conceptual development than is measured by the state minimal skills test. From our data, we cannot determine the exact mix or quantity of any of the TQMs that will precipitate this effect; this should be left as a randomized control design, but we can report the appearance of a relationship between TQMs and student achievement. We also are reflective that the optimal mix or quantity of TQMs may be dependent on some interaction of child development, teacher content knowledge, and specific content being taught.
Explicitly engaging students to determine their depth of understanding can have multiple realized effects (Arlo & Skovsmose, 1998). When teachers develop a pattern of responses that students eventually recognize, students may be more inclined to apply additional effort (Carpenter & Lehrer, 1999). For instance, when students become accustomed to the teacher supplying answers to her own questions, the students often fail to engage (Myhill & Dunkin, 2005). Perhaps when teachers regularly challenge students’ thinking, regardless if their original response is correct or incorrect, students may readily engage (cf. Edwards & Mercer, 1987). Then, if students are more engaged, it is possible that this negates the need to spend a great deal of time on other teaching tasks.
In a step beyond the general understanding of encouraging curiosity and questioning (National Research Council, 2001a, 2001b), and as an outgrowth of its application to problem posing (Knuth, 2002), it may be more a direct measure of the teacher’s competence. When teachers engage in encouraging curiosity and questioning about a subject, this may be more about the teacher and his or her level of competence and comfort in the content than a simple pedagogical technique. Arguably, one must know a great deal about a subject to engage in such risk-taking behaviors as opening up the topic based on student curiosity. The avenue can be tangential to the topic, and if one has superficial understanding, then any tangential diversion can make the teacher feel threatened and fear losing credibility with the students. For the teacher to encourage questioning about the topic, the teacher must feel confident to address the questions that arise when students see a discontinuity in what they have learned. Therefore, this criterion may be evident and measurable only in those teachers who exhibit a relatively high level of comfort with the content they are teaching. Perhaps this explains why the highest overall correlation was between encouraging curiosity and questioning and probing for understanding.
It would seem that if this relationship actually measures a teacher’s level of content competence, then it is reasonable that a positive correlation exists between this and probing for understanding, because a teacher with a weaker content competence might engage less in probing for understanding for fear of finding oneself in unfamiliar territory. Further exploration of these TQMs and others is warranted; however, our analysis has illustrated the relationship among these TQMs and the positive relationships with student achievement.

RMLE Online— Volume 34, No. 4
© 2010 National Middle School Association 15
References
American Association for the Advancement for Science. (2006). Middle grades mathematics textbook evaluation. Retrieved from http://www.project2061.org/tools/textbook/matheval
American Association for the Advancement for Science. (1993). Benchmarks for science literacy. New York: Oxford Press.
Andrews, P. G., Caskey, M. M., & Anfara, V. A., Jr. (2007). Research summary: Characteristics of exemplary schools for young adolescents. Retrieved from http://www.nmsa.org/Research/ResearchSummaries/ExemplarySchools/tabid/256/Default.aspx
Arlo, H., & Skovsmose, O. (1998). That was not the intention! Communication in mathematics education. For the Learning of Mathematics, 18(2), 42–51.
Ball, D. L., & Osborne, M. D. (1998). Teaching with difference: A response to Angela Calabrese Barton. Teaching science with homeless children: Pedagogy representation and identity. Journal of Research in Science Teaching, 35, 395–397.
Balzer, A. L., Evans, T. P., & Blosser, P. E. (1973). A review of research on teacher behavior relating to science education. Association for the education of teachers of science. Columbus, OH: ERIC Information Analysis Center for Science, Mathematics, and Environmental Education.
Beatty, P. (2004). The dynamics of cognitive interviewing. In S. Presser, J. M. Rothgeb, M. P. Couper, J. T. Lessler, E. Martin, E. Singer (Eds.), Methods for testing and evaluating survey questionnaires (pp. 45–66). New York: Wiley.
Biggs, J. B., & Collis, K. F. (1991). Multimodal learning and the quality of intelligent behaviour. In H. Rowe (Ed.), Intelligence: Reconceptualisation and measurement (pp. 57–76). Hillsdale, NJ: Erlbaum.
Blanton, M., & Kaput, J. (2000, October). Generalization and progressively formalizing in a third-grade mathematics classroom: Conversations about even and odd numbers. In M. L. Fernandez (Ed.), Proceedings of the 22nd annual meeting of the North American Chapter of the International Group for the Psychology of Mathematics Education (Vol. 1, pp. 115–119). Columbus, OH: The ERIC Clearinghouse for Science, Mathematics, and Environmental Education.
Brophy, J. E., & Good, T. L. (1997). Looking in classrooms. New York: Longman.
Bulgar, S., Schorr, R. Y., & Maher, C. A. (2002, July). Teachers’ questions and their role in helping students build an understanding of division of fractions. In A. D. Cockburn & E. Nardi (Eds.), International group for the psychology of mathematics education: PME 26, University of East Anglia, 21–26 Norwich UK: Proceedings (pp. 161–168). Norwich: School of Education and Professional Development, University of East Anglia.
Buzzelli, C. A. (1996). The moral implications of teacher-child discourse in early childhood classes. Early Childhood Research Quarterly, 11, 515–534.
Carpenter, T. P., & Lehrer, R. (1999). Teaching and learning mathematics with understanding. In E. Fennema & T. A. Romberg (Eds.), Mathematics classrooms that promote understanding (pp. 19–32). Mahwah, NJ: Erlbaum.
Capraro, R. M., & Capraro, M. M. (2004, February). Looking at representations through the eyes of middle grades students and their teachers. Paper presented at the annual meeting of the Research Council on Mathematics Learning, Oklahoma City, OK.
Capraro, R. M., Willson, V., Capraro, M. M., & Wilson, L. (2004, April). Effects of curriculum variation on structure in middle school mathematics. Paper presented at the annual meeting of the American Educational Research Association. San Diego, CA
Cazden, C. (2001). Classroom discourse: The language of teaching and learning (2nd ed.). Portsmouth, NH: Heinemann.
Collis, K. F., & Biggs, J. B. (1991). Developmental determinants of qualitative aspects of school learning. In G. Evans (Ed.), Learning and teaching cognitive skills. Melbourne, Australia: ACER.
Darling-Hammond, L. (2000). Teacher quality and student achievement: A review of state policy and evidence. Education Policy Analysis Archives, 8(1). Retrieved from http://olam.ed.asu.edu/epaa/v8n1/
Davey, B., & McBride, S. (1986). Effects of question-generation training on reading comprehension. Journal of Educational Psychology, 78, 256–262.
Day, H. I. (1982). Curiosity and the interested explorer. Performance and Instruction, 21(4), 19–22.

RMLE Online— Volume 34, No. 4
© 2010 National Middle School Association 16
Denzin, N. K., & Lincoln, Y. S. (Eds.). (2000). Handbook of qualitative research (2nd ed.). Thousand Oaks, CA: Sage.
Donovan, S., & Bransford, J. (Eds.). (2005). How students learn: Mathematics in the classroom. Washington, DC: National Academies Press.
Dori, Y. J., & Herscovitz, O. (1999). Question-posing capability as an alternative evaluation method: Analysis of an environmental case study. Journal of Research in Science Teaching, 36, 411–430.
Edwards, D., & Mercer, N. (1987). Common knowledge: The development of understanding in the classroom. London: Methuen.
Empson, S. B. (2003). Low-performing students and teaching fractions for understanding: An interactional analysis. Journal for Research in Mathematics Education, 34, 305–343.
Gazzaniga, M. S. (2005). The ethical brain. Washington, DC: Dana Press.
Goldhaber, D., & Anthony, E. (2004). Can teacher quality be effectively assessed? Unpublished manuscript.
Goldin, G. A., & Kaput, J. J. (1996). A joint perspective on the idea of representation in learning and doing mathematics. In L. P. Steffe, P. Nesher, P. Cobb, G. A. Goldin, & B. Greer (Eds.), Theories of mathematical learning (pp. 397–430). Mahwah, NJ: Erlbaum.
Goldin, G., & Shteingold, N. (2001). Systems of representations and the development of mathematical concepts. In A. Cuoco & F. R. Curcio (Eds.), The roles of representation in school mathematics: 2001 Yearbook (pp. 1–23). Reston, VA: National Council of Teachers of Mathematics.
Good, T. L., & Brophy, J. E. (2003). Looking in classrooms (9th ed.). New York: Allyn & Bacon.
Greeno, J. G., & Hall, R. P. (1997). Practicing representation. Phi Delta Kappan, 78, 361–67.
Hamm, J. V., & Perry, M. (2002). Learning mathematics in first-grade classrooms: On whose authority? Journal of Educational Psychology, 94, 126–137.
Harper, K. A., Etkina, E., & Lin, Y. (2003). Encouraging and analyzing student questions in a large physics course: meaningful patterns for instructors. Journal of Research in Science Teaching, 40, 776–791.
Hiebert, J., & Carpenter, T. P. (1992). Learning and teaching with understanding. In D. A. Grouws (Ed.), Handbook of research on mathematics teaching and learning (pp. 65–97). New York: Macmillan.
Hiebert, J., & Wearne, D. (1986). Procedures over concepts: The acquisition of decimal number knowledge. In J. Hiebert (Ed.), Conceptual and procedural knowledge: The case of mathematics (pp. 199–223). Hillsdale, NJ: Erlbaum.
Horsley, M., & Walker, M. (2003). Video based classroom observation systems for examining the use and role of textbooks and teaching materials in learning. Bratislava, Czech: International Association for Research on Textbooks and Educational Media.
Hufferd-Ackles, K., Fuson, K., & Sherin, M. (2004). Describing levels and components of a math talk learning community. Journal for Research in Mathematics Education, 35, 81–116.
Jacobs, J. K., Kawanaka, T. K., & Stigler, J. W. (1999). Integrating qualitative and quantitative approaches to the analysis of video data on classroom teaching. International Journal of Educational Research, 31, 717–724.
Jackson, A. W., & Davis, G. A. (2000). Turning points 2000: Educating adolescents in the 21st century. New York & Westerville, OH: Teachers College Press & National Middle School Association.
Johnson, K. M., Gutkin, T. B., & Plake, B. S. (1991). Use of modeling to enhance children’s interrogative strategies. Journal of School Psychology, 29, 81–88.
Johnson, R. B., & Onwuegbuzie, A. J. (2004). Mixed methods research: A research paradigm whose time has come. Educational Researcher, 33(7), 14–26.
Kashdan, T. B., & Roberts, J. E. (2004). Trait and state curiosity in the genesis of intimacy: Differentiation from related constructs. Journal of Social and Clinical Psychology, 23, 792–816.
Kelly, A. E., & Lesh, R. (Eds.). (2000). Handbook of research design in mathematics and science education. Mahwah, NJ: Erlbaum.
King, A. (1989). Effects of self-questioning training on college students’ comprehension of lectures. Contemporary Educational Psychology, 14, 366–381.
King, A. (1991). Effects of training in strategic questioning on children’s problem solving performance. Journal of Educational Psychology, 83, 307–317.
Knuth, E. J. (2002). Fostering mathematical curiosity. Mathematics Teacher, 95, 126–130.

RMLE Online— Volume 34, No. 4
© 2010 National Middle School Association 17
Le, V. N., Stecher, B. M., Lockwood, J. R., Hamilton, L., Robyn, A., Williams, V. L., … Klein, S. P. (2006). Improving mathematics and science education: A longitudinal investigation between reform-oriented instruction and student achievement. Santa Monica, CA: Rand Corporation.
Lincoln, Y. (2001). Varieties of validity: Quality in qualitative research. In J. Smart & W. Tierny (Eds.), Higher education: Handbook of theory and research (pp. 25–72). New York: Agathon.
Litman, J. A., & Spielberger, C. D. (2003). Measuring epistemic curiosity and its diversive and specific components. Journal of Personality Assessment, 80, 75–86.
Marbach-Ad, G., & Sokolove, P. G. (2000). Can undergraduate biology students learn to ask better questions? Journal of Research in Science Teaching, 37, 854–870.
Marsh, C. (1999). How to encourage museum visitors to ask questions: An experimental investigation. Informal Learning Review, 39, 1, 4–5.
Martinello, M. L. (1998). Learning to question for inquiry. The Educational Forum, 62, 164–171.
Martino A. M., & Maher C. A. (1999). Teacher questioning to promote justification and generalization in mathematics: What research practice has taught us. Journal of Mathematical Behavior, 18, 53–78.
Maw, E. W., & Maw, W. H. (1964). An exploratory study into the measurement of curiosity in elementary school children. Cooperative Research Project No. 801. Newark, DE: University of Delaware. (ERIC Document Reproduction Service No. ED002940)
Mehan, H. (1979). Learning lessons: Social organization in the classroom. Cambridge, MA: Harvard University Press.
Myhill, D., & Dunkin, F. (2005). Questioning learning. Language and Education, 19, 415–427.
Nardi, E., & Steward, S. (2003). Is mathematics T.I.R.E.D.? A quiet disaffection in the secondary mathematics classroom. British Education Research Journal, 29, 345–367.
National Association of Secondary School Principals. (2006). Breaking ranks in the middle: Strategies for leading middle level reform. Reston, VA: Author.
National Association of State Directors of Teacher Education and Certification. (1994). NASDTEC outcome-based standards and portfolio assessment: Outcome-based teacher education standards for the elementary, middle, and high school levels. Mashpee, MA: Author.
National Council of Teachers of Mathematics. (2000). Principles and standards for school mathematics. Reston, VA: Author.
National Council of Teachers of Mathematics. (1991). Professional standards for teaching mathematics. Reston, VA: Author.
National Forum to Accelerate Middle-Grades Reform. (2007). Schools to watch criteria. Champaign, IL: Author. Retrieved from http://www.schoolstowatch.org/what.htm
National Middle School Association. (2010). This we believe: Keys to educating young adolescents. Westerville, OH: Author.
National Research Council. (2001a). Educating teachers of science, mathematics, and technology. Washington, DC: National Academy Press.
National Research Council. (2001b). Adding it up: Helping children learn mathematics. Washington, DC: National Academy Press.
Nye, B., Konstantopoulos, S., & Hedges L. V. (2004). How large are teacher effects? Educational Evaluation and Policy Analysis, 26, 237–257.
Raudenbush, S. (2004). Hierarchical linear models, applications and data analysis methods (2nd ed.). Thousand Oaks, CA: Sage.
Reio, T. G., Jr., Petrosko, J. M., Wiswell, A. K., & Thongsukmag, J. (2006). The measurement and conceptualization of curiosity. The Journal of Genetic Psychology, 167(2), 117–135.
Rice, J. (2003). Teacher quality: Understanding the effectiveness of teacher attributes. Washington, DC: Economic Policy Institute.
Schlesselman, J. J. (1978). Assessing the effects of confounding variables. American Journal of Epidemiology, 108, 3–8.
Shann, M. (2006). Evaluation of an interdisciplinary, problem solving curriculum in elementary science and mathematics. Science Education 61, 491–502.
Wagner, R. K., & Parker, E. L. (1993). Reasoning about social and practical matters. In D. K. Detterman (Ed.), Individual differences and cognition. Current topics in human intelligence, Vol. 3 (pp. 241–257). Westport, CT: Ablex.
RMLE Online— Volume 34, No. 4
© 2010 National Middle School Association 18
Wayne, A. J., & Youngs, P. (2003). Teacher characteristics and student achievement gains: A review. Review of Educational Research, 73(1), 89–122.
Weiss, I. R., & Pasley, J. D. (2004). What is high-quality instruction? Educational Leadership, 61, 24–28.
Wood, T., Cobb, P., & Yackel, E. (2000). Reflections on learning and teaching mathematics in elementary school. In L. Steffe & J. Gale (Eds.), Constructivism in education (pp. 401–422). Mahwah, NJ: Erlbaum.
Wright, S. P., Horn, S. P., & Sanders, W. L. (1997). Teacher and classroom context effects on student achievement: Implications for teacher evaluation. Journal of Personnel Evaluation in Education, 11, 57–67.
Author’s NoteMary Margaret Capraro is an Assistant Professor of Mathematics Education at Texas A&M University. Her research interests include teacher beliefs about mathematics and cultural influences on mathematics achievement. Robert M. Capraro is a Professor of Mathematics Education at Texas A&M University with research interests in equity and the factors influencing mathematics achievement. Tamara A. Carter is a Professor of Mathematics at Oklahoma City Community College with research interests in teaching and learning in mathematics content courses. Adam Harbaugh is an Assistant Professor of Mathematics Education at University of North Carolina Charlotte with interests in classroom communications and learner-centered instruction.
Correspondence can be sent to first author at 4232 TAMU, Department of Teaching, Learning, and Culture, College Station, TX 77843-4232 (e-mail [email protected]).

RMLE Online— Volume 34, No. 4
© 2010 National Middle School Association 19
Appendix
Example of Coding Artifact
Time Stamp
Respect student ideas Comments
0:53:00 00:53:20 2 Keep going. Y'all are doing good.0:53:40 2 How did you get these answers here?0:54:00 2 Have you talk to your partner about that?0:54:20 00:54:40 x0:55:00 10:55:20 2 Suzanna, please share with us your answer to letter a.
0:55:40 2And please remember that your answer differs from Suzanna's, that we need to be respectful in the way we say that.
0:56:00 x
0:56:20 2So I see you had 53 hundredths and you went ahead and wrote 53% … 53 hundredths as a decimal, very nice.
0:56:40 1Raise your hand if you got 53 hundredths … Raise your hand if you got a different answer you would like to share.
0:57:00 20:57:20 20:57:40 20:58:00 00:58:20 10:58:40 10:59:00 2 Nice job Suzanna … You did a great job.
0:59:20 2 What fraction … Kelsey, would you do that for us please.0:59:40 11:00:00 2