Embed Size (px)
Citation preview

Understanding Taxes

A primary reason to organize ourselves as cities is to foster a sense of community and belonging
Most goals around which we form governments are to provide benefits that are difficult to achieve as individuals or through private businesses
Who would build our roads, raise our armies, or provide our parks if we did not collectively do it?
It is important to assure that government activities add to the greater public good and are balanced to serve major needs of all segments of society within our ability to pay

Municipalities rarely engage in some activities, such as welfare, education, and building highways, because they are the responsibility of other entities.
Towns and cities provide many of the remaining services, including most of the services that directly affect our daily lives.


We HAVE to pay for government services, and we mostly do so through taxes
We pay taxes whether or not we want/use the services they fund
The degree to which we think government ought to provide more/fewer services is a primary reason for voter choices
Cities can bond (borrow) to pay for infrastructure improvements, but must budget repayment, and must have a balanced budget

Only the federal government can spend more than it collects in taxes, creating debt that must be paid by future citizens
The national debt is now about $11,308,127,000,000 – each US citizen owes about $37,000
This figure is up 10% in just the last 6 months, and is scheduled to rise by another 15-20% with planned federal stimulus expenditures this year


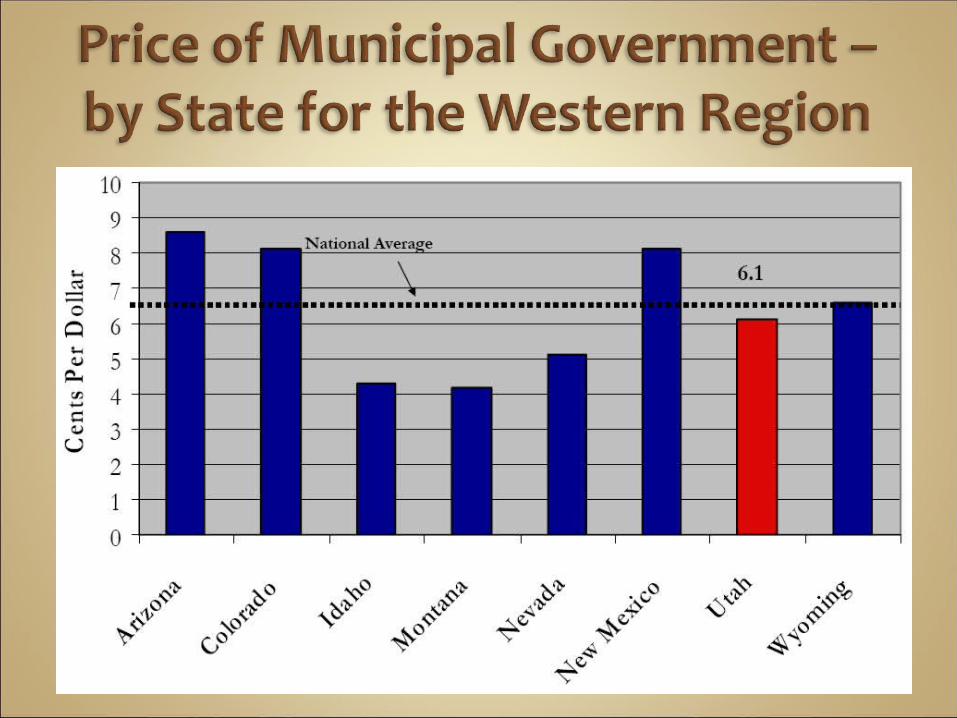
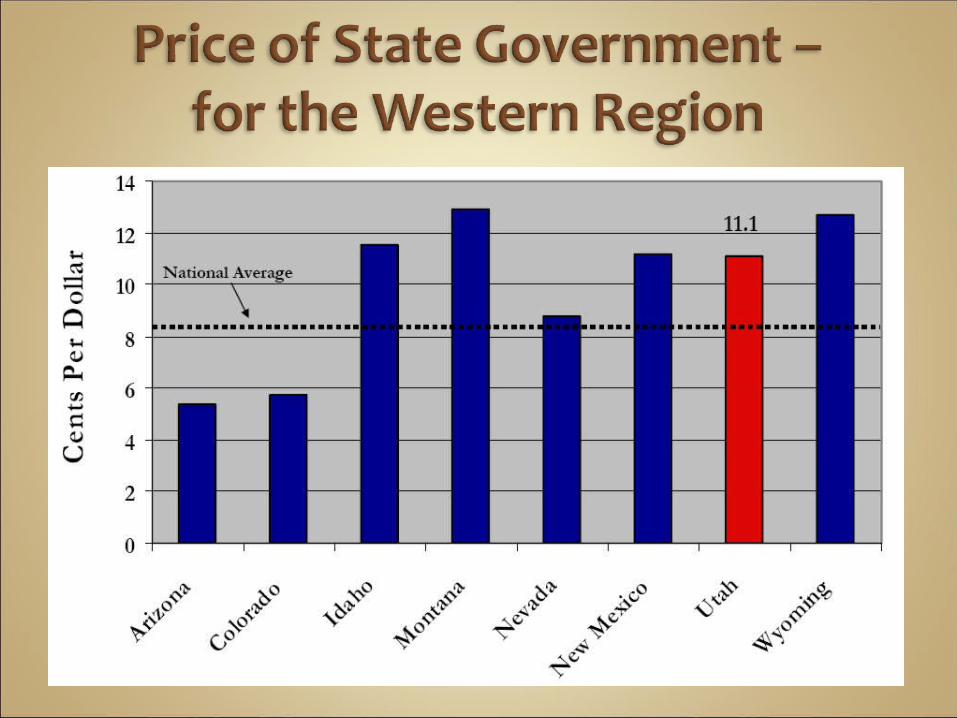

Be careful about making comparisons
Circumstances differ across locals:
The primary reason Utah has somewhat higher state taxes is a much larger than average birth rate. Aside from much higher than average costs for public education, Utah governmental costs are below average. In fact, our per-student expenditures are among the lowest in the nation.
Differences also arise because of choices about adequacy, affordability, and competitiveness.
Cities try to provide what their citizens want and are willing to pay for

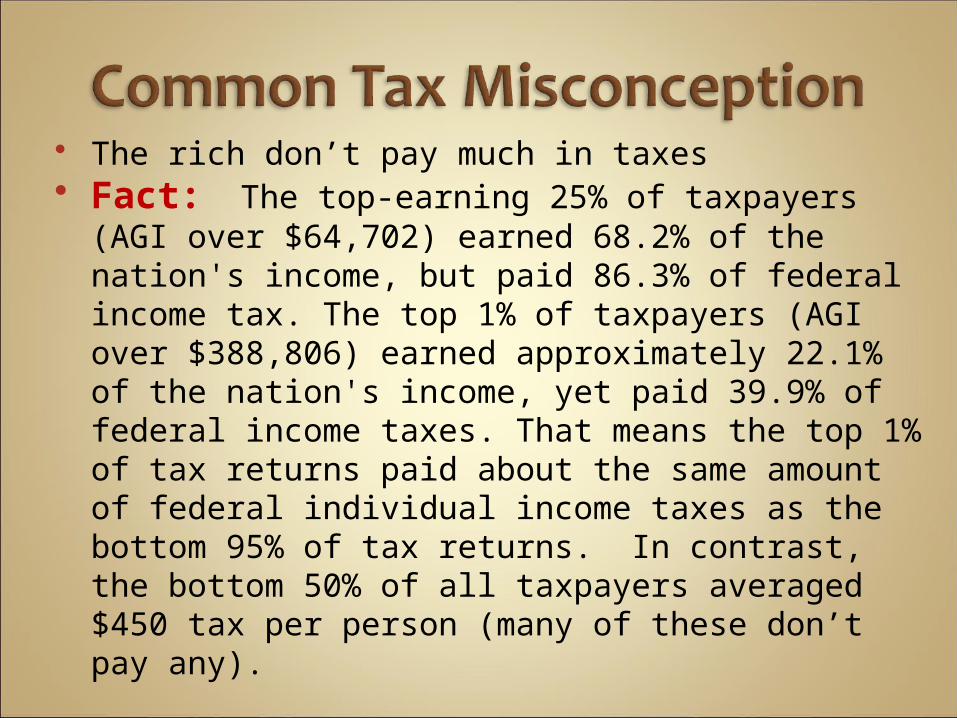
The rich don’t pay much in taxes Fact: The top-earning 25% of taxpayers (AGI
over $64,702) earned 68.2% of the nation's income, but paid 86.3% of federal income tax. The top 1% of taxpayers (AGI over $388,806) earned approximately 22.1% of the nation's income, yet paid 39.9% of federal income taxes. That means the top 1% of tax returns paid about the same amount of federal individual income taxes as the bottom 95% of tax returns. In contrast, the bottom 50% of all taxpayers averaged $450 tax per person (many of these don’t pay any).

Fallacy: 24% of surveyed citizens believe cities receive income tax revenue
Fact: Cities don’t collect income tax; in Utah all state income tax goes to public education
Fallacy: 40% believe the state receives property tax revenue
Fact: Depending upon the locale, about 55% of this tax goes to the local school district, 20% to the county, 15% to city
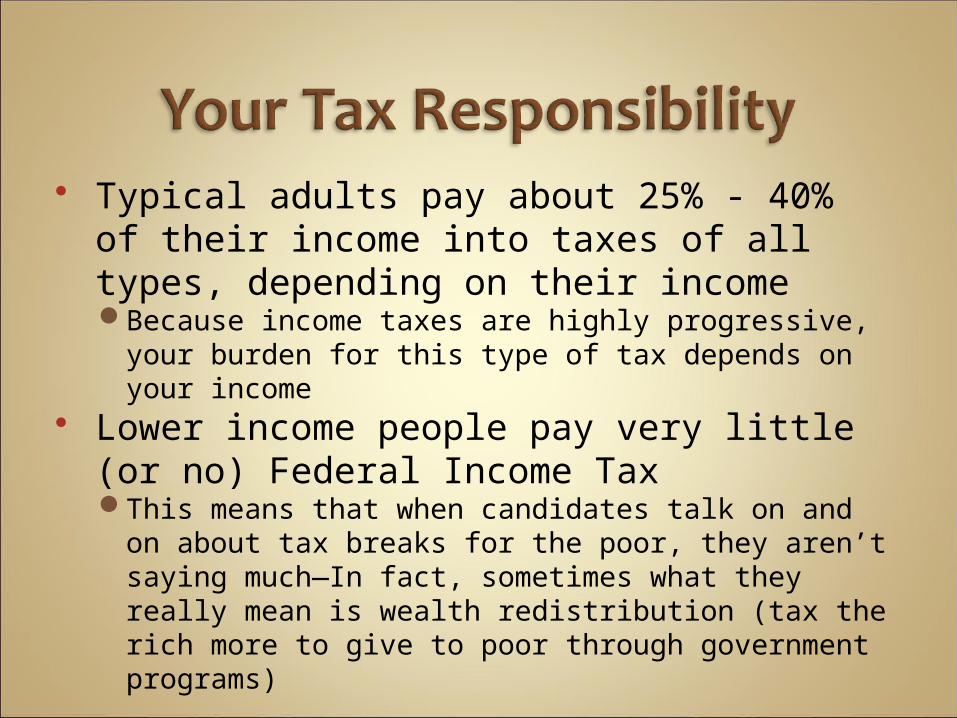
Typical adults pay about 25% - 40% of their income into taxes of all types, depending on their incomeBecause income taxes are highly progressive, your
burden for this type of tax depends on your income Lower income people pay very little (or
no) Federal Income TaxThis means that when candidates talk on and on
about tax breaks for the poor, they aren’t saying much—In fact, sometimes what they really mean is wealth redistribution (tax the rich more to give to poor through government programs)

In 2008, average Americans worked 74 days to pay their federal taxes and 39 more days to pay state and local taxes. Careful about “average”—remember that lower income
persons might pay off their entire federal income tax in 1 week of work or less
This means that an average American taxpayer pays 31% of annual income for all forms of taxation
Utah places about 20th among the states for tax burden (due to lots of kids and costs of educating them—without the extra burden of education, the ranking would be much lower)

Federal and state income taxUsually regarded as most progressive (rich pay more)
Ad valorem taxes (sales tax, tariffs, inheritance)Sales tax is usually regarded as most regressive (rich
pay more because they buy more, but poor pay proportionally more of their income)
Entitlements taxes (Social Security, Medicare)
Property tax Corporate and excise taxes
Often regarded as hidden taxes because the entities taxed pass on the cost to the consumer

*In recent years, the rate is starting to rise back up

In fact, the federal tax for most people was recently at its lowest rate in decades, although creeping back up in the last few years

Note: Remember that this is just income tax. The Federal budget includes other sources of income spent elsewhere, most notably Social Security and Medicare
*A little over half of debt is for past defense spending

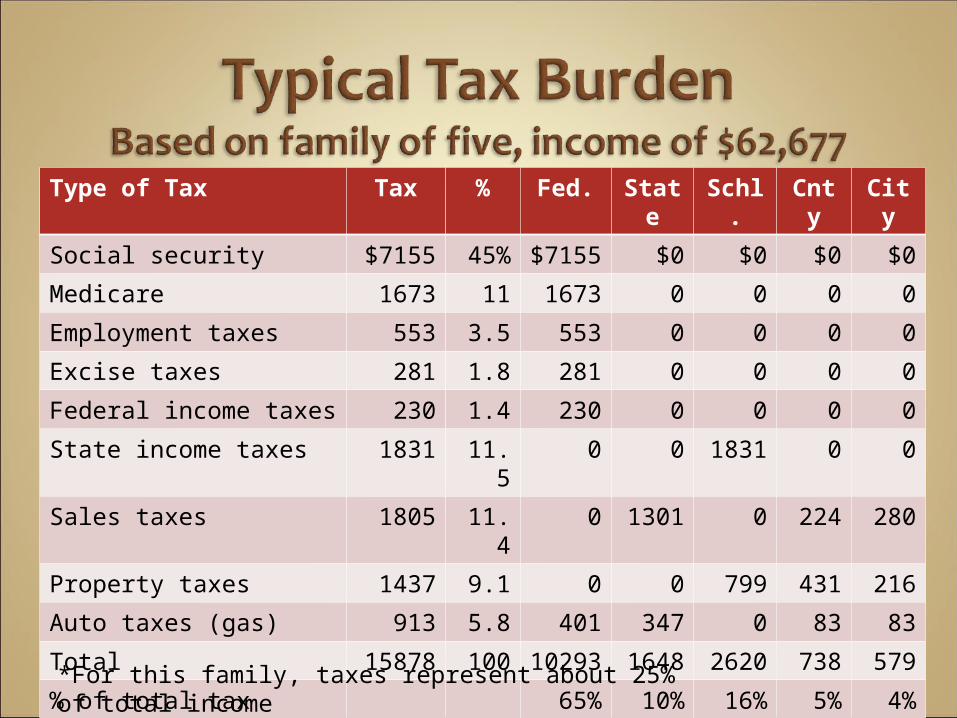
Type of Tax Tax % Fed. State
Schl.
Cnty
City
Social security $7155 45% $7155
$0 $0 $0 $0
Medicare 1673 11 1673 0 0 0 0
Employment taxes 553 3.5 553 0 0 0 0
Excise taxes 281 1.8 281 0 0 0 0
Federal income taxes 230 1.4 230 0 0 0 0
State income taxes 1831 11.5 0 0 1831 0 0
Sales taxes 1805 11.4 0 1301 0 224 280
Property taxes 1437 9.1 0 0 799 431 216
Auto taxes (gas) 913 5.8 401 347 0 83 83
Total 15878 100 10293
1648 2620 738 579
% of total tax 65% 10% 16% 5% 4%*For this family, taxes represent about 25% of total income

Whereas Federal tax rates are pretty stable, spending is growing rapidly
Entitlement programs are unsustainable without major tax increases
Huge debt will hamper our ability to solve our problems
Fortunately, our state and local governments are in much better shape, mostly because of cost containment and avoidance of entitlements


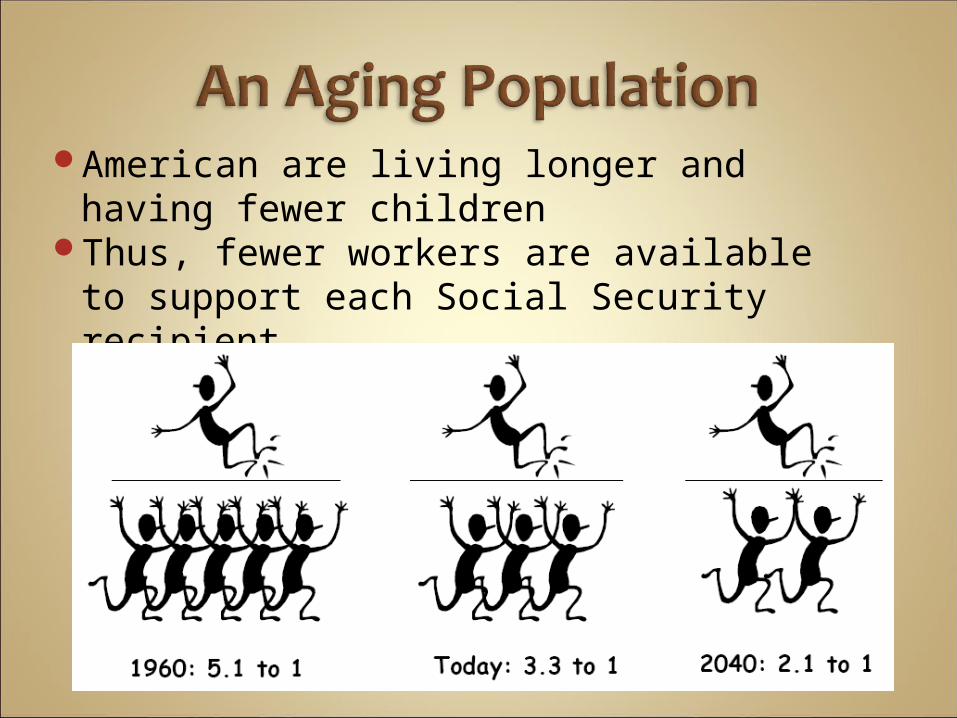
American are living longer and having fewer children
Thus, fewer workers are available to support each Social Security recipient


Our high birth rate and increasing longevity mean increased reliance on wage earners to support the young and old
Our movement towards a service-based economy means a growing proportion of our economy is exempt from municipal taxation
E-commerce generates no municipal taxation, and other technology reduces the need for real property (e.g., factories)
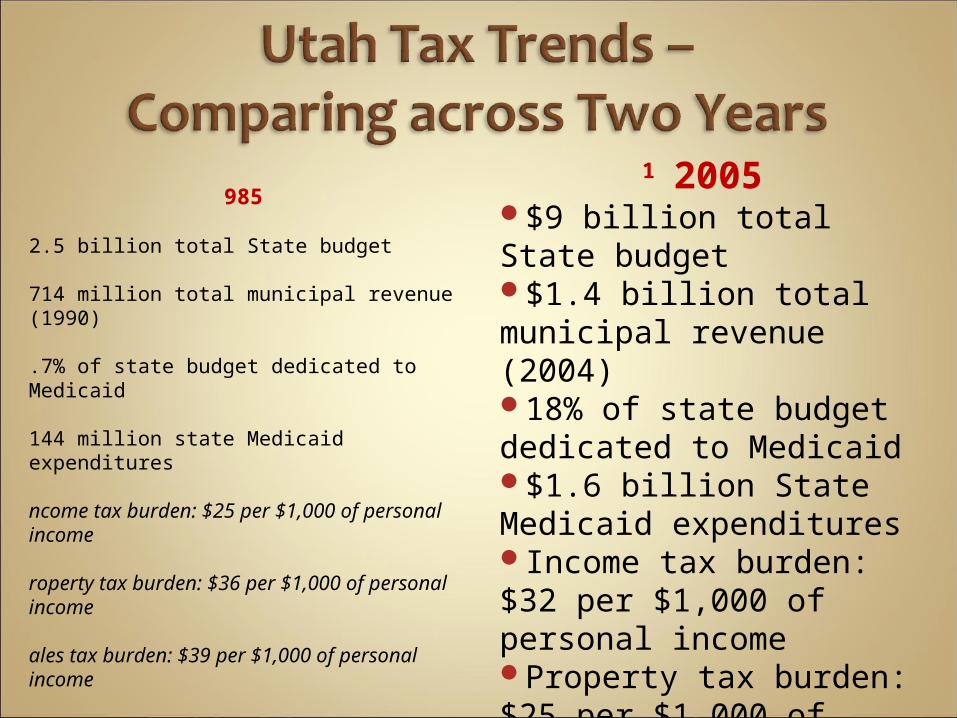
1985
$2.5 billion total State budget
$714 million total municipal revenue (1990)
7.7% of state budget dedicated to Medicaid
$144 million state Medicaid expenditures
Income tax burden: $25 per $1,000 of personal income
Property tax burden: $36 per $1,000 of personal income
Sales tax burden: $39 per $1,000 of personal income
2005$9 billion total State budget $1.4 billion total municipal revenue (2004)18% of state budget dedicated to Medicaid$1.6 billion State Medicaid expendituresIncome tax burden: $32 per $1,000 of personal incomeProperty tax burden: $25 per $1,000 of personal incomeSales tax burden: $35 per $1,000 of personal income

Although federal budgets face extreme challenges, municipal budgets have been relatively stable
However, the status quo is threatened for municipalities because (a) they have limited control over their own ability to maintain current taxation levels and (b) other government entities have overcommitted or postponed meeting their needs
In the last major tax overhaul (over 30 years ago), Utah developed a municipal tax structure where property taxes would mostly pay for all operating expenses and sales/use taxes would pay for capital improvements.

1. Simple – clear and easy to administer2. Fair – depends heavily on one’s
perspective3. Efficient – generates adequate revenue
with low administrative cost4. Stable – predictable revenue5. Transparent – open to citizens with
rational ties to services provided

Fact: In Utah, property taxes are a major source of funding for counties, cities, and schools only.


The county places a valuation on real property (homes, business, land)
The taxing entities (cities, counties, schools) set a tax rate
The tax is calculated by multiplying the assessed value by the tax rate (reduced by 45% for homes)
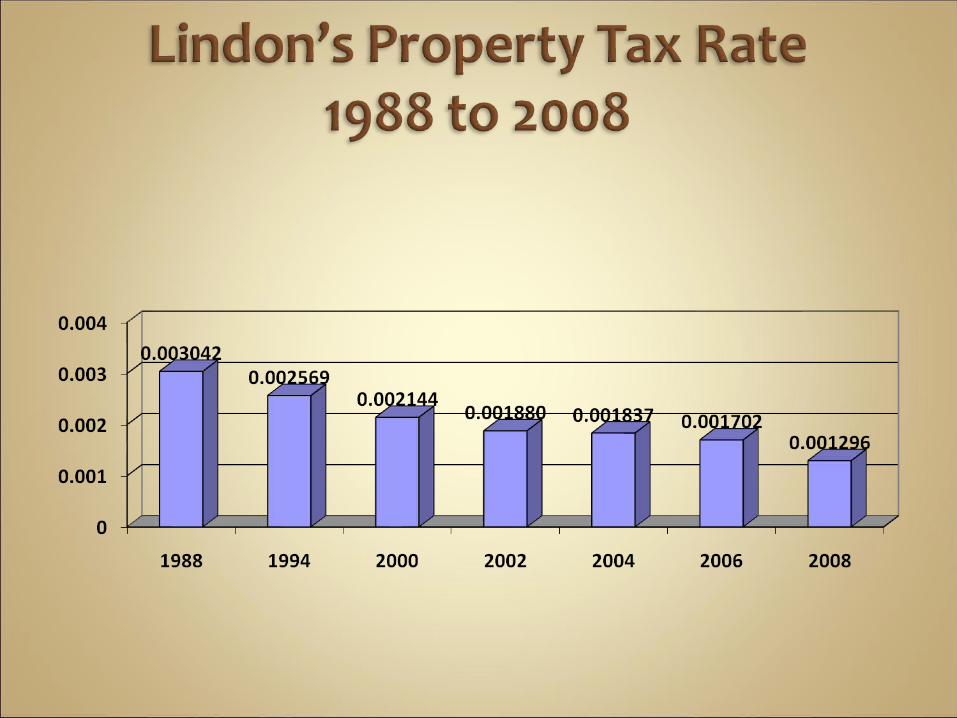
Lindon’s tax rate is currently .001296A home valued at $300,000 would have city
property tax of $214In Lindon, about 13% of your property tax is for
the city, 72% for the school district, and 15% for the county

An increase in the assessed value of a home does not mean property tax goes up
As assessed values go up, the tax rate goes down so that the same dollar amount of tax is assessed
A taxing entity must hold a “Truth in Taxation” hearing to adjust the tax rate
Because of inflation, the value of property taxes collected will steadily decline unless to taxing entity holds a hearing and raises the tax rate.
Lindon has not increased the tax rate for as long as we have records, so homeowners now have a much lower tax rate than they did years ago

As compared to other cities in Utah County, Lindon’s property tax rate is one of the lowest
Over just the last 10 years, the contribution of property tax to Lindon’s revenue has declined from 38% in 1998 to just 18% in 2007
Over time, the most stable source of municipal revenue will decline unless the city acts
Contrary to the intent of the state tax plan for municipalities, Lindon must now heavily subsidize its general operations from the sales tax


Utah’s ranking is now higher due to recent reduction in our tax on food and tax increases in other states

The sales tax in Lindon is 6.75%1% of this, goes to cities, 4.7% goes to the
state, .25% goes to the county, and the rest goes to county transportation funds
The 1% city portion is allocated in two ways:
Half goes to the city where the tax was generated Half goes into a general fund that is distributed to
all cities in the state based on population Because of this distribution formula, only about
60% of the municipal portion sales taxes generated in Lindon comes back to Lindon City
The recent economic downturn exposes the folly of becoming too dependent on sales tax from a period of economic boom
For the first quarter of 2009, Utah’s sales tax is down over 11%, 8th worst in the nation
Lindon’s sales tax decline is a bit worse than this state average
Good tax policy includes a variety of revenue sources, including the stability of property taxes and the growth ability of sales taxes
For more information:
Attend Lindon City budget hearings held each June, Request budget information from out City Treasurer,
or Look for detailed budget information to appear on-
line soon