Embed Size (px)
Citation preview
©U
NIC
EF/IN
DA
2011
-001
84/N
ikla
s H
alle
’n
Elementary Education
3
24 | ELEMENTARY EDUCATION
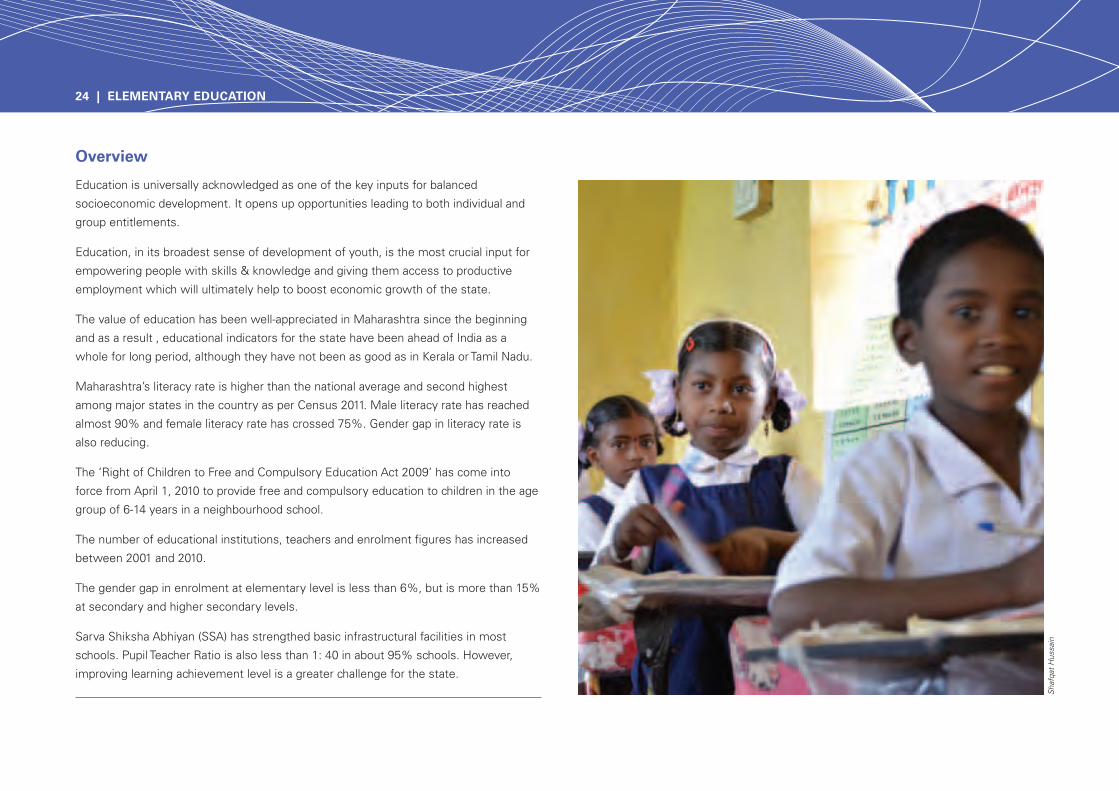
Overview
Education is universally acknowledged as one of the key inputs for balanced
socioeconomic development. It opens up opportunities leading to both individual and
group entitlements.
Education, in its broadest sense of development of youth, is the most crucial input for
empowering people with skills & knowledge and giving them access to productive
employment which will ultimately help to boost economic growth of the state.
The value of education has been well-appreciated in Maharashtra since the beginning
and as a result , educational indicators for the state have been ahead of India as a
whole for long period, although they have not been as good as in Kerala or Tamil Nadu.
Maharashtra’s literacy rate is higher than the national average and second highest
among major states in the country as per Census 2011. Male literacy rate has reached
almost 90% and female literacy rate has crossed 75%. Gender gap in literacy rate is
also reducing.
The ‘Right of Children to Free and Compulsory Education Act 2009’ has come into
force from April 1, 2010 to provide free and compulsory education to children in the age
group of 6-14 years in a neighbourhood school.
The number of educational institutions, teachers and enrolment figures has increased
between 2001 and 2010.
The gender gap in enrolment at elementary level is less than 6%, but is more than 15%
at secondary and higher secondary levels.
Sarva Shiksha Abhiyan (SSA) has strengthed basic infrastructural facilities in most
schools. Pupil Teacher Ratio is also less than 1: 40 in about 95% schools. However,
improving learning achievement level is a greater challenge for the state.
Shaf
qat H
ussa
in
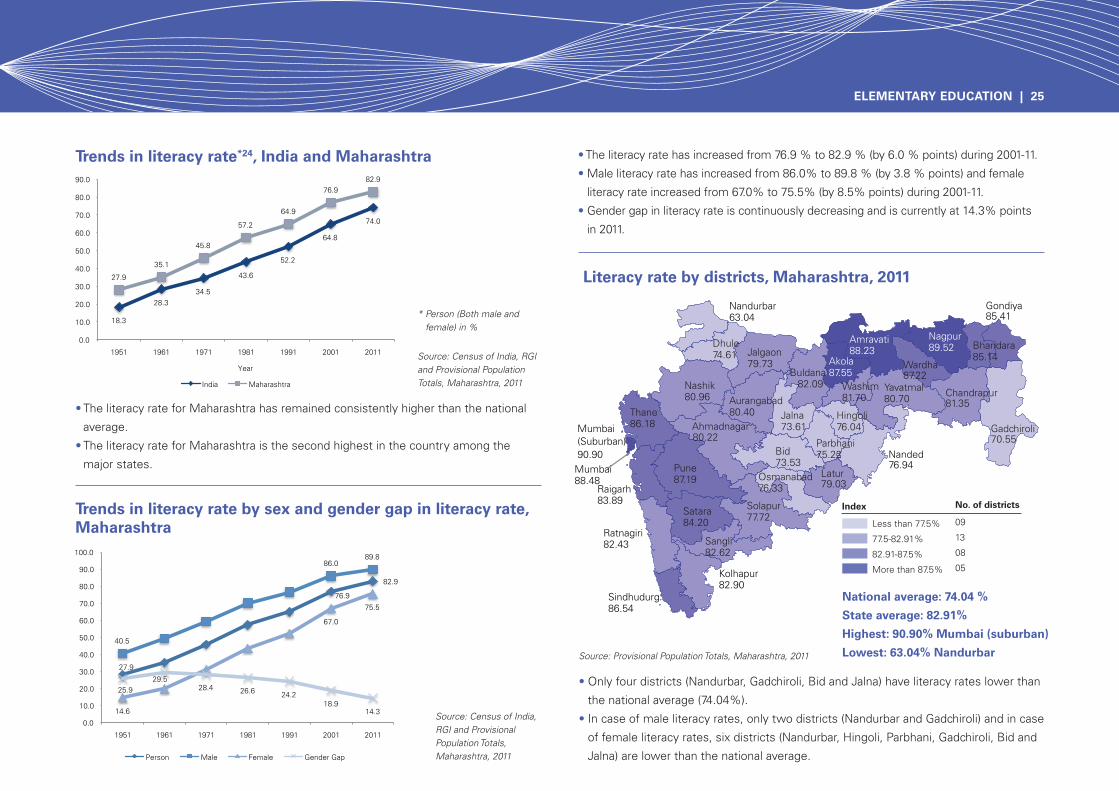
Index
Less than 77.5%
77.5-82.91%
82.91-87.5%
More than 87.5%
No. of districts
09
13
08
05
Source: Census of India, RGI and Provisional Population Totals, Maharashtra, 2011
Source: Census of India, RGI and Provisional Population Totals, Maharashtra, 2011
* Person (Both male and female) in %
• The literacy rate for Maharashtra has remained consistently higher than the national
average.
• The literacy rate for Maharashtra is the second highest in the country among the
major states.
• The literacy rate has increased from 76.9 % to 82.9 % (by 6.0 % points) during 2001-11.
• Male literacy rate has increased from 86.0% to 89.8 % (by 3.8 % points) and female
literacy rate increased from 67.0% to 75.5% (by 8.5% points) during 2001-11.
• Gender gap in literacy rate is continuously decreasing and is currently at 14.3% points
in 2011.
Trends in literacy rate*24, India and Maharashtra
Trends in literacy rate by sex and gender gap in literacy rate, Maharashtra
Source: Provisional Population Totals, Maharashtra, 2011
• Only four districts (Nandurbar, Gadchiroli, Bid and Jalna) have literacy rates lower than
the national average (74.04%).
• In case of male literacy rates, only two districts (Nandurbar and Gadchiroli) and in case
of female literacy rates, six districts (Nandurbar, Hingoli, Parbhani, Gadchiroli, Bid and
Jalna) are lower than the national average.
Literacy rate by districts, Maharashtra, 2011
National average: 74.04 %
State average: 82.91%
Highest: 90.90% Mumbai (suburban)
Lowest: 63.04% Nandurbar
ELEMENTARY EDUCATION | 25
Source: DISE, Maharashtra Prathmik Shiksha Parishad (MPSP), 2010-11
Source: DISE, MPSP, 2004-05 to 2010-11
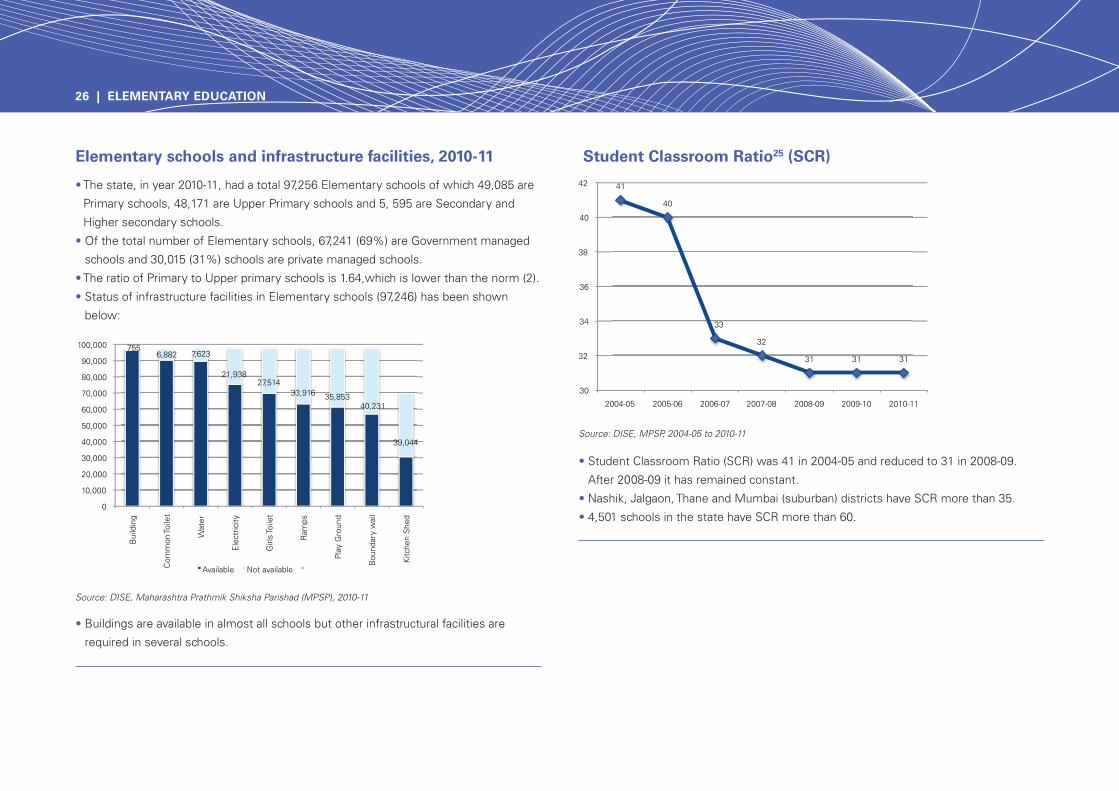
• The state, in year 2010-11, had a total 97,256 Elementary schools of which 49,085 are
Primary schools, 48,171 are Upper Primary schools and 5, 595 are Secondary and
Higher secondary schools.
• Of the total number of Elementary schools, 67,241 (69%) are Government managed
schools and 30,015 (31%) schools are private managed schools.
• The ratio of Primary to Upper primary schools is 1.64,which is lower than the norm (2).
• Status of infrastructure facilities in Elementary schools (97,246) has been shown
below:
• Student Classroom Ratio (SCR) was 41 in 2004-05 and reduced to 31 in 2008-09.
After 2008-09 it has remained constant.
• Nashik, Jalgaon, Thane and Mumbai (suburban) districts have SCR more than 35.
• 4,501 schools in the state have SCR more than 60.
• Buildings are available in almost all schools but other infrastructural facilities are
required in several schools.
Elementary schools and infrastructure facilities, 2010-11 Student Classroom Ratio25 (SCR)
26 | ELEMENTARY EDUCATION
Source : Annual reports, MHRD, Govt. of India
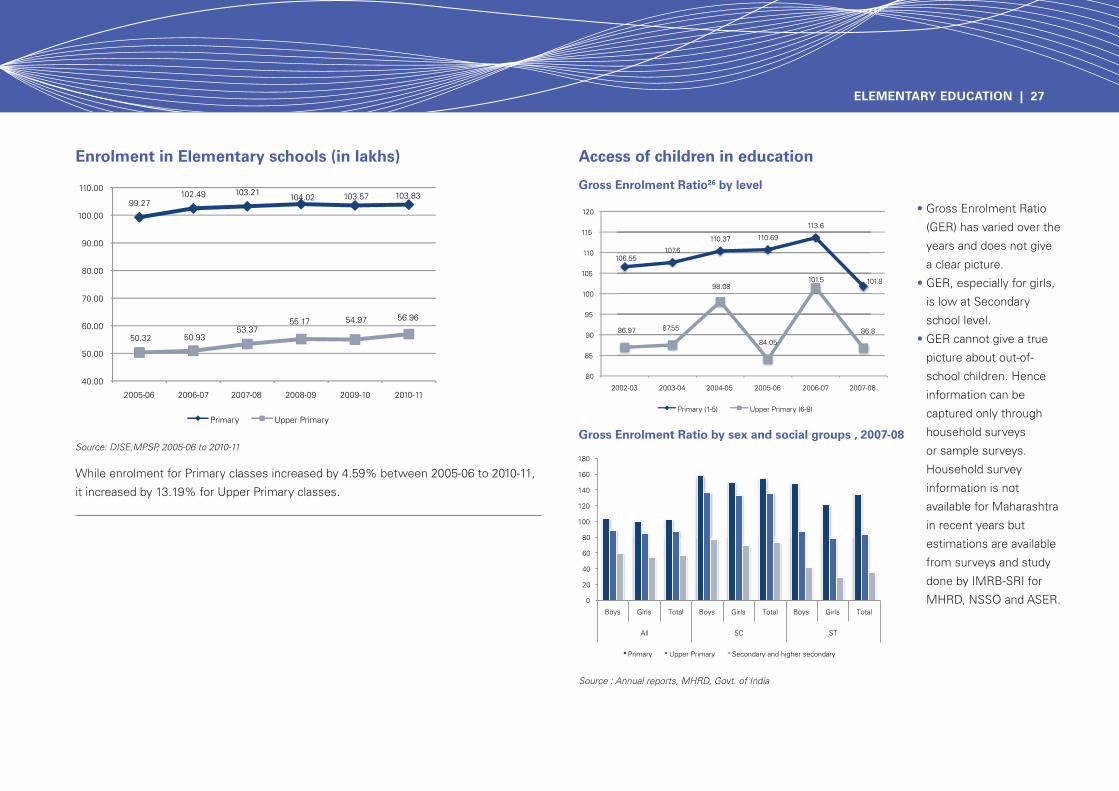
• Gross Enrolment Ratio
(GER) has varied over the
years and does not give
a clear picture.
• GER, especially for girls,
is low at Secondary
school level.
• GER cannot give a true
picture about out-of-
school children. Hence
information can be
captured only through
household surveys
or sample surveys.
Household survey
information is not
available for Maharashtra
in recent years but
estimations are available
from surveys and study
done by IMRB-SRI for
MHRD, NSSO and ASER.
Enrolment in Elementary schools (in lakhs) Access of children in education
Gross Enrolment Ratio by sex and social groups , 2007-08
Gross Enrolment Ratio26 by level
Source: DISE,MPSP, 2005-06 to 2010-11
While enrolment for Primary classes increased by 4.59% between 2005-06 to 2010-11,
it increased by 13.19% for Upper Primary classes.
ELEMENTARY EDUCATION | 27
Source: Out-of-School Children Survey, IMRB-SRI, 2009 for MHRD
Source: NSSO, 64th round survey report, 2007-08
Source: ASER reports from 2006 to 2010
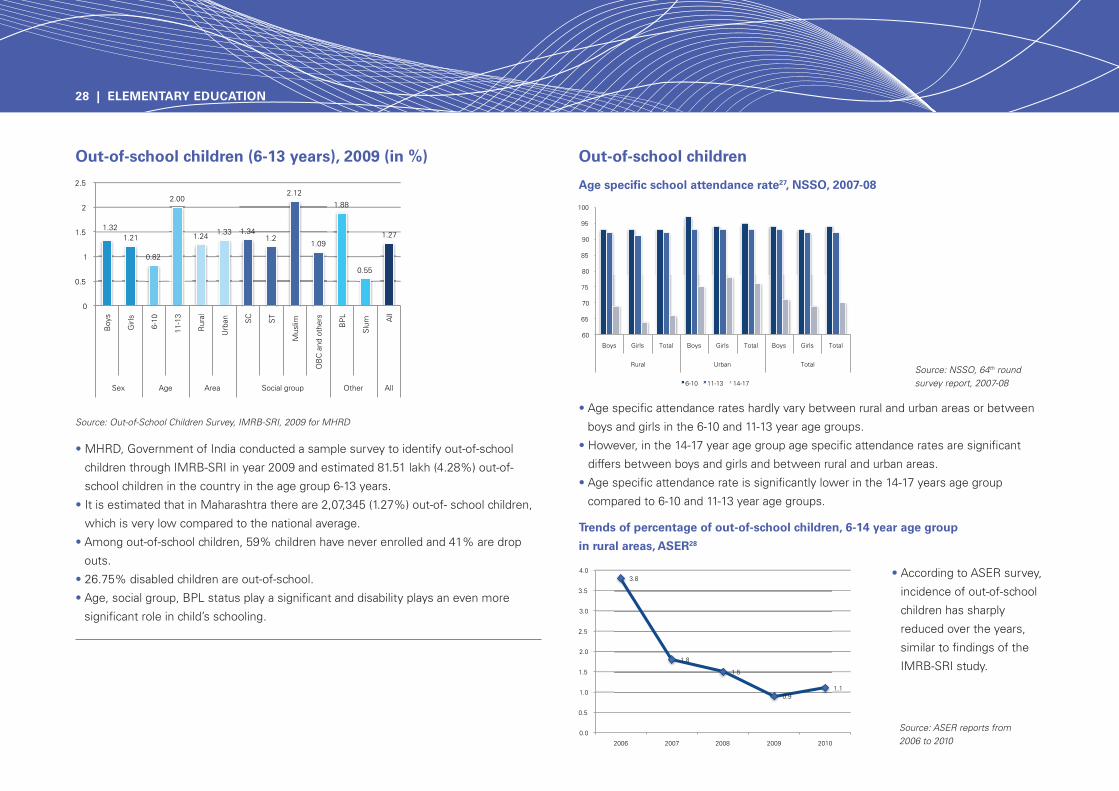
• MHRD, Government of India conducted a sample survey to identify out-of-school
children through IMRB-SRI in year 2009 and estimated 81.51 lakh (4.28%) out-of-
school children in the country in the age group 6-13 years.
• It is estimated that in Maharashtra there are 2,07,345 (1.27%) out-of- school children,
which is very low compared to the national average.
• Among out-of-school children, 59% children have never enrolled and 41% are drop
outs.
• 26.75% disabled children are out-of-school.
• Age, social group, BPL status play a significant and disability plays an even more
significant role in child’s schooling.
• Age specific attendance rates hardly vary between rural and urban areas or between
boys and girls in the 6-10 and 11-13 year age groups.
• However, in the 14-17 year age group age specific attendance rates are significant
differs between boys and girls and between rural and urban areas.
• Age specific attendance rate is significantly lower in the 14-17 years age group
compared to 6-10 and 11-13 year age groups.
• According to ASER survey,
incidence of out-of-school
children has sharply
reduced over the years,
similar to findings of the
IMRB-SRI study.
Out-of-school children (6-13 years), 2009 (in %)
Trends of percentage of out-of-school children, 6-14 year age group
in rural areas, ASER28
Out-of-school children
Age specific school attendance rate27, NSSO, 2007-08
28 | ELEMENTARY EDUCATION
Source: DISE, MPSP, Mumbai, 2004-05 to 2010-11
Source: DISE, MPSP, 2006-07 to 2010-11
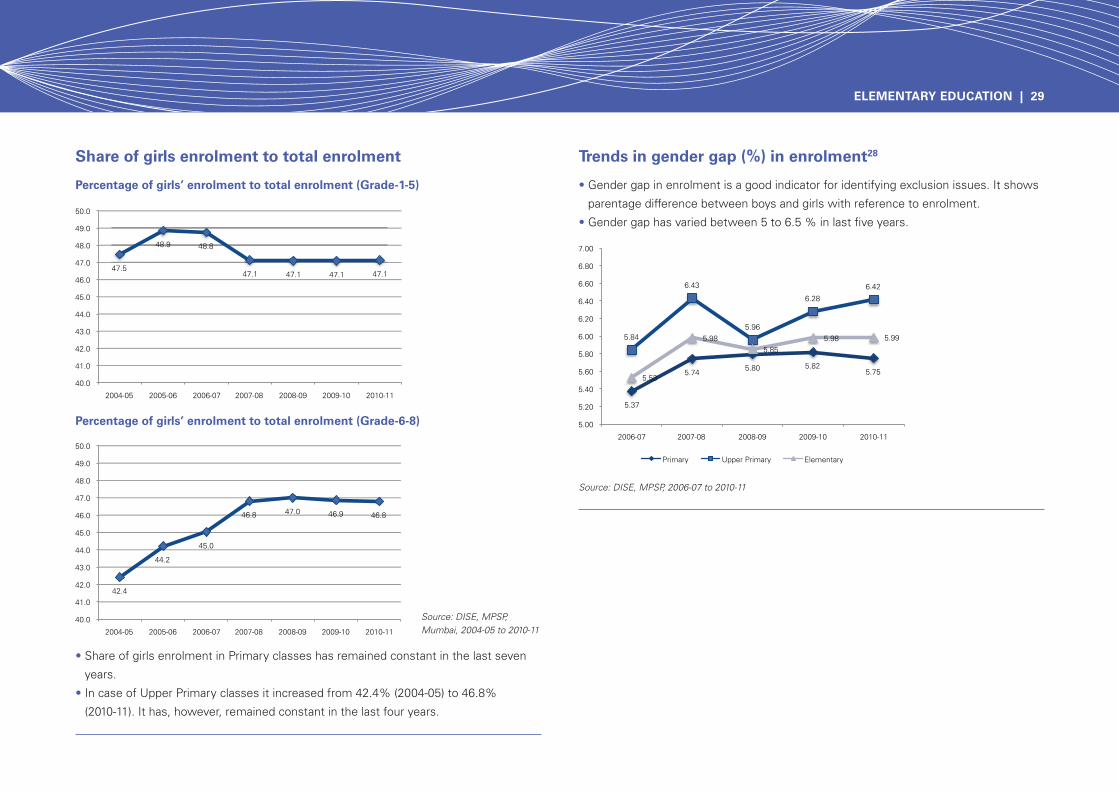
• Share of girls enrolment in Primary classes has remained constant in the last seven
years.
• In case of Upper Primary classes it increased from 42.4% (2004-05) to 46.8%
(2010-11). It has, however, remained constant in the last four years.
• Gender gap in enrolment is a good indicator for identifying exclusion issues. It shows
parentage difference between boys and girls with reference to enrolment.
• Gender gap has varied between 5 to 6.5 % in last five years.
Percentage of girls’ enrolment to total enrolment (Grade-1-5)
Share of girls enrolment to total enrolment Trends in gender gap (%) in enrolment28
Percentage of girls’ enrolment to total enrolment (Grade-6-8)
ELEMENTARY EDUCATION | 29
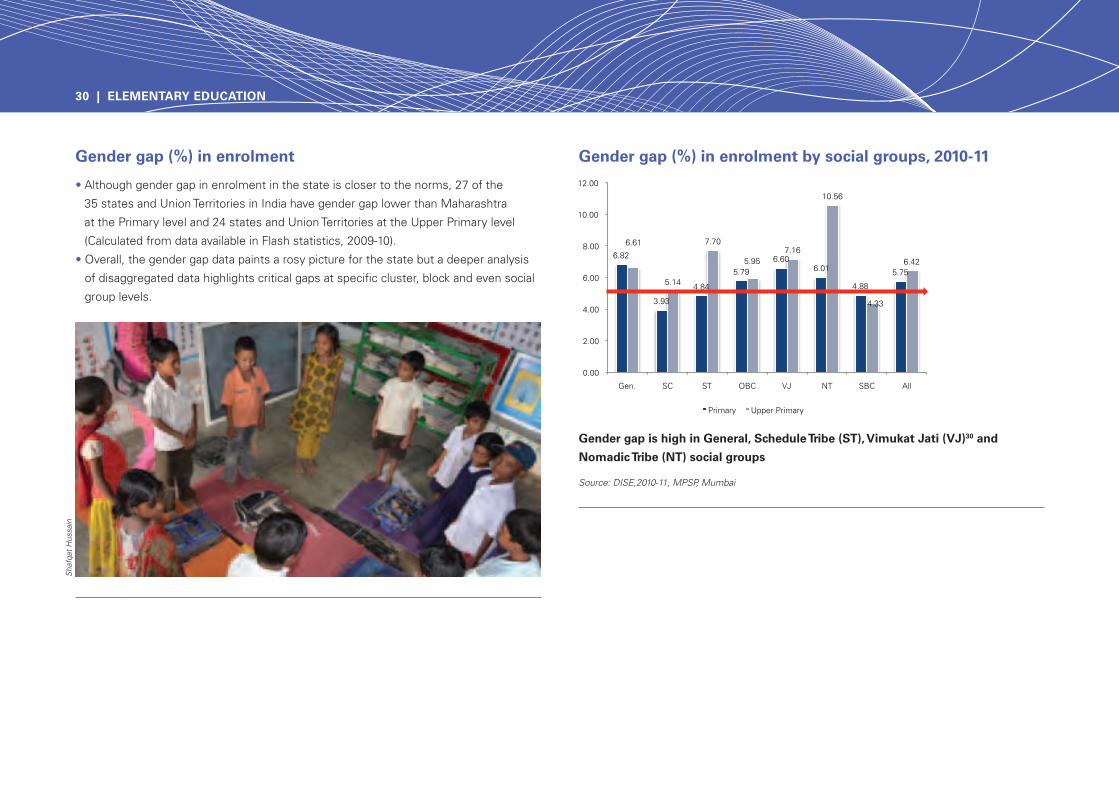
• Although gender gap in enrolment in the state is closer to the norms, 27 of the
35 states and Union Territories in India have gender gap lower than Maharashtra
at the Primary level and 24 states and Union Territories at the Upper Primary level
(Calculated from data available in Flash statistics, 2009-10).
• Overall, the gender gap data paints a rosy picture for the state but a deeper analysis
of disaggregated data highlights critical gaps at specific cluster, block and even social
group levels.
Gender gap (%) in enrolment Gender gap (%) in enrolment by social groups, 2010-11
Gender gap is high in General, Schedule Tribe (ST), Vimukat Jati (VJ)30 and
Nomadic Tribe (NT) social groups
Source: DISE,2010-11, MPSP, Mumbai
30 | ELEMENTARY EDUCATION
Shaf
qat H
ussa
in
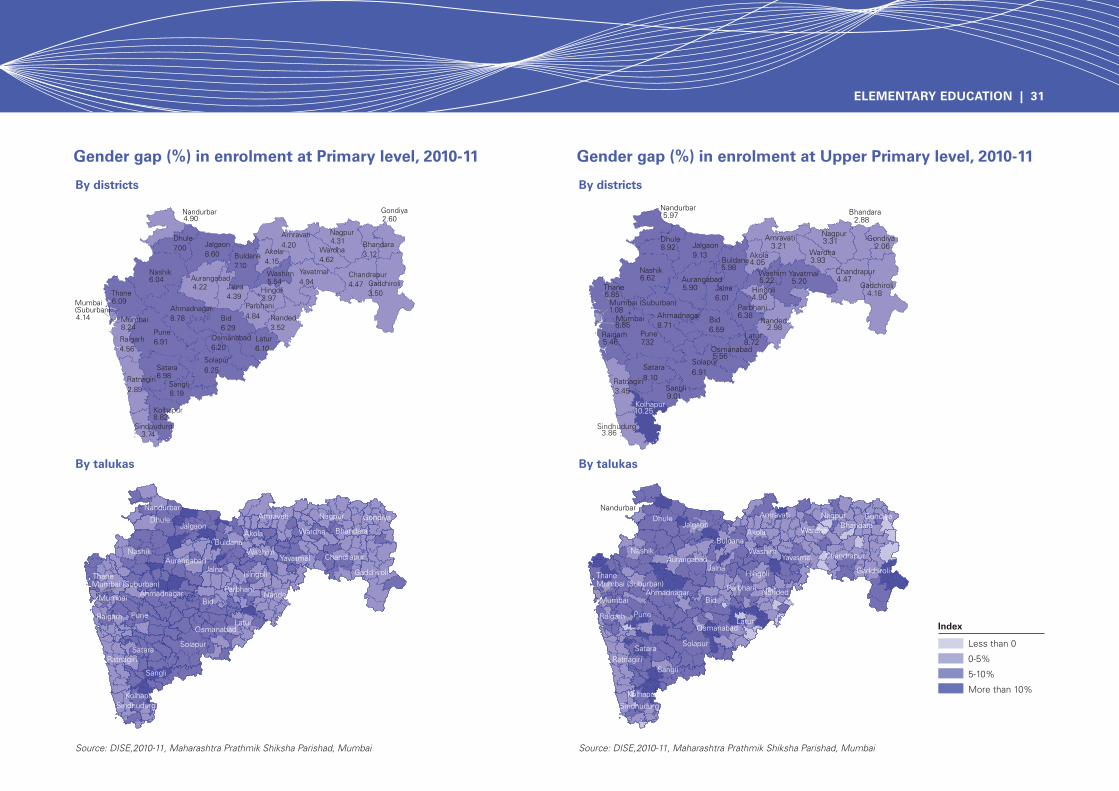
By districts By districts
Gender gap (%) in enrolment at Primary level, 2010-11 Gender gap (%) in enrolment at Upper Primary level, 2010-11
By talukas By talukas
Source: DISE,2010-11, Maharashtra Prathmik Shiksha Parishad, Mumbai Source: DISE,2010-11, Maharashtra Prathmik Shiksha Parishad, Mumbai
Index
Less than 0
0-5%
5-10%
More than 10%
ELEMENTARY EDUCATION | 31
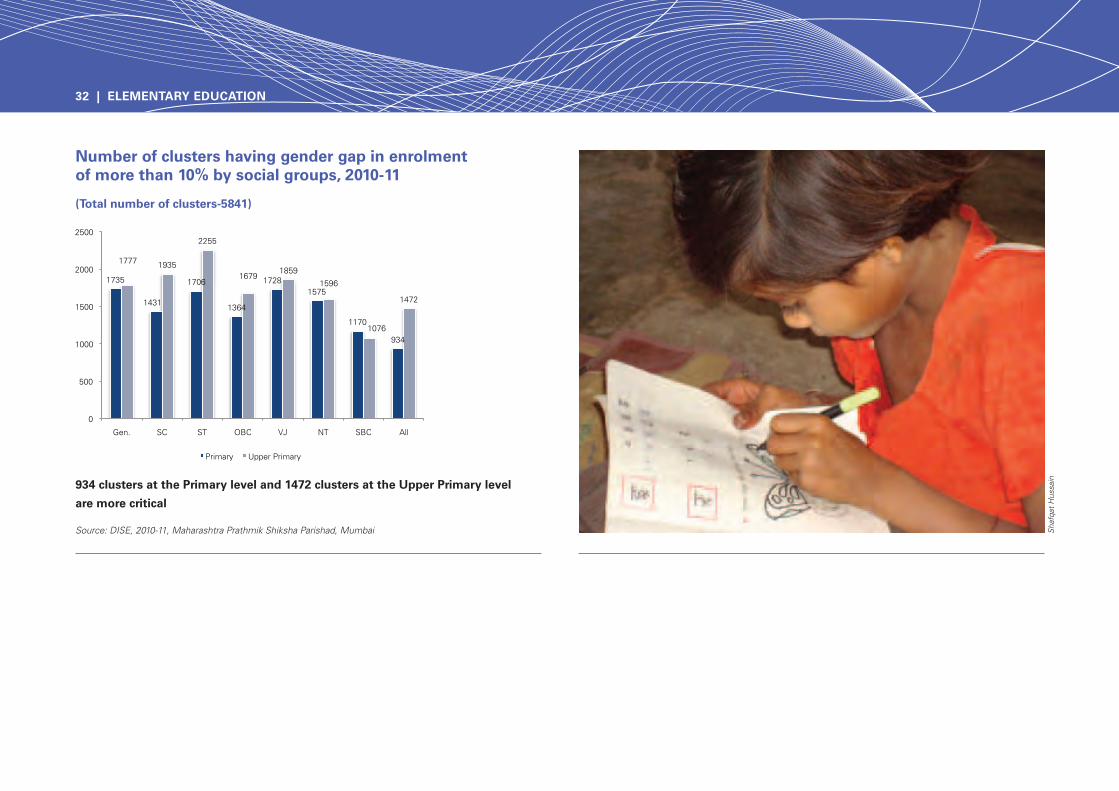
Number of clusters having gender gap in enrolment of more than 10% by social groups, 2010-11
(Total number of clusters-5841)
934 clusters at the Primary level and 1472 clusters at the Upper Primary level
are more critical
Source: DISE, 2010-11, Maharashtra Prathmik Shiksha Parishad, Mumbai
32 | ELEMENTARY EDUCATION
Shaf
qat H
ussa
in
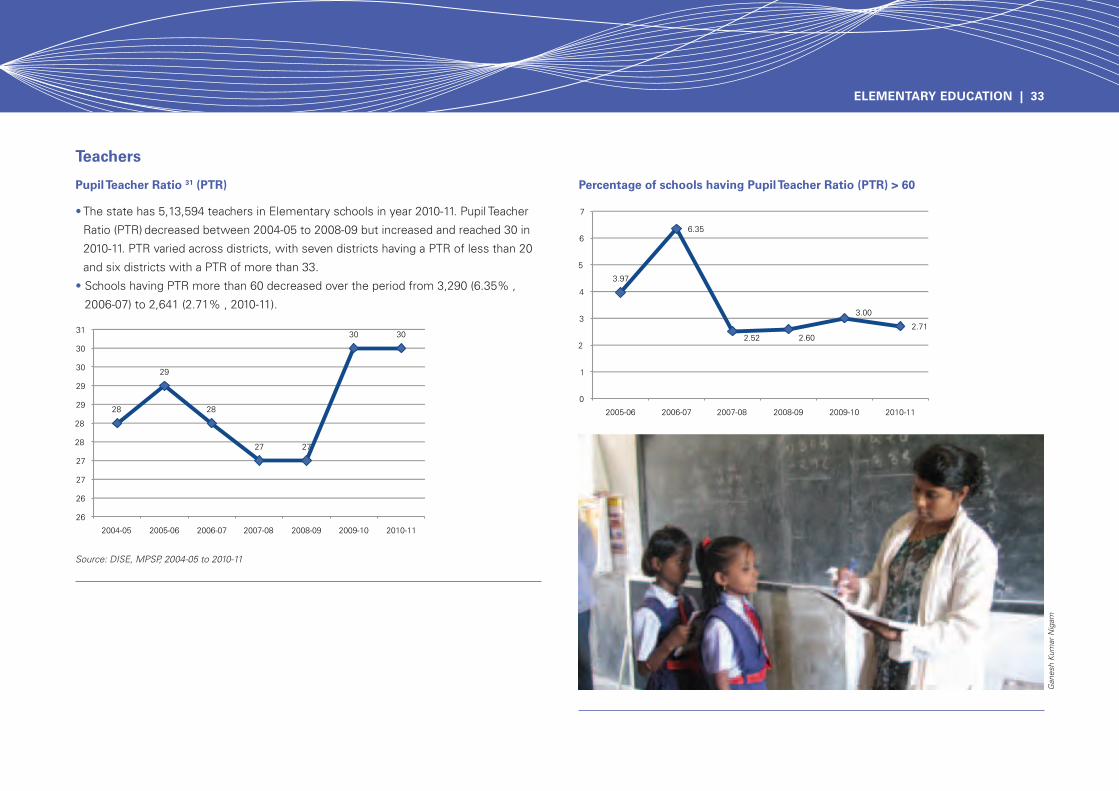
• The state has 5,13,594 teachers in Elementary schools in year 2010-11. Pupil Teacher
Ratio (PTR) decreased between 2004-05 to 2008-09 but increased and reached 30 in
2010-11. PTR varied across districts, with seven districts having a PTR of less than 20
and six districts with a PTR of more than 33.
• Schools having PTR more than 60 decreased over the period from 3,290 (6.35% ,
2006-07) to 2,641 (2.71% , 2010-11).
Pupil Teacher Ratio 31 (PTR) Percentage of schools having Pupil Teacher Ratio (PTR) > 60
Source: DISE, MPSP, 2004-05 to 2010-11
Teachers
Gan
esh
Kum
ar N
igam
ELEMENTARY EDUCATION | 33
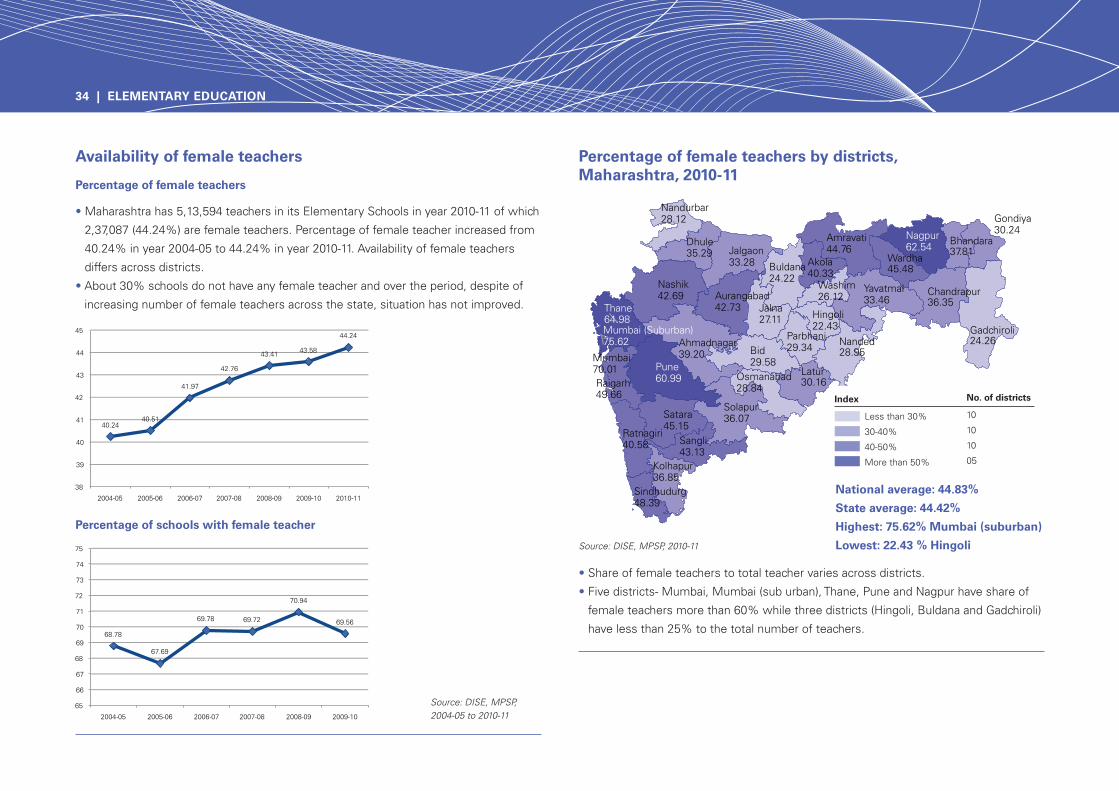
• Maharashtra has 5,13,594 teachers in its Elementary Schools in year 2010-11 of which
2,37,087 (44.24%) are female teachers. Percentage of female teacher increased from
40.24% in year 2004-05 to 44.24% in year 2010-11. Availability of female teachers
differs across districts.
• About 30% schools do not have any female teacher and over the period, despite of
increasing number of female teachers across the state, situation has not improved.
• Share of female teachers to total teacher varies across districts.
• Five districts- Mumbai, Mumbai (sub urban), Thane, Pune and Nagpur have share of
female teachers more than 60% while three districts (Hingoli, Buldana and Gadchiroli)
have less than 25% to the total number of teachers.
Percentage of female teachers
Percentage of female teachers by districts, Maharashtra, 2010-11
Percentage of schools with female teacher
Source: DISE, MPSP, 2004-05 to 2010-11
Availability of female teachers
National average: 44.83%
State average: 44.42%
Highest: 75.62% Mumbai (suburban)
Lowest: 22.43 % Hingoli Source: DISE, MPSP, 2010-11
34 | ELEMENTARY EDUCATION
Index
Less than 30%
30-40%
40-50%
More than 50%
No. of districts
10
10
10
05
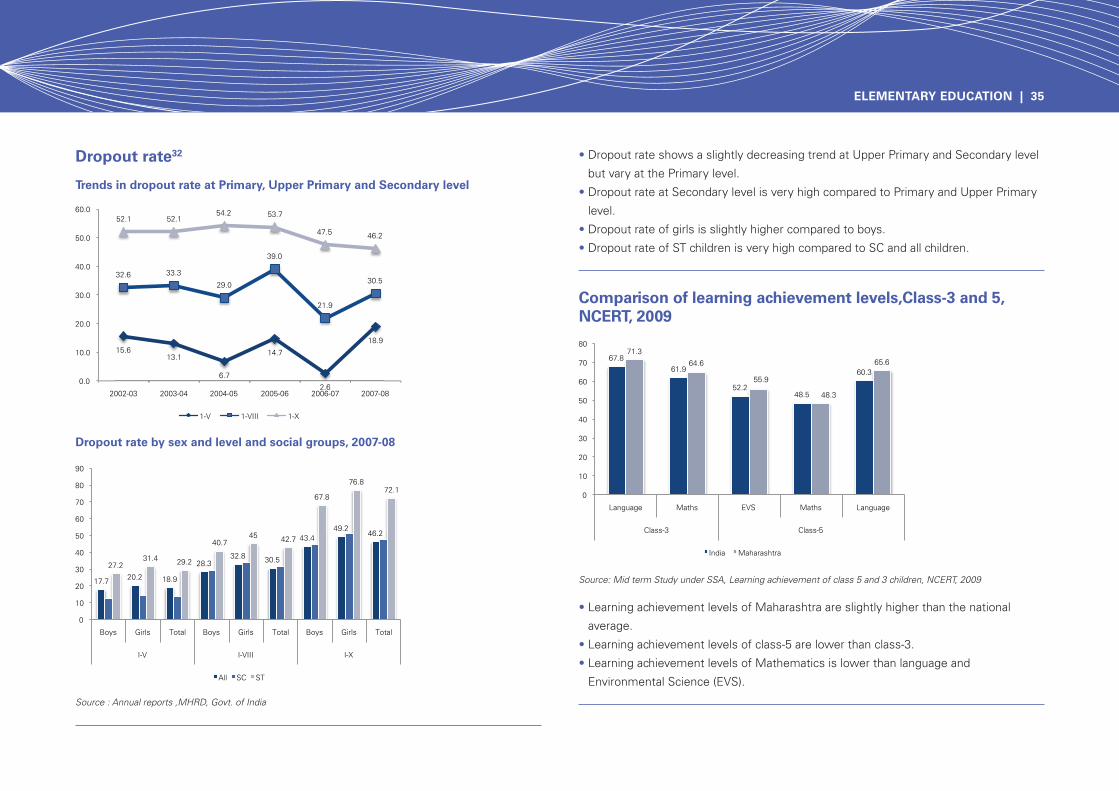
• Dropout rate shows a slightly decreasing trend at Upper Primary and Secondary level
but vary at the Primary level.
• Dropout rate at Secondary level is very high compared to Primary and Upper Primary
level.
• Dropout rate of girls is slightly higher compared to boys.
• Dropout rate of ST children is very high compared to SC and all children.
Trends in dropout rate at Primary, Upper Primary and Secondary level
Dropout rate32
Dropout rate by sex and level and social groups, 2007-08
Source : Annual reports ,MHRD, Govt. of India
• Learning achievement levels of Maharashtra are slightly higher than the national
average.
• Learning achievement levels of class-5 are lower than class-3.
• Learning achievement levels of Mathematics is lower than language and
Environmental Science (EVS).
Comparison of learning achievement levels,Class-3 and 5, NCERT, 2009
Source: Mid term Study under SSA, Learning achievement of class 5 and 3 children, NCERT, 2009
ELEMENTARY EDUCATION | 35
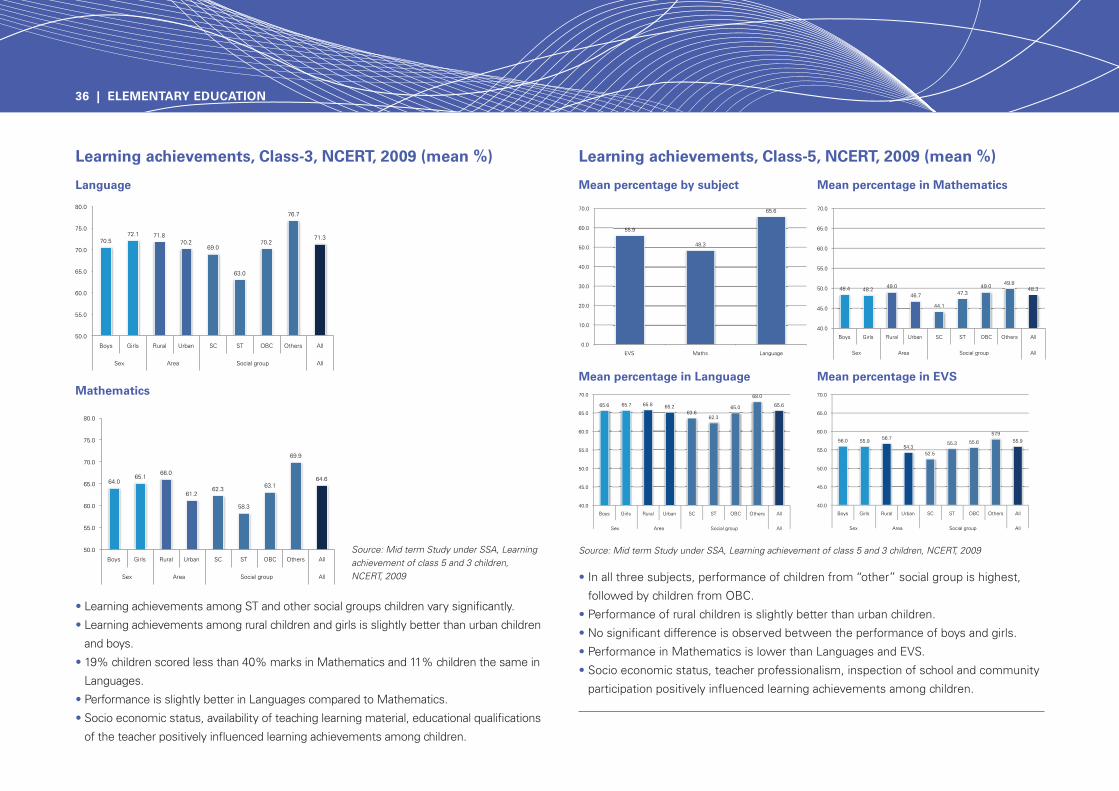
• Learning achievements among ST and other social groups children vary significantly.
• Learning achievements among rural children and girls is slightly better than urban children
and boys.
• 19% children scored less than 40% marks in Mathematics and 11% children the same in
Languages.
• Performance is slightly better in Languages compared to Mathematics.
• Socio economic status, availability of teaching learning material, educational qualifications
of the teacher positively influenced learning achievements among children.
• In all three subjects, performance of children from “other” social group is highest,
followed by children from OBC.
• Performance of rural children is slightly better than urban children.
• No significant difference is observed between the performance of boys and girls.
• Performance in Mathematics is lower than Languages and EVS.
• Socio economic status, teacher professionalism, inspection of school and community
participation positively influenced learning achievements among children.
Language
Learning achievements, Class-3, NCERT, 2009 (mean %)
Mean percentage by subject
Learning achievements, Class-5, NCERT, 2009 (mean %)
Mean percentage in Language
Mean percentage in Mathematics
Mean percentage in EVSMathematics
Source: Mid term Study under SSA, Learning achievement of class 5 and 3 children, NCERT, 2009Source: Mid term Study under SSA, Learning achievement of class 5 and 3 children, NCERT, 2009
36 | ELEMENTARY EDUCATION
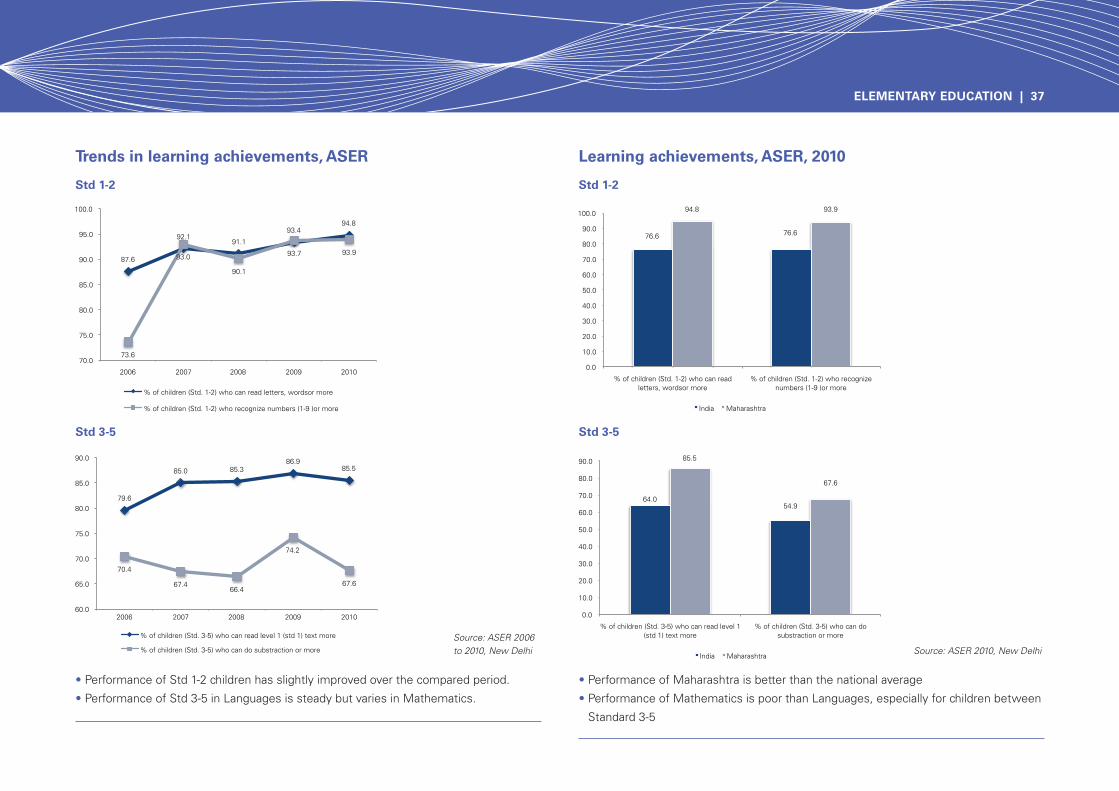
• Performance of Std 1-2 children has slightly improved over the compared period.
• Performance of Std 3-5 in Languages is steady but varies in Mathematics.
• Performance of Maharashtra is better than the national average
• Performance of Mathematics is poor than Languages, especially for children between
Standard 3-5
Std 1-2
Trends in learning achievements, ASER Learning achievements, ASER, 2010
Std 1-2
Std 3-5
Source: ASER 2006 to 2010, New Delhi Source: ASER 2010, New Delhi
Std 3-5
ELEMENTARY EDUCATION | 37
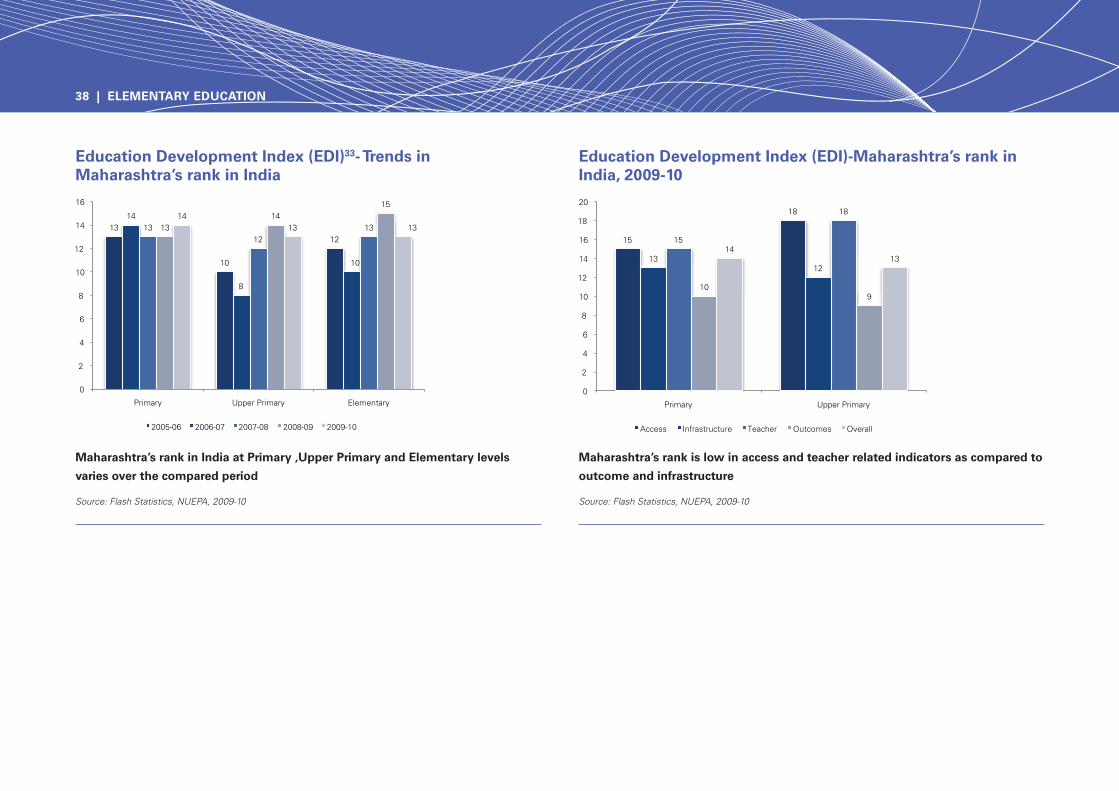
Education Development Index (EDI)33- Trends in Maharashtra’s rank in India
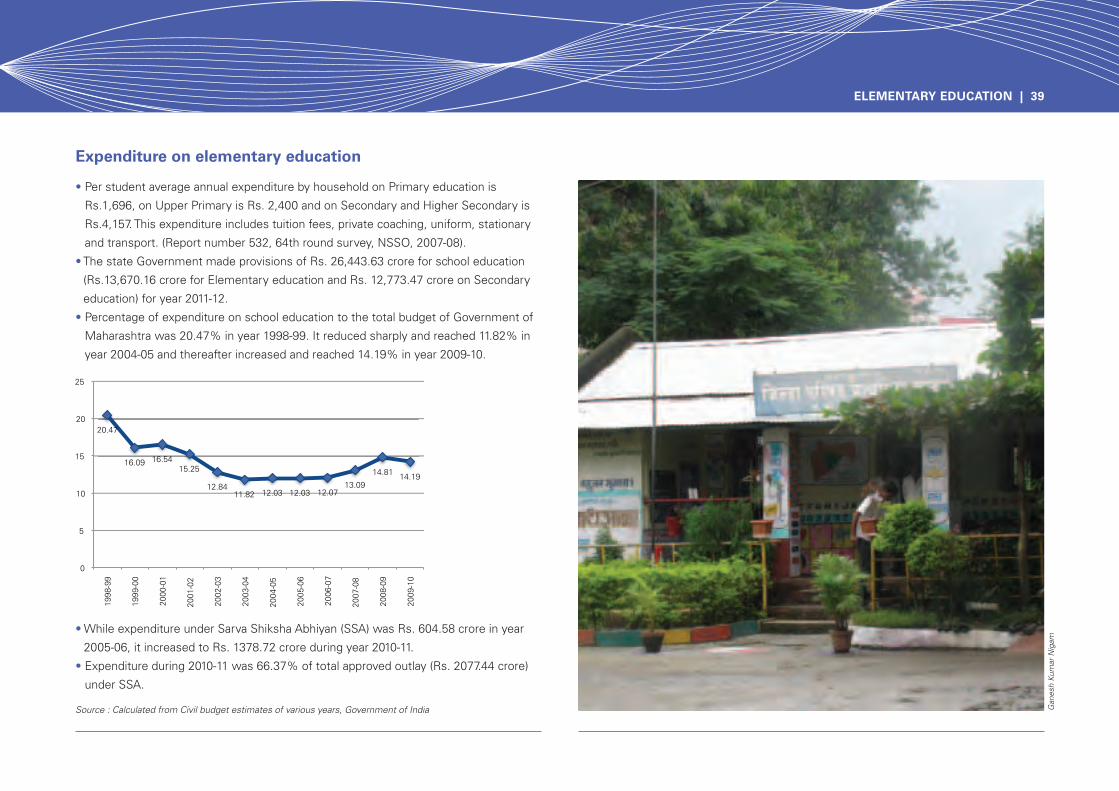
Education Development Index (EDI)-Maharashtra’s rank in India, 2009-10
Source: Flash Statistics, NUEPA, 2009-10 Source: Flash Statistics, NUEPA, 2009-10
Maharashtra’s rank in India at Primary ,Upper Primary and Elementary levels
varies over the compared period
Maharashtra’s rank is low in access and teacher related indicators as compared to
outcome and infrastructure
38 | ELEMENTARY EDUCATION
• Per student average annual expenditure by household on Primary education is
Rs.1,696, on Upper Primary is Rs. 2,400 and on Secondary and Higher Secondary is
Rs.4,157. This expenditure includes tuition fees, private coaching, uniform, stationary
and transport. (Report number 532, 64th round survey, NSSO, 2007-08).
• The state Government made provisions of Rs. 26,443.63 crore for school education
(Rs.13,670.16 crore for Elementary education and Rs. 12,773.47 crore on Secondary
education) for year 2011-12.
• Percentage of expenditure on school education to the total budget of Government of
Maharashtra was 20.47% in year 1998-99. It reduced sharply and reached 11.82% in
year 2004-05 and thereafter increased and reached 14.19% in year 2009-10.
• While expenditure under Sarva Shiksha Abhiyan (SSA) was Rs. 604.58 crore in year
2005-06, it increased to Rs. 1378.72 crore during year 2010-11.
• Expenditure during 2010-11 was 66.37% of total approved outlay (Rs. 2077.44 crore)
under SSA.
Source : Calculated from Civil budget estimates of various years, Government of India
Expenditure on elementary education
Gan
esh
Kum
ar N
igam
ELEMENTARY EDUCATION | 39


![Confianza [Niklas Luhmann]](https://img.pdfslide.net/doc/110x75/577cc0571a28aba7118fbc77/confianza-niklas-luhmann.jpg)