Embed Size (px)
Citation preview

United Airlines Reports Second-Quarter 2018 Performance
CHICAGO, July 17, 2018 – United Airlines (UAL) today announced its second-quarter 2018 financial
results.
UAL reported second-quarter net income of $684 million, diluted earnings per share of $2.48, pre-tax
earnings of $857 million and pre-tax margin of 8.0 percent.
Excluding special charges and mark-to-market adjustments, UAL reported second-quarter net income
of $889 million, diluted earnings per share of $3.23, pre-tax earnings of $1.1 billion and pre-tax margin
of 10.4 percent.
Ranked first among largest competitors in on-time departures in the quarter.
UAL repurchased $407 million of its common shares in the second quarter.
Consolidated passenger revenue per available seat mile (PRASM) increased 3.0 percent year-over-
year.
Consolidated total revenue per available seat mile (TRASM) increased 2.8 percent year-over-year.
Consolidated unit cost per available seat mile (CASM) increased 7.1 percent year-over-year.
Consolidated CASM, excluding special charges, third-party business expenses, fuel and profit sharing,
decreased 0.4 percent year-over-year.
UAL now expects full-year 2018 diluted earnings per share, excluding special charges and mark-to-
market adjustments, to be $7.25 to $8.751.
“We delivered great financial results and strong operational performance in the second quarter despite
the significant headwind of higher fuel prices,” said Oscar Munoz, chief executive officer of United Airlines.
“These results are the strongest evidence yet that our strategic growth plan is working, and we are well
positioned to carry our momentum into the second half of the year.”
For more information on UAL's third-quarter 2018 guidance, please visit ir.united.com for the company's
investor update.

United Airlines Reports Second-Quarter 2018 Performance
2
Second-Quarter Highlights
Operations and Employees
Completed the best second-quarter on-time departure performance in United’s history.
Received "Best-of-the-Best" Award from the National LGBT Chamber of Commerce and National
Business Inclusion Consortium for commitment to diversity and inclusion across all communities.
Announced a total of $8 million in grants to benefit organizations in each of its domestic hub
communities.
Became the first carrier to achieve certification through the new Audubon International Green
Hospitality Program for the airline's United Club location in Terminal 7 of Los Angeles International
Airport.
Customer Experience
Expanded personal device entertainment option to all aircraft with DIRECTV live streaming for
purchase, providing at least one free entertainment option on all Wi-Fi equipped aircraft (which is any
aircraft with more than 70 seats).
Opened three new United Polaris lounges located in San Francisco International Airport, Newark
Liberty International Airport and Houston’s George Bush Intercontinental Airport.
Announced a new relationship with The Private Suite, offering the airline's customers access to a newly
built, private terminal at Los Angeles International Airport.
Introduced the new United Explorer Card which offers additional benefits, travel credits and discounts.
Network and Fleet
Launched service from Newark/New York to two new international destinations: Reykjavik, Iceland, and
Porto, Portugal.
Announced the return of seasonal service to 25 destinations, including, among others: Athens, Greece;
Glasgow, Scotland; Madrid and Barcelona, Spain; Rome and Venice, Italy; and Hamburg, Germany.
Announced schedule expansion at East Coast hubs in Newark/New York and Washington-Dulles to
offer more nonstop flights to destinations popular with New York-area customers while reallocating
largely connecting passenger flights to Washington-Dulles.
Took delivery of one Boeing 777-300ER aircraft and six Boeing 737 MAX 9 aircraft.
Became North American launch customer of the Boeing 737 MAX 9 aircraft, which took its first flight on
June 7 from Houston’s George Bush Intercontinental Airport to Orlando International Airport in Florida.
Earnings Call
UAL will hold a conference call to discuss second-quarter 2018 financial results and its financial and
operational outlook for the third quarter and full year of 2018 on Wednesday, July 18, at 9:30 a.m. Central Time
/10:30 a.m. Eastern Time. A live, listen-only webcast of the conference call will be available at ir.united.com. The

United Airlines Reports Second-Quarter 2018 Performance
3
webcast will be available for replay within 24 hours of the conference call and then archived on the website for
three months.
About United
United Airlines and United Express operate approximately 4,600 flights a day to 357 airports across five
continents. In 2017, United and United Express operated more than 1.6 million flights carrying more than 148
million customers. United is proud to have the world's most comprehensive route network, including U.S.
mainland hubs in Chicago, Denver, Houston, Los Angeles, Newark/New York, San Francisco and Washington,
D.C. United operates 757 mainline aircraft and the airline's United Express carriers operate 551 regional
aircraft. The airline is a founding member of Star Alliance, which provides service to 193 countries via 28
member airlines. For more information, visit united.com, follow @United on Twitter or connect on Facebook.
The common stock of United's parent, United Continental Holdings, Inc., is traded on the NYSE under the
symbol "UAL".
1 Excludes special charges, the nature of which are not determinable at this time, and mark-to-market impact of equity investments. Accordingly, UAL is not providing earnings guidance on a GAAP basis.
Safe Harbor Statement under the Private Securities Litigation Reform Act of 1995: Certain statements included in this release are forward-looking and thus reflect our current expectations and beliefs with respect to certain current and future events and anticipated financial and operating performance. Such forward-looking statements are and will be subject to many risks and uncertainties relating to our operations and business environment that may cause actual results to differ materially from any future results expressed or implied in such forward-looking statements. Words such as “expects,” “will,” “plans,” “anticipates,” “indicates,” “believes,” “estimates,” “forecast,” “guidance,” “outlook,” “goals” and similar expressions are intended to identify forward-looking statements. Additionally, forward-looking statements include statements that do not relate solely to historical facts, such as statements which identify uncertainties or trends, discuss the possible future effects of current known trends or uncertainties, or which indicate that the future effects of known trends or uncertainties cannot be predicted, guaranteed or assured. All forward-looking statements in this release are based upon information available to us on the date of this release. We undertake no obligation to publicly update or revise any forward-looking statement, whether as a result of new information, future events, changed circumstances or otherwise, except as required by applicable law. Our actual results could differ materially from these forward-looking statements due to numerous factors including, without limitation, the following: general economic conditions (including interest rates, foreign currency exchange rates, investment or credit market conditions, crude oil prices, costs of aircraft fuel and energy refining capacity in relevant markets); economic and political instability and other risks of doing business globally, including political developments that may impact our operations in certain countries; demand for travel and the impact that global economic and political conditions have on customer travel patterns; competitive pressures on pricing and on demand; demand for transportation in the markets in which we operate; our capacity decisions and the capacity decisions of our competitors; the effects of any hostilities, act of war or terrorist attack; the effects of any technology failures or cybersecurity breaches; the impact of regulatory, investigative and legal proceedings and legal compliance risks; disruptions to our regional network; the ability of other air carriers with whom we have alliances or partnerships to provide the services contemplated by the respective arrangements with such carriers; costs associated with any modification or termination of our aircraft orders; potential reputational or other impact from adverse events in our operations, the operations of our regional carriers or the operations of our code share partners; our ability to attract and retain customers; our ability to execute our operational plans and revenue-generating initiatives, including optimizing our revenue; our ability to control our costs, including realizing benefits from our resource optimization efforts, cost reduction initiatives and fleet replacement programs; the impact of any management changes; our ability to cost-effectively hedge against increases in the price of aircraft fuel if we decide to do so; any potential realized or unrealized gains or losses related to any fuel or currency hedging programs; labor costs; our ability to maintain satisfactory labor relations

United Airlines Reports Second-Quarter 2018 Performance
4
and the results of any collective bargaining agreement process with our union groups; any disruptions to operations due to any potential actions by our labor groups; an outbreak of a disease that affects travel demand or travel behavior; U.S. or foreign governmental legislation, regulation and other actions (including Open Skies agreements and environmental regulations); industry consolidation or changes in airline alliances; our ability to comply with the terms of our various financing arrangements; the costs and availability of financing; our ability to maintain adequate liquidity; the costs and availability of aviation and other insurance; weather conditions; our ability to utilize our net operating losses to offset future taxable income; the impact of changes in tax laws; the success of our investments in airlines in other parts of the world; and other risks and uncertainties set forth under Part I, Item 1A., “Risk Factors,” of our Annual Report on Form 10-K for the fiscal year ended December 31, 2017, as well as other risks and uncertainties set forth from time to time in the reports we file with the U.S. Securities and Exchange Commission.
-tables attached-
United Airlines Reports Second-Quarter 2018 Performance
5
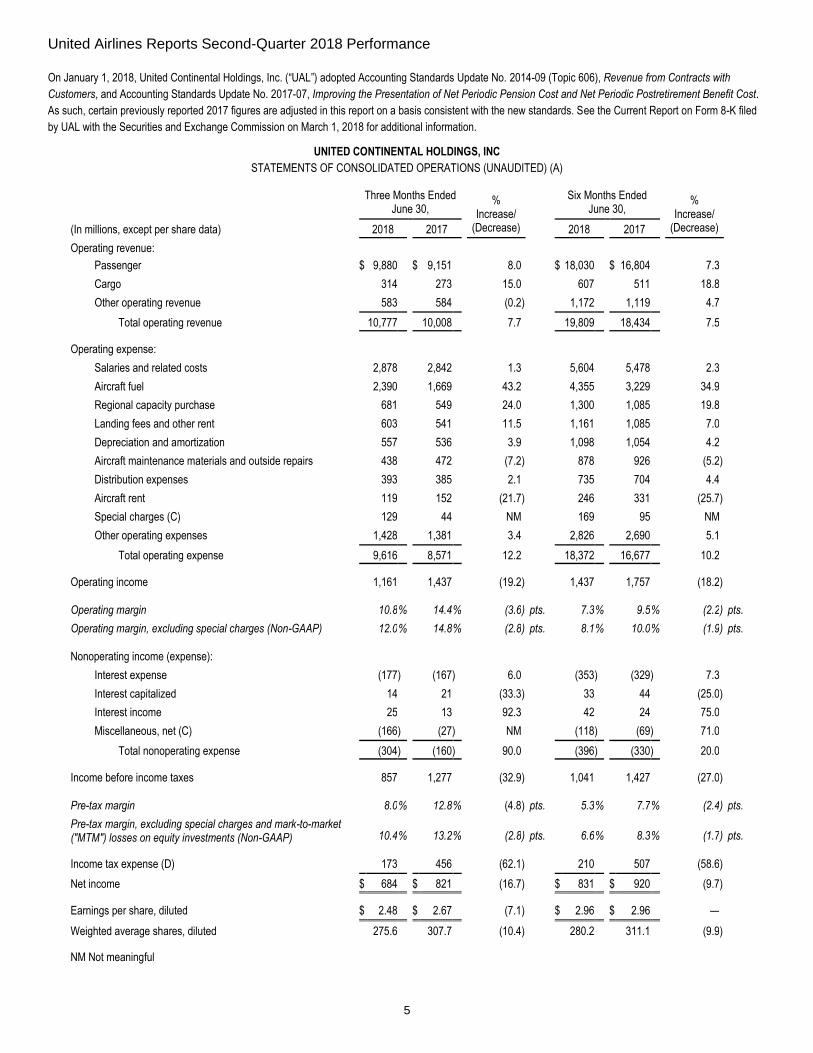
On January 1, 2018, United Continental Holdings, Inc. (“UAL”) adopted Accounting Standards Update No. 2014-09 (Topic 606), Revenue from Contracts with
Customers, and Accounting Standards Update No. 2017-07, Improving the Presentation of Net Periodic Pension Cost and Net Periodic Postretirement Benefit Cost.
As such, certain previously reported 2017 figures are adjusted in this report on a basis consistent with the new standards. See the Current Report on Form 8-K filed
by UAL with the Securities and Exchange Commission on March 1, 2018 for additional information.
UNITED CONTINENTAL HOLDINGS, INC
STATEMENTS OF CONSOLIDATED OPERATIONS (UNAUDITED) (A)
Three Months Ended
June 30, %
Increase/ (Decrease)
Six Months Ended
June 30, %
Increase/ (Decrease)
(In millions, except per share data) 2018 2017 2018 2017 Operating revenue:
Passenger $ 9,880 $ 9,151 8.0 $ 18,030 $ 16,804 7.3 Cargo 314 273 15.0 607 511 18.8 Other operating revenue 583 584 (0.2 ) 1,172 1,119 4.7
Total operating revenue 10,777 10,008 7.7 19,809 18,434 7.5
Operating expense: Salaries and related costs 2,878 2,842 1.3 5,604 5,478 2.3 Aircraft fuel 2,390 1,669 43.2 4,355 3,229 34.9 Regional capacity purchase 681 549 24.0 1,300 1,085 19.8 Landing fees and other rent 603 541 11.5 1,161 1,085 7.0 Depreciation and amortization 557 536 3.9 1,098 1,054 4.2 Aircraft maintenance materials and outside repairs 438 472 (7.2 ) 878 926 (5.2 ) Distribution expenses 393 385 2.1 735 704 4.4 Aircraft rent 119 152 (21.7 ) 246 331 (25.7 ) Special charges (C) 129 44 NM 169 95 NM Other operating expenses 1,428 1,381 3.4 2,826 2,690 5.1
Total operating expense 9,616 8,571 12.2 18,372 16,677 10.2
Operating income 1,161 1,437 (19.2 ) 1,437 1,757 (18.2 )
Operating margin 10.8 % 14.4 % (3.6 ) pts. 7.3 % 9.5 % (2.2 ) pts.
Operating margin, excluding special charges (Non-GAAP) 12.0 % 14.8 % (2.8 ) pts. 8.1 % 10.0 % (1.9 ) pts.
Nonoperating income (expense):
Interest expense (177 ) (167 ) 6.0 (353 ) (329 ) 7.3 Interest capitalized 14 21 (33.3 ) 33 44 (25.0 ) Interest income 25 13 92.3 42 24 75.0 Miscellaneous, net (C) (166 ) (27 ) NM (118 ) (69 ) 71.0
Total nonoperating expense (304 ) (160 ) 90.0 (396 ) (330 ) 20.0
Income before income taxes 857 1,277 (32.9 ) 1,041 1,427 (27.0 )
Pre-tax margin 8.0 % 12.8 % (4.8 ) pts. 5.3 % 7.7 % (2.4 ) pts.
Pre-tax margin, excluding special charges and mark-to-market ("MTM") losses on equity investments (Non-GAAP) 10.4 % 13.2 % (2.8 ) pts. 6.6 % 8.3 % (1.7 ) pts.
Income tax expense (D) 173 456 (62.1 ) 210 507 (58.6 ) Net income $ 684 $ 821 (16.7 ) $ 831 $ 920 (9.7 )
Earnings per share, diluted $ 2.48 $ 2.67 (7.1 ) $ 2.96 $ 2.96 — Weighted average shares, diluted 275.6 307.7 (10.4 ) 280.2 311.1 (9.9 ) NM Not meaningful
United Airlines Reports Second-Quarter 2018 Performance
6
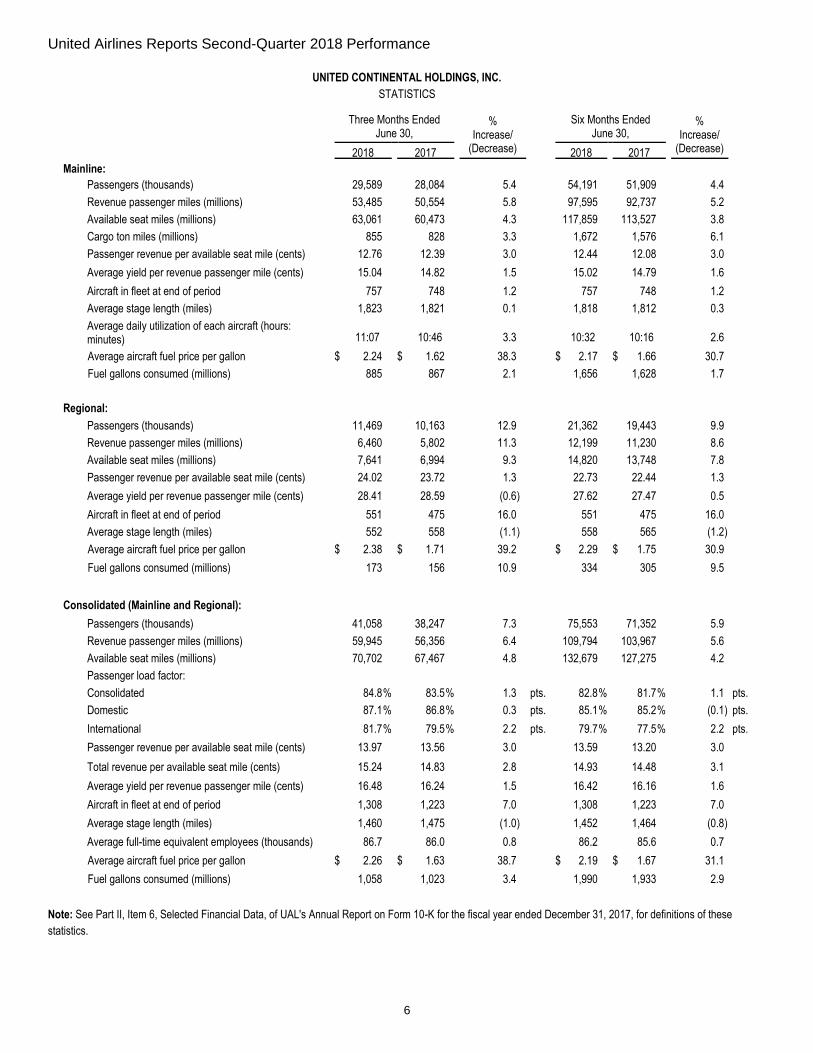
UNITED CONTINENTAL HOLDINGS, INC.
STATISTICS
Three Months Ended
June 30, %
Increase/ (Decrease)
Six Months Ended
June 30, %
Increase/ (Decrease)
2018 2017 2018 2017 Mainline:
Passengers (thousands) 29,589 28,084 5.4 54,191 51,909 4.4 Revenue passenger miles (millions) 53,485 50,554 5.8 97,595 92,737 5.2 Available seat miles (millions) 63,061 60,473 4.3 117,859 113,527 3.8 Cargo ton miles (millions) 855 828 3.3 1,672 1,576 6.1 Passenger revenue per available seat mile (cents) 12.76 12.39 3.0 12.44 12.08 3.0 Average yield per revenue passenger mile (cents) 15.04 14.82 1.5 15.02 14.79 1.6 Aircraft in fleet at end of period 757 748 1.2 757 748 1.2 Average stage length (miles) 1,823 1,821 0.1 1,818 1,812 0.3 Average daily utilization of each aircraft (hours: minutes) 11:07 10:46 3.3
10:32 10:16 2.6
Average aircraft fuel price per gallon $ 2.24 $ 1.62 38.3 $ 2.17 $ 1.66 30.7 Fuel gallons consumed (millions) 885 867 2.1 1,656 1,628 1.7 Regional:
Passengers (thousands) 11,469 10,163 12.9 21,362 19,443 9.9 Revenue passenger miles (millions) 6,460 5,802 11.3 12,199 11,230 8.6 Available seat miles (millions) 7,641 6,994 9.3 14,820 13,748 7.8 Passenger revenue per available seat mile (cents) 24.02 23.72 1.3 22.73 22.44 1.3 Average yield per revenue passenger mile (cents) 28.41 28.59 (0.6 ) 27.62 27.47 0.5 Aircraft in fleet at end of period 551 475 16.0 551 475 16.0 Average stage length (miles) 552 558 (1.1 ) 558 565 (1.2 )
Average aircraft fuel price per gallon $ 2.38 $ 1.71 39.2 $ 2.29 $ 1.75 30.9 Fuel gallons consumed (millions) 173 156 10.9 334 305 9.5
Consolidated (Mainline and Regional):
Passengers (thousands) 41,058 38,247 7.3 75,553 71,352 5.9 Revenue passenger miles (millions) 59,945 56,356 6.4 109,794 103,967 5.6 Available seat miles (millions) 70,702 67,467 4.8 132,679 127,275 4.2 Passenger load factor: Consolidated 84.8 % 83.5 % 1.3 pts. 82.8 % 81.7 % 1.1 pts.
Domestic 87.1 % 86.8 % 0.3 pts. 85.1 % 85.2 % (0.1 ) pts.
International 81.7 % 79.5 % 2.2 pts. 79.7 % 77.5 % 2.2 pts.
Passenger revenue per available seat mile (cents) 13.97 13.56 3.0 13.59 13.20 3.0 Total revenue per available seat mile (cents) 15.24 14.83 2.8 14.93 14.48 3.1 Average yield per revenue passenger mile (cents) 16.48 16.24 1.5 16.42 16.16 1.6 Aircraft in fleet at end of period 1,308 1,223 7.0 1,308 1,223 7.0 Average stage length (miles) 1,460 1,475 (1.0 ) 1,452 1,464 (0.8 ) Average full-time equivalent employees (thousands) 86.7 86.0 0.8 86.2 85.6 0.7
Average aircraft fuel price per gallon $ 2.26 $ 1.63 38.7 $ 2.19 $ 1.67 31.1 Fuel gallons consumed (millions) 1,058 1,023 3.4 1,990 1,933 2.9
Note: See Part II, Item 6, Selected Financial Data, of UAL's Annual Report on Form 10-K for the fiscal year ended December 31, 2017, for definitions of these
statistics.

United Airlines Reports Second-Quarter 2018 Performance
7
UNITED CONTINENTAL HOLDINGS, INC. SUMMARY FINANCIAL METRICS (A)
Three Months Ended
June 30, % Increase/
(Decrease)
Six Months Ended
June 30, % Increase/
(Decrease)
2018 2017 2018 2017 (In millions, except per share data) Operating income $ 1,161 $ 1,437 (19.2 ) $ 1,437 $ 1,757 (18.2 ) Operating margin 10.8 % 14.4 % (3.6 ) pts. 7.3 % 9.5 % (2.2 ) pts.
Operating income, excluding special charges (Non-GAAP)
1,290
1,481
(12.9 )
1,606
1,852
(13.3 )
Operating margin, excluding special charges (Non-GAAP)
12.0 % 14.8 % (2.8 ) pts.
8.1 % 10.0 % (1.9 ) pts.
EBITDA, excluding special charges and MTM losses on equity investments (Non-GAAP)
$ 1,816
$ 1,990
(8.7 )
$ 2,676
$ 2,837
(5.7 )
EBITDA margin, excluding special charges and MTM losses on equity investments (Non-GAAP)
16.9 % 19.9 % (3.0 ) pts.
13.5 % 15.4 % (1.9 ) pts.
Pre-tax income $ 857 $ 1,277 (32.9 ) $ 1,041 $ 1,427 (27.0 ) Pre-tax margin 8.0 % 12.8 % (4.8 ) pts. 5.3 % 7.7 % (2.4 ) pts.
Pre-tax income, excluding special charges and MTM losses on equity investments (Non-GAAP)
1,121
1,321
(15.1 )
1,300
1,522
(14.6 )
Pre-tax margin, excluding special charges and MTM losses on equity investments (Non-GAAP)
10.4 % 13.2 % (2.8 ) pts.
6.6 % 8.3 % (1.7 ) pts.
Net income $ 684 $ 821 (16.7 ) $ 831 $ 920 (9.7 ) Net income, excluding special charges and MTM losses on equity investments (Non-GAAP)
889
849
4.7
1,032
981
5.2
Diluted earnings per share $ 2.48 $ 2.67 (7.1 ) $ 2.96 $ 2.96 — Diluted earnings per share, excluding special charges and MTM losses on equity investments (Non-GAAP)
3.23
2.76
17.0
3.68
3.15
16.8
Net cash provided by operating activities $ 2,442 $ 1,561 56.4 $ 4,175 $ 2,108 98.1
Capital expenditures $ 755 $ 1,089 (30.7 ) $ 1,734 $ 1,780 (2.6 ) Adjusted capital expenditures (Non-GAAP) 783 1,247 (37.2 ) 1,796 2,601 (30.9 )
Free cash flow, net of financings (Non-GAAP) $ 1,687 $ 472 257.4 $ 2,441 $ 328 NM Free cash flow (Non-GAAP) 1,659 314 428.3 2,379 (493 ) NM
NM Not meaningful

United Airlines Reports Second-Quarter 2018 Performance
8
UNITED CONTINENTAL HOLDINGS, INC.
RETURN ON INVESTED CAPITAL (ROIC) - Non-GAAP
ROIC is a non-GAAP financial measure that we believe provides useful supplemental information for management and investors by measuring the effectiveness of
our operations' use of invested capital to generate profits.
(in millions) Twelve Months Ended
June 30, 2018
Net Operating Profit After Tax ("NOPAT") Pre-tax income $ 2,654
Special charges and MTM losses on equity investments (C): Impairment of assets 159
MTM losses on equity investments 90
Severance and benefit costs 63
(Gains) losses on sale of assets and other special charges 28
Pre-tax income excluding special charges and MTM losses on equity investments (Non-GAAP) 2,994
add: Interest expense (net of income tax benefit) (a) 689
add: Interest component of capitalized aircraft rent (net of income tax benefit) (a) 260
add: Net interest on pension (net of income tax benefit) (a) 10
less: Income taxes paid (24 )
NOPAT (Non-GAAP) $ 3,929
Average Invested Capital (five-quarter average) Total assets $ 43,205
add: Capitalized aircraft operating leases (b) 4,227
less: Non-interest bearing liabilities (c) (16,957 )
Average invested capital (Non-GAAP) $ 30,475
Return on invested capital (Non-GAAP) 12.9 %
(a) Income tax benefit measured based on the effective cash tax rate. The effective cash tax rate is calculated by dividing cash taxes paid by pre-tax income
excluding special charges. For the twelve months ended June 30, 2018, the effective cash tax rate was 0.8%.
(b) The purpose of this adjustment is to capitalize the impact of aircraft operating leases. The company uses a multiple of seven times its annual aircraft rent
expense to estimate the potential capitalized value and related liability of its aircraft. This is a simplified method used by many rating agencies and financial
analysts to assist with the impact of operating leases on financial measures like return on invested capital.
(c) Non-interest bearing liabilities include advance ticket sales, frequent flyer deferred revenue, deferred income taxes and other non-interest bearing liabilities.
United Airlines Reports Second-Quarter 2018 Performance
9
UNITED CONTINENTAL HOLDINGS, INC.
NON-GAAP FINANCIAL RECONCILIATION
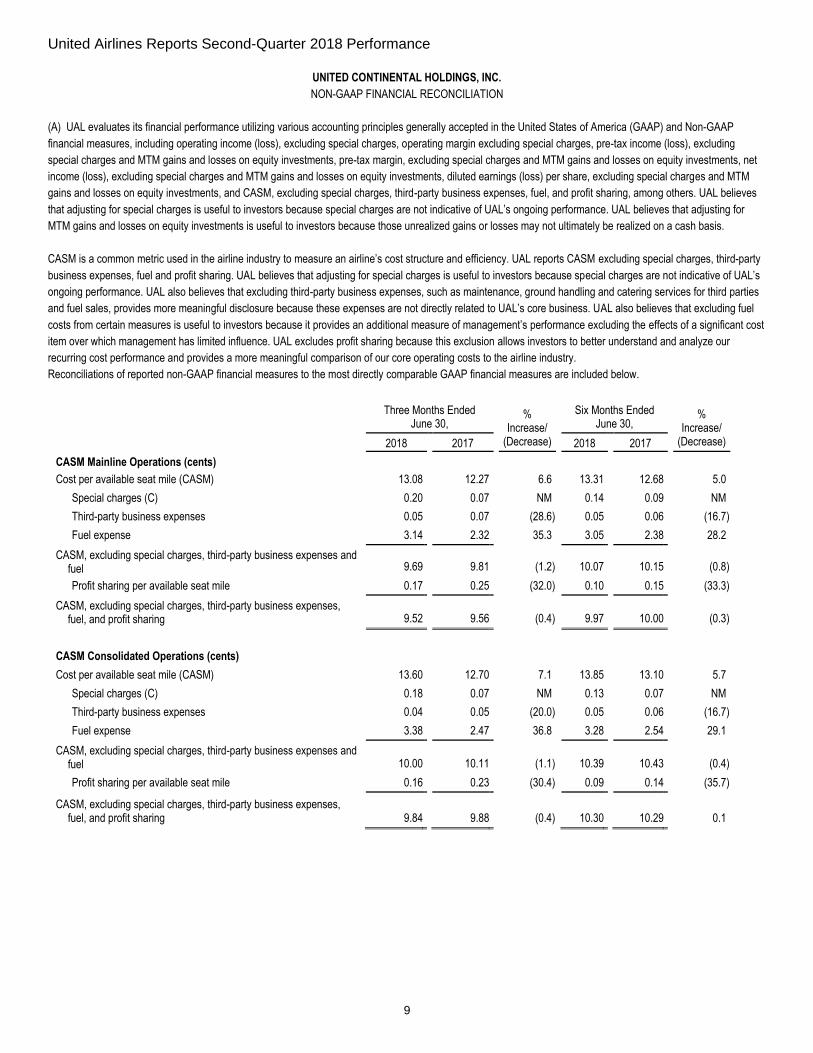
(A) UAL evaluates its financial performance utilizing various accounting principles generally accepted in the United States of America (GAAP) and Non-GAAP
financial measures, including operating income (loss), excluding special charges, operating margin excluding special charges, pre-tax income (loss), excluding
special charges and MTM gains and losses on equity investments, pre-tax margin, excluding special charges and MTM gains and losses on equity investments, net
income (loss), excluding special charges and MTM gains and losses on equity investments, diluted earnings (loss) per share, excluding special charges and MTM
gains and losses on equity investments, and CASM, excluding special charges, third-party business expenses, fuel, and profit sharing, among others. UAL believes
that adjusting for special charges is useful to investors because special charges are not indicative of UAL’s ongoing performance. UAL believes that adjusting for
MTM gains and losses on equity investments is useful to investors because those unrealized gains or losses may not ultimately be realized on a cash basis.
CASM is a common metric used in the airline industry to measure an airline’s cost structure and efficiency. UAL reports CASM excluding special charges, third-party
business expenses, fuel and profit sharing. UAL believes that adjusting for special charges is useful to investors because special charges are not indicative of UAL’s
ongoing performance. UAL also believes that excluding third-party business expenses, such as maintenance, ground handling and catering services for third parties
and fuel sales, provides more meaningful disclosure because these expenses are not directly related to UAL’s core business. UAL also believes that excluding fuel
costs from certain measures is useful to investors because it provides an additional measure of management’s performance excluding the effects of a significant cost
item over which management has limited influence. UAL excludes profit sharing because this exclusion allows investors to better understand and analyze our
recurring cost performance and provides a more meaningful comparison of our core operating costs to the airline industry.
Reconciliations of reported non-GAAP financial measures to the most directly comparable GAAP financial measures are included below.
Three Months Ended
June 30, %
Increase/ (Decrease)
Six Months Ended
June 30, %
Increase/ (Decrease) 2018 2017 2018 2017
CASM Mainline Operations (cents) Cost per available seat mile (CASM) 13.08 12.27 6.6 13.31 12.68 5.0
Special charges (C) 0.20 0.07 NM 0.14 0.09 NM
Third-party business expenses 0.05 0.07 (28.6 ) 0.05 0.06 (16.7 )
Fuel expense 3.14 2.32 35.3 3.05 2.38 28.2
CASM, excluding special charges, third-party business expenses and fuel
9.69
9.81
(1.2 )
10.07
10.15
(0.8 )
Profit sharing per available seat mile 0.17 0.25 (32.0 ) 0.10 0.15 (33.3 )
CASM, excluding special charges, third-party business expenses, fuel, and profit sharing
9.52
9.56
(0.4 )
9.97
10.00
(0.3 )
CASM Consolidated Operations (cents) Cost per available seat mile (CASM) 13.60 12.70 7.1 13.85 13.10 5.7
Special charges (C) 0.18 0.07 NM 0.13 0.07 NM
Third-party business expenses 0.04 0.05 (20.0 ) 0.05 0.06 (16.7 )
Fuel expense 3.38 2.47 36.8 3.28 2.54 29.1
CASM, excluding special charges, third-party business expenses and fuel
10.00
10.11
(1.1 )
10.39
10.43
(0.4 )
Profit sharing per available seat mile 0.16 0.23 (30.4 ) 0.09 0.14 (35.7 )
CASM, excluding special charges, third-party business expenses, fuel, and profit sharing
9.84
9.88
(0.4 )
10.30
10.29
0.1

United Airlines Reports Second-Quarter 2018 Performance
10
UNITED CONTINENTAL HOLDINGS, INC.
NON-GAAP FINANCIAL RECONCILIATION (Continued)
Three Months Ended
June 30, $
Increase/ (Decrease)
% Increase/
(Decrease)
Six Months Ended
June 30, $
Increase/ (Decrease)
% Increase/
(Decrease) (in millions) 2018 2017 2018 2017 Operating expenses $ 9,616 $ 8,571 $ 1,045 12.2 $ 18,372 $ 16,677 $ 1,695 10.2
Special charges (C) 129 44 85 NM 169 95 74 NM
Operating expenses, excluding special charges 9,487 8,527 960 11.3 18,203 16,582 1,621 9.8 Third-party business expenses 29 41 (12 ) (29.3 ) 60 81 (21 ) (25.9 )
Fuel expense 2,390 1,669 721 43.2 4,355 3,229 1,126 34.9 Profit sharing, including taxes 108 154 (46 ) (29.9 ) 125 174 (49 ) (28.2 )
Operating expenses, excluding fuel, profit sharing, special charges and third-party business expenses
$ 6,960
$ 6,663
$ 297
4.5
$ 13,663
$ 13,098
$ 565
4.3
Operating income $ 1,161 $ 1,437 $ (276 ) (19.2 ) $ 1,437 $ 1,757 $ (320 ) (18.2 )
Special charges (C) 129 44 85 NM 169 95 74 NM
Operating income, excluding special charges $ 1,290 $ 1,481 $ (191 ) (12.9 ) $ 1,606 $ 1,852 $ (246 ) (13.3 )
Pre-tax income $ 857 $ 1,277 $ (420 ) (32.9 ) $ 1,041 $ 1,427 $ (386 ) (27.0 )
Special charges and MTM losses on equity investments before income taxes (C)
264
44
220
NM
259
95
164
NM
Pre-tax income excluding special charges and MTM losses on equity investments
$ 1,121
$ 1,321
$ (200 ) (15.1 )
$ 1,300
$ 1,522
$ (222 ) (14.6 )
Net income $ 684 $ 821 $ (137 ) (16.7 ) $ 831 $ 920 $ (89 ) (9.7 )
Special charges and MTM losses on equity investments, net of tax (C)
205
28
177
NM
201
61
140
NM
Net income, excluding special charges and MTM losses on equity investments
$ 889 $ 849
$ 40 4.7
$ 1,032 $ 981
$ 51 5.2
Diluted earnings per share $ 2.48 $ 2.67 $ (0.19 ) (7.1 ) $ 2.96 $ 2.96 $ — —
Special charges and MTM losses on equity investments
0.96 0.14
0.82 NM 0.92
0.31 0.61
NM
Tax effect related to special charges and MTM losses on equity investments
(0.21 ) (0.05 ) (0.16 ) NM (0.20 ) (0.12 ) (0.08 ) NM
Diluted earnings per share, excluding special charges and MTM losses on equity investments
$ 3.23
$ 2.76
$ 0.47
17.0
$ 3.68
$ 3.15
$ 0.53
16.8
United Airlines Reports Second-Quarter 2018 Performance
11
UNITED CONTINENTAL HOLDINGS, INC.
NON-GAAP FINANCIAL RECONCILIATION (Continued)
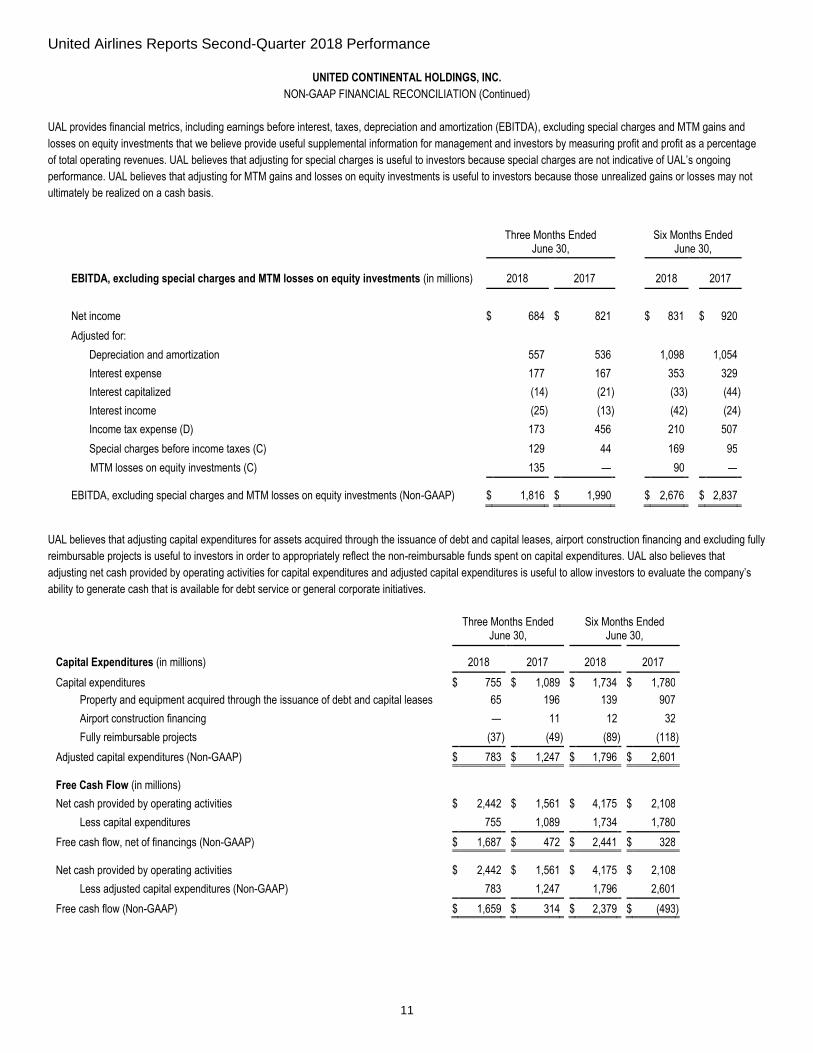
UAL provides financial metrics, including earnings before interest, taxes, depreciation and amortization (EBITDA), excluding special charges and MTM gains and
losses on equity investments that we believe provide useful supplemental information for management and investors by measuring profit and profit as a percentage
of total operating revenues. UAL believes that adjusting for special charges is useful to investors because special charges are not indicative of UAL’s ongoing
performance. UAL believes that adjusting for MTM gains and losses on equity investments is useful to investors because those unrealized gains or losses may not
ultimately be realized on a cash basis.
Three Months Ended
June 30, Six Months Ended
June 30,
EBITDA, excluding special charges and MTM losses on equity investments (in millions) 2018 2017 2018 2017
Net income $ 684 $ 821 $ 831 $ 920 Adjusted for:
Depreciation and amortization 557 536 1,098 1,054 Interest expense 177 167 353 329 Interest capitalized (14 ) (21 ) (33 ) (44 ) Interest income (25 ) (13 ) (42 ) (24 ) Income tax expense (D) 173 456 210 507 Special charges before income taxes (C) 129 44 169 95
MTM losses on equity investments (C) 135 — 90 —
EBITDA, excluding special charges and MTM losses on equity investments (Non-GAAP) $ 1,816 $ 1,990
$ 2,676 $ 2,837
UAL believes that adjusting capital expenditures for assets acquired through the issuance of debt and capital leases, airport construction financing and excluding fully
reimbursable projects is useful to investors in order to appropriately reflect the non-reimbursable funds spent on capital expenditures. UAL also believes that
adjusting net cash provided by operating activities for capital expenditures and adjusted capital expenditures is useful to allow investors to evaluate the company’s
ability to generate cash that is available for debt service or general corporate initiatives.
Three Months Ended
June 30, Six Months Ended
June 30,
Capital Expenditures (in millions) 2018 2017 2018 2017
Capital expenditures $ 755 $ 1,089 $ 1,734 $ 1,780 Property and equipment acquired through the issuance of debt and capital leases 65 196 139 907 Airport construction financing — 11 12 32 Fully reimbursable projects (37 ) (49 ) (89 ) (118 )
Adjusted capital expenditures (Non-GAAP) $ 783 $ 1,247 $ 1,796 $ 2,601
Free Cash Flow (in millions) Net cash provided by operating activities $ 2,442 $ 1,561 $ 4,175 $ 2,108
Less capital expenditures 755 1,089 1,734 1,780
Free cash flow, net of financings (Non-GAAP) $ 1,687 $ 472 $ 2,441 $ 328
Net cash provided by operating activities $ 2,442 $ 1,561 $ 4,175 $ 2,108 Less adjusted capital expenditures (Non-GAAP) 783 1,247 1,796 2,601
Free cash flow (Non-GAAP) $ 1,659 $ 314 $ 2,379 $ (493 )

United Airlines Reports Second-Quarter 2018 Performance
12
UNITED CONTINENTAL HOLDINGS, INC.
NOTES (UNAUDITED)
(B) Select passenger revenue information is as follows (in millions):
2Q 2018 Passenger Revenue (millions)
Passenger Revenue
vs. 2Q 2017
PRASM vs.
2Q 2017
Yield vs.
2Q 2017
Available Seat Miles
vs. 2Q 2017
Mainline $ 4,395 8.7% 1.7% 1.6% 6.9%
Regional 1,786 10.6% 0.9% (1.0%) 9.6%
Domestic 6,181 9.2% 1.7% 1.3% 7.4%
Atlantic 1,824 12.9% 7.9% 0.9% 4.7%
Pacific 1,103 3.7% 3.4% 4.3% 0.2%
Latin America 772 (5.2%) (2.9%) (4.2%) (2.3%)
International 3,699 5.9% 4.3% 1.4% 1.6%
Consolidated $ 9,880 8.0% 3.0% 1.5% 4.8%
Mainline $ 8,045 7.4% 3.0% 1.5% 4.3%
Regional 1,835 10.6% 1.3% (0.6%) 9.3%
Consolidated $ 9,880
United Airlines Reports Second-Quarter 2018 Performance
13
UNITED CONTINENTAL HOLDINGS, INC.
NOTES (UNAUDITED)
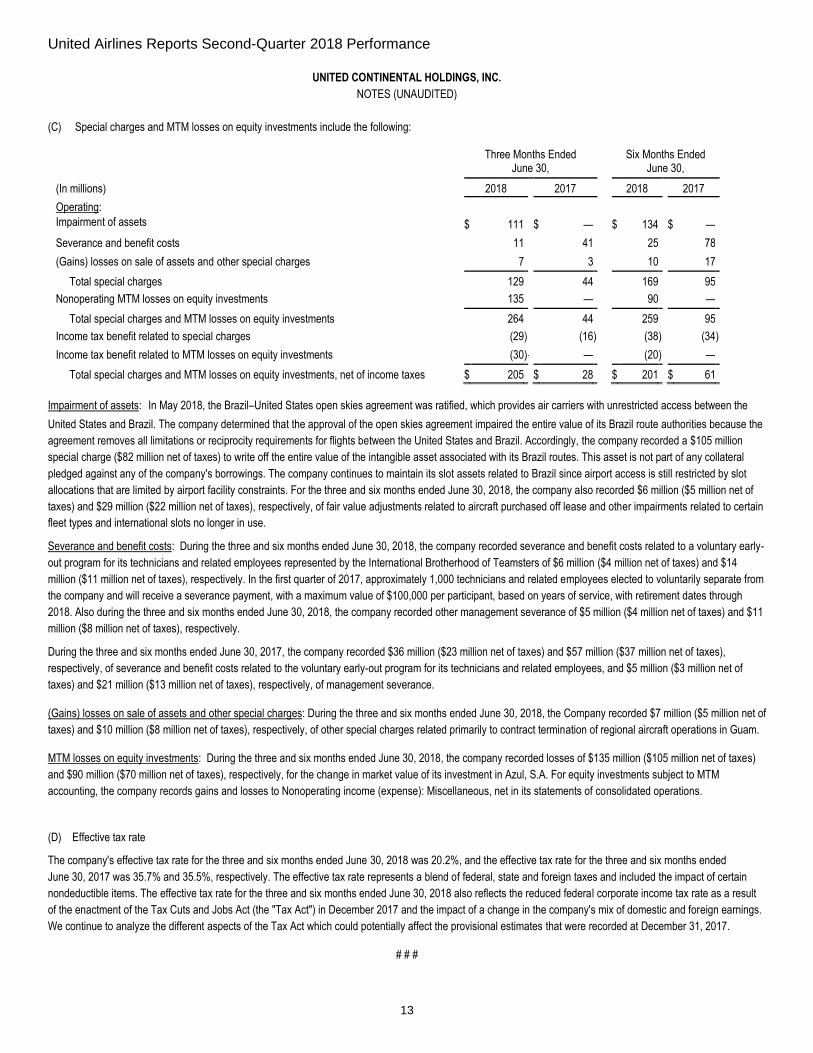
(C) Special charges and MTM losses on equity investments include the following:
Three Months Ended
June 30, Six Months Ended
June 30,
(In millions) 2018 2017 2018 2017
Operating: Impairment of assets
$ 111 $ — $ 134 $ — Severance and benefit costs 11 41 25 78 (Gains) losses on sale of assets and other special charges 7 3 10 17
Total special charges 129 44 169 95 Nonoperating MTM losses on equity investments 135 — 90 —
Total special charges and MTM losses on equity investments 264 44 259 95 Income tax benefit related to special charges (29 ) (16 ) (38 ) (34 )
Income tax benefit related to MTM losses on equity investments (30 ) — — (20 ) —
Total special charges and MTM losses on equity investments, net of income taxes $ 205 $ 28 $ 201 $ 61
Impairment of assets: In May 2018, the Brazil–United States open skies agreement was ratified, which provides air carriers with unrestricted access between the
United States and Brazil. The company determined that the approval of the open skies agreement impaired the entire value of its Brazil route authorities because the
agreement removes all limitations or reciprocity requirements for flights between the United States and Brazil. Accordingly, the company recorded a $105 million
special charge ($82 million net of taxes) to write off the entire value of the intangible asset associated with its Brazil routes. This asset is not part of any collateral
pledged against any of the company's borrowings. The company continues to maintain its slot assets related to Brazil since airport access is still restricted by slot
allocations that are limited by airport facility constraints. For the three and six months ended June 30, 2018, the company also recorded $6 million ($5 million net of
taxes) and $29 million ($22 million net of taxes), respectively, of fair value adjustments related to aircraft purchased off lease and other impairments related to certain
fleet types and international slots no longer in use.
Severance and benefit costs: During the three and six months ended June 30, 2018, the company recorded severance and benefit costs related to a voluntary early-
out program for its technicians and related employees represented by the International Brotherhood of Teamsters of $6 million ($4 million net of taxes) and $14
million ($11 million net of taxes), respectively. In the first quarter of 2017, approximately 1,000 technicians and related employees elected to voluntarily separate from
the company and will receive a severance payment, with a maximum value of $100,000 per participant, based on years of service, with retirement dates through
2018. Also during the three and six months ended June 30, 2018, the company recorded other management severance of $5 million ($4 million net of taxes) and $11
million ($8 million net of taxes), respectively.
During the three and six months ended June 30, 2017, the company recorded $36 million ($23 million net of taxes) and $57 million ($37 million net of taxes),
respectively, of severance and benefit costs related to the voluntary early-out program for its technicians and related employees, and $5 million ($3 million net of
taxes) and $21 million ($13 million net of taxes), respectively, of management severance.
(Gains) losses on sale of assets and other special charges: During the three and six months ended June 30, 2018, the Company recorded $7 million ($5 million net of
taxes) and $10 million ($8 million net of taxes), respectively, of other special charges related primarily to contract termination of regional aircraft operations in Guam.
MTM losses on equity investments: During the three and six months ended June 30, 2018, the company recorded losses of $135 million ($105 million net of taxes)
and $90 million ($70 million net of taxes), respectively, for the change in market value of its investment in Azul, S.A. For equity investments subject to MTM
accounting, the company records gains and losses to Nonoperating income (expense): Miscellaneous, net in its statements of consolidated operations.
(D) Effective tax rate
The company's effective tax rate for the three and six months ended June 30, 2018 was 20.2%, and the effective tax rate for the three and six months ended
June 30, 2017 was 35.7% and 35.5%, respectively. The effective tax rate represents a blend of federal, state and foreign taxes and included the impact of certain
nondeductible items. The effective tax rate for the three and six months ended June 30, 2018 also reflects the reduced federal corporate income tax rate as a result
of the enactment of the Tax Cuts and Jobs Act (the "Tax Act") in December 2017 and the impact of a change in the company's mix of domestic and foreign earnings.
We continue to analyze the different aspects of the Tax Act which could potentially affect the provisional estimates that were recorded at December 31, 2017.
# # #