Embed Size (px)
Citation preview
1
UNIVERSITÀ DEGLI STUDI DI NAPOLI FEDERICO II
Tesi di Dottorato di Ricerca in
Scienze e Tecnologie delle Produzioni Agro-Alimentari
XXI ciclo
SOURDOUGHS FOR SWEET BAKED PRODUCTS: MICROBIOLOGY,
CHARACTERIZATION, SCREENING AND STUDY OF
EXOPOLYSACCHARIDES PRODUCED BY MICROBIAL STRAINS
Supervisor: PhD Student:
Prof. ssa Olimpia Pepe Simona Palomba
Co-ordinator:
Prof. Giancarlo Barbieri
1
CONTENTS INTRODUCTION Cereals fermentation 1 Sourdough 2 Spontaneous sourdough fermentation 3 Sourdough fermentation through backslopping 3 Classification of sourdough 4 Microbial interaction 5 Impact of sourdough on the texture of baked products 6 Acidification effects 6 Protein fraction changes during sourdough fermentation 7 Effect of sourdough on staling 7 Sourdough for sweet baked products 8 Molecular approach to investigate sourdough microflora: PCR-DGGE 9 Microbial exopolysaccharides 10 Classification of exopolysaccharides from LAB 11 Biosynthesis of Homopolysaccharides from LAB 12 Fructans 13 Glucans 14 Biosynthesis of Heteropolysaccharides from LAB 15 Molecular organization of genes involved in HePS biosynthesis by LAB 16 Factors influencing the HePS production by LAB 17 Preparation, isolation and characterization of EPS 18 EPS from LAB in food 19 Application of EPS from LAB in dough processing 19 MATERIALS AND METHODS Characterization of sweet sourdough by culture-dependent and independent methods 21 Sourdough’s analysis 21 pH and TTA 21 Microbiological analysis 21 LAB and yeasts isolation 21 Identification by culture-dependent method 22 DNA isolation from LAB isolates 22 DNA isolation from yeasts isolates 22 PCR conditions 22 Optimization of the method used for the identification by culture-independent technique 23 Production of standardized sordough 23 DNA isolation from sourdough 24 PCR conditions 25 DGGE analysis 26
2
Sequencing of DGGE fragments 26 Screening of bacteria for exopolysaccharides production 27 Strains, media and growth conditions 27 Media optimization for EPS screening 27 Screening of bacteria strains for EPS production on modified Agar Chalmers with sucrose 27 Screening of bacteria strains for EPS production on modified Agar Chalmers with sugars mixture 28 DNA isolation from bacteria strains 28 PCR conditions and DNA sequencing to screen eps genes involved in omopolysaccharides (HoPS) and eteropolysaccharides (HePS) biosynthesis 28 Characterization of exopolysaccharides from Lactobacillus parabuchneri FUA3154 29 Strain, media and growth conditions 29 Isoaltion and purification of EPS 29 Enzyme assay 30 HPLC analysis 30 Screening of eps genes 30 DNA cloning 31 RNA isolation and Reverse transcription PCR 31 RESULTS Characterization of sweet sourdough by culture-dependent and independent methods 33 Microbial counts and chemical determinations of sourdough samples 33 Microbial identification by “culture-dependent” method 33 Phenotypic characterization of bacterial isolates 33 Phenotypic characterization of yeast isolates 33 Molecular identification of LAB strains 34 Molecular identification of yeast isolates 34 Microbial identification by “culture-independent” method 34 Comparison of different DNA isolation methods 34 PCR-DGGE analysis for LAB identification 35 PCR-DGGE analysis for yeasts identification 36 Screening of bacteria isolated from baked products for exopolysaccharides production 36 Media optimization for EPS screening 36 Screening of bacteria strains for EPS production on modified Agar Chalmers with sucrose 37 Screening of bacteria strains for EPS production on modified Agar Chalmers with sugars mixture 37 Molecular screening of eps genes for HoPS and HePS from bacteria strains 38 Characterization of exopolysaccharides from Lactobacillus parabuchneri FUA3154 38 Characterization of exoploysaccharides by HPLC analysis 38
3
Screening of eps genes and sequencing 39 Expression of the epsD/E gene in Lactobacillus parabuchneri FUA3154 39 DISCUSSION Characterization of sourdough samples by culture-dependent and culture-independent methods 40 Screening of bacteria isolated from baked products for exopolysaccharides production 44 Characterization of exopolysaccharides from Lactobacillus parabuchneri FUA3154 47 CONCLUSIONS 48 REFERENCES 49
1
1. INTRODUCTION
Cereals represent the most important food crop. Their cultivation dates back to 7000 B. C. for wheat
and barley, 4500 B.C. for rice and maize, 4000 B.C. for millet and sorghum, 400 B.C. for rye and
100 B.C. for oats. At present, the total global production of food crops amounts is 3.6 billions
tonnes and the 60% are cereals. In develops countries the 70% of the cereals were used for animal
feed. The other part was used for human nutrition. This last one is almost all consumed in cereals
fermented foods. The first use of cereal fermentation was represented by a porridge that was made
of pounded or ground grains, which were later baked.
1.1 Cereals fermentation
Normally, when considering the variety of foods made with cereals, it will be easier thinking about
just fermentation foods. Generally, fermentation is a process that proceeds under the influence of
activities exerted by enzymes and /or microorganisms (Hammes et al., 2005). To know the
microbial ecology of cereals fermentation it is necessary know about the fermentation substrates
like the grains or seeds of the various cereal plants. During the cereals fermentation, the enzymes,
bacteria, yeast and mould can play a role alone or with the combination of all of them togheter, and
finally they contribute to the creation of a great variety of products.
The aim of fermentation process is to achieve this aims:
• Conditioning for wet milling by steeping of maize (Johnoson, 2000) and wild rice (Oelke
and Boedicker, 2000).
• Influencing sensory properties.
• Saccharification by use of koji prior to alcoholic fermentation or producing a sweetened
rice.
• Preservation.
• Increasing food safety by inhibition of pathogen bacteria.
• Enhancing the nutritive value by removing antinutritive compounds (as phytate, enzyme
inhibitors, tannins) and improving the availability of components, for example by affecting
the physio-chemical properties of starch.
• Withdrawing same undesired components as mycotoxins, endougenous toxins, cyanogenic
compounds and flatulence producing carbohydrates.
The cereal fermentation is influenced by different variables (Hammes and Gänzle, 1998):
• Type of cereals determining the fermentable substrates.
• Water content.
• Degree and moment of comminution of the grains.
2
• Components adding to the fermenting substrates.
• Source of amylolytic activities (Hammes et al., 2005).
The kind of cereal used is the major variable, in fact, the amount and quality of carbohydrates,
nitrogen source, growth factors, minerals, buffering capacity and the efficacy of growth inhibitors
are affected.
1.2 Sourdough
The traditional sourdough fermentation is represented by the combined activity of hydrolytic
activities of the grain and LAB and yeast. Essentially it consisted of a mixture of flour and water
that is fermented by microorganisms present. At this aim the grain used must not been heat treated
before to assure the presence of hydrolytic activities. When added water, microorganisms present
will become metabolically active, multiply and with incubation, the most competitive
microorganisms will be dominant. In sourdough, generally, LAB occurring at numbers > 108 CFU
g-1, while the yeast are lower, around 106-107 CFU g-1. The LAB: yeast ratio is generally 1:100
(Ottogalli et al., 1996). Unlike the others fermentation process, where the LAB homofermentative
play a fundamental role, for sourdough fermentation heterofermentative LAB are dominating,
especially when sourdough are prepared by traditional techniques. The LAB present may originate
from a selected natural contaminants in the flour or from starter culture. A big number of studies
were demonstrated that more than 50 LAB species (mostly species of the genus Lactobacillus) and
more then 20 species of yeast (especially species if the genera Saccaromyces and Candida) can
been involved during the fermentation steps. Saccaromyces cerevisiae is frequently for the use of
the baker’s yeast; S. exiguus (Torulaspora holmii or Candida holmii or S. minor), C. humilis (C.
milleri) and Issatchenkia orientalis (C. krusei) are usually associated with LAB in sourdough
fermentation. Otherwise a large variety of yeast was isolated from sourdough, the variability
depends to the degree of dough hydration, the type of the cereals used and the leavening
temperature. Also, the number and species of yeast present in a sourdough depending on the degree
of yeast tolerance to the organic acids produced by the LAB and by the availability sources of
carbon (Pulvirenti et al., 2004). The sourdough microflora is composed of stable associations of
lactobacilli and yeasts, in particular due to metabolic interactions. These microbial associations may
endure for years, although the fermentation process runs under non-aseptic conditions (De Vuyst
and Neysens, 2005). Ecological factors are determining to select the microflora during sourdough
fermentation and also depend on both endogenous and exogenous factors (Hammes et al., 1996;
Vogel et al., 1996). Endogenous factors are determined by the chemical and microbiological
composition of the dough, exogenous depends especially, from the temperature and redox potential.

3
Many effects are due to the process parameters such as dough yield, addition of salt, amount and
composition of starter, number of propagation steps and fermentation time. The impact of this
parameters causes the selection of the characteristic microflora and at the same time prevent the
growth of potential pathogen or alterative microorganisms.
The use of sourdough during the baked good production improved dough machinability, nutritional
properties, organoletic features and prolonged the shelf-life. The disadvantages to use sourdough
are the long time and the labour consuming.
1.2.1 Spontaneous sourdough fermentation
Sourdough is rich of a fermentable carbohydrates and it has a initially pH ranged from 5.0 to 6.2,
that determined a spontaneous development of LAB, derived from cereals or flours. The traditional
sourdough process does not involve the fortuitous microflora but used a mother doughs that they are
continuously propagated for long period. The mother dough represents the natural microbial
inoculum for the subsequent doughs (De Vuyst and Neysens, 2005). During this process, the LAB
immediately dominate on the Gram negative enterobacteria. In this kind of sourdough fermentation
are present both lactobacilli (homofermentative as Lb. casei, Lb. delbrueckii, Lb. farciminis, Lb.
plantarum, and heterofermentative as Lb. brevis, Lb. buchneri and Lb. fermentum) and pediococci
(P. acidilactici, P. pentosaceus). Instead, genera Weisella and Leuconostoc may play a role during
the first part of the fermentation and pediococci species are more frequently in the end of the
fermentation. Finally, in this kind of sourdough, the most common species of yeast that can find are
S. turbidans, S. marchalianus, S. albida, S. exiggus, S. cerevisiae and Saturnispora saitoi (Stolz,
1999).
1.2.2 Sourdough fermentation through backslopping
When this technique is applied, can find a spontaneous microflora and in particular, mostly
heterofermentative LAB. The so called sourdough lactobacilli Lb. sanfranciscensis (Kline and
Sugihara, 1971), Lb. pontis ( Vogel et al., 1994), Lb. panis ( Wiese et al., 1996), Lb.
paraalimentarius (Cai et al., 1999), Lb. frumenti (Müller et al., 2000a) and Lb. mindensis (Ehrmann
et al., 2003) are typical of this sourdough, because their competitive metabolism has adapted to this
environments. Instead, species like Lb. brevis and Lb. plantarum can be considered like a
ubiquitous and Lactococcus species can be used deliberately. In this case, also, same factors can
contribute to the LAB dominance. First, their carbohydrates metabolism is highly adapted to the
main source of energy in the dough, maltose and fructose. Second the growth requirements with a
respect of temperature and pH conditions. Third, the lactobacilli have stress response mechanisms
4
to overcome acids, temperature, osmolarity, oxidation and starvation (De Angelis et al., 2001). In
the end, the production of antimicrobial compounds improves their competitiveness and contributes
to their presence in the sourdough.
1.2.3 Classification of sourdough
Sourdoughs have been classified into three types, based on the kind of technology applied for their
production, as used in artisan and industrial process (Böcker et al., 1995):
• Type I sourdough or traditional sourdough.
• Type II sourdough or accelerated sourdough.
• Type III sourdough or dried sourdough.
• Type 0 dough
The type I sourdough is produced with a traditional techniques and are characterized by a
continuous and daily refreshment to keep the microorganisms in active state, for a high metabolic
activity and to obtain a good leavening with a production of gas. The process is performed at
temperature ranged from 20-30°C. The LAB frequently isolated from this kind of sourdough are Lb.
sanfranciscensis, Lb. pontis, Lb. fructivorans, Lb. fermentum e Lb. brevis and the yeast specie is C.
humilis. The type I sourdough include pure culture, sourdough starter isolated from different origin
(type Ia), mixed culture sourdoughs made from wheat and rye and prepared with multiple stage
fermentation process (type Ib) and finally the sourdough made in a tropical regions fermented at
high temperature (Type Ic).
The type II sourdough is a semi-fluid silo preparation and was born to satisfy the industrial
demands. In this, case the sourdough process is obtained by a continuous propagation and long-term
one-step fermentations to guarantee more production reliability and flexibility. This process is
carried out at a fermentation temperature of 30°C for 2-5 days and after 24 h of fermentation the
sourdough has a pH value of <3.5. In this case the microorganisms are in the last stationary phase
and their metabolic activity is restricted. The LAB species occurs are the obligate homofermentative
as Lb. acidophilus, L. delbrueckii, Lb. amylovorus, lb. farciminis and Lb. johnsonii and
heterofermentative specie as Lb. fermentum, Lb. frumenti Lb. panis, Lb. pontis, Lb. reuteri, and Lb.
brevis and Weisella species, too (Müller et al., 2001; Vogel et al., 1999).
Type III sourdough is dried dough in powder form which are initiated by defined starter cultures
(De Vuyst and Neysens 2001). This kind of sourdough is used especially as a acidifier supplements
and to increase the aroma. It contains LAB that are resistant to the drying process as Lb. brevis or
same facultative heterofermentative species as P. pentosaceus or Lb. plantarum. This form of
sourdough is convenient, simple in use and result in standardized end products.
5
Sourdoughs type I and type II required the addition of baker’s yeast as leavening agent.
In the end, type 0 dough consisted of dough which uses baker’s yeast to obtain the leavening and it
not made with a sourdough fermentation. Anyways, yeast preparation often contain LAB, belonging
mainly to the genera Pediococcus, Leuconostoc and Lactococcus spp. (Jenson, 1998), which can
contribute only to a small degree to the acidification and aroma development (Corsetti and Settanni
2007).
1.2.4 Microbial interaction
Knowledge to develop and increase the stability association between LAB and yeasts in sourdough
it is necessary to prevent the loss of variety of regional specialities and at the same time, to meet
consumer and industry demands. The stable association between LAB and yeast in sourdough
fermentation exists because of their growth requirements with respect of temperature, pH, and
organic acids as well as metabolic interaction. Although in some cases, LAB and yeasts can
compete for the available substrates, resulting in heterogeneous populations that reflect the media
resources and environmental conditions (De Vuyst and Neysens 2001). This can change the mother
completely and quickly in the case of propagation and backslopping (Ottogalli et al., 1996). The
importance of antagonism and synergism between these microorganisms is due to the metabolism
of carbohydrates and amino acids and the production of carbon dioxide (Gobbetti e Corsetti 1997;
Gobbetti et al., 1994a, b).
The typical example of a mutual interaction between LAB and yeasts in sourdough is Lb.
sanfrancisciensis and S. exiguus or S. humilis, in San Francisco French bread and in Panettone. In
fact, Lb. sanfrancisciensis used as a preferred source of energy maltose, while S. exiguus and S.
humilis can not use maltose but sucrose, glucose or fructose as a source of energy. In the other
hand, amino acids production by yeasts stimulates Lb. sanfranciscensis growth (Gobetti et al,
1994c). The lack competition for maltose is essential for this stable association. The sourdough
yeasts do not affect the cell yield of Lb. sanfrancisciensis, because pH is the limiting factor for
growth of the lactobacilli (Lb. sanfrancisciensis does not grow below pH 3.8).
The cell yield of the maltose negative yeasts is lower in the presence of lactobacilli because their
growth is inhibited by the accumulation of metabolic end products. However, the glucose
concentration in the flours remains high enough to support yeast growth throughout the
fermentation (De Vuyst and Neysens 2001). This kind of association in sourdough fermentation can
also influence the CO2 and therefore the leavening (Gobbetti et al., 1995). Finally, the interactions
influence also the synthesis of volatile compounds and therefore the aroma of final products.
6
Anyways, these kinds of interaction are helpful in self-protection sourdough because they can
inhibit the effects of other pathogen and alterative microorganisms.
1.2.5 Impact of sourdough on the texture of baked products
The main advantage of the microbial population in dough is that dough formed by the addition of
water to ground cereals will be fermented by the microorganisms naturally present to become a
sourdough characterized by acid taste, aroma and increased volume due to gas formation (Hammes
and Gänzle, 1998). Generally, the sourdough is used to improve flavour but its addition also as an
effect on the dough and the final baked product structure. In fact, there is a wide consensus with
regard to the positive effects of sourdough addition for bread production, including improvemnts in
bread volume and crumb structure (Coresetti et al., 2000; Clarke et al., 2002; Crowley et al., 2002;
Arendt et al., 2007), flavour (Thiele et al., 2002), nutritional values ( Liljeberg and Björck, 1994;
Liljeberg et al., 1995) and shelf-life (Corsetti et al., 1998b; Lavermiccola et al., 2000, 2003; Dal
Bello et al., 2007). The influence of sourdough on the structure depends of the mechanisms at work
in sourdough and of its application that both are complex. In fact, for example the variety of flour
characteristics and process parameters contribute to conferring particular effects on the metabolic
activity of the sourdough microflora. To obtain a good final product, it is necessary to characterize
the microorganisms responsible of two of main activities: the acidification and the rate of substrate
breakdown. The selection of a characteristic microbiota, during continuous propagation of
sourdough, is due by different parameters as dough yield, addition of salt, amount and composition
of the starter, number of propagation steps and fermentation time (De Vuys and Neysens, 2005). In
fact, as show by Gül et al. (2005), individual strains and combination thereof strongly affect the
final bread texture. Therefore, the ecological composition of each sourdough influences the final
quality of baked products.
1.2.6 Acidification effects
The pH values of ripe sourdough is variable, but for wheat sourdoughs it ranges from 3.5 to 4.3
(Collar et al., 1994a; Wehrle and Arendt, 1998). The main factor regulating acidification is the
amount of fermentable carbohydrates. One of the most important effect on the acidification is the
nature of the flour, in particular its ash content (Collar et al., 1994b).
The acidification of the sourdough and the partial acidification of the bread dough will impact on
structure-forming components like gluten, starch and arabinoxylans (Arendt et al., 2007). Acids
affect the mixing behaviour of the doughs, in fact a dough with a lower pH values needs a shorter

7
mixing time and have a less stability than normal dough. Moreover, the presence of acids influences
also the softness and elasticity of gluten, increasing those (Schober et al., 2003).
The acidification has a secondary effect on the dough, including changes in the activity of cereal or
bacterial enzymes associated. For example, wheat flour proteases have a optimal activity around pH
4.0 (Kawamura and Yonezawa, 1982).
1.2.7 Protein fraction changes during sourdough fermentation
The protein fraction plays a crucial role for baked goods quality. The proteolysis process provides
to the formation of precursor compounds for the formation of aroma volatiles during baking as well
as substrates for microbial conversion of amino acids to flavour precursor compounds. The gluten
proteins in wheat flour determine dough rheology, gas retention and bread volume (Weegels et al.,
1996). The sourdough influence the structure and the rheology, in fact, Di Cagno et al. (2002)
demonstrated a decrease in resistance to extension and an increase in both extensibility and degree
of softening. Acidification due to growth of LAB also alters the gluten network. At pH below 4.0
there is a sizable positive net charge and the increased electrostatic repulsion enhances protein
solubility and prevents the formation of new bonds (Schober et al., 2003). The reduction of
intermolecular and intramolecular disulfide bonds solubilises gluten proteins and allows greater
access by proteolytic enzymes allowing for more efficient proteolysis (Arendt et al., 2007). The
proteolysis activity gives an improvement in final product flavour and also it can change the
rheology and the texture. The gliadin macropolymer is a major determinant of the volume and
texture of wheat breads in a straight dough process; however, when a sourdough fermentation was
used it can obtain a larger loaf volumes (Corsetti et al., 1198a).
1.2.8 Effect of sourdough on staling
For texture properties of a food is understanding as “that group of physical characteristics that are
sensed by the felling of touch, are related to the deformation, disintegration and flow of the food
under the application of a force and are measured objectively by functions of force, time and
distances” (Bourne, 1982). Bakery products have a very short shelf-life; in fact, during their storage
the freshness decreases and in parallel, the crumb will become hardness. All of these aspects
contribute to a loss of consumer acceptance. This deterioration process it knows like a staling that it
has been defined as “a term which indicates decreasing consumer acceptance of bakery products
caused by changes in crumb other than those resulting from the action of spoilage organisms”
(Bechtel et al., 1953). During this process the changes of texture of crumb are: the crumb becomes
8
harder, crumbly an opaque. The crust staling is caused by moisture migration from the crumb to the
crust (Lin and Lineback, 1990) with a consequent soft and leathery texture.
It was demonstrated that the use of LAB in sourdough fermentation have a positive effects on
staling process. One effect is an improvement in a loaf specific volume, which is associated with a
reduction in the rate of staling (Axford et al., 1968; Maleki et al., 1980) and a reduction in crumb
softness during the storage also (Corsetti et al., 2000; Crowely et al., 2002). This effect of
sourdough is dependent from the strain performing the fermentation. The enzymes produced by
LAB can influence starch molecules, causing a variation in the retrogradation properties of the
stearch. The proteolytic enzymes can affect the final quality of the baked product, in fact. It was
studied the addition of a protease can increases the shelf-life (Van Eijk and Hille, 1996). The
proteases also support the liberation of water associated protein network that increasing the alpha
amylase activity.
1.2.9 Sourdough for sweet baked products
Sweet leavened baked products obtained from sourdoughs are developed especially in northern Italy
and they are also typical and traditionally made for religious feasts by small and industrial sized
bakeries. They are usually, Panettone cake in Milan and Pandoro in Verona manufactured for
Christmas, while Colomba is a Milanese cake for Easter. There are also, local products as Bisciola
in Valtellina, Lagaccio biscuits in Genoa, Focaccia Dolce in the Venetian region and finally, some
snacks for breakfast like Brioches and Cornetti and other small industrial cakes for infants. Despite
their geographical origin, these cakes have a national and international diffusion. The production
processes for all this products are different but they are in common the use of a particular cycle of
preparation starting from a sourdough (or “madre”-mother sponge), reproduced in a continuous way
that consists of a natural mixed cultures obtained by spontaneous selection of the original
microflora of the flour. The main ingredients used for this kind of products are flour, water, eggs
sugar, butter and/or margarine and in the case of Panettone and Colomba candied fruit and raisins,
too.
Nowadays, a lot of studies were focalized the attention to the study of microflora isolated from
bread sourdoughs; otherwise, the microbiota study of sweet baked products are still limited in
comparison to the others. Galli and Ottogalli (1973) were the first one to carry out the microbial
characterization of sourdough for Panettone, identifying strains belonging to Lb. brevis and T.
holmii strains; while for Pandoro characterization, Zorzanello and Sugihara (1982), were the first
one. Afterwards, Galli et al. (1988) characterized the microflora of sourdoughs for Brioche and
9
Panattone were they can identify strains belonging to Lb. sanfranciscensis, Lb. brevis and Ln.
mesenteroides species and yeasts ascribed to C. stellata and S. exiguus species.
In this kind of technology, sometimes, it is a traditional practice to add vegetable matters as grape
most, figs, lemon or orange peels, bran etc., to the starting dough to prepare the mother culture and
therefore this can influencing the final microflora (Foschino et al., 2004). Some sourdough used to
make Panettone and Pandoro are more then six years old and are preserved according to one’s
private custom carried on from generation to generation. All of these characteristic make the
microflora characterization and the reproducibility more difficult.
1.3 Molecular approach to investigate sourdough microflora: PCR-DGGE
The use of molecular approach to identify and characterize the sourdough microflora can decrease
the variability and instability of certain phenotypic characters and the dependence of culturing
conditions. Culture-dependent method does not necessarily provide reliable information about the
microbial communities and indeed these communities can have species that would be not cultivable
with usual culture method. Molecular methods are also characterised by rapidity and reliability.
Genetic fingerprinting techniques can provide a profile representing the genetic diversity of
microbial communities. In addition, the PCR-DGGE has a great potential for comprehension of the
community dynamics in response to variations in technological parameters. One of the most
important features of a molecular approach is the possibility to monitor the presence and persistence
of microorganisms in the ecosystem without any cultivation. Denaturing Gradient Gel
Electrophoresis (DGGE) of rDNA amplicons was established in evaluation or compositions and
activity over time in complex ecosystem (Ehrmann and Vogel, 2005; Heilig et al., 2002; Muyzer
and Smalla, 1998). DGGE is the most common methods used among the culture-independent
fingerprinting techniques. It is based on the separation of polymerase chain reaction (PCR)
amplicons of the same size but different sequences. This is because these fragments can be
separated in a denaturing gradient gel based on their differential denaturation (melting) profile
(Ercolini, 2004). The final result is a fingerprinting which contains different bands relative to a
microbial species present in a sample analyzed. The technique was introduced firstly, in microbial
ecology by Muyzer et al., (1993). The application of PCR-DGGE in microbiology environmental is
extremely wide; in fact, this method is versatile and has been used in many fields of microbial
ecology. For this reason, was applied for soli studies (Norris et al., 2002; Avrahami et al., 2003;
Nicol et al., 2003); sea (Bano and Hollibaugh, 2002), gastrointestinal tract (Zoetendal et al., 2002),
insects (Reeson et al., 2003) and more other kind of environmental.
10
In conclusion, both phenotypic and genotypic characterization can be used of a polyphasic
approach. In fact, the identification of pure cultures and the characterization of mixed microbial
communities are both useful to understand the complex microbial communities in sourdoughs are
occurring. PCR-DGGE has been successfully applied to the study of the LAB composition of
fermented cereal-based products (Ampe et al., 2001; ben Omar and Ampe, 2000; Garofalo et al.,
2008; Gatto and Torriani, 2004; Meroth et al., 2004; Meroth et al., 2003a; Miambi et al., 2002;
Randazzo et al., 2005; Scheirlinck et al., 2008; Van der Meulen et al., 2007b) and to compare
sourdough LAB communities subjected to different fermentation processes (Meroth et al., 2004;
Meroth et al., 2003a). This method also was applied to study the yeasts community during
sourdough fermentation (Garofalo et al., 2008; Gatto and Torriani, 2004; Meroth 2003b). In
particular, Garafalo et al., (2008) were studied the LAB and yeasts population in sourdoughs used
for Panettone production and they carried out the dominance in all three samples of Lb.
sanfranciscensis, Lb. brevis and C. humilis.
1.4 Microbial exopolysaccharides
Polymer from plant, animal, and microbial origin play an important role in food fermentations
(Tombs and Harding, 1998). Most of the biopolymers used in food industry are polysaccharides
from crop plants (e.g. starch) or seaweeds (e.g. carrageenen) and animal proteins like caseinate and
gelatin. For industry use this kind of polymer are chemically modified. A good alternative of
biothickners are the microbial exopolysaccharides. The first description of exopolysaccharides
formation by wine-spoiling LAB dates back to Pasteur (Pasteur 1861, as cited by Leathers, 2002).
After that, Orla-Jensen (1943) described EPS formation from sucrose by Leuconostoc spp.,
mesophilic lactobacilli and pediococci and indicated the role of EPS formation in the spoilage of
apple cider and beer. These polysaccharides are extracellular polysaccharides that they are
associated with the cell surface in the form of capsule or secreted into the environmental in the form
of slime (De Vuyst et al., 2001). The first kinds of exopolysaccharides are called capsular (CPS)
and the other slime (EPS). Exist also cell wall exopolysaccharides (WPS), that in contrast with EPS,
are not released into the medium and are associated with the cell envelope and they are covalently
bound to the peptidoglycan layer (Delcour et al., 1999). In general, some strains can produce both
kind of polysaccharides, whereas others strains ar able to produce only one kind. It can exist
different phenotypic forms of EPS, ropy and mucoid, determined by environmental conditions.
Ropy EPS is defined by viscous ropes longer than 5mm, originating from the colony when the
colony is touched. Instead, mucoid EPS imparts a slimy appearance to the colony but does not
produce viscous ropes (Knoshaug et al., 2000). EPS from LAB can also divide in two groups:
11
homopolysaccharides (HoPS) and heteropolysaccharides (HePS). In particular, the HoPS are
composed of one type of monosaccharides and the HePS are composed of a backbone of repeated
subunits (Monsan et al., 2001; De Vuyst et al., 2001).In Gram-negative bacteria polysaccharides are
presented in the form of the O-antigens of the lipopolysaccharides (LPS). EPS are diffused widely
among bacteria, microalgae and less among yeasts and fungi (Sutherland, 1990-1998; Crescenzi,
1995). EPS have different function as a protection against toxic and/or limiting environments and
other antagonisms (Sutherland, 1972; Whitfield, 1988; Weiner et al., 1995; Roberts, 1996; Forde
and Fitzgerald, 1999; Looijesteijn et al., 2001); but also as a protection against desiccation,
phagocytosis, phage attack and antibiotics; as a stimulating adhesion to solid surfaces and formation
o biofilms; as a sequestering of essential cations, as colonization and in cellular recognition. Some
EPS may contribute to patnogenicity (Forsen et al., 1985; Roberts, 1995-1996; Whitfield and
Valvano 1993). The bacteria can not use EPS like a food reserve because they are not able to utilize
them (Cerning, 1990). A good example of industrially microbial EPS is dextran from Leuconostoc
mesenteroides, xanthan from Xanthomonas campestris and EPS of the gellan family from
Sphingomonas paucimobilis (Sutherland, 1986, Roller and Dea, 1992; Crescenzi 1995; Banik et al.,
2000). The EPS use in food industry is limited from economics factors, which requires a thorough
knowledge of their biosynthesis and an adapted bioprocess technology, the high costs of their
recovery and the non-food bacterial origin of most of them. For these reason, strains recognized as
safe (GRAS) food grade microorganisms, in particular LAB, dairy propionibacteria and
bifidobacteria, which are able to produce EPS in large amounts, are an interesting alternative for
food uses of EPS. Therefore, this kind of bacteria can use for the in situ production of EPS, in
particular, for fermented foods to improve their rheology, texture and body. It has been suggested
that EPS from LAB can confer health benefits (De Vuyst et al., 2001). Their benefits for human
health consist in the availability to remain for longer in the gastrointestinal tract, thus enhancing
colonization by probiotic bacteria (German et al., 1999). In addition, the EPS have been claimed to
have antitumor effects (Kitazawa et al., 1998), immunostimulatory activity (Hosono et al., 1997;
Chabot et al., 2001) and to lower blood cholesterol (Nakajima et al., 1992). Finally, LAB have a
potential for development and exploitation as food additives or functional food ingredients with
both economical an health benefits.
1.4.1 Classification of exopolysaccharides from LAB
EPS from LAB can divide in two groups: homopolysaccharides and eteropolysaccharides. HoPS are
constituted of one type of constituting monosaccharides (D-glucopyranose or D-fructofuranose) and
can be clustered into four groups: α-D-glucans, β-D-glucans fructans and others, like polygalactan.
12
Strain-specific differences depend on the degree of branching and the different linking sides. In fact,
most of the HoPS are characterised to be synthesized by extracellular glycansucrases using sucrose
as the glycosyl donor. Some examples of HoPS are cellulose, dextran, mutan, alternan, pullulan,
levan and curdlan. HoPS have high molecular weights.
HePS are compose of a backbone o repeated subunits, that are branched (at positions C2, C3, C4 or
C6) or unbranched, and that consist of three to eight monosaccharides, derivates of
monosaccharides or substituted monosaccharides. The monosaccharides can be present in α- or β-
anomer in the pyranose or furanose form. LAB can secrete different kinds of HePS in according to
the sugar composition and the molecular mass that can be ranged from 1.0 X 10⁴ to 6.0 X 10⁶
(Cerning, 1995; De Vuyst and Degeest, 1999). The most frequently monosaccharides constituting
the HePS are D-galactose, D-glucose and L-rhamnose that they are almost ever present but in
different ratio. Some HePS can contain the acetylated amino sugars as N-acetylgalactosamine or N-
acetylglucosamine and also residues such as glucoronic acid and sn-glycerol-3-phosphate. Small
amounts of xylose, arabinose, mannose and uronic acids can be also present but are probably due to
contamination from cell wall and/or medium components that persist during isolation and
purification (De Vuyst et al., 2001). The media and culture conditions may be one of the most
factors influencing the HePS monomer composition and variations in glycosidic bonds (De Vuyst
and Degeest, 1999; Degeest et al., 2001b). Exopolysaccharides are synthesized in different growth
phases and under variety of conditions. HoPS are synthesized outside the cell in the presence of a
donor molecule, sucrose and an acceptor. Instead, HePS synthesis differs from HoPSsynthesis in
that they are produced at the cytoplsmic membrane utilizing precursosrs formed intracellulary. In
this case, sugar nucleotides play an essential role due to their role in sugar interconversions as well
as sugar activation, which is necessary for monosaccharide polymerization (Cerning, 1990).
1.4.2 Biosynthesis of Homopolysaccarides from LAB
In the LAB three different system for sugar uptake are known (de Vos and Vaughan, 1994): 1)
primary transport system or a direct coupling of sugar translocation with ATP hydrolysis via a
transport-specific ATPase; 2) secondary, sugar transport systems or a coupling of sugar transport
with transport of ions or other solutes, both as symport and antiport transport systems; 3) group
translocation systems or a coupling of sugar transport with phosphorylation via the
phosphoenolpyruvate (PEP)-dependent phosphotransferase system (PTS). In the most of LAB
strains all sugar are transported via sugar-specific PEP-PTS system, with only one ATP consumed.
Most of the HoPS share the feature of being synthesized by extracellular glycansucrase using
sucrose as the glycosyl donor. Most of these polymers are not produced by glycosyltransferases
13
wich use nucleotide-sugar precursors, but by transglycosylases (glycansucrases) which are able to
use the energy of the osidic bond of sucrose to catalyse the transfer of a corresponding glycosyl
moiety:
Sucrose
Over the synthesis of high-molecular-mass polymers, glycansucrase catalyse the production of low-
molecular-mass oligosaccharides when efficient acceptor molecules, as maltose are present during
the reaction (Koepsell et al., 1952):
Sucrose + Acceptor
In general, three reactions are catalyzed by glycosyltransferases, the hydrolysis of sucrose, the
formation of oligosaccharides with a degree of polymerization ranged from 2 to 6 and the formation
of polysaccharides with a relative molecular mass, more then 106. This enzyme catalyze a (1)
hydrolysis reaction using water like an acceptor molecule. In an acceptor reaction (2) sucrose or
kestose act as acceptors, yielding in the β-(2-1) linked oligosaccharides kestose and nystose,
respectively. The polymerisation (3) of fructose to a levan chain yields a high-molecular-mass
polymer with β-(2-6) linkages in the main chain that may be branched with β-(2-1) linkages
(Tieking and Gänzle, 2005). Fructan and glucansucrase enzymes are extracellular or cell wall bound
enzymes. Glucansucrases generally are composed of four domains: domain A, an N-terminal export
signal; domain B, a variable region with no role in catalysis; domain C, the highly conserved
catalytic core and domain D, a C-terminal core, which are responsable for glucan binding (Remaud-
Simeon, 2000). Instead, fructosyltransferases consist of an export signal (domain A), a N-terminal
variable domain (domain B) and the catalytic domain with conserved residues (domain C). These
two enzymes are a optimal activity at pH 5.4.
1.4.2.1 Fructans
Two types of fructose HoPS are produced by fructosyltransferases from sucrose: levan and inulin,
which have β-2.6 and β-2.1 osidic bonds, respectively (Monsan et al., 2001). About the synthesis of
fructose a little is known. The proposal mechamism of catalysis for fructosyltransferases is a two
step mechanism in which an acidic group and a nucleophilic group of the enzymes are involved in
the transfructosylation reaction (Sinnot, 1990).
Levansucrase catalyses the transfer of D-fructosyl residues from fructose to yield the β-2.6 osidic
bonds which characterized a levan (Figure 1A). Instead, fructooligosaccharides containing β-2.1
Glucansucrase
Fructansucrase
Glucan + Fructose
Fructan + Glucose
Glucansucrase
Fructansucrase
Glucooligosaccharide + Fructose
Fructooligosaccharide + Glucose
14
osidic bonds have a nutritional value, in fact, they are non digestible and also have a interesting
prebiotic properties for both animals and humans (Tokunaga et al., 1193; Bouhnik et al., 1999;
Diplock et al., 1999). These kinds of fructooligosaccharides are called “Inulin-type” (Figure 1B).
1.4.2.2 Glucans
The enzymes glucansucrases catalyse the synthesis of a variety of glucans containing mostly α-1.6,
α-1.3, α-1.4 and α-1.2, linked D-glucosyl units. Extracellular glucansucrases are mostly produced
by LAB belonging to the genera Leuconostoc, Streptoccocus and Lactobacillus. Different strains
can produce more than one glucansucrase: for example, S. mutans 6715, are able to produce three
distinctive enzymes (Shimamura et al., 1983), four are produced by S. sobrinus (Walker et al.,
1990), three by Ln. mesnteroides NRRL B-1355 (Smith et al., 1998). The catalytic mechanism of
glucansucrases has not been clarified. The main step of the transfer of the D-glucosyl unit is the
formation of a covalent glucosyl-enzyme intermediate. Moreover, in the absence of sucrose in the
reaction medium, glucansucrases can catalyse disproportion reactions involving oligosaccharides as
substrates (Lopez-Munguia et al., 1993). Glucan polymer synthesis follows a processive
mechanism. This is deduced from the observations that intermediate oligosaccharides cannot be
detected in the reaction medium during the synthesis, and high molecular weight polysaccharides
are obtained at early reaction times (Monsan et al., 2001). Several kinds of glucans are obtained
from the action of glucansucrase. The mayor example is the dextran. In 1862 Pasteur discovered the
microbial origin of the gelification of cane sugar syrups and after that, in 1874, the corresponding
product was named “dextran” (Figure 2A), due to its positive rotatory power. The microorganism
responsible of the gelification was Ln. mesenteroides. Hehre (1941) demonstrated that dextran
could be synthesized from sucrose by a cell-free filtrate. The correspondent enzyme is the
dextransucrase (Hestrin et al., 1943) that produces glucan which contain at least 50% of α-1.6
osisdic bonds within the main chain (Bucholz and Monsan et al., 2001). Dextransucrase catalyses
the transfer of the glucosyl unit of sucrose to different “acceptor molecules” which are normally the
growing dextran chain (Lacaze et al., 2007). The degree of branching involving α-1.2, α-1.3 and α-
1.4 linkages in different kind of dextrans. All of the dextrans are more or less ramified and the
branching very much depends on the subspecies. Dextrans molecular weights ranged from 1.5 x 10⁴
to 2 x 10⁷. Other kind of glucan is the mutan (Figure 2B). Mutansucrase produces a water in-soluble
glucan containing more than 50% of α-1.3 glucosidic linkages, mainly associated with α-1.6
linkages. The last more famous glucan is the alternan (Figure 2C). Alternansucrase synthesizes the
glucan, which contains alterning of α-1.6 and α-1.3 glucosidic linkages, with sime degree of α-1.3
branchings. This enzyme activity is bound to the bacterial cells and is more thermostable than the
15
dextransucrase activity. Finally, some LAB can produce called β-1.3 glucan. In fact, Lactobacillus
subsp. G-77 has been reported to produce two glucose homopolysaccharides when grown on a
glucose medium (Duenas-Chasco et al., 1998). One of the exopolysaccharides was shown to be a 2-
substituted-(1-3)-β-D-glucan identical to that described for the exopolysaccharides from P.
damnosus 2,6 (Duenas-Chasco et al., 1997). This is the first time that some LAB can produce β-
glucan. The mechanism of synthesis was not been clarify bit it does not involve any glucansucrase,
because sucrose was not present in the medium used. The second homopolysaccharides is a
dextran-type polysaccharide with α-1.2 branching of a single D-glucose unit.
1.4.3 Biosynthesis of Heteropolysaccarides from LAB
The biosynthesis of HePS is an energy-demanding process. First, one ATP is necessary for the
conversion of each hexose substrate molecule to a hexose phosphate, if the hexose is not transported
via a PEP-PTS. A further high-energy phosphate bond is needed for the synthesis of each sugar
nucleotide and one ATP is required for the phosphorylation of the isoprenoid lipid carrier. Finally,
polymerization and transport need much energy. HePS are made by polymerization of repeating
unit precursors formed in the cytoplasm (Cerning, 1990-1995; De Vuyst and Degeest, 1999). These
are set up at the membrane by the sequential addition of activated sugars to the growing repeating
unit that is most anchored on a lipid carrier. After completion of a HePS repeating unit becoming
polymerized into a final HePS. Enzymes and proteins are involved during biosynthesis of EPS.
Mesophilic LAB are able to produce more EPS under sub-optimal growth conditions, while HePS
production from thermophilic LAB strains are associated to the growth. The biosynthetic pathway
can be broken down into four separate reaction sequences. These are the reactions involved with
sugar transport into the cytoplasm, the synthesis of sugar-1-phosphates, activation of and coupling
of sugars, and the process involved in the export of the EPS. These proces is schematized in Figure
3. Glucose-1-phosphate and fructose-6-phosphate are key intermediates linking HePS biosynthesis
to the general energy metabolism (Boels et al., 2001a; Ramos et al., 2001). Glucose-1-P is
converted to the sugar nucleotides dTDPrhamnose, UDP-galactose, or UDP-glucose, Fructose-6-P
serves as precursor for UDP-GalNac and GDP-fucose (Boels et al., 2001b). The repeating unit is
assembled from the sugar nucleotides by sequential activity of dedicated glycosyltransferases and in
attached to the membrane carrier undecaprenylphosphate during assembly. This lipid II carrier is
also involved in assembly and export of murein repeating units. Export of the repeating units is
thought to occur through a “flippase”, followed by extracellular polymerisation. The enzymes
involved in this process from LAB are homologous to proteins involved in biosynthesis of the O-
antigens of Gram negative bacteria (Jolly and Stingele, 2001).
16
The biosynthesis of activated sugars like UDP-glucose, UDP-galactose and TDP-rhamnose is
necessary for both sugar interconversion reactions (epimerization, decarboxylation and
dehydrogenation) and glycosyltransferase activities. Two different ways exist for the biosynthesis
of ribonucleotides: 1) de novo synthesis from internalized or newly synthesized precursors and 2)
salvage pathways, from the catabolism of pre-existing nucleotides. Deoxyribonucleotides are
generated from reduction of ribonucleotides. It has been shown that 5-phosphorylribose 1-
pyrophosphate, an intermediate in biosynthesis of nucleotides. In bacteria, these genes involved in
the metabolism of nucleotide may be either clustered or isolated along the chromosomal DNA. An
example is the deo operon from Lc. Lactis involved in the degradation of nucleotides (Duwat et al.,
1997).
1.4.3.1 Molecular organization of genes involved in HePS biosynthesis by LAB
A complex genetic organization is responsible for HePS biosyhthesis. Besides the specific eps/cps
genes, HePS biosynthesis also requires a number of “housekeeping” genes for synthesis of sugar
nucleotides from which HePS is built (De Vuyst et al., 2001). The gene organization was the first
time described for S. thermophilus Sfi6 (Stingele et al., 1996-1999a) (Figure 4). The similarity
between the HePS gene clusters from different LAB is most remarkable (Jolly and Stingele, 2001).
These gene clusters, which are well conserved at the 5′ region, code for regulation, chain length
determination, biosynthesis of the repeating unit, polymerization, and export (Broadbent et al.,
2003; Van der Meulen et al., 2007). This strain had a eps gene cluster of 14,5-kb
epsABCDEGHIJKLM comprises 13 genes. The gene cluster epsABCDEGHIJKL has also been
identified, cloned and sequenced (Griffin et al., 1996; Almiron-Roig et al., 2000). The genes epsA,
epsB, epsC and epsF that have a variable divergence with related sequences are mosaic genes. The
two distal region epsAB and pgm and a small central region that contains orf14.9 are costant and
present in most S. thermophilus strains studied. The other region are variable, however not all
strains were found to be ropy in skim milk (Bourgoin et al., 1999). Generally, for thermophilic LAB
the eps genes are chromosomal; instead, for mesophilic LAB almost all genes are associated with
plasmids. The eps genes in S. thermophilus strains may have undergone numerous rearrangements
by homologous recombination between distantly related or unrelated sequences, as a result of
horizontal transfers of DNA with the transferred sequences replacing a part of the original ones.
These exchanges may explain for the variability of the eps loci and also the appearance of novel
structures. The general organization, transcriptional direction and deduced functions of the genes in
different eps gene clusters seem to be highly conserved. The genes seem to be organized in four
functional regions (Van Kranenburg et al., 1997): a central region with genes showing homology
17
with glycosiltransferases, two regions flanking the central region that show homology to enzymes
involved in chain length determination, polymerization and export and a regulatory region located
at the 5’ end of the gene cluster.
The instability and variability in HePS production is maybe at the genetic level as well as for the
ropy texture. Also, it is possible that some spontaneous mutation occurred with consequent weaker
production or even an altered HePS composition. Finally, not all ropy strains are suitable for large-
scale industrial fermentations and ropy strains in use have to be periodically re-isolated to maintain
HePS production. The genetic instability could be due to mobile genetic elements like insertion
sequences or to a generalized genomic instability, including DNA deletions and rearrangements.
1.4.3.2 Factors influencing the HePS production by LAB
The total yield of EPS produced by the LAB depends on the composition of the medium (carbon
and nitrogen sources, growth factors) and the conditions in which the strains grow like temperature,
pH, oxygen tension and incubation time. The first media used to study the EPS production was
milk, after that test was assed on MRS medium (Cerning et al., 1990-1992; Garcia-Garibay and
Marshall, 1991; De Vuyst et al., 1998). Also whey and whey-based media have been used
(Knoshaug et al., 2000). In the last years semi-synthetic and synthetic media have been investigated.
To study the influence of nutrients on growth, metabolic pathways and the biosynthesis of EPS is
more appropriate a chemically media with carbohydrate source, amino acids, vitamins, nucleic acid
bases and mineral. These kinds of media allow the quantitative and qualitative production of the
HePS and the investigation of the exact composition of the HePS produced. Instead, media
containing complex nutrients like beef extract, peptone and yeast extract are not suitable because of
interference of these compounds with the monomer and structure analysis of the HePS (Degeest et
al., 2001). Enhanced HePS production and growth were obtained on the basis of the ingredients and
media used. In fact, when casein was added to skim milk cultures of cultures of Lb. delbrueckii
subsp. bulgaricus (Cerning et al., 1990), instead, the addition of hydrolyzed casein to MRS does not
increase the EPS production. An other example was a supplementation of milk and milk ultrafiltrate
with glucose or sucrose stimulates the HePS production of Lb. casei. Finally, not only the nature of
the carbon source and the combination of monosaccharides, but also their concentration can have a
stimulating effect on the HePS biosynthesis (Gamar et al., 1997). To achieve a good yield of EPS, it
was shown that an optimal balance between the carbon and nitrogen source is necessary (Degeest
and De Vuyst, 1999-2000; De Vuyst et al., 1998). Also the vitamins can influence the EPS
production relative to cell growth. Optimal conditions of temperature, pH oxygen tension, agitation
speed and incubation time can improve HePS yields (Kojic et al., 1992; Looijestein and

18
Hugenholtz, 1999; Petry et al., 2000). Some studies were show that low temperatures induce slime
production (Mozzi et al., 1995a-1996a; Breedveld et al., 1998). For example, Gamar-Nourani et al.,
(1998), found that a temperature shift (from 37°C to 25°C) at the beginning of the exponential
growth phase enhances the HePS production by Lb. rhamnosus C83. Other studies demonstrated
that higer HePS production by LAB strains at higer cultivation temperatures (De Vuyst et al., 1998)
and under conditions optimal for growth, for istance with to respect to pH (De Vuyst et al., 1998;
Grobben et al., 1998) and oxygen tension (De Vuyst et al., 1998; Petry et al., 2000). In general, the
agitation does not influence growth HePS production. Optimal pH conditions for production of the
HePS are often close to pH 6.0 (Mozzi et al., 1994; Looijestein and Hugenholtz, 1999, De Vuyst et
al., 1998). It was also show that the HePS production under growth conditions with continuously
controlled pH is significantly higher than in acidifying batch cultures; therefore, it seems that the
effect of pH adjustment is greater that that of supplementation with nutrients (Gassem et al., 1997,
Degeest et al., 2001). The pH effect could be a problem when considering industrial exploitation of
the HePS-producing LAB strains during fermentation.
The yield of intracellularly synthesized HePS by different LAB strains varies from 0.045 to 0.350
g/L when the bacteria are grown under non-optimized culture conditions. When the bacteria was in
optimal culture conditions result in HePS yields from 0.150 to 0.600 g/L, depending on the strain
(Cerning 1990; Ricciardi e Clementi, 2000).
1.4.4 Preparation, isolation and characterisation of EPS
The starting point for EPS production is the preparation of a culture inoculum and this is the first
point where we can have some contaminations. For EPS isolation are necessary subculturing steps
to remove unwanted high-molecuar mass material. To characterize EPS, is necessary an isolation of
polysaccharides, without alter the chemical and physical properties. Exist different methods to do it;
the first is the use of pronase (Cerning et al., 1986-1988); an other one involved the addition of
trichloroacetic acid for the precipitation (Garcia-Garibay and Marshall, 1991); at the end,
sometimes to precipitate used different concentration of ethanol (Korakli et al., 2002). LAB can
synthesise mixtures of EPS. They can produce EPS with different structures or with identical
structures but different molecular masses.
Before a polysaccharide can be considered characterised, it is necessary to have information about
molecular mass, to identify the composition and composition of the monomers and to determine the
linkage pattern of the monomers (Laws et al., 2001). To determine the molecular mass exist
different methods, one of them it is the chromatography using refractive index detection (Cerning et
al., 1986). Also to detect the monomer composition exist a large variety of techniques. Some

19
examples are the methanolysis and per-trimethylsilylation that provides samples that can be
analysed by GLC. In the end, to determine pattern of the monomers can be used a NMR
spectroscopy or HPLC analysis.
1.4.5 EPS from LAB in food
The commercial exploitation of EPS, as materials for enhancing the texture and mouthfeel of food,
requires the synthesis of EPS having desirable physical properties and for the EPS to be available in
sufficient quantities to match demand. At the present, EPS from LAB are not really exploited by
industrial manufactures. In the last years, few exceptions were developed among the HoPS
produced by LAB (Sutherland, 1990; Tombs and Harding, 1998). In fact, the dextran and its
derivates find several commercial uses like in the manufacture of gel filtration products and as
blood volume extenders. Other uses of dextran are in paper and metal-palting processes and as food
syrup stabilizers, as conditioner, stabilizer and dough improvers. Also levan can be used in food
application like a biothickener. Fructo-oligosaccharides (FOS) have interesting properties for food
apllications as they have a low sweetness compared to sucrose, are essentially calorie-free and
noncariogenic (Yun, 1996). The application of FOS and inulin in food are based essentially on their
prebiotic properties (Tieking and Gänzle, 2005). One of the first application in food processing was
in Scandinavian fermented milk drinks like viili display firm, thick, slimy, consistency (Toba et al.,
1990). Also in some Europe countries dairy starter cultures that contain slime-forming LAB strains
are commercially available. Ropy, thermophilic LAB starter cultures for yoghurt production are
used. For the production of kefir, effervescent drink fermented from grains, some strains producing
EPS were used. The intentional and controlled use of HePS from LAB as natural food additives or
of functional starter cultures could result in a safe, natural end-product. This can represents an
important strategies to develop novel food products, especially, food products with enhanced
rheological properties, improved texture and stability and/or water retention capacity. An example
of application is during yoghurt manufacture, to resolve the problems of low viscosity, gel fracture
or high syneresis.
1.4.5.1 Application of EPS from LAB in dough processing
The addition of plant polysaccharides is a common practice in the production of baked products to
improve textural properties and shelf life. The use of EPS-producing sourdough starters meets the
strict requirements of modern baking biotechnology for clean labels and consumer demands for a
reduced use of additives (Di Cagno et al., 2006). Several studies demonstrated that fructan and FOS
improve rheological properties of wheat doughs and bread quality (Takehiro et al., 1994; Yasushi
20
and Akifumi, 1993). Some studies provided evidence that EPS effectively improve dough
reological parameters and final quality (Brandt et al., 2003; Tieking et al., 2003). It was showed that
the addition of dextran to a level of 5g/kg flour affected the viscoelastic properties of wheat doughs
and the volumes of the corresponding breads to a greater extend than addition of the same levels of
reuteran or levan (Tieking et al., 2003). Also, the US patent 2983613 (Bohn, 1961) reported that the
incorporation of a sufficient amount of dextrans in bakery products to soften the gluten content and
to increase the specific volume. In this document it is possible to read that the bread added with
dextran was about 20% bigger in volume than products which do not contain dextrans. The
formation in situ of EPS is more effective; in fact, the formation in situ of EPS from sucrose results
in further metabolites as mannitol, glucose and acetate, that may contribute to the improved brad
quality (Korakli et al., 2003). EPS from LAB can affect one or more of the following technological
properties of dough and bread: water absorption of the dough, dough rheology and machinability,
dough stability during frozen storage, loaf volume and bread staling. When more water is in dough,
in presence of dextran that is a hydrocolloid, it can bind high amounts of water. Also they can
contribute to produce additional metabolites to improve flavour, texture and shelf life of bread. The
texturizing and antistaling properties of EPS depend on their molecular size, charge,
monosaccharide composition, degree of branching and types of glycosidic linkages.
21
2. MATERIALS AND METHODS 2.1. CHARACTERIZATION OF SWEET SOURDOUGH BY CULTURE-DEPENDENT
AND INDEPENDENT METHODS
2.1.1 Sourdoug’s analysis
A total of 6 different bakeries from several Naples provinces were selected for sampling. Nine
samples of sourdoughs were collected aseptically and kept at 4°C for the following microbiological,
acidic and molecular analysis. The sourdoughs analyzed were used for the production of brioches,
croissants and “Colomba” cake (Table 1).
2.1.2 pH and TTA
The pH value was measured from an aliquot of 5 g of dough blended with 25 ml of distilled water.
After homogenisation in a Stomacher, the pH was measured with an electrode (AACC, 1975).
10 g of dough with 25 ml of distilled water, homogenised in a Stomacher, was used for the TTA
determination. This suspension was poured in a graduated cylinder and added distelled water to
achieve a volume of 50 ml. Twenty ml of this solution were titrated against 0,1N NaOH, used like
indicator phenolphthalein.
2.1.3 Microbiological analysis
For microbiological analysis, 10g of dough samples were homogenized in 90 ml of quarter strength
Ringer solution (Oxoid) by using a Stomacher (Stomacher 400 Circulator, PBI), after that serial
dilutions in Ringer solution were prepared until 10-6. LAB and yeasts were enumerated and isolated
on differential modified Chalmers Agar (Vanos & Cox, 1986). 0,1 ml of each dilutions were plated
in double on a series of modified Agar-Chalmers plates that were incubated at 30°C for at least 4
days days aerobically and anaerobically.
The modified Chalmers Agar is able to distinguish between colonies of LAB and yeasts, which
form the typical microbial association of starter for bread making and also, it is suitable to
differentiate colonies belonging to different genera and in some cases, to distinguish also between
different species of lactic acid bacteria employed in dough preparation in association with yeasts
(Pepe et al., 2001).
2.1.4 LAB and yeasts isolation
The LAB and yeast isolated colonies were obtained from the counting plates and examinted to
observe their dimension, edge, colour, elevation, consistency and CaCO3 dissolution halo (Pepe et
al., 2001). Those colonies were randomly isolated and purified by streaking on the some medium
22
(modified Chalmers Agar). Isolates were cultured in modified Chalmers Agar and recognised as
Lactobacillus spp. by assessing their morphological (phase contrast microscopy) and biochemical
characteristics (Gram stains and catalase activity). Gram positive and catalase negative cocci and
rods were purified by successive sub-cultered. The purity was checked microscopically.
2.2 Identification by culture-dependent method
2.2.1 DNA isolation from LAB isolates
For the preparation of genomic DNA for PCR assay, one colony from the purification plates was
picked and washed with 1ml of STE buffer (NaCl 100mM, Tris 10mM, EDTA 1mM).
The cells were harvested by centrifugation at 12,000 rpm for 2 min and the pallet was resuspended
in 200µl of InstaGeneTM matrix solution and incubated at 56°C for 20 min. After that, the samples
were agitated by vortexing for 10 s and boiled for 8 minutes. The DNA samples obtained were
agitated by vortexing and centrifugated at 12,000 rpm for 2-3 min. Finally, The DNA samples were
stored at -20°C.
2.2.2 DNA isolation from yeasts isolates
One colony from each purification plates was picked and washed with 1ml of STE buffer (NaCl
100mM, Tris 10mM, EDTA 1mM). The cells were resuspended with 150 µl of SPG buffer
containing 10 mg/ml of LERS and 150 µl of ET buffer (EDTA 10mM; TRIS 1 mM). After that, the
DNA samples were incubated at 37°C over night. After that, 60 µl of Triton-X 100 (15%) were
added and the DNA samples were agitated by inversion. One volume of NH4+CH3COO- 5M was
added and the samples were incubated at -20°C for 5 min; subsequently a centrifugation at 14 000
rpm at 4°C for 10 min was performed. Then, 500 µl of supernatant were precipitated with 1 vol.
(500 µl) of isopropanol and centrifuged at 14,000 rpm for 10 min at 4°C. Finally, the pellet was
dried and resuspended in 100 µl of DNA Rehydratation Solution (Promega) by incubation at 55°C
for 1h. The DNA samples were stored at -20°C.
2.2.3 PCR conditions
Identification of LAB isolated was obtained by 16S rRNA sequencing, as below described. Five µl of
the DNA isolated were used directly as a template for PCR amplifications. Synthetic oligonucleotide
primers described by Weisburg et al., (1991) fD1 (5’-AGAGTTTGATCCTGGCTCAG-3’) and rD1
(5’-AAGGAGGTGATCCAGCC-3’) (E. coli positions 8-17 and 1540-1524, respectively) were used
to amplify the 16S rRNA. PCR mixture (final volume 50 µl) contained each primer at a concentration
of 0.2 µM, each deoxynucleoside triphosphate at a concentration of 0.25 mM, 2.5 mMMgCl2, 2.5 µl
23
of 10x PCR buffer and 2.5 U of Taq polymerase (Invitrogen, Milan, Italy). PCR conditions consisted
of 30 cycles (1 min at 94 °C, 45 sec at 54 °C, 2 min at 72 °C) plus one additional cycle at 72°C for 7
min as a final chain elongation.
The internal transcribed spacers present between the 18S and 26S rDNA genes (ITS1-5,8S-ITS2)
were amplified to characterize the yeast strains isolated. The Synthetic oligonucleotide primers
described by White et al., (1990) ITS1 (5’-TCCGTAGGTGAACCTGCGG-3’) and ITS4 (5’-
TCCTCCGCTTATTGATATGC-3’) were used to amplify the 26S rRNA. The PCR mixture used for
the amplification was the same as described above. The amplification program was 95°C for 5 min,
40 cycles of 95°C for 1min, 58°C for 2 min, 72°C for 3 min and an elongation step at 72°C for 10
min.
Identification of yeasts isolated was obtained by D1-D2 domain of 26S rDNA sequencing. To
analyze the yeast population, the primers NL1 (5’-GCATATCAATAAGCGGAGGAAAAG-3’) and
NL4 (5’-GGTCCGTGTTTCAAGACGG-3’) (Kurtzman and Robnett 1998) were used. The PCR
mixture used was the same to that described above. The amplification program was 95°C for 5 min,
30 cycles of 95°C for 1min, 52°C for 45 sec, 72°C for 1 min and an elongation step at 72°C for 7
min.
The amplifications were performed in a programmable heating incubator (MJ Research Inc.,
Watertown, MA, USA).
The presence of PCR products was verified by agarose (1.5 % w/v) gel electrophoresis in 1X TBE
buffer, at 100V for 2 h, purified by using a QIAquick gel extraction kit (Qiagen S. p. A., Milan) and
sequenced by using the primer fD1 (Weisburg et al., 1991). The DNA sequences were determined
by the dideoxy chain termination method by using the DNA sequencing kit (Perkin-Elmer Cetus,
Emeryville, CA) according to the manufacturer's instructions. The sequences were analysed by
MacDNasis Pro v3.0.7 (Hitachi Software Engineering Europe S. A., Olivet Cedex, F) and research
for DNA similarity was performed with the GenBank and EMBL database
(http://www.ncbi.nlm.nih.gov/Blast.cgi) (Altschul, et al 1997).
2.3 OPTIMIZATION OF THE METHOD USED FOR THE IDENTIFICATION BY
CULTURE-INDEPENDENT TECHNIQUE
2.3.1 Production of standardized sourdough
To study the functionality and the efficiency of different protocols for DNA isolation, standardized
dough was made.
For this aim, lactobacilli (Lb. brevis H6, Lb.plantarum E5 and Lb. sanfranciscensis B9) were grown
in MRS broth (Oxoid) and, incubated overnight at 30°C. Saccharomyces cerevisiae T22 was

24
cultured in Malt extract (Oxoid), for 2 day at 30°C. After that, the cells were collected by
centrifugation (5000g), washed with sterile distilled water and resuspended to obtain 5 ± 0.5 x 10⁹
microorganisms ml-1 (direct microscopic counts). The standardized dough was prepared by
Kneading mixer (model KPM50 Professional by KitchenAid, St Joseph, MI, USA) for 5 min at
room temperature and at medium speed, 500 g wheat flour, 280 g top water and starter suspension
to achieve viable counts of about 5.0 x 10⁷CFU g-1 of both yeasts and LAB in the final dough
(Coppola et al, 1998). The dough was leavened for 24 h at 30°C. The sourdough obtained was used
for PCR-DGGE analysis.
2.3.2 DNA isolation from sourdough
Three different methods of DNA extraction were used.
For all isolation methods 10 g of sourdough (before the fermentation and after 24 h of
fermentation), prepared as described above, was cut in sterile conditions and diluited (1/10 and
1/100) in quarter strength Ringer’s solution (Oxoid). Two ml of the 10-1 and 10-2 dilutions were
centrifuged at 14,000 x g for 5 min.
Wizard method. The pellet was suspended in 100 µl of TE (10mM Tris-HCl, 1mM EDTA, pH 8.0)
and used for DNA extraction. The 100 µl suspension was mixed with 160 µl of 0.5 M
EDTA/Nuclei Lysis Solution in 1/4.16 ratio, 5 µl of RNAse (10 mg/ml) and 15 µl of pronase E /20
mg/ml, Sigma-Alderich) and incubated for 60 min at37°C. After incubation, 1 vol. of ammonium
acetate 5M was added to the sample and incubated at -20°C for 15 min. Then, the samples were
centrifuged at 14.000 x g for 5 min at 4°C. The supernatant was precipitated with 0.7 vol. of
isopropanol and centrifuged at 14.000 x g for 5 min. Finally, the pellet was washed with 500 µl of
glacial ethanol (70%), dried and resuspended in 50 µl of DNA Rehydration Solution by incubation
at 55°C for 45 min. The DNA samples were stored at -20°C.
Nucleo Spin Food Protocol (Macherey-Nagel, Germany). The DNA isolation was carried out in
according to supplier’s recommendations and applied as follows. Two ml of the 10-1 and 10-2
dilutions were used and 550 µl of lysis buffer CF (preheated to 65°C) was added and mixed
carefully, after that 10 µl of proteinase K was added and mixed again for 2-3 min. Incubate at 65°C
for 30 min; afterwards, the mixture was centrifuged for 10 min at 14.000 rpm. Then, 300 µl of clear
supernatant was pipetted into a new 1.5 ml tube and 300 µl of buffer C4 and 200 µl of ethanol were
added, the mixture obtained was vortexed for 30 sec. To bind the DNA 750 µl of the mixture were
placed into a NucleoSpin Food column and centrifuged for 1 mi at 13.000 rpm. Instead, to wash and
dry silica membrane, 400 µl of buffer CQW and centrifuged for 1 min at 13.000 rpm; after that, the
supernatant was discarded and 700 µl of buffer C5 onto the NucleoSpin Food column ancentrifuged
25
for 1 min at 13,000 rpm. For the last washing, 200 µl was pipetted onto the NucleoSpin Food
column and centrifuged for 2 min at 13.000 rpm to remove the buffer completely.Finally, to eluete
the DNA, the NucleoSpin Food column was placed in a new 1.5 ml centrifuge tube and 100 µl of
elution buffer CE (preheated to 70°C) onto the membrane. Incubate for 5 min at room temperature
and the mixture was centrifuged for 1 min at 13.000 rpm to collect the DNA.
DNeasy Plant Mini Kit Protocol (Qiagen S. p. A., Milan). The DNA isolation was carried out in
according to supplier’s recommendations and applied as follows: The pellet from the first two
dilutions was resuspended with 400 µl of buffer AP1and 4 µl of RNase A (stock solution
100mg/ml) and agitated by votexing vigouously. The mixture was incubated at 65°C for 10 min.
After that, 130 µl of buffer AP2 was added and incubated on for 5 min. Then, to apply the lysate to
theQIAshredder Mini Spin Column placed in 2ml collection tube and centrifuged for 2 min at
14.000 rpm. The flow-through fraction from the previous step was transferred to a new tube and 1.5
volumes of buffer AP3/E were added to the cleared lysate and mixed by pipetting. 650 µl of
mixture from the previous step were applied to the DNeasy Mini Spin Column sitting in 2 ml
collection tube and centrifuged for 1 min at 8000 rpm and the flow-through was discarded.
Therefore, 500 µl of buffer AW were added and centrifuged for 1 min at 8000 rpm. After that, 500
µl of buffer AW were added and centrifuged for 2 min at 14.000 rpm to dry the membrane. The
DNeasy Mini Spin Column was transferred in a 1.5 ml microcentrifuge tube and 100 µl of buffer
AE were pipetted directly on the DNeasy membrane. The mixture was incubated for 5 min at room
temperature and centrifuged for 1 min at 8000 rpm to eluete the DNA.
Their efficiency were evaluated by: a) DNA analysis by electrophoresis on 1% agarose gel run at
100V in 1x TBE buffer and ethidium bromide staining; b) evaluation of DNA amplificability, by
PCR of 16S rDNA and D1-D2 domain of 26S rDNA (Kurtzman and Robnett 1998), for detection of
LAB and yeasts, respectively; c) PCR-DGGE analysis of V3 region of the 16S rDNA and D1-D2
domain of 26S for LAB and yeasts, respectively, to detect the biodiversity in the dough samples.
2.3.3 PCR conditions
The primers V3f (5’-CCTACGGGAGGCAGCAG-3’) and V3r (5’-ATTACCGCGGCTGCTGG-3’)
spanning the 200 bp V3 region of the 16S rDNA of E. coli (Muyzer et al., 1993) were used for LAB
DGGE analysis. A GC-clamp was added to the forward primer, according to Muyzer et al., 1993.
Amplification was performed in a programmable heating incubator (MJ Research Inc., Watertown,
MA, USA). One or two µl of DNA were used. Each mixture (final volume 50 µl) contained each
primer at a concentration of 0.2 µM, each deoxynucleoside triphosphate at a concentration of 0.25
mM, 2.5 mMMgCl2, 2.5 µl of 10x PCR buffer and 2.5 U of Taq polymerase (Invitrogen). Template
26
DNA was denatured for 5 min at 94°C. A “touchdown” PCR was performed (Muyzer et al., 1993)
to increase the specificity to amplification and to reduce the formation of spurious by-products.
To analyze the yeast population, the primers 403f (5’-GTGAAATTGTTGAAAGGGAA-3’) and 662r
(5’-(GC)-GACTCCTTGGTCCGTGTT-3’) (Sandhu et al., 1995) were used. A GC-clamp was added
to the reverse primer, according to Muyzer et al., 1993. PCR mixture used for the amplification of
yeast DNA was the same as for bacterial DNA. The reaction was run for 30 cycles: denaturation was
at 95°C for 60 s, annealing at 52°C for 45 s, and extension at 72°C for 1 min. An initial 5 min
denaturation at 95°C for 60s and a final 7 min elongation step at 72°C were used. A “touchdown”
PCR was performed (Muyzer et al., 1993) to increase the specificity of amplification and to reduce
the formation of spurious by products. The initial annealing temperature was 60°C for 60 s, which
was reduced by 1°C every cycle for 10 cycles. Finally, 20 cycles were performed at 50°C for 60 s.
The denaturation and extension for each cycle were carried out at 94°C for 30s and 72°C for 3 min,
respectively, while the final extension was at 72°C for 10 min.
The presence of PCR products was verified by agarose (1.7 % w/v) gel electrophoresis in 1X TBE
buffer, at 100V for 2 h.
2.3.4 DGGE analysis
PCR products were analyzed by DGGE using a Bio-Rad Dcode apparatus and the procedure first
described by Muyzer et al., 1993. Samples were applied to 8 % (wt/vol) polyacrylamide gels in 1X
TAE buffer. Parallel electrophoresis experiments were performed at 60°C by using gels containing
a 15 to 55% (for LAB analysis) and 20 to 50% ( for yeasts analysis) urea-formamide denaturing
gradient (100% corresponded to 7M urea and 40% (wt/vol) formamide) increasing in the direction
of electrophoresis. The gels were analyzed by electrophoresis for 10 min at 50 V and for 4h at 200
V, stained with ethidium bromide for 5 min and rinsed for 20 min in distilled water and
photographed under UV transillumination.
2.3.5 Sequencing of DGGE fragments
DGGE fragments to be sequence were excised from the gel with a scalpel and purified by QIAquick
gel extraction kit (Qiagen S. p. A., Milan) according to supplier’s recommendations. Twenty
microliters of the eluted DNA of each DGGE band were reamplified by using the PCR conditions
describe above. Purity was checked by analyzing 10 µl portions of the PCR products in DGGE gels
as described above; PCR products which gave a single band comigrating with the original band
were then purified and sequenced. The DNA sequences were determined and analysed as above
described.
27
2.4 SCREENING OF BACTERIA ISOLATED FROM BAKED PRODUCTS FOR
EXOPOLYSACCHARIDES PRODUCTION
2.4.1 Strains, media and growth conditions
One hundred ninety two strains of LAB and Bacilli were screened for EPS formation. In particular,
53 LAB strains isolated from sourdoughs for sweet baked goods, 107 LAB strains previously
isolated from sourdough and pizza, 17 LAB previously islated from commercial bakery’s yeast
(Coppola et al., 1996-1998; Pepe et al., 2004), and 15 Bacilli (Bacillus subtilis) strains, previously
isolated from bread (Table 2). All strains used for this screening were previously identified by
biochemical and molecular methods.
LAB strains were grown in MRS broth (Oxoid) and Bacilli strains were grown in PCA (Plate count
agar, Oxoid). All strains were incubated at 30°C for 24h.
2.4.2 Media optimization for EPS screening
To verify the EPS production in vitro preliminary experiments were done to studie which specific
grown solid media give the best performance. For this aim, microbial strains were tested by
streaking on following media were:
• Modified Agar Chalmers;
• Modified Agar Chalmers with sucrose (5%);
• Modified Agar Chalmers, without CaCO3 and with different carbohydrates source like
sucrose, maltose, glucose, galactose, fructose and lactose.
Solutions of the different sugars (50mg/ml), after sterilization by filtration with 0,45 µm pore size
filters (Minisart®plus Sartourius AG, Goettingen, Germany), were added to the media.
For this aim, 12 Leuconostoc, 8 Lactobacillus and 1 Streptococcus strains (Table 3) were tested on
all media described above. The EPS production was observed during the 3 days of incubations at
30°C.3 Colonies were assayed for the ropy EPS phenotype by touching them with a sterile
toothpick. Colonies were scored as ropy if visible strings were observed (Vescovo et al., 1989).
2.4.3 Screening of bacteria strains for EPS production on modified Agar Chalmers with
sucrose
The media that we optimized for the 12 Leuconostoc strains, modified Agar Chalmers with sucrose
(5%) without CaCO3, we used to obtain a primary screening for all strains that we want tested for
EPS production. In this case too, all plates were incubated at 30°C and the EPS production was
observed during the time (3 days).

28
2.4.4 Screening of bacteria strains for EPS production modified Agar Chalmers with sugars
mixture
The positive strains for the primary assay were tested on modified Agar Chalmers, without calcium
carbonate and with a mixture of (50 g/100ml of water) sucrose (3%), maltose (3%) and fructose
(3%). This mixture was chose because the sugars concentration was similar to the sugar
concentration in the sourdough used for sweet baked products. The strains were incubated at 30°C
for 3 days, and the ropiness property was evaluated as described above.
In the end, an other media was used to asses the EPS production. This media would like to be
similar to sourdough composition. For this aim, 100 g of sourdoughs (previously used for other
experiments), were mixed with 350 ml of water. This mixture was homogenised for 5 min in a
Stomacher and after that, was centrifuged at 6500 rpm for 10 min. Then, the supernatant was gently
separated from the pellet and filtered with distillate water to achieve a final volume of 500 ml. to
the media wad added yeast extract 3% (wt/vol) to increase the LAB growth and the final pH was
6.0.
2.4.5 DNA isolation from bacteria strains
The DNA from the 18 strains that showed a better EPS production was isolated.
The strains were incubated in MRS broth at 30°C over night. Therefore, the pellet from 2 ml of
were harvested and washed with 1 ml of STE buffer (100mM NaCl, 10mM Tris pH 8.0, 1mM
EDTA pH 8.0). The cells were risuspended in 250 µl of ET (50mM Tris-HCl, 5mM EDTA, pH 8.0)
with lysozyme (2 mg/ml) and mutanolysin (40U/ml) and they were incubated at 37°C over night.
After that, 75 µl of SDS (10%) were added and mixed gently by inversion. Two µl of Pronase
(20mg/ml) were added and incubated at 37°C for 1h. After incubation, 1 vol. of ammonium acetate
5M was added to the sample and incubated at 4°C for 15 min and centrifuged at 14000 rpm for 15
min at room temperature. The pellet was dried and resuspended in 50 µl of DNA Reydration
Solution by incubation at 55°C for 1h. Finally, 2 µl of RNase (10mg/ml) were added and the
samples were incubated for 10 min at 37°C.
2.4.6 PCR conditions and DNA sequencing to screen eps genes involved in
omopolysaccharides (HoPS) and eteropolysaccharides (HePS) biosynthesis
A screening for eps genes was performed using different primers targeting omopolysaccharides
(glucansucrase and levansucrase) (Kralj et al., 2003; Tieking et al., 2003) and eteropolysaccharides
(epsA, epsB, epsD/E, epsGTF) genes (Table 4) (Mozzi et al., 2006). The PCR mixtures (25 µl)
29
contained 1 µl of DNA, 2.5 mM MgCl2, the four deoxynucleoside triphosphates at 100 µM each,
each primer at 1 µM in Taq buffer and 2.5 U of Taq polymerase. The programs detailed in Table 4.
Amplicons were analyzed by electrophoresis in 1% (wt/vol) agarose gels in 1X TBE buffer. The
200-bp PCR products obtained with the eps D/E primers were run in 2% (wt/vol) agarose gels. A
1kb ladder (Invitrogen, Milan, Italy) was used to estimate the sizes of the bands. Amplifications
were performed in a programmable heating incubator (MJ Research Inc., Watertown, MA, USA).
PCR products of from gtf genes and epsGTF were purified by using a QIAquick gel extraction kit
(Qiagen S. p. A., Milan) and sequenced. The DNA sequences were determined and analysed as
above described.
2.5 CHARACTERIZATION OF EXOPOLYSACCHARIDES FROM LACTOBACILLUS
PARABUCHNERI FUA3154
2.5.1 Strain, media and growth conditions
The strain used for this part of my study is Lb. parabuchneri FUA3154. It is a gram-positive, non-
motile and catalase-negative and usually the cells are rods-shaped and occur single or in pairs. This
strain was isolated previous from “Brottrunk” a bread fermented beverage. Lb.parabuchneri
FUA3154 was incubated in MRS medium modified as described by Stolz et al., and containing 100
g/L of sucrose as the sole source if carbon (mMRS-sucrose) or 5g/L of glucose, 5 g/L of fructose
and 10 g/L of maltose as sole carbon sources (mMRS-maltose). The medium pH was adjusted to
6.2 before it was autoclaved, and sugars were autoclaved separately from the other medium
components. The strain was incubated at 30°C for 24-48h in anaerobic condition.
2.5.2 Isolation and purification of EPS
The cells were removed from 24-48h old cultures by centrifugation (5000 rpm for 10 min) and the
cell-free culture supernatant was used to screen for EPS production. To harvest the EPS add ethanol
to achieve a 70% (wt/vol) concentration. After that, the samples were incubated on ice for 1h.
Harvest EPS obtained by precipitation and centrifuged them at 5000 rpm for 10 min. Then, add 2ml
of ethanol to the sample and centrifuged. The pellet was resuspended in 2ml of distilled water. EPS
were purified by dialysis over night. For dialysis, Spectra/Por membranes (VWR International) with
a molecular mass cut off of 3.500 Da were used. After dialysis, to obtain the first fraction of EPS
add ethanol to achieve a 70% (wt/vol) concentration and incubate on ice for 1h. After that harvest
the EPS and resuspended them with 1 ml of mQ water. To precipitate a second fraction of EPS, was
added ethanol, to achieve a 40% (wt/vol) concentration, to the supernatant and was incubated on ice
1h. Finally, the EPS were harvested and resuspended with 1ml of mQ water. After purification the
30
EPS purify were freeze-dried using a Labconco FreeZoneone 4.5 Liter Freeze Dry System
(Labconco; Kansas City, USA) at a collector temperature of -50°C. When the cells were freeze-
dried, were weighted to quantify the EPS.
2.5.2.1 Enzyme assay
The purified EPS were submitted to enzymatic digestion. For the digestion Dextranase from
Chaetomium erraticum (Sigma-Alderich) and β-glucanase (Sigma-Alderich) were used and the
reaction was carried out at 55°C and 37°C respectively, over night. After that, the samples were run
to the HPLC to study the oligosaccharides composition.
2.5.3 HPLC analysis
The monosaccharides composition was analyzed by high-performance liquid chromatography
(HPLC) using an Agilent HPLC system, Aminex 87H column with mobile phase was: 2 mM
H2SO4, flow rate 0.4 ml min-1, column temperature was maintained at 70°C; the injection volume
was 200 µl. To determine the size was used a SEC column Zorbax PSM1000. The mobile phase
was deionized water at a flow rate 0.5 ml min-1 and column temperature was 30°C. Finally the
oligosaccharides were analysed directly from the supernatant by HPAEC-PAD using a Carbopac
PA20 column combined with an ED40 chemical detector (Dionex, Oakville, Canada). Water (A), 1
M NaOH (B) and 1 M Na-acetate was used as solvents with the gradient shown in Table 5. For peak
identification, an external standard of glucose, maltose and galactose was used. To study an
oligosaccarides composition, for the peak identification, an external standard of cellobiose,
cellooligossacarides and laminarabiose were used.
2.5.4 Screening of eps genes
The primers and the conditions used to performer the PCR are the same that we used before and
they were reported above (Table 4).
In this case, one more pair of primer was used, the primer which encodes a β-D-glucan synthase
gene: GTF-F 5´-CGGTAATGAAGCGTTTCCTG-3´ and GTF-R 5´-
GCTAGTACGGTAGACTTG-3´ (Werning et al., 2006). The PCR mixtures (50 µl) contained 1 µl
of DNA, 3.5 mM MgCl2, the four deoxynucleoside triphosphates at 250 µM each, each primer at
0.2 µM in Taq buffer and 2.5 U of Taq polymerase. The programs used was 1 x (95°C, 5 min); 30 x
(95°C, 5 min; 55°C, 1 min; 72°C, 30,s), and 1 x (72°C, 10 min).
PCR products from eps D/E and eps GTF genes were purified by using a QIAquick gel extraction
kit (Qiagen S. p. A., Milan) and sequenced. The DNA sequences were determined and analysed as
31
described above. Sequence alignments were conducted with the ClustalW algorithm (Thompson, et
al., 1994).
2.5.4.1 DNA cloning
Purified PCR products from epsEFG gene were cloned in the vector pCR 2.1-TOPO by using the
TOPO TA Cloning kit (Invitrogen, Carlsbad, Calif) with chemically competent cells in accordance
with the manufacturer’s recommendations. Plasmids from transformants purified with the QIAprep
Spin Miniprep Kit (Quiagen) were used for automated sequencing. The sequences on both strands
from two clones were then determined with M13 forward and reverse primers by the DNA
sequencing service of Department of Bioscience of University of Alberta (Canada). Similarity
searches were performed with the GenBank and EMBL database
(http://www.ncbi.nlm.nih.gov/Blast.cgi) (Altschul, et al 1997).
2.7.4.2 RNA isolation and reverse transcription PCR
Total RNA was isolated from cultures of Lb. parabuchneri FUA3154 grown to the exponential
growth phase (optical density at 660 nm, 0.4-0.5) in mMRS-maltose.
The TRIzol (Invitrogen) RNA Isolation Kit protocol was used. The protocol was as following:
Five hundred µl were added to the cells to resuspend them. The solution was applied to 2ml tube
with DEPC.treated glass beads. Binding for 2 min at max speed and repeated it for 2 times. After
that, the samples were incubated and homogenized for 5 min at room temperature. One hundred µl
of chloroform were added and incubated at room temperature for 2.3 min. The samples were
centrifuged at 12000 g for 15 min at 4°C. Therefore, the upper phase was withdrew and 1 vol of
isopropanol was added to precipitate the RNA and the mixture was incubated at room temperature
for 20 min. In the following, the samples were centrifuged at 12000g at 4°C for 10 min. The
supernatant was removed and the RNA was washed once with 500 µl of 75% ethanol; the samples
were agitated by vortexing and centrifuged at 7500 g for 5 min at 4°C and all leftover ethanol was
removed. To dissolve the RNA pellet 25 µl of RNA ase-free water were added. Five µl of RNA was
used to measure the concentration e for cheking by electrophoresis. The rest RNA was stored at -
80°C. To check RNA isolation, RNA samples were run on 0.8 % agarose gel. Before the running,
RNA loading dye was prepared as follows: 50% glyverol, 10mM EDTA (pH 8.0), 0.25% (w/v)
bromophenol blue and 0.25% (w/v) xylene cyanol FF. Three µl of RNA samples were mixed with
17 µl of formamide and incubated for 10 min at 65°C to denature the secondary structure and the
samples were chilled on ice for 2 min. Two µl of RNA loading dye were added to the samples and
run at 80 Volts for 40 min. The gel was stained in a DEPC-treated water containing ethidium
32
bromide. In the RNA preparations, DNA was digested by incubation with DNase-treated RNA
(Promega). Reverse transcription (RT)-PCR was performed using 100 U Moloney murine leukemia
virus reverse transcriptase and was primed with 20 µg of hexameric random primers ml-1 (rRNase H
minus and random primers from Promega). From the cDNA library, an internal fragment of the
epsEFG gene was amplified with a new pairs of primer, designed on the basis of the sequence
obtained for the our strain: epsEf (5’-ACGAGCTCCCACAATTTTGGA-3’) and epsEr (5’-
GCTGAGGCGACGTTT TTGTTC-3’); also the cDNA was amplificated for two houskeeping
genes: RecAf (5’-AATGCTAAAAAGTGGCTTAAGGAACA-3’), RecAr (5’-
CCCATTTGCAACACGAACTTTAT-3’) and DnaKf (5’-
CCTACTTCAAAGAGCCAAATCTTCTC-3’) and DnaKr (5’-TGCCATTGGACGTTCACCTT-
3’). The PCR mixture and conditions were the same used fro the amplifications descibed above.
33
3. RESULTS
3.1. CHARACTERIZATION OF SWEET SOURDOUGH BY CULTURE-DEPENDENT
AND INDEPENDENT METHODS
3.1.1 Microbial counts and chemical determinations of sourdough samples
The plate analysis results of each sourdough are shown in Table 6.
In the sourdoughs I4b, I4c, I5, I6 and I7 were isolated both LAB and yeasts with different
concentrations. In particular, the count for the LAB was in the range of 1.1 x 10⁵ CFU g -1
(sourdough I6) and 7.0 x 10⁷ CFU g -1 (sourdough I4b). On the other hand, viable yeast counts were
showed more differences between the sourdoughs; in fact, was ranged from 5.0 × 10⁴ (sourdough
I5) to 3.0 × 10⁸ (sourdough I4b) CFU g -1.
Otherwise, in the sourdoughs I1, I2, I3 and I4, no yeasts were counted and in general the viable
LAB counts were less then for the other samples (8.0 x 10² CFU g -1 - 4.0 x 10³ CFU g -1).
The viable LAB counts were greater then viable yeast counts, in fact, the ratio LAB/yeasts was in
the range from 4000 to 0.1. Therefore, the sourdoughs I4b, I4c, I5, I6 and I7, showed very low
ratios more favourable for to the yeasts. Although in the sourdoughs I4 and I5 the majority of LAB
was limited. This result is in accord with Ottogalli et al., (1996), that reported the ratio LAB/ yeasts
of 100/1. In all sourdough samples a high degree of acidification was observed, with pH values
(Table 6) varying between 3.76 and 5.74 with a mean value of 4.61. The TTA values were ranged
from 1.6 (sample I7) to 3.4 (sample I6).
3.2 Microbial identification by “culture-dependent” method
3.2.1 Phenotypic characterization of bacterial isolates
Ninety-seven strains, collected from the different sourdoughs were Gram positive and catalase
negative reactions, thus, considered as presumptive LAB (Table 7). The isolates were
physiologically divided into 6 different groups for their macro morphology, micro morphology,
Gram reaction and catalase test. Some representative strains of every group (4 strains) was chosen
for the genotypic characterization and were identified by 16S rDNA sequencing.
3.2.2 Phenotypic characterisation of yeast isolates
After isolation on modified Agar Chalmers, each strain was microscopically observed and its
morphology recorded. In total, forty-nine strains were isolated and differentiated with their macro
morphology, micro morphology and grouped in 5 different groups (Table 8). The identification and
typing of the yeast isolates was achieved by using the PCR for the ITS of 5.8S for 2 representative
strains for each group. All strains showed the same fingerprinting for the ITS amplification with
34
one band at 850 bp, with exception of a strain (100B) isolated from the sourdough I6, that showed
one band at 400 bp that was sequenced.
3.2.3. Molecular identification of LAB strains
In all samples we isolated bacteria belonging to the genera Lactobacillus (Table 9), in particular
with the species Lb. casei, Lb. plantarum, Lb. sakei, Lb. curvatus, Lb. graminis, Lb. rennanqilfy and
Lb. coryniformis. Moreover we isolated same strains belonging to the genera Leuconostoc with the
species Ln. mesenteroides, Ln. pseudomesenteroides, Ln. lactis and Ln. garlicum and in the end,
same strains belonging to the genera Lactococcus with species Lc. lactis subp. lactis and Lc. lactis
subp. cremoris. All Lactobacillus strains isolated were facultatively heterofermentative. In
particular, in the sourdoughs I1 and I3 we isolated the species Lb. casei and Lb. rennanqilfy; in the
sourdoughs I2 and I4, Lb. casei was the only species carried out; in the sourdough I4b we identified
the species Lc. lactis sp. lactis, Lc. lactis sp. cremoris, Ln. pseudomesenteroides and Lb. plantarum;
in the sourdough I4c the species Lb. curvatus, Lb. sakei, Ln. mesenteoides, Ln. lactis and Ln.
garlicum; in the sourdough I5 we can identified just one strain at species level as Lb. plantarum and
the others just at genera level as Lactobacillus sp., as well as for the sourdough I6 . Finally in the
sourdough I7 we isolated the species Lb. coryniformis subsp. torquens, Lb. curvatus subsp.
curvatus, Lb. graminis and Leuconostoc sp (Table 9).
3.2.4. Molecular identification of yeast strains
A single ITS1- 5.8S- ITS2 DNA fragment of about at 850 bp (Figure 5), was observed in all isolates
of yeasts. The only exception was one isolate from the dough I6 that was showed one fragment with
a length about at 400 bp that was, also, submitted to the sequencing of the domain D1-D2 of 26S.
All isolated with a ITS fragment at 850 bp were compared to available on-line sequences using
BLAST software. They showed 100% homology with S. cerevisiae (Table 9), whereas that from the
dough I6 aligned with Metschnikowia pulcherrima at 100%.
3.3 Microbial identification by “culture-independent” method
3.3.1 Comparison of different DNA isolation methods
The three different protocols of DNA isolation were applied to the standardized sourdough that was
made with three Lactobacillus strains (Lb. brevis H6, Lb. plantarum E5 and Lb. sanfranciscensis
B9) and one yeast strain S. cerevisiae T22.
35
This preliminary study was important because the substances present in the food matrix may affect
PCR, and such elements can be co-extracted with the target DNA and thus interfere with PCR
(Picozzi et al., 2006).
The DNA was isolated from the first two dilutions employing the three above described protocols
and subjected to agarose gel electrophoresis. The Figure 6 shows the extraction results. It is possible
to note the presence of nucleic acids from Nucleo Spin, Wizard and DNeasy Plant Mini Kit
methods. The last one protocol didn’t show DNA products except for the first dilutions for each
sample that show a weak band with, at the same time, some impurity smear. Otherwise, the Nucleo
Spin and Wizard protocols yielded high-molecular weight DNA, for the first dilutions of sourdough
samples before and after the sourdough leavening, but same impurity smear, too. Finally, the DNA
obtained by agarose electrophoresis showed the presence of nucleic acids in all three methods, even
if, the Wizard protocol yielded bands better than to the other protocols. Moreover, all methods
allowed PCR amplification (Figure 7.) of all samples, but also in this case the Wizard protocol gave
better results. Finally, in the analysis PCR-DGGE (Figure 8.), the DNA extraction method did not
influence the final result obtained with all three protocols, even if, better fingerprinting was detected
in the samples extracted with Wizard method. In conclusion, the Nucleo Spin and Wizard protocols
were chosen to apply to characterize by molecular method the sourdoughs.
3.3.2 PCR-DGGE analysis for LAB identification
Figures 9 and 10 show the DGGE fingerprints of the bacterial DNA extracted directly from the
sourdough samples with Nucleo Spin Food and Wizard protocols, respectively. The number and the
intensity of bands varied among samples. To identify the bacterial species, the bands were excised
from the gel, re-amplified and run again on a denaturing gel to confirm their position relative to the
original sourdough sample. Purification and sequencing of some faint bands did not provide
successful (Figure 9 and 10; bands X). The closest relatives of the sequences analysed are reported
in Table 10.
In general, all samples were not showed a big variety in their DGGE fingerprinting. The
fingerprintings obtained was very similar among the different samples. Anyways, the sourdoughs
I1, I2 showed the same DGGE profile as well as I3 and I4, I4c and I5. All thesed samples showed
more variability since their fingerprintings presented at least 6 bands together with the sourdough
I4b. The samples I6 and I7 indeed showed a pour fingerprinting with only one band but four of
them were very weak. Most of the sequences obtained with Nucleo Spin Food protocol
corresponded to portions of 16S rDNA of LAB; one exception are the bands C and I, present in all
sourdough samples (Figure 9) which showed a similarity with a portion of the mitochondrial 18S
36
rDNA of Triticum aestivum. The sequence of the other bands showed a similarity with Lb.
sanfrancisciensis (band E), Lb. sakei (band G), Weisella cibaria (band N) and S. thermophilus
(band D). Moreover, with Wizard protocol, the DGGE profile obtained showed less number of
bands (Figure 10). The sourdough samples I1, I2, I3 and I4 (data not shown) and I4c and I5 (Figure
10), had the same had the same fingerprinting that showed the presence also of some weak bands.
Also thye samples I6 and I7 were similar but with a pour fingerprintings constituted by a single
band. Moreover, the sequences of the bands (A, C, C2) (Figure 10) showed a similarity with a
portion of the mitochondrial 18S rDNA of Hordeum vulgare subs. vulgare. Other sequenced bands
were identified as Lb. sanfrancisciensis (bands C1, D, D1) and Weisella cibaria (band E). When we
used Nucleo Spin Food protocol, for Triticum aestivum two bands with different migration were
obtained in the DGGE gel; with Wizard protocol, for Lb. sanfranciscensis and Hordeum vulgare
two o three bands were obtained in the DGGE gel.
3.3.3 PCR-DGGE analysis for yeast identification
DGGE fingerprints obtained by analysing the amplified 26S rDNA fragments wit primers 403f and
662r are shown in Figure 11. No diversity was found in yeast population, with both DNA isolation
protocols. In fact, in all samples there was one main band with a good intensity (band A). In all
DGGE profiles there were other bands (for the samples I1, I2, I3 and I4) not clearly visible in
fingerprint replicates to be sequencing.
3.4 SCREENING OF BACTERIA FOR EXOPOLYSACCHARIDES PRODUCTION
3.4.1 Media optimization for EPS screening
Different kinds of media were tested to choose the one that give a better result. For this aim, firstly,
12 Leuconostoc strains were tested on modified Agar Chalmers (Table 3), but after 48h of
incubation, the EPS production was not detected. Then, the same strains were assayed on modified
Agar Chalmers without CaCO3 with sucrose (5%) as only carbohydrate. This media allowed the
EPS formation by 10 of Leuconostoc strains tested (Figure 12A) but, when the sucrose was
substituted by fructose, glucose, maltose, lactose and galactose (5% wt/vol) no more developing of
EPS was observed. Modified agar Chalmers with sucrose and without CaCO3 allowed to put in
evidence the EPS production in three of the eight Lactobacillus strains tested (Lb. coryniformis
subsp. torquens, Lb. curvatus; Figure 12B) and in Uncultured Streptococcus 107 (data not shown).
All tested strains were isolated from swedet sourdoughs.
37
3.4.2 Screening of bacteria strains for EPS production on modified Agar Chalmers with
sucrose
On the basis of previous results, the investigation of screening for EPS synthesis on modified Agar
Chalmers with sucrose and without CaCO3, showed that 42 strains were EPS producers.
Particularly, the 61% of Leuconstoc and Weissella strains were sensitized EPS. Otherwise, the
Lactobacillus Lactococcus and Enterococcus strains were all negative. Finally, 6 Bacillus subtilis
strains were able to produce EPS with ropy property too (Table 11).
3.4.3 Screening of bacteria strains for EPS production modified Agar Chalmers with sugars
mixture
This screening was aimed to the selection of strains able to be “iper-EPS producers” and it was a
preliminary step to transfer the process from the lab condition to the industry production. The
results were showed in the table 12. 42 positive strains obtained by modified Agar Chalmers with
sucrose were tested on modified Agar chalmers with a mixture of sugars and without CaCO3. The
results obtained by this test showed that the 55% of strains was able to produce EPS; in particular,
the strains isolated from sourdough samples for sweet products, represented the 19% of the total of
all strains tested and the 44% of the strains isolated from the same origin. Instead, the strains
isolated from sourdough for pizza were the 21% of the total strains investigated and the 53% of the
strains isolated from the same origin. In the end, the 6 Bacillus subtilis strains cheeked were all
positive for EPS production on modified Agar Chalmers with a mixture of sugars and without
CaCO3.
The same strains assessed on the media with a sourdough extract showed negative results.
38
3.4.4 Molecular screening of eps genes for HoPS and HePS from bacteria strains
All strains (17) belonging to different species (Leuconostoc, Lactobacillus and Bacillus) were
capable of producing HePS genes with exception of the strain Ln. pseudomesenteroides 79A. Most
of the EPS positive strains possessed the eps genes, as verified with the primers used (Table 13).
DNA of 10 Leuconostoc species strains gave positive results for the epsEFG gene. Instead, just four
Leuconostoc strains showed 800-pb PCR products with epsA gene. With the epsD/E primers, all
strains tested displayed positive results, except for the strain Ln. pseudomesenteroides 79A and the
Bacillus subtilis strains. Regarding the epsB primers, the most of the strains yielded a PCR product.
No PCR products were obtained with the DNA from Ln. pseudomesenteroides 79A, Ln.
mesenteroides A 52, Ln. gelidum A43, Ln. gelidum A16, Ln. amelibiosum A21, Ln. dextranicum
A28 and Ln. lactis A28. Otherwise, to determine the presence of glucansucrase and levansucrase
genes (involved in HoPS biosynthesis) PCR amplification was performed with the 17 strains used
before. In this case all Leuconostoc strains were able to produce HoPS, except for the strain from
Ln. pseudomesenteroides 79A, Ln. lactis/ Ln. garlicum 68A12, Ln. lactis69B and Ln. lactis68B.
The strains tested showed for the glucansucrase gene positive PCR products with the exception the
strain Lb. curvatus69B2; for the levansucrase gene all strains showed a positive results except for
the strains Ln. lactis95.
The epsGTF sequencing did not showed a similarity with nucleotides analysis present in database,
but it was found a 99% similarity with a genes that codified for a wall cell protein of Leuconostoc
citreum KM20. Finally, from the sequencing of gtf genes of the strains Ln. mesenteroides A52, Ln.
gelidum A43 and Ln. amelibiosum A21, for the first two strains were obtained a 99% similarity
with the gene codifying for the dextransucrases in Ln. mesenteroides L0309; and for the last one,
was found a 96% of similarity with the gene codifying for a dextransucrase in Ln. citreum.
3.5 CHARACTERIZATION OF EXOPOLYSACCHARIDES FROM LACTOBACILLUS
PARABUCHNERI FUA3154
3.5.1 Characterization of exopolysaccharides by HPLC analysis
The EPS isolated from Lb. parabuchneri FUA3154 from MRS modified with maltose was
quantified as 713 ± 371 mg l-1.
From the enzyme assay with dextranase, we can not found significative results; in fact the peak
obtained was glucose and the other peaks derived from the buffer used during the assay (Figure 13).
Otherwise, the results obtained from β-glucanase assay, the peak showed the presence of glucose,
too, but the other peaks that we can not characterize, because they did not corresponded with the
standard, but they represented same oligosaccharides (β-glucan) linked with linkages β-1.3.

39
3.5.2 Screening of eps genes and sequencing
Firstly, the presence of eps (HePS) was verified by using four primer pairs (eps A, eps B, eps D/E
and eps EFG). Lb. parabuchneri FUA3154 showed positive PCR products for the gene epsEFG, a
300-pb and 1,600-pb PCR products were obtained. With the epsD/E primers, the strain displayed a
positive result. For the other primer pairs, the PCR products were all negative. Negative results
were obtained from the PCR amplification of levansucrase and glucansucrase genes, that they are
involved in omopolysaccharides biosynthesis. Finally, for the gene involved in the β-glucan
synthesis, the strain was showed a positive PCR product.
To confirm the positive results for the epsEFG and epsD/E genes, the PCR products were purified
and sequenced. For the gene epsEFG, the sequence obtained was failed and this is the way we
decided to clone the gene and sequenced again, but in this case too, the sequencing was failed.
Otherwise, for the gene epsD/E was found a 98% similarity (180bp) with eps gene cluster in S.
thermophilus.
3.5.3 Expression of the epsD/E gene in Lactobacillus parabuchneri FUA3154
To determine whether the putative epsD/E gene was expressed, RNA isolation was carried out to
obtain a cDNA. To study the effective expression of the gene, the cDNA was used for a Reverse
Transcription PCR. For each pairs of primer (β-glucan, dnaK, recA, epsD/E and epsE) the cDNA
was showed positive results (Figure 14). In particular, we obtained a positive results for epsD/E
primer used before for the sequencing and for the primers that we designed, specifically, on the
interesting gene. In conclusion, the strain Lb. parabuchneri FUA3154 was showed a really
expression of epsD/E gene.
40
4. DISCUSSION
4.1 CHARACTERIZATION OF SOURDOUGH SAMPLES BY CULTURE-DEPENDENT
AND CULTURE-INDEPENDENT METHODS
In the first part of this study, the microflora of nine sourdoughs, used for bakery sweet goods,
collected in different bakery of Campania region, have been investigated by using culture-
dependent and culture-independent techniques. This part of the work was mainly aimed to
characterize LAB and yeasts population in sweet leavened baked products, because more studies
were focalised on microbiological aspects of sourdoughs used in bread production; instead not to
much papers have treated the microbial composition of mother sponges for the sweet baked goods.
The LAB count results were lower than the usually in sourdough fermentation, probably, because
the samples collected were not belonging to the sourdough type I and II, but maybe they can be
defined like sourdough type III or type 0, which the for the first type, production technology predict
the use of bakery’s yeast and some LAB species more resistant and obtained standardized end
products. Type 0 dough consisted of dough which uses baker’s yeast to obtain the leavening and it
not made with sourdough fermentation and also the LAB species can be the species present in the
flour and they can contribute to a small degree to the acidification and aroma development.
In the samples I1, I2, I3 and I4 did not counted yeasts species and also the viable count of LAB is
low; this sourdoughs can be considered constituting just of LAB species, as described by Gobbetti
et al., (1994d) for wheat sourdough of central and southern Italy. Anyways, in sourdough
population exists a huge variability that can be due by a lot of different factors as degree of dough
hydration, kind of cereal used and leavening temperature and time. Also in this case, the condition
of storage samples can determine the yeasts death. An other way that we can not count yeasts in this
sample could be the media that we used to count and isolate the microflora. In fact, this media was
suitable for counting a mixed population consisting of different species of LAB used as starter in
breadmaking. It permit a selection of strains of Lb.s plantarum, Ln. mesenteroides subsp.
mesenteroides, Lb. sanfranciscensis, Enterococcus faecalis together with S. cerevisiae could be
easily differentiated and counted with an acceptable recovery in comparison with reference media
(Pepe et al., 2001) and in this case did not allowed a good isolation and selction of the other yeast
and LAB species occured. In all sourdoughs, the LAB: yeast ratio was always pro LAB, with an
exception for the sourdough I4b, I6 and I7. In this case, the yeast can dominated the fermentation
overhanging the indigenous LAB flora as indicated by the high pH. The viable count yeast (ranging
from 5.0 × 10⁴ to 3.0 × 10⁸ CFU g-1 were in agreement with those reported for other sourdoughs
from wheat flour produced in other regions (Succi et al., 2003).
41
The pH values of ripe sourdough is variable, but for wheat sourdoughs it ranges from 3.5 to 4.3
(Collar et al., 1994a; Wehrle and Arendt, 1998). Almost, all sample were included in this range, just
for the sourdoughs I4b, I6 and I7, the pH was higher, because the temperature of fermentation were
higher than the others and also for the predominance of yeast as explain above (Table 6). The
acidification properties of different doughs also varied with the starter cultures used or of the
proportion of lactic and acetic acid produced by LAB (Coppola et al., 1998), as well as the
microbial influence on the pH values, is affected, also, by the amount and the number of
homofermentative and heterofermentative species and by characteristic strains. It is also true that it
is impossible compare the pH values and microbiological characteristics of sourdoughs obtained
with different ingredients and different production technologies (Coppola et al., 1996).
In the present study, the LAB isolated colonies were identified by culture-dependent techniques by
16S rDNA sequencing. The major genus isolated was Lactobacillus with the species Lb. casei, Lb.
plantarum, Lb. sakei, Lb. curvatus, Lb. graminis, Lb. rennanqilfy and Lb. coryniformis. Also some
species belonging to the genus Leuconostoc: Ln. mesenteroides, Ln. pseudomesenteroides, Ln.
lactis e Ln. garlicum and in the end two species belonging to the genus Lactococcus as Lc. lactis
subp. lactis e Lc. lactis subp. cremoris (Table 9). This kind of LAB is typically isolated as a
dominant in sourdough fermentation (Foschino et al., 1999; De Vuyst, 2005; Corsetti et al., 2007).
Lb. sanfranciscensis, Lb. brevis and Lb. plantarum are the most frequently lactobacilli isolated from
sourdoughs. However, some strains, initially classified as Lb. plantarum may actually belong to Lb.
paraplantarum or Lb. pentosus species, since both phenotypic determination tools, such as
carbohydrate fermentation patterns, and genetic methods, such as 16S rRNA gene sequence
analysis, are not able to distinguish among Lb. plantarum group species.
Gobbetti (1998) reported on the Lb. sanfranciscensis/Lb. plantarum association in Italian wheat
sourdough.
The species belonging to the genus Lactobacillus were all facultatively heterofermentative, while
the strains identified as Leuconostoc were all obligately heterofermentative and finally the only
homofermentative species isolated were belonged to Lactococcus genus. This situation is
characteristic for sourdoughs microflora; in fact, in contrast to the use of mostly homofermentative
species of LAB in the majority of (fermented) food applications, heterofermentative species play a
major role in sourdough fermentation (Salovaara, 1998). Generally, Weisella and Leuconostoc
species may play a role during the first part of the fermentation. The presence of the species of
Lactococcus genus can due to the probably used of bakery’s yeast which can contain LAB,
especially lactobacilli rather than Pediococcus, Lactococcus and Leuconostoc spp. (Jenson, 1998),
which in this case contributes only to a small degree to the acidification and aroma development of

42
dough. Finally, the dough sampled can be definite as “mother with transitory association” (madre ad
associazione labile) (Foschino et al., 1995), which the sourdough was fermented by LAB that they
are variable in the species occurs and the yeast involved in the leaving process are also different in
species. Also between the different microbial groups present do not establish a mutual association
but their occurrence is due of the common origin, flour and to particular environmental conditions.
This determines a continuous competition for different nutrient sources that causes a constant
selection between the different microorganisms, improving the development of some strains with
particular physiologic properties (growth temperature, capability of fermentation, acidic resistance).
Forty-nine yeast strains were isolated from nine samples, in the first four samples, the yeast
population was not carried out. The identification was obtained by D1-D2 domain of 26S rDNA
sequencing, showed the some result: all strains were identified as S. cerevisiae. One exception was
the strain 100B identified as Metschnikowia pulcherrima. No other papers reported the occurrence
of this specie in sourdough habitat, but it was previously isolated from some fruits like grapes
(Senses-Ergul et al., 2005) or from pests guts (Molnár O., Prillinger H., 2005). It can be considered
as a contamination from the bakery environmental or because the producer added to the dough
some fruits to increase the amount of sugar fermented. Among the species mostly isolated from
sourdough, S. cerevisiae occurring very often also because it is often introduced through the
addition of baker’s yeast. In common practice for sweet leavened baked products, the bakery yeast
is added to the first refreshment to speed up the last leavening step, particularly when malt is used
in place of sucrose (Garofalo et al., 2008). It is true that the amount of S. cerevisiae may be
overestimated due to the lack of reliable systems for identifying and classifying yeasts from this
habitat (Vogel, 1997). The persistence of S. cerevisiae is due to fermentation temperature, in fact, it
was demonstrated that during a fermentation at 30°C for 24 h this the specie can dominate the
process. In agreement with Hansen et al., (1989a), some strain of S. cerevisiae, are more adapted to
growth with homofermentative LAB strains rather then homofermentative LAB, because the acidity
produced by heterofermentative LAB can be toxic or can achieve levels that the yeast strains can
not be support. This reasoning can be used to explain the results obtained for the samples I1, I2, I3
and I4, where S. cerevisiae was not isolated by culture-dependent method, instead in the other
samples where always S. cerevisiae strains were associated with at least one homofermentative or
facultatively heterofermentative strains. In the dough I4b, the association S. cerevisiae/Lb.
plantarum/Ln.c mesenteroides, was present one of the best association to a good production of
aroma and to reach high level of phytate biodegradation (Chaoui et al., 2003). These results
emphasize microbial potential in improving the nutritional quality of cereal-based products. The
predominance of S.cerevisiae was predictable and desirable, considering their role in bread-making

43
with particular reference to leavening and to the development of aroma compounds as described by
different authors (Severini et al., 2002; Wick et al., 2001).
The second part of my work was the characterization of the nine sourdoughs by culture-independent
techniques, in particular, PCR-DGGE. Before to apply this method, the DNA isolation protocol was
optimized, because the substances present in the food matrix may affect PCR and such elements can
be co-extracted with the target DNA and thus interfere with PCR. Three protocols (Wizard method,
Nucleo Spin Food Protocol and DNeasy Plant Mini Kit Protocol) were used. To obtain the best
solution a standardized dough was done and the DNA isolated was tested with PCR and PCR-
DGGE analysis. The three DNA isolation methods gave comparable results for the DNA quality but
when the DNA was used for PCR and PCR-DGGE analysis, the Wizard and Nucleo Spin Food
protocols proved to give the best results. However, the Wizard and Nucleo Spin Food protocols
were used for the following identifications, which the higher quality of the template DNA collected
from these sweet doughs, with these two protocols is ascribable to the greater removal of lipids,
proteins and carbohydrates, which can interfere with the DNA or even inhibit the PCR
amplification.
The population dynamics of lactobacilli and yeasts in dough samples have been investigated by
PCR-DGGE analysis. As far as the PCR-DGGE outcomes are concerned, low species diversity was
detected in all of the samples investigated. This result is justified because, usually, in sourdough the
low biodiversity is explained by the selection of well-adapted species which co-exist in a stable
dynamic equilibrium (Meroth et al., 2003a). By comparing the fingerprints obtained with the two
DNA isolation protocols, slight differences emerged in the compositions of the microbial
communities. One exception was the detection of the species of Lb. sakei occurred in the samples
I4c and I5 and S. thermophilus, occurred in the doughs I1, I2, I3, I4 and I4b, with Nucleo Spin Food
protocol. The analysis of the DNA recovered directly from sourdough samples showed that Lb.
sanfranciscensis was the dominant specie that it does not isolated by dependent-culture method.
Also with this approach, Weisella cibaria, was detected. Although this specie is know to have
important roles in growth association with lactobacilli during early sourdough fermentation. The
differences highlighted with culture dependent and independent techniques can be explained with
the following hypothesis. Firstly, the technological parameters, such as the addition of ingredients
like butter, eggs, chocolate and raisins, could have exerted selection pressures towards the species
as Lb.s sakei, S.thermophilus, Lb. sanfranciscensis and Weisella cibaria. S.thermophilus is not very
frequently isolated from this kind of samples, but we can hypothesize a probable contamination or
the use of yogurt during the manufacturing. The visualization of DNA bands ascribed to Lb.
sanfranciscensis can be explained by the amplification of DNA released from lysed cells, which can

44
be stressed for metabolic or osmolar factors during sourdough fermentation and not able to multiply
on the solid media. Also, Lb. sanfranciscensis growth is very fastidious: in fact, it requires fresh
yeast extract, unsaturated fatty acids and it preferentially ferments maltose instead than glucose
(Gobbetti and Corsetti, 1997).When Lb. sanfranciscensis was detected with wizard protocols, we
found a not unique profile but differences in the migration distances. Foschino et al., (2001) were
demonstrated that the analysis of 16S-23S rDNA spacer regions is unable to distinguish among the
Lb. sanfranciscensis isolates.
The yeast populations carried out with PCR-DGGE was also very low in variability. In fact, like the
results obtained by culture-dependent methods, only the specie S. cerevisiae was detected. Also the
number of bands were law, in fact, for all samples just one band was present in DGGE profile, with
the exception, the profiles for the samples I1, I2, I3, I4 and I4b where were present a second band
but it did not possible to purify. This specie was always detected by PCR-DGGE when it was
applied in sourdough samples (Garofalo et al., 2008; Gatto and Torriani, 2004; Meroth et al.,
2003b). Indeed, it is well known that microbial community analyses based on PCR-DGGE allow
the most representative species to be detected, owing to competition among heterogeneous
templates (Meroth et al. 2003a; Ercolini 2004).
4.2. SCREENING OF BACTERIA ISOLATED FROM BAKED PRODUCTS FOR
EXOPOLYSACCHARIDES PRODUCTION
The first aim of this part o the study, was to optimize a media to screen the LAB strains able to
produce exopolysaccharides. At this aim, the first medium that was testes was modified Agar
Chalmers, because it was the media used to isolate the LAB strains. All Leuconostoc strains tested
did not showed positive results. Therefore, the second medium that we tried was modified Agar
Chalmer plus sucrose (5%), because the extracellular glucansucrases, the enzymes involved in EPS
biosynthesis, are specifically induced by sucrose (Mizutani et al., 1994). In this case the strains
assayed did not showed EPS production, but just when we used modified Agar Chalmers with
sucrose (5%) as the only source of carbon, and without CaCO3 the strains were produced EPS. To
select the media, the some strains were tested on modified Agar Chalmers with different sugars as
carbon sources but no one produced EPS. This results confirmed data from literature, in fact, it is
known that Leuconostoc species can produce EPS, when in the media is present sucrose at high
concentration.
The EPS production was better after 48 hours of incubation.
After this media optimization, all LAB strains (192) and 15 Bacillus strains were tested on modified
Agar Chalmers with only sucrose as a carbon source and without CaCO3. In particular, the 61% of

45
the LAB strains, isolated from sourdough, were EPS+. In particular, among the positive strains, it
was possible mote that there were all strains belonging to the genera Leuconostoc sp. and Weisella
sp., while all strains belonging to the genera Enterococcus sp., Lactococcus and Lactobacillus sp.,
were negative, with the exception of two strains Lb.curvatus 69B2 e Lb. coryniformis subsp.
torquens 133, which were positives. The synthesis of EPS from sucrose for the species belonging to
the genera Weisella sp. and Leuconostoc sp. has been found previously. These strains were also
tested for the ropy test by Vescovo et al., (1989) methods, but they were all negative. Instead, 6
Bacillus strains were EPS + and showed, also, the ropy properties. In the end, to confirm the
previous results, a media with a mixture of sugars (maltose, sucrose and fructose) was used. This
media could be similar to the sourdough composition used for the production of sweet baked goods.
Only 23 strains were able to produce EPS on this media, instead all six positive strains of Bacillus
subtilis showed a positive results. The choice of the media used to study the EPS production is very
important because it will be critical factors for EPS isolation. A good substrate must be a good
source of carbohydrate, amino acids, vitamins, nucleic acid bases and mineral, because this kind of
media allow the quantitative and qualitative production of the HePS and the investigation of the
exact composition of the HePS produced. Instead, media containing complex nutrients like beef
extract, peptone and yeast extract are not suitable because of interference of these compounds with
the monomer and structure analysis of the HePS (Degeest et al., 2001). Usually, the screening for
EPS production is performed in broth media. The methodology that we optimized is advantageous
because the strains were inoculated directly in a solid media and for the consequent EPS isolation it
was not necessary the elimination of substances different from EPS like a high-molecular mass
material and also the protocol is easier and quickly because it is not necessary used the dialysis.
The results obtained by screening on this kind of solid media could hypothesize that the strain EPS+
are able to produce especially polysaccharides like dextrans or fructan.
The visual inspection of bacterial colonies on agar paltes is the easiest method but sometimes it can
be insensitive and only indicative (Welman et al., 2003), also with this method it is not possible
screen the LAB strains that produce a low amounts of EPS. Different alternatives exist but in this
study, we decided to perform a further screening by molecular investigations for both HoPS and
HePS. The frequencies of fructan- or glucan-positive strains were highest in Leuconostoc strains.
Glucans and fructans are formed from sucrose by the activity of a single enzyme, i.e., glucan- or
fructansucrase. Glucansucrases and fructansucrases display a similar protein domain organization
(van Hijum et al., 2006). Primers targeting the conserved catalytic domain have already been
developed to screen both for genes encoding glucansucrases or fructansucrases in LAB (Kralj et al.,
2003; Tieking et al., 2003).

46
In this study the strains were screened to for the presence of the genes involved in the production of
these two enzymes. All strains tested were positive for gtf or lev genes to predict the production of
omopolysaccharides, which could be dextran or fructan. This results can confirm also the results
obtained by the screening in solid media, because in that case, the strains were able to produce EPS
just when they grew on media containing sucrose and also because almost all positive strains were
belonging to the genera Weisella and Leuconostoc, the mostly species producing glucansucrases
and fructansucrases (Monsan et al., 2001). With the sequencing of the three strains we confirmed
the PCR amplification.
Recently, the molecular genetics of HePS biosynthesis have been studied for different LAB species
(De Vuyst et al., 2004; Provenchee et al., 2003). Several glycosyltransferases involved in the
assemblage of the HePS repeating units have been discovered (Jolly et al., 2002; van Kranenburg et
al., 1999; Mozzi et al., 2006). For this aim 17 LAB and bacilli strains were subjected to PCR
analysis with 4 different pairs of primer codifying for the different genes involved in HePS
biosynthesis. All strains tested showed a positive results for at least one gene except for the strain
Ln. pseudomesenteroides 79A. During this molecular analysis, a lot of aspecificity were obtained
that is because it will be necessary focalised more studies on the specific strains and design a new
specific pairs of primer. A good correlation between the presence of eps genes with the specific
primers described for HePS and the HePS phenotype was observed (Mozzi et al., 2006). An
inspected result was the negative epsA amplification for Bacillus subtilis strains, because from
literature data, it was knew that EpsA from S. thermophilus Sfi6 has been shown to have significant
homology with LytR of Bacillus subtilis (Stingele et al., 1996). In this study, it will be necessary a
characterization of EPS to can compare the results obtained. Anyways, screening with different sets
of eps primers could be a rapid alternative way to seek HePS-producing strains, although the HePS
phenotype has to be confirmed afterwards.
The result obtained by epsGTF sequencing can be because detection of this gene is difficult
considering that little similarity exists between genes encoding similar functions from distantly
related species (Provencher et al., 2003). However, single consensus primers targeting highly
conserved regions do not account well for codon usage and are thus most useful for more closely
related sequences (Rose et al., 1998). Also, the protein could be considered involved in the
synthesis of glucosiltransferases that they are cell wall bound enzymes.
It is very interesting note that the strain Lb. curvatus69B2 was able to produce EPS, as possible to
see from results obtained by both phonotypically and molecularly analysis. In fact, just in another
one paper it was reported the production of EPS from Lb. curvatus (Van der Meuken et al., 2007).
47
4.3. CHARACTERIZATION OF EXOPOLYSACCHARIDES FROM LACTOBACILLUS
PARABUCHNERI FUA3154
The study of EPS produced from the strain Lb. parabuchneri FUA3154 was complete. In fact, in
this case, we started with a production of EPS in broth and consequently purification and
quantification. Therefore, the EPS composition was evaluated with HPLC analysis and with
molecular approach, too. The important result was the identification by HPLC permit to note the
EPS monosaccharides and oligosaccharides composition. In fact, this strai was avìble to produce as
a monosaccharide dextran and as oligosaccharides that it was not possible identified because the
pick obtained did not correspond with the standard pick. Anyways, it was possible to highlight the
presence of different oligosaccharides like β-glucans constituted by linkages β-1.3 and other
polysaccharides with linkages α-1,6. Lactobacillus sp. G-77 was able to produce a
exopolysaccharides was shown to be a 2-substituted-(1-3)-β-D-glucan identical to that described for
the exopolysaccharides from P. damnosus 2,6 (Duenas-Chasco et al., 1997). This is the first time
that some LAB strains produce β-glucan. The ability to produce this kind of homopolysaccharides
is very important, because this strain could be use during sourdough fermentation with a consequent
improvement of the final quality of baked products. In fact, β-glucan can increased loaf volumes
and the viscosity of the dough (Lazaridou and Biliaderis, 2007). Finally, they also have a prebiotic
characteristic and can contribute to human health.
The molecular screening for Lb. parabuchneri FUA3154, to investigate its capability to posses the
genes involved in both HoPS and HePS biosynthesis. Positive results were obtained just for he
genes epsD/E and epsGTF, involved both priming glycosyltransferase. The genes for HoPS
biosynthesis were not present, but this it could be a contradiction with the data obtained with HPLC
analysis. It was demonstrated that the gene was less conserved in these strains and this can generate
the presence of false negatives that it is inevitable and has been reported previously (Tieking et al.,
2003-2005; Mozzi et al., 2006). Also a genetic screening can generate false positives that generate a
positive PCR signal, but the sequence of the amplified fragment does not correspond with the
targeted gene (Van der Meulen et al., 2007). That could be the explanation for negative results
obtained when the gene epsGTF was cloned and sequenced. A 200.bp sequence could be amplified
in this work from Lb. parabuchneri FUA3154 by PCR targeting for epsD/E gene and the database
searches revealed high similarity to eps gene cluster in S. thermophilus. This pairs of primer plus an
internal fragment of epsE/F genes were amplified from cDNA libraries of Lb.parabuchneri
FUA3154, indicating this gene expression in this strain. In this way, we obtained more specific
information about the genetic properties of this strain during EPS production.
48
5. CONCLUSIONS
The microbial characterization of sourdough for sweet leavened baked products by culture-
dependent and independent methods was very efficient to know and understand the biodiversity and
species complexity in sourdough samples.
In conclusion, this work highlights the need to combine both culture-dependent and culture
independent methods for a better description of complex microbial populations involved in the
production of fermented foods, such as sourdough.
The screening and selection of strains able to produce EPS highlighted the useful of the method to
obtain a rapid screening; but also it will be necessary confirm the EPS characterization by other
methods like for example, HPLC analysis to know the nature of the EPS produced. In this way the
results obtained from molecular screening will be confront with the EPS composition. Anyways, the
molecular approach can be easier method to allow a fast and initial selection of strains able to
produce EPS.
Future studies will be focalising to the characterization of monosaccharides and oligosaccharides
composition of EPS from positive strains. Also some of these strains will be test in vivo during
sourdough fermentation to choose a possible starter for a production of sweet leavened baked
goods.
Finally, Lb.parabuchneri FUA3154 can produce polysaccharides with α-1.6 linkages and β-1.3
linkages. The expression of epsE gene shows the possible relationship between eps gene cluster and
EPS production.
Future plans will be try to characterize the oligosaccharides obtained and also try some experiments
to study the behaviour of this strain in vivo, during sourdough fermentation. In the end we will
investigate the sequencing eps gene operon and looking for essential genes for EPS production
49
REFERENCES
AAAC 1975. Cereal Laboratory Methods 44-15A. Am. Activity. Assoc. Cereal Chem. Inc., St.
Paul, MN 39, 17-22.
Almiron-Roig, E., Mulholland, F., Gasson, M. J., Griffin, A. M., 2000. The complete cps gene
cluster from Streptococcus thermophilus NCFB 2393 involved in the biosynthesis of a new
exopolysaccharide. Microbiology 146, 2793-2802.
Altschul, S. F., Madden, T. L., Schaffer, A. A., Zhang, J., Zhang, Z., Miller, W. and Lipman, D. J.,
1997. “Gapped BLAST and PSI-BLAST: a new generation of protein database search programs”.
Nucleic Acids Research 25, 3389–3402.
Ampe, F., Sirvent, A., Zakhia, N., 2001. Dynamics of the microbial community responsible for
traditional sour cassava starch fermentation studied by denaturing gradient gel electrophoresis and
quantitative rRNA hybridization. International Journal of Food Microbiology 64, 45-54.
Arendt, E. K., Ryan, L. A. M., Dal bello, F., 2007. Impact of sourdough on the texture of bread.
Foood Microbiology 24, 165-174.
Avrahami, S., Liesack, W., Conrad, R., 2003. effects of temperature and fertilizer on activity and
community structure of soil ammonia oxidizers. Environ. Microbiol. 5, 691-705.
Axford, D. W. E., Kolwell, K. H., Cornfor, S. J., Elton, G. A. H., 1968. Effect of loaf specific
volume on rate and extent of staling in bread. J. Sci. Food Agric. 19, 95-101.
Banik, R. M., Kanari, B., Upadhyay, S. N., 2000. Exopolysaccharide of the gellan family: Prospects
and potential. World Journal of Microbiology and Biotecnology 16, 407-414.
Bano, N., Hollibaugh, j. T., 2002. Phylogenetic composition of bacterioplankton assemblages from
the artic Ocean. App. Environ. Microbiol. 68, 505-518.
Bechtel, W. G., Meisner, D. F., Bradley, W. B., 1953. The effect of crust on the staling of bread.
Cereal Chem. 30, 160-168.
ben Omar, N., Ampe, F., 2000. Microbial community dynamics during production of the Mexican
fermented maize dough Pozol. Appl. Environ. Microbiol. 66, 3664-3673.
Böcker, G., Stolz, P., Hammes, W.P., 1995. Neue Erkenntnisse zum Ökosystem sauerteig und zur
Physiologie des sauerteig-typischen Stämme Lactobacillus sanfrancisco und Lactobacillus pontis.
Getreide Mehl und Brot 49, 370-374.
Boels, I. C., Ramos, A., Kleerebezem, M., de Vos, W. M., 2001a. Functional analysis of the
Lactococcus lactis galU and galE genes and their impact on sugar nucleotide and
exopolysaccharide biosynthesis. Appl. Environ. Microbiol. 67, 3033-3040.
50
Boels, I. C., van Krananburg, R., Hugenholtz, J., Kleerebezem, M., de Vos, W. M., 2001b. Sugar
catabolism and its impact on the biosynthesis and engineering of exopolysaccharides production
in lactic acid bacteria. Int. dairy Journal 11, 723-732.
Bohn, R. T., 1961. Addition of dextran to bread doughs, US Patent 2983613.
Bouhnik, Y., vahedi, K., Achour, L., Salfati, J., Pochart, P., Marteau, P., Flourié, B., Bornet, F.,
Rambaud, J. C., 1999. Dose-related effect of short-chain fructo-oligosaccharides administration
on the colonic Bifidobacteria in healthy humans. Journal of Nutrition 129, 113-116.
Bourgoin, F., Pluvinet, A., Gintz, B., Decaris, B., Guedon, G., 1999. Are horizontal transfers
involved in the evolution of the Streptococcus thermophilus exopolysaccharide synthesis loci?
Gene 233, 151-161.
Bourne, M. C., 1982. Texture, viscosity and food. In: Bourne, M. C. (Ed.), Food Texture and
Viscosity. Concept and Measurement. Academic Press, new York, pp 1-23.
Brandt, M. J., Roth, K., Hammes, W. P., 2003. Effect of an exopolysaccharide produced by
Lactobacillus sanfranciscensis LTH1729 on dough and bread quality. In : L. de Vuyst (Ed.),
Sourdough from fundamentals to applications (p.80). Brussels: Vrije Universiteit Brussel (VUB),
IMDO.
Breedveld, M., Bonting, K., Dijkuizen, L., 1998. Mutational analysis of exopolysaccharide
biosynthesis by Lactobacillus sakei 0-1. FEMS Microbiology Letters 169, 241-249.
Broadbent, J. R., McMahon, D. J., Welker, D. L., Oberg, C. J., Moineau, S., 2003. Biochemistry,
genetics, and applications of exopolysaccharide production in Streptococcus thermophilus: a
review. Journal of Dairy Science 86, 407-423.
Bucholz, K., Monsan, P., 2001. Dextransucrases. In: J. R. Whitaker (Ed.), Handbook of food
enzymology. New York: Marcel Dekker, in press.
Cai, Y., Okeda, H., Mori, H., Benno, Y., Nakase, T., 1999. lactobacillus paralimentarius sp. nov.,
isolated from sourdoughs. International Journal of Systematic Bacteriology 49, 1451-1455.
Cerning, J., 1990. Exocellular polysaccharides produced by lactic acid bacteria. FEMS
Microbiology Reviews 87, 113-130.
Cerning, J., 1995. Production ofexopolysacc harides by lactic acid bacteria and dairy
propionibacteria. Lait 75, 463-472.
Cerning, J., Bouillanne, C., Desmazeaud, M. J., London, M., 1986. Isolation and characterization of
exocellular polysaccharide produced by Lactobacillus bulgaricus. Biotechnology Letters 8, 625-
628.
Cerning, J., Bouillanne, C., Desmazeaud, M. J., London, M., 1988. Exocellular polysaccharide
production by Streptococcus thermophilus. Biotechnology Letters 10-255-260.

51
Cerning, J., Bouillanne, C., London, M., Desmazeaud, M. J., 1990. Comparison of exocellular
polysaccharides production by thermophilic lactic acid bacteria. Science des Aliments 10, 443-
451.
Cerning, J., Bouillanne, C., London, M., Desmazeaud, M. J., 1992. Isolation and characterization of
exopolysaccharides from slime-forming mesophilic lactic acid bacteria. Journal of Dairy Science
75, 692-699.
Chabot, S., Yu, H. L., De Leseleuc, L., Cloutier, D., Van Calsteren, M. R., Lessard, M., Roy, D.,
Lacroix, M., Oth, D., 2001. Exopolysaccharides from Lactobacillus rhamnosus RW-9595M
stimulate TNF, IL-6 and IL-12 in human and mouse cultured immunocompetent cells, and IFN-γ
in mouse splenocytes. Lait 81, 683-697.
Chaoui, A., Fais, M., Belheen, R., 2003. Effect of natural starters used for sourdough bread in
Morocco on phytate biodegradation. East Mediterranean Health Journal 9, 141-147.
Clarke, C., Schober, T. J., Arendt, E. K., 2002. Effect of single strain and traditional mixed strain
starter cultures in rheological properties of wheat dough and bread quality. Cereal Chem. 79, 640-
647.
Collar, C., Benedito de Barber, C., Martinez-Anaya, M.A., 1994a. Microbial sourdoughs influence
acidification properties and bread making potential of wheat dough. J. Food Sci. 59, 629-633.
Collar, C., Martinez-Anaya, M.A., Benedito de Barber, C., 1994b. Interactive effects between
microbial breadmaking starters and wheat flours on sour dough and braed quality. Rev. Esp.
Cienc. Tecnol. Aliment. 34, 191-201.
Coppola S, Pepe O., Masi, P., Sepe, M., 1996. Characterization of leavened doughs for Pizza in
Naples. Advances in Food Science 18, 160-162.
Coppola S, Pepe O and Mauriello G, 1998. Effect of leavening microflora on pizza dough
properties. J. of Applied Microbiology 85: 891-897.
Corsetti, A., Gobbetti, M., Balestrieri, F., Paoletti, F., Russi, L., Rossi, J., 1998a. Sourdough lactic
acid bacteria effects on bread firmness and staling. J. Food Sci. 63, 347-351.
Corsetti, A., Gobetti, M., De Marco, B., Balestrieri, F., Paoletti, F., Russi, L., Rossi, J., 2000.
Combined effect of sourdough lactic acid bacteria and additives on bread firmness and staling. J.
Agric. Food Chem. 48, 3044-3951.
Corsetti, A., Gobbetti, M., Rossi, J., Damiani, P., 1998b. Antimuold activity of sourdough lactic
acid bacteria, identification of a mixture of organic acids produced by Lactobacillus sanfrancico
CB1. App. Microbiol. Biotechnol. 50, 253-256.
Corsetti, A., Settanni, L., 2007. Lactobacilli in sourdough fermentation: review. Food research
International 40, 539-558.
52
Crescenzi, V., 1995. Microbial polysaccharides of applied interest: Ongoing research activities in
Europe. Biotechnological Progress 11, 251-259.
Crowley, P., Schober, T., Clarke, C., Arendt, E., 2002. The effect of storage time on textural and
crumb grain characteristics of sourdough wheat bread. Eur. Food Res. Technol. 214, 489-496.
Dal Bello, F., Clarke, C.I., Ryan, L.A. M., Ulmer, H., Ström, K., Sjögren, J., van Sinderen, D.,
Schnürer, J., Arendt, E. K., 2007. Improvement of the quality and shelf life of wheat bread by
using the antifungal strain lactobacillus plantarum FST 1.7. J. Cereal Sci., 45, 309-318.
De Angelis, M., Bibi, L., Pallini, V., Cocconcelli, P. S., Gobetti, M., 2001. The acidic-stress
response in Lactobacillus sanfrancisciensis CB1. Microbiology 147, 1863-1873.
Degeest, B., de Vuyst, L., 1999. Indication that the nitrogen source influences both amount and size
of exopolysaccharides produced by Streptococcus thermophilus LY03 and modelling of the
bacterial growth and exopolysaccharide production in a complex medium. Appl. Environ.
Microbiol. 65, 2863-2870.
Degeest, B., de Vuyst, L., 2000. Correlation of activities of the enzymes a-phosphoglucomutase,
UDP-galactose 4-epimerase, and UDP-glucose pyrophosphorylase with exopolysaccharide
biosynthesis by Streptococcus thermophilus LY03. Appl. Environ. Microbiol. 66, 3519-3527.
Degeest, B., Vaningelgem, F., De Vuyst, L., 2001b. Microbial physiology, fermentation kinetics,
and process engineering of heteropolysaccharide production by lactic acid bacteria. International
Dairy Journal 11, 745-755.
Delcour, J., Ferain, T., Deghorain, M., Palumbo, E., Hols, P., 1999. The biosynthesis and
functionally of the cell-wall of lactic acid bacteria. Antonie van Leeuwenhoek 76, 159-184.
De Vuyst, L., Degeest, B., 1999. Heteropolysaccharides from lactic acid bacteria. FEMS
Microbiology Reviews 23, 153-177.
De Vuyst, L., De Vin, F., Vaningelgem, F., Degeest, B., 2001. Recent developments in the
biosynthesis and applications of heteropolysaccharides from lactic acid bacteria. International
Dairy Journal 11, 687-707.
De Vuyst, L., Neysens, P., 2005. The sourdough microflora, biodiversity and metabolic
interactions. Trends Food Sci. Technol. 16, 43-56.
De Vuyst, L., Vanderveken, F., Van de Ven, S., Degeest, B., 1998. Production by and isolation of
exopolysaccharides from Streptococcus thermophilus grown in a milk medium and evidence for
their growth-associated biosynthesis. Journal of Applied Microbiology 84, 1059-1068.
De Vuyst, L., Vaningelgen, F., 2004. Developing new polysaccharides from lactic acid bacteria, p.
275–320. In B. M. McKenna (ed.), Texture in food, vol. 2. Semi-solid foods. Woodhead
Publishing Ltd., Cambridge, United Kingdom.
53
Di Cagno, R., De Angelis, M., Lavermicocca, P., De Vincenzi, M., Giovannini, C., Faccia, M.,
Gobetti, M., 2002. Proteolysis by sourdough lactic acid bacteria. Effect on wheat flour protein
fractions and gliadin peptides involved in human cereal intolerance. Appl. Environ. Microbio. 68.
623-633.
Di Cagno, R., De Angelis, M., Limitone, A., Minervini, F., Carnevali, P., Corsetti, A., Gänzle, M.
G., Ciati, R., Gobbetti, M., 2006. Glucan and Fructan production by Sourdough Weisella cibaria
and Lactobacillus plantarum. J. Agric. Food. Chem. 54, 9873-9881.
Diplock, A. T., Aggett, P. J., Ashwell, M., Bornet, F., Fern, E. B., Roberfroid, M. B., 1999.
Scientific concepts of functional foods in Europe: Consensus document. British Journal of
Nutrition 81, S1-S27.
Duenas-Chasco, M. T., Rodriguez-Carvajal, M. A., Tejero-Mateo, P., Espartero, J. L., Irastorza-
Iribas, A., Gil-serrano, A. M., 1998. Structural analysis of the exopolysaccharides produced by
Lactobacillus spp. G-77. Carbohydrate Research 303, 453-458.
Duenas-Chasco, M. T., Rodriguez-Carvajal, M. A., Tejero-Mateo, P., Franco-Rodriguez, G.,
Espartero, J. L., Irastorza-Iribas, A., Gil-serrano, A. M., 1997. Structural analysis of the
exopolysaccharide produced by Pediococcus damnosus 2.6. Carbohydrate Research 307, 125-
133.
Duwat, P., Cochu, A., Ehrlich, D., Gruss, A., 1997. Characterization of L. lactis UV-sensitivity
mutants obtained by ISS1 transposition. Journal of Bacteriology 179, 4473-4479.
Ehrmann, M. A., Müller, M. R. A., Vogel, R. F., 2003. Molecular analysis of sourdough reveals
Lactobacillus mindensis sp. nov. International Journal of Systematic and Evolutionary
Microbiology 53, 7-13.
Ehrmann, M. A., Vogel, R. F., 2005. Molecular taxonomy and genetics of sourdough lactic acid
bacteria. Trends in Food and Technology 16, 31-42.
Ercolini, D., 2004. PCR-DGGE fingerprinting: novel strategies for detection of microbes in food:
review. Journal of Microbiological Methods 56, 297-314.
Ercolini D, Moschetti G, Blaiotta G and Coppola S, 2001. The potential of a Polyphasic PCR-
DGGE Approach in evaluating Microbial Diversity of Natural Whey Cultures for water-Buffalo
Mozzarella Cheese Production: Bias of Culture-Dependent and Culture-independent Analyses.
Systematic and Applied Microbiology 24: 610-617.
Forde, A., Fitzgerald, G. F., 1999. Analysis of exopolysaccharide (EPS) production mediated by the
bacteriophage adsorption blocking plasmid, pCI68, isolated from Lactoccocus lactis spp.
cremoris HO2. International Dairy Journal 9, 465-472.
54
Forsen, R., Niskasaari, K., Niemitalo, S., 1985. Immunochemical demonstration of lipoteichoic acid
as a sufrace-exposed plasma membrane antigen of slime-forming, encapsulated Streptococcus
cremoris from the fermented milk product “viili”. FEMS Microbiology Letters 26, 249-253.
Foschino, R., Arrigoni, C., Picozzi, C., Mora, D., Galli, A., 2001. Phenotypic and genotypic aspects
of Lactobacillus sanfranciscensis strains isolated from sourdoughs in Italy. Food Microbiology
18, 277-285.
Foschino, R., Galli, A., Perrone, F. & Ottogalli, G., (1995). Prodotti da forno ottenuti da impasti a
lievitazione naturale: studio e caratterizzazione della microflora tipica. Tecnica molitoria, pag
485-503.
Foschino, R., Gallina, S., Andrighetto, C., Rossetti, L., Galli, A., 2004. Comparison of cultural
methods for the identification and molecular investigation of yeasts from sourdoughs for Italian
sweet baked products. FEMS Yeast Research 4, 609-618.
Foschino, R., Terranno, R., Mora, D. & Galli, A., (1999). Microbial characterization of sourdoughs
for sweet baked products. Ital. J. Food Sci., 11, 19-28.
Galli, A., Franzetti, L., Fortina, M. G., 1988. Isolation and identification of sourdough microflora.
Micr. Alim. Nutr. 6, 345.
Galli, A., Ottogalli, G., 1973. Aspetti della microflora degli impasti per panettone. Ann. Microbiol.
Enzimol. 23, 39.
Gamar, L., Blondeau, K., Simonet, J. M., 1997. Physiological approach to extracellular
polysaccharide production by Lactobacillus rhamnosus strain C83. Journal of Applied
Microbiology 83, 281-287.
Gamar-Nourani, L., Blondeau, K., Simonet, J. M., 1998. Influence of culture conditions on
exopolysaccharide production by Lactobacillus rhamnosus strain C83. Journal of Applied
Microbiology 85, 664-672.
Garcia-Garibay, M., Marshall, V. M. E., 1991. Polymer production by Lactobacillus delbrueckii
ssp. bulgaricus. Journal of Applied Bacteriology 70, 325-328.
Garofalo, C., Silvestri, G, Aquilanti, L., Clementi, F., 2008. PCR-DGGE analysis of lacti acid
bacteria and yeast dynamics during the production processes of three varieties of Panettone.
Journal of Applied Microbiology 105, 243-254.
Gassem, M. A., Schmidt, K. A., Frank, J. F., 1997. Exopolysaccharide production from whey
lactose by fermentation with Lactobacillus delbrueckii ssp. bulgaricus. Journal of Food Science
62, 171-173.
55
Gatto, V., Torriani, S., 2004. Microbial population changes during sourdough fermentation
monitored by DGGE analysis of 16S and 26S rRNA gene fragments. Annals of Microbiology 54,
31-42.
German, B., Schiffrin, E. J., Reniero, R., Mollet, B., Pfeifer, A., Neeser, J. R., 1999. The
development of functional foods: lessons from the gut. Trends Biotechnol. 17, 492-499.
Gobbetti, M., 1998. The sourdough microflora: interactions of lactic acid bacteria and yeasts.
Trends in Food Science and Technology 9, 267-274.
Gobbetti, M., Corsetti, A., 1997. Lactobacillus sanfranciscisco a key sourdough lactic acid
bacterium: a review. Food Microbiiology 14, 175-187.
Gobbetti, M., Corsetti, A., Rossi, J., 1994a. The sourdough microflora. Interaction between lactic
acid bacteria and yeasts: metabolism of amino acids. World journal of Microbiology and
Biotechnology 10, 456-460.
Gobbetti, M., Corsetti, A., Rossi, J., 1994b. The sourdough microflora. Interaction between lactic
acid bacteria and yeasts: metabolism of amino acids. Applied Microbiology and Biotechnology
41, 456-460.
Gobbetti, M., Corsetti, A., Rossi, J., 1994c. The sourdough microflora. Interaction between lactic
acid bacteria and yeasts: metabolism of amino acids. World Journal of Microbiology and
Biotechnology 10, 275-279.
Gobbetti, M., Corsetti, A., Rossi, J., 1995. Interactions between Lactic Acid Bacteria and Yeasts in
Sour Dough using a Rheofermentometer. World J. Microbiol. Biotechnol. 11. 625-630.
Gobbetti, M., Corsetti, A., Rossi, J., La Rosa, F. & De Vincenti, S., (1994d). Identification and
clustering of lactic acid bacteria and yeasts from wheat sourdough of central Italy. Italian journal
of food science, 5, 85-94.
Gregersen, T., 1978. Rapid method for distinction of Gram-negative form Gram-positive bacteria.
European J. Appl. Microbiol. Biotechnal. 5, 123.
Griffin, A. M., Morris, V. J., Gasson, M. J., 1996. The cpsABCDE genes involved in
polysaccharide production in Streptococcus salivarius ssp. thermophilus strain NCBF 2393. gene
183, 23-27.
Grobben, G. J., Chin-Joe, I., Kitzen, V. A., Boels, I. C., Boer, F., Sikkerna, J., Smith, M. R., De
Bont, J. A. M., 1998. Enhancement of exopolysaccharide production by Lactobacillus delbrueckii
subsp. bulgaricus NCFB 2772 with a simplified defined medium. Appl. Environ. Microbiol 64,
1333-1337.
Gül, H., Ozcelik, S., Sagdic, O., Certel, M., 2005. sourdough bread production with lactobacilli and
S. cerevisiae isolated from sourdoughs. Process Biochem. 40, 691-697.
56
Hammes, W. P., Gänzle, M. G., 1998. Sourdough breads and related products. In: Woods, B. J. B.
(Ed.), Microbiology of Fermented Foods, vol.1. Blackie Academic/ Professional, London, pp.
199-216.
Hammes, W. P., Brandt, M. J., Kerstin L. F., Rosenheim, J., Seitter, M. F. H., Vogelmann, S. A.,
2005. Microbial ecology of cereal fermentations. Trends Food Sci. Technol. 16, 4-11.
Hammes, W. P., Stolz, P., Gänzle, M. G., 1996. Metabolism of lactobacilli in traditional
sourdoughs. Advances in Food Science 18, 176-184.
Hansen, A., Lund, B., Lewis, M. J., 1989a. Flavour production and acidification of sour doughs in
relation to starter culture and fermentation temperature. Lebensmittel Wissenschaft und
Technologie 22, 145-144.
Heilig, H. G. H. J., Zoetendhal, E. G., Vaughan, E. E., Marteau, P., Akkermans, A. D. L., De Vos,
W. M., 2002. Molecular diversity of Lactobacillus spp. And other lactic acid bacteria in the
human intestine as determined by specific amplification of 16S ribosomal DNA. Appl. Environ.
Microbiol. 68, 114-123.
Hestrin, S., Averini-Shapiro, S., Aschner, M., 1943. The enzymic production of levan.
Biochemistry Journal 37, 450-456.
Hosono, A., Lee, J., Ametani, A., Natsume, M., Hirayama, M., Adachi, T., Kaminogawa, S., 1997.
Characterization of a water-soluble polysaccharide fraction with immunopotentiating activity
from Bifidobacterium adolescentis M101-4. Biosci. Biotechnol. Biochem. 61, 312-316.
Jenson, I., 1998. Bread and baker’s yeast. In: B. J. B. Wood (Ed.), Microbiology of fermented
foods. London: Blackie Academic and Professional, pp.172-198.
Johnson, L. A., 2000. The major cereal of the Americas. In: K. Kulp and J. G. Ponte (Eds.),
Handbook of cereal science and technology, 2nd ed., New York : Marcel Dekker, pp. 31-80.
Jolly, L., Newell, J., Porcelli, I., Vuncent, S. J., Stingele, F., 2002. Lactobacillus helveticus
glycosyltransferases: from genes to carbohydrate synthesis. Glycobiology 12, 319-327.
Jolly, L., Stingele, F., 2001. Molecular organization and functionality of exopolysaccharide gene
clusters in lactic acid bacteria. Int. Dairy J. 11, 733-745.
Kawamura, Y., Yonezawa, D., 1982. Wheat flour proteases and their action on gluten proteins in
dilute acetic acid. Agric. Biol. Chem. 46, 767-773.
Kitazawa, H., Haratat, T., Uemura, J., Saito, T., Kaneko, T., Itoh, T., 1998. Phosphate group
requirement for mitogenic activation of lymphocytes by an extracellular phosphopolysaccharide
from Lactobacillus delbrueckii ssp. bulgaricus. Int. J. Food Microbiol. 40, 169-175.
57
Kline, L., Sugihara, T. F., 1971. Microorganisms of the San Francisco sour dough bread process. II.
Isolation and characterization of underscribed bacterial species responsible for the souring
responsible for the souring activity. Appl. Microbiol. 21, 459-465.
Knoshaug, E. P., Ahlgren, J. A., Trempy, J. E., 2000. Growth associated Exopolysaccharide
Expression in Lactococcus lactis subspecies cremoris Ropy352. Journal of Dairy Science 83, 633-
640.
Koespell, H., Tsuchiya, H., hellman, N., Kasenko, A., Hoffman, C., Sharpe, E., Jackson, R., 1952.
Enzymatic synthesis of dextran. Acceptor specificity and chain initiation. Journal of Biological
Chemistry 255, 12034-12036.
Kojic, M., Vujcic, M., Banina, A., Cocconcelli, P., Cerning, J., Topisirovic, L., 1992. Analysis of
exopolysaccharide production by Lactobacillus casei CG11, isolated from cheese. Appl. Environ.
Microbiol. 58, 4086-4088.
Korakli, M., Gänzle, M. G., Vogel, R. F., 2002. Metabolism by bifidobacteria and lactic acid
bacteria of polysaccharides from wheat and rye, and exopolysaccharides produced by
Lactobacillus sanfranciscensis. Journal of Applied Microbiology 92, 958-965.
Korakli, M., Pavlovic, M., Gänzle, M. G., Vogel, R. F., 2003. Exopolysaccharide and kestose
production by Lactobacillus sanfranciscensis LTH2590. Appl. Environ. Microbiol. 69, 2073-
2079.
Kralj, S., van Geel-Schutten, G. H., van der Maarel, M., Dijkhuizen, L., 2003. Efficient screening
methods for glucosyltransferase genes in Lactobacills strains. Biocatalysis and Biotrasformation
21, 181-187.
Kurtzman, C. P., Robnett, C. J., 1998. Identification and phylogeny of ascomycetous yeasts from
analysis of nuclear large subunit (26S) ribosomal DNA partial sequences. Antonie van
Leeuwenhoek 73, 331–371.
Lacaze, G., Wick, M., Cappelle, S., 2007. Emerging fermentation technologies: development of
novel sourdoughs. Food Microbiology 24, 155-160.
Lavermicocca, P., Valerio, F., Evidente, A., Lazzaroni, S., Corsetti, A., Gobetti, M., 2000.
Purification and characterization of antifungal compounds from the sourdough Lactobacillus
plantarum strain 21B. Appl. Environ. Microbiol. 66, 2073-2079.
Lavermicocca, P., Valerio, F., Visconti, A., 2003. Antifungal activity of phenyllactic acid against
molds isolated from bakery products. App. Environ. Microbiol. 69, 634-640.
Laws, A., Yucheng, G., Marshall, V., 2001. Biosynthesis, characterisation, and design of bacterial
exopolysaccharides from lactic acid bacteria. Biotechnology Advances 19, 597-625.
58
Lazaridou, A., Biliaderis, C. G., 2007. Molecular aspects of cereals β-glucan functionality: Physical
properties, technological applications and physiological effects. Journal of Cereal Science 46,
101-118.
Leathers, T., 2002. Dextran. In A. Steinbüchel, S. A. baets, E. H. Vandamme, E. H. Biopolymers.
Weinheim: Wiley VCH, pp 299-322.
Lilijeberg, H., Björck, I., 1994. Bioavailability of starch in bread products. Postprandial glucose and
insulin responses in health subjects and in vitro resistant starch content. Eur. J. Clin. Nutr. 48,
151-164.
Liljeberg, H. G. M., Lönner, C. H., Björck, I. M. E., 1995. Sourdough fermentation or addition of
organic acids or corresponding salts to bread improves nutritional properties of starch in healty
humans. J. Nutr. 125, 1503-1511.
Lin, W., Lineback, D. R., 1990. Changes in carbohydrates fractions in enzyme-supplemented bread
and the potential relationship to staling. Starch 42, 385-394.
Looijesteijn, P. L., Hugenholtz, J., 1999. Uncoupling of growth and exopolysaccharide production
by Lactococcus lactis subsp. cremoris NIZO B40 and optimisation of its exopolysaccharide
synthesis. Journal of Bioscience and Bioengineering 88, 159-163.
Looijesteijn, P. L., Trapet, L., de Vries, E., Abee, T., Hugenholtz, J., 2001. Physiological function
of exopolysaccharides produced by Lactococcus lactis. International Journal of Food
Microbiology 64, 71-80.
Lopez-Munguia, A., Pelenc, V., Remaud, M., Biton, J., Michel, J., Lang, C., Monsan, P., 1993.
Production and purification of alternansucrase, glucosyltransferase from Leuconostoc
mesenteroides NRRL B-1355 for the synthesis of oligoalternans. Enzyme and Microbial
Technology 15, 77-85.
Maleki, M., Hoseney, R. C., mattern, P. J., 1980. Effects of loaf volume, moisture content and
protein quality on the softness and staling rate of bread. Cereal Chem. 57, 138-140.
Meroth, C. B., Hammes, W. P., Hertel, C., 2004. Characterisation of the microbiota of rice
sourdoughs and description of Lactobacillus spicheri sp. nov. Systematic and applied
Microbiology 27, 151-159.
Meroth, C. B., Walter, P., Hertel, C., Brandt, M., Hammes, W. P., 2003a. Monitoring the bacterial
population dynamics in sourdough fermentation processes by using PCR-denaturing gradient gel
electrophoresis. Appl. Environ. Microbiol. 69, 475-482.
Meroth, C. B., Walter, P., Hammes, W. P., Hertel, C., 2003b. Identification and Population
Dynamics of Yeasts in Sourdough fermentation Processes by PCR-Denaturing Gradient gel
Electrophoresis. Appl. Environ. MIcrobiol. 69, 7453-7461.
59
Miambi, e., Guyot, J. P., Ampe, F., 2002. Identification, isolation and quantification of
representative bacteria from fermented cassava dough using an integrated approach of culture-
dependent and culture-independent methods. International Journal of Food Microbiology 82, 111-
120.
Mizutani, N., Yamada, M., Takayama, K., Shoda, M., 1994. Constitutive mutants for
dextransucrase from Leuconostoc mesenteroides NRRL B-512F. Journal of Fermentation
Bioengineering 77, 248-251.
Molnár O., Prillinger H., 2005. Analysis of yeast isolates related to Metschnikowia pulcherrima
using the partial sequences of the large subunit rDNA and the actin gene; description of
Metschnikowia andauensis sp. nov. Systematic and Applied Microbiology 28, 717–726.
Monsan, P., Bozonnet, S., Albenne, C., Joucla, G., Willemot, R. M., Remaud-Simeon, M., 2001.
Homopolysaccharides from lactic acid bacteria. International Dairy Journal 11, 675-685.
Mozzi, F., Oliver, G., Savoy de Giori, G. S., Font de Valdez, G. F., 1995a. Influence of temperature
on the production of exopolysaccharides by thermophilic lactic acid bacteria. Milchwissenschaft
50, 80-82.
Mozzi, F., Savoy de Giori, G. S., Oliver, G., Font de Valdez, G. F., 1994. Effect of culture pH on
the growth characteristics and polysaccharide production by Lactobacillus casei.
Milchwissenschaft 49, 667-670.
Mozzi, F., Savoy de Giori, G. S., Oliver, G., Font de Valdez, G. F., 1996a. Exopolysaccharide
production by Lactobacillus casei under controlled pH. Biotechnology Letters 18, 435-439.
Mozzi, F., Vaningelgem, F., Hebert, E. M., Van der Meulen, R., Moreno, M. R. F., Font de Valdez,
G. and De Vuyst, L., 2006. Diversity of Heteropolysaccharide-Producing Lactic Acid Bacterium
Strains and Their Biopolymers. App. Environ. Microbiol. 72, 4431-4435.
Müller, M. R. A., Ehrmann, M. A., Vogel, R. F., 2000a. Lactobacillus frumenti sp. nov., a new
lactic acid bacterium isolated from rye-bran fermentation with a long fermentation period.
International Journal of Systematic and Evolutionary Microbiology 50, 2127-2133.
Müller, M. R. A., Wolfrum, G., Stolz, P., Ehrmann, M. A., Vogel, R. F., 2001. Monitoring the
growth of Lactobacillus species during a rye flour fermentation. Appl. Environ. Microbiol. 66,
2113-2116.
Muyzer, G., de Waal, E. C., and Uitterlinden, A. G., 1993. Profiling of complex microbial
populations by denaturing gradient gel electrophoresis analysis of polymerase chain reaction-
amplified genes coding for 16S rRNA. App. Environ. Microbiol. 59, 695-700.
60
Muyzer G., Smalla, K., 1998. Application of denaturing gradient gel electrophoresis (DGGE) and
temperature gradient gel electrophoresis (TGGE) in microbial ecology. Antonie van
Leeuwenhoek 73, 127-141.
Nicol, G. W., Glover, L. A., Prosser, J. I., 2003. the impact grassland management on archaeal
community structure in upland pasture rhizosphere soil. Environ. Microbiol. 5, 152-162.
Norris, T. B., Wraith, J. M., Castenholz, R. W., McDermott, T. R., 2002.soil microbial community
structure across a thermal gradient following a geothermal heating event. Appl. Environ.
Microbiol. 68, 6300-6309.
Oelke, E. A., Boedicker, J. J., 2000. Wild rice: Processing and utilization. In: K. Kulp and J. G.
Ponte (Eds.), Handbook of cereal science and technology, 2nd ed., New York : Marcel Dekker, pp.
275-295.
Ottogalli, G., Galli, A., and Foschino, R., 1996. Italian bakery products obtained with sour dough:
characterization of the typical microflora. Advances in Food Science, 18, 131-134.
Orla-Jensen,1943. The lactic acid bacteria. Kopenhagen: Det Kongelige Danske Videnskabernes
Selskab. Biologiske Skrifter Bind II Nr. 3.
Pepe, O., Blaiotta, G., Anastasio, M., Moschetti, G., Ercolini, D., Villani, F., 2004. Technological
and Molecular Diversity of Lactobacillus plantarum Strains Isolated from Naturally Fermented
Sourdoughs. System. Appl. Microbiol. 27, 443-453.
Pepe, O., Villani, F., Coppola, S., 2001. Differential viable count of mixed starter cultures of lactic
acid bacteria by using modified Chalmers medium. Microbial Res. 155, 351-354.
Petry, S., Furlan, S., Crepeau, M. J., Cerning, J., Desmazeaud, M., 2000. Factors affecting
exocellular polysaccharide production by Lactobacillus delbrueckii subsp. bulgaricus grown in a
chemically defined medium. Appl. Environ. Microbiol. 66, 3427-3431.
Picozzi, C., D’Anchise, F., Foschino, R., 2006. PCR detection of Lactobacillus sanfranciscensis in
sourdough and Panettone baked product. Eur. Food Res. Technol. 222, 330-335.
Provencher, C., La Pointe, G., Sirois, S., Van Calsteren, M. R., Roy, D., 2003. Consensus
degenerate hybrid oligonucleotide primers for amplification of priming glycosyltransferase genes
of the exopolysaccharide locus in strains of the Lactobacillus casei group. Appl. Environ.
Microbiol. 69, 3299-3307.
Pulvirenti, A., Solieri, L., Gullo, M., De Vero, L., Giudici, P., 2004. occurence and dominance of
yeast species in sourdough. Lettersi in Applied Microbiology 38, 113-117.
Ramos, A., Boels, I. C., de Vos, W., Santos, H., 2001. Relationship between glycolysis and
exopolysaccharide biosynthesis in Lactococcus lactis. Appl. Environ. Microbiol. 67, 33-41.
61
Randazzo, C. L., Heilig, H., Restuccia, C., Giudici, P., Caggia, C., 2005. Bacterial population in
traditional sourdough evaluated by molecular methods. Journal of Applied Microbiology 99, 251-
258.
Reeson, A. F., Jancovic, T., Kasper, M. L., Rogers, S., Austin, A. D., 2003. Application of 16S
rDNA-DGGE to examine the microbial ecology associated with a social wasp Vespula
germanica. Insect Mol. Biol. 12, 85-91.
Remaud-Simeon, M., Willemot, R. M., Sarcabal, P., Potocki de Montalk, G., and Monsan, P., 2000.
Glucansucrases: molecular engineering and oligosaccharide synthesis. Journal of molecular
Catalysis B 10, 117-128.
Ricciardi, A., Clementi, F., 2000. Exopolysaccharides from lactic acid bacteria: Structure,
production and technological applications. Italian Journal of Food Science 12, 23-45.
Roberts, I. S., 1995. Bacterial polysaccharides in sickness and in health. The 1995 Fleming Lecture.
Microbiology 141, 2023-2031.
Roberts, I. S., 1996. The biochemistry and genetics of capsular polysaccharide production in
bacteria. Annual Reviews of Microbiology 50, 285-315.
Robyt, J. F., Walseth, T., 1979. Production, purification, and properties of dextransucrases from
Leuconostoc mesenteroides NRRL B-512F. Carbohydr. Res. 68, 95-111.
Roller, S., Dea, I. C. M., 1992. Biotechnology in the production and modification of biopolymers
for foods. Critical Reviews in Biotecnology 12, 261-277.
Rose, T. M., Schultz, E. R., Henokoff, J. G., Pietrokovski, S., McCallum, C. M., Henikoff, S., 1998.
Consensus-degenerate hybrid oligonucleotide primers for amplification of distantly related
sequences. Nucleic Acids Res. 26, 1628-1635.
Salovaara, H., 1998. Lactic acid bacteria in cereal-based products. In S. Salminen & A. von Wright
(Eds.), Lactic acid bacteria microbiology and functional aspects (pp. 115–138). New York:
Marcel Dekker.
Sandhu, G.S., Kline, B.C., Stockman, L., Roberts, G. D., 1995. Molecular probes for the diagnosis
of fungal infections. Journal of Clinical Microbiology 33, 2913-2919.
Scheirlinck, I., Van der Meulen, R., Van Schoor, A., Vancanneyt, M., De Vuyst, L., Vandamme, P.,
Huys, G., 2008. Taxonomic Structure and Stability of the Bacterial Community in Belgian
Sourdough Ecosystems as Assessed by Culture and Population Fingerprinting. Appl. Environ.
Microbiol. 74, 2414-2423.
Schober, T. J., Dockery, P., arendt, E. K., 2003. Model studies for whet sourdough system using
gluten, lactate buffer and sodium chloride. Eur. Food Res. Technol. 217, 235-243.
62
Senses-Ergul S., Ấgoston R., Belảk A, Deảk T., 2005. Characterization of some yeasts isolated
from foods by traditional and molecular tests. International Journal of Food Microbiology 108,
120-124.
Severini, C., De Pilli, T., Cannito, G., Baiano, A., Peri, G., 2002. Di。erenti tipologie di lievito per la
produzione di pane di grano duro. Tecnica Molitoria 30, 5-9.
Shimamura, A., Tsumori, H., Mukasa, H., 1983. Three kinds of extracellular glucosyltransferases
from Streptococcus mutans 6715 (serotype g). FEBS Letters 157, 79-84.
Sinnot, M. L., 1990. Catalytic mechanisms of enzymatic glycosyltransfer. Chemical Reviews 90,
1171-1202.
Smith, M. R., Zahnley, J., Wong, R. Y., Lundin, R. E., Ahlgren, J. A., 1998. A mutant strain of
Leuconostoc mesenteroides B-1355 producing a glucosyltransferase synthesizing α(1,2)
glucosidic linkages. Journal of Industrial Microbiology and Biotechnology 21, 37-45.
Stingele F., Neeser, J. R., Mollet, B., 1996. Identification and characterization of the eps
(exopolysaccharide) gene cluster from Streptococcus thermophilus Sfi6. Journal of Bacteriology
178, 1680-1690.
Stingele F., Newell, J. W., Neeser, J. R., 1999a. Unraveling the function of glycosyltransferases in
Streptococcus thermophilus Sfi6. Journal of bacteriology 181, 6354-6360.
Stolz, P., 1999. Mikrobiologie des Sauerteiges. In: G. Spicher, & H. Stephan (Eds.), Handbuck
Sauerteig: Biologie, Biochemie, Technologie 5th ed., Hamburg: Behr’s Verlag, pp. 35-60.
Succi, M., Reale, A., Andrighetto, C., Lombardi, A., Sorrentino, E., Coppola, R., 2003. Presence of
yeasts in southern Italian sourdoughs from Triticum aestivum flour. FEMS Microbiology Letters
225, 143-148.
Sutherland, I. W., 1972. Bacterial exopolysaccharides. Advances in Microbiological Physiology 8,
143-213.
Sutherland, I. W., 1986. Industrially useful microbial polysaccharides. Microbiological Science 3,
5-9.
Sutherland, I. W., 1990. Biotechnology of microbial exopolysaccharides. Cambridge, UK:
Cambridge University Press.
Sutherland, I. W., 1998. Novel and established applications of microbial polysaccharides. Trends in
Biotechnology 16, 41-46.
Takehiro, U., Teruo, N., Akemi, W., Terumi, U., 1994. Modifier for frozen bread dough and
production of frozen bread dough. Japanese patent 08009892A.
Tieking, M., Gänzle, M. G., 2005. Exopolysaccharides from cereal associated lactobacilli. Trends in
Food Science & Technology 16, 79-84.
63
Tieking, M., Korakli M., Ehrmann, M. A., Gänzle, M. G., Vogel, R. F., 2003. In situ production of
exopolysaccharides during sourdough fermentation by cereal and intestinal isolates of latic acid
bacteria. Appl. Environ. Microbiol. 69, 945-952.
Thiele, c., Gänzle, M. G., Vogel, R. F., 2002. Contribution of sourdough lactobacilli, yeast and
cereal enzymes to the genaration of amino acids in dough relevant for bread flavour. Cereal
Chem. 16, 79-84.
Thompson, J. D., Higgins, D. G., Gibson, T. J., 1994. Clustal-W-improving the sensitivity of
progressive multiple sequence alignment through sequence weighting, position-specific gap
penalties and weight matrix choice. Nucleic Acids Research 22, 4673-4680.
Toba, T., Nakajima, H., Tobitani, A., Adachi, S., 1990. Scanning electron microscopic and texture
studies on characteristic consistency of Nordic ropy sour milk. International Journal of Food
Microbiology 11, 313-320.
Tombs, M., Harding, S. E., 1998. An introduction to polysaccharide biotechnology. London, UK:
Taylor and Francis Ltd.
Tokunaga, T., Nakada, Y., Tashiro, Y., Hirayama, M., Hidaka, H., 1993. Effects of fructo-
oligosaccharides on the intestinal microflora and defecation in healty volunteers. Bifidus 6, 471-
476.
Van der Meulen, R., Grosu-Tudor, S., Mozzi, F., Vaningelgem, F., Zamfir, M., Font de Valdez, G.,
De Vuyst, L., 2007a. Screening of lactic acid bacteria isolates from dairy and cereal products for
exopolysaccharide production and genes involved. International Journal of Food Microbiology
118, 250-258.
Van der Meulen, R., Scheirlinck, I., Van Schoor, A., Huys, G., Vancanneyt, Vandamme, P., De
Vuyst, L., 2007b. Population Dynamics and Metabolite Target Analysis of Lactic Acid Bacteria
during Laboratory Fermentations of Wheat and Spelt Sourdoughs. Appl. Environ. Microbiol. 73,
4741-4750.
Van Eijk, J. H., Hille, J. D. R., 1996. Nonamylolytic enzymes. In: Hebeda, R. E., Zobel, H. (Eds.),
baked Goods Freshness. Marcel dekker, New York, pp. 131-150.
van Hijum, S., Kralj, S., Ozimek, L. K., Dijkhuizen, L., van Geel-Schutten, I. G. H., 2006.
Structure–function relationships of glucansucrase and fructansucrase enzymes from lactic acid
bacteria. Microbiology and Molecular Biology Reviews 70, 157-176.
van Kranenburg, R., Marugg, J. D., van Swam, I. I., Willem, N. J., de Vos, W. M., 1997. Molecular
characterization of the plasmid encoded eps gene cluster essential for exopolysaccharide
biosynthesis in Lactococcus lactis. Molecular Microbiology 24, 387-397.
64
van Kranenburg, R., Voss, H. R., Van Swam, I. I., Willem, N. J., De Vos, W. M., 1999. Functional
analysis of glycosyltransferases genes from Lactococcus lactis and other gram-positive cocci:
complementation, expression, and diversity. J. Bacteriol. 181, 6347-6353.
Vanos, V., & Cox, L., 1986. Rapid routine method for the detection of lactic acid bacteria among
competitive flora. Food Microbiol., 3, 223-234.
Vernocchi, P., Valmorri, S., Gatto, V., Torriani, S., Gianotti, A., Suzzi, G., Guerzoni, M. E.,
Gardini, F., 2004. A survey on yeast microbiota associated with an Italian traditional sweet-
leavened baked good fermentation. Food Research International 37, 469-476.
Vescovo, M., Scolari, G. L., and Bottazzi, V. 1989. Plasmid-encoded ropiness production in
Lactobacillus casei ssp. casei. Biotechnol. Lett. II 10, 709-711.
Vogel, R. F., 1997. Microbial Ecology of Cereal Fermentations. Food Tecnhol. Biotechnol. 35, 51-
54.
Vogel, R. F., Böcker, G., Stolz, P., Ehrmann, M., Fanta, D., Ludwig, W., Pot, B., Kersters, K.,
Schleifer, K. H., Hammes, W. P., 1994. Identification of lactobacilli from sourdough and
description of Lactobacillus pontis sp. nov. International journal of Systematic Bacteriology 44,
223-229.
Vogel, R. F., Müller, M., Stolz, P., Ehrmann, M.m 1996. Ecology in sourdoughs produced by
traditional and modern technologies. Advances in Food Science 18, 152-159.
Walker, G. J., Cheetham, N. W. H., Taylor, C., Pearce, B. J., Slodki, M. E., 1990. Productivity of
four a-D-glucosyltransferases released by Streptococcus sobrinus under defined conditions in
continuous culture. Carbohydrate Polymers 13, 399-421.
Weegels, P. L., Hamer, R. J., Schofield, J. D., 1996. Functional properties of wheat glutenin. J.
Cereal Sci. 23, 1-18.
Wehrle, K., Arendt, E. K., 1998. Rheological changes in wheat sourdough during controlled and
spontaneous fermentation. Cereal Chem. 75, 882-886.
Weiner, R., Langille, S., Quintero, E., 1995. Structure, function and immunochemistry of bacterial
exopolysaccharides. Journal of Industrial Microbiology 15, 339-346.
Weisburg, W. G., Barns, S. M., Pelletier, D. A. and Lane, D. J., 1991. 16S ribosomal DNA
amplification for phylogenetic study. Journal Bacteriology 173, 697–703.
Welman, A. D., Maddox, I. S., 2003. Exopolysaccharides from lactic acid bacteria: perspectives
and challenges. Trends in Biothecnology 21, 269-274.
Werning, M. L., Ibarburu, I., Duenas, M. T., Irastorza, A., Navas, J., Lopez, P., 2006. Pediococcus
parvulus gtf Gene Encoding the GTF Glycosyltransferase and Its Application for Specific PCR
65
Detection of β-D-Glucan–Producing Bacteria in Foods and Beverages. Journal of Food Protection
69, 161-169.
White, T J., Bruns, T., Lee, S., Taylor, J., 1990. Amplification and direct sequencing of fungal
ribosomal RNA genes for phylogenetics. In: Innis M A, et al., editors. PCR protocols: a guide to
methods and applications. New York, N.Y: Academic Press, Inc.; pp. 315–322.
Whitfield, C., 1988. Bacterial extracellular polysaccharides. Canadian Journal of Microbiology 15,
339-346.
Whitfield, C., Valvano, M., 1993. Biosynthesis and expression of cell-surface polysaccharides in
Gram-negative bacteria. Advances in Microbiological Physiology 35, 415-420.
Wick, M., Vanhoutte, J. J., Adhermard, A., Turini, G., Lebeault, J. M., 2001. Automatic method for
evaluating the activity of sourdough strains based on gas pressure measurements. Appl.
Microbiol. Biotechnol. 55, 362-368.
Wiese, B. G., Strohmar, W., Rainey, F. A., Diekmann, H., 1996. Lactobacillus panis sp. nov., from
sourdough from Verona bakery: a preliminary investigation. Advances in Food Science 18, 163-
166.
Yasushi, M., Akifumi, Y., 1993. Bread dough improver and production of bread dough. Japanese
patent 07046956A.
Yun, J. W., 1996. Fructooligosaccharides-occurrence, preparation and application. Enzyme and
Microbial Technology 19, 107-117.
Zoetendal, E. G., Akkermans, a. D., de Vos, W. M., 1998. Temperature gradient gel electrophoresis
analysis of 16S rRNA from human fecal samples reveals stable and host-specific communities of
active bacteria. Appl. Environ. Microbiol. 64, 3854-3859.
Zorzanello, D., Sugihara, T. F., 1982. The technology of Pandoro production. Bakers Digest 56, 12.
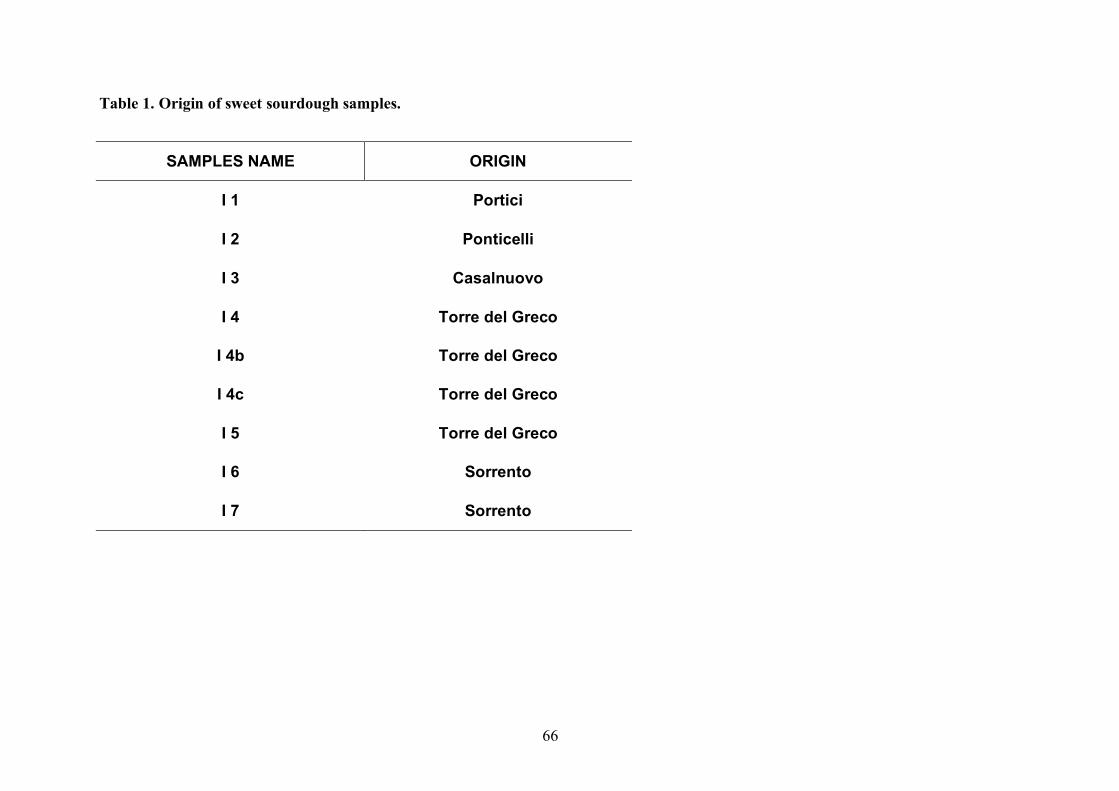
66
Table 1. Origin of sweet sourdough samples.
SAMPLES NAME ORIGIN
I 1 Portici
I 2 Ponticelli
I 3 Casalnuovo
I 4 Torre del Greco
I 4b Torre del Greco
I 4c Torre del Greco
I 5 Torre del Greco
I 6 Sorrento
I 7 Sorrento
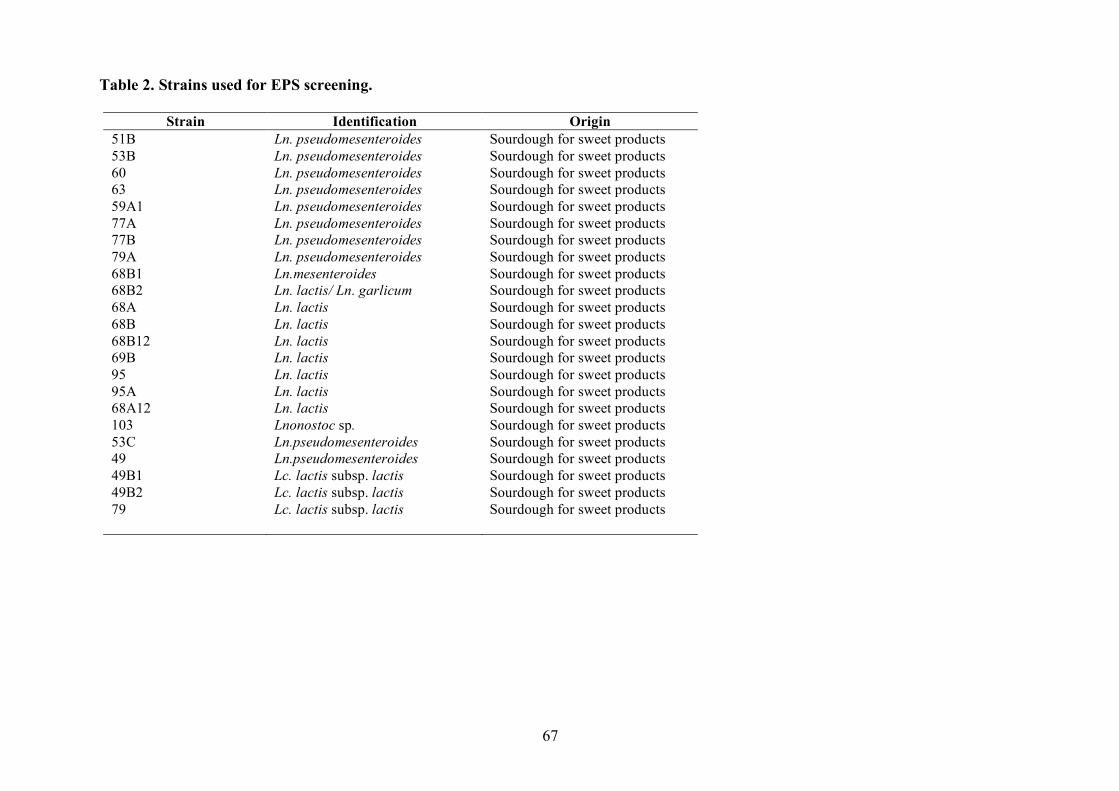
67
Table 2. Strains used for EPS screening.
Strain Identification Origin 51B Ln. pseudomesenteroides Sourdough for sweet products 53B Ln. pseudomesenteroides Sourdough for sweet products 60 Ln. pseudomesenteroides Sourdough for sweet products 63 Ln. pseudomesenteroides Sourdough for sweet products 59A1 Ln. pseudomesenteroides Sourdough for sweet products 77A Ln. pseudomesenteroides Sourdough for sweet products 77B Ln. pseudomesenteroides Sourdough for sweet products 79A Ln. pseudomesenteroides Sourdough for sweet products 68B1 Ln.mesenteroides Sourdough for sweet products 68B2 Ln. lactis/ Ln. garlicum Sourdough for sweet products 68A Ln. lactis Sourdough for sweet products 68B Ln. lactis Sourdough for sweet products 68B12 Ln. lactis Sourdough for sweet products 69B Ln. lactis Sourdough for sweet products 95 Ln. lactis Sourdough for sweet products 95A Ln. lactis Sourdough for sweet products 68A12 Ln. lactis Sourdough for sweet products 103 Lnonostoc sp. Sourdough for sweet products 53C Ln.pseudomesenteroides Sourdough for sweet products 49 Ln.pseudomesenteroides Sourdough for sweet products 49B1 Lc. lactis subsp. lactis Sourdough for sweet products 49B2 Lc. lactis subsp. lactis Sourdough for sweet products 79 Lc. lactis subsp. lactis Sourdough for sweet products
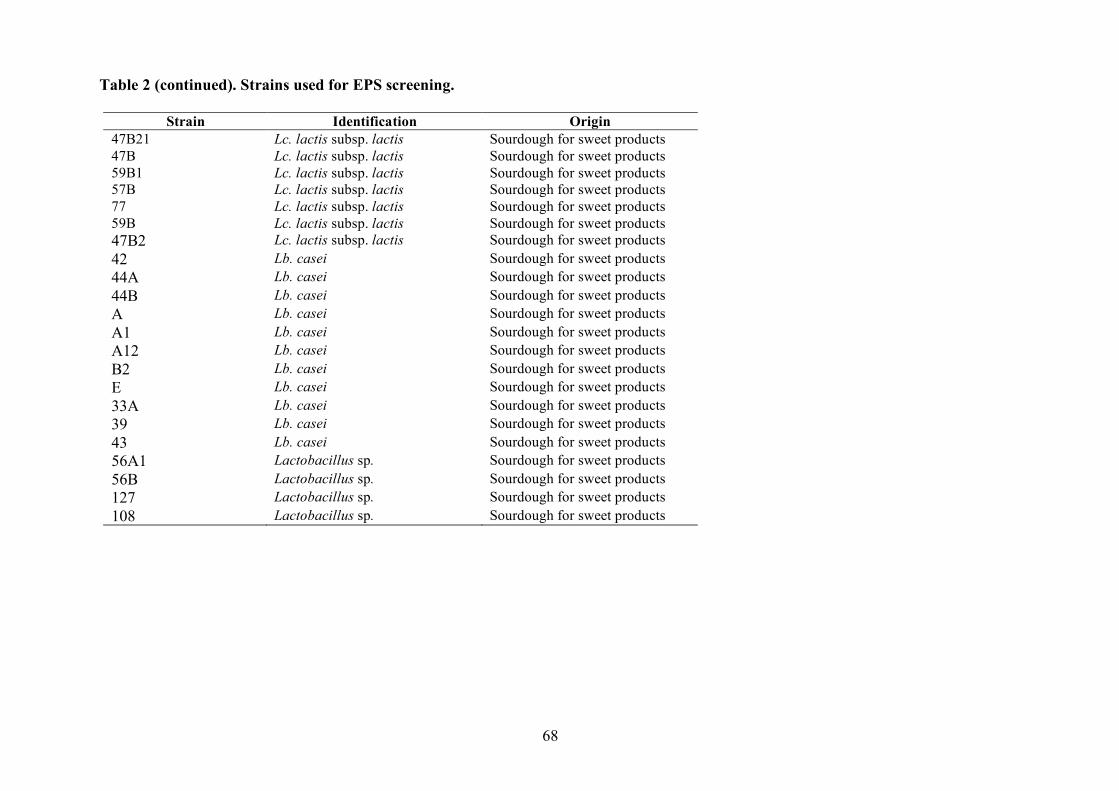
68
Table 2 (continued). Strains used for EPS screening.
Strain Identification Origin 47B21 Lc. lactis subsp. lactis Sourdough for sweet products 47B Lc. lactis subsp. lactis Sourdough for sweet products 59B1 Lc. lactis subsp. lactis Sourdough for sweet products 57B Lc. lactis subsp. lactis Sourdough for sweet products 77 Lc. lactis subsp. lactis Sourdough for sweet products 59B Lc. lactis subsp. lactis Sourdough for sweet products 47B2 Lc. lactis subsp. lactis Sourdough for sweet products 42 Lb. casei Sourdough for sweet products 44A Lb. casei Sourdough for sweet products 44B Lb. casei Sourdough for sweet products A Lb. casei Sourdough for sweet products A1 Lb. casei Sourdough for sweet products A12 Lb. casei Sourdough for sweet products B2 Lb. casei Sourdough for sweet products E Lb. casei Sourdough for sweet products 33A Lb. casei Sourdough for sweet products 39 Lb. casei Sourdough for sweet products 43 Lb. casei Sourdough for sweet products 56A1 Lactobacillus sp. Sourdough for sweet products 56B Lactobacillus sp. Sourdough for sweet products 127 Lactobacillus sp. Sourdough for sweet products 108 Lactobacillus sp. Sourdough for sweet products

69
Table 2 (continued). Strains used for EPS screening.
Strain Identification Origin 69B2 Lb.curvatus Sourdough for sweet products 68A1 Lb.curvatus Sourdough for sweet products 68A2 Lb.curvatus Sourdough for sweet products 64A Lb.curvatus/Lb. sakei Sourdough for sweet products 116A Lb.curvatus subsp. curvatus Sourdough for sweet products 133 Lb. coryniformis subsp. torquens Sourdough for sweet products 109A Lb. coryniformis subsp. torquens Sourdough for sweet products 107 Uncultured Streptococcus sp. Sourdough for sweet products LM47 Lb. sakei Pizza dough LM227 Lb. sakei Pizza dough M77 Lb. sakei Pizza dough T56 Lb. sakei Pizza dough E5 Lb. plantarum Commercial bakery’s yeast E7 Lb. plantarum Commercial bakery’s yeast T9 Lb. plantarum Pizza dough T211 Lb. plantarum Pizza dough T231 Lb. plantarum Pizza dough E1 Lb. paracasei Commercial bakery’s yeast E4 Lb. pentosus. Commercial bakery’s yeast E10 Lb. pentosus Commercial bakery’s yeast
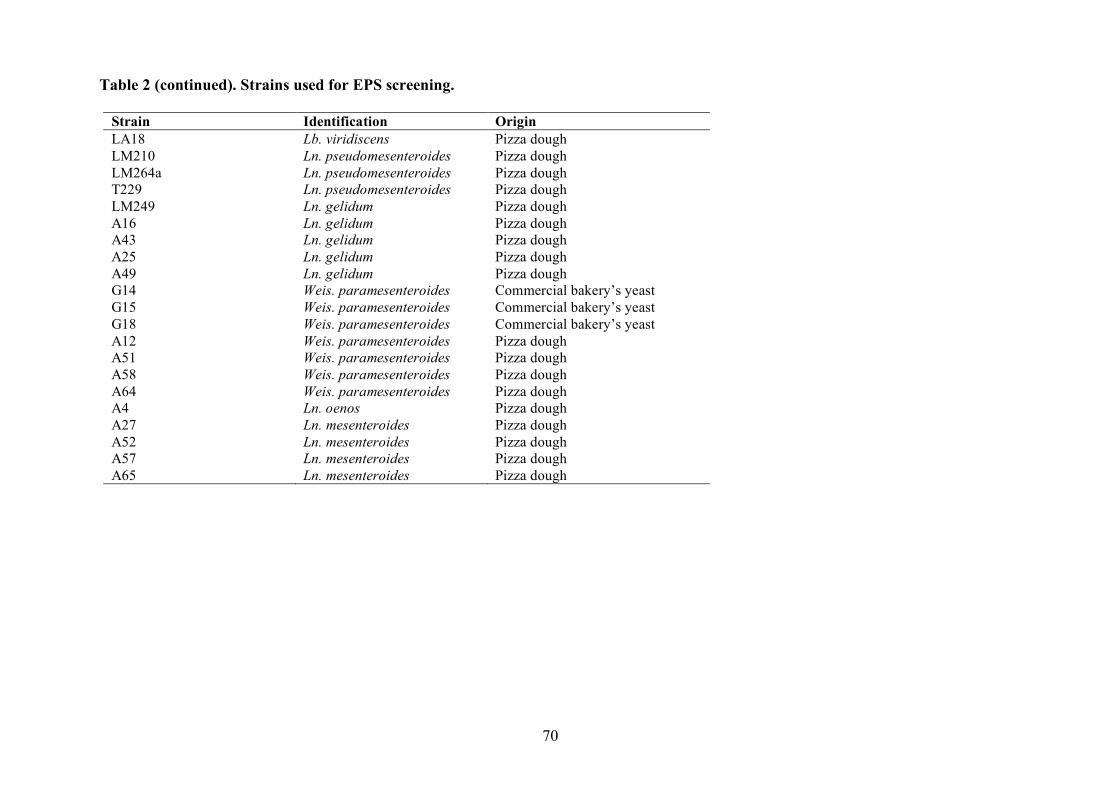
70
Table 2 (continued). Strains used for EPS screening.
Strain Identification Origin LA18 Lb. viridiscens Pizza dough LM210 Ln. pseudomesenteroides Pizza dough LM264a Ln. pseudomesenteroides Pizza dough T229 Ln. pseudomesenteroides Pizza dough LM249 Ln. gelidum Pizza dough A16 Ln. gelidum Pizza dough A43 Ln. gelidum Pizza dough A25 Ln. gelidum Pizza dough A49 Ln. gelidum Pizza dough G14 Weis. paramesenteroides Commercial bakery’s yeast G15 Weis. paramesenteroides Commercial bakery’s yeast G18 Weis. paramesenteroides Commercial bakery’s yeast A12 Weis. paramesenteroides Pizza dough A51 Weis. paramesenteroides Pizza dough A58 Weis. paramesenteroides Pizza dough A64 Weis. paramesenteroides Pizza dough A4 Ln. oenos Pizza dough A27 Ln. mesenteroides Pizza dough A52 Ln. mesenteroides Pizza dough A57 Ln. mesenteroides Pizza dough A65 Ln. mesenteroides Pizza dough
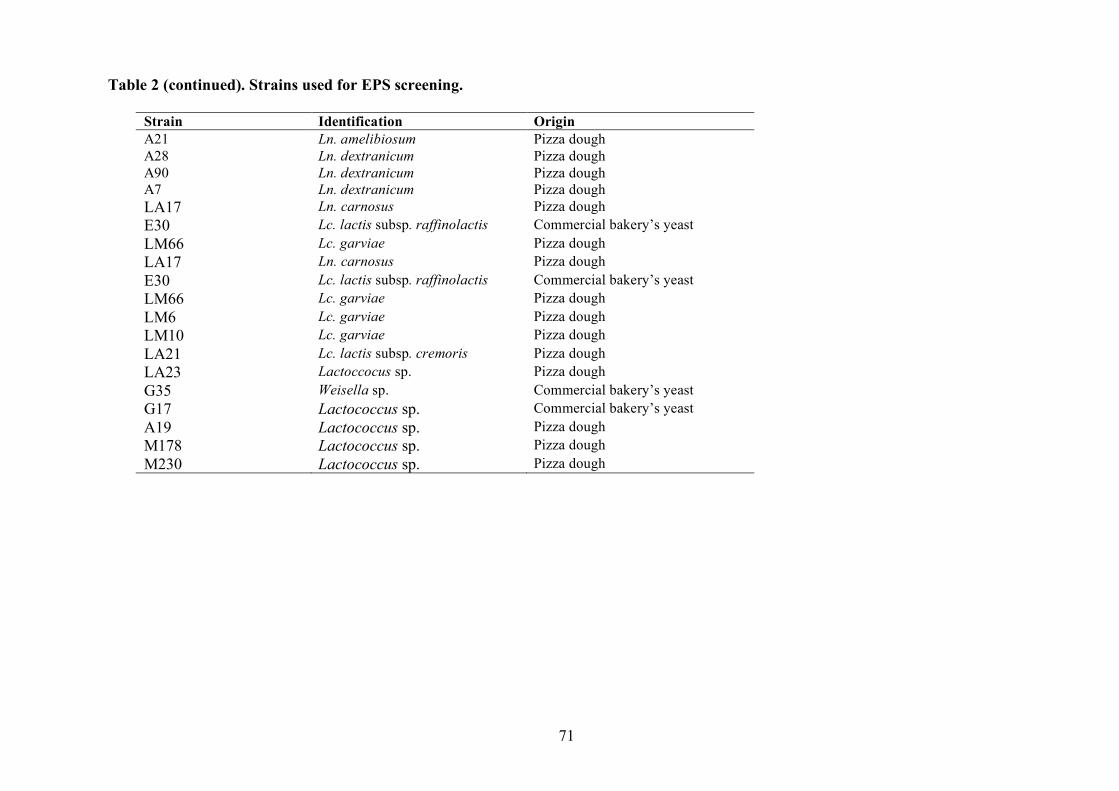
71
Table 2 (continued). Strains used for EPS screening.
Strain Identification Origin A21 Ln. amelibiosum Pizza dough A28 Ln. dextranicum Pizza dough A90 Ln. dextranicum Pizza dough A7 Ln. dextranicum Pizza dough LA17 Ln. carnosus Pizza dough E30 Lc. lactis subsp. raffinolactis Commercial bakery’s yeast LM66 Lc. garviae Pizza dough LA17 Ln. carnosus Pizza dough E30 Lc. lactis subsp. raffinolactis Commercial bakery’s yeast LM66 Lc. garviae Pizza dough LM6 Lc. garviae Pizza dough LM10 Lc. garviae Pizza dough LA21 Lc. lactis subsp. cremoris Pizza dough LA23 Lactoccocus sp. Pizza dough G35 Weisella sp. Commercial bakery’s yeast G17 Lactococcus sp. Commercial bakery’s yeast A19 Lactococcus sp. Pizza dough M178 Lactococcus sp. Pizza dough M230 Lactococcus sp. Pizza dough

72
Table 2 (continued). Strains used for EPS screening.
Strain Identification Origin T40 Lactococcus sp. Pizza dough T46 Lactococcus sp. Pizza dough T201 Lactococcus sp. Pizza dough A86 E. faecium Pizza dough M39 Ln. gelidum Pizza dough M47 Leuconostoc sp. Pizza dough T238 Lb. pentosus Pizza dough LM204b Leuconostoc sp. Pizza dough E3 Lactobacillus sp. Commercial bakery’s yeast LA25 Leuconostoc sp. Pizza dough T229 Ln. pseudomesenteroides Pizza dough K22 Lb. plantarum Pizza dough H19 Lb. plantarum Pizza dough H16 Lb. plantarum Pizza dough H5 Lb. plantarum Pizza dough H14 Lb. plantarum Pizza dough K13 Lb. plantarum Pizza dough H22 Lb. plantarum Pizza dough H4 Lb. plantarum Pizza dough H7 Lb. plantarum Pizza dough
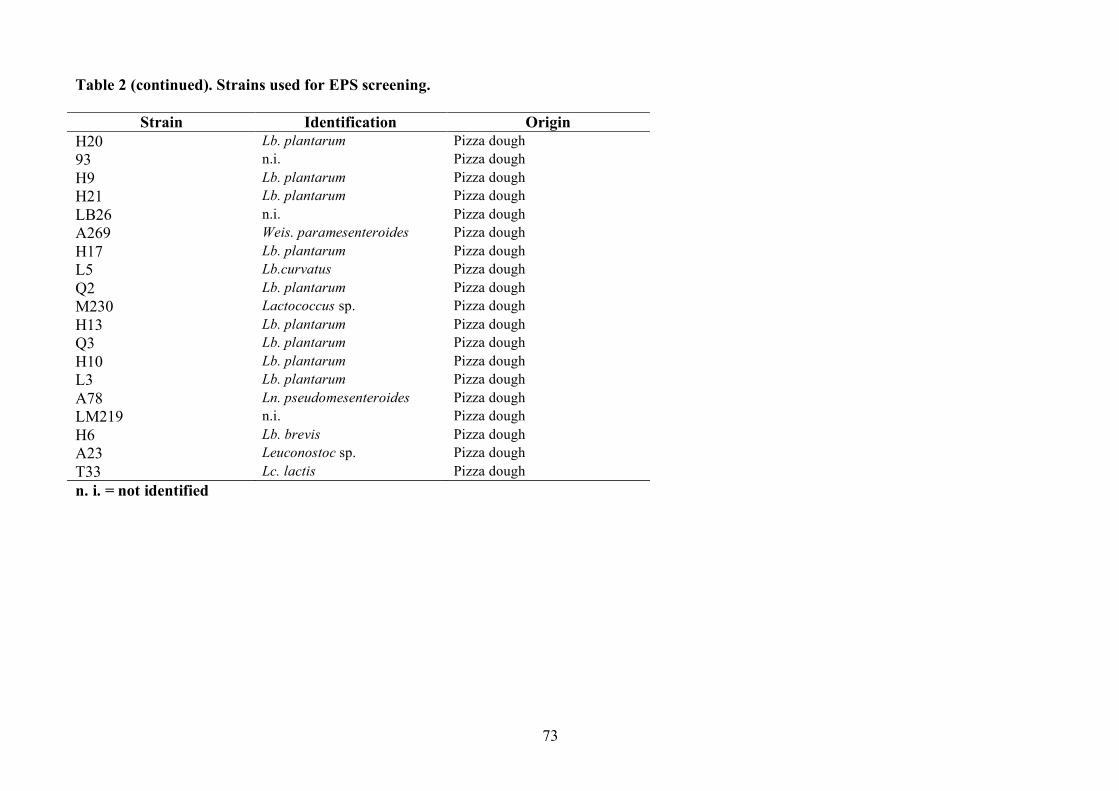
73
Table 2 (continued). Strains used for EPS screening.
Strain Identification Origin H20 Lb. plantarum Pizza dough 93 n.i. Pizza dough H9 Lb. plantarum Pizza dough H21 Lb. plantarum Pizza dough LB26 n.i. Pizza dough A269 Weis. paramesenteroides Pizza dough H17 Lb. plantarum Pizza dough L5 Lb.curvatus Pizza dough Q2 Lb. plantarum Pizza dough M230 Lactococcus sp. Pizza dough H13 Lb. plantarum Pizza dough Q3 Lb. plantarum Pizza dough H10 Lb. plantarum Pizza dough L3 Lb. plantarum Pizza dough A78 Ln. pseudomesenteroides Pizza dough LM219 n.i. Pizza dough H6 Lb. brevis Pizza dough A23 Leuconostoc sp. Pizza dough T33 Lc. lactis Pizza dough n. i. = not identified

74
Table 2 (continued). Strains used for EPS screening.
Strain Identification Origin L8 Lb. plantarum Pizza dough K21 Lb. plantarum Pizza dough ZS71 Ent. faecalis Pizza dough NS9 Ent. faecalis Pizza dough DL6 Lb. plantarum Pizza dough US69 Ent. faecalis Pizza dough BL6 Lb. brevis Pizza dough OS14 Ent. faecalis Pizza dough ES5 Ent. faecalis Commercial bakery’s yeast PS23 Ent. faecalis Pizza dough AL5 Lb. plantarum Pizza dough CL9 Lb. plantarum Pizza dough EL7 Lb. paracasei subsp. paracasei Pizza dough CL5 Lb. plantarum Pizza dough GL2 Lb. brevis Commercial bakery’s yeast GL3 Lb. brevis Commercial bakery’s yeast FL2 Lb. pentosus Pizza dough
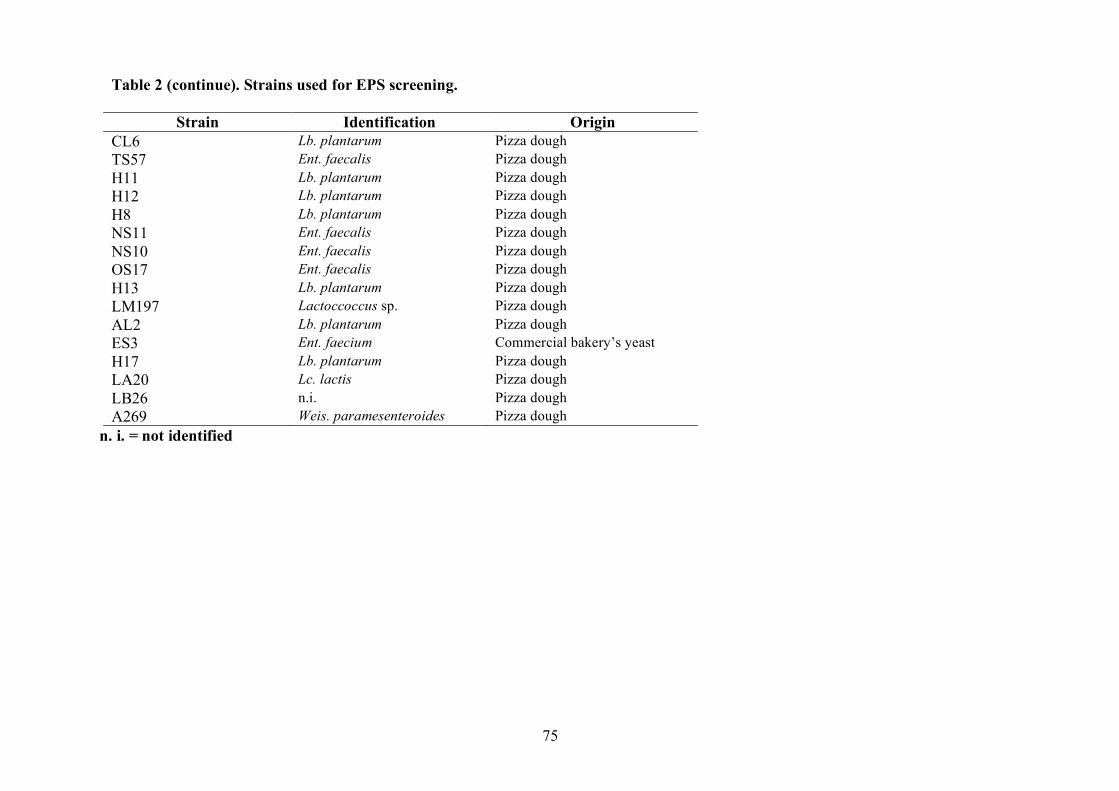
75
Table 2 (continue). Strains used for EPS screening.
Strain Identification Origin CL6 Lb. plantarum Pizza dough TS57 Ent. faecalis Pizza dough H11 Lb. plantarum Pizza dough H12 Lb. plantarum Pizza dough H8 Lb. plantarum Pizza dough NS11 Ent. faecalis Pizza dough NS10 Ent. faecalis Pizza dough OS17 Ent. faecalis Pizza dough H13 Lb. plantarum Pizza dough LM197 Lactoccoccus sp. Pizza dough AL2 Lb. plantarum Pizza dough ES3 Ent. faecium Commercial bakery’s yeast H17 Lb. plantarum Pizza dough LA20 Lc. lactis Pizza dough LB26 n.i. Pizza dough A269 Weis. paramesenteroides Pizza dough
n. i. = not identified
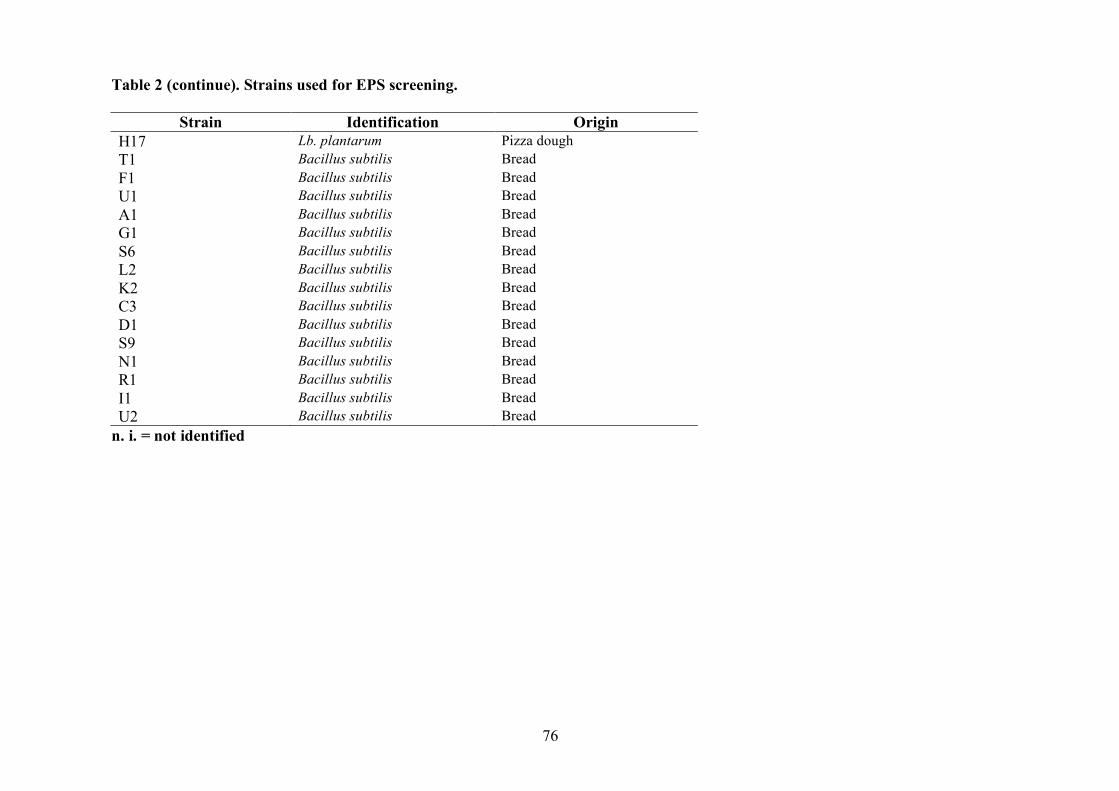
76
Table 2 (continue). Strains used for EPS screening.
Strain Identification Origin H17 Lb. plantarum Pizza dough T1 Bacillus subtilis Bread F1 Bacillus subtilis Bread U1 Bacillus subtilis Bread A1 Bacillus subtilis Bread G1 Bacillus subtilis Bread S6 Bacillus subtilis Bread L2 Bacillus subtilis Bread K2 Bacillus subtilis Bread C3 Bacillus subtilis Bread D1 Bacillus subtilis Bread S9 Bacillus subtilis Bread N1 Bacillus subtilis Bread R1 Bacillus subtilis Bread I1 Bacillus subtilis Bread U2 Bacillus subtilis Bread
n. i. = not identified
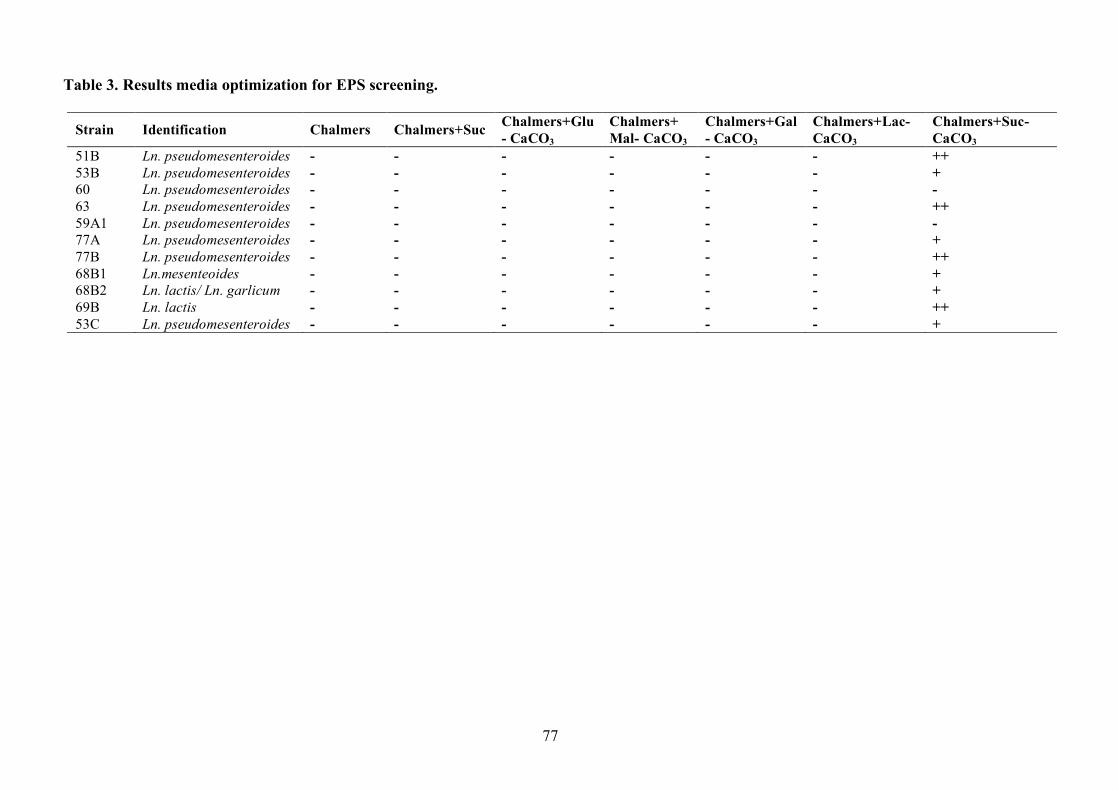
77
Table 3. Results media optimization for EPS screening. Strain Identification Chalmers Chalmers+Suc Chalmers+Glu
- CaCO3 Chalmers+Mal- CaCO3
Chalmers+Gal- CaCO3
Chalmers+Lac- CaCO3
Chalmers+Suc-CaCO3
51B Ln. pseudomesenteroides - - - - - - ++ 53B Ln. pseudomesenteroides - - - - - - + 60 Ln. pseudomesenteroides - - - - - - - 63 Ln. pseudomesenteroides - - - - - - ++ 59A1 Ln. pseudomesenteroides - - - - - - - 77A Ln. pseudomesenteroides - - - - - - + 77B Ln. pseudomesenteroides - - - - - - ++ 68B1 Ln.mesenteoides - - - - - - + 68B2 Ln. lactis/ Ln. garlicum - - - - - - + 69B Ln. lactis - - - - - - ++ 53C Ln. pseudomesenteroides - - - - - - +
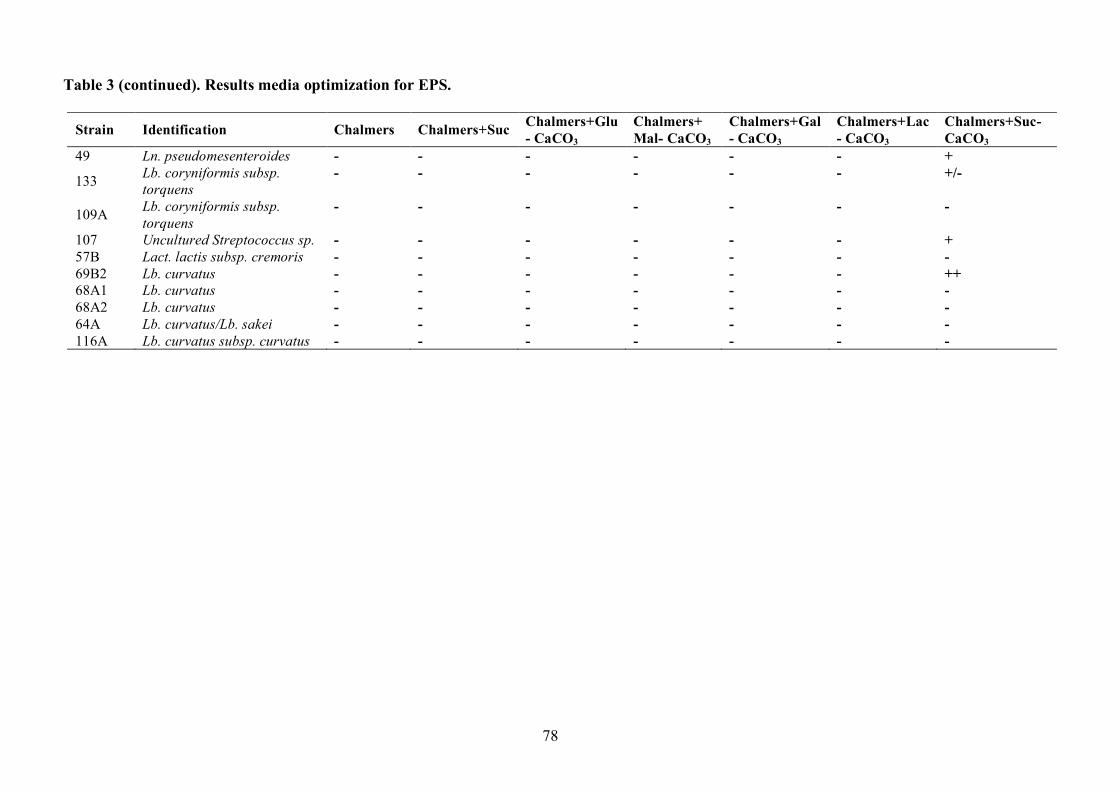
78
Table 3 (continued). Results media optimization for EPS. Strain Identification Chalmers Chalmers+Suc Chalmers+Glu
- CaCO3 Chalmers+Mal- CaCO3
Chalmers+Gal- CaCO3
Chalmers+Lac- CaCO3
Chalmers+Suc-CaCO3
49 Ln. pseudomesenteroides - - - - - - +
133 Lb. coryniformis subsp. torquens
- - - - - - +/-
109A Lb. coryniformis subsp. torquens
- - - - - - -
107 Uncultured Streptococcus sp. - - - - - - + 57B Lact. lactis subsp. cremoris - - - - - - - 69B2 Lb. curvatus - - - - - - ++ 68A1 Lb. curvatus - - - - - - - 68A2 Lb. curvatus - - - - - - - 64A Lb. curvatus/Lb. sakei - - - - - - - 116A Lb. curvatus subsp. curvatus - - - - - - -

79
Table 4. Pairs of primer used to screen the presence of eps genes. Primer Sequence (5’-3’) Gene target PCR condition References eps EFG fw GAYGARYTNCCNCARYTNWKNAAYGT Priming glycosyltransferase
(Lb.delbrueckii subs. bulgaricus)
30 cycles of 90°C (30s), 49°C (45s), 72°C(1min)
Mozzi et al., 2006
eps EFG rev TGCAGCYTCWGCCACATG Priming glycosyltransferase (L. helveticus)
Mozzi et al., 2006
epsD/E fw TCATTTTATTCGTAAAACCTCAAATTGAYGARYTNCC
Priming glycosyltransferase (L.casei group and S. thermophilus)
5 cycles of n94°C (30s), 62°C (30s), 72°C (30s); 40 cycles of 94°C (30s), 52°C (30s), 72°C (30s)
Mozzi et al., 2006
epsD/E rev AATATTATTACGACCTSWNAYYTGCCA Priming glycosyltransferase (L.casei group and S. thermophilus
Mozzi et al., 2006
epsA fw TAGTGACAACGGTTGTACTG EPS regulation (S. thermophilus)
35 cycles of 94°C (15s), 40°C (30s), 72°C (1min)
Mozzi et al., 2006
epsA rev GATCATTATGGACTGTCAC EPS regulation (S. thermophilus)
Mozzi et al., 2006
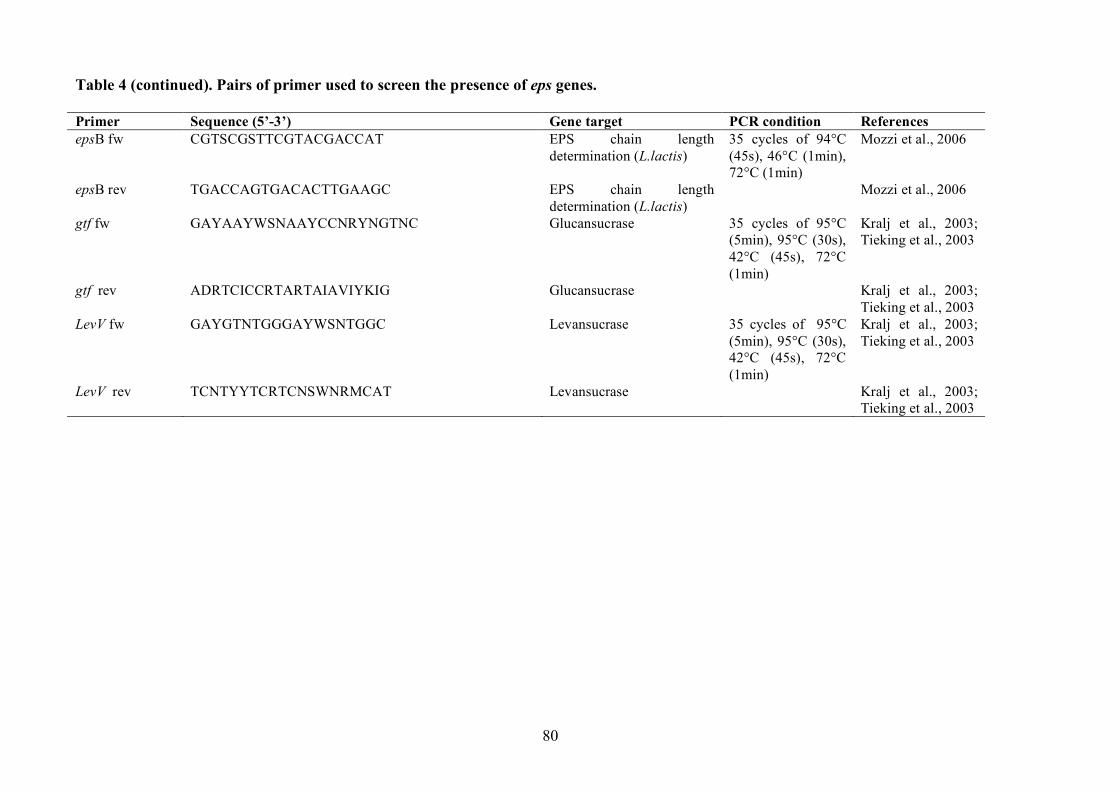
80
Table 4 (continued). Pairs of primer used to screen the presence of eps genes. Primer Sequence (5’-3’) Gene target PCR condition References epsB fw CGTSCGSTTCGTACGACCAT EPS chain length
determination (L.lactis) 35 cycles of 94°C (45s), 46°C (1min), 72°C (1min)
Mozzi et al., 2006
epsB rev TGACCAGTGACACTTGAAGC EPS chain length determination (L.lactis)
Mozzi et al., 2006
gtf fw GAYAAYWSNAAYCCNRYNGTNC Glucansucrase 35 cycles of 95°C (5min), 95°C (30s), 42°C (45s), 72°C (1min)
Kralj et al., 2003; Tieking et al., 2003
gtf rev ADRTCICCRTARTAIAVIYKIG Glucansucrase Kralj et al., 2003; Tieking et al., 2003
LevV fw GAYGTNTGGGAYWSNTGGC Levansucrase 35 cycles of 95°C (5min), 95°C (30s), 42°C (45s), 72°C (1min)
Kralj et al., 2003; Tieking et al., 2003
LevV rev TCNTYYTCRTCNSWNRMCAT Levansucrase Kralj et al., 2003; Tieking et al., 2003
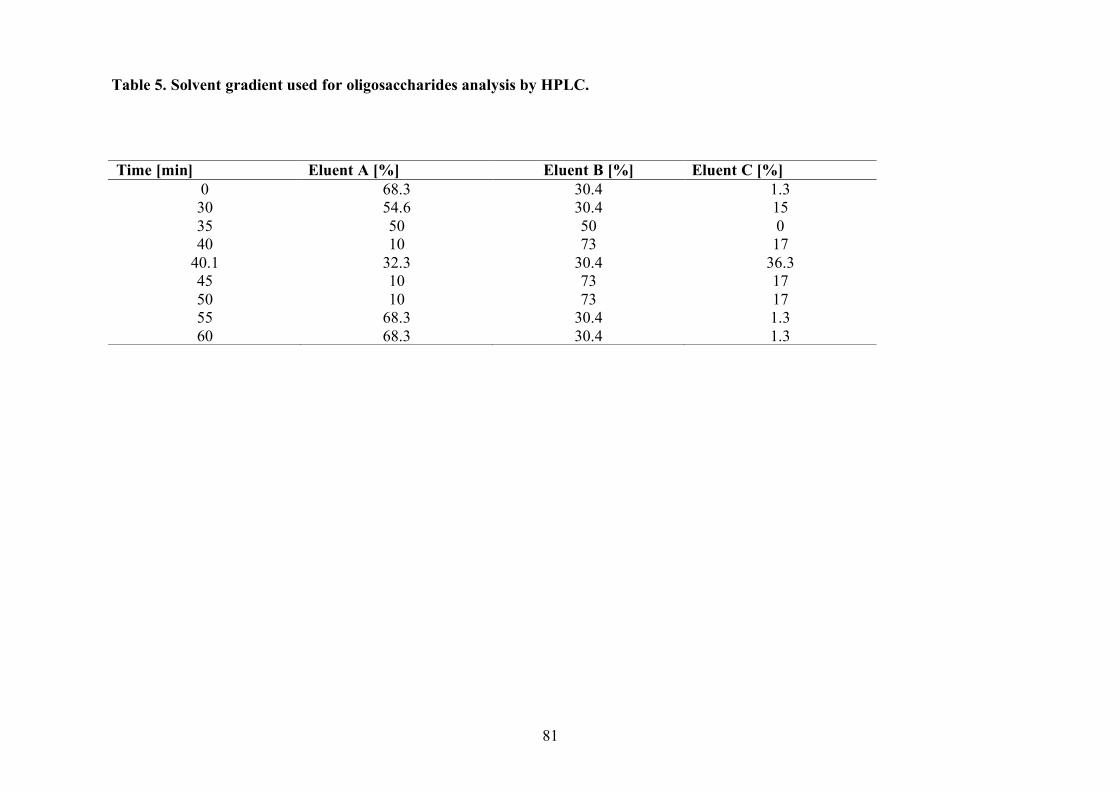
81
Table 5. Solvent gradient used for oligosaccharides analysis by HPLC.
Time [min] Eluent A [%] Eluent B [%] Eluent C [%] 0 68.3 30.4 1.3 30 54.6 30.4 15 35 50 50 0 40 10 73 17
40.1 32.3 30.4 36.3 45 10 73 17 50 10 73 17 55 68.3 30.4 1.3 60 68.3 30.4 1.3
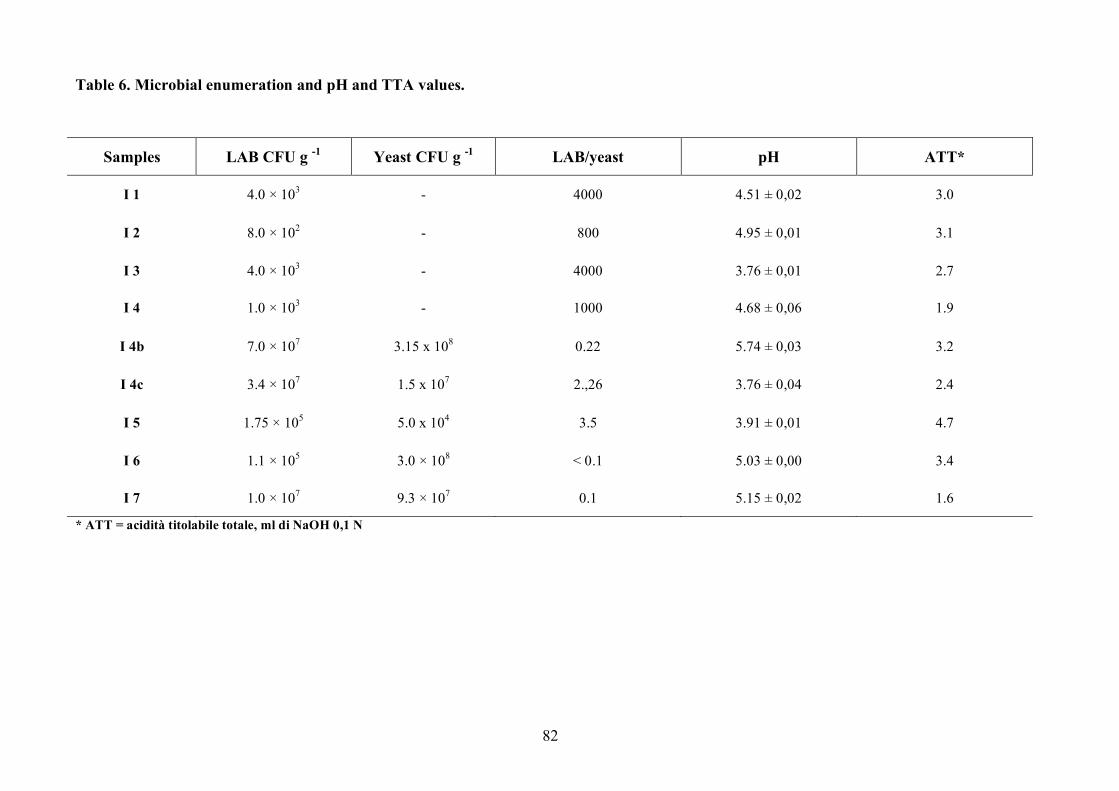
82
Table 6. Microbial enumeration and pH and TTA values.
* ATT = acidità titolabile totale, ml di NaOH 0,1 N
Samples LAB CFU g -1 Yeast CFU g -1 LAB/yeast pH ATT*
I 1 4.0 × 10³ - 4000 4.51 ± 0,02 3.0
I 2 8.0 × 10² - 800 4.95 ± 0,01 3.1
I 3 4.0 × 10³ - 4000 3.76 ± 0,01 2.7
I 4 1.0 × 10³ - 1000 4.68 ± 0,06 1.9
I 4b 7.0 × 10⁷ 3.15 x 10⁸ 0.22 5.74 ± 0,03 3.2
I 4c 3.4 × 10⁷ 1.5 x 10⁷ 2.,26 3.76 ± 0,04 2.4
I 5 1.75 × 10⁵ 5.0 x 10⁴ 3.5 3.91 ± 0,01 4.7
I 6 1.1 × 10⁵ 3.0 × 10⁸ < 0.1 5.03 ± 0,00 3.4
I 7 1.0 × 10⁷ 9.3 × 10⁷ 0.1 5.15 ± 0,02 1.6
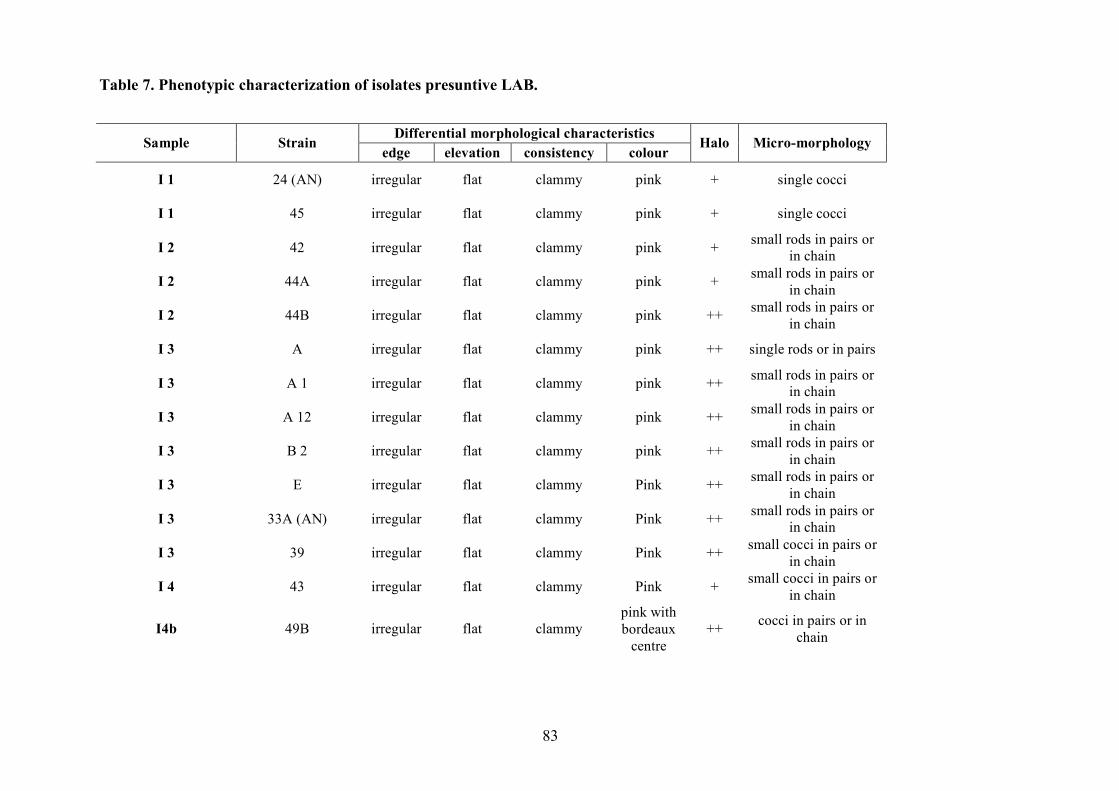
83
Table 7. Phenotypic characterization of isolates presuntive LAB.
Differential morphological characteristics Sample Strain
edge elevation consistency colour Halo Micro-morphology
I 1 24 (AN) irregular flat clammy pink + single cocci
I 1 45 irregular flat clammy pink + single cocci
I 2 42 irregular flat clammy pink + small rods in pairs or in chain
I 2 44A irregular flat clammy pink + small rods in pairs or in chain
I 2 44B irregular flat clammy pink ++ small rods in pairs or in chain
I 3 A irregular flat clammy pink ++ single rods or in pairs
I 3 A 1 irregular flat clammy pink ++ small rods in pairs or in chain
I 3 A 12 irregular flat clammy pink ++ small rods in pairs or in chain
I 3 B 2 irregular flat clammy pink ++ small rods in pairs or in chain
I 3 E irregular flat clammy Pink ++ small rods in pairs or in chain
I 3 33A (AN) irregular flat clammy Pink ++ small rods in pairs or in chain
I 3 39 irregular flat clammy Pink ++ small cocci in pairs or in chain
I 4 43 irregular flat clammy Pink + small cocci in pairs or in chain
I4b 49B irregular flat clammy pink with bordeaux
centre ++ cocci in pairs or in
chain
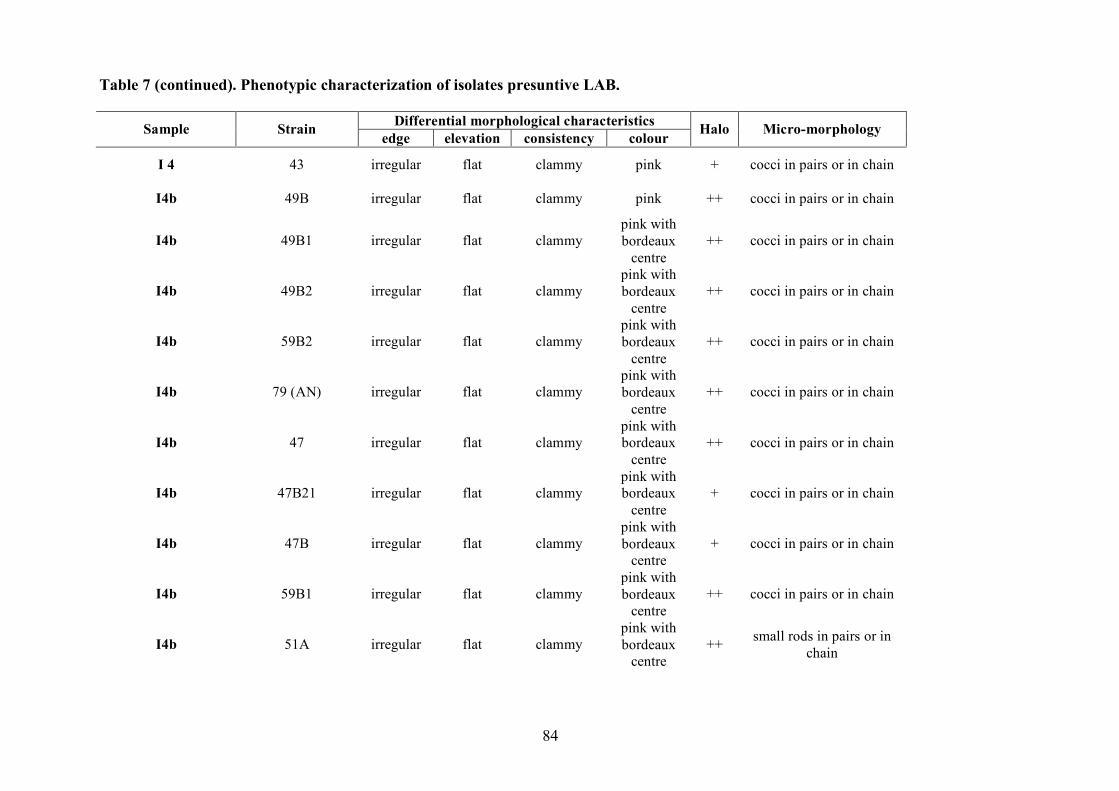
84
Table 7 (continued). Phenotypic characterization of isolates presuntive LAB.
Differential morphological characteristics Sample Strain edge elevation consistency colour Halo Micro-morphology
I 4 43 irregular flat clammy pink + cocci in pairs or in chain
I4b 49B irregular flat clammy pink ++ cocci in pairs or in chain
I4b 49B1 irregular flat clammy pink with bordeaux
centre ++ cocci in pairs or in chain
I4b 49B2 irregular flat clammy pink with bordeaux
centre ++ cocci in pairs or in chain
I4b 59B2 irregular flat clammy pink with bordeaux
centre ++ cocci in pairs or in chain
I4b 79 (AN) irregular flat clammy pink with bordeaux
centre ++ cocci in pairs or in chain
I4b 47 irregular flat clammy pink with bordeaux
centre ++ cocci in pairs or in chain
I4b 47B21 irregular flat clammy pink with bordeaux
centre + cocci in pairs or in chain
I4b 47B irregular flat clammy pink with bordeaux
centre + cocci in pairs or in chain
I4b 59B1 irregular flat clammy pink with bordeaux
centre ++ cocci in pairs or in chain
I4b 51A irregular flat clammy pink with bordeaux
centre ++ small rods in pairs or in
chain
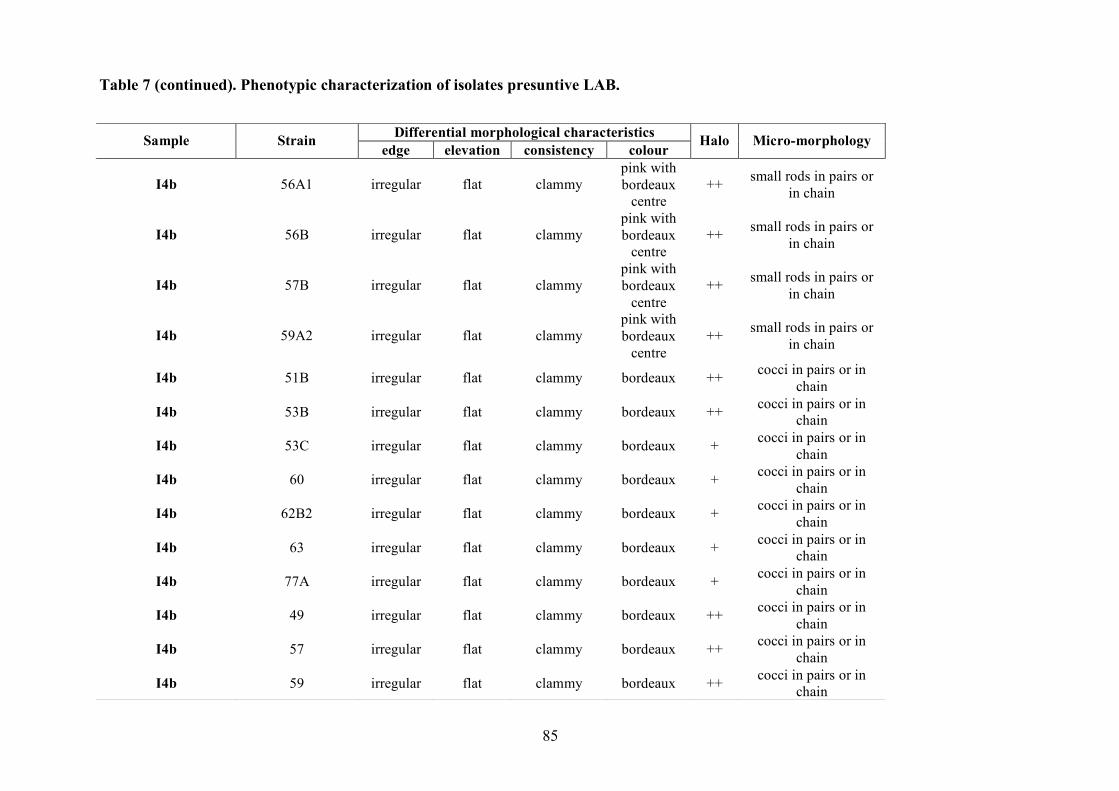
85
Table 7 (continued). Phenotypic characterization of isolates presuntive LAB.
Differential morphological characteristics Sample Strain edge elevation consistency colour
Halo Micro-morphology
I4b 56A1 irregular flat clammy pink with bordeaux
centre ++ small rods in pairs or
in chain
I4b 56B irregular flat clammy pink with bordeaux
centre ++ small rods in pairs or
in chain
I4b 57B irregular flat clammy pink with bordeaux
centre ++ small rods in pairs or
in chain
I4b 59A2 irregular flat clammy pink with bordeaux
centre ++ small rods in pairs or
in chain
I4b 51B irregular flat clammy bordeaux ++ cocci in pairs or in chain
I4b 53B irregular flat clammy bordeaux ++ cocci in pairs or in chain
I4b 53C irregular flat clammy bordeaux + cocci in pairs or in chain
I4b 60 irregular flat clammy bordeaux + cocci in pairs or in chain
I4b 62B2 irregular flat clammy bordeaux + cocci in pairs or in chain
I4b 63 irregular flat clammy bordeaux + cocci in pairs or in chain
I4b 77A irregular flat clammy bordeaux + cocci in pairs or in chain
I4b 49 irregular flat clammy bordeaux ++ cocci in pairs or in chain
I4b 57 irregular flat clammy bordeaux ++ cocci in pairs or in chain
I4b 59 irregular flat clammy bordeaux ++ cocci in pairs or in chain

86
Table 7 (continued). Phenotypic characterization of isolates presuntive LAB.
Differential morphological characteristics Sample Strain edge elevation consistency colour Halo Micro-morphology
I4b 59A1 irregular flat clammy bordeaux ++ cocci in pairs or in chain
I4b 58A irregular flat clammy bordeaux + cocci in pairs or in chain
I4b 77A irregular flat clammy bordeaux ++ sigle cocci or in pairs
I4b 77B irregular flat clammy bordeaux ++ sigle cocci or in pairs
I4b 79A irregular flat clammy bordeaux ++ sigle cocci or in pairs
I4b 57A irregular flat clammy bordeaux + small rods in pairs or in chain
I4b 59B2 irregular flat clammy bordeaux ++ small rods in pairs or in chain
I4b 77 irregular flat clammy bordeaux + small rods in pairs or in chain
I4b 59B regular flat clammy pink ++ cocci in pairs or in chain
I4b 78 irregular flat clammy pink ++ small rods in pairs or in chain
I4b 51A irregular flat clammy pink with red centre ++ small rods in pairs or
in chain
I4b 47B2 irregular flat clammy pink with red centre ++ small rods in pairs or
in chain
I4c 69B2 irregular flat clammy pink with red centre ++ small rods in pairs or
in chain
I4c 68A1 irregular flat clammy pink with red centre ++ small rods in pairs or
in chain
I4c 68A2 irregular flat clammy pink with red centre ++ small rods in pairs or
in chain
I4c 96B (AN) irregular flat clammy pink with red centre ++ small rods in pairs or
in chain
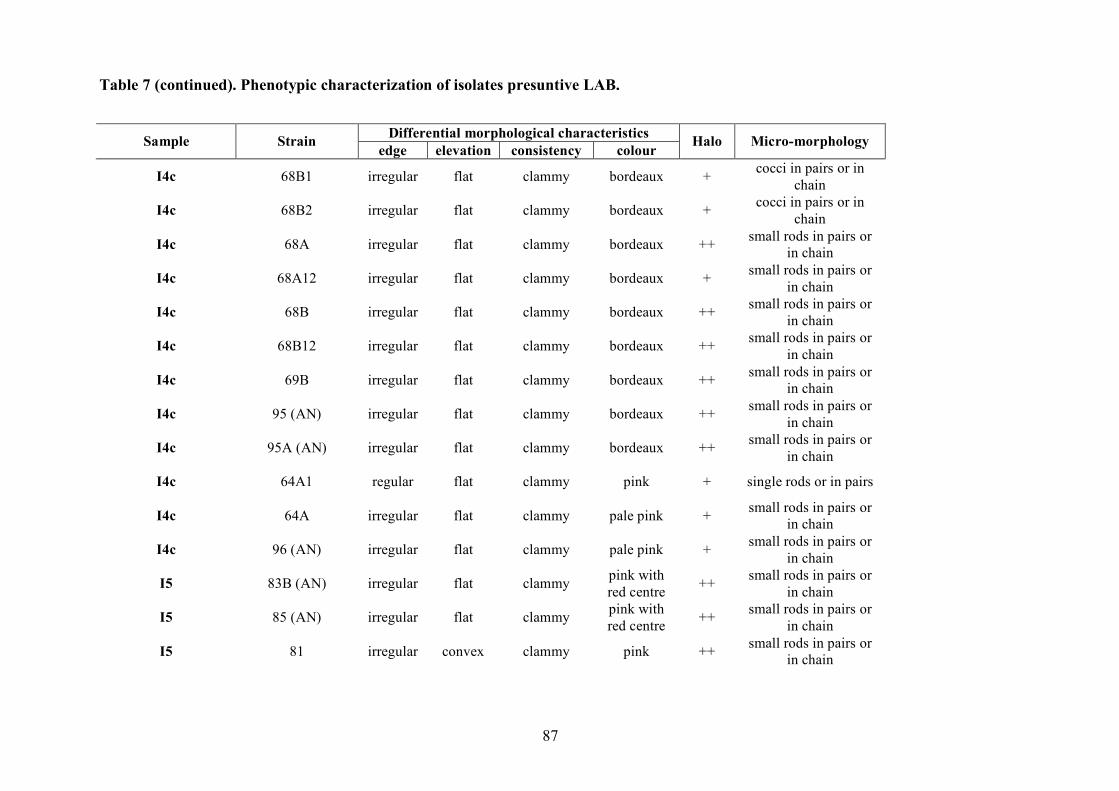
87
Table 7 (continued). Phenotypic characterization of isolates presuntive LAB.
Differential morphological characteristics Sample Strain edge elevation consistency colour Halo Micro-morphology
I4c 68B1 irregular flat clammy bordeaux + cocci in pairs or in chain
I4c 68B2 irregular flat clammy bordeaux + cocci in pairs or in chain
I4c 68A irregular flat clammy bordeaux ++ small rods in pairs or in chain
I4c 68A12 irregular flat clammy bordeaux + small rods in pairs or in chain
I4c 68B irregular flat clammy bordeaux ++ small rods in pairs or in chain
I4c 68B12 irregular flat clammy bordeaux ++ small rods in pairs or in chain
I4c 69B irregular flat clammy bordeaux ++ small rods in pairs or in chain
I4c 95 (AN) irregular flat clammy bordeaux ++ small rods in pairs or in chain
I4c 95A (AN) irregular flat clammy bordeaux ++ small rods in pairs or in chain
I4c 64A1 regular flat clammy pink + single rods or in pairs
I4c 64A irregular flat clammy pale pink + small rods in pairs or in chain
I4c 96 (AN) irregular flat clammy pale pink + small rods in pairs or in chain
I5 83B (AN) irregular flat clammy pink with red centre ++ small rods in pairs or
in chain
I5 85 (AN) irregular flat clammy pink with red centre ++ small rods in pairs or
in chain
I5 81 irregular convex clammy pink ++ small rods in pairs or in chain
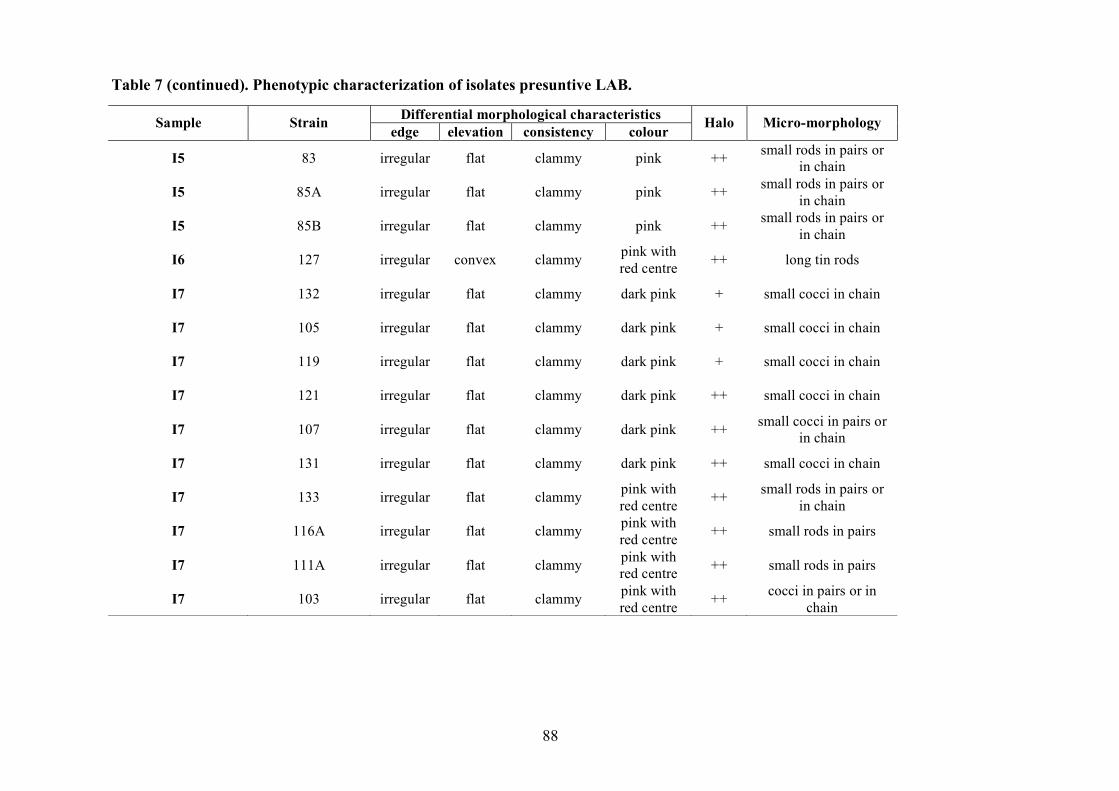
88
Table 7 (continued). Phenotypic characterization of isolates presuntive LAB.
Differential morphological characteristics Sample Strain edge elevation consistency colour Halo Micro-morphology
I5 83 irregular flat clammy pink ++ small rods in pairs or in chain
I5 85A irregular flat clammy pink ++ small rods in pairs or in chain
I5 85B irregular flat clammy pink ++ small rods in pairs or in chain
I6 127 irregular convex clammy pink with red centre ++ long tin rods
I7 132 irregular flat clammy dark pink + small cocci in chain
I7 105 irregular flat clammy dark pink + small cocci in chain
I7 119 irregular flat clammy dark pink + small cocci in chain
I7 121 irregular flat clammy dark pink ++ small cocci in chain
I7 107 irregular flat clammy dark pink ++ small cocci in pairs or in chain
I7 131 irregular flat clammy dark pink ++ small cocci in chain
I7 133 irregular flat clammy pink with red centre ++ small rods in pairs or
in chain
I7 116A irregular flat clammy pink with red centre ++ small rods in pairs
I7 111A irregular flat clammy pink with red centre ++ small rods in pairs
I7 103 irregular flat clammy pink with red centre ++ cocci in pairs or in
chain

89
Table 7 (continued). Phenotypic characterization of isolates presuntive LAB.
Differential morphological characteristics Sample Strain edge elevation consistency colour Halo Micro-morphology
I7 113 irregular flat clammy pink + small cocci in chain
I7 108 irregular flat clammy pink + long tin rods
I7 109A regular convex clammy pink ++ small rods in pairs
I7 114 regular convex clammy pink ++ Small rods in pairs

90
Table 8. Phenotypic characterization of isolates presuntive yeasts.
Differential morphological characteristics Sample Strain edge elevation consistency colour Halo
I 4b 47B22 regular convex creamy pale pink -
I 4b 46 irregular convex creamy pink with yellow centre -
I 4b 55 irregular convex creamy pink with yellow centre -
I 4b 56A2 irregular convex creamy pink with yellow centre -
I 4b 61 irregular convex creamy pink with yellow centre -
I 4b 71 (AN) irregular convex creamy pink with yellow centre -
I 4b 72 (AN) irregular convex creamy pink with yellow centre -
I 4b 73 (AN) irregular convex creamy pink with yellow centre -
I 4b 74 (AN) irregular convex creamy pink with yellow centre -
I 4b 75 (AN) irregular convex creamy Pink with yellow centre -
I 4b 76 (AN) irregular convex creamy pink with yellow centre -
I4c 69A21 regular convex creamy pale pink -
I4c 69A2 irregular convex creamy pink with yellow centre -
I4c 87 (AN) irregular convex creamy pink with yellow centre -
I4c 90 (AN) irregular convex creamy pink with yellow centre -
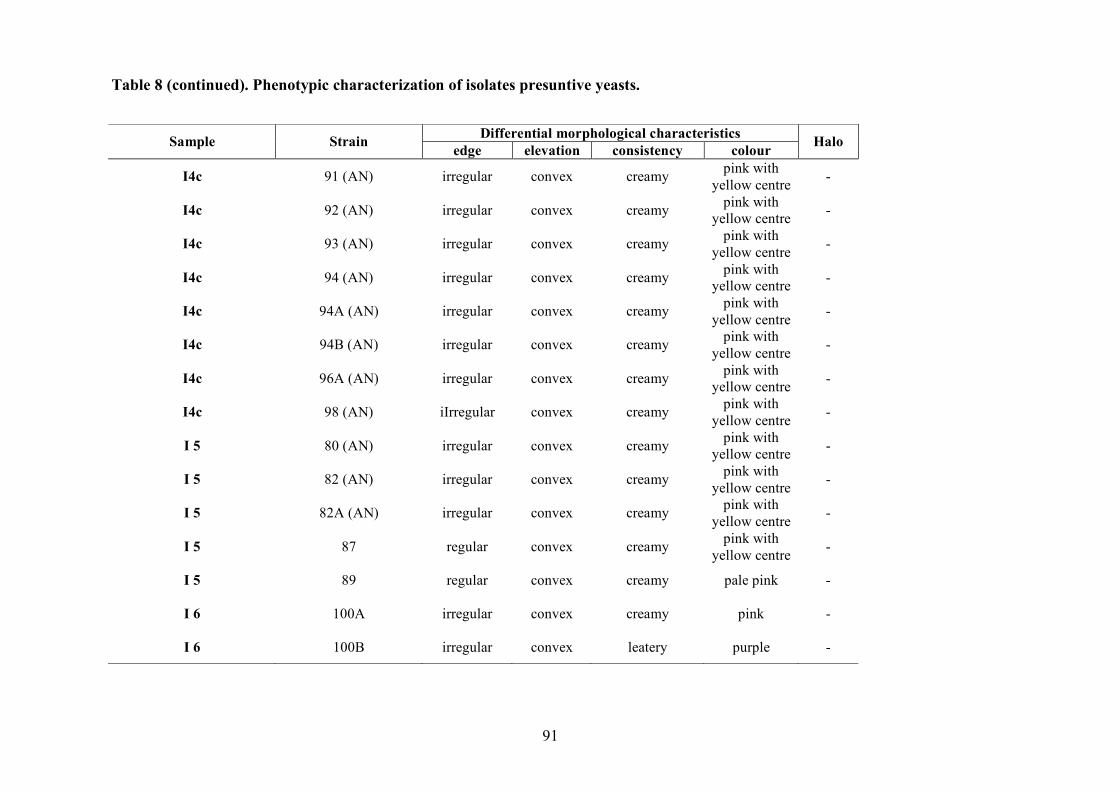
91
Table 8 (continued). Phenotypic characterization of isolates presuntive yeasts.
Differential morphological characteristics Sample Strain edge elevation consistency colour Halo
I4c 91 (AN) irregular convex creamy pink with yellow centre -
I4c 92 (AN) irregular convex creamy pink with yellow centre -
I4c 93 (AN) irregular convex creamy pink with yellow centre -
I4c 94 (AN) irregular convex creamy pink with yellow centre -
I4c 94A (AN) irregular convex creamy pink with yellow centre -
I4c 94B (AN) irregular convex creamy pink with yellow centre -
I4c 96A (AN) irregular convex creamy pink with yellow centre -
I4c 98 (AN) iIrregular convex creamy pink with yellow centre -
I 5 80 (AN) irregular convex creamy pink with yellow centre -
I 5 82 (AN) irregular convex creamy pink with yellow centre -
I 5 82A (AN) irregular convex creamy pink with yellow centre -
I 5 87 regular convex creamy pink with yellow centre -
I 5 89 regular convex creamy pale pink -
I 6 100A irregular convex creamy pink -
I 6 100B irregular convex leatery purple -
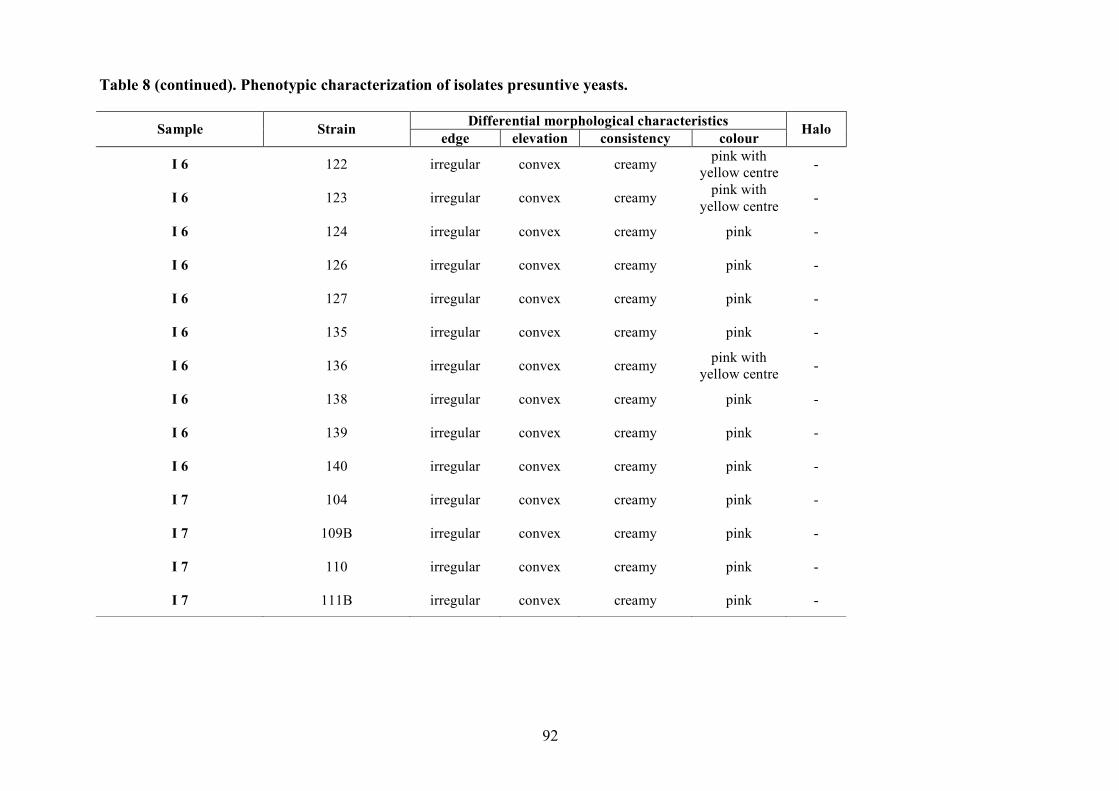
92
Table 8 (continued). Phenotypic characterization of isolates presuntive yeasts.
Differential morphological characteristics Sample Strain edge elevation consistency colour Halo
I 6 122 irregular convex creamy pink with yellow centre -
I 6 123 irregular convex creamy pink with yellow centre -
I 6 124 irregular convex creamy pink -
I 6 126 irregular convex creamy pink -
I 6 127 irregular convex creamy pink -
I 6 135 irregular convex creamy pink -
I 6 136 irregular convex creamy pink with yellow centre -
I 6 138 irregular convex creamy pink -
I 6 139 irregular convex creamy pink -
I 6 140 irregular convex creamy pink -
I 7 104 irregular convex creamy pink -
I 7 109B irregular convex creamy pink -
I 7 110 irregular convex creamy pink -
I 7 111B irregular convex creamy pink -
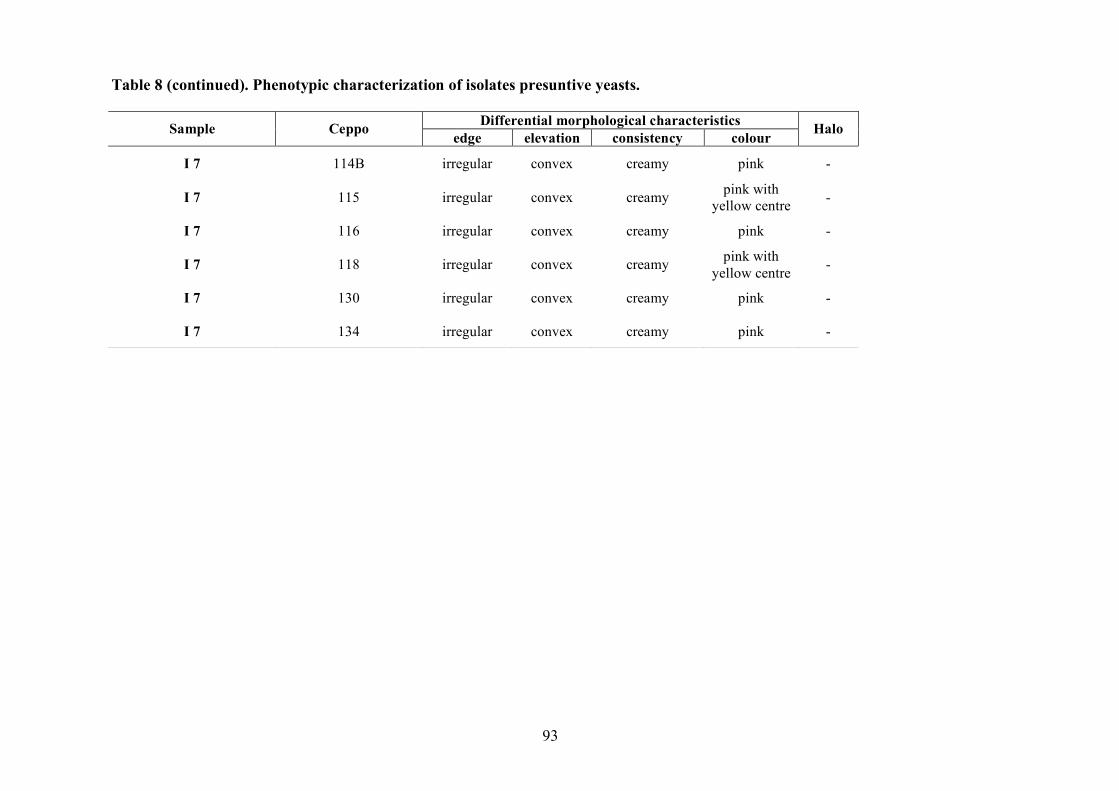
93
Table 8 (continued). Phenotypic characterization of isolates presuntive yeasts.
Differential morphological characteristics Sample Ceppo edge elevation consistency colour Halo
I 7 114B irregular convex creamy pink -
I 7 115 irregular convex creamy pink with yellow centre -
I 7 116 irregular convex creamy pink -
I 7 118 irregular convex creamy pink with yellow centre -
I 7 130 irregular convex creamy pink -
I 7 134 irregular convex creamy pink -
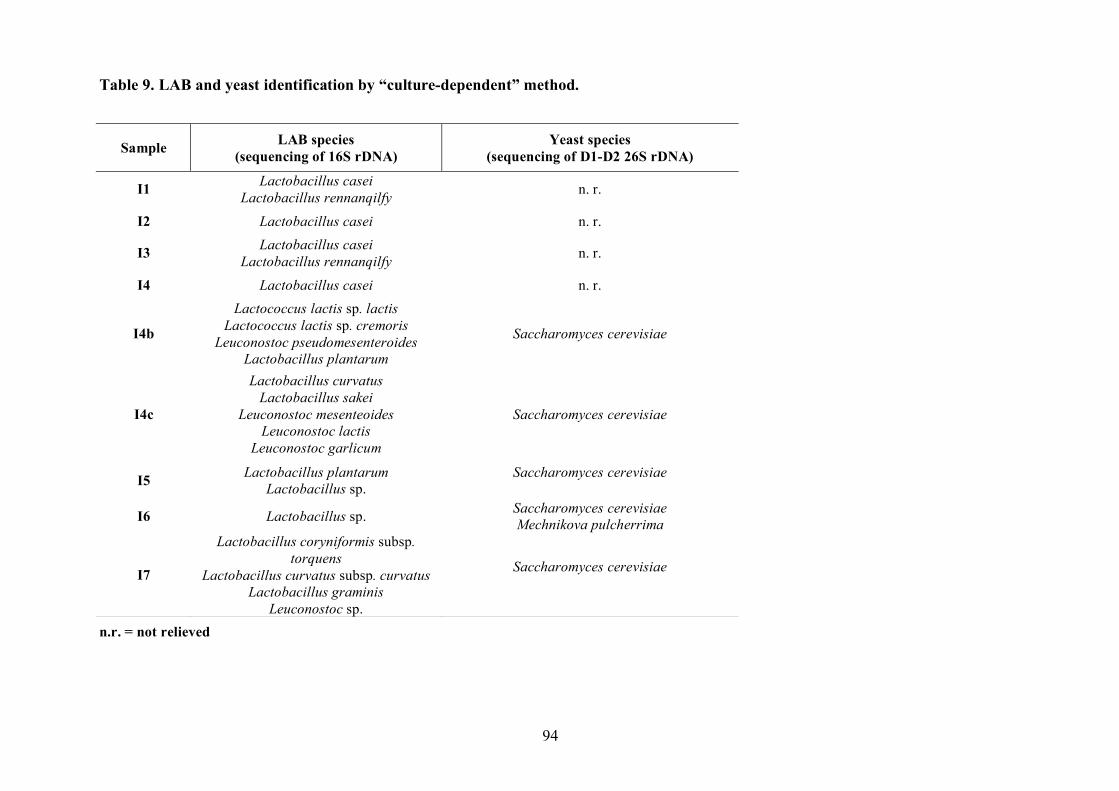
94
Table 9. LAB and yeast identification by “culture-dependent” method.
n.r. = not relieved
Sample LAB species (sequencing of 16S rDNA)
Yeast species (sequencing of D1-D2 26S rDNA)
I1 Lactobacillus casei Lactobacillus rennanqilfy n. r.
I2 Lactobacillus casei n. r.
I3 Lactobacillus casei Lactobacillus rennanqilfy n. r.
I4 Lactobacillus casei n. r.
I4b
Lactococcus lactis sp. lactis Lactococcus lactis sp. cremoris
Leuconostoc pseudomesenteroides Lactobacillus plantarum
Saccharomyces cerevisiae
I4c
Lactobacillus curvatus Lactobacillus sakei
Leuconostoc mesenteoides Leuconostoc lactis
Leuconostoc garlicum
Saccharomyces cerevisiae
I5 Lactobacillus plantarum Lactobacillus sp.
Saccharomyces cerevisiae
I6 Lactobacillus sp. Saccharomyces cerevisiae Mechnikova pulcherrima
I7
Lactobacillus coryniformis subsp. torquens
Lactobacillus curvatus subsp. curvatus Lactobacillus graminis
Leuconostoc sp.
Saccharomyces cerevisiae
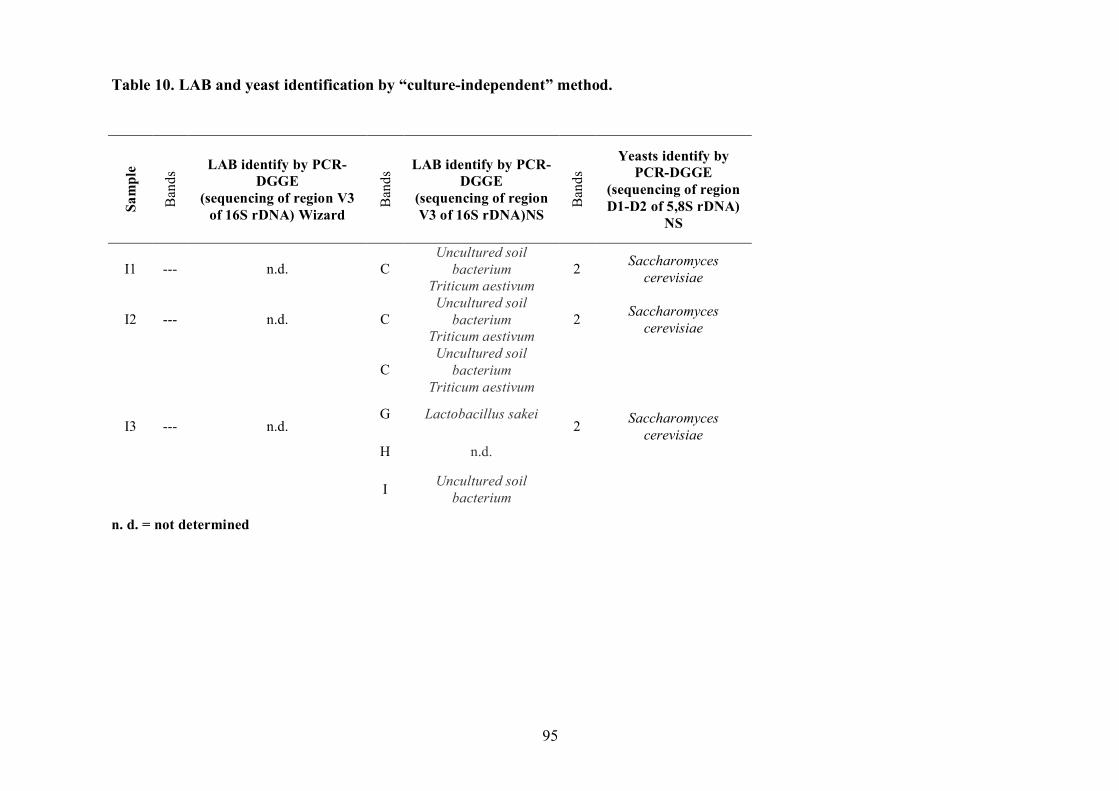
95
Table 10. LAB and yeast identification by “culture-independent” method.
n. d. = not determined
Sam
ple
Ban
ds LAB identify by PCR-
DGGE (sequencing of region V3
of 16S rDNA) Wizard
Ban
ds LAB identify by PCR-
DGGE (sequencing of region V3 of 16S rDNA)NS
Ban
ds
Yeasts identify by PCR-DGGE
(sequencing of region D1-D2 of 5,8S rDNA)
NS
I1 --- n.d. C Uncultured soil
bacterium Triticum aestivum
2 Saccharomyces cerevisiae
I2 --- n.d. C Uncultured soil
bacterium Triticum aestivum
2 Saccharomyces cerevisiae
C Uncultured soil
bacterium Triticum aestivum
G Lactobacillus sakei
H n.d.
I3 --- n.d.
I Uncultured soil bacterium
2 Saccharomyces cerevisiae
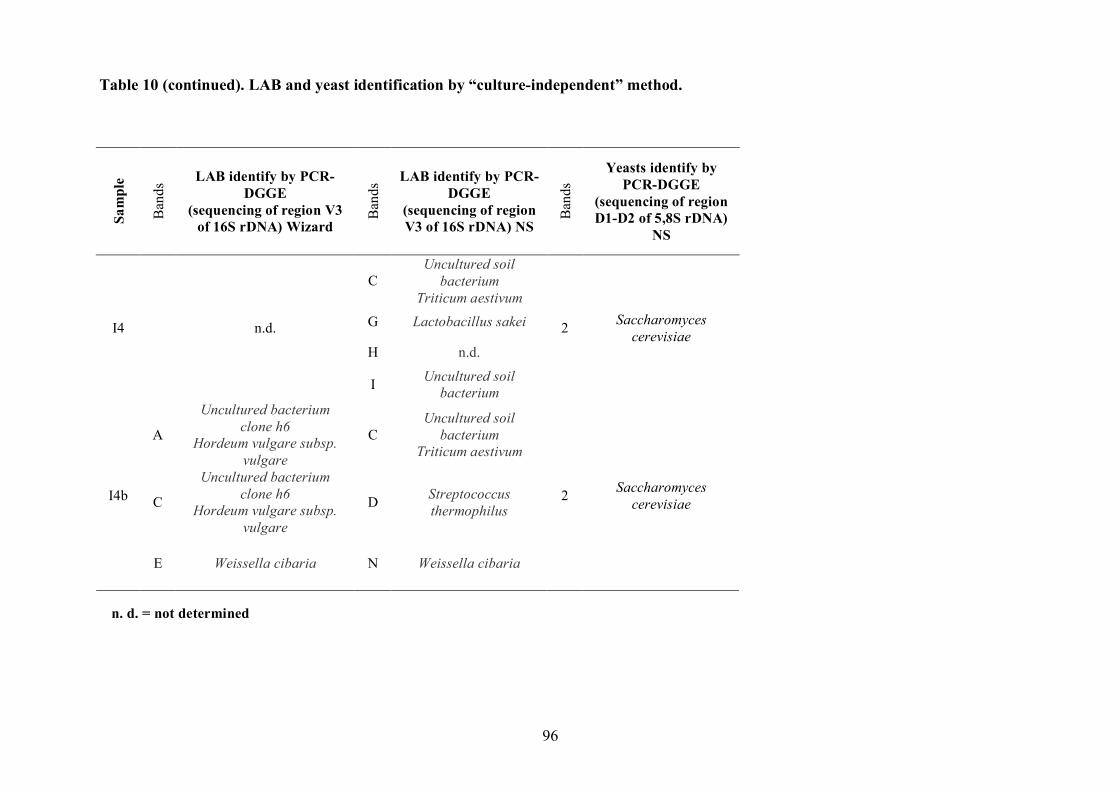
96
Table 10 (continued). LAB and yeast identification by “culture-independent” method.
n. d. = not determined
Sam
ple
Ban
ds LAB identify by PCR-
DGGE (sequencing of region V3
of 16S rDNA) Wizard
Ban
ds LAB identify by PCR-
DGGE (sequencing of region V3 of 16S rDNA) NS
Ban
ds
Yeasts identify by PCR-DGGE
(sequencing of region D1-D2 of 5,8S rDNA)
NS
C Uncultured soil
bacterium Triticum aestivum
G Lactobacillus sakei
H n.d.
I4 n.d.
I Uncultured soil bacterium
2 Saccharomyces cerevisiae
A
Uncultured bacterium clone h6
Hordeum vulgare subsp. vulgare
C Uncultured soil
bacterium Triticum aestivum
C
Uncultured bacterium clone h6
Hordeum vulgare subsp. vulgare
D Streptococcus thermophilus
I4b
E Weissella cibaria N Weissella cibaria
2 Saccharomyces cerevisiae

97
Table 10 (continued). LAB and yeast identification by “culture-independent” method.
Sam
ple
Ban
ds LAB identify by PCR-
DGGE (sequencing of region V3
of 16S rDNA) Wizard
Ban
ds LAB identify by PCR-
DGGE (sequencing of region V3 of 16S rDNA) NS
Ban
ds
Yeasts identify by PCR-DGGE
(sequencing of region D1-D2 of 5,8S rDNA)
NS
C1 Lactobacillus sanfranciscensis C
Uncultured soil bacterium
Triticum aestivum
D Lactobacillus sanfranciscensis D Streptococcus
thermophilus I4c
E Weissella cibaria E Lactobacillus sanfranciscensis
2 Saccharomyces cerevisiae
C
Uncultured bacterium clone h6
Hordeum vulgare subsp. vulgare
C1 Lactobacillus sanfranciscensis
C Uncultured soil
bacterium Triticum aestivum
D1 Lactobacillus sanfranciscensis D Streptococcus
thermophilus
I5
C2
Uncultured bacterium clone h6
Hordeum vulgare subsp. vulgare
E Lactobacillus
sanfranciscensis
2 Saccharomyces cerevisiae
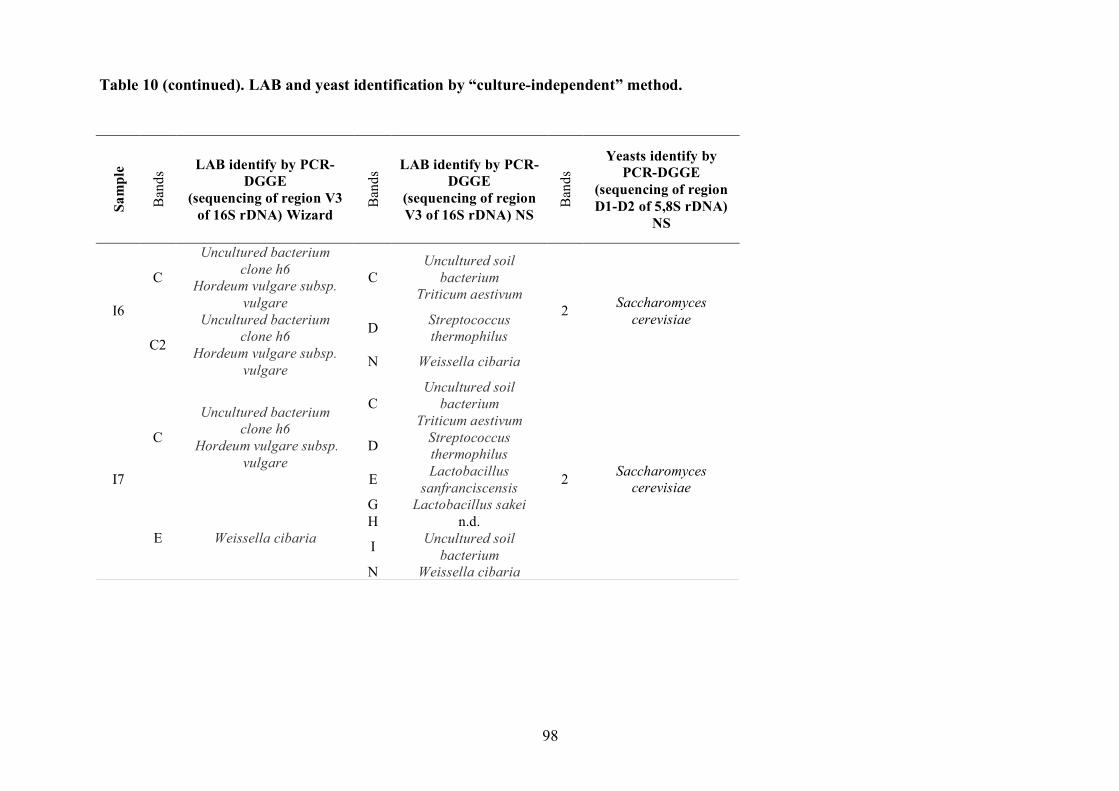
98
Table 10 (continued). LAB and yeast identification by “culture-independent” method.
Sam
ple
Ban
ds LAB identify by PCR-
DGGE (sequencing of region V3
of 16S rDNA) Wizard
Ban
ds LAB identify by PCR-
DGGE (sequencing of region V3 of 16S rDNA) NS
Ban
ds
Yeasts identify by PCR-DGGE
(sequencing of region D1-D2 of 5,8S rDNA)
NS
C
Uncultured bacterium clone h6
Hordeum vulgare subsp. vulgare
C Uncultured soil
bacterium Triticum aestivum
D Streptococcus thermophilus
I6
C2
Uncultured bacterium clone h6
Hordeum vulgare subsp. vulgare N Weissella cibaria
2 Saccharomyces cerevisiae
C Uncultured soil
bacterium Triticum aestivum
D Streptococcus thermophilus
C
Uncultured bacterium clone h6
Hordeum vulgare subsp. vulgare
E Lactobacillus sanfranciscensis
G Lactobacillus sakei H n.d.
I Uncultured soil bacterium
I7
E Weissella cibaria
N Weissella cibaria
2 Saccharomyces cerevisiae
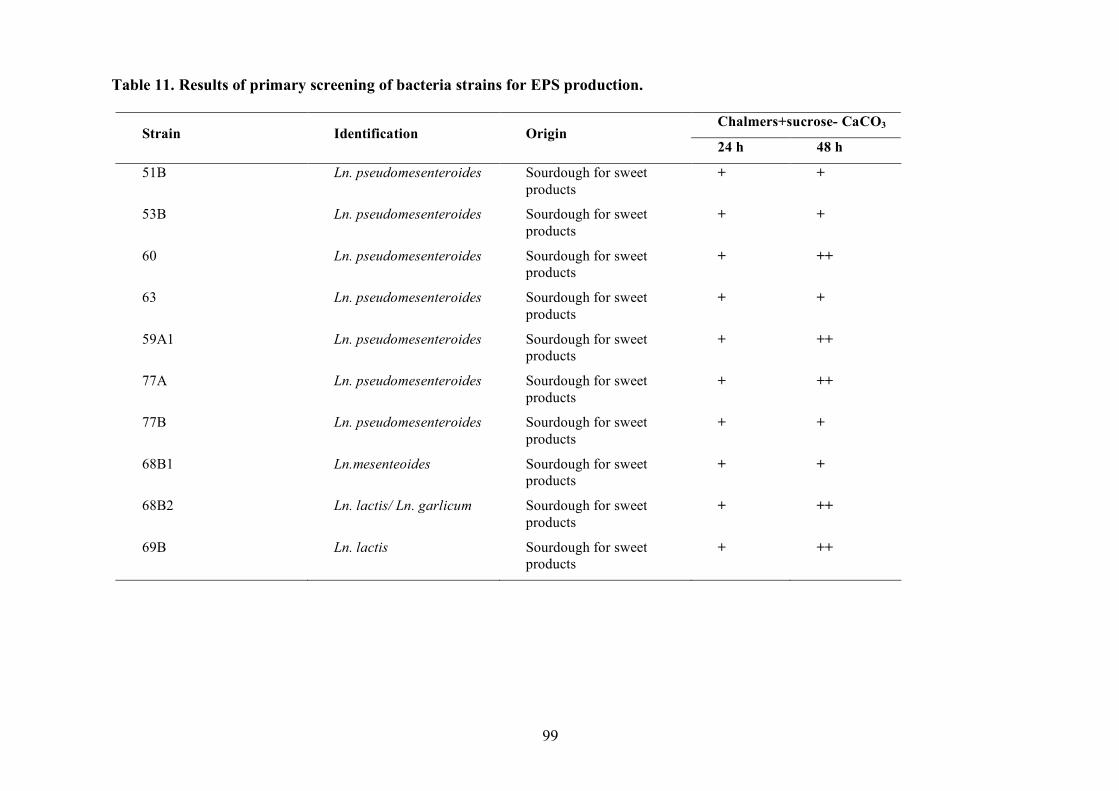
99
Table 11. Results of primary screening of bacteria strains for EPS production.
Chalmers+sucrose- CaCO3 Strain Identification Origin
24 h 48 h
51B Ln. pseudomesenteroides Sourdough for sweet products
+ +
53B Ln. pseudomesenteroides Sourdough for sweet products
+ +
60 Ln. pseudomesenteroides Sourdough for sweet products
+ ++
63 Ln. pseudomesenteroides Sourdough for sweet products
+ +
59A1 Ln. pseudomesenteroides Sourdough for sweet products
+ ++
77A Ln. pseudomesenteroides Sourdough for sweet products
+ ++
77B Ln. pseudomesenteroides Sourdough for sweet products
+ +
68B1 Ln.mesenteoides Sourdough for sweet products
+ +
68B2 Ln. lactis/ Ln. garlicum Sourdough for sweet products
+ ++
69B Ln. lactis Sourdough for sweet products
+ ++

100
Table 11 (continued). Results of primary screening of bacteria strains for EPS production.
Chalmers+sucrose- CaCO3 Strain Identification Origin
24 h 48 h
53C Ln. pseudomesenteroides Sourdough for sweet products
+ ++
49 Ln. pseudomesenteroides Sourdough for sweet products
+ ++
68A12 Ln. lactis/ Ln. garlicum Sourdough for sweet products
+ +
69B2 Lb. curvatus Sourdough for sweet products
+ +
133 Lb. coryniformis subsp. torquens
Sourdough for sweet products
+ +
107 Uncultured Streptococcus sp.
Sourdough for sweet products
+ +
A16 Ln. gelidum Pizza dough + ++
A43 Ln. gelidum Pizza dough + ++
A49 Ln. gelidum Pizza dough + +
G14 Weis. paramesenteroide Commercially Bakery’yeast + +
G15 Weis. paramesenteroide Commercially Bakery’yeast + +
A51 Weis. paramesenteroide Pizza dough + +
A58 Weis. paramesenteroide Pizza dough + +
A64 Weis. paramesenteroide Pizza dough + ++
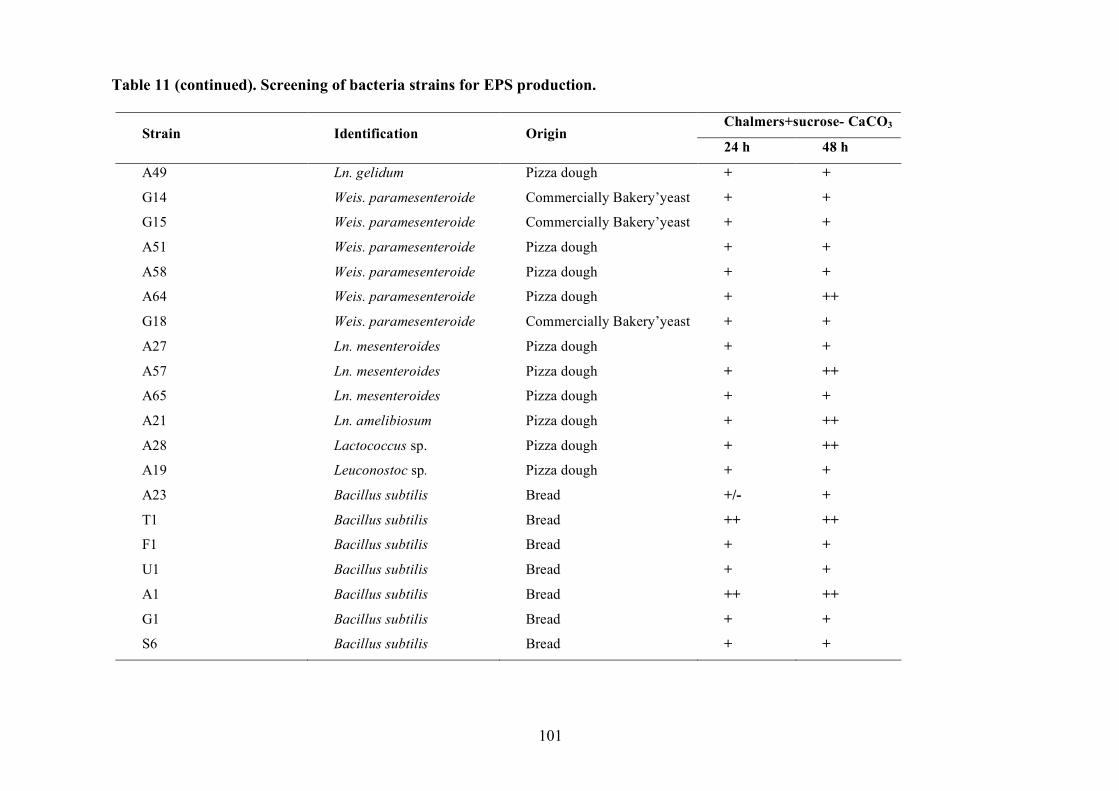
101
Table 11 (continued). Screening of bacteria strains for EPS production.
Chalmers+sucrose- CaCO3 Strain Identification Origin
24 h 48 h
A49 Ln. gelidum Pizza dough + +
G14 Weis. paramesenteroide Commercially Bakery’yeast + +
G15 Weis. paramesenteroide Commercially Bakery’yeast + +
A51 Weis. paramesenteroide Pizza dough + +
A58 Weis. paramesenteroide Pizza dough + +
A64 Weis. paramesenteroide Pizza dough + ++
G18 Weis. paramesenteroide Commercially Bakery’yeast + +
A27 Ln. mesenteroides Pizza dough + +
A57 Ln. mesenteroides Pizza dough + ++
A65 Ln. mesenteroides Pizza dough + +
A21 Ln. amelibiosum Pizza dough + ++
A28 Lactococcus sp. Pizza dough + ++
A19 Leuconostoc sp. Pizza dough + +
A23 Bacillus subtilis Bread +/- +
T1 Bacillus subtilis Bread ++ ++
F1 Bacillus subtilis Bread + +
U1 Bacillus subtilis Bread + +
A1 Bacillus subtilis Bread ++ ++
G1 Bacillus subtilis Bread + +
S6 Bacillus subtilis Bread + +
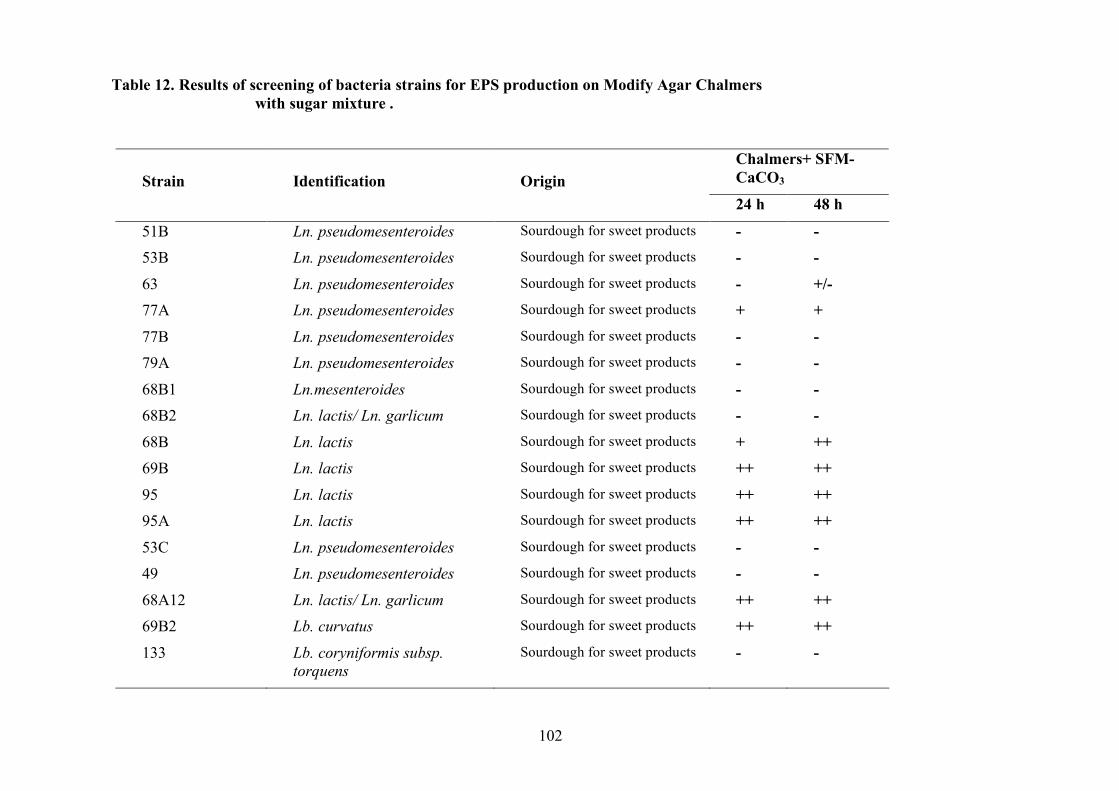
102
Table 12. Results of screening of bacteria strains for EPS production on Modify Agar Chalmers with sugar mixture .
Chalmers+ SFM-CaCO3 Strain Identification Origin 24 h 48 h
51B Ln. pseudomesenteroides Sourdough for sweet products - - 53B Ln. pseudomesenteroides Sourdough for sweet products - - 63 Ln. pseudomesenteroides Sourdough for sweet products - +/- 77A Ln. pseudomesenteroides Sourdough for sweet products + + 77B Ln. pseudomesenteroides Sourdough for sweet products - - 79A Ln. pseudomesenteroides Sourdough for sweet products - - 68B1 Ln.mesenteroides Sourdough for sweet products - - 68B2 Ln. lactis/ Ln. garlicum Sourdough for sweet products - - 68B Ln. lactis Sourdough for sweet products + ++ 69B Ln. lactis Sourdough for sweet products ++ ++ 95 Ln. lactis Sourdough for sweet products ++ ++ 95A Ln. lactis Sourdough for sweet products ++ ++ 53C Ln. pseudomesenteroides Sourdough for sweet products - - 49 Ln. pseudomesenteroides Sourdough for sweet products - - 68A12 Ln. lactis/ Ln. garlicum Sourdough for sweet products ++ ++ 69B2 Lb. curvatus Sourdough for sweet products ++ ++ 133 Lb. coryniformis subsp.
torquens Sourdough for sweet products - -

103
Table 12 (continued). Results of screening of bacteria strains for EPS production on Modify Agar Chalmers with sugar mixture .
Chalmers+ SFM-CaCO3 Strain Identification Origin 24 h 48 h
107 Uncultured Streptococcus sp. Sourdough for sweet products
- -
A16 Ln. gelidum Pizza dough + + A43 Ln. gelidum Pizza dough + ++ A49 Ln. gelidum Pizza dough - - G14 Weis. paramesenteroides Commercially Bakery’yeast - - G15 Weis. paramesenteroidse Commercially Bakery’yeast - - A51 Weis. paramesenteroides Pizza dough - - A58 Weis. paramesenteroides Pizza dough + + A64 Weis. paramesenteroides Pizza dough - - G18 Weis. paramesenteroide Commercially Bakery’yeast - - A27 Ln. mesenteroides Pizza dough - - A52 Ln. mesenteroides Pizza dough - +
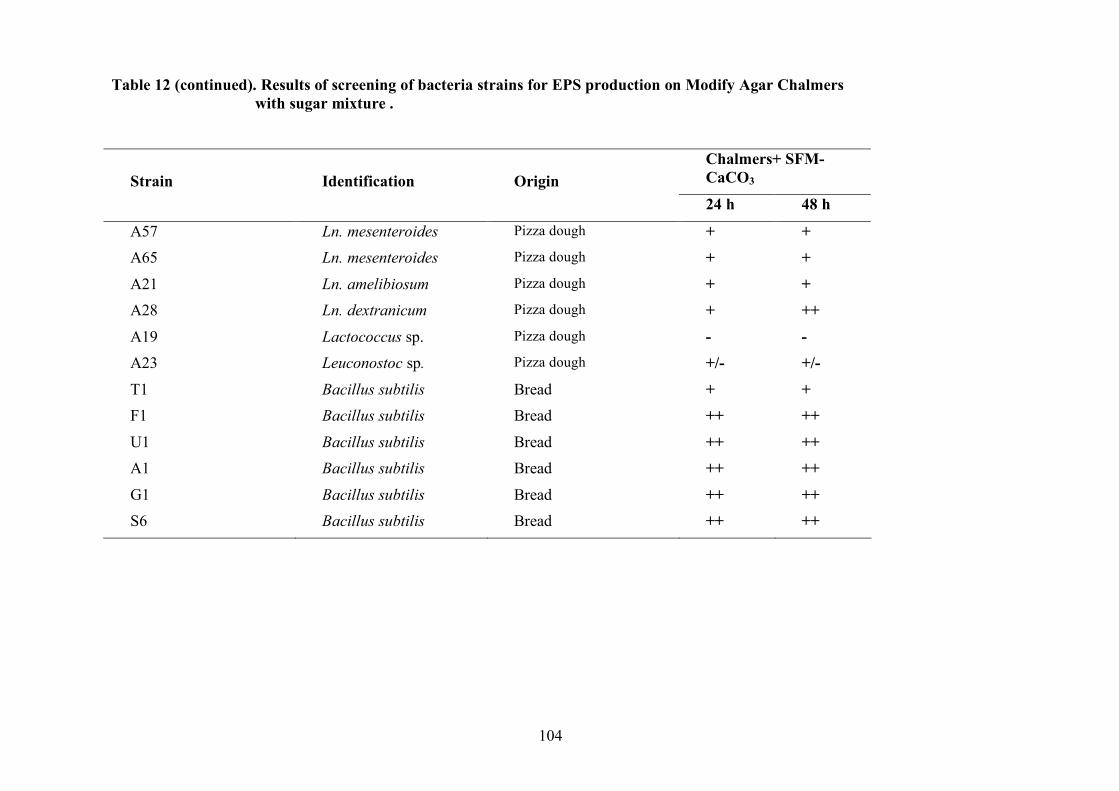
104
Table 12 (continued). Results of screening of bacteria strains for EPS production on Modify Agar Chalmers with sugar mixture .
Chalmers+ SFM-CaCO3 Strain Identification Origin 24 h 48 h
A57 Ln. mesenteroides Pizza dough + + A65 Ln. mesenteroides Pizza dough + + A21 Ln. amelibiosum Pizza dough + + A28 Ln. dextranicum Pizza dough + ++ A19 Lactococcus sp. Pizza dough - - A23 Leuconostoc sp. Pizza dough +/- +/- T1 Bacillus subtilis Bread + + F1 Bacillus subtilis Bread ++ ++ U1 Bacillus subtilis Bread ++ ++ A1 Bacillus subtilis Bread ++ ++ G1 Bacillus subtilis Bread ++ ++ S6 Bacillus subtilis Bread ++ ++
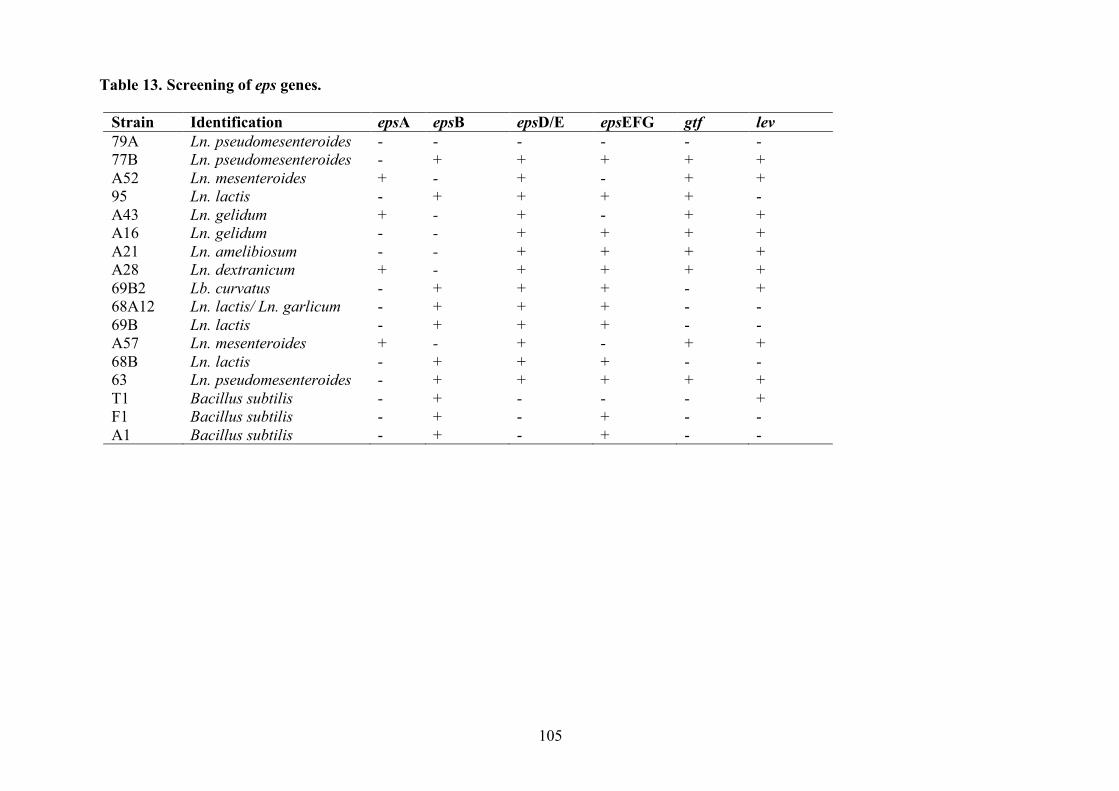
105
Table 13. Screening of eps genes.
Strain Identification epsA epsB epsD/E epsEFG gtf lev 79A Ln. pseudomesenteroides - - - - - - 77B Ln. pseudomesenteroides - + + + + + A52 Ln. mesenteroides + - + - + + 95 Ln. lactis - + + + + - A43 Ln. gelidum + - + - + + A16 Ln. gelidum - - + + + + A21 Ln. amelibiosum - - + + + + A28 Ln. dextranicum + - + + + + 69B2 Lb. curvatus - + + + - + 68A12 Ln. lactis/ Ln. garlicum - + + + - - 69B Ln. lactis - + + + - - A57 Ln. mesenteroides + - + - + + 68B Ln. lactis - + + + - - 63 Ln. pseudomesenteroides - + + + + + T1 Bacillus subtilis - + - - - + F1 Bacillus subtilis - + - + - - A1 Bacillus subtilis - + - + - -
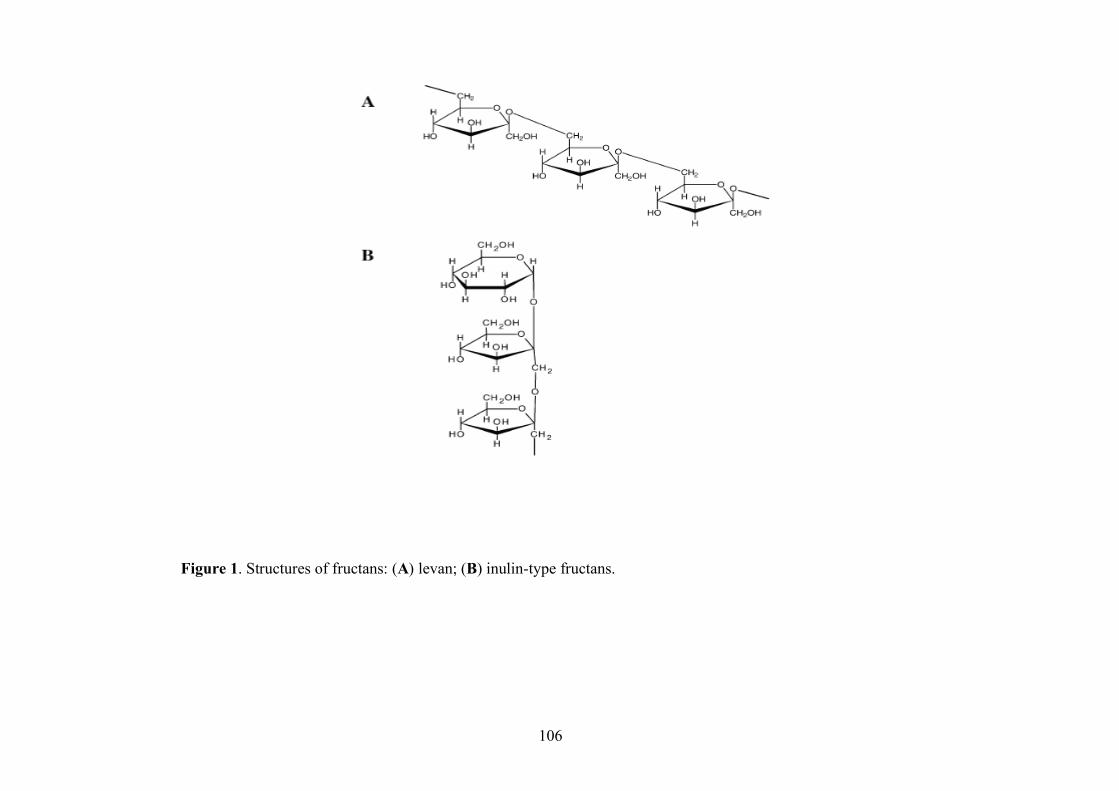
106
Figure 1. Structures of fructans: (A) levan; (B) inulin-type fructans.
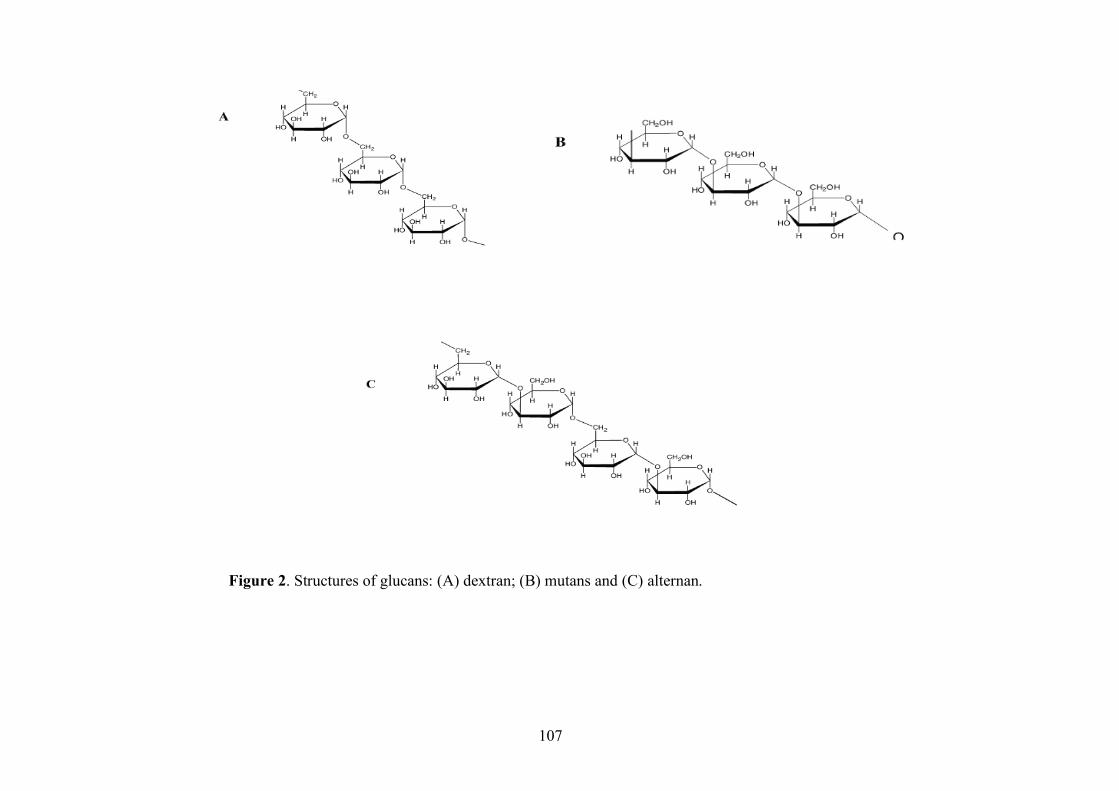
107
Figure 2. Structures of glucans: (A) dextran; (B) mutans and (C) alternan.

108
Figure 3. (A) Schematic representation of a number of possible pathways for sugar transport and metabolism in LAB. (B) Schematic representation of a possible pathway for EPS biosynthesis in L. lactis NIZO B40 starting from glucose-6-phosphate. From Laws et al., 2001.

109
Figure 4. Organization ofthe eps gene clusters of heteropolys acharide-producing Streptococcus thermophilus and Lactococcus lactis strains. The (possible) functions of the different gene products are indicated (Figure from De vuyst et al., 2001) .
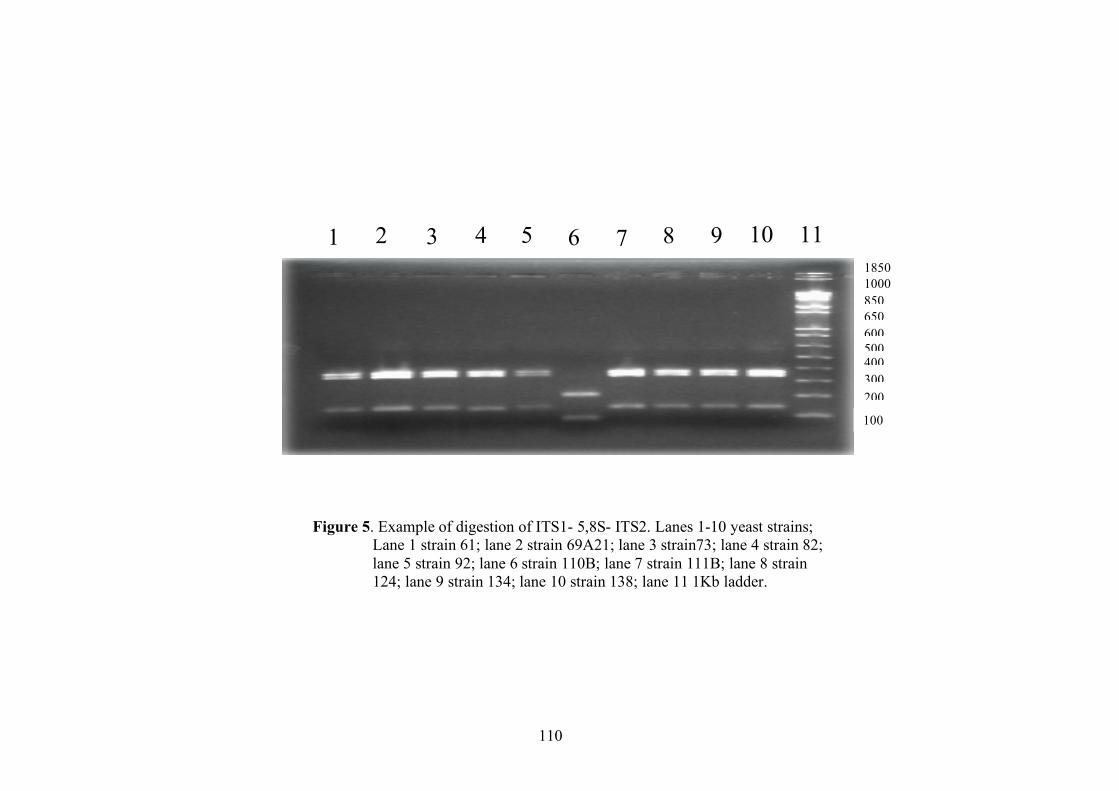
110
2 3 4 5 6 7 8 9 10 11 1
Figure 5. Example of digestion of ITS1- 5,8S- ITS2. Lanes 1-10 yeast strains; Lane 1 strain 61; lane 2 strain 69A21; lane 3 strain73; lane 4 strain 82; lane 5 strain 92; lane 6 strain 110B; lane 7 strain 111B; lane 8 strain 124; lane 9 strain 134; lane 10 strain 138; lane 11 1Kb ladder.
100
200 300 400 500 600 6500
850 1000 1850

111
Figure 6. DNA isolation with three different protocols. The three mini gels show the DNA isolation from first two dilutions of the standardized sourdough (lanes L1-L2). W: Wizard protocol; NS: Nucleo Spin Food protocol and K DNeasy Plant Mini Kit.

112
Figure 7. PCR amplification of V3 region of 16S rDNA of the first two dilutions (lanes 1-2) of standardized sourdough. W: Wizard protocol; NS: Nucleo Spin Food protocol and K DNeasy Plant Mini Kit. M: 1Kb ladder.
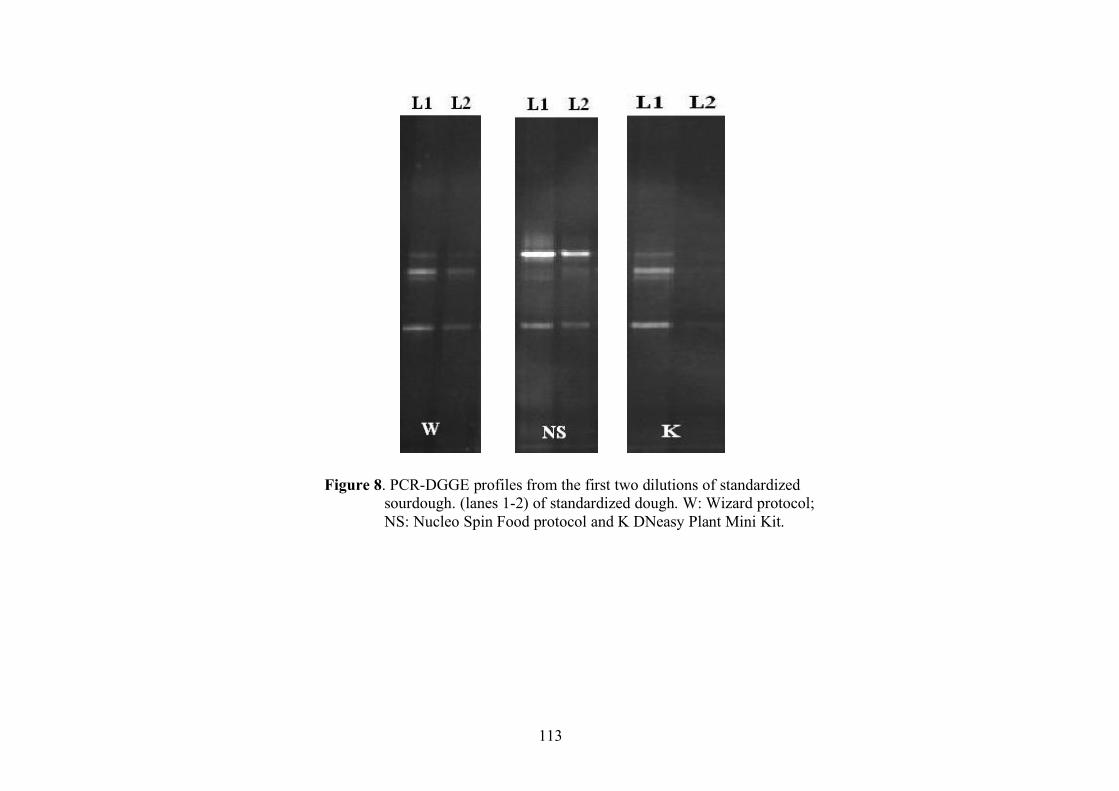
113
Figure 8. PCR-DGGE profiles from the first two dilutions of standardized sourdough. (lanes 1-2) of standardized dough. W: Wizard protocol; NS: Nucleo Spin Food protocol and K DNeasy Plant Mini Kit.
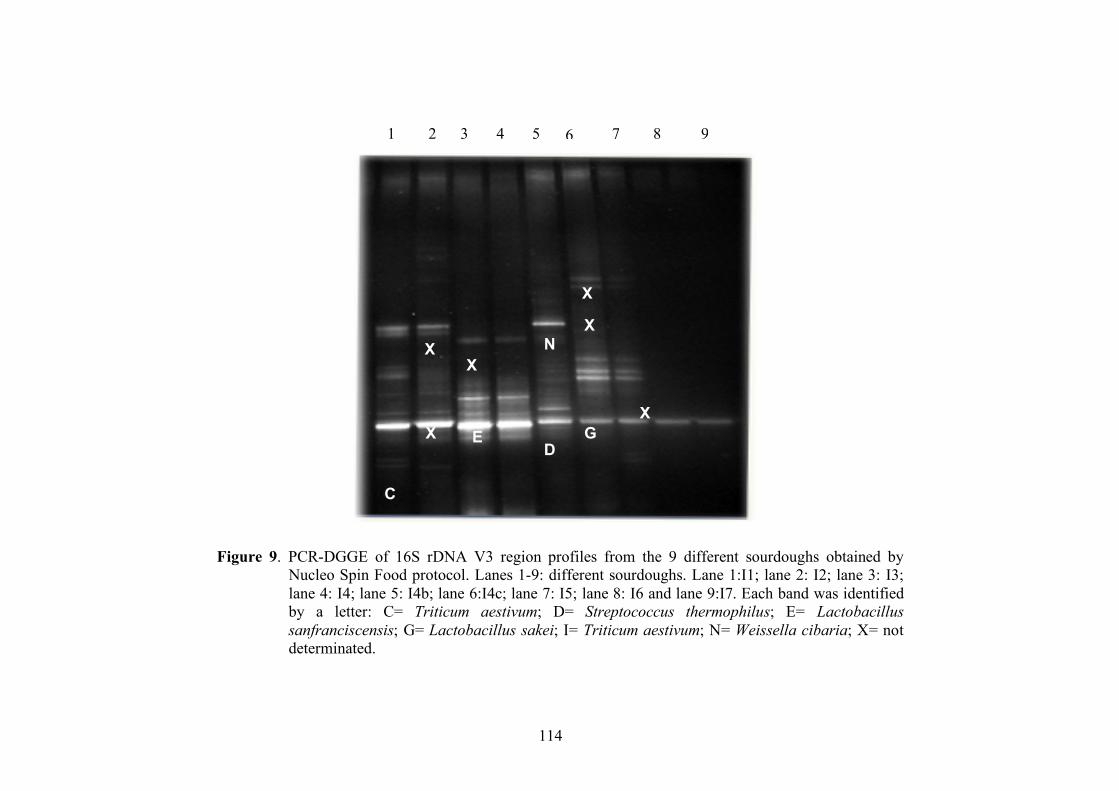
114
I
1 2 3 4 5 6 7 8 9
C
D E G
N X
X
X
X X
X
Figure 9. PCR-DGGE of 16S rDNA V3 region profiles from the 9 different sourdoughs obtained by Nucleo Spin Food protocol. Lanes 1-9: different sourdoughs. Lane 1:I1; lane 2: I2; lane 3: I3; lane 4: I4; lane 5: I4b; lane 6:I4c; lane 7: I5; lane 8: I6 and lane 9:I7. Each band was identified by a letter: C= Triticum aestivum; D= Streptococcus thermophilus; E= Lactobacillus sanfranciscensis; G= Lactobacillus sakei; I= Triticum aestivum; N= Weissella cibaria; X= not determinated.
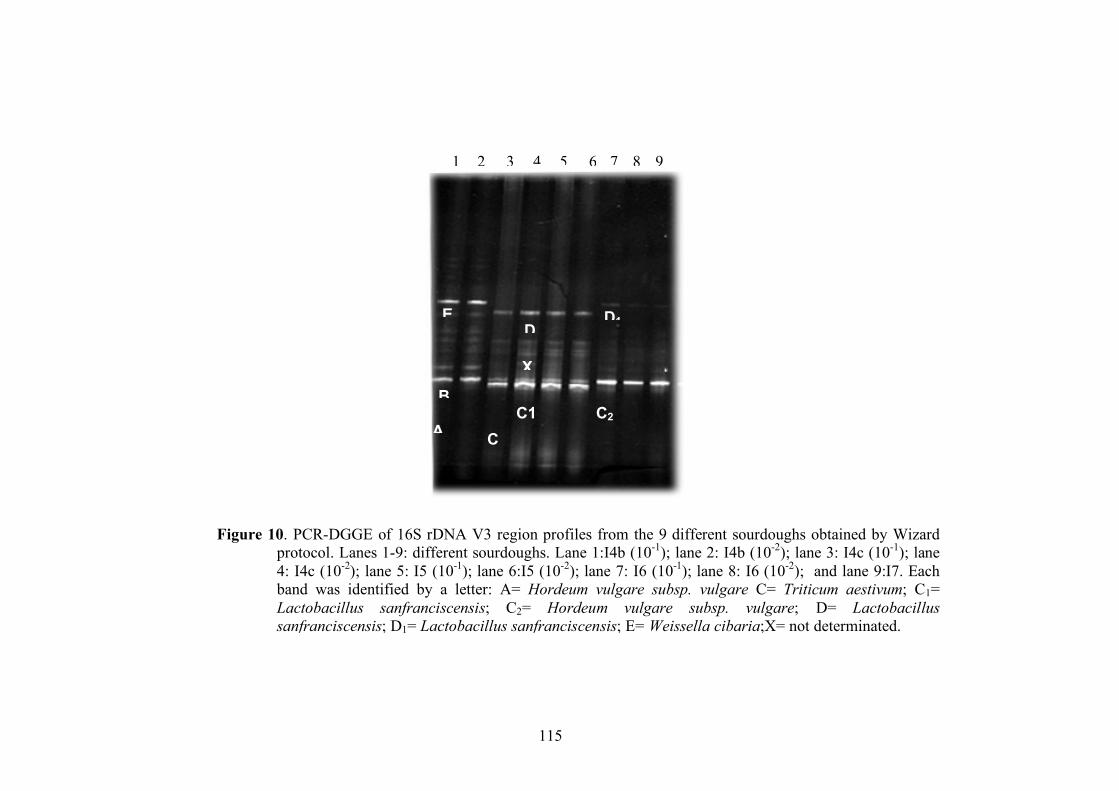
115
1 2 8 9 7 6 5 4 3
A C C1 C2
B
D D1 E
X
Figure 10. PCR-DGGE of 16S rDNA V3 region profiles from the 9 different sourdoughs obtained by Wizard protocol. Lanes 1-9: different sourdoughs. Lane 1:I4b (10-1); lane 2: I4b (10-2); lane 3: I4c (10-1); lane 4: I4c (10-2); lane 5: I5 (10-1); lane 6:I5 (10-2); lane 7: I6 (10-1); lane 8: I6 (10-2); and lane 9:I7. Each band was identified by a letter: A= Hordeum vulgare subsp. vulgare C= Triticum aestivum; C1= Lactobacillus sanfranciscensis; C2= Hordeum vulgare subsp. vulgare; D= Lactobacillus sanfranciscensis; D1= Lactobacillus sanfranciscensis; E= Weissella cibaria;X= not determinated.
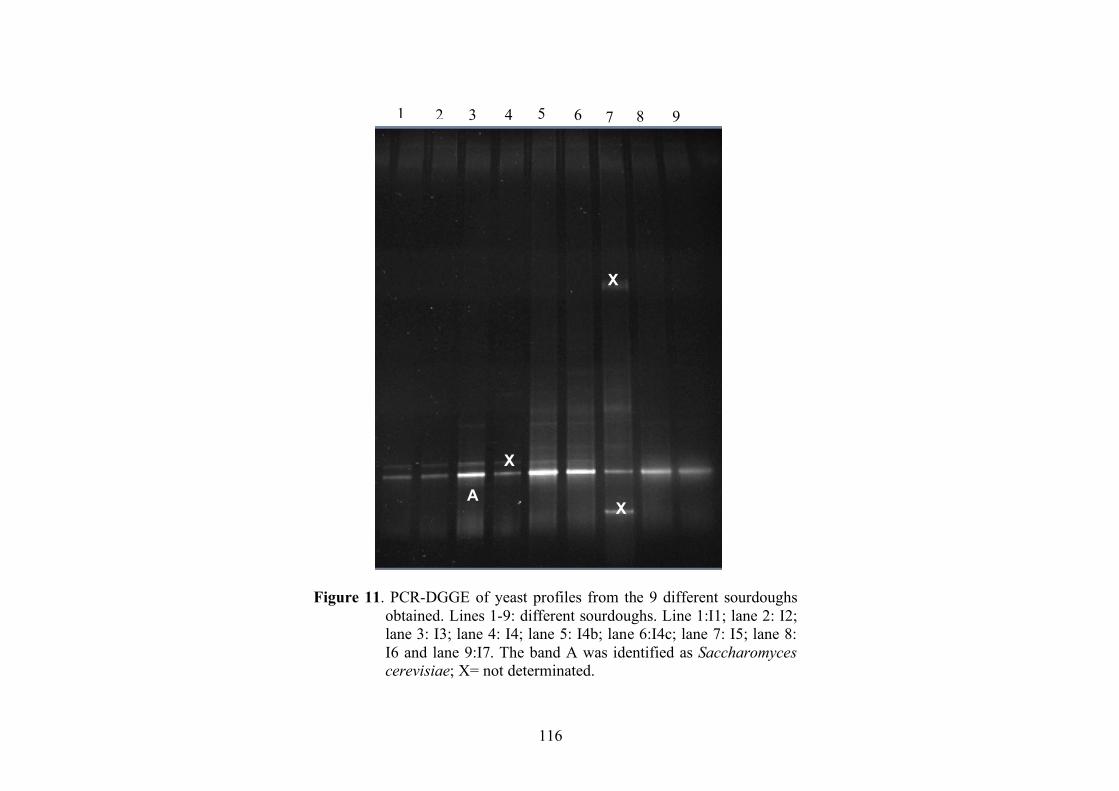
116
1 2 3 4 5 6 7 8 9
A
X
X
X
Figure 11. PCR-DGGE of yeast profiles from the 9 different sourdoughs obtained. Lines 1-9: different sourdoughs. Line 1:I1; lane 2: I2; lane 3: I3; lane 4: I4; lane 5: I4b; lane 6:I4c; lane 7: I5; lane 8: I6 and lane 9:I7. The band A was identified as Saccharomyces cerevisiae; X= not determinated.
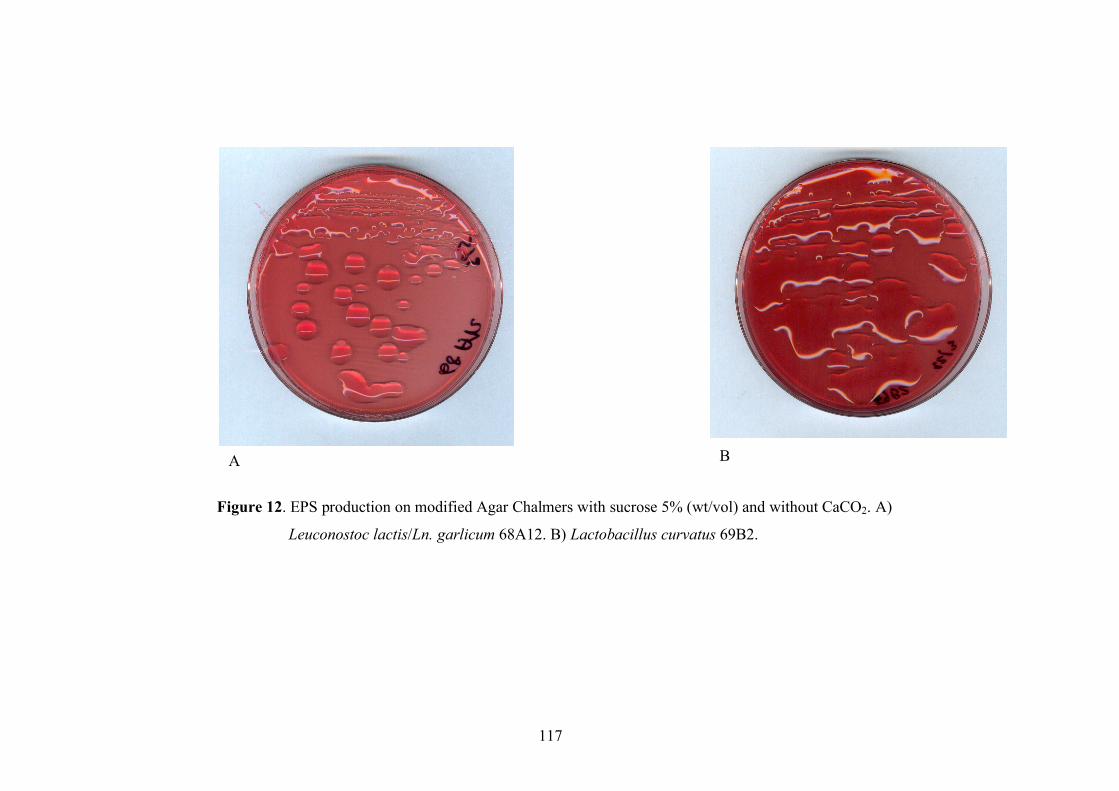
117
Figure 12. EPS production on modified Agar Chalmers with sucrose 5% (wt/vol) and without CaCO2. A)
Leuconostoc lactis/Ln. garlicum 68A12. B) Lactobacillus curvatus 69B2.
A B

118
Time [min]
4 6 8 10 12 14 16 18 20
Arb
itrary
Units
[AU
]
0
20
40
60
80
100
120
140
Dextranase α-1-6
� -D-Glucanase β-1-3
� -glucanase � -1-4
Glucose
Glucose
Figure 13. HPLC chromatograms from culture supernatants of Lb. parabuchneri FUA 3154.

119
A B C
D E
Figure 14. Results of RT-PCR of cDNA. A) Primers for β-glucan; B) Primers for housekeeping gene dnaK; C) Primers for housekeeping gene recA; D) Primers for epsD/E gene; E) Primers for epsE gene.