Embed Size (px)
Citation preview

Università degli studi di Parma
Facoltà di Scienze MM.FF.NN.
Corso di Laurea Specialistica in
Scienza e Tecnologia dei Materiali
Innovativi
Interazione tra antibiotici macrolidi e
membrane modello
Interaction between macrolide
antibiotics and model membranes
Relatore Candidato
Prof. Luigi CRISTOFOLINI Agostino ROMEO
Correlatore
Prof. Pietro CICUTA
Anno Accademico 2009/2010

Contents
Contents 5
List of �gures 8
List of tables 10
Riassunto 11
Introduction 21
1 Physical properties and pharmacology of lipid membranes 26
1.1 Phospholipids . . . . . . . . . . . . . . . . . . . . . . . . . . . 26
1.2 Polymorphic phases of phospholipids . . . . . . . . . . . . . . 27
1.2.1 Cell membranes . . . . . . . . . . . . . . . . . . . . . . 27
1.2.2 Phospholipid aggregates . . . . . . . . . . . . . . . . . 29
1.3 Model membranes: vesicles and Langmuir-Blodgett �lms . . . 31
1.3.1 Phospholipid vesicles . . . . . . . . . . . . . . . . . . . 31
1.3.2 Langmuir and Langmuir-Blodgett �lms . . . . . . . . . 33
1.4 Phase transitions in lipid bilayers . . . . . . . . . . . . . . . . 35
1.5 Interactions of drugs with model membranes . . . . . . . . . . 37
1.5.1 Drugs: Aivlosin, Azithromicyn, Clarithromycin . . . . 37
1.5.2 E�ect of Azithromycin on lipid bilayers . . . . . . . . . 41
1.6 Thermal �uctuations of �uid membranes . . . . . . . . . . . . 43
1.6.1 The Helfrich Hamiltonian . . . . . . . . . . . . . . . . 45
1.6.2 The planar approximation . . . . . . . . . . . . . . . . 46
CONTENTS 3
1.6.3 Spherical Harmonics representation . . . . . . . . . . . 49
1.6.4 Dynamics of membrane �uctuations . . . . . . . . . . . 51
1.6.5 Pixellation e�ects . . . . . . . . . . . . . . . . . . . . . 54
1.7 Interfacial Shear Rheology of phospholipid monolayers . . . . 55
1.7.1 Generalities . . . . . . . . . . . . . . . . . . . . . . . . 55
1.7.2 ISR experiment . . . . . . . . . . . . . . . . . . . . . . 56
1.7.3 Newtonian �uids . . . . . . . . . . . . . . . . . . . . . 57
1.7.4 Maxwell model . . . . . . . . . . . . . . . . . . . . . . 57
1.7.5 Time-temperature superposition . . . . . . . . . . . . . 58
2 Materials and methods 60
2.1 Materials . . . . . . . . . . . . . . . . . . . . . . . . . . . . . 60
2.2 Experimental Methods . . . . . . . . . . . . . . . . . . . . . . 61
2.2.1 GUVs preparation: Electroformation method . . . . . . 61
2.2.2 Microscopy for size and �ickering analysis . . . . . . . 62
2.2.3 Interfacial Shear Rheology (ISR) . . . . . . . . . . . . 64
2.2.4 Di�erential Scanning Calorimetry (DSC) . . . . . . . . 67
2.2.5 Micro�uidics . . . . . . . . . . . . . . . . . . . . . . . . 69
2.3 Data analysis . . . . . . . . . . . . . . . . . . . . . . . . . . . 71
2.3.1 Size distributions of vesicles . . . . . . . . . . . . . . . 71
2.3.2 Contour analysis . . . . . . . . . . . . . . . . . . . . . 73
2.3.3 ISR data analysis . . . . . . . . . . . . . . . . . . . . . 75
3 Experimental results 78
3.1 Size distributions of GUVs . . . . . . . . . . . . . . . . . . . . 78
3.2 Other e�ects of highly concentrated Aivlosin . . . . . . . . . . 85
3.3 Flickering analysis of GUVs . . . . . . . . . . . . . . . . . . . 88
3.3.1 E�ect of antibiotics on mechanical properties of GUVs 88
3.3.2 E�ect of spatial sampling . . . . . . . . . . . . . . . . . 96
3.3.3 Pixellation e�ect on the static spectra . . . . . . . . . 100
3.4 Langmuir monolayers of phospholipid . . . . . . . . . . . . . . 101
3.4.1 DPPC monolayers . . . . . . . . . . . . . . . . . . . . 101
CONTENTS 4
3.4.1.1 Π-A isotherm . . . . . . . . . . . . . . . . . . 101
3.4.1.2 Compressibility modulus . . . . . . . . . . . . 103
3.4.1.3 ISR measurements of pure DPPC . . . . . . . 104
3.4.1.4 Drug e�ects on the visco-elasticity of DPPC
monolayer . . . . . . . . . . . . . . . . . . . . 106
3.4.2 DOPC monolayers . . . . . . . . . . . . . . . . . . . . 115
3.5 Micro�uidics of GUVs . . . . . . . . . . . . . . . . . . . . . . 116
3.6 Thermotropic behaviour of DOPC bilayers . . . . . . . . . . . 118
4 Discussion 120
4.1 Morphological alterations of DOPC GUVs . . . . . . . . . . . 120
4.1.1 Micro�uidics . . . . . . . . . . . . . . . . . . . . . . . . 121
4.1.2 Antibiotics a�ect size distributions of GUVs . . . . . . 121
4.1.3 Clusters . . . . . . . . . . . . . . . . . . . . . . . . . . 122
4.1.4 Loss of contrast: a possible variation of the membrane
permeability . . . . . . . . . . . . . . . . . . . . . . . . 123
4.2 Antibiotics a�ect �ickering of GUVs . . . . . . . . . . . . . . . 124
4.2.1 Triggering of thermal undulations . . . . . . . . . . . . 124
4.2.2 Bending modulus of control vesicles . . . . . . . . . . . 124
4.2.3 Decrease of κ and formation of groups of κ-values . . . 125
4.3 E�ect of antibiotics on phospholipid monolayer rheology . . . 126
4.3.1 Thermotropic phases of DPPC monolayer and com-
pression modulus . . . . . . . . . . . . . . . . . . . . . 126
4.3.2 Rheology of pure DPPC monolayer . . . . . . . . . . . 127
4.3.3 In�uence of antibiotics on the rheology of DPPC mono-
layer . . . . . . . . . . . . . . . . . . . . . . . . . . . . 128
4.3.4 Rheology of DOPC monolayer . . . . . . . . . . . . . . 131
4.4 Possible mechanism of antibiotic-phospholipid interaction pro-
posed . . . . . . . . . . . . . . . . . . . . . . . . . . . . . . . . 132
5 Conclusions and outlook 134
5.1 Results obtained in this work . . . . . . . . . . . . . . . . . . 134
CONTENTS 5
5.1.1 E�ect of Macrolide antibiotics on size distributions of
GUVs . . . . . . . . . . . . . . . . . . . . . . . . . . . 134
5.1.2 Bending modulus of bilayers . . . . . . . . . . . . . . . 135
5.1.3 Visco-elasticity of Langmuir phospholipid monolayers . 135
5.1.4 Drug-phospholipid macromolecular complexes . . . . . 135
Bibliography 138
Acknowledgements 151
List of Figures
1 Struttura di un generico fosfolipide e dell'Aivlosin . . . . . . . 12
2 Immagine di GUV in �uorescenza . . . . . . . . . . . . . . . . 13
3 Distribuzioni di modulo di bending . . . . . . . . . . . . . . . 15
4 Isoterme Π-A e moduli di compressibilità . . . . . . . . . . . . 18
5 Master curves . . . . . . . . . . . . . . . . . . . . . . . . . . . 19
1.1 Phospholipid structure . . . . . . . . . . . . . . . . . . . . . . 27
1.2 Chemical structures of DOPC, DPPC, POPE . . . . . . . . . 28
1.3 Plasma membrane . . . . . . . . . . . . . . . . . . . . . . . . 28
1.4 Phospholipid aggregates . . . . . . . . . . . . . . . . . . . . . 29
1.5 Shape features of membranes phospholipids . . . . . . . . . . 30
1.6 Bilayer thickness . . . . . . . . . . . . . . . . . . . . . . . . . 31
1.7 Liposome . . . . . . . . . . . . . . . . . . . . . . . . . . . . . 32
1.8 L �lms . . . . . . . . . . . . . . . . . . . . . . . . . . . . . . . 33
1.9 Π-A isotherm of phospholipids . . . . . . . . . . . . . . . . . . 34
1.10 Phase transitions in lipid bilayers . . . . . . . . . . . . . . . . 36
1.11 Aivlosin structural formula . . . . . . . . . . . . . . . . . . . . 39
1.12 Azithromycin structural formula . . . . . . . . . . . . . . . . . 40
1.13 Clarithromycin structural formula . . . . . . . . . . . . . . . . 41
1.14 Azithromycin molecular modeling . . . . . . . . . . . . . . . . 43
1.15 Principal surface curvatures . . . . . . . . . . . . . . . . . . . 45
1.16 Maxwell model: spring and damper . . . . . . . . . . . . . . . 58
1.17 Maxwell model . . . . . . . . . . . . . . . . . . . . . . . . . . 59
LIST OF FIGURES 7
2.1 ISR instrument . . . . . . . . . . . . . . . . . . . . . . . . . . 66
2.2 Train wave . . . . . . . . . . . . . . . . . . . . . . . . . . . . . 67
2.3 Micro�uidic channel . . . . . . . . . . . . . . . . . . . . . . . 69
2.4 Vesicle detection . . . . . . . . . . . . . . . . . . . . . . . . . 72
2.5 Sub-pixel resampling . . . . . . . . . . . . . . . . . . . . . . . 74
2.6 Flickering analysis steps . . . . . . . . . . . . . . . . . . . . . 75
2.7 Needle position oscillations . . . . . . . . . . . . . . . . . . . . 77
2.8 Needle position oscillations - no drift . . . . . . . . . . . . . . 77
3.1 Microscopy images of vesicles . . . . . . . . . . . . . . . . . . 79
3.2 Microscopy image of Aivlosin e�ect . . . . . . . . . . . . . . . 80
3.3 Size distributions at di�erent incubation times . . . . . . . . . 82
3.4 Size distributions with Aivlosin 800 µM . . . . . . . . . . . . . 83
3.5 Size distributions averaged . . . . . . . . . . . . . . . . . . . . 83
3.6 Clusters . . . . . . . . . . . . . . . . . . . . . . . . . . . . . . 86
3.7 Clusters (�uorescence) . . . . . . . . . . . . . . . . . . . . . . 86
3.8 GUVs explosion . . . . . . . . . . . . . . . . . . . . . . . . . . 87
3.9 Permeability of GUVs . . . . . . . . . . . . . . . . . . . . . . 88
3.10 Non-uniform permeability of GUVs . . . . . . . . . . . . . . . 88
3.11 Static �uctuation spectrum . . . . . . . . . . . . . . . . . . . 89
3.12 Static �uctuation spectrum (q3 slope) . . . . . . . . . . . . . . 90
3.13 κ versus vesicle radii . . . . . . . . . . . . . . . . . . . . . . . 91
3.14 κ distributions . . . . . . . . . . . . . . . . . . . . . . . . . . . 93
3.15 Power Spectral Density . . . . . . . . . . . . . . . . . . . . . . 95
3.16 Coe�cient of spectral power density . . . . . . . . . . . . . . . 96
3.17 E�ect of sector number on static spectrum . . . . . . . . . . . 97
3.18 E�ect of sector number on �tting range . . . . . . . . . . . . . 98
3.19 E�ect of sector number on κ and σ . . . . . . . . . . . . . . . 99
3.20 Pixellation e�ect . . . . . . . . . . . . . . . . . . . . . . . . . 101
3.21 Π/A isotherms . . . . . . . . . . . . . . . . . . . . . . . . . . 102
3.22 Compressibility moduli . . . . . . . . . . . . . . . . . . . . . . 103
3.23 Amplitude rations and phase shifts . . . . . . . . . . . . . . . 105
LIST OF FIGURES 8
3.24 G' and G� versus ω, control . . . . . . . . . . . . . . . . . . . 107
3.25 G' and G� versus ω, Azithromycin . . . . . . . . . . . . . . . . 107
3.26 G' and G� versus ω, Clarithromycin . . . . . . . . . . . . . . . 108
3.27 G' and G� versus ω, Aivlosin . . . . . . . . . . . . . . . . . . . 108
3.28 Viscous and elastic shear moduli versus Π . . . . . . . . . . . 112
3.29 Master curves . . . . . . . . . . . . . . . . . . . . . . . . . . . 113
3.30 a factors versus Pi . . . . . . . . . . . . . . . . . . . . . . . . 114
3.31 Amplitude ratios and phase shifts (DOPC) . . . . . . . . . . . 115
3.32 G' and G� versus ω (DOPC) . . . . . . . . . . . . . . . . . . . 116
3.33 Micro�uidics: laminar �ows . . . . . . . . . . . . . . . . . . . 117
3.34 Micro�uidics: unbalanced �ows . . . . . . . . . . . . . . . . . 117
3.35 Thermograms . . . . . . . . . . . . . . . . . . . . . . . . . . . 118

List of Tables
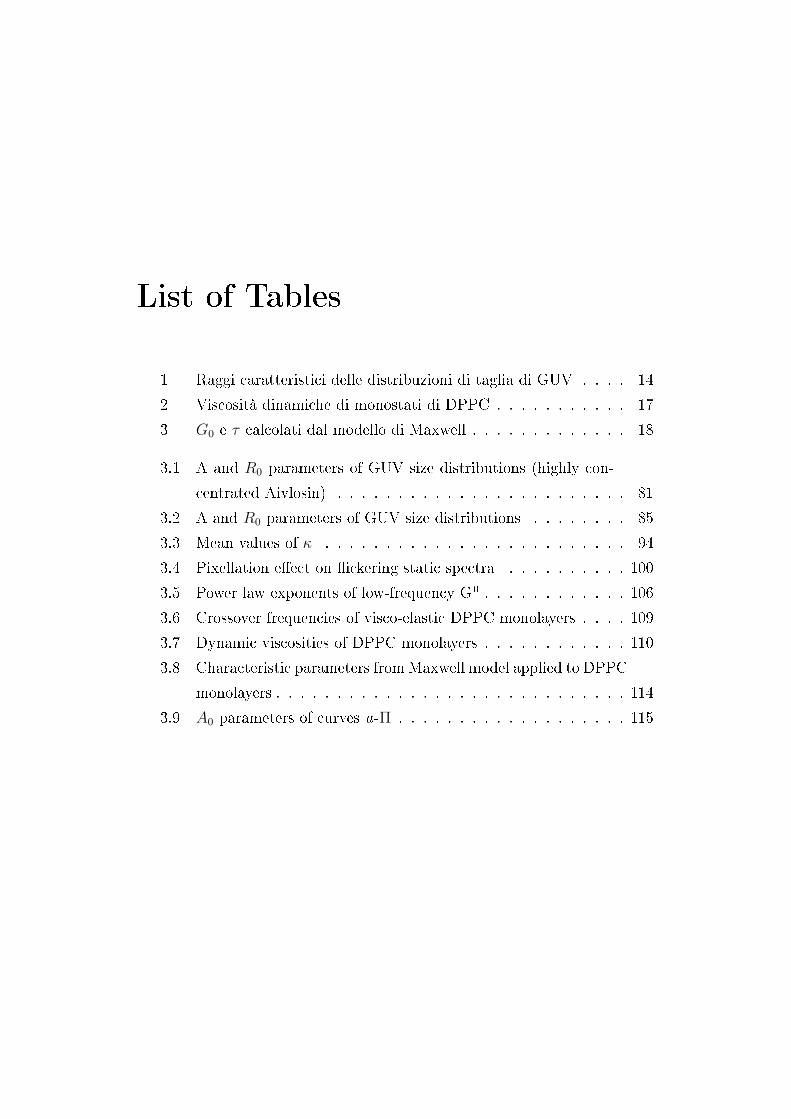
1 Raggi caratteristici delle distribuzioni di taglia di GUV . . . . 14
2 Viscosità dinamiche di monostati di DPPC . . . . . . . . . . . 17
3 G0 e τ calcolati dal modello di Maxwell . . . . . . . . . . . . . 18
3.1 A and R0 parameters of GUV size distributions (highly con-
centrated Aivlosin) . . . . . . . . . . . . . . . . . . . . . . . . 81
3.2 A and R0 parameters of GUV size distributions . . . . . . . . 85
3.3 Mean values of κ . . . . . . . . . . . . . . . . . . . . . . . . . 94
3.4 Pixellation e�ect on �ickering static spectra . . . . . . . . . . 100
3.5 Power law exponents of low-frequency G" . . . . . . . . . . . . 106
3.6 Crossover frequencies of visco-elastic DPPC monolayers . . . . 109
3.7 Dynamic viscosities of DPPC monolayers . . . . . . . . . . . . 110
3.8 Characteristic parameters fromMaxwell model applied to DPPC
monolayers . . . . . . . . . . . . . . . . . . . . . . . . . . . . . 114
3.9 A0 parameters of curves a-Π . . . . . . . . . . . . . . . . . . . 115

Riassunto
In questo lavoro si è studiata l'interazione di antibiotici macrolidi con dei
modelli di membrana fosfolipidica. Lo studio dell'interazione di farmaci con
membrane biologiche permette di ottenere informazioni sui meccanismi di
azione dei farmaci, nonchè sui loro e�etti sull'organizzazione molecolare, �u-
idità e permeabilità delle membrane. La modi�cazione delle proprietà mecca-
niche delle membrane per e�etto dei farmaci può in�uenzare processi biologici
connessi, ad esempio, all'endocitosi, di estrema rilevanza in tutti gli organsmi
viventi.
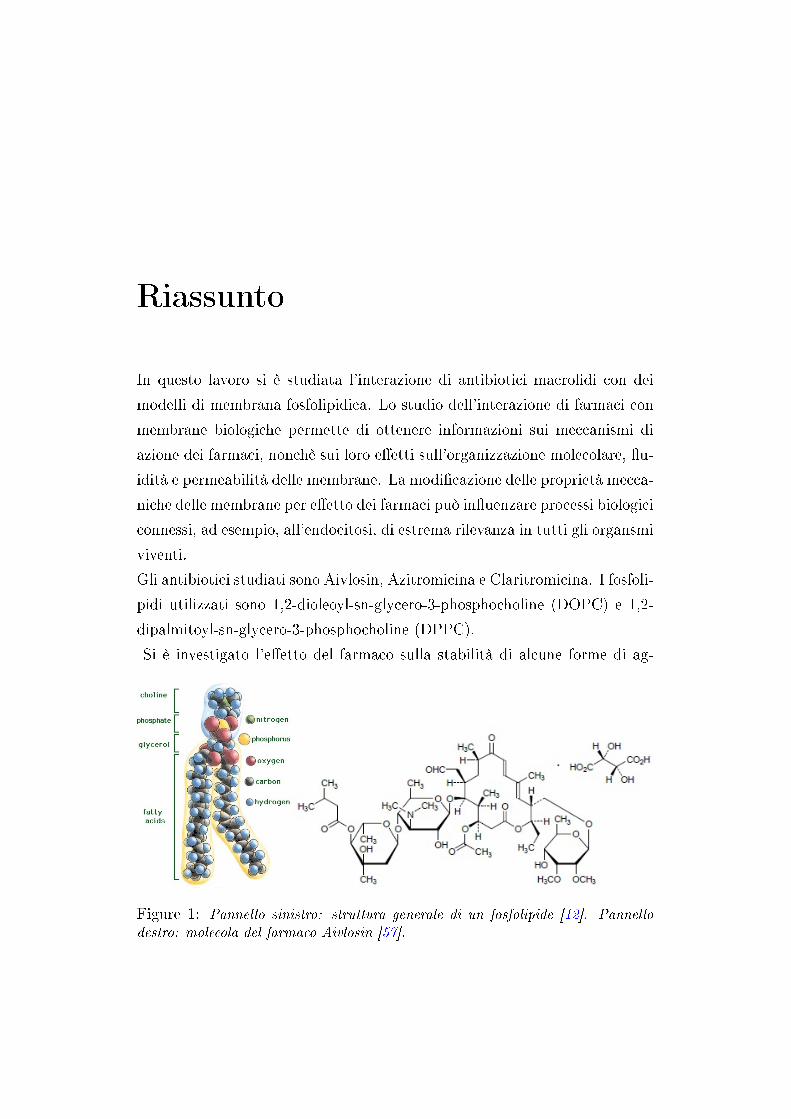
Gli antibiotici studiati sono Aivlosin, Azitromicina e Claritromicina. I fosfoli-
pidi utilizzati sono 1,2-dioleoyl-sn-glycero-3-phosphocholine (DOPC) e 1,2-
dipalmitoyl-sn-glycero-3-phosphocholine (DPPC).
Si è investigato l'e�etto del farmaco sulla stabilità di alcune forme di ag-
Figure 1: Pannello sinistro: struttura generale di un fosfolipide [12]. Pannellodestro: molecola del farmaco Aivlosin [57].
Riassunto 13
gregazione dei fosfolipidi (vescicole unilamellari giganti, GUV e monostrati di
Langmuir) nonchè gli e�etti di tali farmaci sulle proprietà meccaniche quali
il modulo di compressibilità, di bending, di shear.
Le principali tecniche utilizzate sono la microscopia in �uorescenza e a con-
trasto di fase e la reometria di scorrimento interfacciale su monostrato di
Langmuir.
Distribuzioni di taglia di GUV
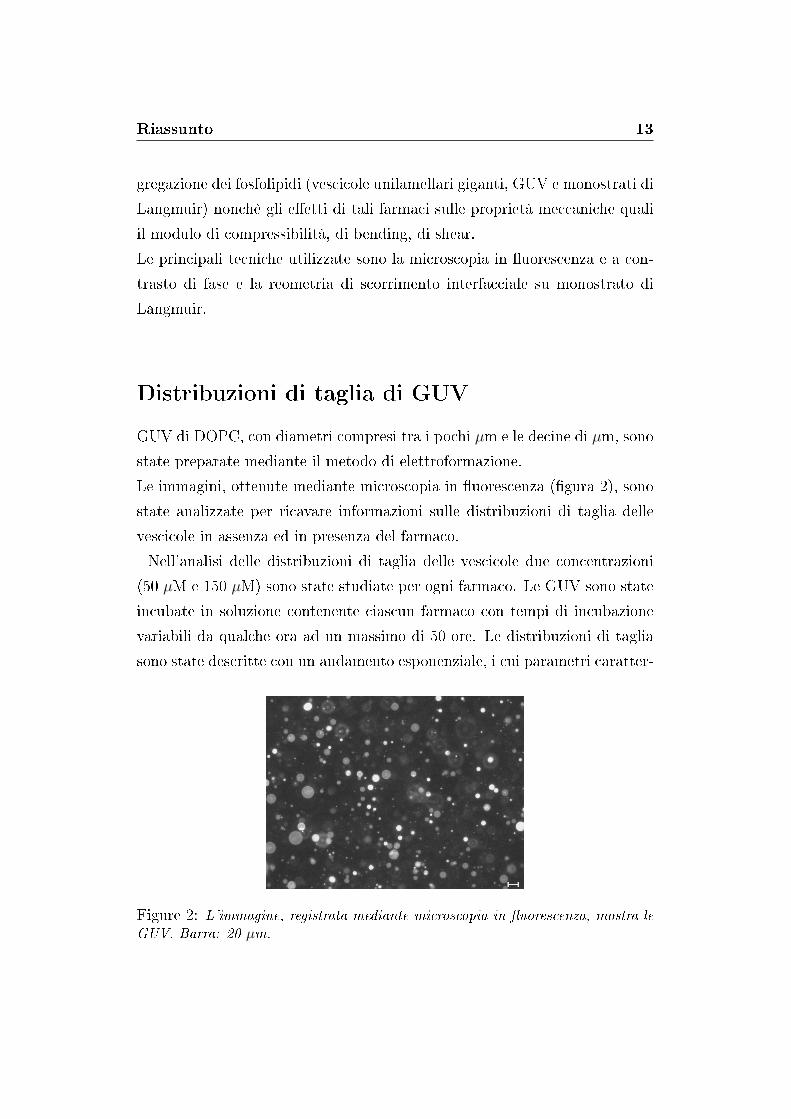
GUV di DOPC, con diametri compresi tra i pochi µm e le decine di µm, sono
state preparate mediante il metodo di elettroformazione.
Le immagini, ottenute mediante microscopia in �uorescenza (�gura 2), sono
state analizzate per ricavare informazioni sulle distribuzioni di taglia delle
vescicole in assenza ed in presenza del farmaco.
Nell'analisi delle distribuzioni di taglia delle vescicole due concentrazioni
(50 µM e 150 µM) sono state studiate per ogni farmaco. Le GUV sono state
incubate in soluzione contenente ciascun farmaco con tempi di incubazione
variabili da qualche ora ad un massimo di 50 ore. Le distribuzioni di taglia
sono state descritte con un andamento esponenziale, i cui parametri caratter-
Figure 2: L'immagine, registrata mediante microscopia in �uorescenza, mostra leGUV. Barra: 20 µm.
Riassunto 14
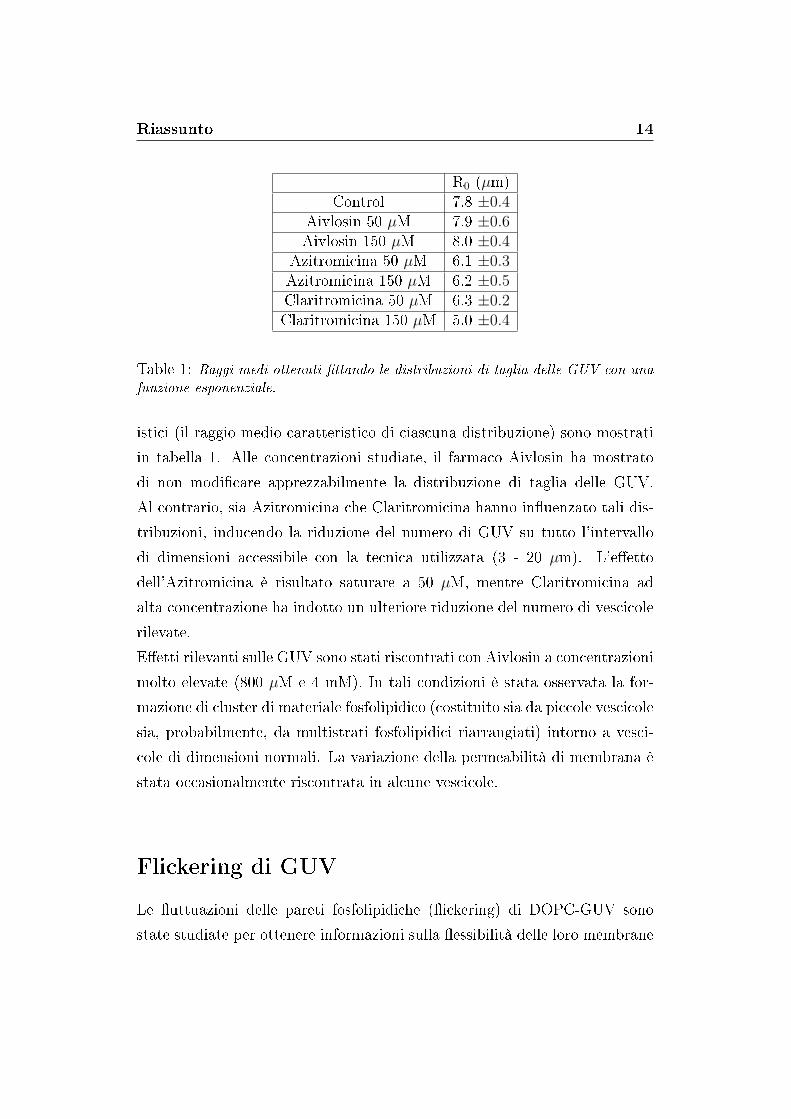
R0 (µm)Control 7.8 ±0.4
Aivlosin 50 µM 7.9 ±0.6Aivlosin 150 µM 8.0 ±0.4
Azitromicina 50 µM 6.1 ±0.3Azitromicina 150 µM 6.2 ±0.5Claritromicina 50 µM 6.3 ±0.2Claritromicina 150 µM 5.0 ±0.4
Table 1: Raggi medi ottenuti �ttando le distribuzioni di taglia delle GUV con unafunzione esponenziale.
istici (il raggio medio caratteristico di ciascuna distribuzione) sono mostrati
in tabella 1. Alle concentrazioni studiate, il farmaco Aivlosin ha mostrato
di non modi�care apprezzabilmente la distribuzione di taglia delle GUV.
Al contrario, sia Azitromicina che Claritromicina hanno in�uenzato tali dis-
tribuzioni, inducendo la riduzione del numero di GUV su tutto l'intervallo
di dimensioni accessibile con la tecnica utilizzata (3 - 20 µm). L'e�etto
dell'Azitromicina è risultato saturare a 50 µM, mentre Claritromicina ad
alta concentrazione ha indotto un ulteriore riduzione del numero di vescicole
rilevate.
E�etti rilevanti sulle GUV sono stati riscontrati con Aivlosin a concentrazioni
molto elevate (800 µM e 4 mM). In tali condizioni è stata osservata la for-
mazione di cluster di materiale fosfolipidico (costituito sia da piccole vescicole
sia, probabilmente, da multistrati fosfolipidici riarrangiati) intorno a vesci-
cole di dimensioni normali. La variazione della permeabilità di membrana è
stata occasionalmente riscontrata in alcune vescicole.
Flickering di GUV
Le �uttuazioni delle pareti fosfolipidiche (�ickering) di DOPC-GUV sono
state studiate per ottenere informazioni sulla �essibilità delle loro membrane
Riassunto 15
0 50 100 1500
5
10
15
κ (kBT)
Fre
quen
za
N = 46
Controllo
0 50 100 1500
5
10
15
κ (kBT)
Fre
quen
za
N = 35
Aivlosin 50µM
0 50 100 1500
5
10
15
κ (kBT)
Fre
quen
zaN = 49
Aivlosin 150µM
0 50 100 1500
5
10
15
κ (kBT)
Fre
quen
za
N = 36
Azitromicina 150µM
0 50 100 1500
5
10
15
κ (kBT)
Fre
quen
za
N = 19
Claritromicina 150µM
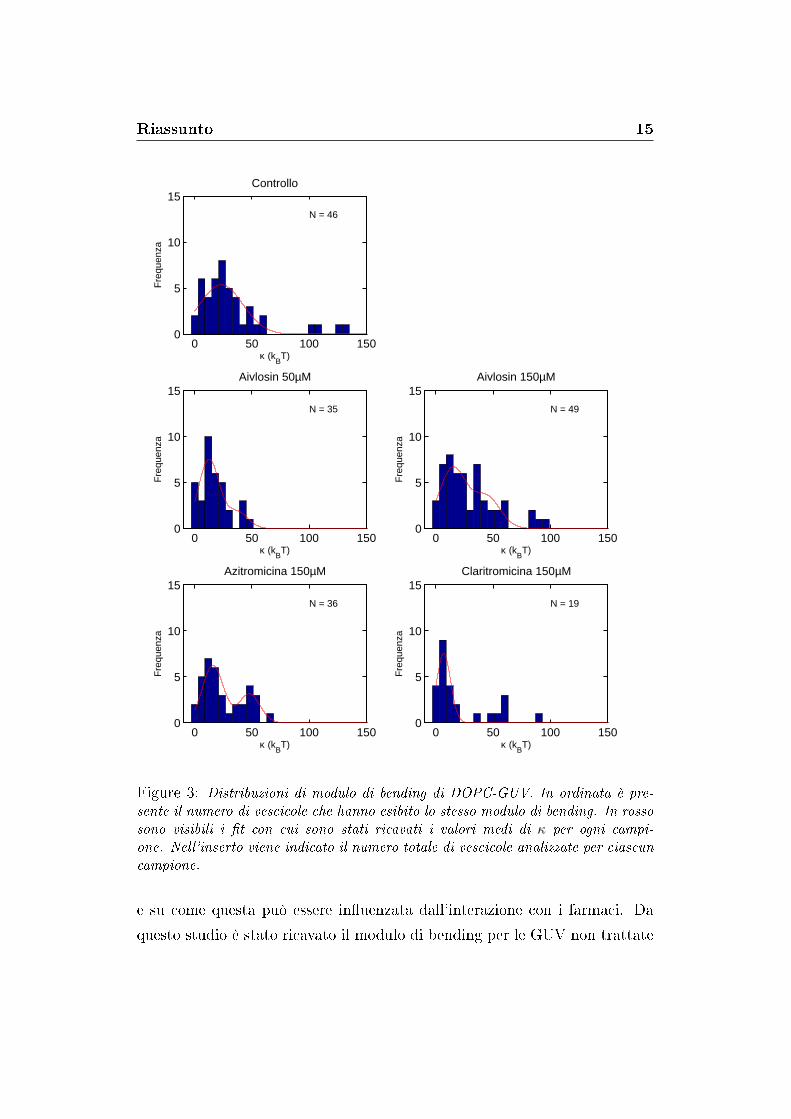
Figure 3: Distribuzioni di modulo di bending di DOPC-GUV. In ordinata è pre-sente il numero di vescicole che hanno esibito lo stesso modulo di bending. In rossosono visibili i �t con cui sono stati ricavati i valori medi di κ per ogni campi-one. Nell'inserto viene indicato il numero totale di vescicole analizzate per ciascuncampione.
e su come questa può essere in�uenzata dall'interazione con i farmaci. Da
questo studio è stato ricavato il modulo di bending per le GUV non trattate
Riassunto 16
con farmaci (23.2 kbT), in ottimo accordo con la letteratura. Tutti gli antibi-
otici studiati hanno indotto un abbassamento di tale modulo. Aivlosin (50
µM e 150 µM) e Azitromicina (150 µM) hanno causato una abbassamento di
κ di pari entità (40%), con saturazione dell'Aivlosin già a 50 µM. Claritro-
micina (150 µM) ha mostrato un e�etto anche più marcato (70%).
Nelle distribuzioni di κ di alcuni campioni (Azitromicina e Aivlosin) si nota
la presenza di picchi distinti centrati su valori multipli del κ fondamentale,
associabili a vescicole multilamellari (�gura 3).
Reologia di monostrati fosfolipidici
Film fosfolipidici di Langmuir sono stati preparati a partire da DPPC.
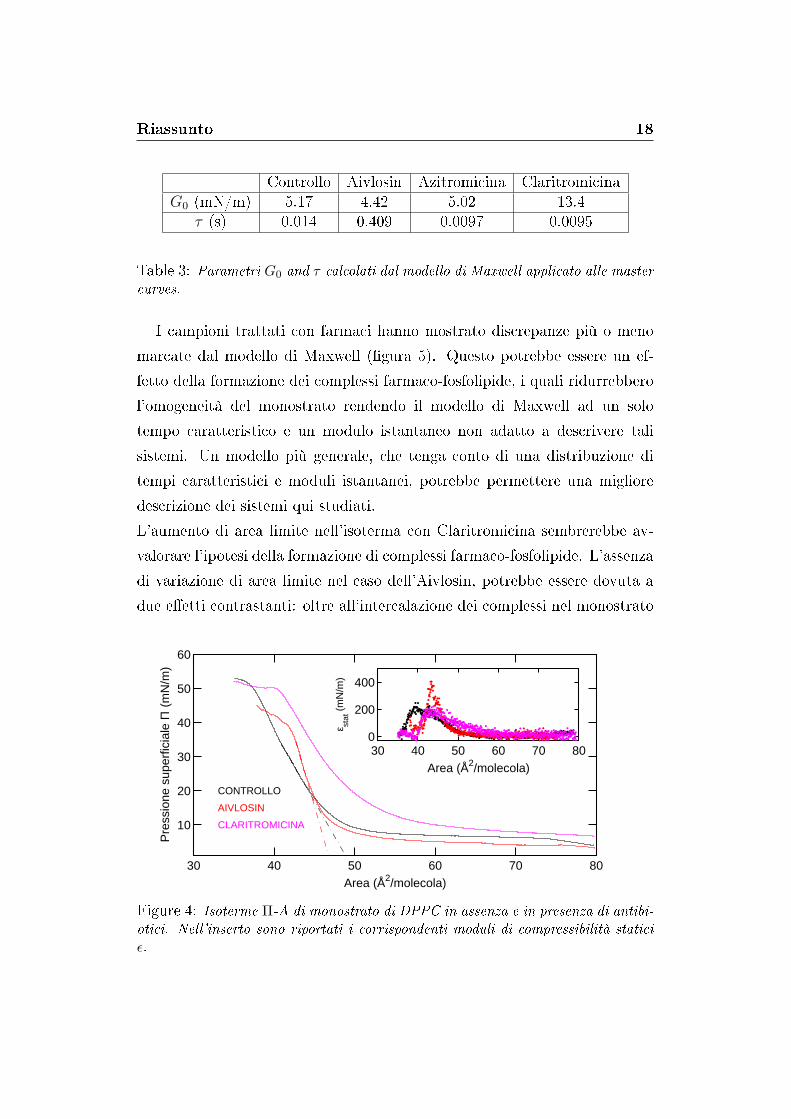
In primo luogo, isoterme Π-A sono state misurate sui monostrati in presenza
e in assenza di Aivlosin e Claritromicina (�gura 4). Esse hanno mostrato
che le fasi caratteristiche di un monostrato fosfolipidico (gas, liquido-espanso,
liquido-compresso, solido) permangono anche dopo l'e�etto dei farmaci. Aivlosin
ha indotto un abbassamento della pressione di collasso, mentre Claritromic-
ina ha mostrato un aumento dell'area limite della fase liquido-compatta. Il
modulo di compressibilità calcolato dalle isoterme ha mostrato un ridotto
e�etto di Claritromicina; al contrario, Aivlosin ha indotto un incremento del
modulo di compressibilità (�gura 4, inserto).
Il monostrato di DPPC ha mostrato un comportamento visco-elastico, ben
descritto dal modello di Maxwell (sull'intero range di frequenze analizzato).
E' stato ipotizzato di poter generalizzare il principio di sovrapposizione tempo-
temperatura al caso tempo-pressione super�ciale (sulla base di considerazioni
simili a quelle su cui si basa la teoria del volume escluso per la transizione
vetrosa). Tale ipotesi consiste nel traslare lungo l'asse delle frequenze in plot
log-log dati ottenuti a di�erenti temperature, sovrapponendoli a quelli rela-
tivi ad una temperatura di riferimento: fattori di traslazione dipendenti dalla
temperatura vengono applicati a tutti i dati. Il risultato di questa procedura
Riassunto 17
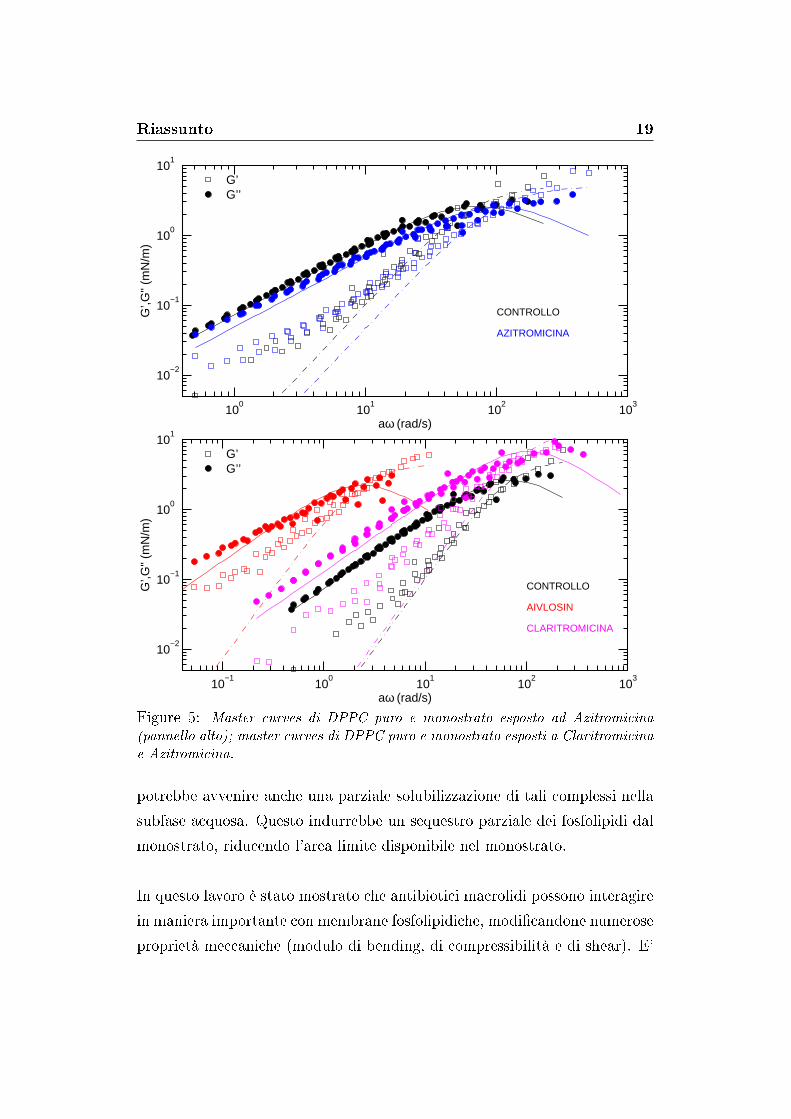
viene de�nito master curve. Questo metodo è stato applicato allo studio
del modulo di scorrimento viscoso G∗ dei monostrati: questo ha permesso
di avere accesso ad un intervallo di frequenze più ampio di quello altrimenti
accessibile e di generare le master curves.
Le master curves, nel limite di basse frequenze, sono descritte dal modello
Newtoniano, cioè da una modulo di scorrimento viscoso G" proporzionale
alla frequenza ovvero da una viscosità bidimensionale η2D indipendente dalla
frequenza.
L'analisi di G∗ ha mostrato e�etti rilevanti da parte di Aivlosin e Claritro-
micina. In tabella 2 sono riportati i valori di η2D. In particolare, Aivlosin è
risultato l'antibiotico con il maggiore e�etto sul monostrato, inducendo un
grande aumento della sua viscosità. Claritromicina ha mostrato un e�etto
analogo, seppure meno marcato. Azitromicina, al contrario, non ha mostrato
e�etti misurabili sulla viscosità del monostrato.
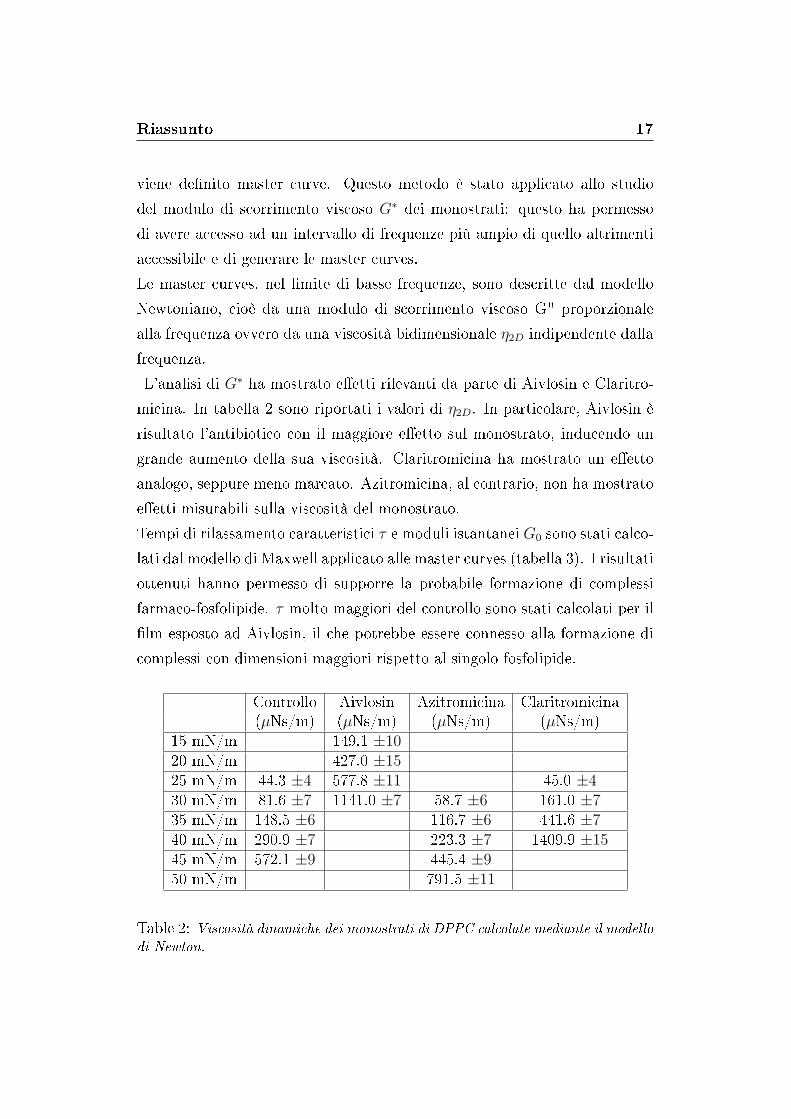
Tempi di rilassamento caratteristici τ e moduli istantanei G0 sono stati calco-
lati dal modello di Maxwell applicato alle master curves (tabella 3). I risultati
ottenuti hanno permesso di supporre la probabile formazione di complessi
farmaco-fosfolipide. τ molto maggiori del controllo sono stati calcolati per il
�lm esposto ad Aivlosin, il che potrebbe essere connesso alla formazione di
complessi con dimensioni maggiori rispetto al singolo fosfolipide.
Controllo Aivlosin Azitromicina Claritromicina(µNs/m) (µNs/m) (µNs/m) (µNs/m)
15 mN/m 149.1 ±1020 mN/m 427.0 ±1525 mN/m 44.3 ±4 577.8 ±11 45.0 ±430 mN/m 81.6 ±7 1141.0 ±7 58.7 ±6 161.0 ±735 mN/m 148.5 ±6 116.7 ±6 441.6 ±740 mN/m 290.9 ±7 223.3 ±7 1409.9 ±1545 mN/m 572.1 ±9 445.4 ±9 -50 mN/m 791.5 ±11
Table 2: Viscosità dinamiche dei monostrati di DPPC calcolate mediante il modellodi Newton.
Riassunto 18
Controllo Aivlosin Azitromicina ClaritromicinaG0 (mN/m) 5.17 4.42 5.02 13.4
τ (s) 0.014 0.409 0.0097 0.0095
Table 3: Parametri G0 and τ calcolati dal modello di Maxwell applicato alle mastercurves.
I campioni trattati con farmaci hanno mostrato discrepanze più o meno
marcate dal modello di Maxwell (�gura 5). Questo potrebbe essere un ef-
fetto della formazione dei complessi farmaco-fosfolipide, i quali ridurrebbero
l'omogeneità del monostrato rendendo il modello di Maxwell ad un solo
tempo caratteristico e un modulo istantaneo non adatto a descrivere tali
sistemi. Un modello più generale, che tenga conto di una distribuzione di
tempi caratteristici e moduli istantanei, potrebbe permettere una migliore
descrizione dei sistemi qui studiati.
L'aumento di area limite nell'isoterma con Claritromicina sembrerebbe av-
valorare l'ipotesi della formazione di complessi farmaco-fosfolipide. L'assenza
di variazione di area limite nel caso dell'Aivlosin, potrebbe essere dovuta a
due e�etti contrastanti: oltre all'intercalazione dei complessi nel monostrato
30 40 50 60 70 80
10
20
30
40
50
60
CONTROLLO
AIVLOSIN
Area (Å2/molecola)
Pre
ssio
ne s
uper
ficia
le Π
(m
N/m
)
CLARITROMICINA
30 40 50 60 70 800
200
400
ε stat
(m
N/m
)
Area (Å2/molecola)
Figure 4: Isoterme Π-A di monostrato di DPPC in assenza e in presenza di antibi-otici. Nell'inserto sono riportati i corrispondenti moduli di compressibilità staticiε.
Riassunto 19
100
101
102
103
10−2
10−1
100
101
aω (rad/s)
G’,G
" (m
N/m
)
CONTROLLO
AZITROMICINA
G’G’’
10−1
100
101
102
103
10−2
10−1
100
101
aω (rad/s)
G’,G
" (m
N/m
)
CONTROLLO
AIVLOSIN
CLARITROMICINA
G’G’’
Figure 5: Master curves di DPPC puro e monostrato esposto ad Azitromicina(pannello alto); master curves di DPPC puro e monostrato esposti a Claritromicinae Azitromicina.
potrebbe avvenire anche una parziale solubilizzazione di tali complessi nella
subfase acquosa. Questo indurrebbe un sequestro parziale dei fosfolipidi dal
monostrato, riducendo l'area limite disponibile nel monostrato.
In questo lavoro è stato mostrato che antibiotici macrolidi possono interagire
in maniera importante con membrane fosfolipidiche, modi�candone numerose
proprietà meccaniche (modulo di bending, di compressibilità e di shear). E'
Riassunto 20
stato ipotizzato che, tra gli antibiotici studiati, Aivlosin sia quello con il mag-
giore carattere idrofobico.
Ad oggi, la reometria super�ciale è una tecnica utilizzata poco comunemente
per lo studio di sistemi fosfolipidici modello. Il suo utilizzo in questo lavoro
assume, quindi, una particolare rilevanza dal punto di vista dell'innovazione
e del progresso nello studio di sistemi fosfolipidici.

Introduction
Arti�cial phospholipid systems, such as Langmuir monolayers spread on ac-
queous surfaces, nanometer- or micrometer-sized vesicles and supported bi-
layers, provide a model system representing particular aspects of essential
similarity to the cellular plasma membrane bilayer. These model systems
are widely used to investigate the properties of biological membranes and
associated processes such as molecular recognition, enzymatic catalysis, cell
adhesion and membrane fusion [1][2][3]. In the case of micrometer-sized vesi-
cles, the properties of the membrane and its constituents are directly related
to the vesicle shape and size, which can be easily observed by optical mi-
croscopy.
Model membranes have also been extensively used in pharmaceutical research
on drug-delivery systems and provide assays for studying drug-membrane,
lipid-lipid, lipid-protein interactions [4]. Experimental work on arti�cial
membranes has also demonstrated that the membrane properties may be af-
fected strongly by the presence of membrane associated molecules. Examples
of membrane properties that can be a�ected by drug-membrane interactions
include the conformation of acyl groups, the membrane surface and thick-
ness, the phase transition temperature, the membrane potential, hydration
of head groups and the membrane fusion properties [5].
The main goal of this work is to investigate the e�ect of macrolide antibi-
otics on model lipid membranes (tens-of-micron sized vesicles), with particu-
lar regard to their size distributions, mechanical properties and thermotropic
Introduction 23
behaviour.
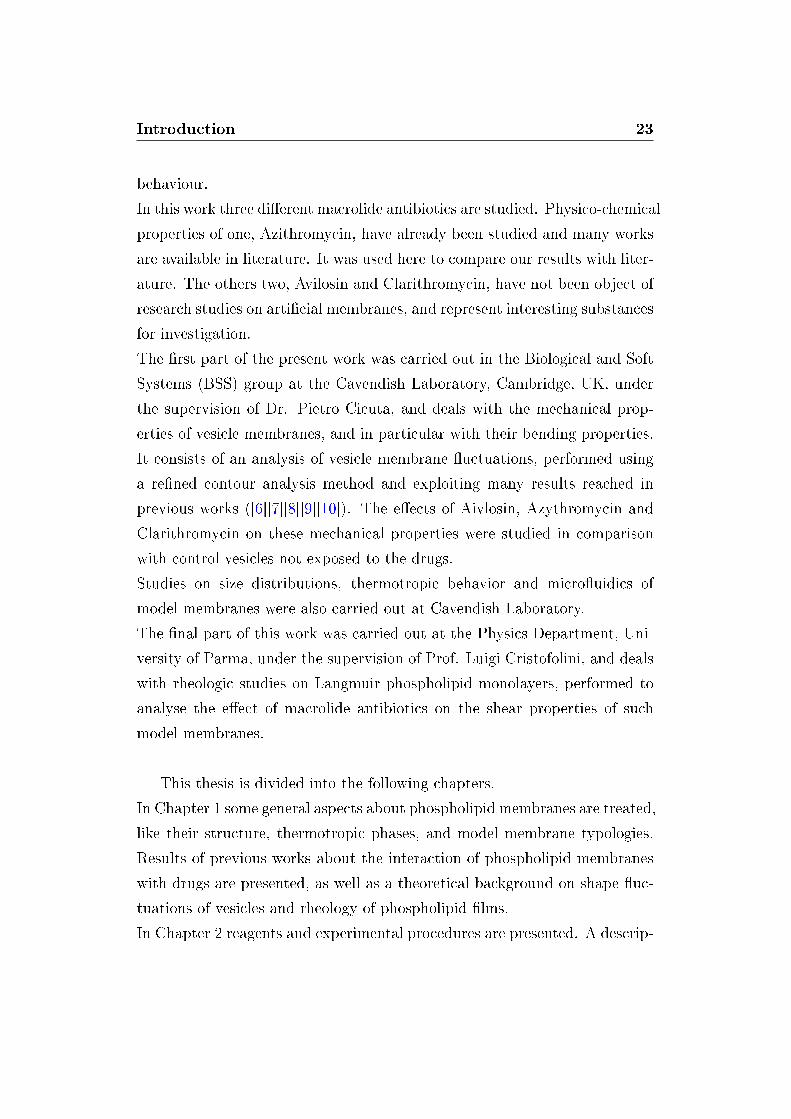
In this work three di�erent macrolide antibiotics are studied. Physico-chemical
properties of one, Azithromycin, have already been studied and many works
are available in literature. It was used here to compare our results with liter-
ature. The others two, Avilosin and Clarithromycin, have not been object of
research studies on arti�cial membranes, and represent interesting substances
for investigation.
The �rst part of the present work was carried out in the Biological and Soft
Systems (BSS) group at the Cavendish Laboratory, Cambridge, UK, under
the supervision of Dr. Pietro Cicuta, and deals with the mechanical prop-
erties of vesicle membranes, and in particular with their bending properties.
It consists of an analysis of vesicle membrane �uctuations, performed using
a re�ned contour analysis method and exploiting many results reached in
previous works ([6][7][8][9][10]). The e�ects of Aivlosin, Azythromycin and
Clarithromycin on these mechanical properties were studied in comparison
with control vesicles not exposed to the drugs.
Studies on size distributions, thermotropic behavior and micro�uidics of
model membranes were also carried out at Cavendish Laboratory.
The �nal part of this work was carried out at the Physics Department, Uni-
versity of Parma, under the supervision of Prof. Luigi Cristofolini, and deals
with rheologic studies on Langmuir phospholipid monolayers, performed to
analyse the e�ect of macrolide antibiotics on the shear properties of such
model membranes.
This thesis is divided into the following chapters.
In Chapter 1 some general aspects about phospholipid membranes are treated,
like their structure, thermotropic phases, and model membrane typologies.
Results of previous works about the interaction of phospholipid membranes
with drugs are presented, as well as a theoretical background on shape �uc-
tuations of vesicles and rheology of phospholipid �lms.
In Chapter 2 reagents and experimental procedures are presented. A descrip-
Introduction 24
tion of the protocol to prepare giant unilamellar vesicles and the experimental
procedures (optical microscopy, di�erential scanning calorimentry, micro�u-
idics, and interfacial stress rheology) used in this work are given. Then the
algorithms used to detect the vesicle sizes and contours, and to analyse the
ISR data are described.
In Chapter 3 results of analysis are outlined. Size distributions and �ickering
analysis results are presented in detail, followed from sections with results
about calorimetric and micro�uidic channels experiments. Finally, rheology
of monolayers is also described.
In Chapter 4 experimental results are discussed. A possible mechanism of
interaction of the antibiotics with phospholipid model membranes is also pro-
posed.
In Chapter 5 the results obtained here are brie�y summarized.

Chapter 1
Physical properties and
pharmacology of lipid membranes
1.1 Phospholipids
Phospholipids are a class of lipids and are the main component of all cell
membranes, as they can form lipid bilayers.
Most of the phospholipids studied to date consist of two hydrophobic hy-
drocarbon chains, a glycerol backbone and a hydrophilic headgroup. So a
phospholipid molecule can be schematically thought as made of a hydrophilic
headgroup and a hydrophobic tail: the result is an amphiphilic molecule [11]
(see �gure 1.1).
The polar head group contains one or more negatively charged phosphate
groups, and may contain other polar groups.
The hydrophobic tail is made up of two fatty acyl chains, usually containing
an even number of carbon atoms in biomembranes [11]. The carbon atoms
may be saturated (neighboring C atoms are all connected by single bonds)
or unsaturated (some neighboring C atoms are connected by double bonds).
Phospholipids are surfactants, compounds that lower the surface tension of
a liquid or the interfacial tension between two liquids, or a liquid and a solid
because of their amphiphilic nature.
1.2 Polymorphic phases of phospholipids 27
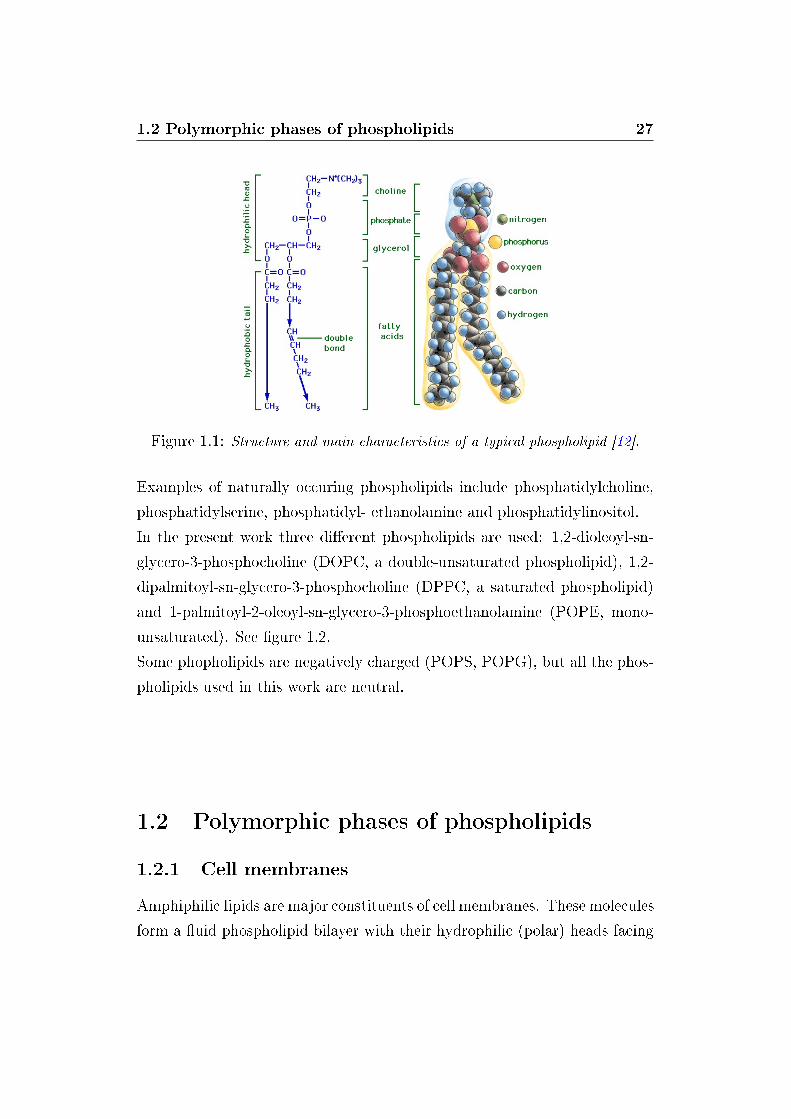
Figure 1.1: Structure and main characteristics of a typical phospholipid [12].
Examples of naturally occuring phospholipids include phosphatidylcholine,
phosphatidylserine, phosphatidyl- ethanolamine and phosphatidylinositol.
In the present work three di�erent phospholipids are used: 1,2-dioleoyl-sn-
glycero-3-phosphocholine (DOPC, a double-unsaturated phospholipid), 1,2-
dipalmitoyl-sn-glycero-3-phosphocholine (DPPC, a saturated phospholipid)
and 1-palmitoyl-2-oleoyl-sn-glycero-3-phosphoethanolamine (POPE, mono-
unsaturated). See �gure 1.2.
Some phopholipids are negatively charged (POPS, POPG), but all the phos-
pholipids used in this work are neutral.
1.2 Polymorphic phases of phospholipids
1.2.1 Cell membranes
Amphiphilic lipids are major constituents of cell membranes. These molecules
form a �uid phospholipid bilayer with their hydrophilic (polar) heads facing
1.2 Polymorphic phases of phospholipids 28
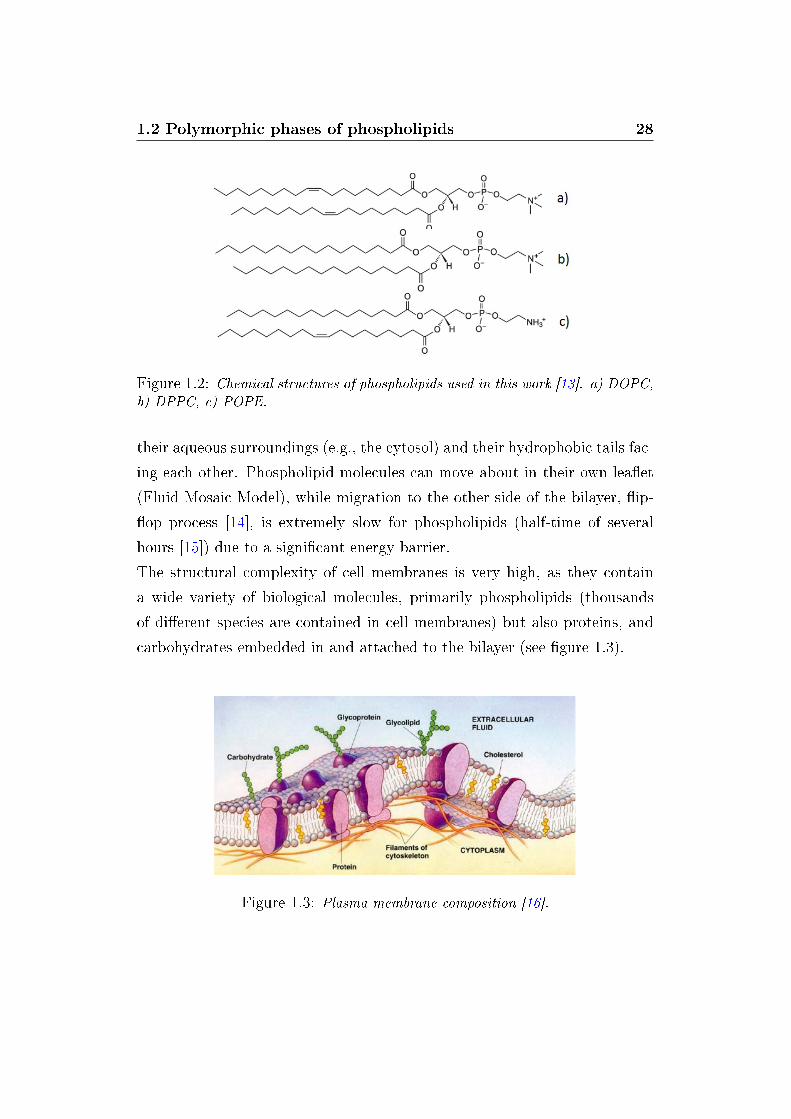
Figure 1.2: Chemical structures of phospholipids used in this work [13]. a) DOPC,b) DPPC, c) POPE.
their aqueous surroundings (e.g., the cytosol) and their hydrophobic tails fac-
ing each other. Phospholipid molecules can move about in their own lea�et
(Fluid Mosaic Model), while migration to the other side of the bilayer, �ip-
�op process [14], is extremely slow for phospholipids (half-time of several
hours [15]) due to a signi�cant energy barrier.
The structural complexity of cell membranes is very high, as they contain
a wide variety of biological molecules, primarily phospholipids (thousands
of di�erent species are contained in cell membranes) but also proteins, and
carbohydrates embedded in and attached to the bilayer (see �gure 1.3).
Figure 1.3: Plasma membrane composition [16].
1.2 Polymorphic phases of phospholipids 29
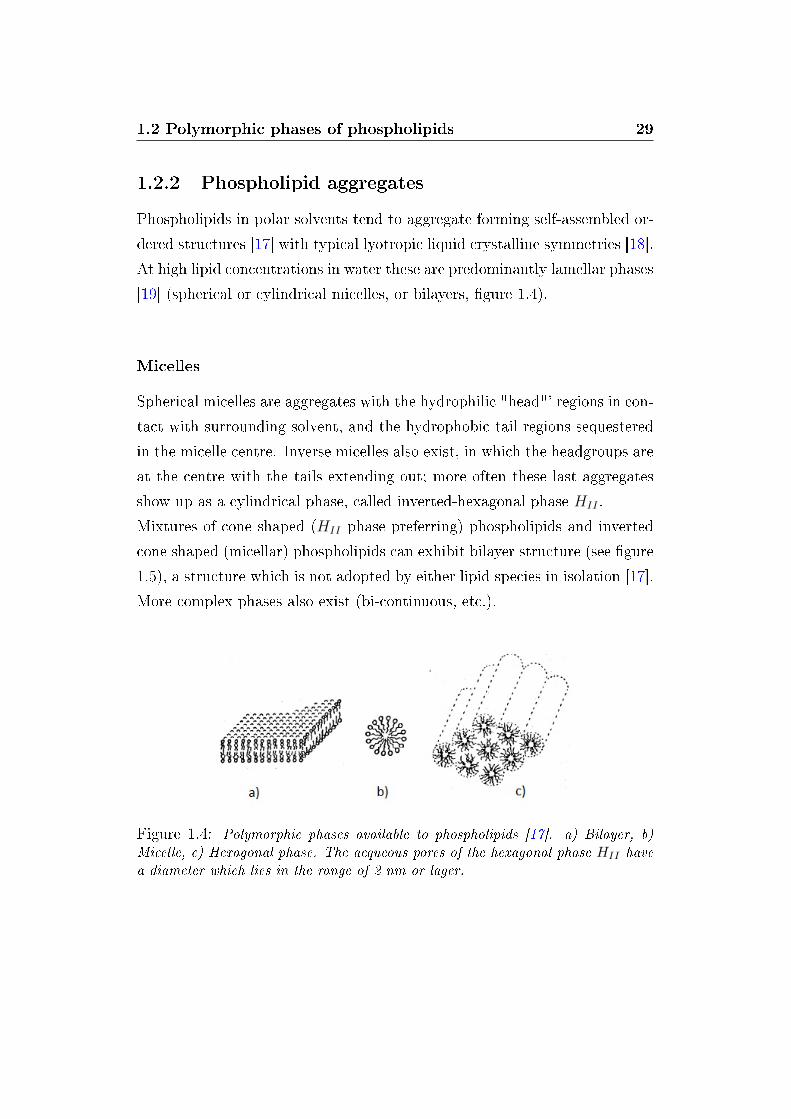
1.2.2 Phospholipid aggregates
Phospholipids in polar solvents tend to aggregate forming self-assembled or-
dered structures [17] with typical lyotropic liquid crystalline symmetries [18].
At high lipid concentrations in water these are predominantly lamellar phases
[19] (spherical or cylindrical micelles, or bilayers, �gure 1.4).
Micelles
Spherical micelles are aggregates with the hydrophilic "head"' regions in con-
tact with surrounding solvent, and the hydrophobic tail regions sequestered
in the micelle centre. Inverse micelles also exist, in which the headgroups are
at the centre with the tails extending out; more often these last aggregates
show up as a cylindrical phase, called inverted-hexagonal phase HII .
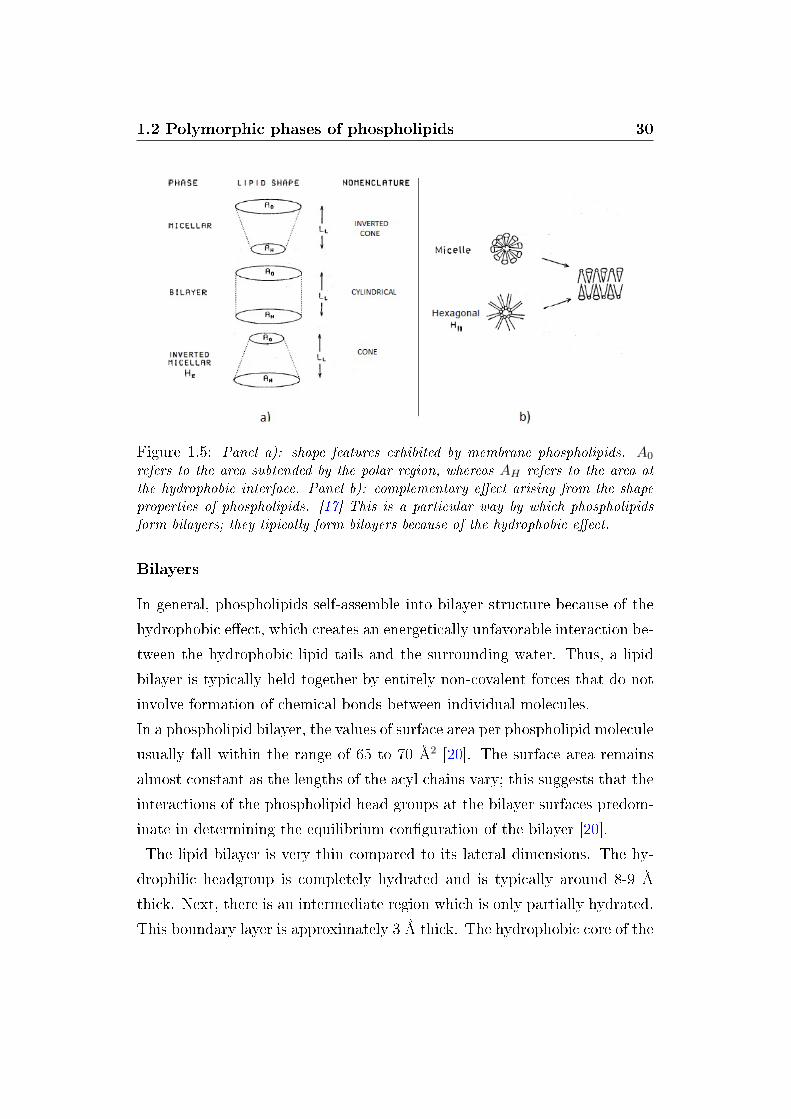
Mixtures of cone shaped (HII phase preferring) phospholipids and inverted
cone shaped (micellar) phospholipids can exhibit bilayer structure (see �gure
1.5), a structure which is not adopted by either lipid species in isolation [17].
More complex phases also exist (bi-continuous, etc.).
Figure 1.4: Polymorphic phases available to phospholipids [17]. a) Bilayer, b)Micelle, c) Hexagonal phase. The acqueous pores of the hexagonal phase HII havea diameter which lies in the range of 2 nm or lager.
1.2 Polymorphic phases of phospholipids 30
Figure 1.5: Panel a): shape features exhibited by membrane phospholipids. A0
refers to the area subtended by the polar region, whereas AH refers to the area atthe hydrophobic interface. Panel b): complementary e�ect arising from the shapeproperties of phospholipids. [17] This is a particular way by which phospholipidsform bilayers; they tipically form bilayers because of the hydrophobic e�ect.
Bilayers
In general, phospholipids self-assemble into bilayer structure because of the
hydrophobic e�ect, which creates an energetically unfavorable interaction be-
tween the hydrophobic lipid tails and the surrounding water. Thus, a lipid
bilayer is typically held together by entirely non-covalent forces that do not
involve formation of chemical bonds between individual molecules.
In a phospholipid bilayer, the values of surface area per phospholipid molecule
usually fall within the range of 65 to 70 Å2 [20]. The surface area remains
almost constant as the lengths of the acyl chains vary; this suggests that the
interactions of the phospholipid head groups at the bilayer surfaces predom-
inate in determining the equilibrium con�guration of the bilayer [20].
The lipid bilayer is very thin compared to its lateral dimensions. The hy-
drophilic headgroup is completely hydrated and is typically around 8-9 Å
thick. Next, there is an intermediate region which is only partially hydrated.
This boundary layer is approximately 3 Å thick. The hydrophobic core of the
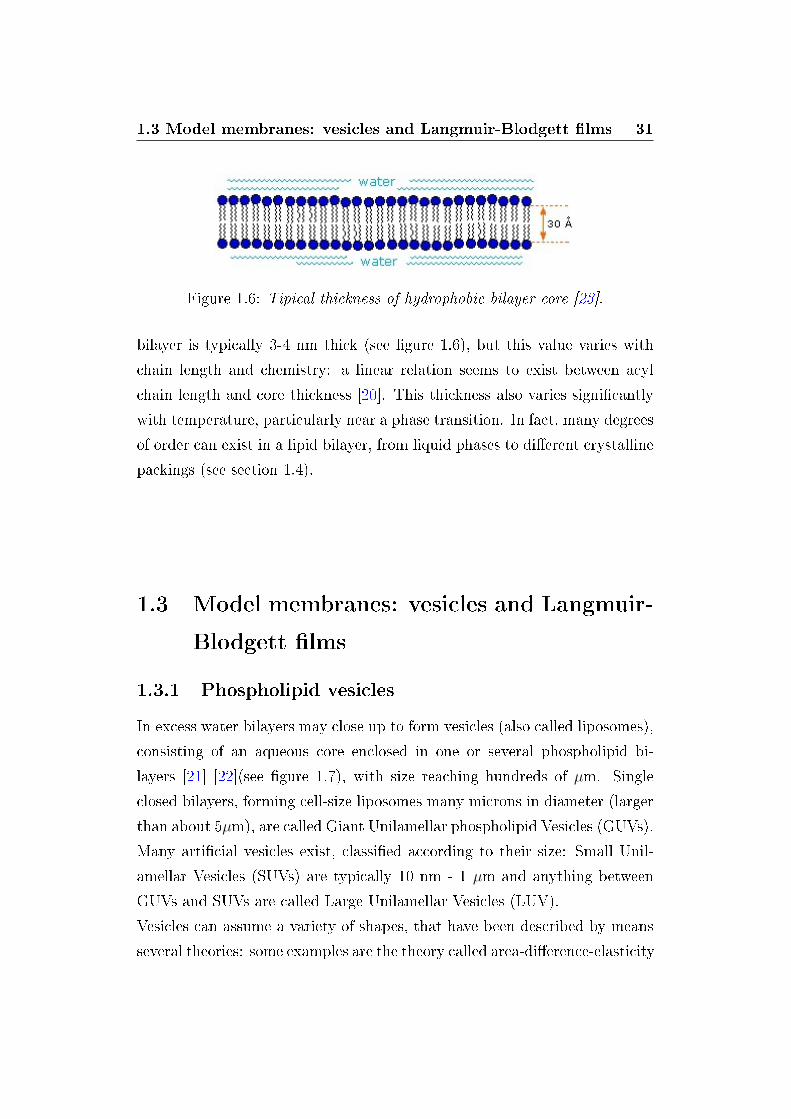
1.3 Model membranes: vesicles and Langmuir-Blodgett �lms 31
Figure 1.6: Tipical thickness of hydrophobic bilayer core [23].
bilayer is typically 3-4 nm thick (see �gure 1.6), but this value varies with
chain length and chemistry: a linear relation seems to exist between acyl
chain length and core thickness [20]. This thickness also varies signi�cantly
with temperature, particularly near a phase transition. In fact, many degrees
of order can exist in a lipid bilayer, from liquid phases to di�erent crystalline
packings (see section 1.4).
1.3 Model membranes: vesicles and Langmuir-
Blodgett �lms
1.3.1 Phospholipid vesicles
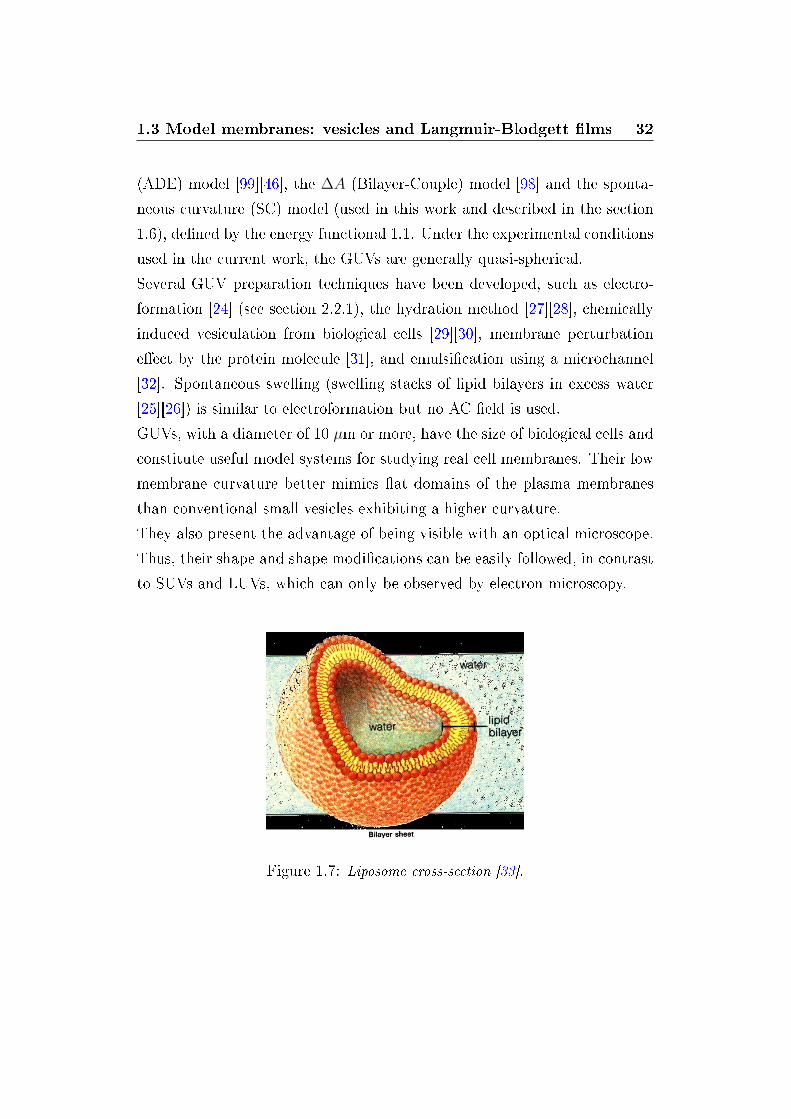
In excess water bilayers may close up to form vesicles (also called liposomes),
consisting of an aqueous core enclosed in one or several phospholipid bi-
layers [21] [22](see �gure 1.7), with size reaching hundreds of µm. Single
closed bilayers, forming cell-size liposomes many microns in diameter (larger
than about 5µm), are called Giant Unilamellar phospholipid Vesicles (GUVs).
Many arti�cial vesicles exist, classi�ed according to their size: Small Unil-
amellar Vesicles (SUVs) are typically 10 nm - 1 µm and anything between
GUVs and SUVs are called Large Unilamellar Vesicles (LUV).
Vesicles can assume a variety of shapes, that have been described by means
several theories: some examples are the theory called area-di�erence-elasticity
1.3 Model membranes: vesicles and Langmuir-Blodgett �lms 32
(ADE) model [99][46], the ∆A (Bilayer-Couple) model [98] and the sponta-
neous curvature (SC) model (used in this work and described in the section
1.6), de�ned by the energy functional 1.1. Under the experimental conditions
used in the current work, the GUVs are generally quasi-spherical.
Several GUV preparation techniques have been developed, such as electro-
formation [24] (see section 2.2.1), the hydration method [27][28], chemically
induced vesiculation from biological cells [29][30], membrane perturbation
e�ect by the protein molecule [31], and emulsi�cation using a microchannel
[32]. Spontaneous swelling (swelling stacks of lipid bilayers in excess water
[25][26]) is similar to electroformation but no AC �eld is used.
GUVs, with a diameter of 10 µm or more, have the size of biological cells and
constitute useful model systems for studying real cell membranes. Their low
membrane curvature better mimics �at domains of the plasma membranes
than conventional small vesicles exhibiting a higher curvature.
They also present the advantage of being visible with an optical microscope.
Thus, their shape and shape modi�cations can be easily followed, in contrast
to SUVs and LUVs, which can only be observed by electron microscopy.
Figure 1.7: Liposome cross-section [33].
1.3 Model membranes: vesicles and Langmuir-Blodgett �lms 33
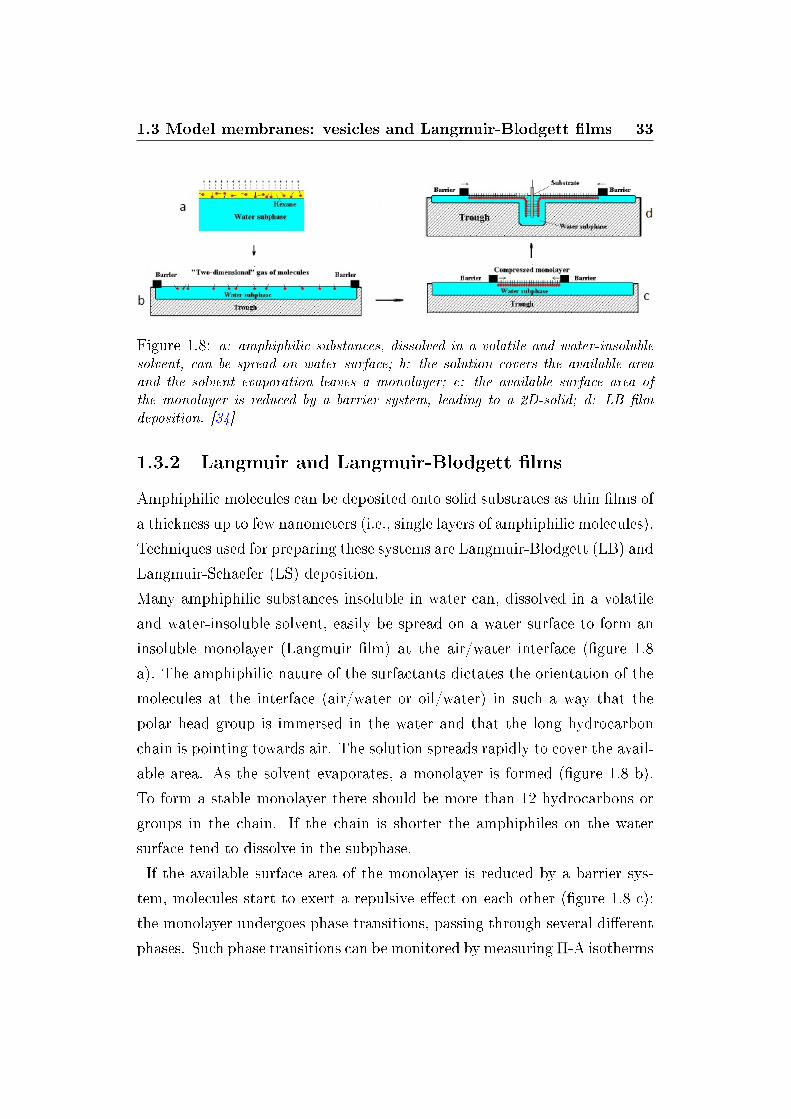
Figure 1.8: a: amphiphilic substances, dissolved in a volatile and water-insolublesolvent, can be spread on water surface; b: the solution covers the available areaand the solvent evaporation leaves a monolayer; c: the available surface area ofthe monolayer is reduced by a barrier system, leading to a 2D-solid; d: LB �lmdeposition. [34]
1.3.2 Langmuir and Langmuir-Blodgett �lms
Amphiphilic molecules can be deposited onto solid substrates as thin �lms of
a thickness up to few nanometers (i.e., single layers of amphiphilic molecules).
Techniques used for preparing these systems are Langmuir-Blodgett (LB) and
Langmuir-Schaefer (LS) deposition.
Many amphiphilic substances insoluble in water can, dissolved in a volatile
and water-insoluble solvent, easily be spread on a water surface to form an
insoluble monolayer (Langmuir �lm) at the air/water interface (�gure 1.8
a). The amphiphilic nature of the surfactants dictates the orientation of the
molecules at the interface (air/water or oil/water) in such a way that the
polar head group is immersed in the water and that the long hydrocarbon
chain is pointing towards air. The solution spreads rapidly to cover the avail-
able area. As the solvent evaporates, a monolayer is formed (�gure 1.8 b).
To form a stable monolayer there should be more than 12 hydrocarbons or
groups in the chain. If the chain is shorter the amphiphiles on the water
surface tend to dissolve in the subphase.
If the available surface area of the monolayer is reduced by a barrier sys-
tem, molecules start to exert a repulsive e�ect on each other (�gure 1.8 c):
the monolayer undergoes phase transitions, passing through several di�erent
phases. Such phase transitions can be monitored by measuring Π-A isotherms
1.3 Model membranes: vesicles and Langmuir-Blodgett �lms 34
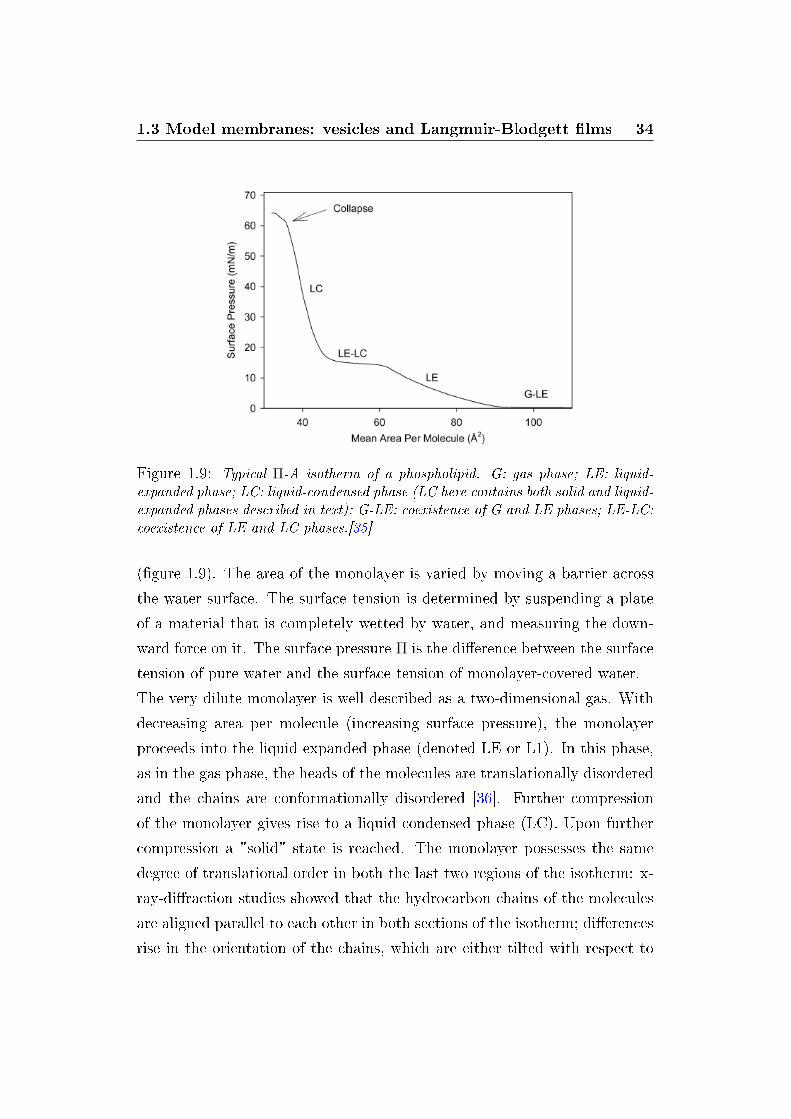
Figure 1.9: Typical Π-A isotherm of a phospholipid. G: gas phase; LE: liquid-expanded phase; LC: liquid-condensed phase (LC here contains both solid and liquid-expanded phases described in text); G-LE: coexistence of G and LE phases; LE-LC:coexistence of LE and LC phases.[35]
(�gure 1.9). The area of the monolayer is varied by moving a barrier across
the water surface. The surface tension is determined by suspending a plate
of a material that is completely wetted by water, and measuring the down-
ward force on it. The surface pressure Π is the di�erence between the surface
tension of pure water and the surface tension of monolayer-covered water.
The very dilute monolayer is well described as a two-dimensional gas. With
decreasing area per molecule (increasing surface pressure), the monolayer
proceeds into the liquid expanded phase (denoted LE or L1). In this phase,
as in the gas phase, the heads of the molecules are translationally disordered
and the chains are conformationally disordered [36]. Further compression
of the monolayer gives rise to a liquid condensed phase (LC). Upon further
compression a "solid" state is reached. The monolayer possesses the same
degree of translational order in both the last two regions of the isotherm: x-
ray-di�raction studies showed that the hydrocarbon chains of the molecules
are aligned parallel to each other in both sections of the isotherm; di�erences
rise in the orientation of the chains, which are either tilted with respect to
1.4 Phase transitions in lipid bilayers 35
the water surface or perpendicular to it [36]. The monolayer is relatively
easily compressible in the tilted state, where decrease of the surface area can
be accomodated by decreasing the tilt angle. In the untitled state, the dis-
tance between close-packed vertical molecules determines the areal density,
and so such phases are much less compressible. The two "condensed" regions
of the isotherms can also be distinguished by calling them tilted condensed
and untitled condensed. Further compression induces the �lm to collapse,
forming a three-dimensional structure (of poor experimental reproducibility).
The pressure corresponding to the equilibrium between the solid and the col-
lapsed monolayer is called collapse pressure.
The deposition of this �lm on a solid substrate can be carried out by succes-
sive dipping of a vertical substrate up and down through a compressed at the
air-water interface; simultaneously the surface pressure is kept constant by
a computer controlled feedback system (�gure 1.8 d). In this way multilayer
structures (LB �lms), of up to hundreds of layers thick, can be produced by
repeated dipping.
On the other hand, the deposition of LS �lms can be achieved by repeatedly
touching the surface of the compressed monolayer on the water subphase by
an almost horizontal solid substrate.
1.4 Phase transitions in lipid bilayers
The phase behaviour of lipid bilayers is largely determined by the strength
of the attractive Van der Waals interactions between adjacent lipid molecules.
The interaction area is larger in longer tailed lipids: this increases the strength
of this interaction, and consequently decreases the lipid mobility. Thus, at a
given temperature, a short-tailed lipid will be more �uid than an otherwise
identical long-tailed phospholipid [38].
Transition temperature can also be a�ected by the degree of unsaturation of
1.4 Phase transitions in lipid bilayers 36
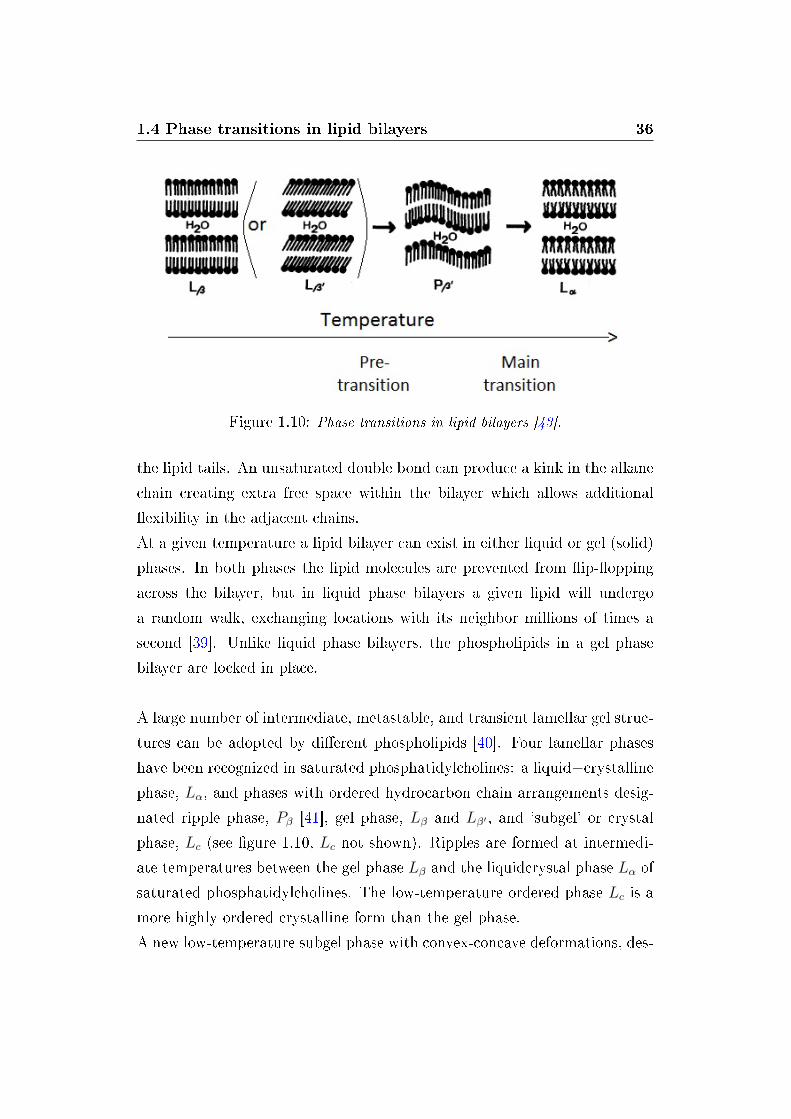
Figure 1.10: Phase transitions in lipid bilayers [43].
the lipid tails. An unsaturated double bond can produce a kink in the alkane
chain creating extra free space within the bilayer which allows additional
�exibility in the adjacent chains.
At a given temperature a lipid bilayer can exist in either liquid or gel (solid)
phases. In both phases the lipid molecules are prevented from �ip-�opping
across the bilayer, but in liquid phase bilayers a given lipid will undergo
a random walk, exchanging locations with its neighbor millions of times a
second [39]. Unlike liquid phase bilayers, the phospholipids in a gel phase
bilayer are locked in place.
A large number of intermediate, metastable, and transient lamellar gel struc-
tures can be adopted by di�erent phospholipids [40]. Four lamellar phases
have been recognized in saturated phosphatidylcholines: a liquid−crystallinephase, Lα, and phases with ordered hydrocarbon chain arrangements desig-
nated ripple phase, Pβ [41], gel phase, Lβ and Lβ′ , and 'subgel' or crystal
phase, Lc (see �gure 1.10, Lc not shown). Ripples are formed at intermedi-
ate temperatures between the gel phase Lβ and the liquidcrystal phase Lα of
saturated phosphatidylcholines. The low-temperature ordered phase Lc is a
more highly ordered crystalline form than the gel phase.
A new low-temperature subgel phase with convex-concave deformations, des-
1.5 Interactions of drugs with model membranes 37
ignated Pcc, has been observed in some phosphatidylcholines [42].
Often, phase behaviour is dominated by the main Lβ − Lα (gel-�uid, Lβstands for the generic gel phase) transition, associated with the melting of
the lipid hydrocarbon chains. In DPPC, for example, the main transition
occurs at 41◦C, while the pre-transition Lβ − Pβ occurs at 35◦C [44]. In
DOPC, instead, the main transition occurs at -18◦C [45]. POPE shows the
main transition at 25◦C [13].
The liquid-crystal phase Lα is the biologically most relevant membrane phase
as the living cell membranes are made of phospholipids in this phase.
1.5 Interactions of drugs with model membranes
Many drugs with di�erent chemical structures and pharmacological e�ects
are known to bind to membrane lipids and to alter physical properties. Typ-
ical examples include anesthetics [47][48], steroids [49], anti-psychotic drugs
[50], as well as anti-cancer [51], anti-bacterial [52], anti-viral agents and an-
tibiotics like aminoglycosides [53] or macrolides (Azithromycin) [54].
The biological activity and/or toxicity of many drugs is known to directly
depend on their interaction with biological membranes [4].
1.5.1 Drugs: Aivlosin, Azithromicyn, Clarithromycin
In the present work macrolide antibiotics are studied. Macrolides are a group
of drugs (included in antibacterial and antiviral agents) characterized by the
presence of a macrolide ring, a large macrocyclic lactone ring (14-, 15-, or 16-
membered) to which one or more deoxy sugars may be attached. Macrolide
antibiotics prevent bacteria from growing. They work by blocking the pro-
tein synthesis of bacteria by interfering with their ribosomal subunits [55].
1.5 Interactions of drugs with model membranes 38
Three macrolide antibiotics are studied here: Aivlosin, Azithromycin and
Clarithromycin. In the following they are brie�y described.
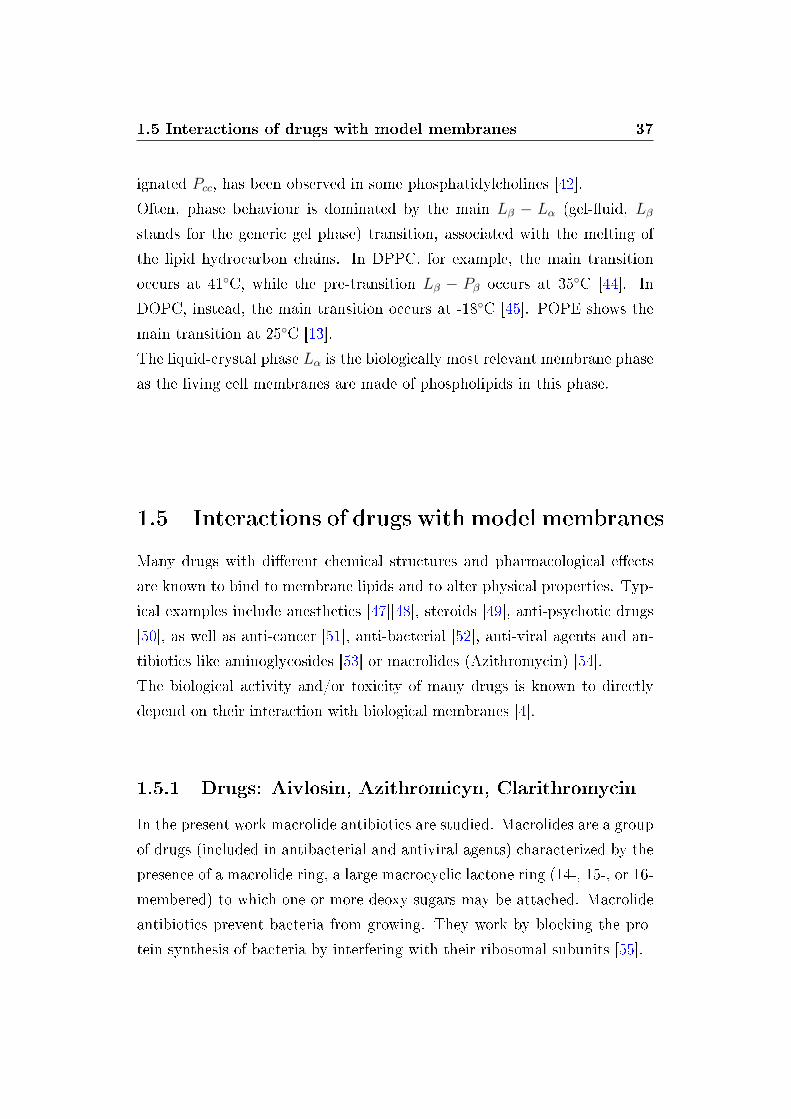
Aivlosin (3-acetyl-4 isovaleryltylosin) is an innovative drug, licensed to treat
diseases in pigs (Porcine Proliferative Enteropathy, Swine Dysentery and En-
zootic Pneumonia) and poultry (Mycoplasma Pneumonia, Necrotic Enteri-
tis). Throughout this report, Aivlosin refers to the active ingredient Tylval-
osin. Aivlosin was available in the tartrate form as granules, with molecular
weight 1192.3 (�gure 1.11). The salt form used in this work is easily soluble
in water. The non-salt form of Aivlosin, instead, shows a high hydrophobic-
ity: tha major contribution to this property could be due to the isovaleryl
group [56].
Aivlosin is rapidly absorbed and concentrates in target tissues, particularly
the lung and gut. It is very clinically e�cient as it achieves peak therapeutic
levels in blood plasma within two hours of administration [57].
Aivlosin was chosen in this work for its innovativeness, its low cost and be-
cause, at high concentrations, it seems to have both antibiotic and antiviral
e�ects [58]. In fact, it could eventually be used for treating a large number
of viruses including PRRS (Porcine reproductive and respiratory syndrome)
virus, In�uenza virus, Hepatitis C virus, Ebola virus, SARS CoV, Coxsackie
B3 and B5 virus, other than for simultaneously treatment of bacterial and
viral infections.
Some side e�ects of Aivlosin presented in animals. Maternotoxic e�ects have
been observed in rodents at concentrations of 400 mg for Kg of body weight.
In mice, a slight decrease in fetal weight has been found at concentrations
that do not cause maternotoxic e�ects [59].
Azithromycin is an azalide (antibiotics containing a nitrogen in the macrolide
ring) and one of the world's best-selling antibiotics, sold in the USA under
the name Zithromax. In humans, it is used to treat many di�erent types of
infections caused by bacteria, such as respiratory infections, skin infections,
ear infections, and sexually transmitted diseases [60].
1.5 Interactions of drugs with model membranes 39
Figure 1.11: Aivlosin structural formula [57].
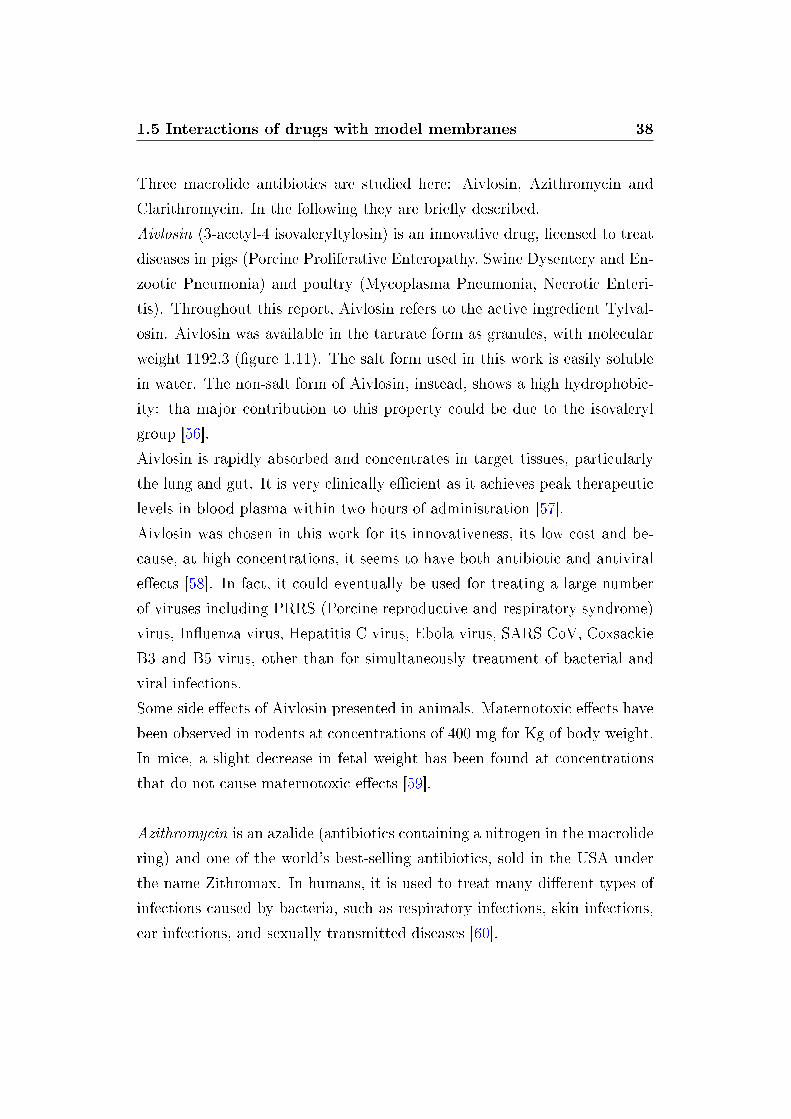
Azithromycin has the chemical name (2R,3S,4R,5R,8R, 10R,11R,12S,13S,14R)-
13-[(2,6-dideoxy-3-C-methyl-3-O- methyl-α-L-ribo-hexopyranosyl)oxy]-2-
ethyl-3,4,10-trihydroxy-3,5,6,8,10, 12,14-heptamethyl-11-[[3,4,6-trideoxy-3-
(dimethylamino)-β-D-xylo-hexopyranosyl]oxy]-1-oxa-6-azacyclopentadecan-
15-one (�gure 1.12). Azithromycin, as the dihydrate, is a white crystalline
powder with a molecular formula of C38H72N2O12 · 2H2O and a molecular
weight of 785.02.
Azithromycin is derived from Erythromycin; however, it di�ers chemically
from Erythromycin in that a methyl-substituted nitrogen atom is incorpo-
rated into the lactone ring. It is sparingly soluble in water, but it can be
dissolved in acid solutions (e.g., 0.1 M HCl).
Azithromycin is generally well tolerated. The most common side e�ects are
diarrhea or loose stools, nausea, abdominal pain, and vomiting which may
occur in fewer than one in twenty persons who receive Azithromycin. Rare
side e�ects include abnormal liver tests, allergic reactions, and nervousness
[61].
Azithromycin was chosen as control because it is well known in literature, as
many studies have already been carried out using it on biological systems.
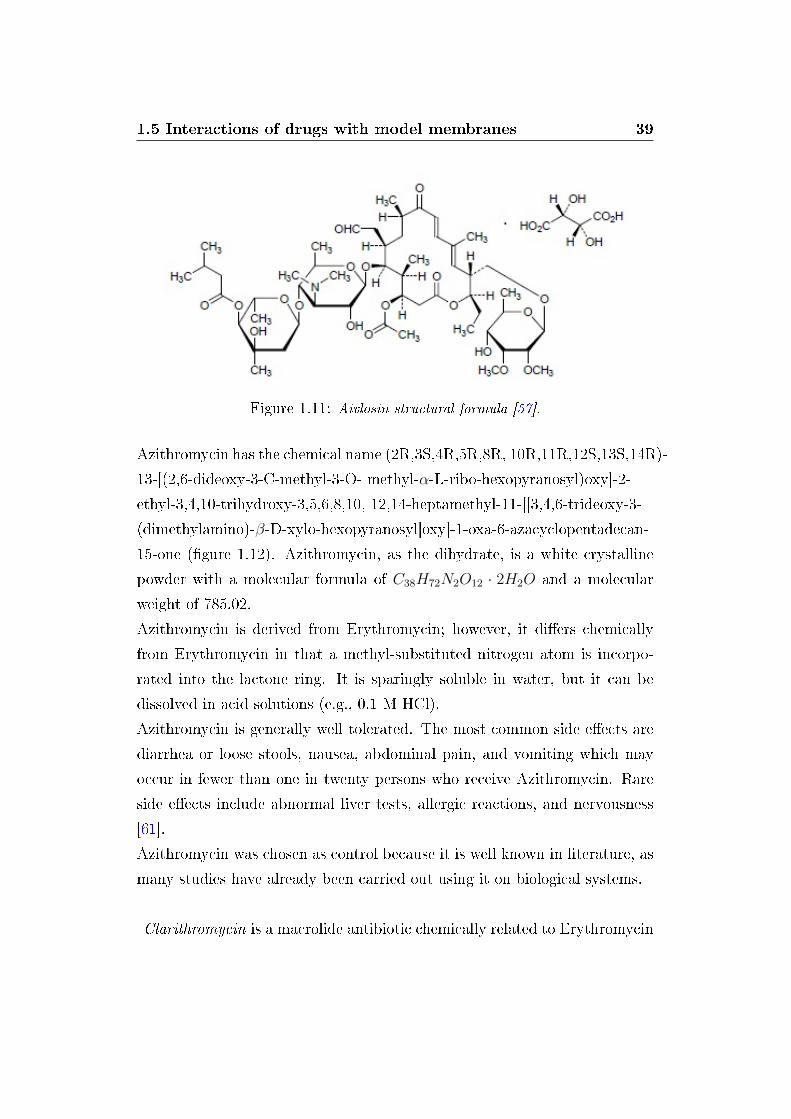
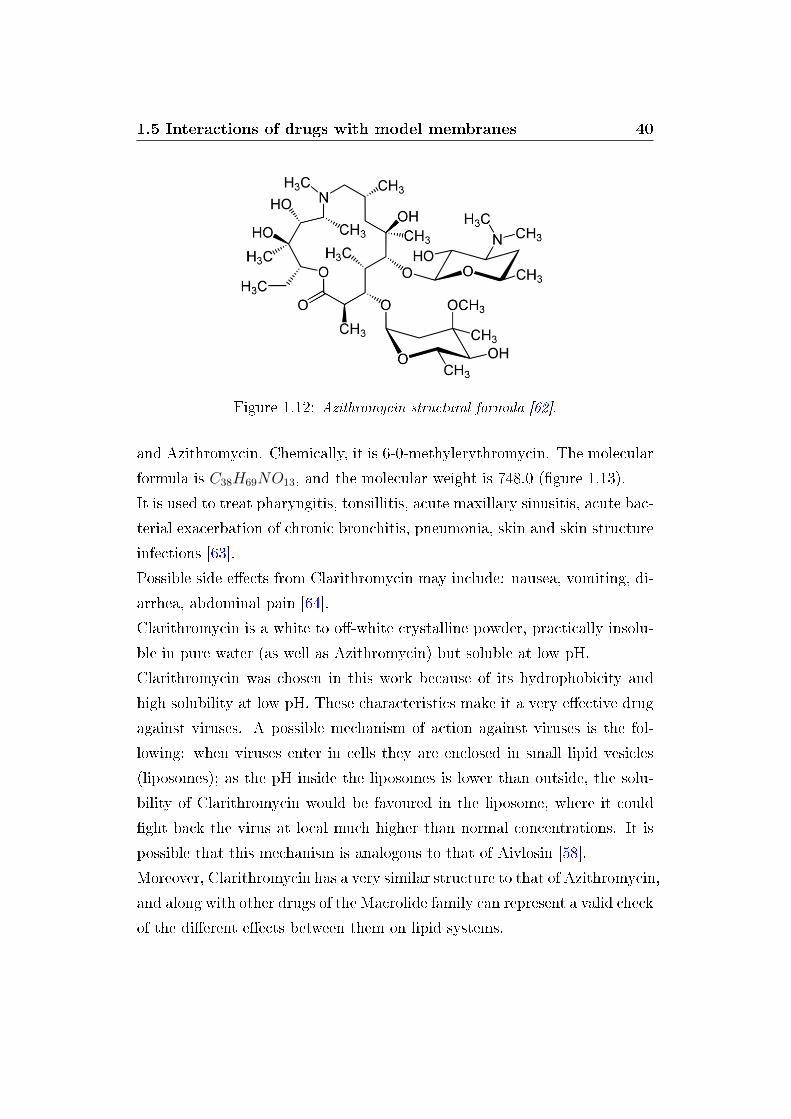
Clarithromycin is a macrolide antibiotic chemically related to Erythromycin
1.5 Interactions of drugs with model membranes 40
Figure 1.12: Azithromycin structural formula [62].
and Azithromycin. Chemically, it is 6-0-methylerythromycin. The molecular
formula is C38H69NO13, and the molecular weight is 748.0 (�gure 1.13).
It is used to treat pharyngitis, tonsillitis, acute maxillary sinusitis, acute bac-
terial exacerbation of chronic bronchitis, pneumonia, skin and skin structure
infections [63].
Possible side e�ects from Clarithromycin may include: nausea, vomiting, di-
arrhea, abdominal pain [64].
Clarithromycin is a white to o�-white crystalline powder, practically insolu-
ble in pure water (as well as Azithromycin) but soluble at low pH.
Clarithromycin was chosen in this work because of its hydrophobicity and
high solubility at low pH. These characteristics make it a very e�ective drug
against viruses. A possible mechanism of action against viruses is the fol-
lowing: when viruses enter in cells they are enclosed in small lipid vesicles
(liposomes); as the pH inside the liposomes is lower than outside, the solu-
bility of Clarithromycin would be favoured in the liposome, where it could
�ght back the virus at local much higher than normal concentrations. It is
possible that this mechanism is analogous to that of Aivlosin [58].
Moreover, Clarithromycin has a very similar structure to that of Azithromycin,
and along with other drugs of the Macrolide family can represent a valid check
of the di�erent e�ects between them on lipid systems.
1.5 Interactions of drugs with model membranes 41
All the antibiotics introduced are weak bases: while they can move across
the membrane readily in the uncharged form, in the protonated form they
will be trapped in the low pH aqueous compartment inside the endosome.
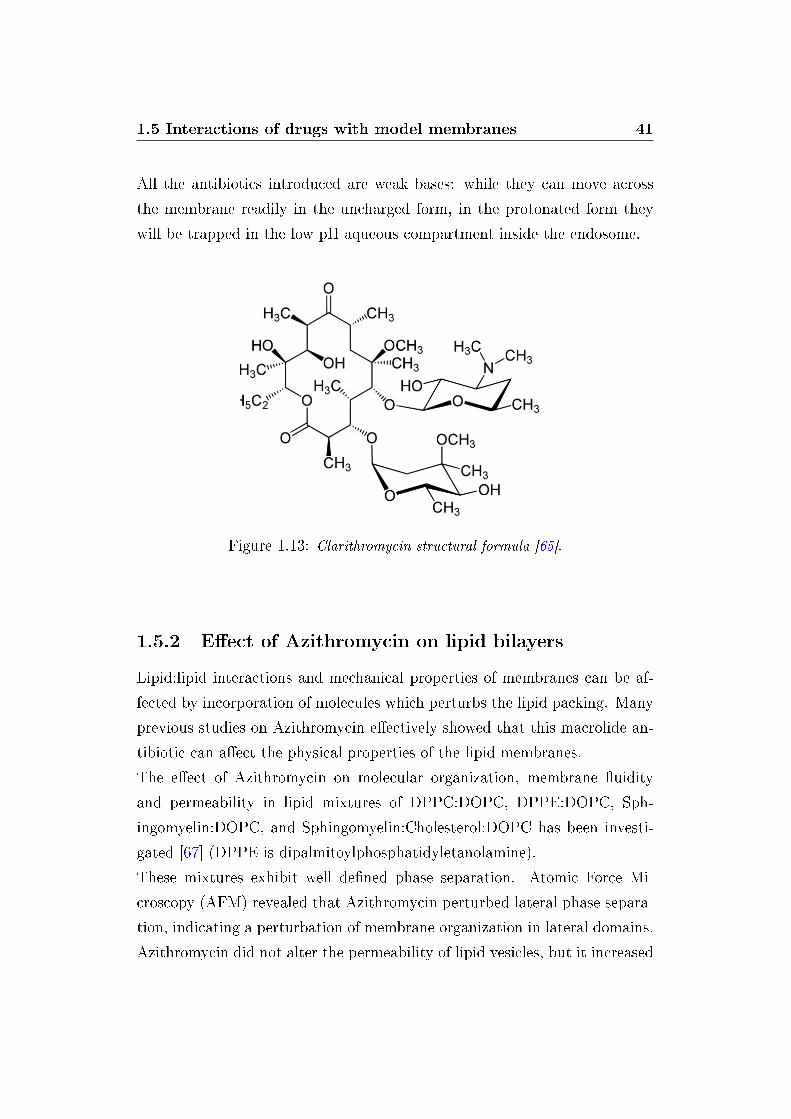
Figure 1.13: Clarithromycin structural formula [65].
1.5.2 E�ect of Azithromycin on lipid bilayers
Lipid:lipid interactions and mechanical properties of membranes can be af-
fected by incorporation of molecules which perturbs the lipid packing. Many
previous studies on Azithromycin e�ectively showed that this macrolide an-
tibiotic can a�ect the physical properties of the lipid membranes.
The e�ect of Azithromycin on molecular organization, membrane �uidity
and permeability in lipid mixtures of DPPC:DOPC, DPPE:DOPC, Sph-
ingomyelin:DOPC, and Sphingomyelin:Cholesterol:DOPC has been investi-
gated [67] (DPPE is dipalmitoylphosphatidyletanolamine).
These mixtures exhibit well de�ned phase separation. Atomic Force Mi-
croscopy (AFM) revealed that Azithromycin perturbed lateral phase separa-
tion, indicating a perturbation of membrane organization in lateral domains.
Azithromycin did not alter the permeability of lipid vesicles, but it increased
1.5 Interactions of drugs with model membranes 42
the �uidity at the hydrophilic/hydrophobic interface in DPPC:DOPC and
DPPE:DOPC bilayers.
More speci�c studies on mechanisms of interaction between Azithromycin
and phospholipids have been perfomed.
Azithromycin was found to bind to lipid model membranes and interact with
the polar head groups of phospholipids, decreasing their motional (both orien-
tational and translational) freedom [68]. Thus, the position of Azithromycin
is probably near the polar head and the interface, in the upper 10 carbons
of the acyl chain.
Fa et al. (2007) [69] investigated the e�ect of Azithromycin on size distribu-
tions and elastic properties of DOPC-GUVs.
GUVs prepared by electroformation showed an initial spherical shape reach-
ing diameters of up to 50 µm. Addition of 50 µM Azithromycin preferentially
destabilized membranes with the lowest curvature (largest vesicles were irre-
versibly lost with the concomitant increase of smallest vesicles).
The amplitude of thermal �uctuations of a bilayer is related to its bending
modulus (κ; see section 1.6); the apparent area compressibility modulus Kapp
characterizes the energy necessary for the increase of bilayer surface area.
Azithromycin addition was found to enhance lipid membrane �uctuations
reducing both the required energy for thermal �uctuations and the stress to
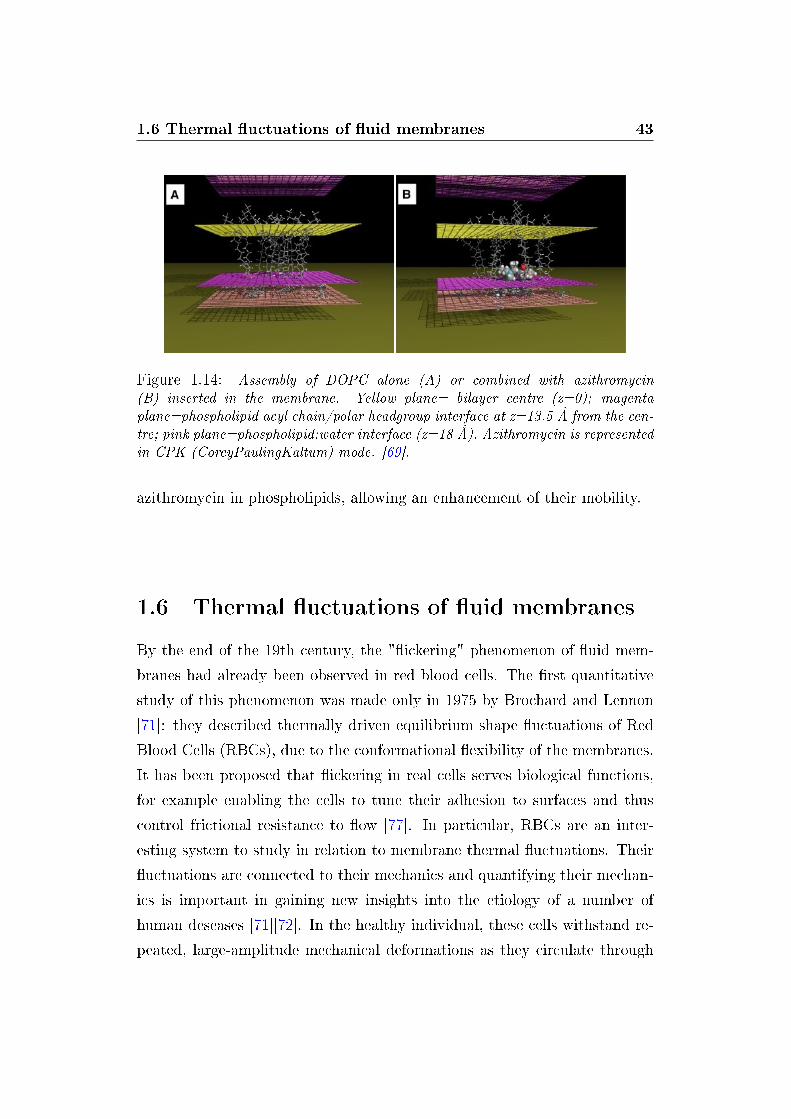
stretch the bilayer. Molecular modeling con�rmed that Azithromycin induces
a modi�cation in the DOPC organization at the interface of phospholipid bi-
layers. Structurally, this modi�cation consists in an increased mean surface
occupied by each phospholipid molecule in presence of Azithromycin (see �g-
ure 1.14).
Calorimetric studies on DOPC and DPPC multilamellar dispersions showed
that for high Azithromycin content, thermal transitions are markedly reduced
(the height of the transition peaks is reduced). The enthalpy variation asso-
ciated with the transition also decreases [70]. These e�ects may be due to an
increase of the available space between hydrophobic chains after insertion of
1.6 Thermal �uctuations of �uid membranes 43
Figure 1.14: Assembly of DOPC alone (A) or combined with azithromycin(B) inserted in the membrane. Yellow plane= bilayer centre (z=0); magentaplane=phospholipid acyl chain/polar headgroup interface at z=13.5 Å from the cen-tre; pink plane=phospholipid:water interface (z=18 Å). Azithromycin is representedin CPK (CoreyPaulingKaltum) mode. [69].
azithromycin in phospholipids, allowing an enhancement of their mobility.
1.6 Thermal �uctuations of �uid membranes
By the end of the 19th century, the "�ickering" phenomenon of �uid mem-
branes had already been observed in red blood cells. The �rst quantitative
study of this phenomenon was made only in 1975 by Brochard and Lennon
[71]: they described thermally driven equilibrium shape �uctuations of Red
Blood Cells (RBCs), due to the conformational �exibility of the membranes.
It has been proposed that �ickering in real cells serves biological functions,
for example enabling the cells to tune their adhesion to surfaces and thus
control frictional resistance to �ow [77]. In particular, RBCs are an inter-
esting system to study in relation to membrane thermal �uctuations. Their
�uctuations are connected to their mechanics and quantifying their mechan-
ics is important in gaining new insights into the etiology of a number of
human deseases [71][72]. In the healthy individual, these cells withstand re-
peated, large-amplitude mechanical deformations as they circulate through
1.6 Thermal �uctuations of �uid membranes 44
the microvasculature. Certain pathological conditions cause changes in both
RBC equilibrium shape and mechanics. For example, the cell's morphological
transitions from discocyte(DC, normal shape) to echinocyte (EC, spiculated
shape) to spherocyte (SC, nearly spherical) are accompanied by changes in
RBCs mechanics. Di�raction phase microscopy (DPM) [73] and stabilized
Hilbert phase microscopy (sHPM) [74] studies revealed that during these
transitions an enhancement of elastic constant and tension occurs: the in-
creased sti�ness of some morphological RBC forms must be due to chemical
changes in the lipid bilayer and structural changes in the spectrin network
tethered to it.
Fluid phospholipid membranes in water are classically described as �uctu-
ating 2-dimensional sheets. The out-of-plane �uctuations, also called undu-
lations, can be induced by thermal motions. Their amplitude can be large
enough to be visible in an optical microscope, and is mostly controlled by
curvature elasticity and lateral tension of the membrane [71][75][76][7]. Their
elastic energy depends on two main parameters: the bending modulus κ and
the e�ective tension σ [6]. The former is de�ned as a constant which deter-
mines how the energy depends on the mean curvature of the membrane; the
latter represents an energy that couples to the area of the bilayer surface.
Over the last three decades giant vesicles have been a popular system for
measuring κ through these �uctuations, since the size of GUVs is suitable for
direct observation using light microscopy.
Several single-cell techniques, for research purposes, have been used to mea-
sure the mechanical properties of vesicles: micropipette aspiration [78], stretch-
ing by optical tweezers [79], deformation in micro�uidic channels [80], analy-
sis of shape �ickering [81][82], tether formation [83], and deformation under
electric �elds [84].
1.6 Thermal �uctuations of �uid membranes 45
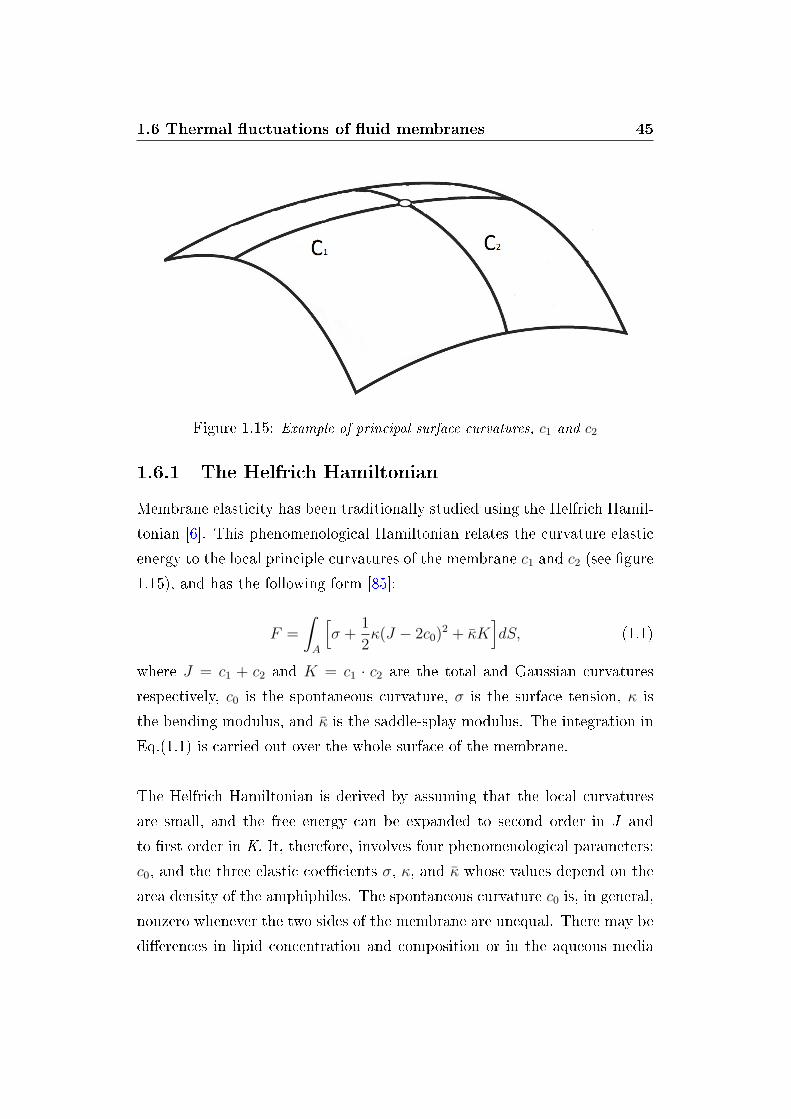
Figure 1.15: Example of principal surface curvatures, c1 and c2
1.6.1 The Helfrich Hamiltonian
Membrane elasticity has been traditionally studied using the Helfrich Hamil-
tonian [6]. This phenomenological Hamiltonian relates the curvature elastic
energy to the local principle curvatures of the membrane c1 and c2 (see �gure
1.15), and has the following form [85]:
F =
∫A
[σ +
1
2κ(J − 2c0)
2 + κK]dS, (1.1)
where J = c1 + c2 and K = c1 · c2 are the total and Gaussian curvatures
respectively, c0 is the spontaneous curvature, σ is the surface tension, κ is
the bending modulus, and κ is the saddle-splay modulus. The integration in
Eq.(1.1) is carried out over the whole surface of the membrane.
The Helfrich Hamiltonian is derived by assuming that the local curvatures
are small, and the free energy can be expanded to second order in J and
to �rst order in K. It, therefore, involves four phenomenological parameters:
c0, and the three elastic coe�cients σ, κ, and κ whose values depend on the
area density of the amphiphiles. The spontaneous curvature c0 is, in general,
nonzero whenever the two sides of the membrane are unequal. There may be
di�erences in lipid concentration and composition or in the aqueous media
1.6 Thermal �uctuations of �uid membranes 46
facing an otherwise symmetric bilayer (monolayers are asymmetric by de�-
nition). The sum of curvatures, cl + c2, and the Gaussian curvature c1 · c2are associated with di�erent elastic moduli, κ and κ.
We can ignore terms containing the Gaussian curvature as its integral de-
pends only on the genus of the (closed) surface. The Helfrich Hamiltonian
for this system is:
F =
∫A
[σ + 2κ(H2 − 2c0H)
]dS − P
∫V
dV, (1.2)
where H = J/2 is the mean curvature, and P is a uniform pressure di�erence
between the two sides of the membrane.
The volume integral in Eq. (1.2) is contained to account for the conservation
of volume in the vesicle [86]. For �uctuations with very short wavelength,
this volume integral is equivalent to having a constant constraining potential
proportional to σ.
The theoretical and experimental methods for determining the elastic coe�-
cients of interfaces can be classi�ed into equilibrium (or mechanical ) methods
and �uctuation methods. In the equilibrium approach one extracts the elas-
tic coe�cients by comparing the free energies of two equilibrium surfaces
with di�erent curvatures. In the �uctuation approach, on the other hand,
the Helfrich Hamiltonian is used to calculate the free energy cost due to
a thermal �uctuation that changes the local curvature from its equilibrium
value. The elastic coe�cients are derived from the mean-square amplitudes
of the �uctuations.
In the following the �uctuation approach is applied.
1.6.2 The planar approximation
In optical microscopy experiments only �uctuations in the equatorial plane
of the vesicle can be measured. The �ickering analysis is then made assuming
1.6 Thermal �uctuations of �uid membranes 47
the vesicle spherical surface as planar; only a linear section of this surface
is taken, that corresponds to the equatorial perimeter of the vesicle. The
oscillations on this closed curve are analysed, and this is what is called the
planar approximation [9].
Vesicle thermal �uctuation spectra in spherical geometry were calculated in
previous work [87]. As we are not interested in the static shape of the vesicle
but only in its �uctuations, we choose to work with the equations valid for
a planar membrane. The errors due to curvature and closed topology of the
membrane are important only for the �rst modes.
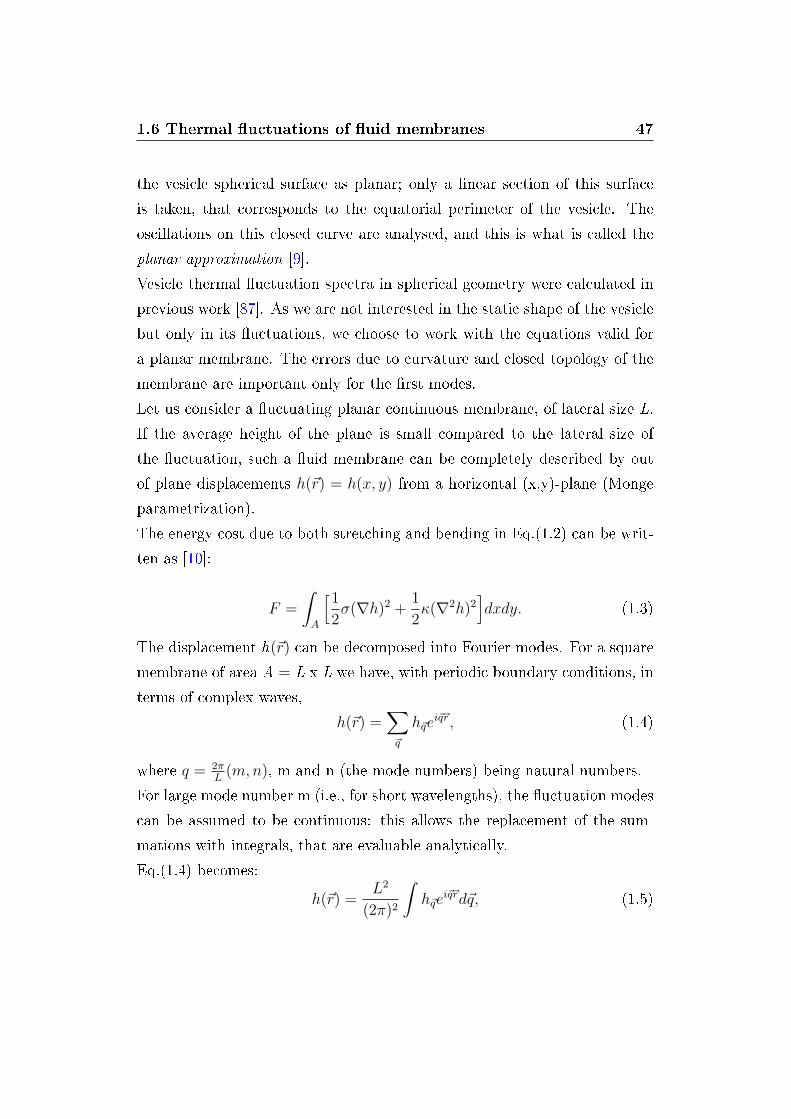
Let us consider a �uctuating planar continuous membrane, of lateral size L.
If the average height of the plane is small compared to the lateral size of
the �uctuation, such a �uid membrane can be completely described by out
of plane displacements h(~r) = h(x, y) from a horizontal (x,y)-plane (Monge
parametrization).
The energy cost due to both stretching and bending in Eq.(1.2) can be writ-
ten as [10]:
F =
∫A
[1
2σ(∇h)2 +
1
2κ(∇2h)2
]dxdy. (1.3)
The displacement h(~r) can be decomposed into Fourier modes. For a square
membrane of area A = L x L we have, with periodic boundary conditions, in
terms of complex waves,
h(~r) =∑~q
h~qei~q~r, (1.4)
where q = 2πL
(m,n), m and n (the mode numbers) being natural numbers.
For large mode number m (i.e., for short wavelengths), the �uctuation modes
can be assumed to be continuous: this allows the replacement of the sum-
mations with integrals, that are evaluable analytically.
Eq.(1.4) becomes:
h(~r) =L2
(2π)2
∫h~qe
i~q~rd~q, (1.5)
1.6 Thermal �uctuations of �uid membranes 48
h~q =1
(L2)
∫h(~r)e−i~q~rd~r. (1.6)
The expression in Eq.(1.4) can be used to evaluate F in Eq.(1.3).
We �nd:
∇h =∑~q
i~qh~qei~q~r, (1.7)
∇2h =∑~q
−~q2h~qei~q~r. (1.8)
We can use these expressions in Eq.(1.3), obtaining:
F =∑~q~q′
∫ ∫ [σ(−~q~q′h~qh~q′e
i(~q+~q′)~r) + κ(~q2~q′2h~qh~q′e
i(~q+~q′)~r)]dxdy. (1.9)
The only terms that survive in this integral are those for which
~q + ~q′ = 0⇒ ~q = −~q′. (1.10)
The elastic energy becomes:
F =∑~q
L2(σ~q~q + κ(~q~q)2
)h2~q. (1.11)
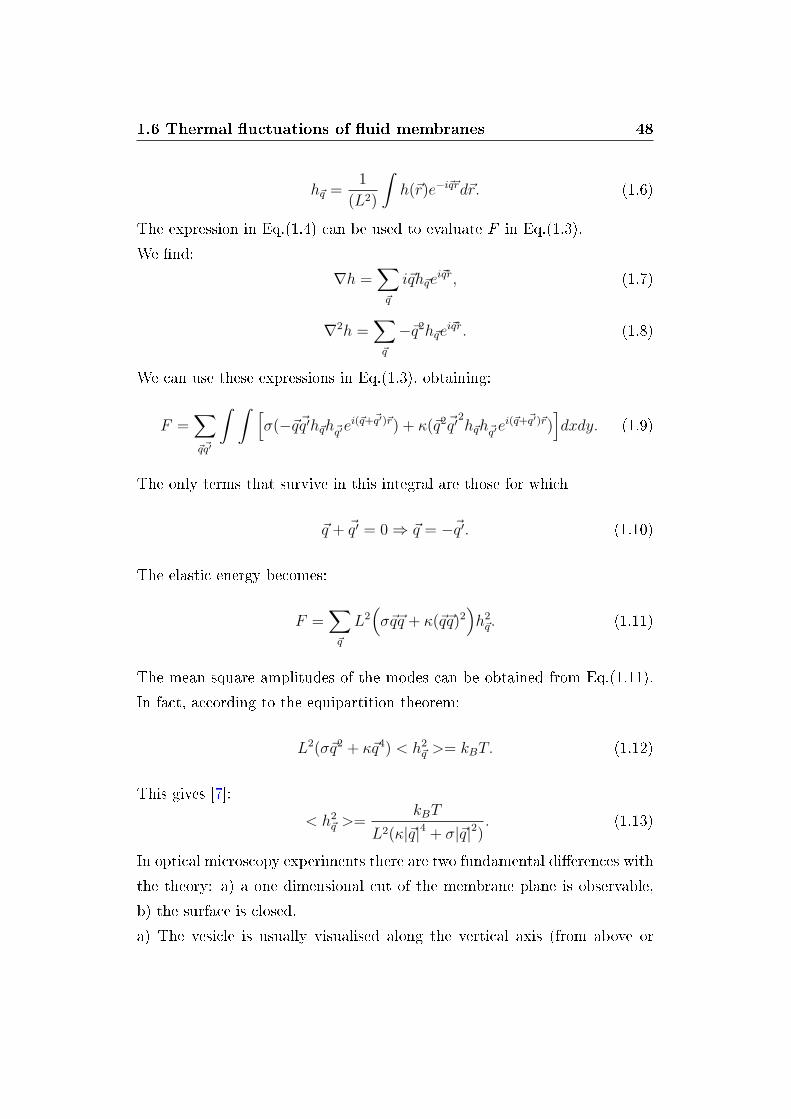
The mean square amplitudes of the modes can be obtained from Eq.(1.11).
In fact, according to the equipartition theorem:
L2(σ~q2 + κ~q4) < h2~q >= kBT. (1.12)
This gives [7]:
< h2~q >=
kBT
L2(κ|~q|4 + σ|~q|2). (1.13)
In optical microscopy experiments there are two fundamental di�erences with
the theory: a) a one dimensional cut of the membrane plane is observable,
b) the surface is closed.
a) The vesicle is usually visualised along the vertical axis (from above or
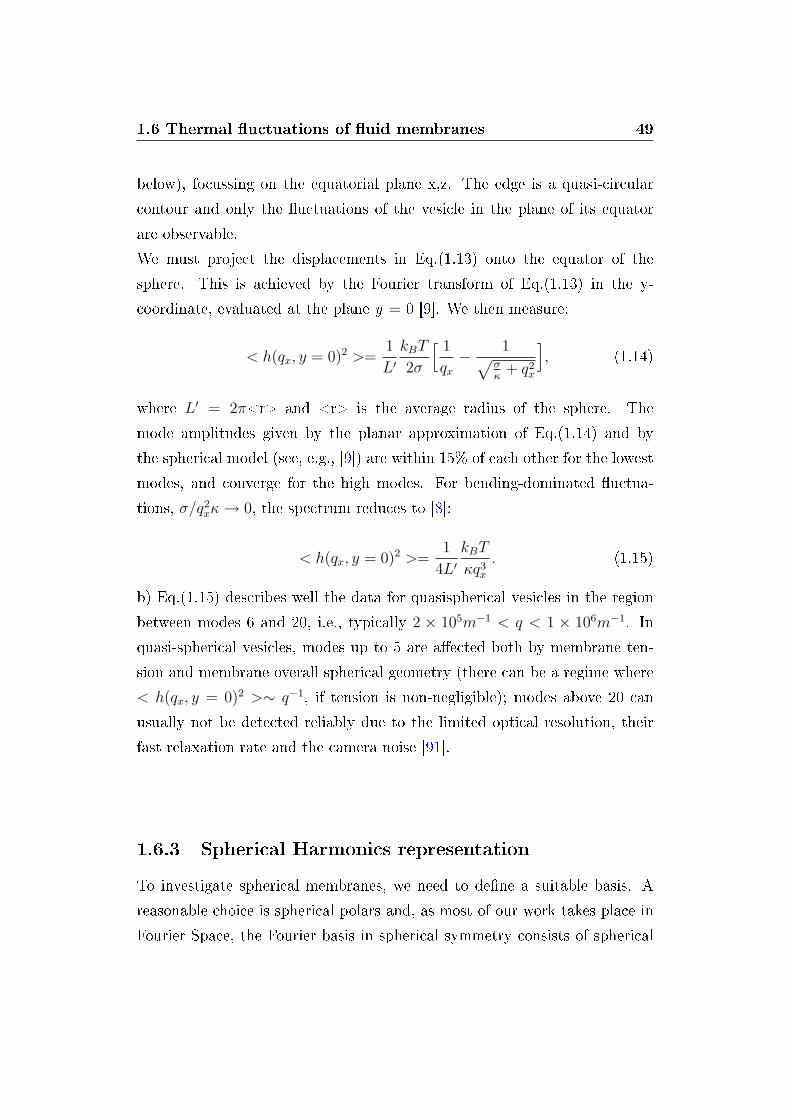
1.6 Thermal �uctuations of �uid membranes 49
below), focussing on the equatorial plane x,z. The edge is a quasi-circular
contour and only the �uctuations of the vesicle in the plane of its equator
are observable.
We must project the displacements in Eq.(1.13) onto the equator of the
sphere. This is achieved by the Fourier transform of Eq.(1.13) in the y-
coordinate, evaluated at the plane y = 0 [9]. We then measure:
< h(qx, y = 0)2 >=1
L′kBT
2σ
[ 1
qx− 1√
σκ
+ q2x
], (1.14)
where L′ = 2π<r> and <r> is the average radius of the sphere. The
mode amplitudes given by the planar approximation of Eq.(1.14) and by
the spherical model (see, e.g., [9]) are within 15% of each other for the lowest
modes, and converge for the high modes. For bending-dominated �uctua-
tions, σ/q2xκ→ 0, the spectrum reduces to [8]:
< h(qx, y = 0)2 >=1
4L′kBT
κq3x
. (1.15)
b) Eq.(1.15) describes well the data for quasispherical vesicles in the region
between modes 6 and 20, i.e., typically 2 × 10⁵m−1 < q < 1 × 10⁶m−1. In
quasi-spherical vesicles, modes up to 5 are a�ected both by membrane ten-
sion and membrane overall spherical geometry (there can be a regime where
< h(qx, y = 0)2 >∼ q−1, if tension is non-negligible); modes above 20 can
usually not be detected reliably due to the limited optical resolution, their
fast relaxation rate and the camera noise [91].
1.6.3 Spherical Harmonics representation
To investigate spherical membranes, we need to de�ne a suitable basis. A
reasonable choice is spherical polars and, as most of our work takes place in
Fourier Space, the Fourier basis in spherical symmetry consists of spherical
1.6 Thermal �uctuations of �uid membranes 50
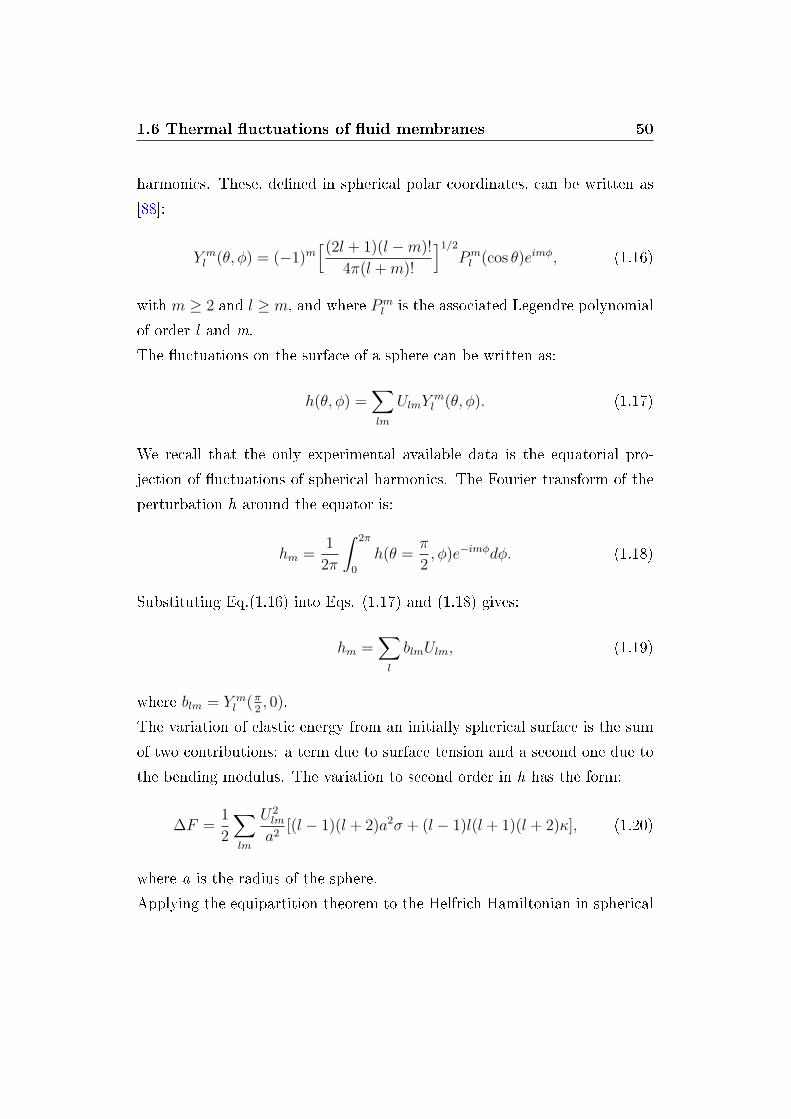
harmonics. These, de�ned in spherical polar coordinates, can be written as
[88]:
Y ml (θ, φ) = (−1)m
[(2l + 1)(l −m)!
4π(l +m)!
]1/2Pml (cos θ)eimφ, (1.16)
with m ≥ 2 and l ≥ m, and where Pml is the associated Legendre polynomial
of order l and m.
The �uctuations on the surface of a sphere can be written as:
h(θ, φ) =∑lm
UlmYml (θ, φ). (1.17)
We recall that the only experimental available data is the equatorial pro-
jection of �uctuations of spherical harmonics. The Fourier transform of the
perturbation h around the equator is:
hm =1
2π
∫ 2π
0
h(θ =π
2, φ)e−imφdφ. (1.18)
Substituting Eq.(1.16) into Eqs. (1.17) and (1.18) gives:
hm =∑l
blmUlm, (1.19)
where blm = Y ml (π
2, 0).
The variation of elastic energy from an initially spherical surface is the sum
of two contributions: a term due to surface tension and a second one due to
the bending modulus. The variation to second order in h has the form:
∆F =1
2
∑lm
U2lm
a2[(l − 1)(l + 2)a2σ + (l − 1)l(l + 1)(l + 2)κ], (1.20)
where a is the radius of the sphere.
Applying the equipartition theorem to the Helfrich Hamiltonian in spherical
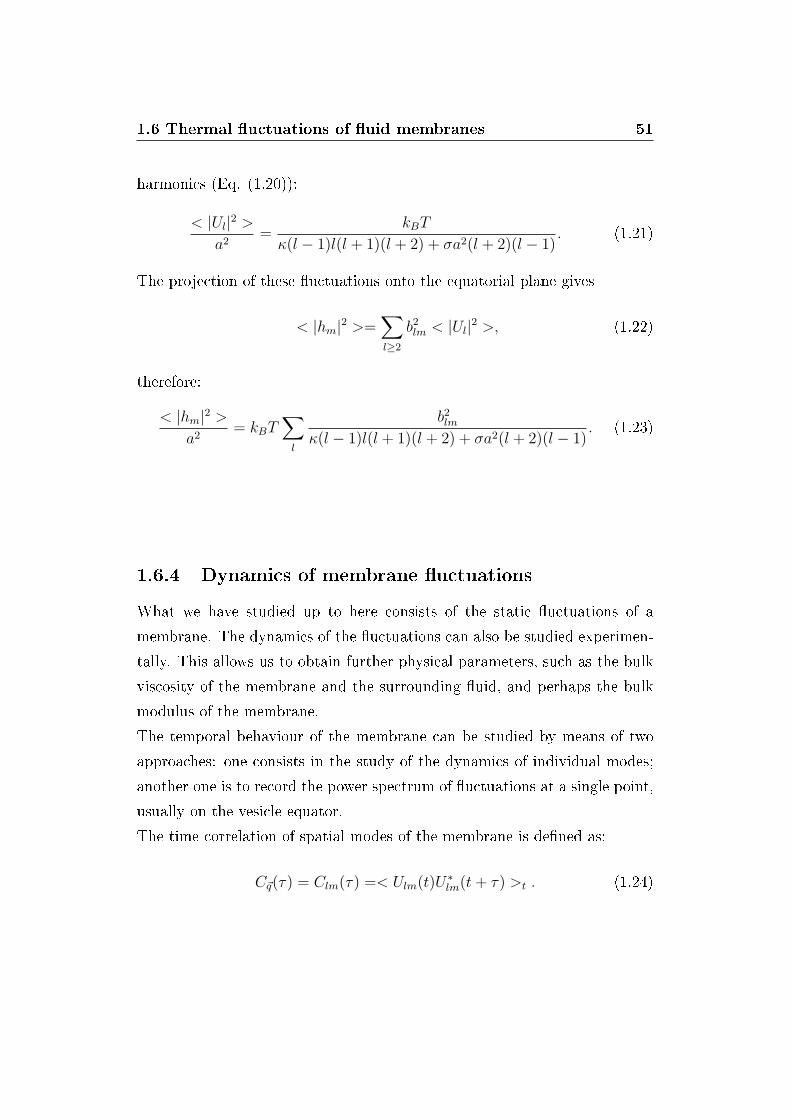
1.6 Thermal �uctuations of �uid membranes 51
harmonics (Eq. (1.20)):
< |Ul|2 >a2
=kBT
κ(l − 1)l(l + 1)(l + 2) + σa2(l + 2)(l − 1). (1.21)
The projection of these �uctuations onto the equatorial plane gives
< |hm|2 >=∑l≥2
b2lm < |Ul|2 >, (1.22)
therefore:
< |hm|2 >a2
= kBT∑l
b2lmκ(l − 1)l(l + 1)(l + 2) + σa2(l + 2)(l − 1)
. (1.23)
1.6.4 Dynamics of membrane �uctuations
What we have studied up to here consists of the static �uctuations of a
membrane. The dynamics of the �uctuations can also be studied experimen-
tally. This allows us to obtain further physical parameters, such as the bulk
viscosity of the membrane and the surrounding �uid, and perhaps the bulk
modulus of the membrane.
The temporal behaviour of the membrane can be studied by means of two
approaches: one consists in the study of the dynamics of individual modes;
another one is to record the power spectrum of �uctuations at a single point,
usually on the vesicle equator.
The time correlation of spatial modes of the membrane is de�ned as:
C~q(τ) = Clm(τ) =< Ulm(t)U∗lm(t+ τ) >t . (1.24)
1.6 Thermal �uctuations of �uid membranes 52
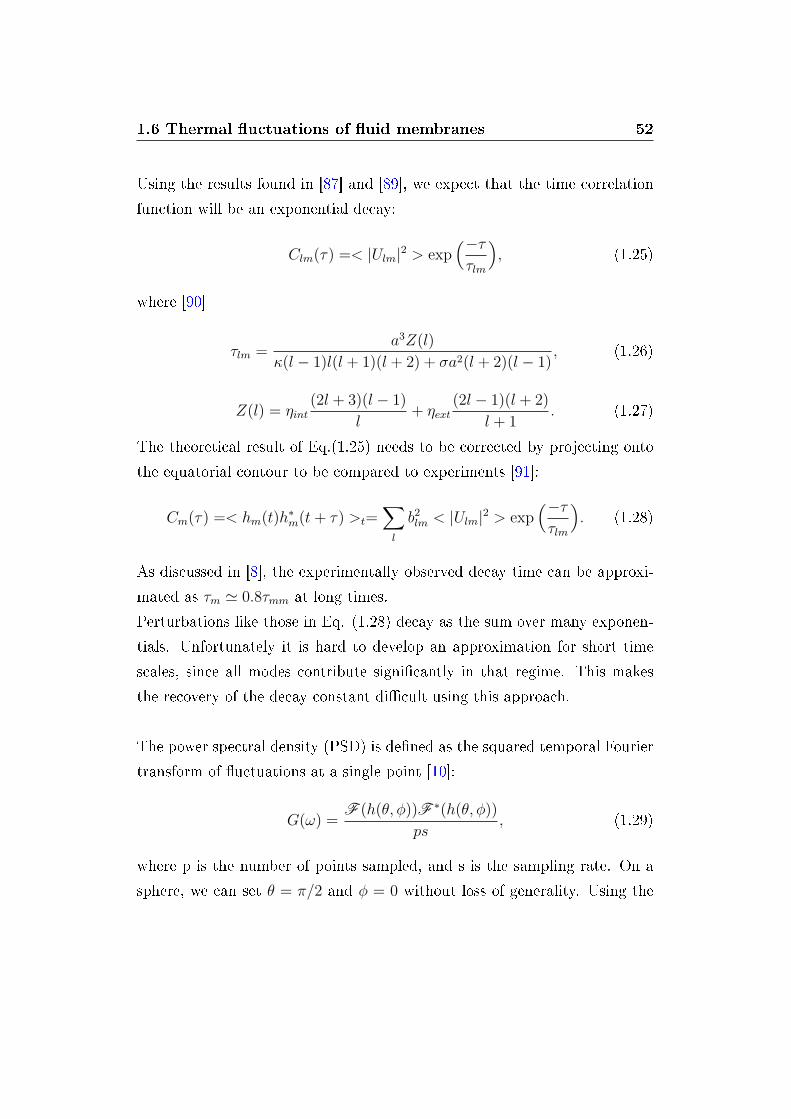
Using the results found in [87] and [89], we expect that the time correlation
function will be an exponential decay:
Clm(τ) =< |Ulm|2 > exp(−ττlm
), (1.25)
where [90]
τlm =a3Z(l)
κ(l − 1)l(l + 1)(l + 2) + σa2(l + 2)(l − 1), (1.26)
Z(l) = ηint(2l + 3)(l − 1)
l+ ηext
(2l − 1)(l + 2)
l + 1. (1.27)
The theoretical result of Eq.(1.25) needs to be corrected by projecting onto
the equatorial contour to be compared to experiments [91]:
Cm(τ) =< hm(t)h∗m(t+ τ) >t=∑l
b2lm < |Ulm|2 > exp(−ττlm
). (1.28)
As discussed in [8], the experimentally observed decay time can be approxi-
mated as τm ' 0.8τmm at long times.
Perturbations like those in Eq. (1.28) decay as the sum over many exponen-
tials. Unfortunately it is hard to develop an approximation for short time
scales, since all modes contribute signi�cantly in that regime. This makes
the recovery of the decay constant di�cult using this approach.
The power spectral density (PSD) is de�ned as the squared temporal Fourier
transform of �uctuations at a single point [10]:
G(ω) =F (h(θ, φ))F ∗(h(θ, φ))
ps, (1.29)
where p is the number of points sampled, and s is the sampling rate. On a
sphere, we can set θ = π/2 and φ = 0 without loss of generality. Using the
1.6 Thermal �uctuations of �uid membranes 53
identity∑
m [Y ml (π/2, 0)]2 = 2l+1
4πwe obtain:
G(ω) =∑l
< |Ul|2 >ωl
ω2l + ω2
2l + 1
2π. (1.30)
Using Eqs.(1.21) and (1.26) gives:
< |Ul|2 >=kBTa
2τlma3Z(l)
=kBTτlmaZ(l)
, (1.31)
and, with ωl = 1/τlm, we obtain:
G(ω) =kBT
2πa
∑l
2l + 1
Z(l)(ω2l + ω2)
. (1.32)
In the high frequency, planar approximation, we �nd:
G(ω) =kBT
12(2η2κ)1/3ω5/3, (1.33)
obtained using a slightly di�erent de�nition of Z from that used in [10]: our
�nal expression di�ers from Betz's by a factor of π. Since the expression in
Eq. (1.33) must agree with the spherical expression in the high frequency
limit, this implies a mistake in this part of the calculation in [10].
In summary, the relevant physics governing the static equilibrium shapes
of GUVs is very well understood. On the contrary, many aspects of the
dynamics of equilibrium shape �uctuations of the vesicles remain not well
explained. The reason of this uncertainty is that the dynamics of �uid mem-
branes involves many more physical factors than the statics. For example,
the membrane viscosity (here considered only as a constant parameter) and
the bulk modulus couple into these equations in complex ways [89]. In prin-
ciple, even compression and splay modes, not considered above, can a�ect
the dynamics in some parameter range [89].
1.6 Thermal �uctuations of �uid membranes 54
1.6.5 Pixellation e�ects
Experimentally detected �uctuation spectrum is not exactly the same as the
real �uctuation spectrum of the vesicle. The discretization of the image into
pixels, and the limited sampling frequency which produces e�ects due to the
Nyquist limit, modify the observed �uctuations.
As a model to explain their e�ects, we take a 1d signal F(x). The camera
sampling with pixels of size L gives a pixelated function P(F(x)), which can
be de�ned as:
P = SL ? δL · SL ? F, (1.34)
where ? is the convolution operation, and · represents the usual multiplica-tion. SL is a top hat function centred on the origin of full width L, and
amplitude 1/L. δL is an array of delta functions of spacing L. The rightmost
SL and the δL represent the mapping of all the light falling on one pixel in
the camera onto a single point. The other SL represents the mapping of these
points back onto pixels on the screen.
P(x) is sampled (discretized in 360 sectors) to give what we actually measure,
R(x):
R = δb · SL ? P, (1.35)
where the SL comes from sampling with a pixel sized object, and the δb comes
from the sampling spacing b which is di�erent from the pixel size L.
Combining Eqs. (1.34) and (1.35) gives:
R = δb · SL ? SL ? δL · SL ? F. (1.36)
Taking the Fourier transform and using the convolution theorem, we get Rof R:
R = Db ? SL · SL · DL ? SL · F . (1.37)
1.7 Interfacial Shear Rheology of phospholipid monolayers 55
where we take the order of the operations from right to left. Db is an array
of delta functions of spacing 2πband:
SL = sinc(qL
2). (1.38)
When measuring vesicle �ickering, we e�ectively measure < R2 >. For a high
enough sampling rate, b, we can ignore the e�ect of the Nyquist frequency:
the �uctuation spectrum decays quickly at high mode number, so the Nyquist
e�ect will not contribute much to the amplitude of modes below the Nyquist
limit. Thus, we can write:
< R2 >= sinc6(qL
2) < F2 > . (1.39)
1.7 Interfacial Shear Rheology of phospholipid
monolayers
1.7.1 Generalities
Dynamics of insoluble surfactants con�ned as thin �lm at the air-water sur-
face is quite di�erent than in the bulk. Rheology of monolayers is very
interesting as it can give us information about mechanical properties of the
monolayer not accessible with other techniques. In particular, measuring the
force necessary to shear the �lm (at di�erent deformations, γ, and deforma-
tion rates, γ) and comparing them at di�erent thermodynamic conditions
(temperature, T, and surface pressure, Π) can provide valuable information
beyond that obtained with pressure-area isotherms [92].
1.7 Interfacial Shear Rheology of phospholipid monolayers 56
1.7.2 ISR experiment
In this work an Interfacial Stress Rheology (ISR) equipment was used to
study if Aivlosin, Azithromycin and Clarithromycin can a�ect the shear mod-
ulus of phosphatidilcoline Langmuir monolayers. Both DOPC and DPPC
were used for these experiments.
ISR experiments were carried out inducing a sinusoidal stress σ(ω) in the
monolayer by the oscillations of a magnetic needle �oating on the surface,
driven by the magnetic �eld gradient generated by a pair of coils. The result-
ing shear strain γ(ω), along with its phase shift δ(ω) with respect to σ, was
measured by tracking the small needle oscillation with a microscope. Two
parameters were monitored: the amplitude ratio, AR, de�ned as the ratio
of the amplitude of the needle displacement, γ, to the forcing amplitude, σ,
and the phase di�erence, δ.
The inertial response of the needle was characterized performing a measure-
ment on pure water surface as a function of frequency, in absence of any sur-
face �lm. The overall frequency behaviour could be modelled as the response
of a forced-damped oscillator of mass m, spring constant k and damping
constant d, in analogy with [94]:
γ
σ=
1√(k −mω2)2 + (ωd)2
, (1.40)
and
δ = arctan(−ωd
k −mω2). (1.41)
Since the only object in motion is the needle, m is the mass of the needle.
The oscillator parameters (previously worked out for the same instrument in
[93]) can be determined by performing a �t on the water stress-strain ratio
curve. Moreover at high frequency the stressstrain ratio was found [93] to be
proportional to ω2: this allowed one to obtain a current-to-force calibration
constant.
The dynamic surface modulus, G∗(ω), is de�ned as the proportionality factor
1.7 Interfacial Shear Rheology of phospholipid monolayers 57
between the stress and the strain:
σeiωt = G∗(ω)γei[ωt−δ(ω)]. (1.42)
By rearranging Eq. (1.42) and solving for G∗(ω) we can directly express the
dynamic modulus as a complex number:
G∗(ω) =σ
γeiδ(ω) = G′(ω) + iG”(ω) (1.43)
where G'(ω) is the surface storage modulus (elastic part) and G"(ω) is the
surface loss modulus (viscous part). The former represents storage of elastic
energy, while the latter represents the viscous dissipation of that energy.
When the �lm is purely elastic δ = 0◦, which means that the shear strain
follows faster the stress applied. When the �lm is purely viscous δ = 90◦ and
the strain follows slowly the stress applied.
1.7.3 Newtonian �uids
Newtonian �uids are characterized by a constant dynamic viscosity, indepen-
dent from the angular frequency. This implies a linear relation between the
viscous shear modulus G" and the angular frequency ω:
G” = η · ω. (1.44)
The stress versus strain rate curve is, therefore, linear and passes through
the origin.
1.7.4 Maxwell model
Even in mainly viscous systems, at high frequencies the elastic response of
a material starts to be relevant. In order to study the shear properties of
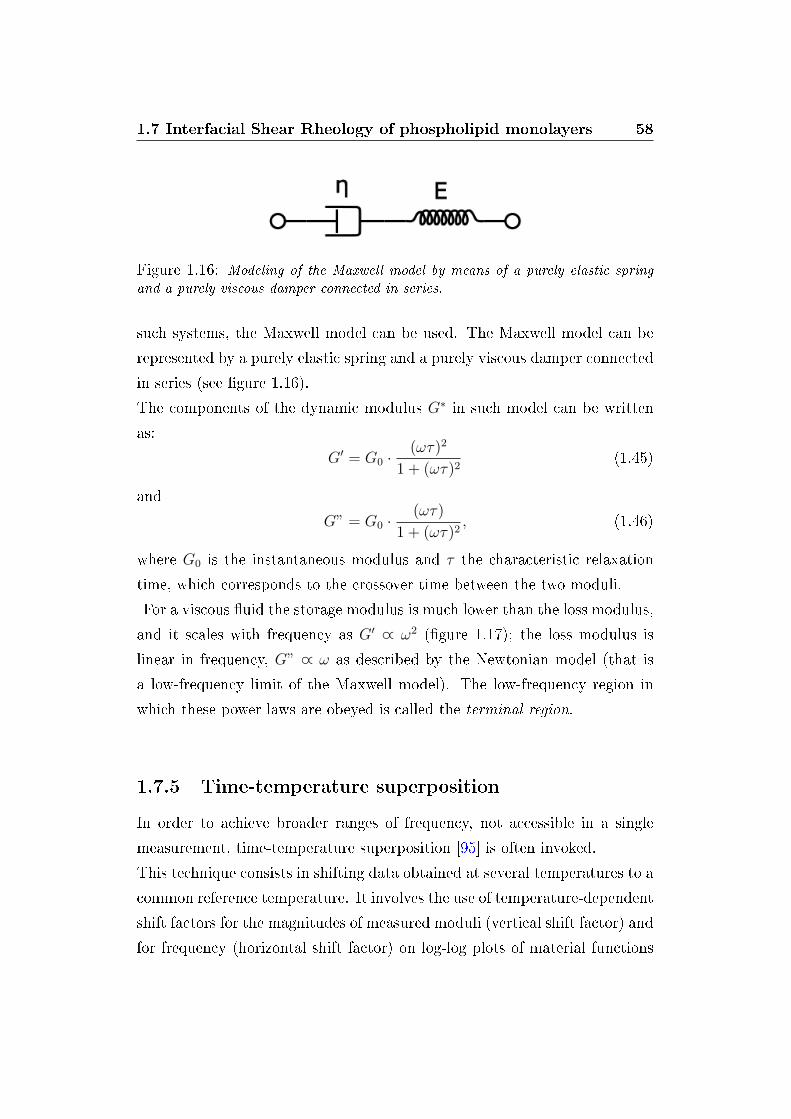
1.7 Interfacial Shear Rheology of phospholipid monolayers 58
Figure 1.16: Modeling of the Maxwell model by means of a purely elastic springand a purely viscous damper connected in series.
such systems, the Maxwell model can be used. The Maxwell model can be
represented by a purely elastic spring and a purely viscous damper connected
in series (see �gure 1.16).
The components of the dynamic modulus G∗ in such model can be written
as:
G′ = G0 ·(ωτ)2
1 + (ωτ)2(1.45)
and
G” = G0 ·(ωτ)
1 + (ωτ)2, (1.46)
where G0 is the instantaneous modulus and τ the characteristic relaxation
time, which corresponds to the crossover time between the two moduli.
For a viscous �uid the storage modulus is much lower than the loss modulus,
and it scales with frequency as G′ ∝ ω2 (�gure 1.17); the loss modulus is
linear in frequency, G” ∝ ω as described by the Newtonian model (that is
a low-frequency limit of the Maxwell model). The low-frequency region in
which these power laws are obeyed is called the terminal region.
1.7.5 Time-temperature superposition
In order to achieve broader ranges of frequency, not accessible in a single
measurement, time-temperature superposition [95] is often invoked.
This technique consists in shifting data obtained at several temperatures to a
common reference temperature. It involves the use of temperature-dependent
shift factors for the magnitudes of measured moduli (vertical shift factor) and
for frequency (horizontal shift factor) on log-log plots of material functions
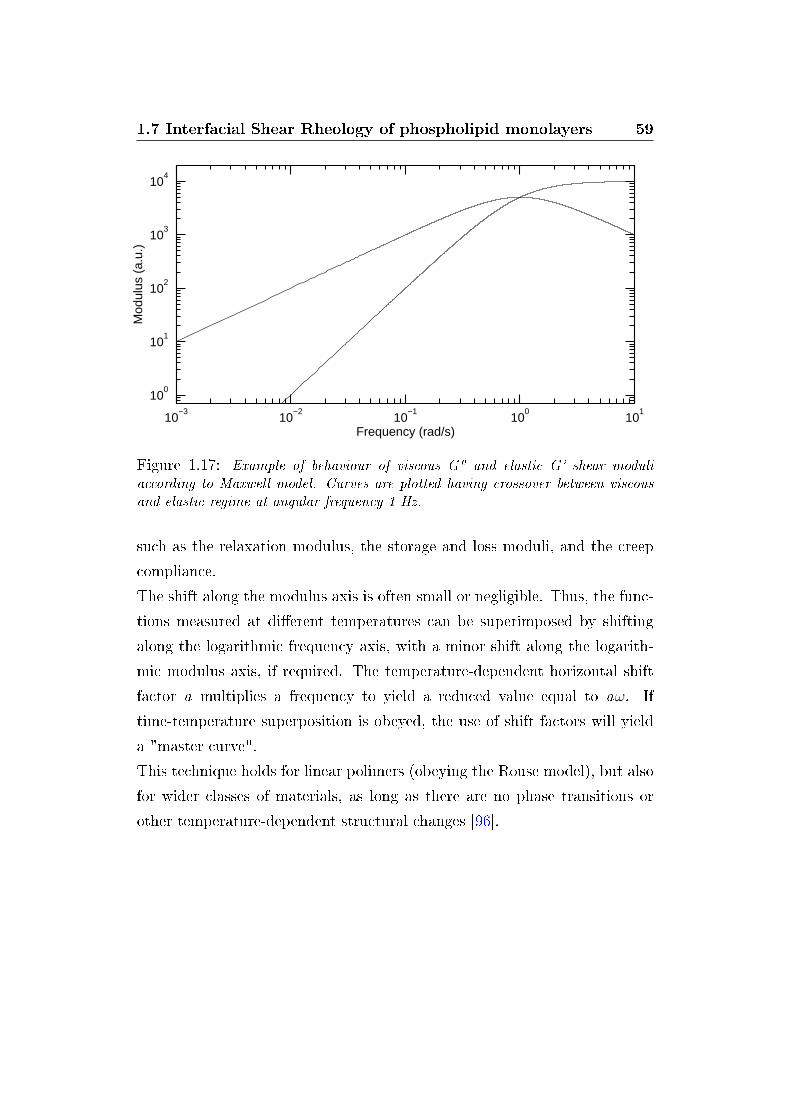
1.7 Interfacial Shear Rheology of phospholipid monolayers 59
10−3
10−2
10−1
100
101
100
101
102
103
104
Mod
ulus
(a.
u.)
Frequency (rad/s)
Figure 1.17: Example of behaviour of viscous G" and elastic G' shear moduliaccording to Maxwell model. Curves are plotted having crossover between viscousand elastic regime at angular frequency 1 Hz.
such as the relaxation modulus, the storage and loss moduli, and the creep
compliance.
The shift along the modulus axis is often small or negligible. Thus, the func-
tions measured at di�erent temperatures can be superimposed by shifting
along the logarithmic frequency axis, with a minor shift along the logarith-
mic modulus axis, if required. The temperature-dependent horizontal shift
factor a multiplies a frequency to yield a reduced value equal to aω. If
time-temperature superposition is obeyed, the use of shift factors will yield
a "master curve".
This technique holds for linear polimers (obeying the Rouse model), but also
for wider classes of materials, as long as there are no phase transitions or
other temperature-dependent structural changes [96].
Chapter 2
Materials and methods
2.1 Materials
DOPC, DPPC and POPE were purchased from Avanti Polar Lipids in 25
mg/ml chloroform solutions. The lipid solutions in chloroform were kept at
-20 ◦C in order to limit the oxidation of phospholipids and the formation of
lysolipids.
Stock solution of DOPC was diluted to 3 mg/ml. 1% in weight Texas-Red
DHPE (Invitrogen) was added to DOPC for �uorescent imaging.
100 mM sucrose solution and 100 mM and 125 mM glucose solutions (Sigma-
Aldrich) were used for vesicles formation and suspension respectively (100
mM glucose solution was used for size distribution analysis, 125 mM glucose
solution was used for �ickering analysis). Milli-Q water was used.
2-(N-morpholino)ethanesulfonic acid (MES) was purchased from Sigma-Aldrich
(P.N. M1317) as 1 M solution.
Aivlosin (Mw = 1192.3) was supplied as tartrate salt (provided by Dr David
Brown, Dept of Viriology, Cambridge University). Azithromycin (Mw =
748.98) and Clarithromycin (Mw = 747.95) were purchased from Fluka (Sig-
maAldrich; P.N. 75199 and C9742, respectively). Since Azithromycin and
Clarithromycin are sparingly soluble in water at pH 7.0 [97], but very soluble
at acidic pH, two stock 100 mM sucrose solutions were prepared by dissolving
2.2 Experimental Methods 61
2.99 mg of drug in 10 ml 0.1 M HCl (399.2 mM) and adding 267 µl MES
solution (26.7 mM). Further dilution in Milli-Q water before analysis allowed
to reach a �nal pH = 6.3 (by titration with NaOH), concentration of MES 10
mM, and concentration of drug 50 µM or 150 µM. The salt form of Aivlosin
also allowed high solubility at not acidic pH, so the same procedure as for
Azithromycin and Clarithromycin was followed but without HCl.
Immersion oil (density 1.09 g/cm3) for micro�uidic experiments was pur-
chased from Sigma-Aldrich.
2.2 Experimental Methods
In this section, the protocols used for the experiments discussed in later
chapters are described. First, the protocol for the production of GUVs is
presented. We next describe microscopy imaging of GUVs followed by tec-
niques used to prepare and study DOPC monolayers. Finally, Di�erential
Scanning Calorimetry and micro�uidics are described.
2.2.1 GUVs preparation: Electroformation method
The classical electroformation technique originally developed by Angelova
and Dimitrov [24] and modi�ed by Mathivet et al. [100] was used to prepare
the DOPC-GUVs.
A chamber was constructed with a pair of conducting indium tin oxide (ITO)-
coated glass microscope slides. For each sample 25 µl of a DOPC solution (3
mg/ml in chloroform, 1% in weight of �uorescent dye) were deposited onto
the conductive face of one slide, forming a �lm as uniform as possible with
the tip of pipette. The complete evaporation of the solvent was achieved by
vacuum drying overnight.
Two te�on spacers of ∼ 0.5 mm were placed between the two slides, with the
2.2 Experimental Methods 62
conductive faces oriented toward each other. The system was held together
with small clips, sealing one aperture with vacuum grease and a stripe of
para�lm. An aqueous solution of 100mM sucrose was injected between slides
from the still open aperture, then sealing it with a stripe of para�lm.
A power supply generated a low-frequency voltage (10 Hz, 1 V peak to peak).
Giant vesicles were obtained in 1.5 hours and then recovered by suction with
a pipette.
The main mechanism behind the GUVs formation seems to be the electro-
swelling: the lipid �lm is swelled to increase the curvature of lipid �lm [102].
The details are not fully understood, but the protocol yields a mostly unil-
amellar sample as checked in [24] and [101].
2.2.2 Microscopy for size and �ickering analysis
Sample preparation
After formation, vesicles were suspended in acqueous solution containing 100
mM sucrose, 10 mM MES bu�er solution (pH 6.3) and antibiotic (Aivlosin,
Azithromycin or Clarithromycin, earlier 50 µM and then 150 µM for each
one). Control vesicles were suspended only in bu�ered sucrose solution.
Seven samples of suspended vesicles (one for each concentration with each
drug plus the control sample) were analysed after 5 hours, 1 day and 2 days
of incubation.
Just before observation under microscope, vesicle suspensions were mixed
with acqueous solution containing 100 mM or 125 mMGlucose (for size distri-
bution and �ickering analysis respectively) and 10 mM MES bu�er solution.
Then the vesicles were carefully transferred into the observation chamber for
visualization.
Observation chambers were prepared balancing a cover slip (18 x 18 mm)
between two other cover slips, lengthways along a microscope slide. A drop
2.2 Experimental Methods 63
of optical adhesive (Norland Optical Adhesive 61) was placed under the mid-
dle of each free side of the supported cover slip, being careful to leave the
supporting cover slips free. The glue was cured under a UV lamp for a few
minutes. The supporting cover slips were then removed. More adhesive was
added to form a chamber (a space of ∼ 1 cm diameter) with two narrow
diametrically opposite apertures (1-2 mm) at either end. The glue was cured
again, then the sample (vesicles suspension, 40 µl) added using a pipettor
before sealing o� the ends of the chamber with vacuum seal to avoid evap-
oration. The �nal inner thickness of the chamber was of the order of ∼ 200
µm.
Glucose and sucrose, classically used for phase contrast microscopy exper-
iments, enhance the contrast of the vesicles because of their di�erences in
refraction index. Due to their slight di�erence in density, they also drive
vesicles towards the bottom of the chamber where they can be easily ob-
served.
The sugar solutions were �ltered using a 0.22 µm �lter beforehand to remove
any particle which could perturb the vesicle analysis.
Since not all lipid initially deposited on the ITO-coated slide becomes orga-
nized in giant vesicles, it was not possible to evaluate the exact amount of
phospholipid transferred in the observation chambers.
Experimental setup
Vesicles were observed using a Zeiss LSM510 confocal microscope platform,
but in conventional imaging. A 10x objective was selected for size analysis
and 40x phase objective for �ickering analysis.
In vesicle samples, where size analysis was to be performed, a �uorescent dye
(Texas-Red DHPE) was added to the lipid solution (1% weight) before elec-
troformation. Texas-Red DHPE, which has an excitation peak at 584 nm,
and emission at 608 nm, was found to have no appreciable photobleaching
over the experimental timescale of several minutes. Then the vesicles were
2.2 Experimental Methods 64
imaged with a green-red �lter set (Zeiss Filter Set 15, excitation: BP 546/12,
emission: LP 590) and a 10x dry objective (Zeiss). The low 10x magni�ca-
tion was used to obtain a large number of vesicles per image, and to give a
large depth of focus to image the whole vesicle, rather than just the equator.
Epi�uorescence was found to give better contrast than bright-�eld methods:
thus, a �uorescence Mercury lamp was used to illuminate the vesicles from
the dark background. Three sets of 30 pictures were taken for each sample
and averaged to obtain mean behaviours for each time of incubation (5 hours,
1 day, 2 days).
For the thermal �uctuation analysis the image series were recorded in phase
contrast on a CCD camera at 60 frames per seconds. With the objective
used (40x) the pixel size was of the order of 200 nm. About 300 vesicles
were analysed, capturing up to 7000 contours for each of them. The �uctu-
ating membrane contour was detected by an algorithm developed in-house
and coded in MatLab (see subsection 2.3.2). Mean values and standard de-
viations were obtained from the several vesicles analysed.
All measurements were performed at room temperature (∼ 23◦C).
2.2.3 Interfacial Shear Rheology (ISR)
Instrument description
The design of the instrument follows that described in [93].
A custom Langmuir trough made of Te�on was used for all measurements.
The trough sizes were 31 cm x 8.5 cm x 0.7 cm. Two hydrophobic Te�on
barriers were moved simmetrically to change the surface concentration of the
surfactant molecules at the interface. The surface pressure was monitored
using a Wilhelmy balance.
Two solenoid rings (R = 16 cm) were aligned parallel, separated by one ring
radius (Helmoltz con�guration). The trough was positioned so that the plane
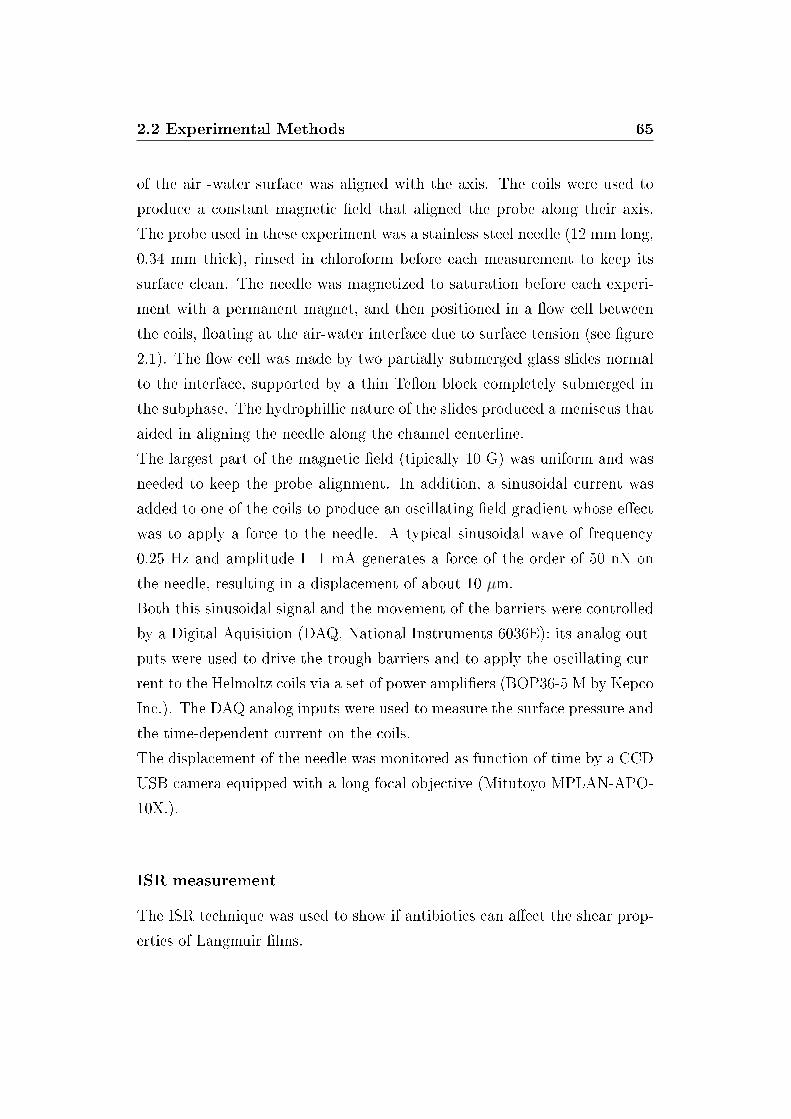
2.2 Experimental Methods 65
of the air -water surface was aligned with the axis. The coils were used to
produce a constant magnetic �eld that aligned the probe along their axis.
The probe used in these experiment was a stainless steel needle (12 mm long,
0.34 mm thick), rinsed in chloroform before each measurement to keep its
surface clean. The needle was magnetized to saturation before each experi-
ment with a permanent magnet, and then positioned in a �ow cell between
the coils, �oating at the air-water interface due to surface tension (see �gure
2.1). The �ow cell was made by two partially submerged glass slides normal
to the interface, supported by a thin Te�on block completely submerged in
the subphase. The hydrophillic nature of the slides produced a meniscus that
aided in aligning the needle along the channel centerline.
The largest part of the magnetic �eld (tipically 10 G) was uniform and was
needed to keep the probe alignment. In addition, a sinusoidal current was
added to one of the coils to produce an oscillating �eld gradient whose e�ect
was to apply a force to the needle. A typical sinusoidal wave of frequency
0.25 Hz and amplitude I=1 mA generates a force of the order of 50 nN on
the needle, resulting in a displacement of about 10 µm.
Both this sinusoidal signal and the movement of the barriers were controlled
by a Digital Aquisition (DAQ, National Instruments 6036E): its analog out-
puts were used to drive the trough barriers and to apply the oscillating cur-
rent to the Helmoltz coils via a set of power ampli�ers (BOP36-5 M by Kepco
Inc.). The DAQ analog inputs were used to measure the surface pressure and
the time-dependent current on the coils.
The displacement of the needle was monitored as function of time by a CCD
USB camera equipped with a long focal objective (Mitutoyo MPLAN-APO-
10X.).
ISR measurement
The ISR technique was used to show if antibiotics can a�ect the shear prop-
erties of Langmuir �lms.
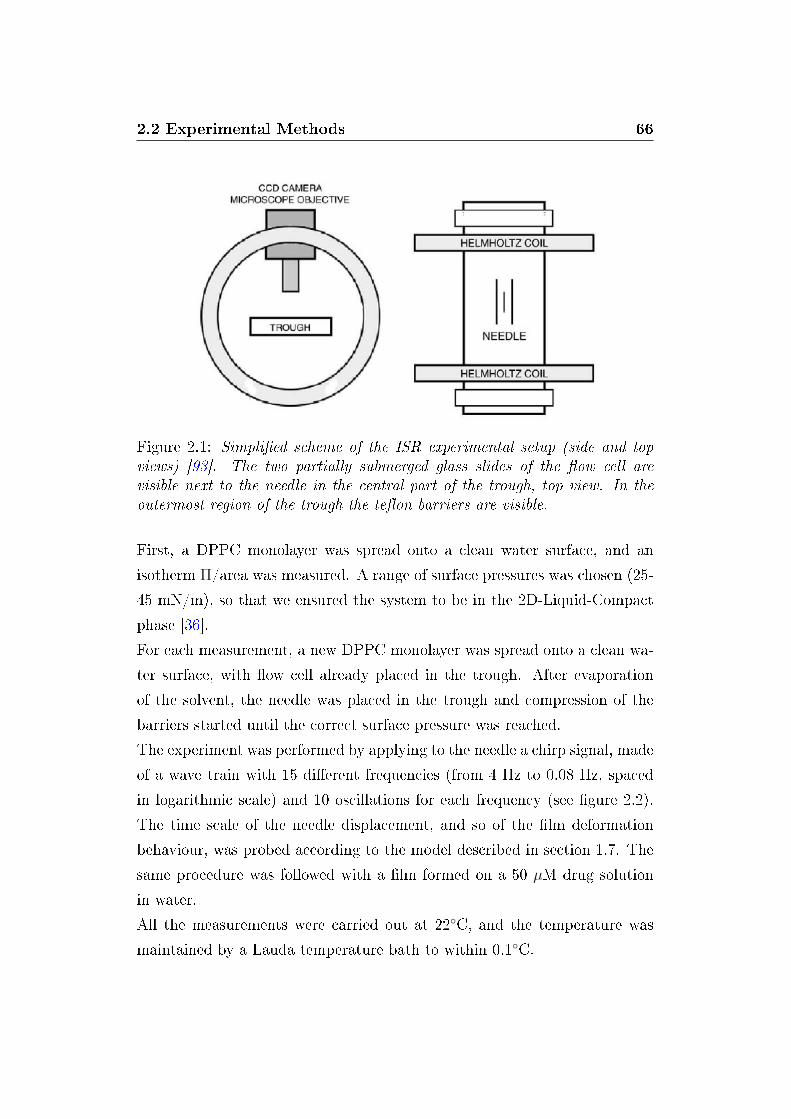
2.2 Experimental Methods 66
Figure 2.1: Simpli�ed scheme of the ISR experimental setup (side and topviews) [93]. The two partially submerged glass slides of the �ow cell arevisible next to the needle in the central part of the trough, top view. In theoutermost region of the trough the te�on barriers are visible.
First, a DPPC monolayer was spread onto a clean water surface, and an
isotherm Π/area was measured. A range of surface pressures was chosen (25-
45 mN/m), so that we ensured the system to be in the 2D-Liquid-Compact
phase [36].
For each measurement, a new DPPC monolayer was spread onto a clean wa-
ter surface, with �ow cell already placed in the trough. After evaporation
of the solvent, the needle was placed in the trough and compression of the
barriers started until the correct surface pressure was reached.
The experiment was performed by applying to the needle a chirp signal, made
of a wave train with 15 di�erent frequencies (from 4 Hz to 0.08 Hz, spaced
in logarithmic scale) and 10 oscillations for each frequency (see �gure 2.2).
The time scale of the needle displacement, and so of the �lm deformation
behaviour, was probed according to the model described in section 1.7. The
same procedure was followed with a �lm formed on a 50 µM drug solution
in water.
All the measurements were carried out at 22◦C, and the temperature was
maintained by a Lauda temperature bath to within 0.1◦C.
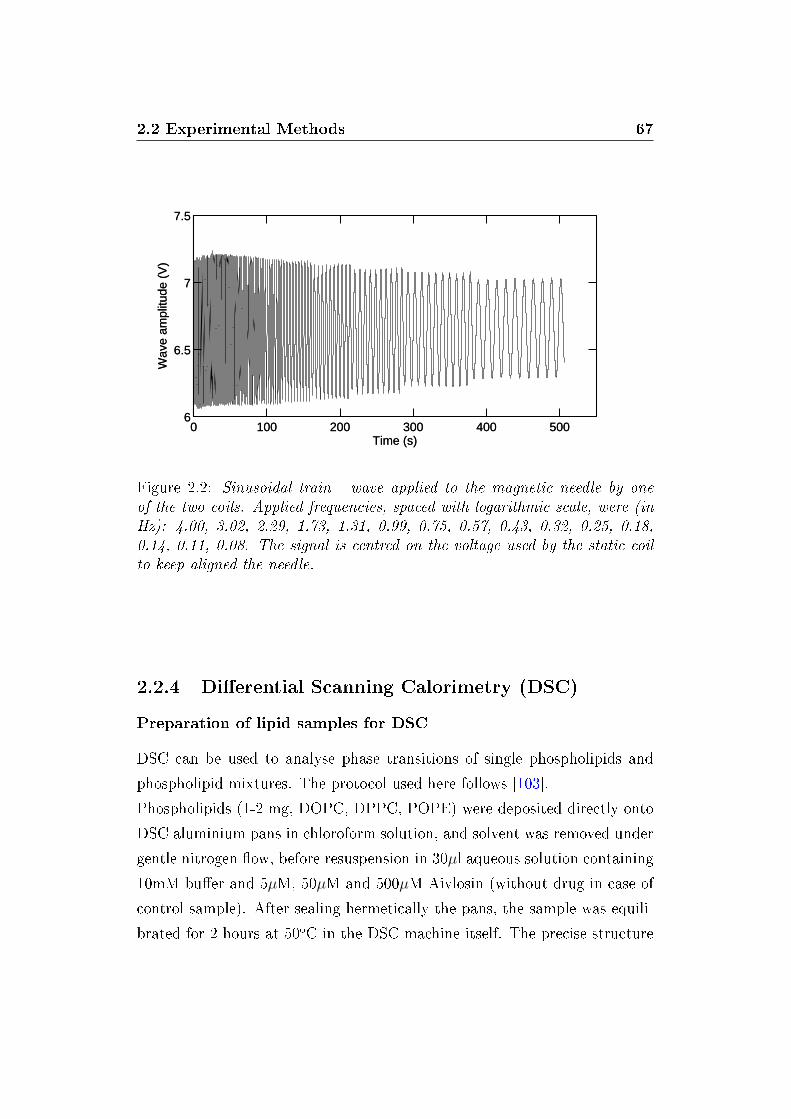
2.2 Experimental Methods 67
0 100 200 300 400 5006
6.5
7
7.5
Time (s)
Wav
e am
plitu
de (
V)
0 100 200 300 400 5006
6.5
7
7.5
Time (s)
Wav
e am
plitu
de (
V)
Figure 2.2: Sinusoidal train - wave applied to the magnetic needle by oneof the two coils. Applied frequencies, spaced with logarithmic scale, were (inHz): 4.00, 3.02, 2.29, 1.73, 1.31, 0.99, 0.75, 0.57, 0.43, 0.32, 0.25, 0.18,0.14, 0.11, 0.08. The signal is centred on the voltage used by the static coilto keep aligned the needle.
2.2.4 Di�erential Scanning Calorimetry (DSC)
Preparation of lipid samples for DSC
DSC can be used to analyse phase transitions of single phospholipids and
phospholipid mixtures. The protocol used here follows [103].
Phospholipids (1-2 mg, DOPC, DPPC, POPE) were deposited directly onto
DSC aluminium pans in chloroform solution, and solvent was removed under
gentle nitrogen �ow, before resuspension in 30µl aqueous solution containing
10mM bu�er and 5µM, 50µM and 500µM Aivlosin (without drug in case of
control sample). After sealing hermetically the pans, the sample was equili-
brated for 2 hours at 50oC in the DSC machine itself. The precise structure
2.2 Experimental Methods 68
of the lipid bilayers produced by this method is unclear. There are probably a
mixture of unilamellar and multilamellar vesicles, together with a connected
stack of bilayers.
DSC measurements
DSC measurements were performed with a Perkins-Elmer Pyrus I heat con-
duction machine. Water was used in reference pan.
Temperature range studied with DOPC was -5◦C and -35◦C (so that liquid-
solid water transition was avoided). After equilibration at 50◦C, the tem-
perature was decreased to -5◦C at high cooling rate (100◦C/min), and the
following temperature scan was applied to the sample:
1) sample was mantained at -5◦C for 2 minutes;
2) it was then cooled to -35◦C at 10◦C/min rate and mantained for 5
minutes;
3) temperature was increased again to -5◦C at 10◦C/min.
Thermal steps from 1 to 3 were repeated three times to ensure constancy
and good repeatability of the data and to erase the thermal history of the
sample.
Due to supercooling phenomenon and in accordance with [104] thermotropic
transitions were more accurately evaluated from heating curves. Conseguently,
only heating scans have been used throughout this work.
A similar equilibration procedure was followed with DPPC and POPE,
but avoiding complete evaporation of solution from the pan was very hard.
Probably this was due to their di�erent physical properties in comparison
with DOPC (the main transition temperature of the latter is much lower
than that of DPPC and DOPC; see section 1.4). Thus, measurements with
DPPC and POPE were not performed.
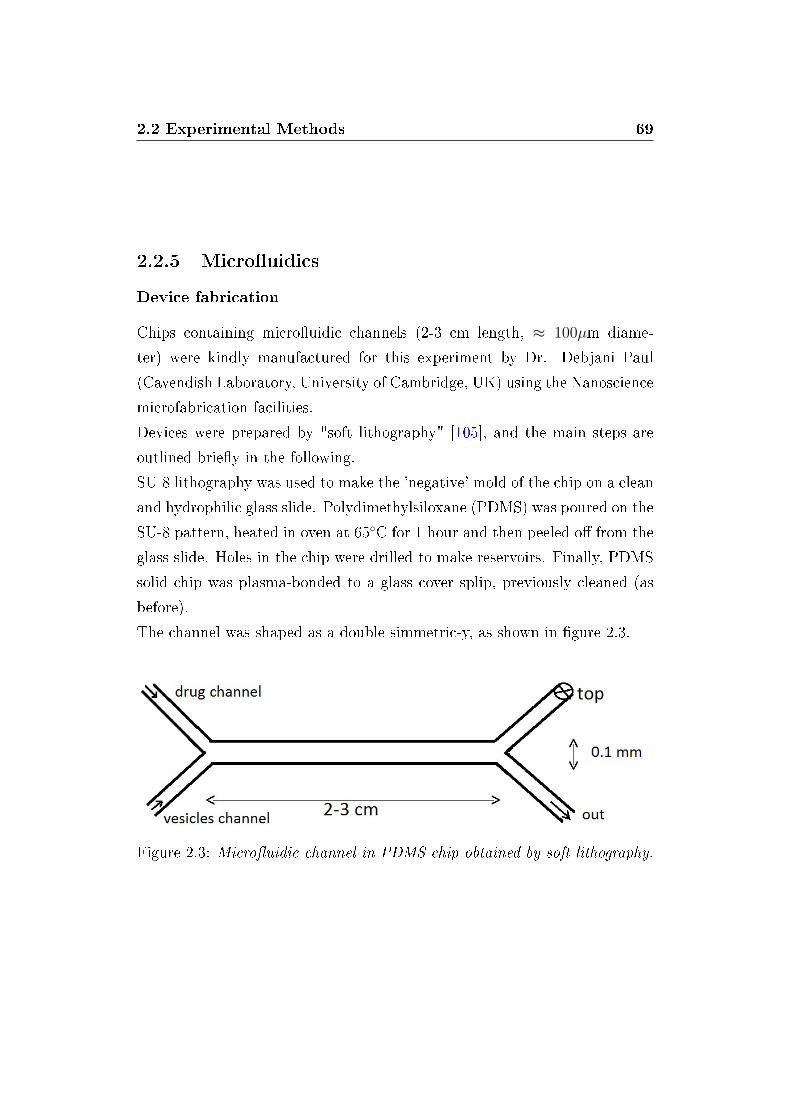
2.2 Experimental Methods 69
2.2.5 Micro�uidics
Device fabrication
Chips containing micro�uidic channels (2-3 cm length, ≈ 100µm diame-
ter) were kindly manufactured for this experiment by Dr. Debjani Paul
(Cavendish Laboratory, University of Cambridge, UK) using the Nanoscience
microfabrication facilities.
Devices were prepared by "soft lithography" [105], and the main steps are
outlined brie�y in the following.
SU-8 lithography was used to make the 'negative' mold of the chip on a clean
and hydrophilic glass slide. Polydimethylsiloxane (PDMS) was poured on the
SU-8 pattern, heated in oven at 65◦C for 1 hour and then peeled o� from the
glass slide. Holes in the chip were drilled to make reservoirs. Finally, PDMS
solid chip was plasma-bonded to a glass cover splip, previously cleaned (as
before).
The channel was shaped as a double simmetric-y, as shown in �gure 2.3.
Figure 2.3: Micro�uidic channel in PDMS chip obtained by soft lithography.
2.2 Experimental Methods 70
Fluidics and stopped-�ow analysis
DOPC-GUVs were used in micro�uidic experiments. After electroformation
they were poured in an eppendorf (diluted 100 times in 100 mM sucrose, to
prevent obstruction of the channel from vesicles), in which the end of the
inlet tube was inserted. A 150 µM Clarithromycin solution (in 100 mM su-
crose) was poured in a di�erent eppendorf and connected to the device as
before.
Fluids were delivered in the channel pulling with a precision syringe pump
(Harvard Apparatus, '11' Plus, single syringe) out�tted with a 50ml syringe
on the output stream. The silicone tubing (Altec, UK) was 1.50mm bore
diameter and 0.50mm wall thickness.
The typical �ow rate, determined by the dispense rate of the syringe pump,
was 0.001 ml/min. This low �ow rate ensures laminar �ow of the �uids, that,
in turn, prevents vesicles from reacting with drug. The analysis was led in
stopped-�ow mode: when rapid injection ends, which happens abruptly when
the syringe reaches a physical stop, the two �uids begin reacting. This static
regime was used to look for the instantaneous e�ects of the exposition to
the drug on vesicles: buddings, for example, can happen on very short time-
scales, not observable by simple optical microscopy.
Optical detection
In order to observe the �ows of vesicles and drug solution inside the channels,
an inverted Leica TCS SP5 confocal microscope was used (but in conventional
imaging mode). The glass side of the chip was placed down on the stage,
facing the microscope objective. A 10x oil immersion objective was used for
all measurements. A mercury arc lamp was used as light source and the �lter
set to make �uorescence measurements. Fluorescence emission was collected
using a CCD camera.
2.3 Data analysis 71
2.3 Data analysis
In the next section, the methods of analysis of the imaging data, both in the
case of size distribution and �ickering experiments will be discussed. Then
the analysis of the ISR data will be brie�y described.
2.3.1 Size distributions of vesicles
Vesicle size distributions were obtained by computationally segmenting epi-
�uorescent images of �uorescent vesicles.
Size analysis of vesicles was performed by means of an in-house program
coded in Matlab. A suitable threshold was chosen, and the image was thresh-
olded. The choice of threshold could be automated by scaling the intensity
levels of each image. In practice it was found that under identical optical
settings, the same threshold could be used for each image. Each bright re-
gion in the thresholded image was identi�ed as a vesicle, and the e�ective
diameter was calculated from that of the smallest convex polygon that can
contain the region (see �gure 2.4). Also, the diameter was calculated from
the squareroot of the number of pixels in the region. As there were very few
dark pixels inside the vesicles, the convex area was not di�erent from the
number of pixels. An eccentricity parameter was initially set for excluding
the vesicles, as in [69]. In practice, in the samples studied in this work this
was not necessary, because there were no really non-spherical vesicles.
Number and radii of all the vesicles detected in the pictures of a kind of sam-
ple were stored. A size distribution (normalized by the number of vesicles
detected in each sample) was plotted and constituted the function on which
to check the e�ect of drugs.
In previous works size distributions of lipid vesicles have already been stud-
ied [106]. If the spontaneous curvature is zero and κ is assumed to be positive,
which should in general be true, the shape of lowest energy of such vesicles is
spherical. The thermodynamic predictions of average vesicle radii distribu-
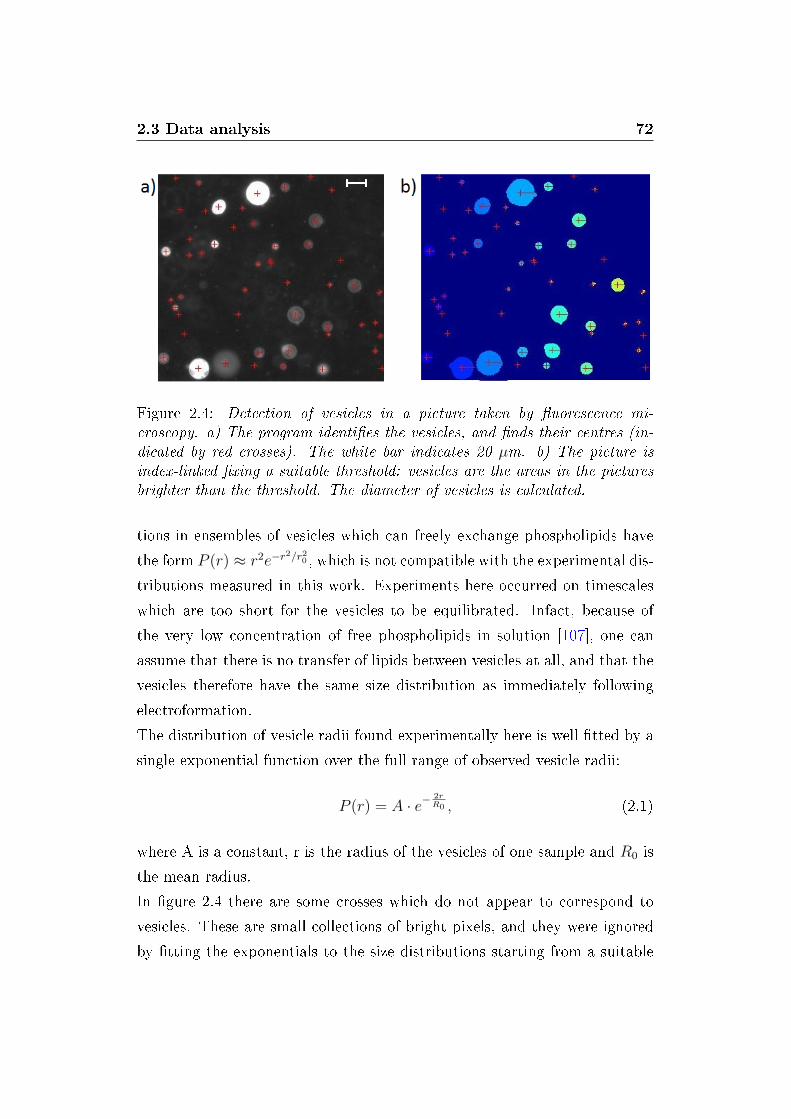
2.3 Data analysis 72
Figure 2.4: Detection of vesicles in a picture taken by �uorescence mi-croscopy. a) The program identi�es the vesicles, and �nds their centres (in-dicated by red crosses). The white bar indicates 20 µm. b) The picture isindex-linked �xing a suitable threshold: vesicles are the areas in the picturesbrighter than the threshold. The diameter of vesicles is calculated.
tions in ensembles of vesicles which can freely exchange phospholipids have
the form P (r) ≈ r2e−r2/r20 , which is not compatible with the experimental dis-
tributions measured in this work. Experiments here occurred on timescales
which are too short for the vesicles to be equilibrated. Infact, because of
the very low concentration of free phospholipids in solution [107], one can
assume that there is no transfer of lipids between vesicles at all, and that the
vesicles therefore have the same size distribution as immediately following
electroformation.
The distribution of vesicle radii found experimentally here is well �tted by a
single exponential function over the full range of observed vesicle radii:
P (r) = A · e−2rR0 , (2.1)
where A is a constant, r is the radius of the vesicles of one sample and R0 is
the mean radius.
In �gure 2.4 there are some crosses which do not appear to correspond to
vesicles. These are small collections of bright pixels, and they were ignored
by �tting the exponentials to the size distributions starting from a suitable
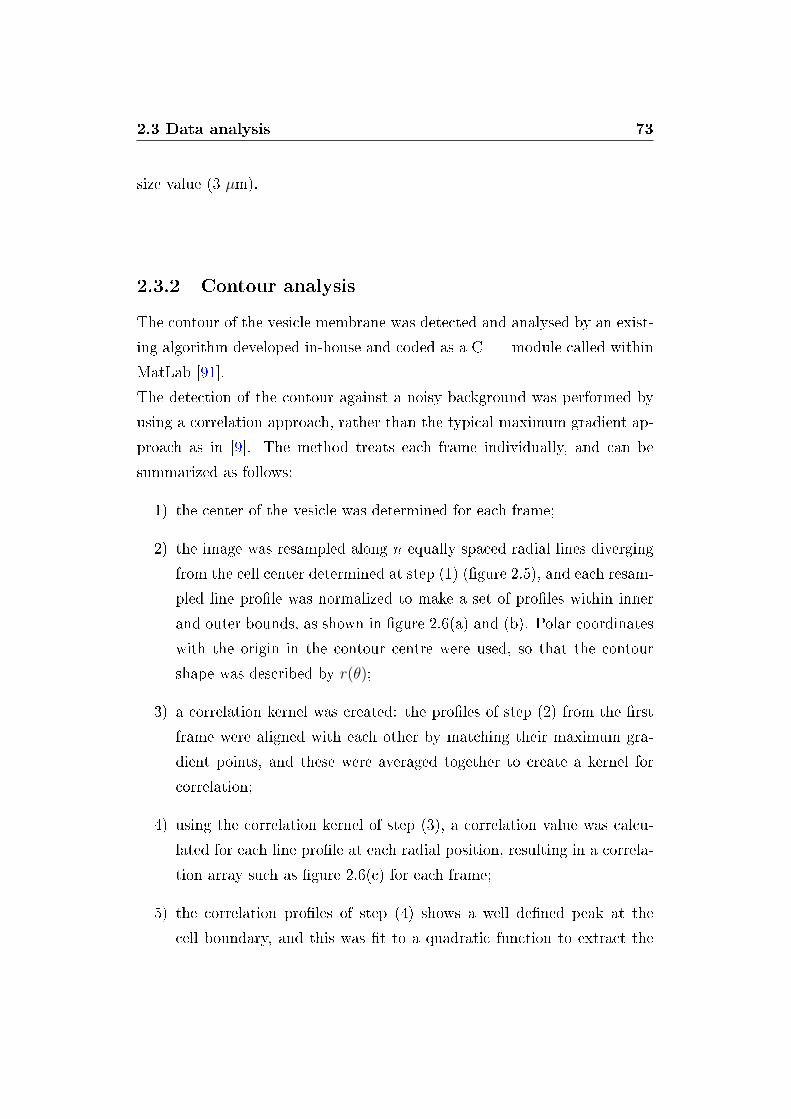
2.3 Data analysis 73
size value (3 µm).
2.3.2 Contour analysis
The contour of the vesicle membrane was detected and analysed by an exist-
ing algorithm developed in-house and coded as a C++ module called within
MatLab [91].
The detection of the contour against a noisy background was performed by
using a correlation approach, rather than the typical maximum gradient ap-
proach as in [9]. The method treats each frame individually, and can be
summarized as follows:
1) the center of the vesicle was determined for each frame;
2) the image was resampled along n equally spaced radial lines diverging
from the cell center determined at step (1) (�gure 2.5), and each resam-
pled line pro�le was normalized to make a set of pro�les within inner
and outer bounds, as shown in �gure 2.6(a) and (b). Polar coordinates
with the origin in the contour centre were used, so that the contour
shape was described by r(θ);
3) a correlation kernel was created: the pro�les of step (2) from the �rst
frame were aligned with each other by matching their maximum gra-
dient points, and these were averaged together to create a kernel for
correlation;
4) using the correlation kernel of step (3), a correlation value was calcu-
lated for each line pro�le at each radial position, resulting in a correla-
tion array such as �gure 2.6(c) for each frame;
5) the correlation pro�les of step (4) shows a well de�ned peak at the
cell boundary, and this was �t to a quadratic function to extract the
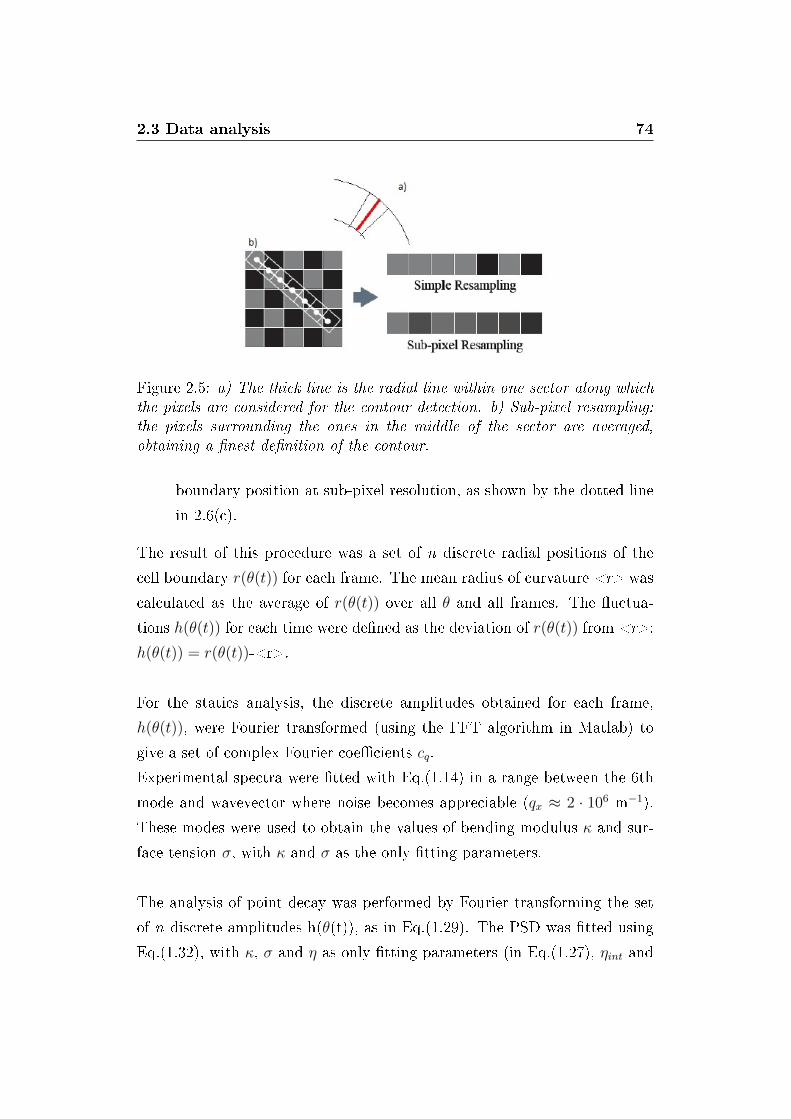
2.3 Data analysis 74
Figure 2.5: a) The thick line is the radial line within one sector along whichthe pixels are considered for the contour detection. b) Sub-pixel resampling:the pixels surrounding the ones in the middle of the sector are averaged,obtaining a �nest de�nition of the contour.
boundary position at sub-pixel resolution, as shown by the dotted line
in 2.6(c).
The result of this procedure was a set of n discrete radial positions of the
cell boundary r(θ(t)) for each frame. The mean radius of curvature <r> was
calculated as the average of r(θ(t)) over all θ and all frames. The �uctua-
tions h(θ(t)) for each time were de�ned as the deviation of r(θ(t)) from <r>:
h(θ(t)) = r(θ(t))-<r>.
For the statics analysis, the discrete amplitudes obtained for each frame,
h(θ(t)), were Fourier transformed (using the FFT algorithm in Matlab) to
give a set of complex Fourier coe�cients cq.
Experimental spectra were �tted with Eq.(1.14) in a range between the 6th
mode and wavevector where noise becomes appreciable (qx ≈ 2 · 106 m−1).
These modes were used to obtain the values of bending modulus κ and sur-
face tension σ, with κ and σ as the only �tting parameters.
The analysis of point decay was performed by Fourier transforming the set
of n discrete amplitudes h(θ(t)), as in Eq.(1.29). The PSD was �tted using
Eq.(1.32), with κ, σ and η as only �tting parameters (in Eq.(1.27), ηint and
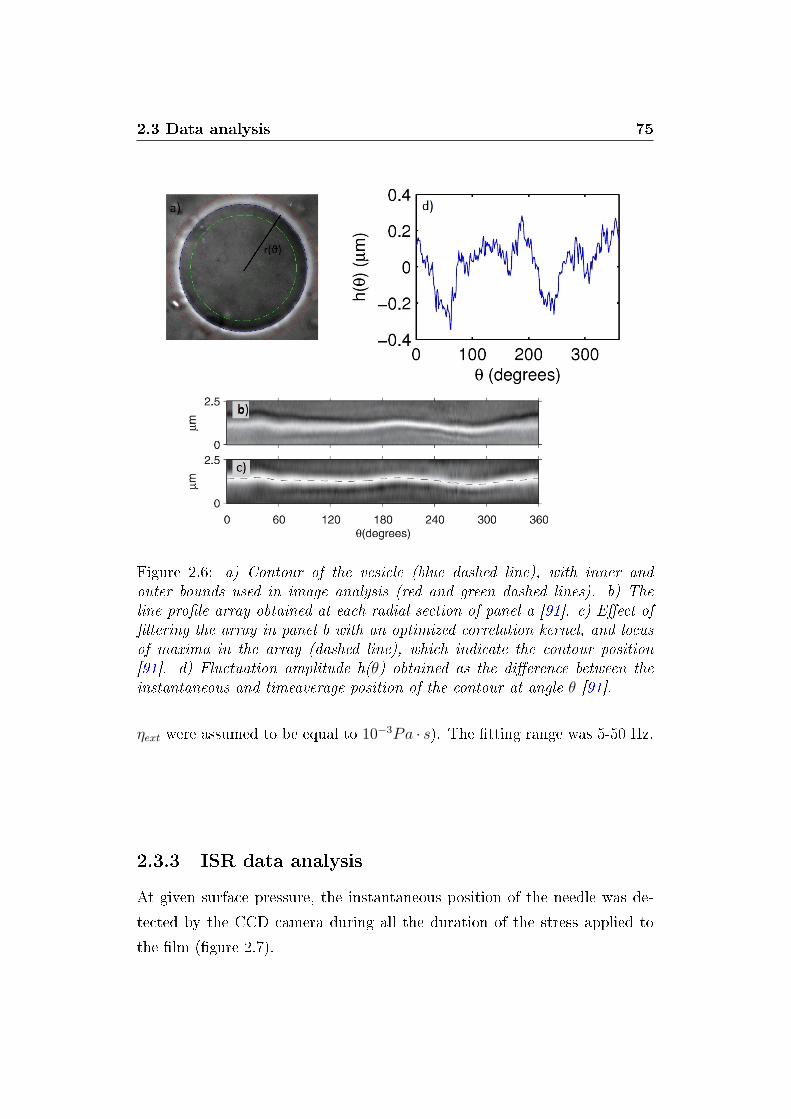
2.3 Data analysis 75
Figure 2.6: a) Contour of the vesicle (blue dashed line), with inner andouter bounds used in image analysis (red and green dashed lines). b) Theline pro�le array obtained at each radial section of panel a [91]. c) E�ect of�ltering the array in panel b with an optimized correlation kernel, and locusof maxima in the array (dashed line), which indicate the contour position[91]. d) Fluctuation amplitude h(θ) obtained as the di�erence between theinstantaneous and timeaverage position of the contour at angle θ [91].
ηext were assumed to be equal to 10−3Pa · s). The �tting range was 5-50 Hz.
2.3.3 ISR data analysis
At given surface pressure, the instantaneous position of the needle was de-
tected by the CCD camera during all the duration of the stress applied to
the �lm (�gure 2.7).
2.3 Data analysis 76
In order to extract the mechanical properties of the �lm from the needle dis-
placement, we had �rst to subtract a slow, non periodic, drift in the needle
position which may be due to di�erent spurious factors (�gure 2.7). To this
aim the time evolution of the needle position was reproduced by a slowly
varying spline interpolant (of order 12), which was then subtracted, leaving
the periodic oscillations as the only displacement. A sine function was used
to �t to these periodic oscillations (one sine was used for each single part
of the train-wave, known its frequency and calculating its amplitude and
phase; �gure 2.8); an analogous �t with a sine function was performed on
each part of the applied wave. The amplitude ratio AR and phase shift δ(ω)
were obtained by Eq. (1.43) comparing the two curves. Typical accuracy
was 10−2mN/m.
For the data analysis, frequencies in Hz were converted to angular frequen-
cies, expressed in rad/s.
It has to be noted that in principle both the real and the imaginary parts
G' and G� can simultaneously be obtained. In practice, however, when one
of the two parts dominates the response, the other, smaller part, remains
poorly determined. Often only an upper limit for the smaller quantity can
be determined.
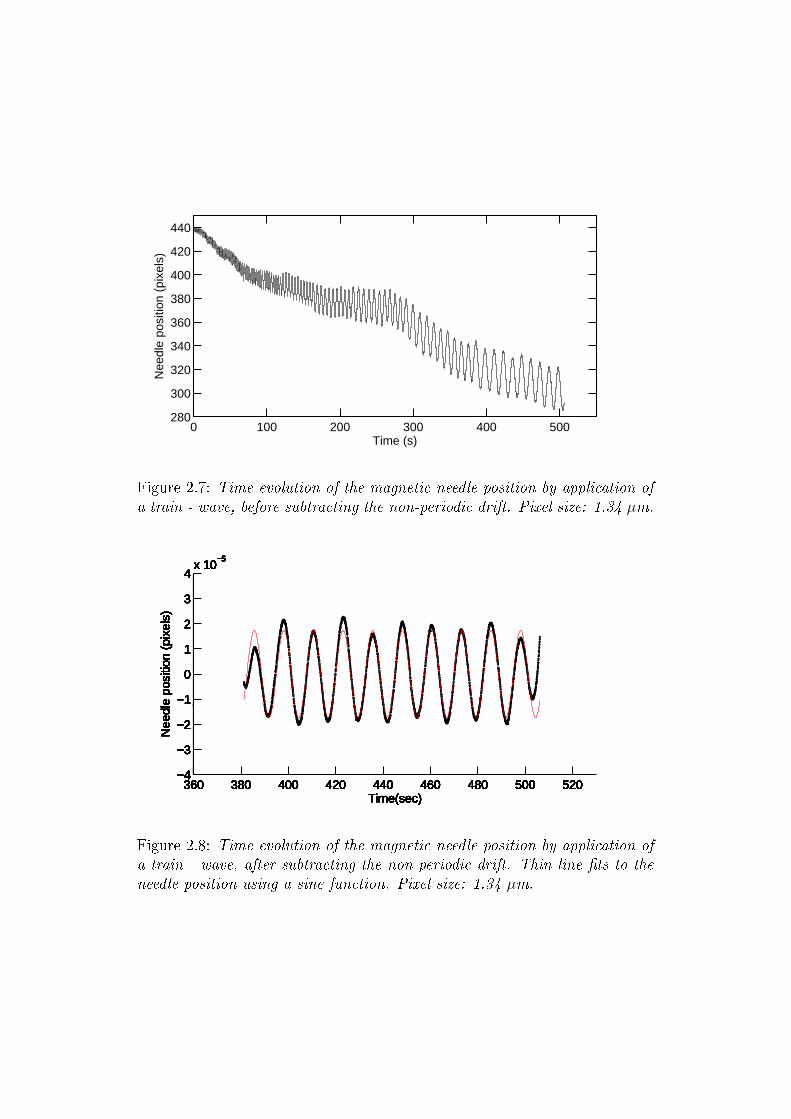
0 100 200 300 400 500280
300
320
340
360
380
400
420
440
Time (s)
Nee
dle
posi
tion
(pix
els)
Figure 2.7: Time evolution of the magnetic needle position by application ofa train - wave, before subtracting the non-periodic drift. Pixel size: 1.34 µm.
360 380 400 420 440 460 480 500 520−4
−3
−2
−1
0
1
2
3
4x 10
−5
Time(sec)
Nee
dle
posi
tion
(pix
els)
360 380 400 420 440 460 480 500 520−4
−3
−2
−1
0
1
2
3
4x 10
−5
Time(sec)
Nee
dle
posi
tion
(pix
els)
360 380 400 420 440 460 480 500 520−4
−3
−2
−1
0
1
2
3
4x 10
−5
Time(sec)
Nee
dle
posi
tion
(pix
els)
360 380 400 420 440 460 480 500 520−4
−3
−2
−1
0
1
2
3
4x 10
−5
Time(sec)
Nee
dle
posi
tion
(pix
els)
360 380 400 420 440 460 480 500 520−4
−3
−2
−1
0
1
2
3
4x 10
−5
Time(sec)
Nee
dle
posi
tion
(pix
els)
360 380 400 420 440 460 480 500 520−4
−3
−2
−1
0
1
2
3
4x 10
−5
Time(sec)
Nee
dle
posi
tion
(pix
els)
360 380 400 420 440 460 480 500 520−4
−3
−2
−1
0
1
2
3
4x 10
−5
Time(sec)
Nee
dle
posi
tion
(pix
els)
360 380 400 420 440 460 480 500 520−4
−3
−2
−1
0
1
2
3
4x 10
−5
Time(sec)
Nee
dle
posi
tion
(pix
els)
360 380 400 420 440 460 480 500 520−4
−3
−2
−1
0
1
2
3
4x 10
−5
Time(sec)
Nee
dle
posi
tion
(pix
els)
360 380 400 420 440 460 480 500 520−4
−3
−2
−1
0
1
2
3
4x 10
−5
Time(sec)
Nee
dle
posi
tion
(pix
els)
360 380 400 420 440 460 480 500 520−4
−3
−2
−1
0
1
2
3
4x 10
−5
Time(sec)
Nee
dle
posi
tion
(pix
els)
360 380 400 420 440 460 480 500 520−4
−3
−2
−1
0
1
2
3
4x 10
−5
Time(sec)
Nee
dle
posi
tion
(pix
els)
360 380 400 420 440 460 480 500 520−4
−3
−2
−1
0
1
2
3
4x 10
−5
Time(sec)
Nee
dle
posi
tion
(pix
els)
360 380 400 420 440 460 480 500 520−4
−3
−2
−1
0
1
2
3
4x 10
−5
Time(sec)
Nee
dle
posi
tion
(pix
els)
360 380 400 420 440 460 480 500 520−4
−3
−2
−1
0
1
2
3
4x 10
−5
Time(sec)
Nee
dle
posi
tion
(pix
els)
Figure 2.8: Time evolution of the magnetic needle position by application ofa train - wave, after subtracting the non-periodic drift. Thin line �ts to theneedle position using a sine function. Pixel size: 1.34 µm.
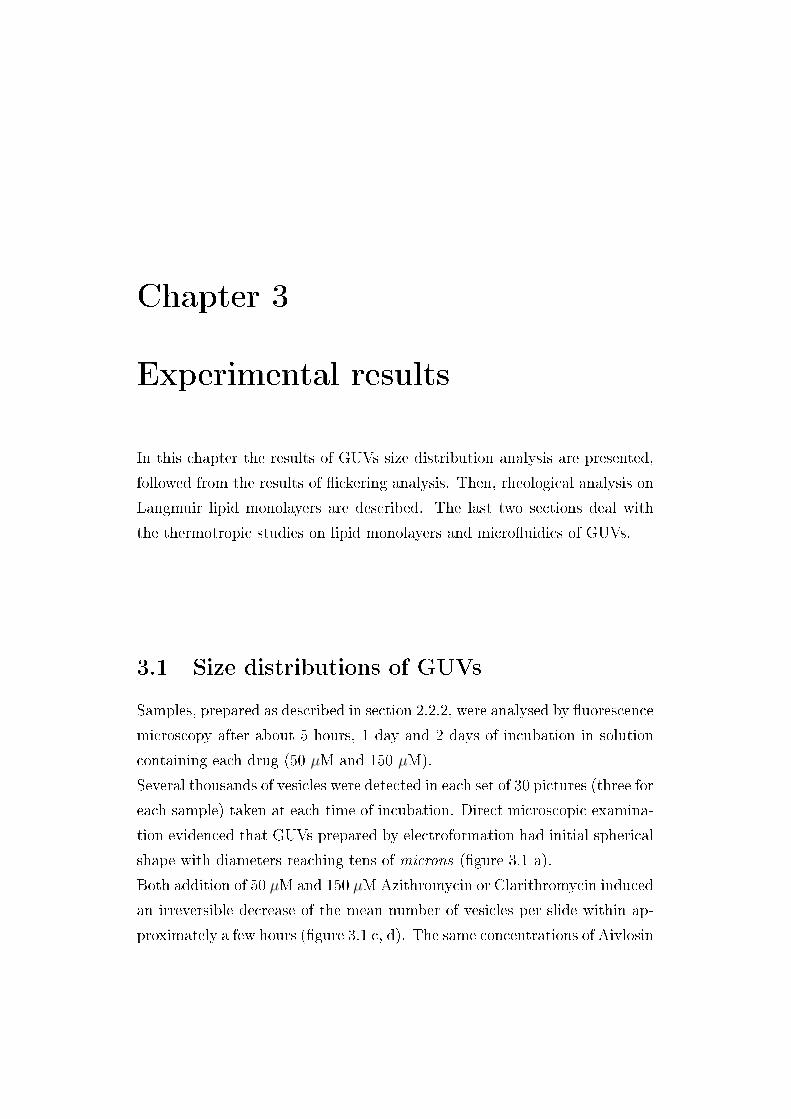
Chapter 3
Experimental results
In this chapter the results of GUVs size distribution analysis are presented,
followed from the results of �ickering analysis. Then, rheological analysis on
Langmuir lipid monolayers are described. The last two sections deal with
the thermotropic studies on lipid monolayers and micro�uidics of GUVs.
3.1 Size distributions of GUVs
Samples, prepared as described in section 2.2.2, were analysed by �uorescence
microscopy after about 5 hours, 1 day and 2 days of incubation in solution
containing each drug (50 µM and 150 µM).
Several thousands of vesicles were detected in each set of 30 pictures (three for
each sample) taken at each time of incubation. Direct microscopic examina-
tion evidenced that GUVs prepared by electroformation had initial spherical
shape with diameters reaching tens of microns (�gure 3.1 a).
Both addition of 50 µM and 150 µMAzithromycin or Clarithromycin induced
an irreversible decrease of the mean number of vesicles per slide within ap-
proximately a few hours (�gure 3.1 c, d). The same concentrations of Aivlosin
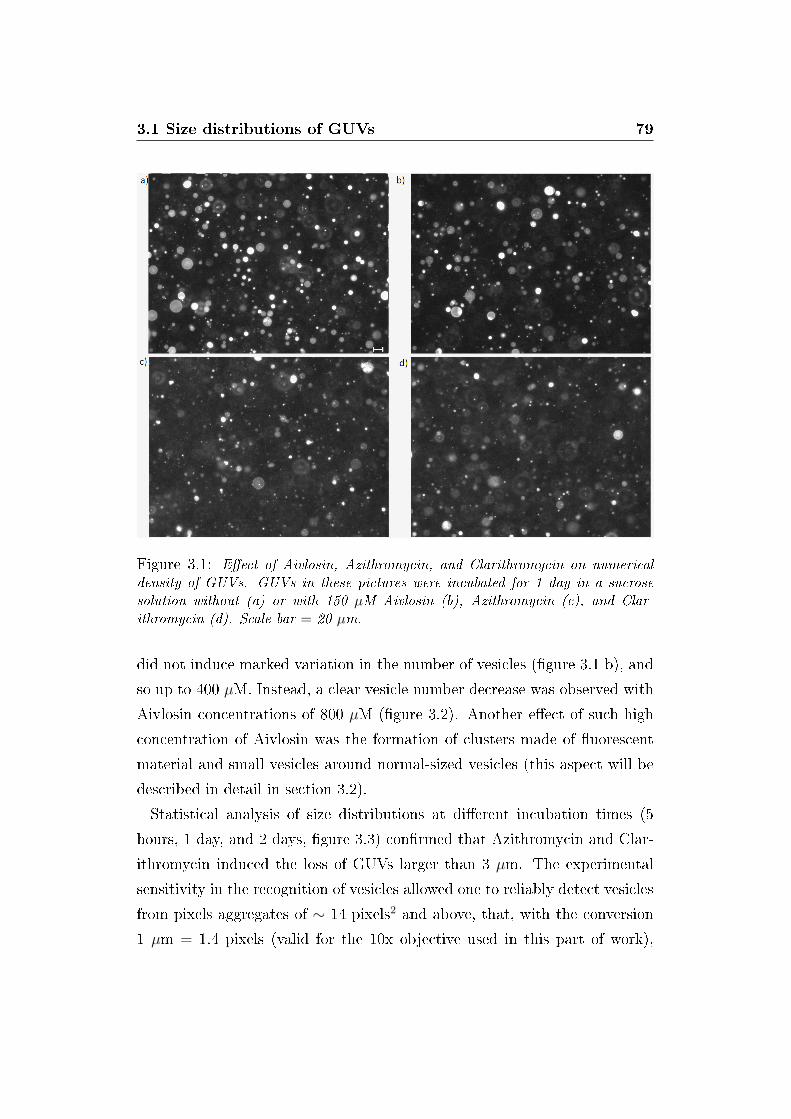
3.1 Size distributions of GUVs 79
Figure 3.1: E�ect of Aivlosin, Azithromycin, and Clarithromycin on numericaldensity of GUVs. GUVs in these pictures were incubated for 1 day in a sucrosesolution without (a) or with 150 µM Aivlosin (b), Azithromycin (c), and Clar-ithromycin (d). Scale bar = 20 µm.
did not induce marked variation in the number of vesicles (�gure 3.1 b), and
so up to 400 µM. Instead, a clear vesicle number decrease was observed with
Aivlosin concentrations of 800 µM (�gure 3.2). Another e�ect of such high
concentration of Aivlosin was the formation of clusters made of �uorescent
material and small vesicles around normal-sized vesicles (this aspect will be
described in detail in section 3.2).
Statistical analysis of size distributions at di�erent incubation times (5
hours, 1 day, and 2 days, �gure 3.3) con�rmed that Azithromycin and Clar-
ithromycin induced the loss of GUVs larger than 3 µm. The experimental
sensitivity in the recognition of vesicles allowed one to reliably detect vesicles
from pixels aggregates of ∼ 14 pixels2 and above, that, with the conversion
1 µm = 1.4 pixels (valid for the 10x objective used in this part of work),
3.1 Size distributions of GUVs 80
Figure 3.2: E�ect of Aivlosin 800 µM on numerical density of GUVs after oneday of incubation in sucrose solution with Aivlosin. Scale bar = 20 µm
corresponds to a projected area about 7 µm2. This value of projected area
corresponds to vesicles with diameter ∼ 3 µm, thus vesicles smaller than this
value were not considered in �tting the size distibutions with Eq. (2.1).
Two parameters were calculated �tting Eq. (2.1): A, the prefactor of the
exponential decay, and R0, that can be considered as the characteristic size
of each distribution.
Figure 3.3 shows that the e�ects of Azithromycin and Clarithromycin in re-
ducing the number of vesicles were quantitatively similar, clearly distinct
from that of Aivlosin: the normalized size distributions (distributions di-
vided by the number of vesicles found in each sample) of vesicles treated
with Azithromycin and Clarithromycin were both lower than control sam-
ples and those treated with Aivlosin, in a diameter range between 5 µm and
∼ 20 µm. Aivlosin 50 µM and 150 µM appeared not to reduce appreciably
the number of vesicles, unless Aivlosin was at high concentration (800 µM).
Highly concentrated Aivlosin was tested on a di�erent set of vesicles and the
corresponding size distributions are showed in �gure 3.4. Two di�erent slopes
were found in these distributions, referring to ranges 3-6 µm and 7-20 µm,
respectively. The distribution of Aivlosin 800 µM-treated GUVs of diameters
larger than 6 µm was higher than that of control GUVs, due to the formation
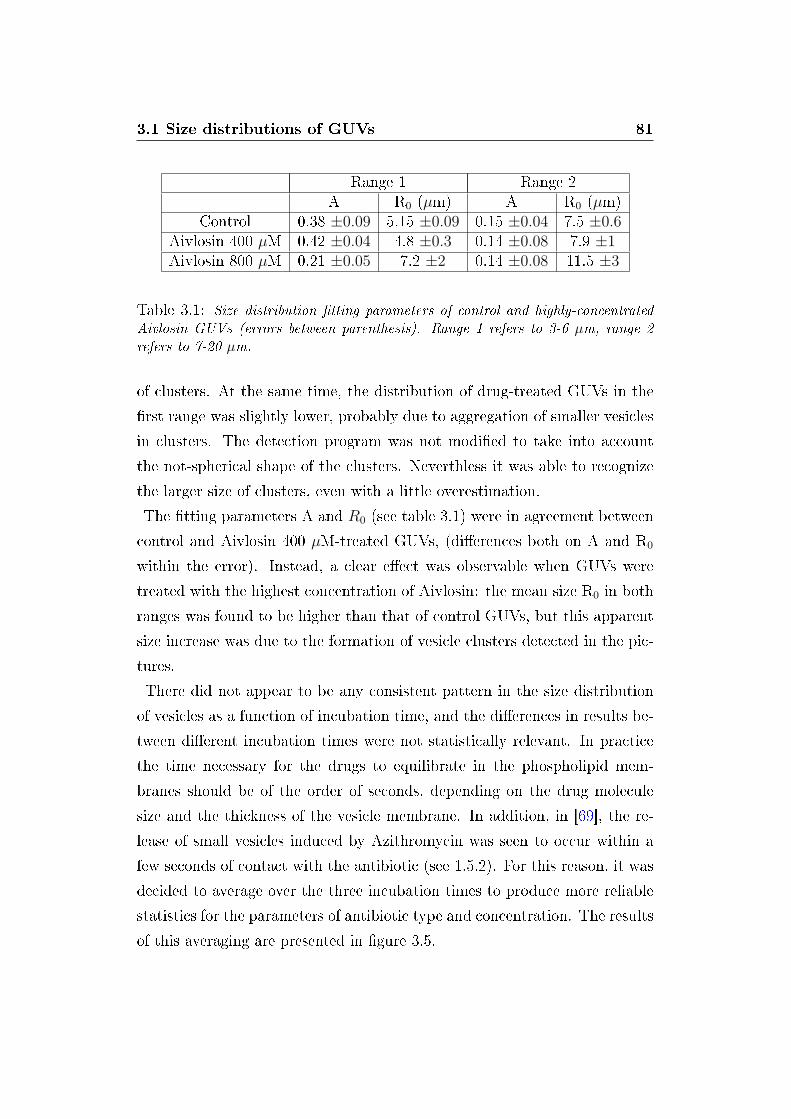
3.1 Size distributions of GUVs 81
Range 1 Range 2A R0 (µm) A R0 (µm)
Control 0.38 ±0.09 5.15 ±0.09 0.15 ±0.04 7.5 ±0.6Aivlosin 400 µM 0.42 ±0.04 4.8 ±0.3 0.14 ±0.08 7.9 ±1Aivlosin 800 µM 0.21 ±0.05 7.2 ±2 0.14 ±0.08 11.5 ±3
Table 3.1: Size distribution �tting parameters of control and highly-concentratedAivlosin GUVs (errors between parenthesis). Range 1 refers to 3-6 µm, range 2refers to 7-20 µm.
of clusters. At the same time, the distribution of drug-treated GUVs in the
�rst range was slightly lower, probably due to aggregation of smaller vesicles
in clusters. The detection program was not modi�ed to take into account
the not-spherical shape of the clusters. Neverthless it was able to recognize
the larger size of clusters, even with a little overestimation.
The �tting parameters A and R0 (see table 3.1) were in agreement between
control and Aivlosin 400 µM-treated GUVs, (di�erences both on A and R0
within the error). Instead, a clear e�ect was observable when GUVs were
treated with the highest concentration of Aivlosin: the mean size R0 in both
ranges was found to be higher than that of control GUVs, but this apparent
size increase was due to the formation of vesicle clusters detected in the pic-
tures.
There did not appear to be any consistent pattern in the size distribution
of vesicles as a function of incubation time, and the di�erences in results be-
tween di�erent incubation times were not statistically relevant. In practice
the time necessary for the drugs to equilibrate in the phospholipid mem-
branes should be of the order of seconds, depending on the drug molecule
size and the thickness of the vesicle membrane. In addition, in [69], the re-
lease of small vesicles induced by Azithromycin was seen to occur within a
few seconds of contact with the antibiotic (see 1.5.2). For this reason, it was
decided to average over the three incubation times to produce more reliable
statistics for the parameters of antibiotic type and concentration. The results
of this averaging are presented in �gure 3.5.
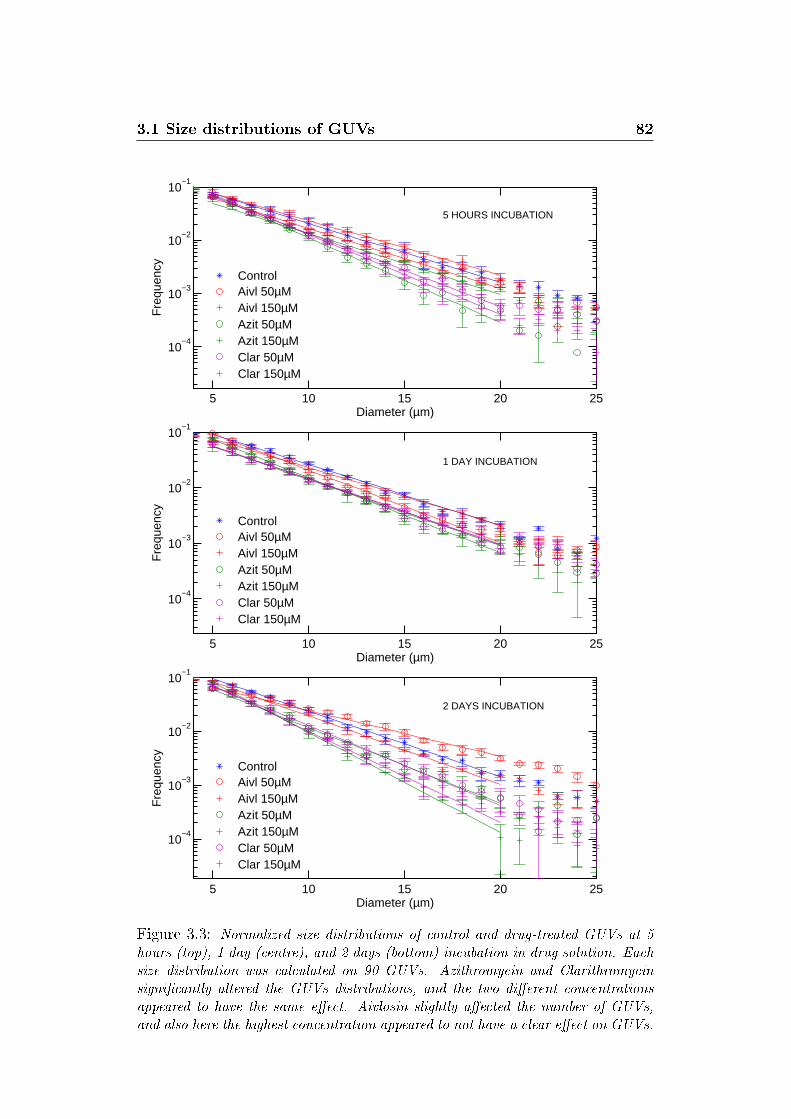
3.1 Size distributions of GUVs 82
5 10 15 20 25
10−4
10−3
10−2
10−1
Diameter (µm)
Fre
quen
cy
5 HOURS INCUBATION
ControlAivl 50µMAivl 150µMAzit 50µMAzit 150µMClar 50µMClar 150µM
5 10 15 20 25
10−4
10−3
10−2
10−1
Diameter (µm)
Fre
quen
cy
1 DAY INCUBATION
ControlAivl 50µMAivl 150µMAzit 50µMAzit 150µMClar 50µMClar 150µM
5 10 15 20 25
10−4
10−3
10−2
10−1
Diameter (µm)
Fre
quen
cy
2 DAYS INCUBATION
ControlAivl 50µMAivl 150µMAzit 50µMAzit 150µMClar 50µMClar 150µM
Figure 3.3: Normalized size distributions of control and drug-treated GUVs at 5hours (top), 1 day (centre), and 2 days (bottom) incubation in drug solution. Eachsize distribution was calculated on 90 GUVs. Azithromycin and Clarithromycinsigni�cantly altered the GUVs distributions, and the two di�erent concentrationsappeared to have the same e�ect. Aivlosin slightly a�ected the number of GUVs,and also here the highest concentration appeared to not have a clear e�ect on GUVs.
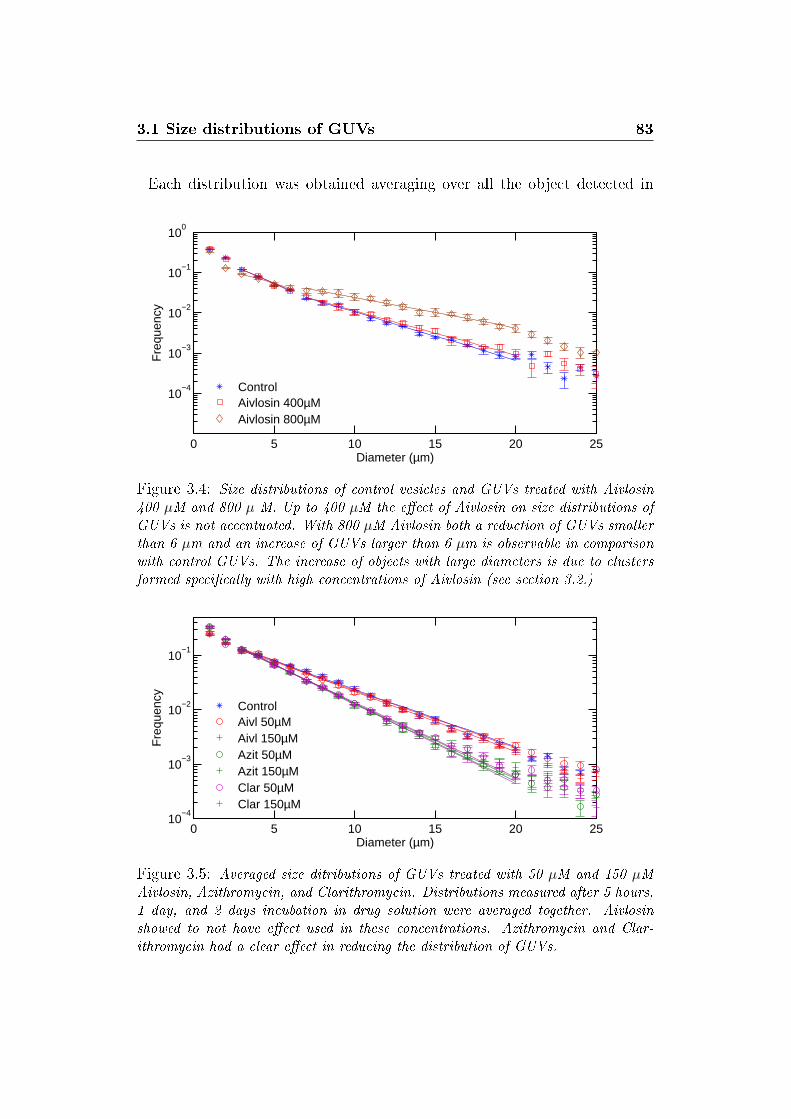
3.1 Size distributions of GUVs 83
Each distribution was obtained averaging over all the object detected in
0 5 10 15 20 25
10−4
10−3
10−2
10−1
100
Diameter (µm)
Fre
quen
cy
ControlAivlosin 400µMAivlosin 800µM
Figure 3.4: Size distributions of control vesicles and GUVs treated with Aivlosin400 µM and 800 µ M. Up to 400 µM the e�ect of Aivlosin on size distributions ofGUVs is not accentuated. With 800 µM Aivlosin both a reduction of GUVs smallerthan 6 µm and an increase of GUVs larger than 6 µm is observable in comparisonwith control GUVs. The increase of objects with large diameters is due to clustersformed speci�cally with high concentrations of Aivlosin (see section 3.2.)
0 5 10 15 20 2510
−4
10−3
10−2
10−1
Diameter (µm)
Fre
quen
cy
ControlAivl 50µMAivl 150µMAzit 50µMAzit 150µMClar 50µMClar 150µM
Figure 3.5: Averaged size ditributions of GUVs treated with 50 µM and 150 µMAivlosin, Azithromycin, and Clarithromycin. Distributions measured after 5 hours,1 day, and 2 days incubation in drug solution were averaged together. Aivlosinshowed to not have e�ect used in these concentrations. Azithromycin and Clar-ithromycin had a clear e�ect in reducing the distribution of GUVs.
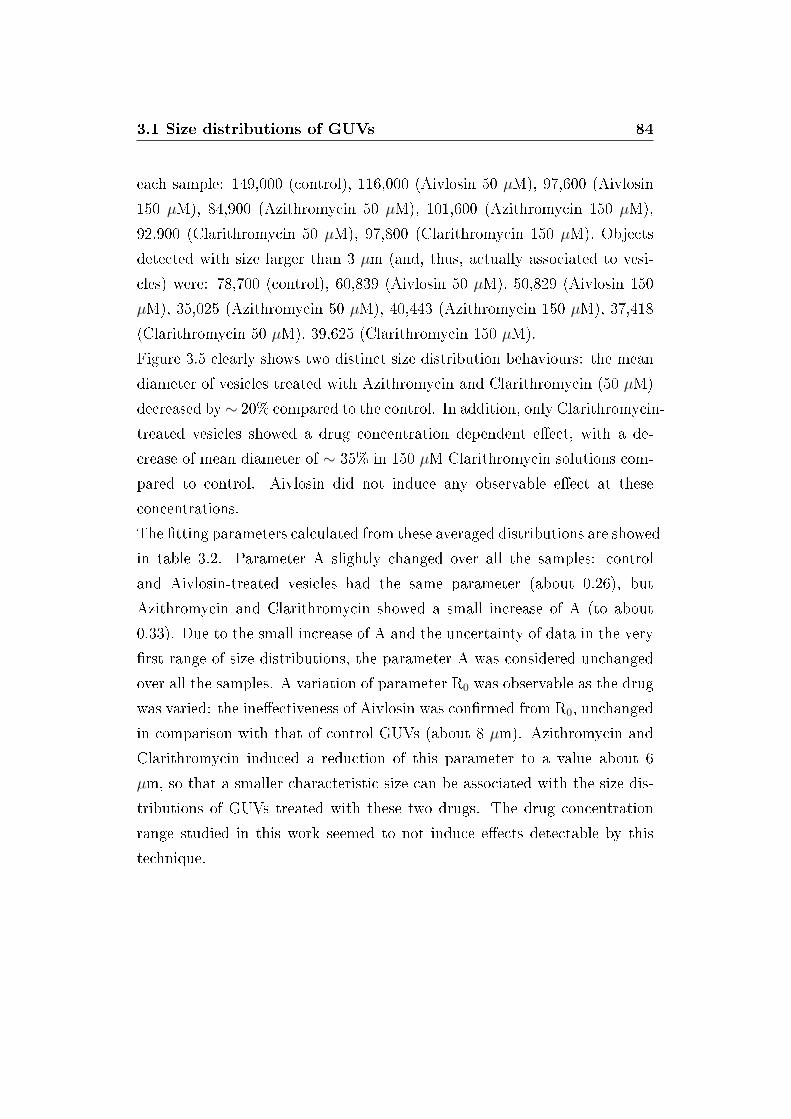
3.1 Size distributions of GUVs 84
each sample: 149,000 (control), 116,000 (Aivlosin 50 µM), 97,600 (Aivlosin
150 µM), 84,900 (Azithromycin 50 µM), 101,600 (Azithromycin 150 µM),
92,900 (Clarithromycin 50 µM), 97,800 (Clarithromycin 150 µM). Objects
detected with size larger than 3 µm (and, thus, actually associated to vesi-
cles) were: 78,700 (control), 60,839 (Aivlosin 50 µM), 50,829 (Aivlosin 150
µM), 35,025 (Azithromycin 50 µM), 40,443 (Azithromycin 150 µM), 37,418
(Clarithromycin 50 µM), 39,625 (Clarithromycin 150 µM).
Figure 3.5 clearly shows two distinct size distribution behaviours: the mean
diameter of vesicles treated with Azithromycin and Clarithromycin (50 µM)
decreased by∼ 20% compared to the control. In addition, only Clarithromycin-
treated vesicles showed a drug concentration dependent e�ect, with a de-
crease of mean diameter of ∼ 35% in 150 µM Clarithromycin solutions com-
pared to control. Aivlosin did not induce any observable e�ect at these
concentrations.
The �tting parameters calculated from these averaged distributions are showed
in table 3.2. Parameter A slightly changed over all the samples: control
and Aivlosin-treated vesicles had the same parameter (about 0.26), but
Azithromycin and Clarithromycin showed a small increase of A (to about
0.33). Due to the small increase of A and the uncertainty of data in the very
�rst range of size distributions, the parameter A was considered unchanged
over all the samples. A variation of parameter R0 was observable as the drug
was varied: the ine�ectiveness of Aivlosin was con�rmed from R0, unchanged
in comparison with that of control GUVs (about 8 µm). Azithromycin and
Clarithromycin induced a reduction of this parameter to a value about 6
µm, so that a smaller characteristic size can be associated with the size dis-
tributions of GUVs treated with these two drugs. The drug concentration
range studied in this work seemed to not induce e�ects detectable by this
technique.
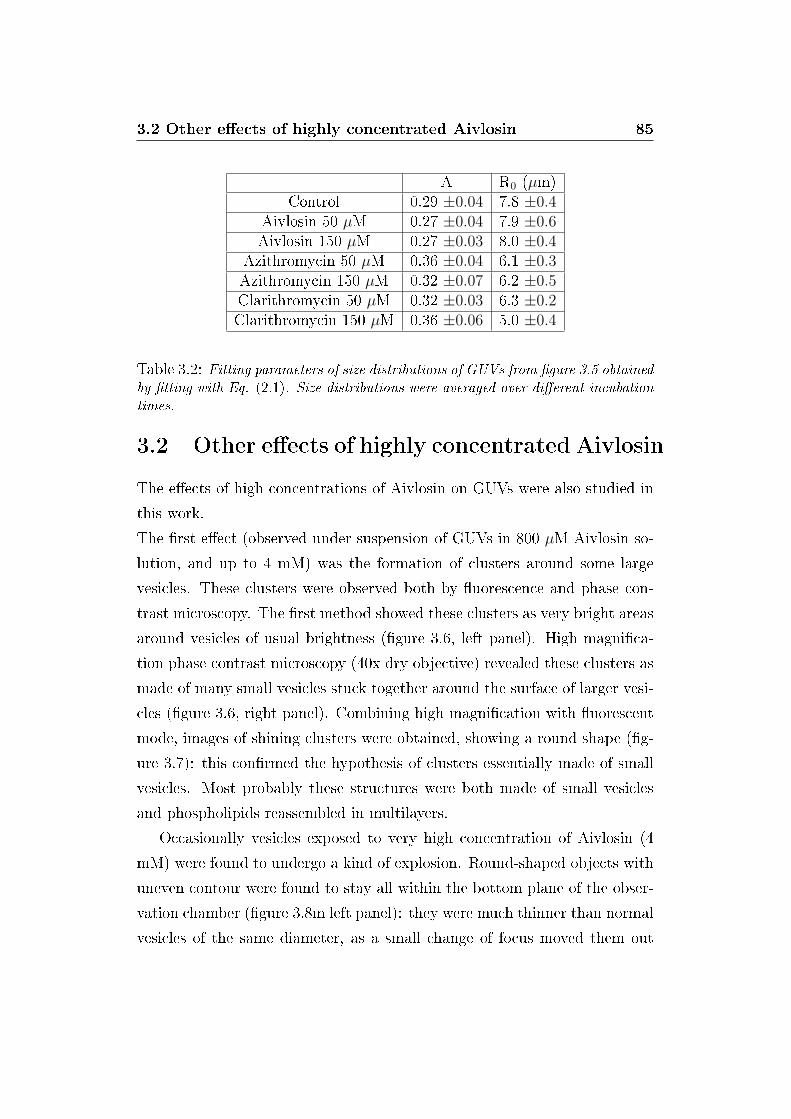
3.2 Other e�ects of highly concentrated Aivlosin 85
A R0 (µm)Control 0.29 ±0.04 7.8 ±0.4
Aivlosin 50 µM 0.27 ±0.04 7.9 ±0.6Aivlosin 150 µM 0.27 ±0.03 8.0 ±0.4
Azithromycin 50 µM 0.36 ±0.04 6.1 ±0.3Azithromycin 150 µM 0.32 ±0.07 6.2 ±0.5Clarithromycin 50 µM 0.32 ±0.03 6.3 ±0.2Clarithromycin 150 µM 0.36 ±0.06 5.0 ±0.4
Table 3.2: Fitting parameters of size distributions of GUVs from �gure 3.5 obtainedby �tting with Eq. (2.1). Size distributions were averaged over di�erent incubationtimes.
3.2 Other e�ects of highly concentrated Aivlosin
The e�ects of high concentrations of Aivlosin on GUVs were also studied in
this work.
The �rst e�ect (observed under suspension of GUVs in 800 µM Aivlosin so-
lution, and up to 4 mM) was the formation of clusters around some large
vesicles. These clusters were observed both by �uorescence and phase con-
trast microscopy. The �rst method showed these clusters as very bright areas
around vesicles of usual brightness (�gure 3.6, left panel). High magni�ca-
tion phase contrast microscopy (40x dry objective) revealed these clusters as
made of many small vesicles stuck together around the surface of larger vesi-
cles (�gure 3.6, right panel). Combining high magni�cation with �uorescent
mode, images of shining clusters were obtained, showing a round shape (�g-
ure 3.7): this con�rmed the hypothesis of clusters essentially made of small
vesicles. Most probably these structures were both made of small vesicles
and phospholipids reassembled in multilayers.
Occasionally vesicles exposed to very high concentration of Aivlosin (4
mM) were found to undergo a kind of explosion. Round-shaped objects with
uneven contour were found to stay all within the bottom plane of the obser-
vation chamber (�gure 3.8m left panel): they were much thinner than normal
vesicles of the same diameter, as a small change of focus moved them out
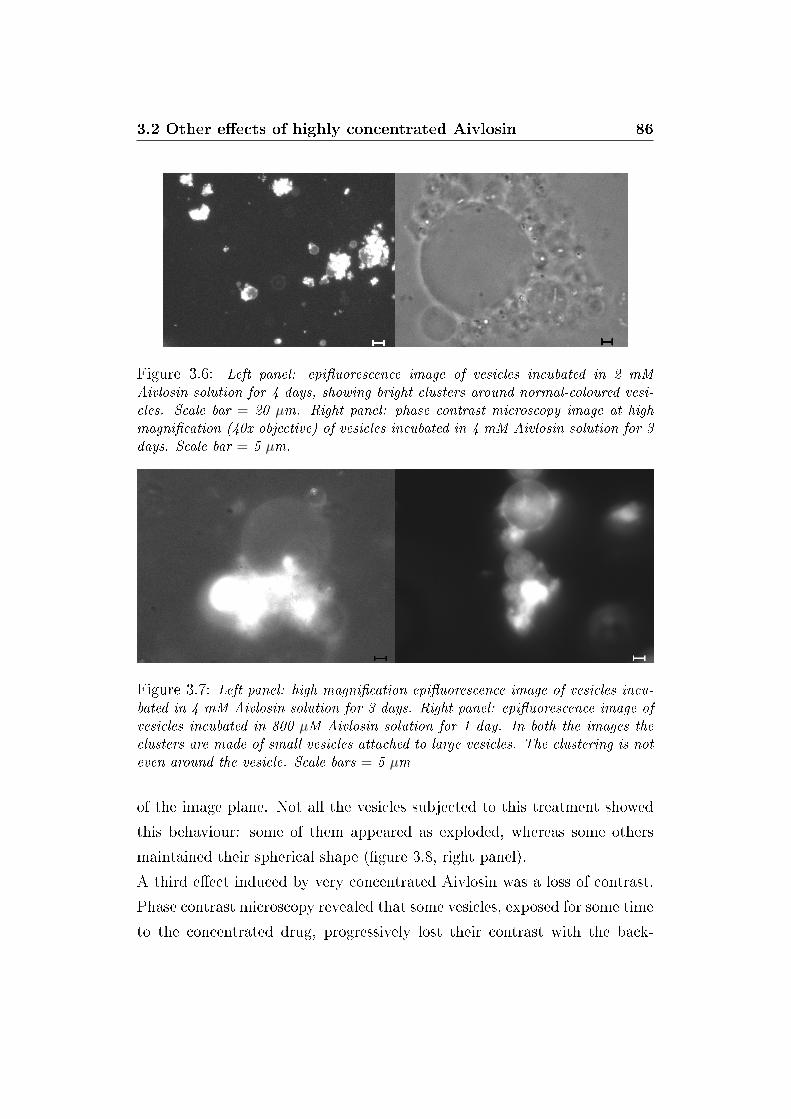
3.2 Other e�ects of highly concentrated Aivlosin 86
Figure 3.6: Left panel: epi�uorescence image of vesicles incubated in 2 mMAivlosin solution for 4 days, showing bright clusters around normal-coloured vesi-cles. Scale bar = 20 µm. Right panel: phase contrast microscopy image at highmagni�cation (40x objective) of vesicles incubated in 4 mM Aivlosin solution for 3days. Scale bar = 5 µm.
Figure 3.7: Left panel: high magni�cation epi�uorescence image of vesicles incu-bated in 4 mM Aivlosin solution for 3 days. Right panel: epi�uorescence image ofvesicles incubated in 800 µM Aivlosin solution for 1 day. In both the images theclusters are made of small vesicles attached to large vesicles. The clustering is noteven around the vesicle. Scale bars = 5 µm
of the image plane. Not all the vesicles subjected to this treatment showed
this behaviour: some of them appeared as exploded, whereas some others
maintained their spherical shape (�gure 3.8, right panel).
A third e�ect induced by very concentrated Aivlosin was a loss of contrast.
Phase contrast microscopy revealed that some vesicles, exposed for some time
to the concentrated drug, progressively lost their contrast with the back-
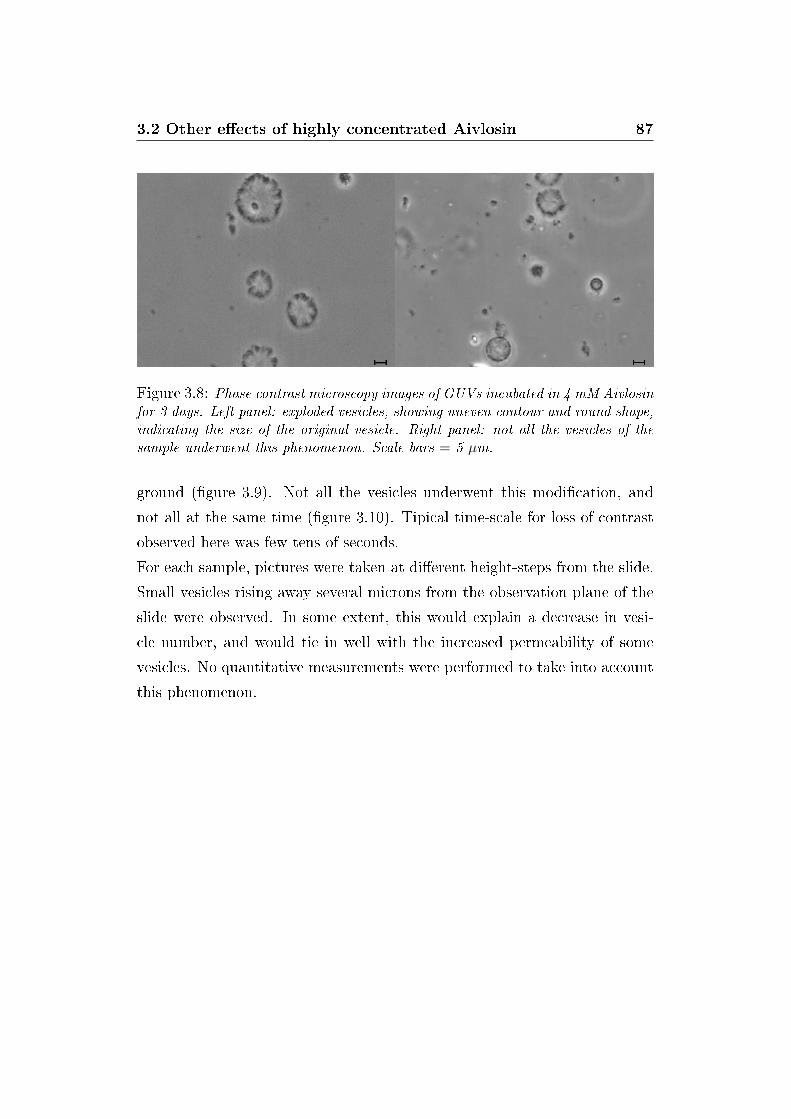
3.2 Other e�ects of highly concentrated Aivlosin 87
Figure 3.8: Phase contrast microscopy images of GUVs incubated in 4 mM Aivlosinfor 3 days. Left panel: exploded vesicles, showing uneven contour and round shape,indicating the size of the original vesicle. Right panel: not all the vesicles of thesample underwent this phenomenon. Scale bars = 5 µm.
ground (�gure 3.9). Not all the vesicles underwent this modi�cation, and
not all at the same time (�gure 3.10). Tipical time-scale for loss of contrast
observed here was few tens of seconds.
For each sample, pictures were taken at di�erent height-steps from the slide.
Small vesicles rising away several microns from the observation plane of the
slide were observed. In some extent, this would explain a decrease in vesi-
cle number, and would tie in well with the increased permeability of some
vesicles. No quantitative measurements were performed to take into account
this phenomenon.
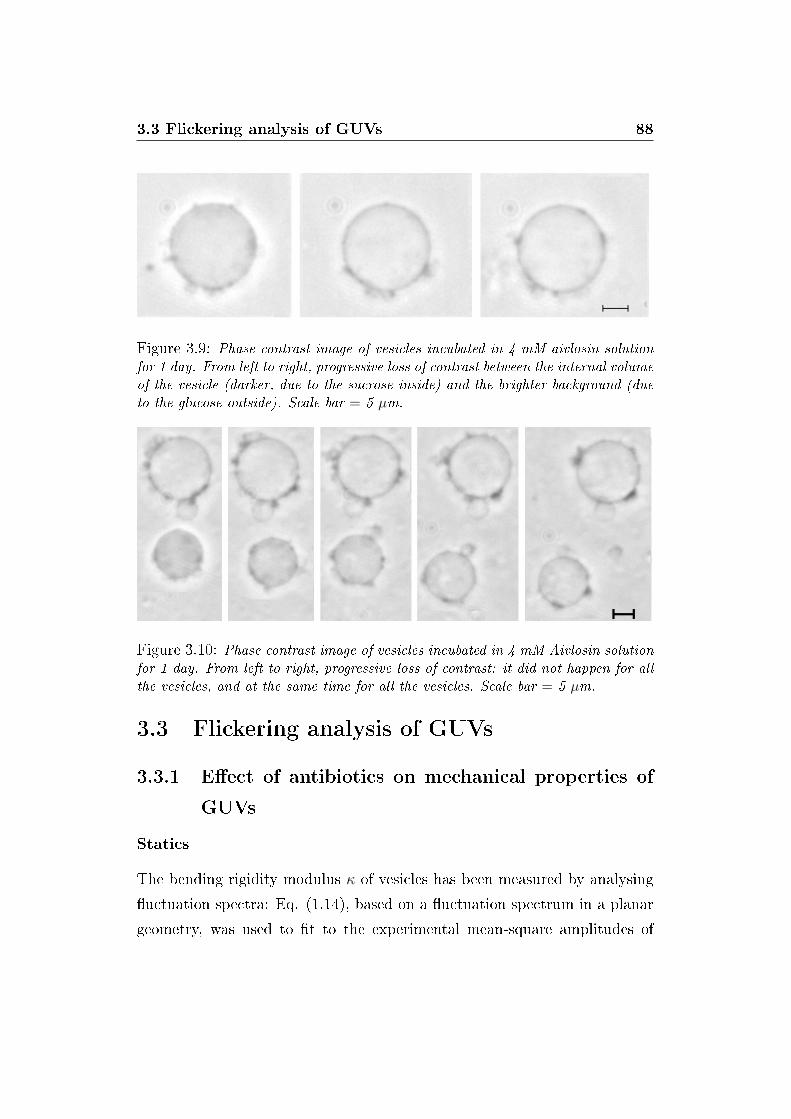
3.3 Flickering analysis of GUVs 88
Figure 3.9: Phase contrast image of vesicles incubated in 4 mM aivlosin solutionfor 1 day. From left to right, progressive loss of contrast between the internal volumeof the vesicle (darker, due to the sucrose inside) and the brighter background (dueto the glucose outside). Scale bar = 5 µm.
Figure 3.10: Phase contrast image of vesicles incubated in 4 mM Aivlosin solutionfor 1 day. From left to right, progressive loss of contrast: it did not happen for allthe vesicles, and at the same time for all the vesicles. Scale bar = 5 µm.
3.3 Flickering analysis of GUVs
3.3.1 E�ect of antibiotics on mechanical properties of
GUVs
Statics
The bending rigidity modulus κ of vesicles has been measured by analysing
�uctuation spectra: Eq. (1.14), based on a �uctuation spectrum in a planar
geometry, was used to �t to the experimental mean-square amplitudes of
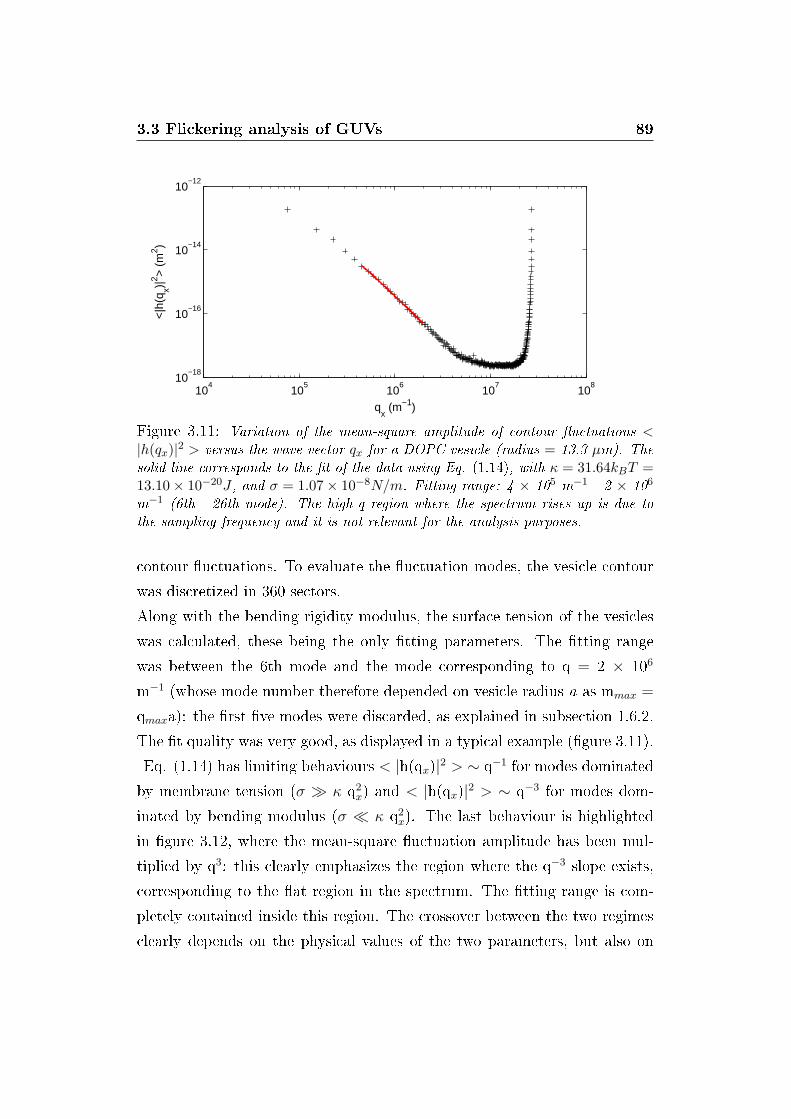
3.3 Flickering analysis of GUVs 89
104
105
106
107
108
10−18
10−16
10−14
10−12
<|h
(qx)|
2 > (
m2 )
qx (m−1)
Figure 3.11: Variation of the mean-square amplitude of contour �uctuations <|h(qx)|2 > versus the wave vector qx for a DOPC vesicle (radius = 13.3 µm). Thesolid line corresponds to the �t of the data using Eq. (1.14), with κ = 31.64kBT =13.10× 10⁻²⁰J , and σ = 1.07× 10⁻⁸N/m. Fitting range: 4 × 10⁵ m−1 - 2 × 10⁶
m−1 (6th - 26th mode). The high-q region where the spectrum rises up is due tothe sampling frequency and it is not relevant for the analysis purposes.
contour �uctuations. To evaluate the �uctuation modes, the vesicle contour
was discretized in 360 sectors.
Along with the bending rigidity modulus, the surface tension of the vesicles
was calculated, these being the only �tting parameters. The �tting range
was between the 6th mode and the mode corresponding to q = 2 × 10⁶
m−1 (whose mode number therefore depended on vesicle radius a as mmax =
qmaxa): the �rst �ve modes were discarded, as explained in subsection 1.6.2.
The �t quality was very good, as displayed in a typical example (�gure 3.11).
Eq. (1.14) has limiting behaviours < |h(qx)|2 > ∼ q−1 for modes dominated
by membrane tension (σ � κ q2x) and < |h(qx)|2 > ∼ q−3 for modes dom-
inated by bending modulus (σ � κ q2x). The last behaviour is highlighted
in �gure 3.12, where the mean-square �uctuation amplitude has been mul-
tiplied by q3: this clearly emphasizes the region where the q−3 slope exists,
corresponding to the �at region in the spectrum. The �tting range is com-
pletely contained inside this region. The crossover between the two regimes
clearly depends on the physical values of the two parameters, but also on
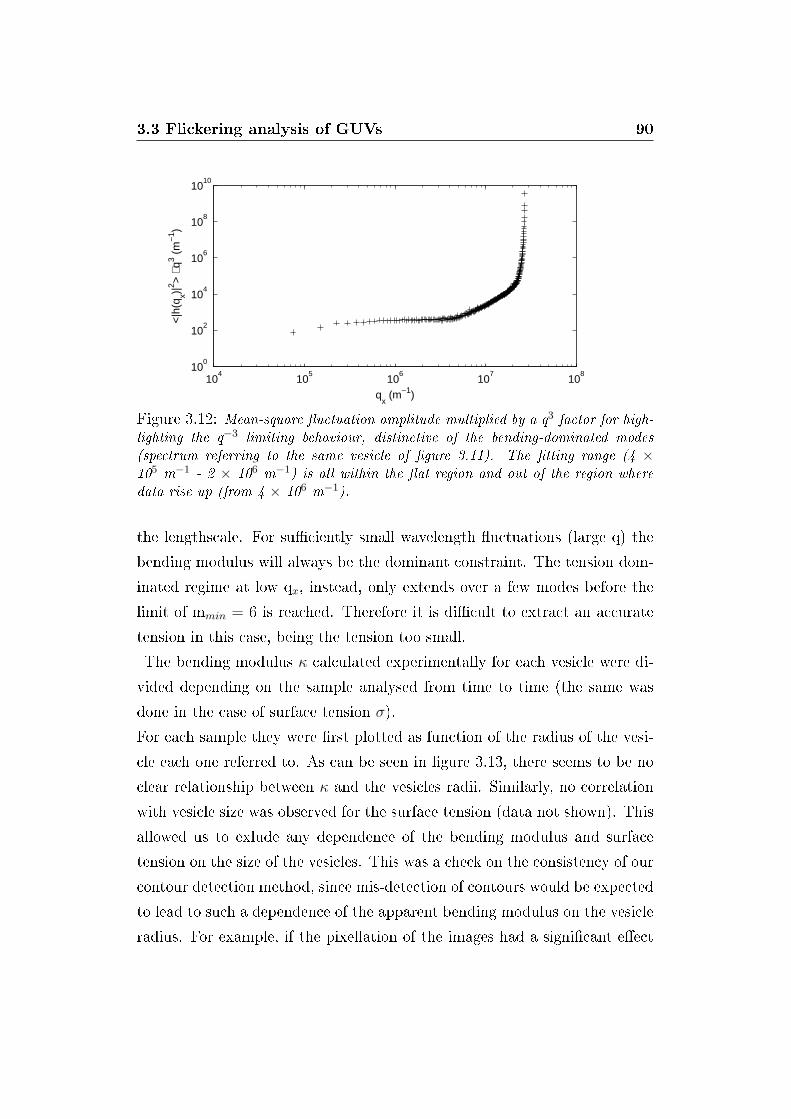
3.3 Flickering analysis of GUVs 90
104
105
106
107
108
100
102
104
106
108
1010
<|h
(qx)|
2 > ⋅
q3 (m
−1 )
qx (m−1)
Figure 3.12: Mean-square �uctuation amplitude multiplied by a q3 factor for high-lighting the q−3 limiting behaviour, distinctive of the bending-dominated modes(spectrum referring to the same vesicle of �gure 3.11). The �tting range (4 ×10⁵ m−1 - 2 × 10⁶ m−1) is all within the �at region and out of the region wheredata rise up (from 4 × 10⁶ m−1).
the lengthscale. For su�ciently small wavelength �uctuations (large q) the
bending modulus will always be the dominant constraint. The tension dom-
inated regime at low qx, instead, only extends over a few modes before the
limit of mmin = 6 is reached. Therefore it is di�cult to extract an accurate
tension in this case, being the tension too small.
The bending modulus κ calculated experimentally for each vesicle were di-
vided depending on the sample analysed from time to time (the same was
done in the case of surface tension σ).
For each sample they were �rst plotted as function of the radius of the vesi-
cle each one referred to. As can be seen in �gure 3.13, there seems to be no
clear relationship between κ and the vesicles radii. Similarly, no correlation
with vesicle size was observed for the surface tension (data not shown). This
allowed us to exlude any dependence of the bending modulus and surface
tension on the size of the vesicles. This was a check on the consistency of our
contour detection method, since mis-detection of contours would be expected
to lead to such a dependence of the apparent bending modulus on the vesicle
radius. For example, if the pixellation of the images had a signi�cant e�ect
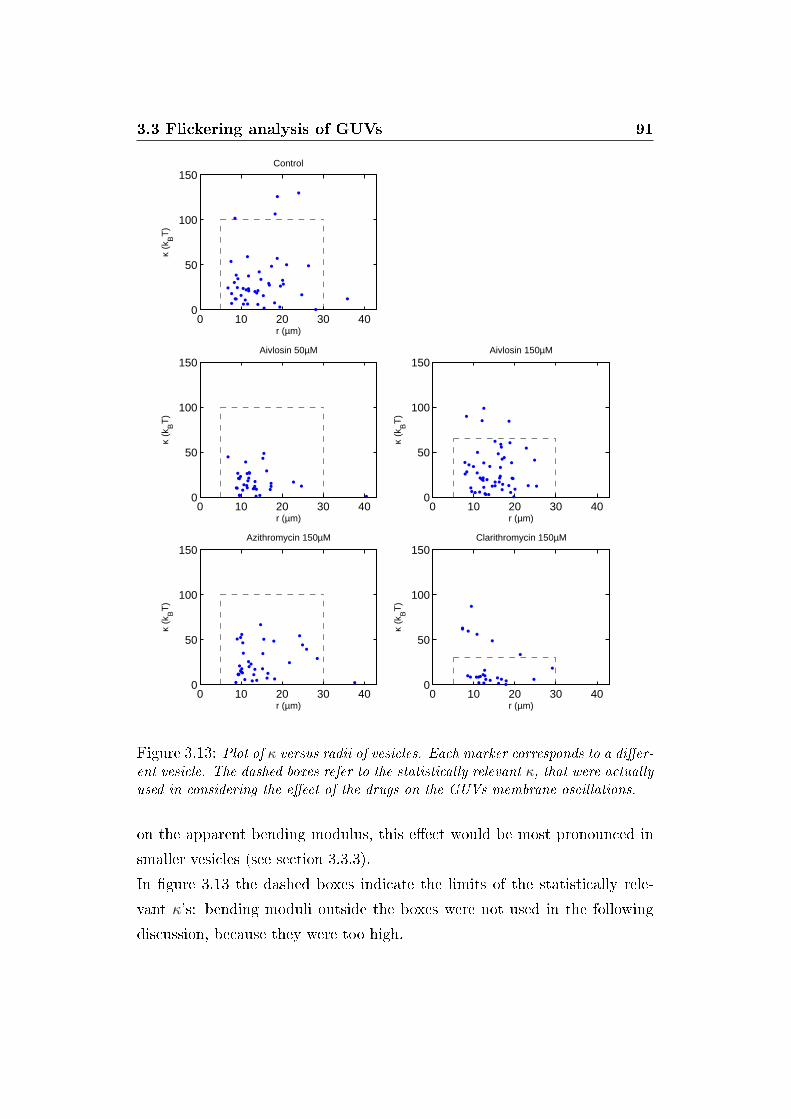
3.3 Flickering analysis of GUVs 91
0 10 20 30 400
50
100
150κ
(kBT
)
r (µm)
Control
0 10 20 30 400
50
100
150
κ (k
BT
)
r (µm)
Aivlosin 50µM
0 10 20 30 400
50
100
150
κ (k
BT
)
r (µm)
Aivlosin 150µM
0 10 20 30 400
50
100
150
κ (k
BT
)
r (µm)
Azithromycin 150µM
0 10 20 30 400
50
100
150
κ (k
BT
)
r (µm)
Clarithromycin 150µM
Figure 3.13: Plot of κ versus radii of vesicles. Each marker corresponds to a di�er-ent vesicle. The dashed boxes refer to the statistically relevant κ, that were actuallyused in considering the e�ect of the drugs on the GUVs membrane oscillations.
on the apparent bending modulus, this e�ect would be most pronounced in
smaller vesicles (see section 3.3.3).
In �gure 3.13 the dashed boxes indicate the limits of the statistically rele-
vant κ's: bending moduli outside the boxes were not used in the following
discussion, because they were too high.
3.3 Flickering analysis of GUVs 92
The �ts of the experimental data produced bending moduli ranging between
0.23 kBT and 66.67 kBT, and tensions between 0.6 × 10⁻⁸ N/m and 86 ×10−8 N/m. Experimental error on κ of an individual vesicle was estimated
to be about 8 kBT: a single video was divided in three sets of frames, κ was
calculated for each one, and their standard deviation was taken as error. The
procedure was repeated with 10 vesicles, averaging the standard deviations.
A distribution of κ was obtained for each sample: these distributions are
shown in �gure 3.14, in which the ordinate of the histogram gives the num-
ber of vesicles yielding the same κ-value. In general, the histograms show up
as multi-peak gaussian distributions: a main peak centred on a minimum κ
is followed by minor peaks centred on multiple values of the previous κ (this
result was also found in [108]). As the larger values of κ are multiples of the
minimum value, this leads to the conclusion that these groups correspond to
vesicles with shells composed of multi-bilayers.
The distributions showed in �gure 3.14 were �tted with multi-gaussian dis-
tributions. Each probability function was centered on the main κ of each
distribution and on values two and three times the previous, according to
the expressions:
G(µ, σg) =1
σg√
2πe−(x−µ)2
2σ2g , (3.1)
GT = A ·G(µ) +B ·G(2µ) + C ·G(3µ), (3.2)
with mean µ (µ = κmean), standard deviation σg, and weights A, B, C ex-
pressed using spherical coordinates (A = (sin(θ) · cos(φ))2, B = (sin(θ) ·sin(φ))2, C = (1-A-B) = cos(θ)2). Total number of free parameters in Eq.
(3.2) is 7 (µ, σg, A, B, C, θ, φ).
In control and Clarithromycin-treated samples peaks at very high values of
κ exist. Because the number of elements in these peaks is much lower than
that in the main peaks, these values were discarded and a single gaussian
function was used to �t to these data (free paramters: µ, σg). Discarded
data are the same shown out of the dashed boxes in �gure 3.13.
Mean values of κ and their standard deviations obtained by multi- (or single-)

3.3 Flickering analysis of GUVs 93
0 50 100 1500
5
10
15
κ (kBT)
Fre
quen
cy
N = 46
Control
0 50 100 1500
5
10
15
κ (kBT)
Fre
quen
cy
N = 35
Aivlosin 50µM
0 50 100 1500
5
10
15
κ (kBT)
Fre
quen
cyN = 49
Aivlosin 150µM
0 50 100 1500
5
10
15
κ (kBT)
Fre
quen
cy
N = 36
Azithromycin 150µM
0 50 100 1500
5
10
15
κ (kBT)
Fre
quen
cy
N = 19
Clarithromycin 150µM
Figure 3.14: Summary of κ values measured for DOPC GUVs by contour analysis.The ordinate of the histograms give the numbers of vesicles exhibiting the samebending elastic modulus. Red lines are �ts of the distribution using Eq. (3.2),showing that, in some cases, groups of κ exist at multiple values of the lowest κ. Nis the number of vesicles in each histogram.
gaussian �ttings are shown in table 3.3. In control vesicles the mean value of
κ from the only peak considered was found to be 23.2 kBT, about the double
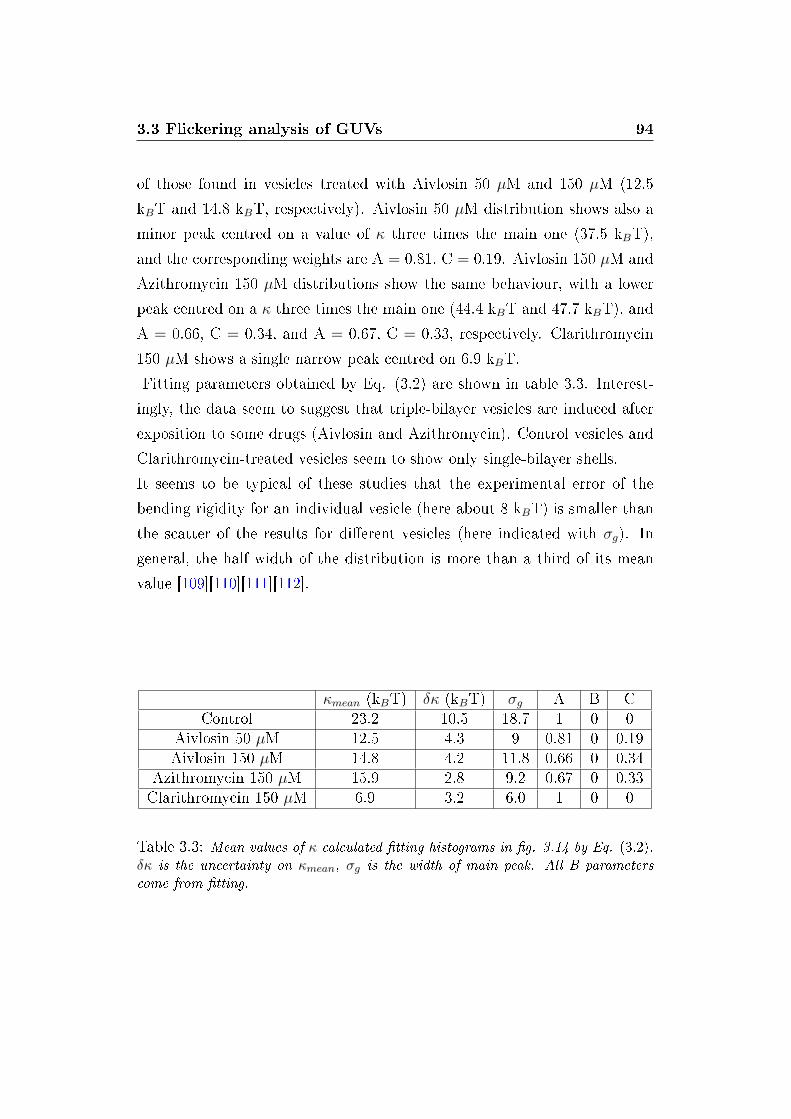
3.3 Flickering analysis of GUVs 94
of those found in vesicles treated with Aivlosin 50 µM and 150 µM (12.5
kBT and 14.8 kBT, respectively). Aivlosin 50 µM distribution shows also a
minor peak centred on a value of κ three times the main one (37.5 kBT),
and the corresponding weights are A = 0.81, C = 0.19. Aivlosin 150 µM and
Azithromycin 150 µM distributions show the same behaviour, with a lower
peak centred on a κ three times the main one (44.4 kBT and 47.7 kBT), and
A = 0.66, C = 0.34, and A = 0.67, C = 0.33, respectively. Clarithromycin
150 µM shows a single narrow peak centred on 6.9 kBT.
Fitting parameters obtained by Eq. (3.2) are shown in table 3.3. Interest-
ingly, the data seem to suggest that triple-bilayer vesicles are induced after
exposition to some drugs (Aivlosin and Azithromycin). Control vesicles and
Clarithromycin-treated vesicles seem to show only single-bilayer shells.
It seems to be typical of these studies that the experimental error of the
bending rigidity for an individual vesicle (here about 8 kBT) is smaller than
the scatter of the results for di�erent vesicles (here indicated with σg). In
general, the half width of the distribution is more than a third of its mean
value [109][110][111][112].
κmean (kBT) δκ (kBT) σg A B CControl 23.2 10.5 18.7 1 0 0
Aivlosin 50 µM 12.5 4.3 9 0.81 0 0.19Aivlosin 150 µM 14.8 4.2 11.8 0.66 0 0.34
Azithromycin 150 µM 15.9 2.8 9.2 0.67 0 0.33Clarithromycin 150 µM 6.9 3.2 6.0 1 0 0
Table 3.3: Mean values of κ calculated �tting histograms in �g. 3.14 by Eq. (3.2).δκ is the uncertainty on κmean, σg is the width of main peak. All B parameterscome from �tting.
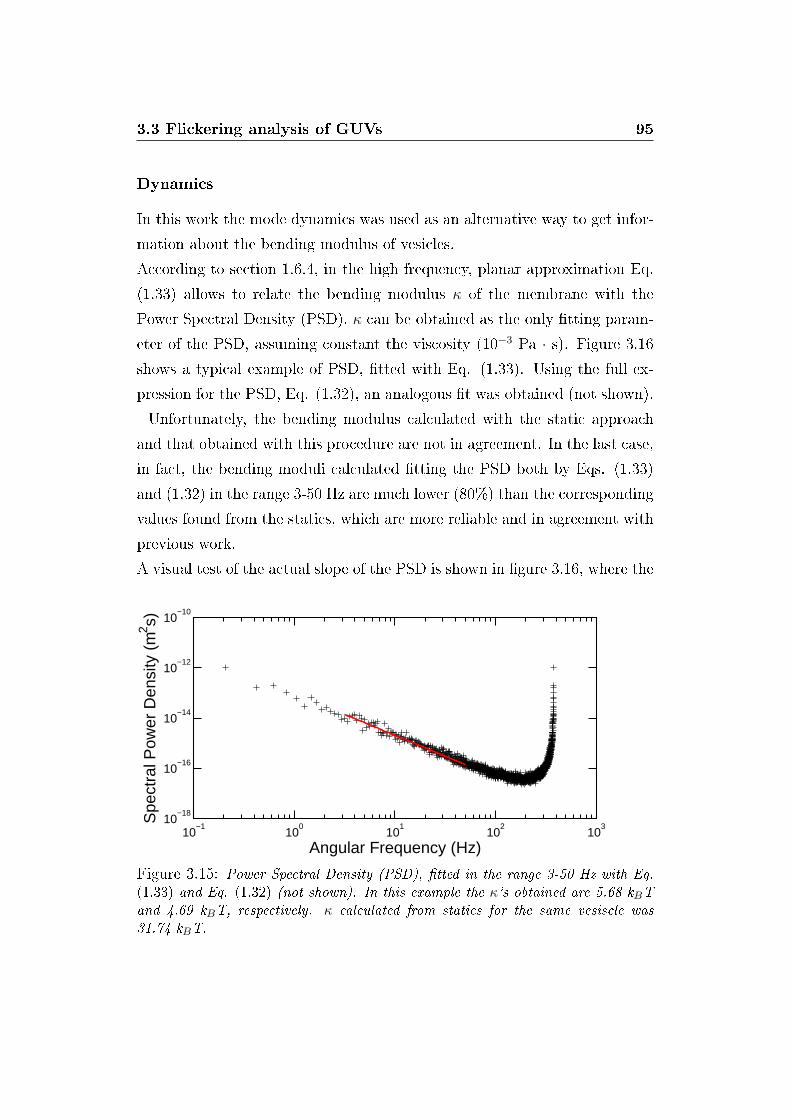
3.3 Flickering analysis of GUVs 95
Dynamics
In this work the mode dynamics was used as an alternative way to get infor-
mation about the bending modulus of vesicles.
According to section 1.6.4, in the high frequency, planar approximation Eq.
(1.33) allows to relate the bending modulus κ of the membrane with the
Power Spectral Density (PSD). κ can be obtained as the only �tting param-
eter of the PSD, assuming constant the viscosity (10−3 Pa · s). Figure 3.16shows a typical example of PSD, �tted with Eq. (1.33). Using the full ex-
pression for the PSD, Eq. (1.32), an analogous �t was obtained (not shown).
Unfortunately, the bending modulus calculated with the static approach
and that obtained with this procedure are not in agreement. In the last case,
in fact, the bending moduli calculated �tting the PSD both by Eqs. (1.33)
and (1.32) in the range 3-50 Hz are much lower (80%) than the corresponding
values found from the statics, which are more reliable and in agreement with
previous work.
A visual test of the actual slope of the PSD is shown in �gure 3.16, where the
10−1
100
101
102
103
10−18
10−16
10−14
10−12
10−10
Spe
ctra
l Pow
er D
ensi
ty (
m2 s)
Angular Frequency (Hz)
Figure 3.15: Power Spectral Density (PSD), �tted in the range 3-50 Hz with Eq.(1.33) and Eq. (1.32) (not shown). In this example the κ's obtained are 5.68 kBTand 4.69 kBT, respectively. κ calculated from statics for the same vesiscle was31.74 kBT.
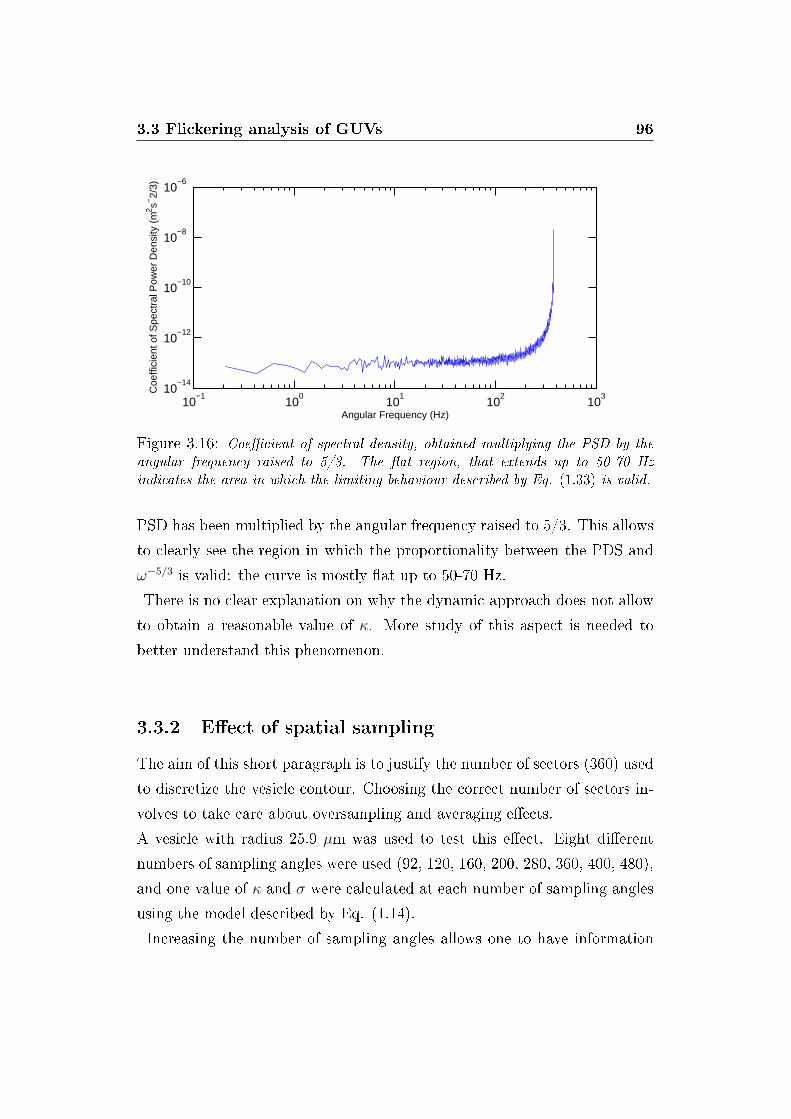
3.3 Flickering analysis of GUVs 96
10−1
100
101
102
103
10−14
10−12
10−10
10−8
10−6
Coe
ffici
ent o
f Spe
ctra
l Pow
er D
ensi
ty (
m2 s−
2/3)
Angular Frequency (Hz)
Figure 3.16: Coe�cient of spectral density, obtained multiplying the PSD by theangular frequency raised to 5/3. The �at region, that extends up to 50-70 Hzindicates the area in which the limiting behaviour described by Eq. (1.33) is valid.
PSD has been multiplied by the angular frequency raised to 5/3. This allows
to clearly see the region in which the proportionality between the PDS and
ω−5/3 is valid: the curve is mostly �at up to 50-70 Hz.
There is no clear explanation on why the dynamic approach does not allow
to obtain a reasonable value of κ. More study of this aspect is needed to
better understand this phenomenon.
3.3.2 E�ect of spatial sampling
The aim of this short paragraph is to justify the number of sectors (360) used
to discretize the vesicle contour. Choosing the correct number of sectors in-
volves to take care about oversampling and averaging e�ects.
A vesicle with radius 25.9 µm was used to test this e�ect. Eight di�erent
numbers of sampling angles were used (92, 120, 160, 200, 280, 360, 400, 480),
and one value of κ and σ were calculated at each number of sampling angles
using the model described by Eq. (1.14).
Increasing the number of sampling angles allows one to have information
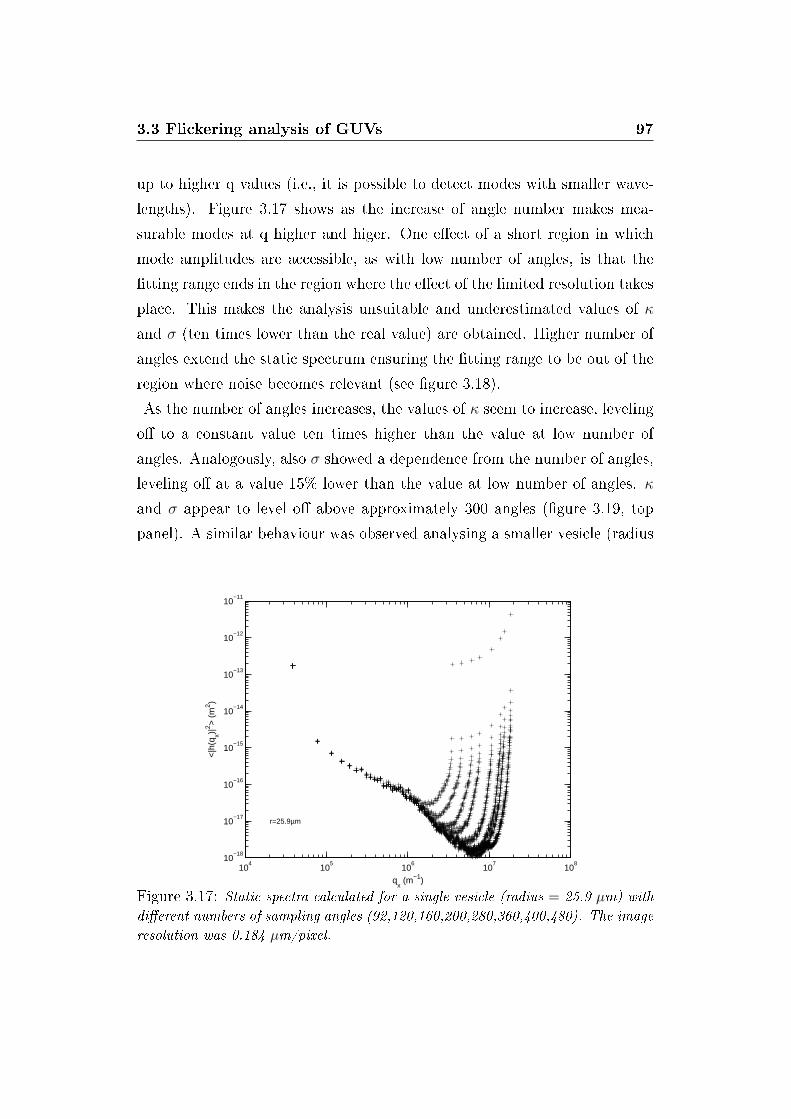
3.3 Flickering analysis of GUVs 97
up to higher q values (i.e., it is possible to detect modes with smaller wave-
lengths). Figure 3.17 shows as the increase of angle number makes mea-
surable modes at q higher and higer. One e�ect of a short region in which
mode amplitudes are accessible, as with low number of angles, is that the
�tting range ends in the region where the e�ect of the limited resolution takes
place. This makes the analysis unsuitable and underestimated values of κ
and σ (ten times lower than the real value) are obtained. Higher number of
angles extend the static spectrum ensuring the �tting range to be out of the
region where noise becomes relevant (see �gure 3.18).
As the number of angles increases, the values of κ seem to increase, leveling
o� to a constant value ten times higher than the value at low number of
angles. Analogously, also σ showed a dependence from the number of angles,
leveling o� at a value 15% lower than the value at low number of angles. κ
and σ appear to level o� above approximately 300 angles (�gure 3.19, top
panel). A similar behaviour was observed analysing a smaller vesicle (radius
104
105
106
107
108
10−18
10−17
10−16
10−15
10−14
10−13
10−12
10−11
<|h
(qx)|
2 > (
m2 )
qx (m−1)
r=25.9µm
Figure 3.17: Static spectra calculated for a single vesicle (radius = 25.9 µm) withdi�erent numbers of sampling angles (92,120,160,200,280,360,400,480). The imageresolution was 0.184 µm/pixel.
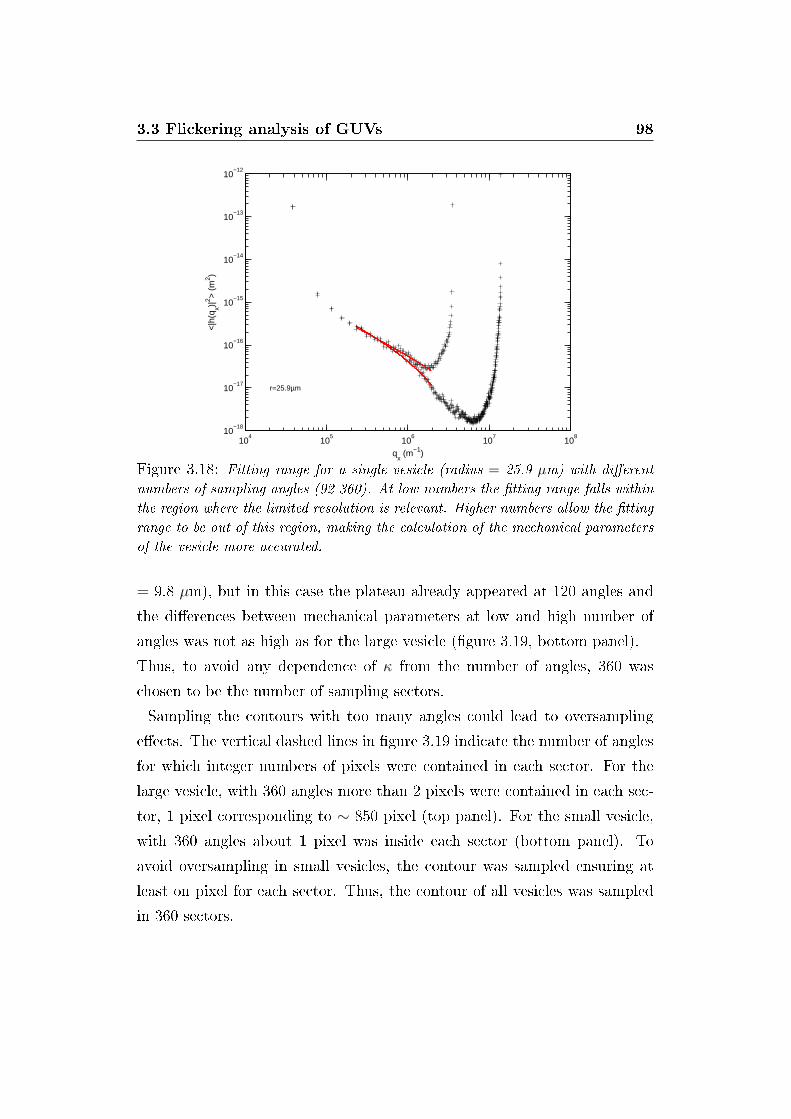
3.3 Flickering analysis of GUVs 98
104
105
106
107
108
10−18
10−17
10−16
10−15
10−14
10−13
10−12
<|h
(qx)|
2 > (
m2 )
qx (m−1)
r=25.9µm
Figure 3.18: Fitting range for a single vesicle (radius = 25.9 µm) with di�erentnumbers of sampling angles (92 360). At low numbers the �tting range falls withinthe region where the limited resolution is relevant. Higher numbers allow the �ttingrange to be out of this region, making the calculation of the mechanical parametersof the vesicle more accurated.
= 9.8 µm), but in this case the plateau already appeared at 120 angles and
the di�erences between mechanical parameters at low and high number of
angles was not as high as for the large vesicle (�gure 3.19, bottom panel).
Thus, to avoid any dependence of κ from the number of angles, 360 was
chosen to be the number of sampling sectors.
Sampling the contours with too many angles could lead to oversampling
e�ects. The vertical dashed lines in �gure 3.19 indicate the number of angles
for which integer numbers of pixels were contained in each sector. For the
large vesicle, with 360 angles more than 2 pixels were contained in each sec-
tor, 1 pixel corresponding to ∼ 850 pixel (top panel). For the small vesicle,
with 360 angles about 1 pixel was inside each sector (bottom panel). To
avoid oversampling in small vesicles, the contour was sampled ensuring at
least on pixel for each sector. Thus, the contour of all vesicles was sampled
in 360 sectors.
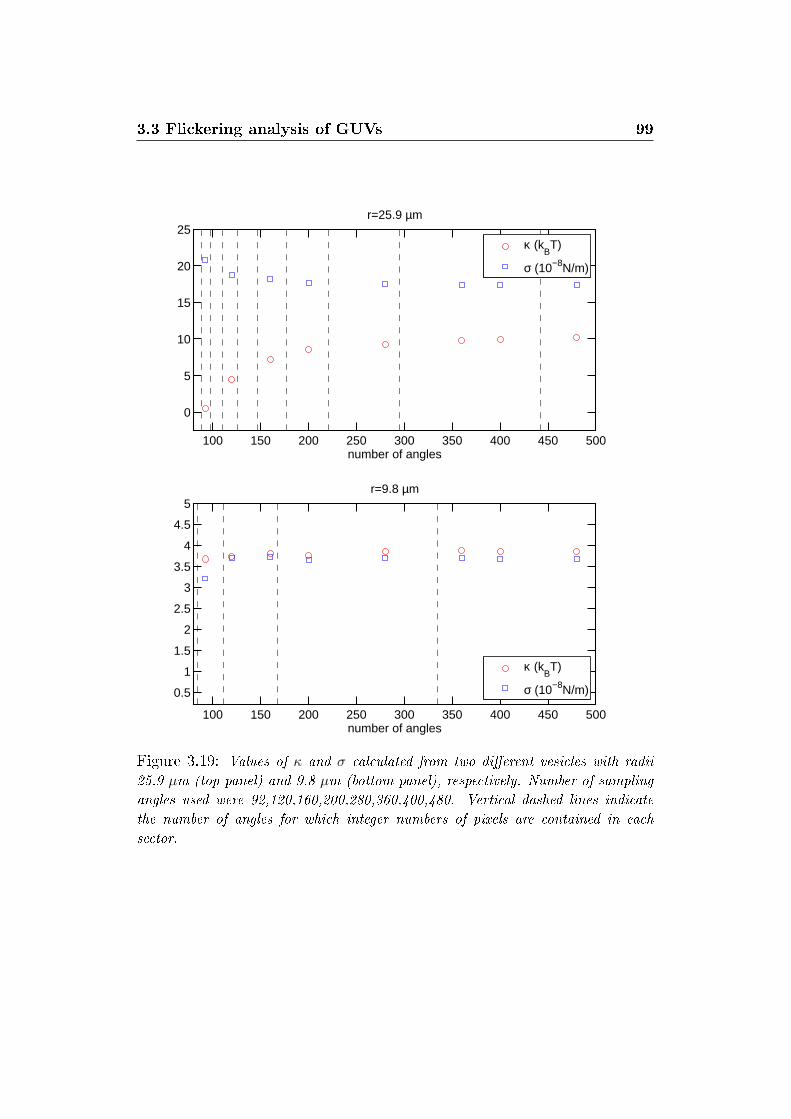
3.3 Flickering analysis of GUVs 99
100 150 200 250 300 350 400 450 500
0
5
10
15
20
25
number of angles
r=25.9 µm
κ (kBT)
σ (10−8N/m)
100 150 200 250 300 350 400 450 500
0.5
1
1.5
2
2.5
3
3.5
4
4.5
5
number of angles
r=9.8 µm
κ (kBT)
σ (10−8N/m)
Figure 3.19: Values of κ and σ calculated from two di�erent vesicles with radii25.9 µm (top panel) and 9.8 µm (bottom panel), respectively. Number of samplingangles used were 92,120,160,200,280,360,400,480. Vertical dashed lines indicatethe number of angles for which integer numbers of pixels are contained in eachsector.
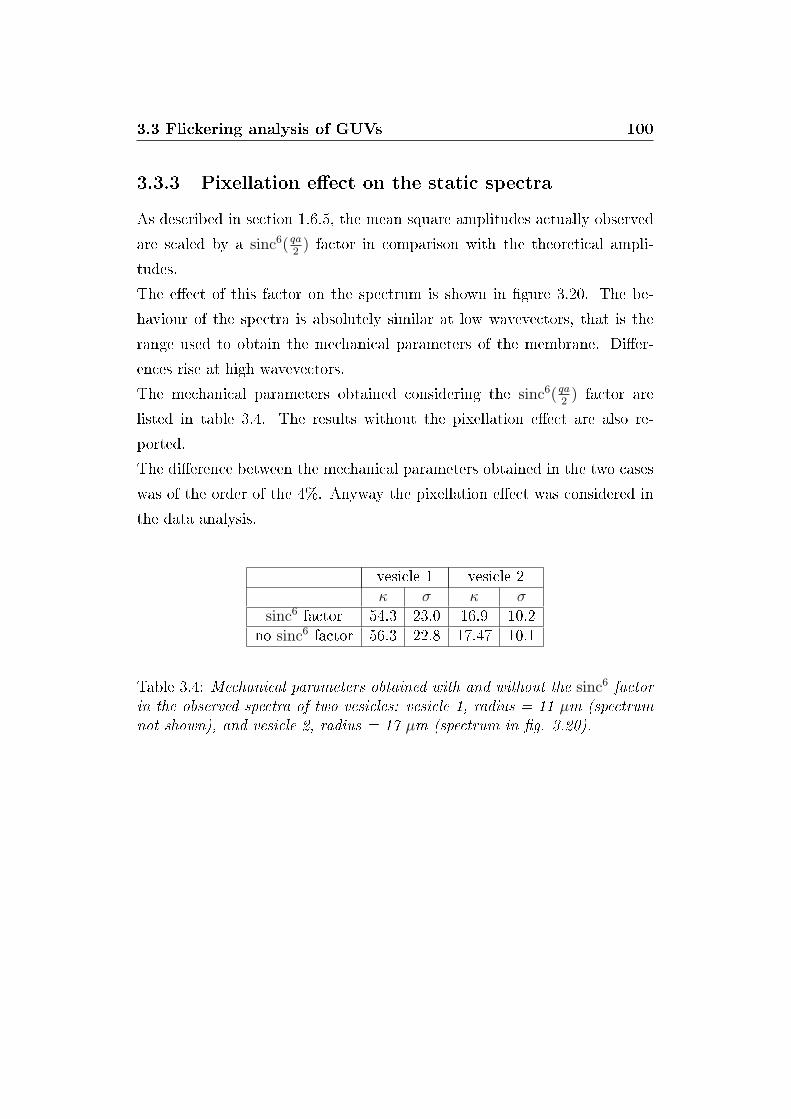
3.3 Flickering analysis of GUVs 100
3.3.3 Pixellation e�ect on the static spectra
As described in section 1.6.5, the mean square amplitudes actually observed
are scaled by a sinc6( qa2
) factor in comparison with the theoretical ampli-
tudes.
The e�ect of this factor on the spectrum is shown in �gure 3.20. The be-
haviour of the spectra is absolutely similar at low wavevectors, that is the
range used to obtain the mechanical parameters of the membrane. Di�er-
ences rise at high wavevectors.
The mechanical parameters obtained considering the sinc6( qa2
) factor are
listed in table 3.4. The results without the pixellation e�ect are also re-
ported.
The di�erence between the mechanical parameters obtained in the two cases
was of the order of the 4%. Anyway the pixellation e�ect was considered in
the data analysis.
vesicle 1 vesicle 2κ σ κ σ
sinc6 factor 54.3 23.0 16.9 10.2no sinc6 factor 56.3 22.8 17.47 10.1
Table 3.4: Mechanical parameters obtained with and without the sinc6 factorin the observed spectra of two vesicles: vesicle 1, radius = 11 µm (spectrumnot shown), and vesicle 2, radius = 17 µm (spectrum in �g. 3.20).
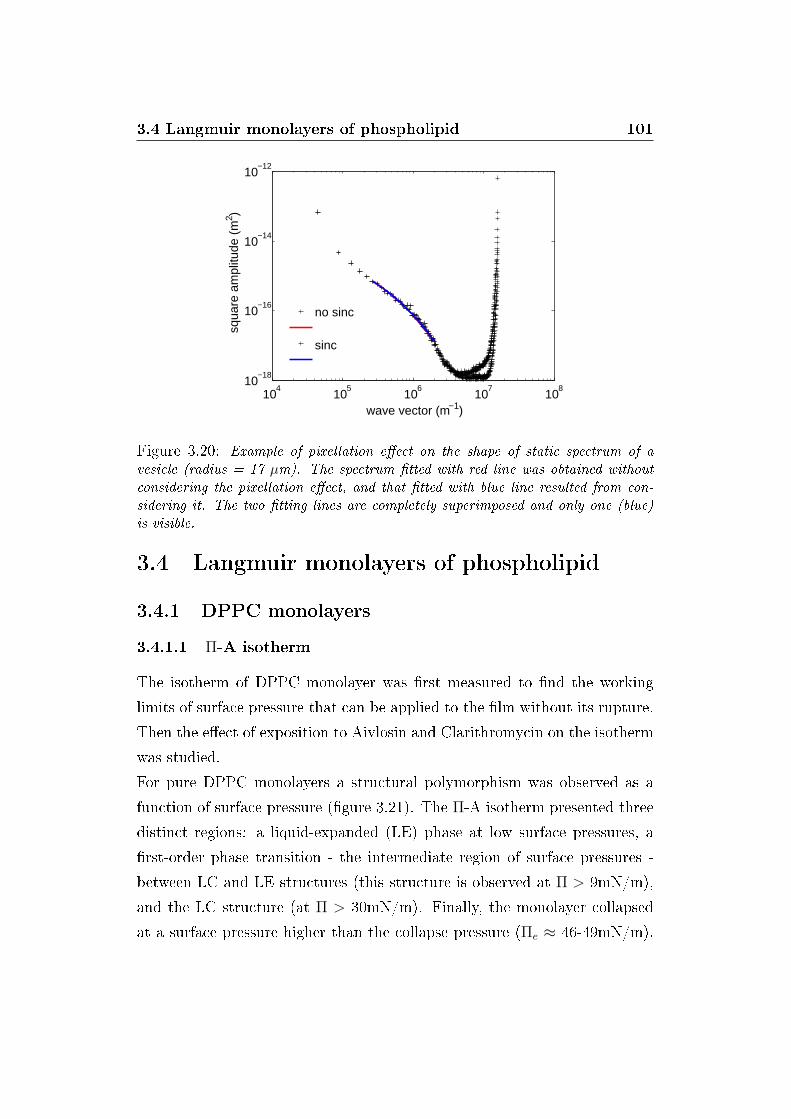
3.4 Langmuir monolayers of phospholipid 101
104
105
106
107
108
10−18
10−16
10−14
10−12
squa
re a
mpl
itude
(m
2 )
wave vector (m−1)
no sinc
sinc
Figure 3.20: Example of pixellation e�ect on the shape of static spectrum of avesicle (radius = 17 µm). The spectrum �tted with red line was obtained withoutconsidering the pixellation e�ect, and that �tted with blue line resulted from con-sidering it. The two �tting lines are completely superimposed and only one (blue)is visible.
3.4 Langmuir monolayers of phospholipid
3.4.1 DPPC monolayers
3.4.1.1 Π-A isotherm
The isotherm of DPPC monolayer was �rst measured to �nd the working
limits of surface pressure that can be applied to the �lm without its rupture.
Then the e�ect of exposition to Aivlosin and Clarithromycin on the isotherm
was studied.
For pure DPPC monolayers a structural polymorphism was observed as a
function of surface pressure (�gure 3.21). The Π-A isotherm presented three
distinct regions: a liquid-expanded (LE) phase at low surface pressures, a
�rst-order phase transition - the intermediate region of surface pressures -
between LC and LE structures (this structure is observed at Π > 9mN/m),
and the LC structure (at Π > 30mN/m). Finally, the monolayer collapsed
at a surface pressure higher than the collapse pressure (Πe ≈ 46-49mN/m).
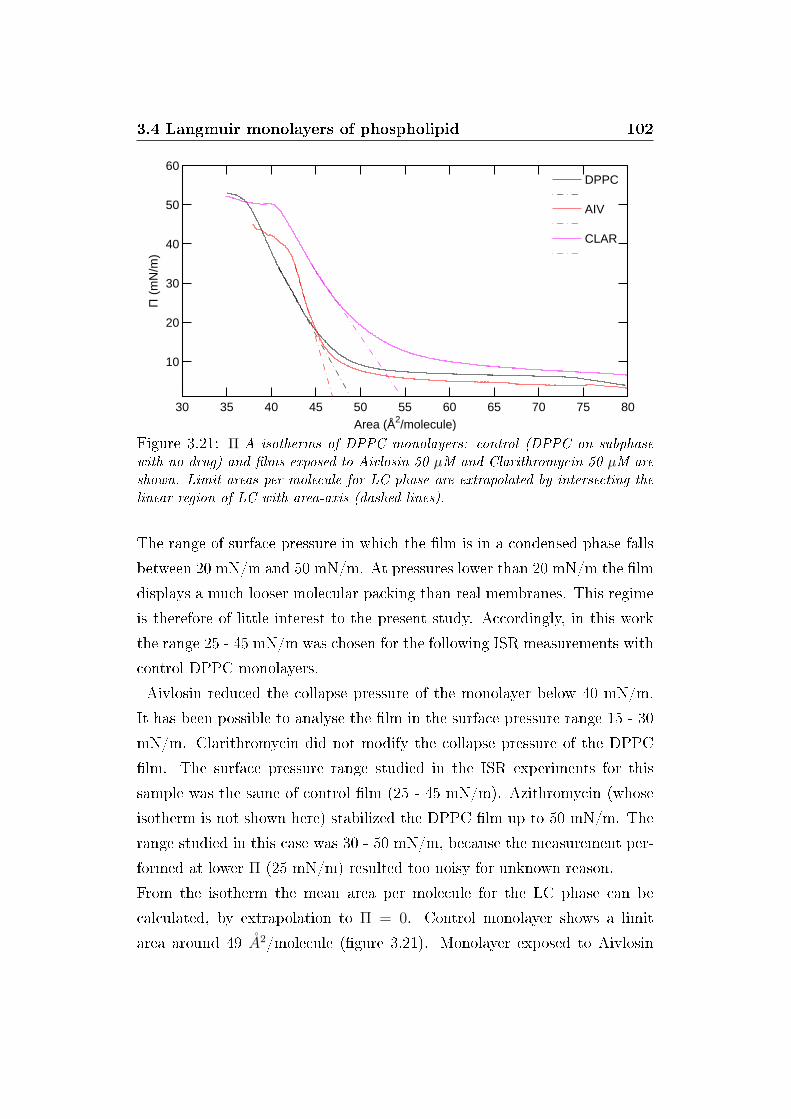
3.4 Langmuir monolayers of phospholipid 102
30 35 40 45 50 55 60 65 70 75 80
10
20
30
40
50
60
Area (Å2/molecule)
Π (
mN
/m)
DPPC
AIV
CLAR
Figure 3.21: Π-A isotherms of DPPC monolayers: control (DPPC on subphasewith no drug) and �lms exposed to Aivlosin 50 µM and Clarithromycin 50 µM areshown. Limit areas per molecule for LC phase are extrapolated by intersecting thelinear region of LC with area-axis (dashed lines).
The range of surface pressure in which the �lm is in a condensed phase falls
between 20 mN/m and 50 mN/m. At pressures lower than 20 mN/m the �lm
displays a much looser molecular packing than real membranes. This regime
is therefore of little interest to the present study. Accordingly, in this work
the range 25 - 45 mN/m was chosen for the following ISR measurements with
control DPPC monolayers.
Aivlosin reduced the collapse pressure of the monolayer below 40 mN/m.
It has been possible to analyse the �lm in the surface pressure range 15 - 30
mN/m. Clarithromycin did not modify the collapse pressure of the DPPC
�lm. The surface pressure range studied in the ISR experiments for this
sample was the same of control �lm (25 - 45 mN/m). Azithromycin (whose
isotherm is not shown here) stabilized the DPPC �lm up to 50 mN/m. The
range studied in this case was 30 - 50 mN/m, because the measurement per-
formed at lower Π (25 mN/m) resulted too noisy for unknown reason.
From the isotherm the mean area per molecule for the LC phase can be
calculated, by extrapolation to Π = 0. Control monolayer shows a limit
area around 49 A2/molecule (�gure 3.21). Monolayer exposed to Aivlosin
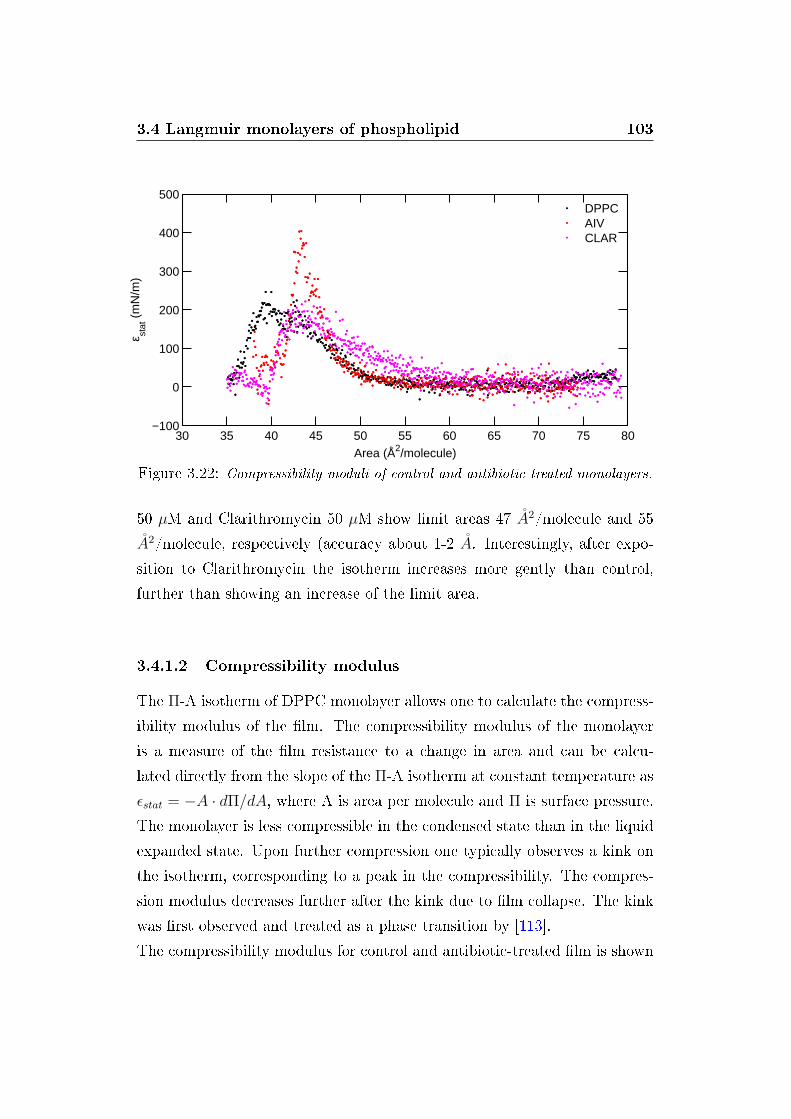
3.4 Langmuir monolayers of phospholipid 103
30 35 40 45 50 55 60 65 70 75 80−100
0
100
200
300
400
500
ε stat
(m
N/m
)
Area (Å2/molecule)
DPPCAIVCLAR
Figure 3.22: Compressibility moduli of control and antibiotic-treated monolayers.
50 µM and Clarithromycin 50 µM show limit areas 47 A2/molecule and 55
A2/molecule, respectively (accuracy about 1-2 A. Interestingly, after expo-
sition to Clarithromycin the isotherm increases more gently than control,
further than showing an increase of the limit area.
3.4.1.2 Compressibility modulus
The Π-A isotherm of DPPC monolayer allows one to calculate the compress-
ibility modulus of the �lm. The compressibility modulus of the monolayer
is a measure of the �lm resistance to a change in area and can be calcu-
lated directly from the slope of the Π-A isotherm at constant temperature as
εstat = −A · dΠ/dA, where A is area per molecule and Π is surface pressure.
The monolayer is less compressible in the condensed state than in the liquid
expanded state. Upon further compression one typically observes a kink on
the isotherm, corresponding to a peak in the compressibility. The compres-
sion modulus decreases further after the kink due to �lm collapse. The kink
was �rst observed and treated as a phase transition by [113].
The compressibility modulus for control and antibiotic-treated �lm is shown
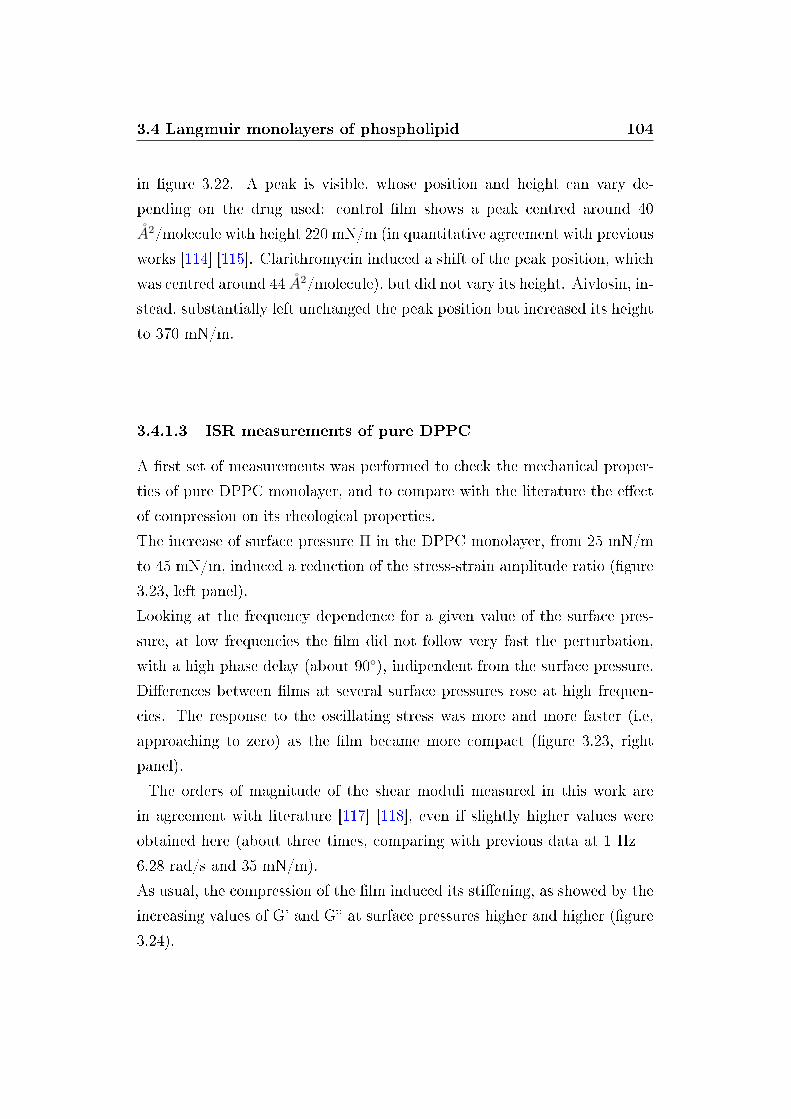
3.4 Langmuir monolayers of phospholipid 104
in �gure 3.22. A peak is visible, whose position and height can vary de-
pending on the drug used: control �lm shows a peak centred around 40
A2/molecule with height 220 mN/m (in quantitative agreement with previous
works [114] [115]. Clarithromycin induced a shift of the peak position, which
was centred around 44 A2/molecule), but did not vary its height. Aivlosin, in-
stead, substantially left unchanged the peak position but increased its height
to 370 mN/m.
3.4.1.3 ISR measurements of pure DPPC
A �rst set of measurements was performed to check the mechanical proper-
ties of pure DPPC monolayer, and to compare with the literature the e�ect
of compression on its rheological properties.
The increase of surface pressure Π in the DPPC monolayer, from 25 mN/m
to 45 mN/m, induced a reduction of the stress-strain amplitude ratio (�gure
3.23, left panel).
Looking at the frequency dependence for a given value of the surface pres-
sure, at low frequencies the �lm did not follow very fast the perturbation,
with a high phase delay (about 90◦), indipendent from the surface pressure.
Di�erences between �lms at several surface pressures rose at high frequen-
cies. The response to the oscillating stress was more and more faster (i.e,
approaching to zero) as the �lm became more compact (�gure 3.23, right
panel).
The orders of magnitude of the shear moduli measured in this work are
in agreement with literature [117] [118], even if slightly higher values were
obtained here (about three times, comparing with previous data at 1 Hz =
6.28 rad/s and 35 mN/m).
As usual, the compression of the �lm induced its sti�ening, as showed by the
increasing values of G' and G� at surface pressures higher and higher (�gure
3.24).
3.4 Langmuir monolayers of phospholipid 105
At given surface pressure the shear moduli showed two distinct regions. At
low frequencies (0.5 - 5 rad/s) G" was dominant; at high frequencies a
crossover between the two moduli was observable, above which the elastic
modulus was dominant.
The e�ect of raising the surface pressure was the shift of the crossover to
lower frequencies. At low surface pressures the crossover was out of the
experimentally accessed frequency range and it was not visible. It became
accessible at surface pressure 35 mN/m: it shifted from about 22 rad/s to 18
rad/s to 12 rad/s going from 35 mN/m to 45 mN/m (see table 3.6).
The mainly viscous character of DPPC �lm at low frequencies was �rst quan-
titatively studied here by �tting G" in this range with a power law as:
G” = A · ωα. (3.3)
The �tting parameters α obtained at each surface pressure are reported in
table 3.5. It can be seen as the exponents of the �t reasonably approximate
to unity over all the working pressures. This induced us to treat the �lm as
100
101
100
102
104
Freq (rad/s)
Am
plitu
de r
atio
(m
/N)
10−1
100
101
0
20
40
60
80
100
120
140
160
180
Freq (rad/s)
Pha
se S
hift
(deg
)
25 mN/m30 mN/m35 mN/m40 mN/m45 mN/mwater
Figure 3.23: Di�erent behaviours of a DPPC Langmuir �lm at several surfacepressures. Left panel: increasing surface pressure induces a reduction of amplituderatio. Right panel: phase shift depends on frequency perturbation and �lm surfacepressure. Black curves refer to water signal.
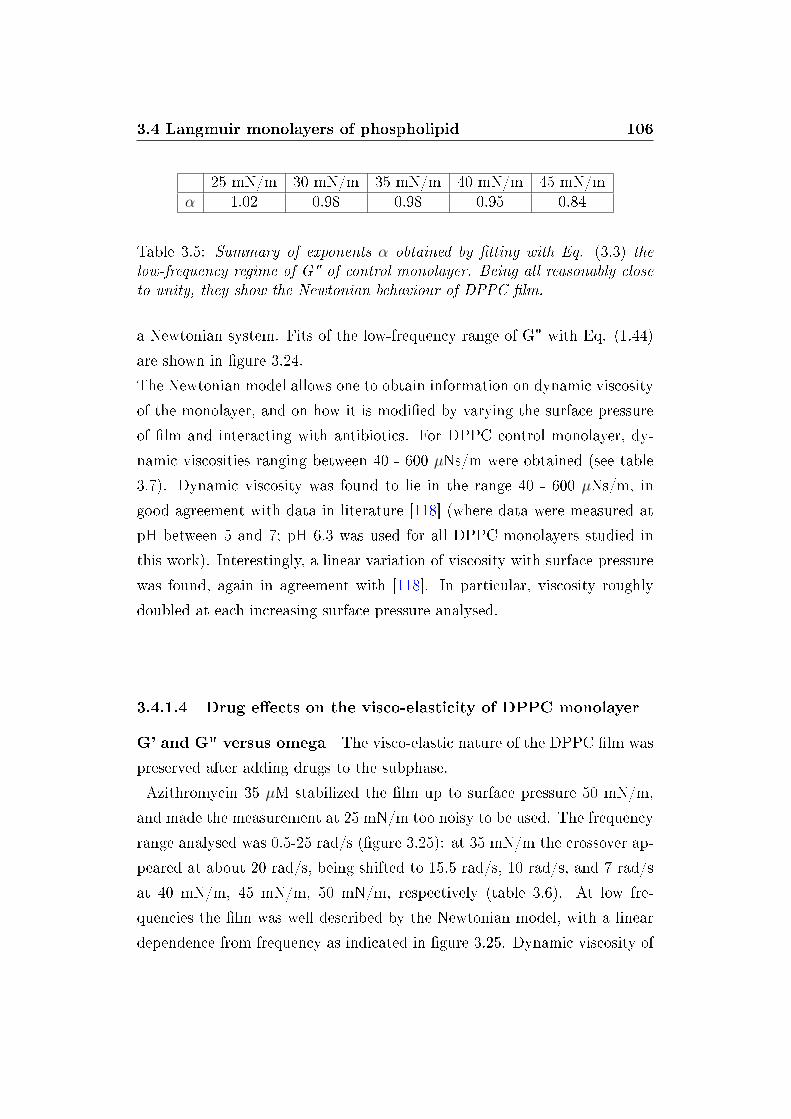
3.4 Langmuir monolayers of phospholipid 106
25 mN/m 30 mN/m 35 mN/m 40 mN/m 45 mN/mα 1.02 0.98 0.98 0.95 0.84
Table 3.5: Summary of exponents α obtained by �tting with Eq. (3.3) thelow-frequency regime of G" of control monolayer. Being all reasonably closeto unity, they show the Newtonian behaviour of DPPC �lm.
a Newtonian system. Fits of the low-frequency range of G" with Eq. (1.44)
are shown in �gure 3.24.
The Newtonian model allows one to obtain information on dynamic viscosity
of the monolayer, and on how it is modi�ed by varying the surface pressure
of �lm and interacting with antibiotics. For DPPC control monolayer, dy-
namic viscosities ranging between 40 - 600 µNs/m were obtained (see table
3.7). Dynamic viscosity was found to lie in the range 40 - 600 µNs/m, in
good agreement with data in literature [118] (where data were measured at
pH between 5 and 7; pH 6.3 was used for all DPPC monolayers studied in
this work). Interestingly, a linear variation of viscosity with surface pressure
was found, again in agreement with [118]. In particular, viscosity roughly
doubled at each increasing surface pressure analysed.
3.4.1.4 Drug e�ects on the visco-elasticity of DPPC monolayer
G' and G" versus omega The visco-elastic nature of the DPPC �lm was
preserved after adding drugs to the subphase.
Azithromycin 35 µM stabilized the �lm up to surface pressure 50 mN/m,
and made the measurement at 25 mN/m too noisy to be used. The frequency
range analysed was 0.5-25 rad/s (�gure 3.25): at 35 mN/m the crossover ap-
peared at about 20 rad/s, being shifted to 15.5 rad/s, 10 rad/s, and 7 rad/s
at 40 mN/m, 45 mN/m, 50 mN/m, respectively (table 3.6). At low fre-
quencies the �lm was well described by the Newtonian model, with a linear
dependence from frequency as indicated in �gure 3.25. Dynamic viscosity of
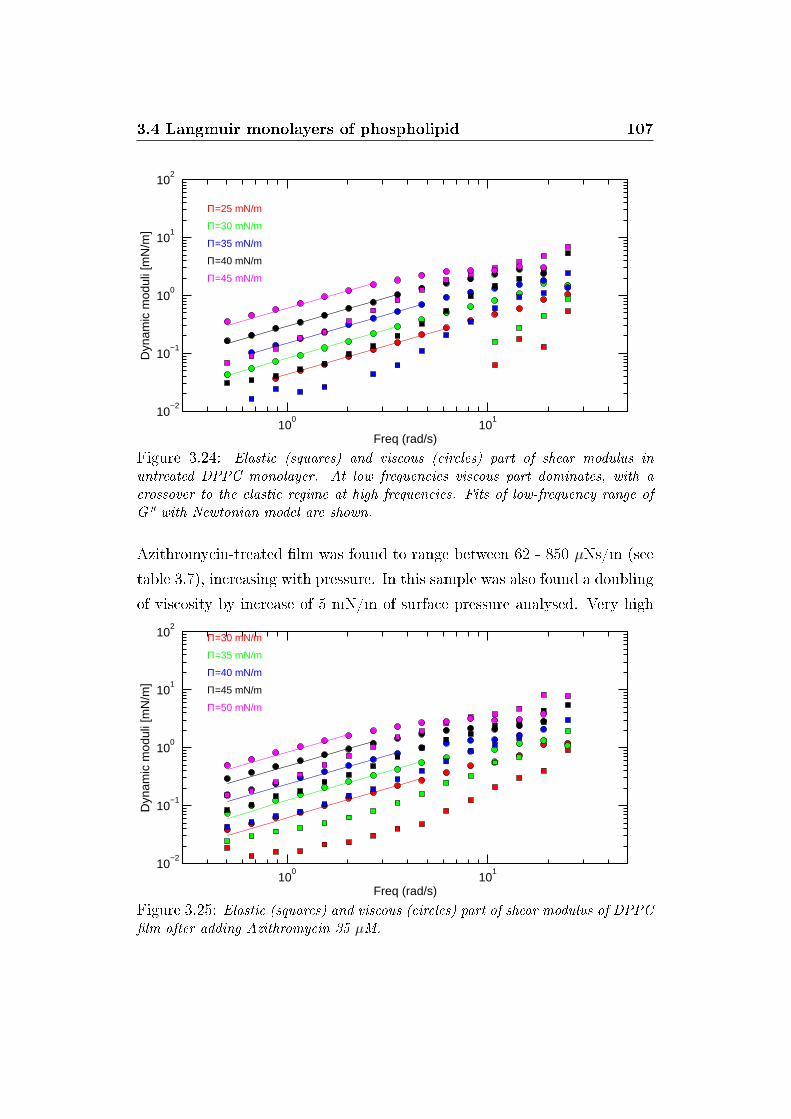
3.4 Langmuir monolayers of phospholipid 107
100
101
10−2
10−1
100
101
102
Π=25 mN/m
Freq (rad/s)
Dyn
amic
mod
uli [
mN
/m] Π=30 mN/m
Π=35 mN/m
Π=40 mN/m
Π=45 mN/m
Figure 3.24: Elastic (squares) and viscous (circles) part of shear modulus inuntreated DPPC monolayer. At low frequencies viscous part dominates, with acrossover to the elastic regime at high frequencies. Fits of low-frequency range ofG" with Newtonian model are shown.
Azithromycin-treated �lm was found to range between 62 - 850 µNs/m (see
table 3.7), increasing with pressure. In this sample was also found a doubling
of viscosity by increase of 5 mN/m of surface pressure analysed. Very high
100
101
10−2
10−1
100
101
102
Π=30 mN/m
Freq (rad/s)
Dyn
amic
mod
uli [
mN
/m]
Π=35 mN/m
Π=40 mN/m
Π=45 mN/m
Π=50 mN/m
Figure 3.25: Elastic (squares) and viscous (circles) part of shear modulus of DPPC�lm after adding Azithromycin 35 µM.
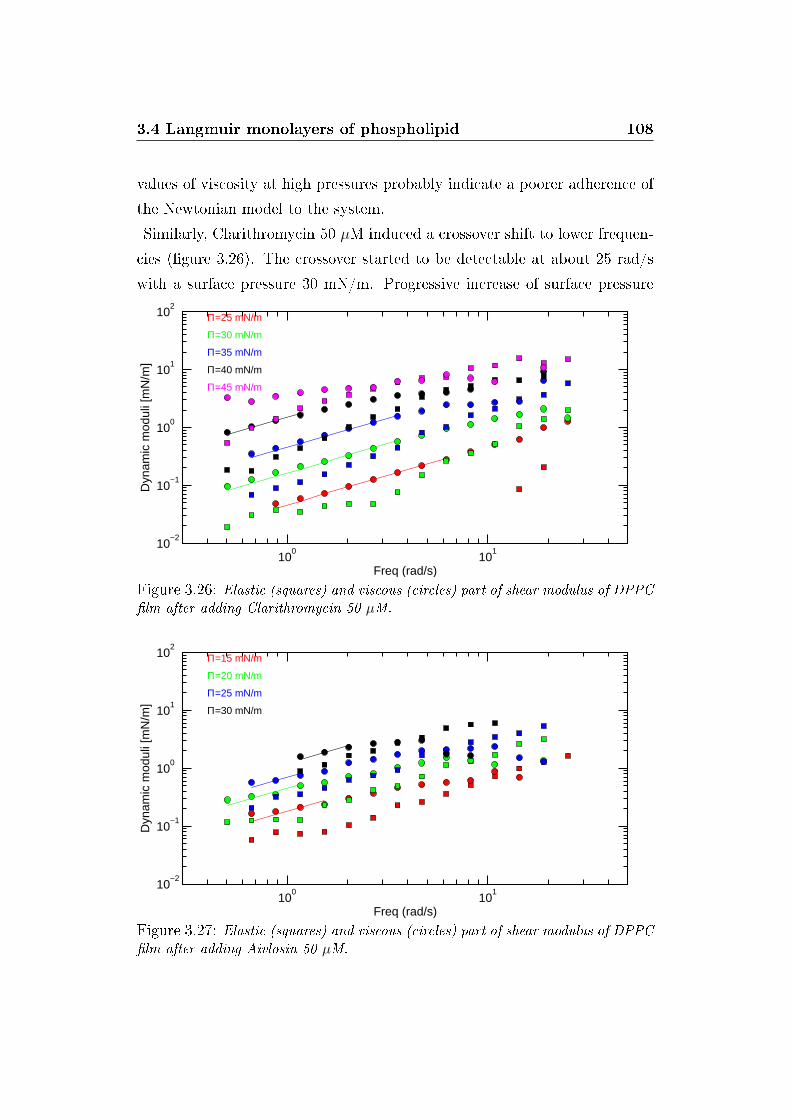
3.4 Langmuir monolayers of phospholipid 108
values of viscosity at high pressures probably indicate a poorer adherence of
the Newtonian model to the system.
Similarly, Clarithromycin 50 µM induced a crossover shift to lower frequen-
cies (�gure 3.26). The crossover started to be detectable at about 25 rad/s
with a surface pressure 30 mN/m. Progressive increase of surface pressure
100
101
10−2
10−1
100
101
102
Π=25 mN/m
Freq (rad/s)
Dyn
amic
mod
uli [
mN
/m]
Π=30 mN/m
Π=35 mN/m
Π=40 mN/m
Π=45 mN/m
Figure 3.26: Elastic (squares) and viscous (circles) part of shear modulus of DPPC�lm after adding Clarithromycin 50 µM.
100
101
10−2
10−1
100
101
102
Π=15 mN/m
Freq (rad/s)
Dyn
amic
mod
uli [
mN
/m]
Π=20 mN/m
Π=25 mN/m
Π=30 mN/m
Figure 3.27: Elastic (squares) and viscous (circles) part of shear modulus of DPPC�lm after adding Aivlosin 50 µM.
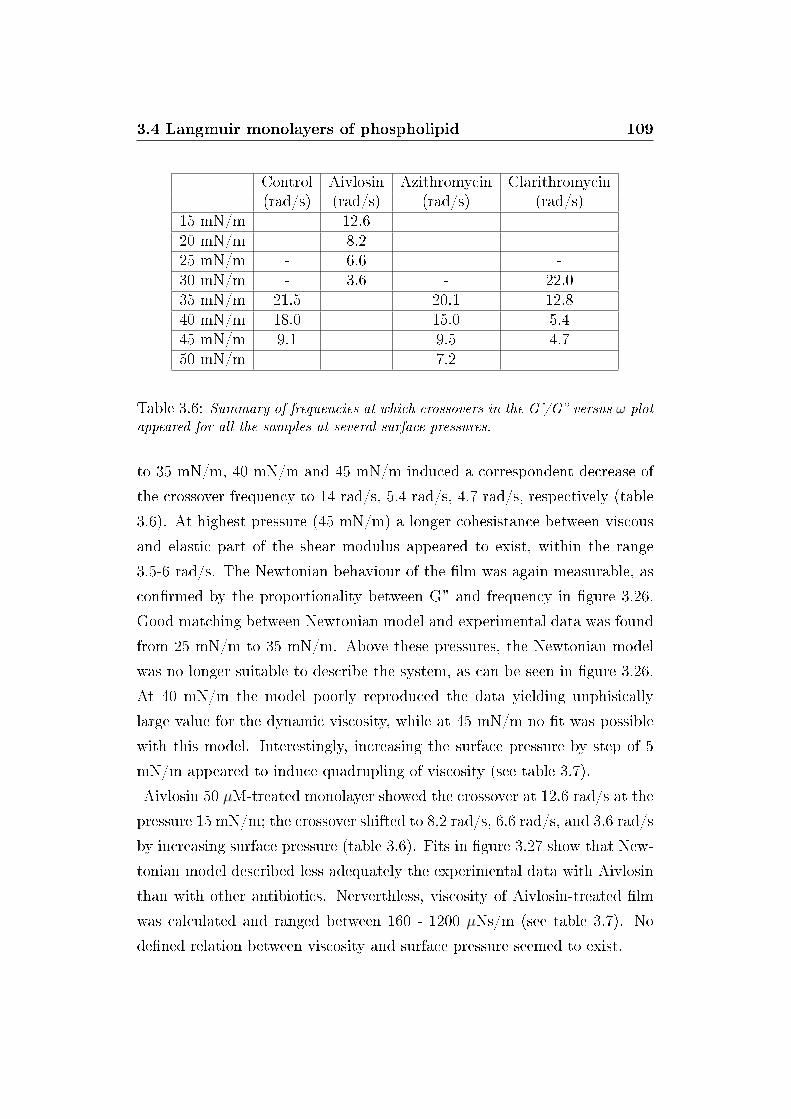
3.4 Langmuir monolayers of phospholipid 109
Control Aivlosin Azithromycin Clarithromycin(rad/s) (rad/s) (rad/s) (rad/s)
15 mN/m 12.620 mN/m 8.225 mN/m - 6.6 -30 mN/m - 3.6 - 22.035 mN/m 21.5 20.1 12.840 mN/m 18.0 15.0 5.445 mN/m 9.1 9.5 4.750 mN/m 7.2
Table 3.6: Summary of frequencies at which crossovers in the G'/G� versus ω plotappeared for all the samples at several surface pressures.
to 35 mN/m, 40 mN/m and 45 mN/m induced a correspondent decrease of
the crossover frequency to 14 rad/s, 5.4 rad/s, 4.7 rad/s, respectively (table
3.6). At highest pressure (45 mN/m) a longer cohesistance between viscous
and elastic part of the shear modulus appeared to exist, within the range
3.5-6 rad/s. The Newtonian behaviour of the �lm was again measurable, as
con�rmed by the proportionality between G" and frequency in �gure 3.26.
Good matching between Newtonian model and experimental data was found
from 25 mN/m to 35 mN/m. Above these pressures, the Newtonian model
was no longer suitable to describe the system, as can be seen in �gure 3.26.
At 40 mN/m the model poorly reproduced the data yielding unphisically
large value for the dynamic viscosity, while at 45 mN/m no �t was possible
with this model. Interestingly, increasing the surface pressure by step of 5
mN/m appeared to induce quadrupling of viscosity (see table 3.7).
Aivlosin 50 µM-treated monolayer showed the crossover at 12.6 rad/s at the
pressure 15 mN/m; the crossover shifted to 8.2 rad/s, 6.6 rad/s, and 3.6 rad/s
by increasing surface pressure (table 3.6). Fits in �gure 3.27 show that New-
tonian model described less adequately the experimental data with Aivlosin
than with other antibiotics. Nerverthless, viscosity of Aivlosin-treated �lm
was calculated and ranged between 160 - 1200 µNs/m (see table 3.7). No
de�ned relation between viscosity and surface pressure seemed to exist.
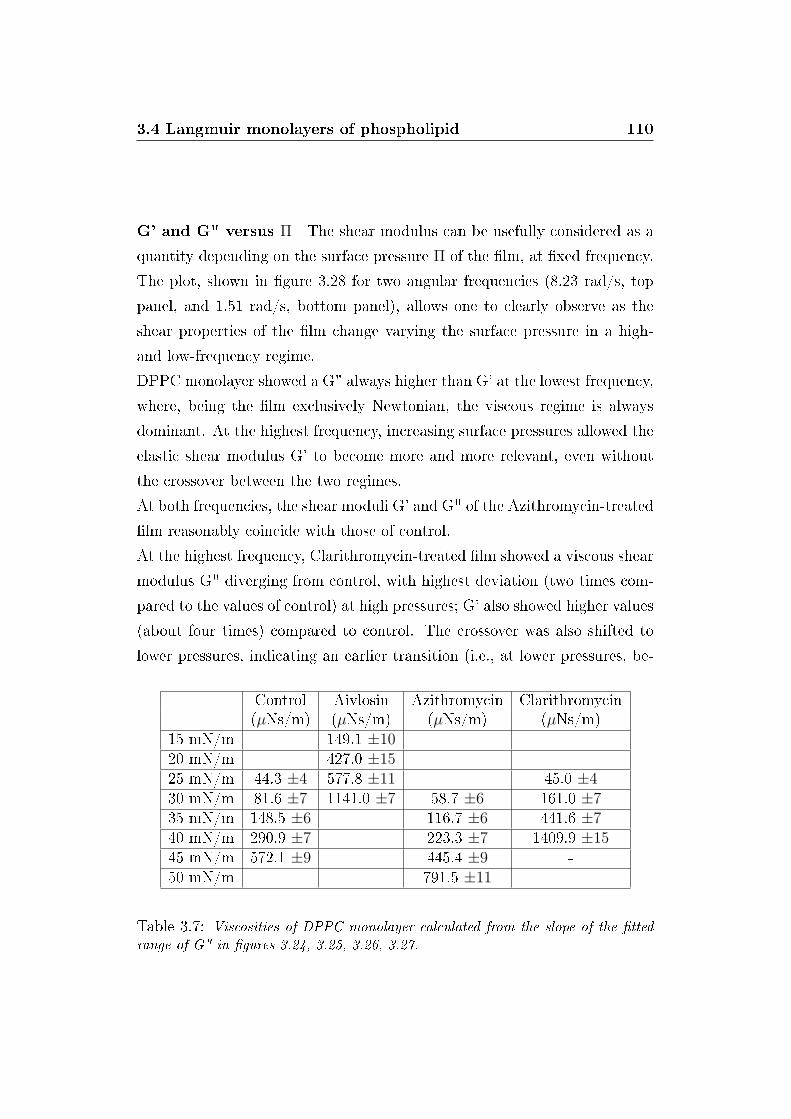
3.4 Langmuir monolayers of phospholipid 110
G' and G" versus Π The shear modulus can be usefully considered as a
quantity depending on the surface pressure Π of the �lm, at �xed frequency.
The plot, shown in �gure 3.28 for two angular frequencies (8.23 rad/s, top
panel, and 1.51 rad/s, bottom panel), allows one to clearly observe as the
shear properties of the �lm change varying the surface pressure in a high-
and low-frequency regime.
DPPC monolayer showed a G" always higher than G' at the lowest frequency,
where, being the �lm exclusively Newtonian, the viscous regime is always
dominant. At the highest frequency, increasing surface pressures allowed the
elastic shear modulus G' to become more and more relevant, even without
the crossover between the two regimes.
At both frequencies, the shear moduli G' and G" of the Azithromycin-treated
�lm reasonably coincide with those of control.
At the highest frequency, Clarithromycin-treated �lm showed a viscous shear
modulus G" diverging from control, with highest deviation (two times com-
pared to the values of control) at high pressures; G' also showed higher values
(about four times) compared to control. The crossover was also shifted to
lower pressures, indicating an earlier transition (i.e., at lower pressures, be-
Control Aivlosin Azithromycin Clarithromycin(µNs/m) (µNs/m) (µNs/m) (µNs/m)
15 mN/m 149.1 ±1020 mN/m 427.0 ±1525 mN/m 44.3 ±4 577.8 ±11 45.0 ±430 mN/m 81.6 ±7 1141.0 ±7 58.7 ±6 161.0 ±735 mN/m 148.5 ±6 116.7 ±6 441.6 ±740 mN/m 290.9 ±7 223.3 ±7 1409.9 ±1545 mN/m 572.1 ±9 445.4 ±9 -50 mN/m 791.5 ±11
Table 3.7: Viscosities of DPPC monolayer calculated from the slope of the �ttedrange of G" in �gures 3.24, 3.25, 3.26, 3.27.
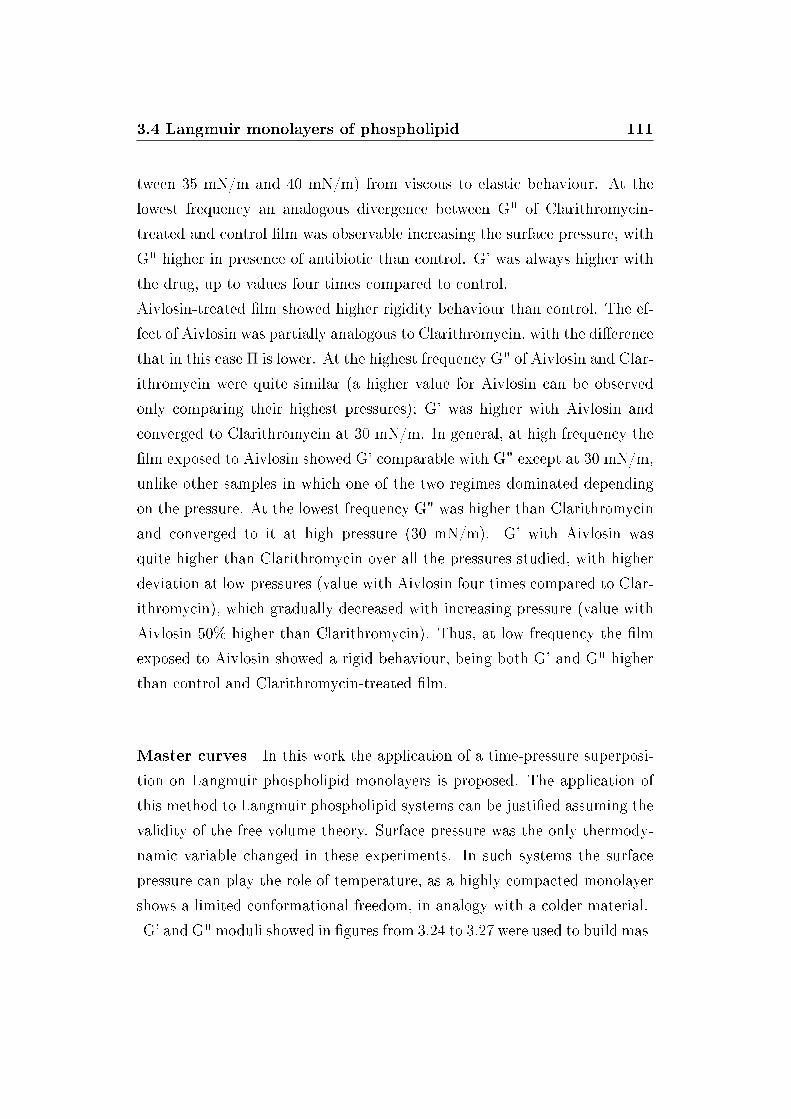
3.4 Langmuir monolayers of phospholipid 111
tween 35 mN/m and 40 mN/m) from viscous to elastic behaviour. At the
lowest frequency an analogous divergence between G" of Clarithromycin-
treated and control �lm was observable increasing the surface pressure, with
G" higher in presence of antibiotic than control. G' was always higher with
the drug, up to values four times compared to control.
Aivlosin-treated �lm showed higher rigidity behaviour than control. The ef-
fect of Aivlosin was partially analogous to Clarithromycin, with the di�erence
that in this case Π is lower. At the highest frequency G" of Aivlosin and Clar-
ithromycin were quite similar (a higher value for Aivlosin can be observed
only comparing their highest pressures); G' was higher with Aivlosin and
converged to Clarithromycin at 30 mN/m. In general, at high frequency the
�lm exposed to Aivlosin showed G' comparable with G" except at 30 mN/m,
unlike other samples in which one of the two regimes dominated depending
on the pressure. At the lowest frequency G" was higher than Clarithromycin
and converged to it at high pressure (30 mN/m). G' with Aivlosin was
quite higher than Clarithromycin over all the pressures studied, with higher
deviation at low pressures (value with Aivlosin four times compared to Clar-
ithromycin), which gradually decreased with increasing pressure (value with
Aivlosin 50% higher than Clarithromycin). Thus, at low frequency the �lm
exposed to Aivlosin showed a rigid behaviour, being both G' and G" higher
than control and Clarithromycin-treated �lm.
Master curves In this work the application of a time-pressure superposi-
tion on Langmuir phospholipid monolayers is proposed. The application of
this method to Langmuir phospholipid systems can be justi�ed assuming the
validity of the free volume theory. Surface pressure was the only thermody-
namic variable changed in these experiments. In such systems the surface
pressure can play the role of temperature, as a highly compacted monolayer
shows a limited conformational freedom, in analogy with a colder material.
G' and G" moduli showed in �gures from 3.24 to 3.27 were used to build mas-
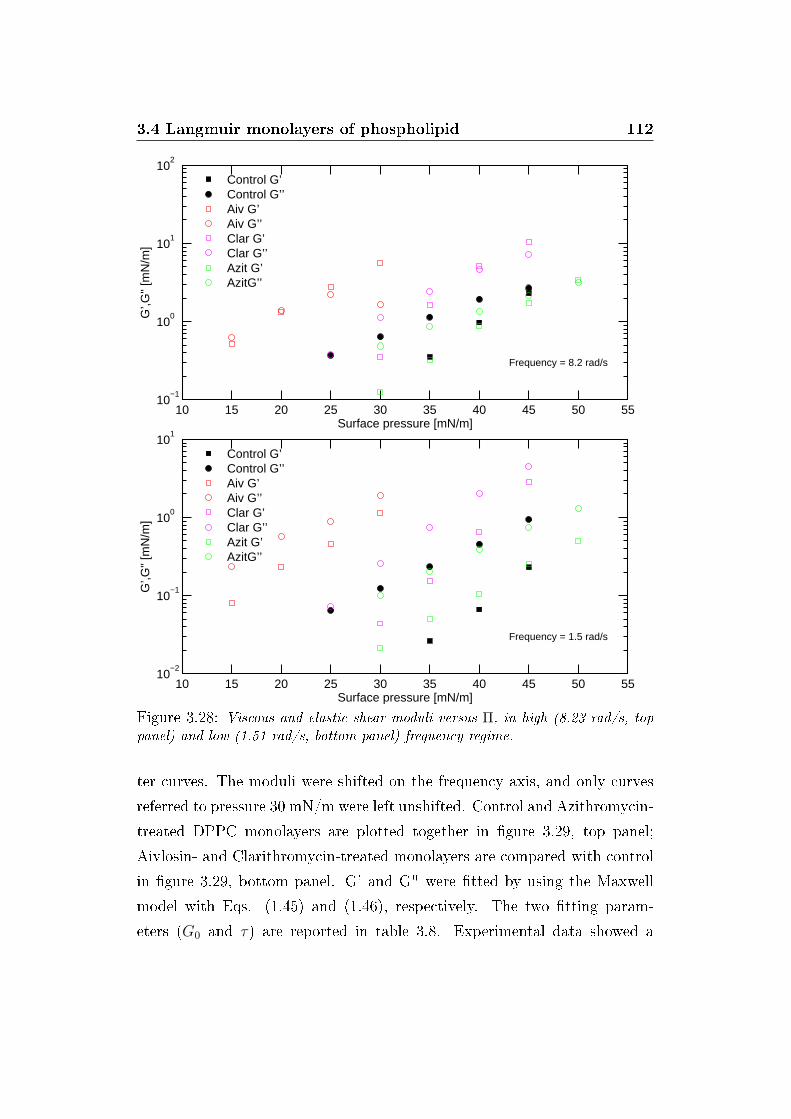
3.4 Langmuir monolayers of phospholipid 112
10 15 20 25 30 35 40 45 50 5510
−1
100
101
102
G’,G
" [m
N/m
]
Surface pressure [mN/m]
Frequency = 8.2 rad/s
Control G’Control G’’Aiv G’Aiv G’’Clar G’Clar G’’Azit G’AzitG’’
10 15 20 25 30 35 40 45 50 5510
−2
10−1
100
101
G’,G
" [m
N/m
]
Surface pressure [mN/m]
Frequency = 1.5 rad/s
Control G’Control G’’Aiv G’Aiv G’’Clar G’Clar G’’Azit G’AzitG’’
Figure 3.28: Viscous and elastic shear moduli versus Π, in high (8.23 rad/s, toppanel) and low (1.51 rad/s, bottom panel) frequency regime.
ter curves. The moduli were shifted on the frequency axis, and only curves
referred to pressure 30 mN/m were left unshifted. Control and Azithromycin-
treated DPPC monolayers are plotted together in �gure 3.29, top panel;
Aivlosin- and Clarithromycin-treated monolayers are compared with control
in �gure 3.29, bottom panel. G' and G" were �tted by using the Maxwell
model with Eqs. (1.45) and (1.46), respectively. The two �tting param-
eters (G0 and τ) are reported in table 3.8. Experimental data showed a
3.4 Langmuir monolayers of phospholipid 113
100
101
102
103
10−2
10−1
100
101
aω (rad/s)
G’,G
" (m
N/m
)
CONTROL
AZITHROMYCIN
G’G’’
10−1
100
101
102
103
10−2
10−1
100
101
aω (rad/s)
G’,G
" (m
N/m
)
CONTROL
AIVLOSIN
CLARITHROMYCIN
G’G’’
Figure 3.29: Master curves of control and Azithromycin-treated DPPC monolayers(top panel); master curves of control, Clarithromycin- and Aivlosin-treated DPPCmonolayers (bottom panel). Surface pressure 30 mN/m was chosen as reference.
clear deviation from the Maxwell model in the low frequency region of G':
as usual, in this range G' is very low compared to G" and not accurately
detectable. Moreover, the higher values of experimental G' in comparison
to model could be due to spurious e�ects (e.g., harmonic potential e�ects
caused by the meniscus orientation in the channel).
The horizontal shift factors used to generate the master curves are shown in
�gure 3.30 as a function of the surface pressure. Their dimension is that of
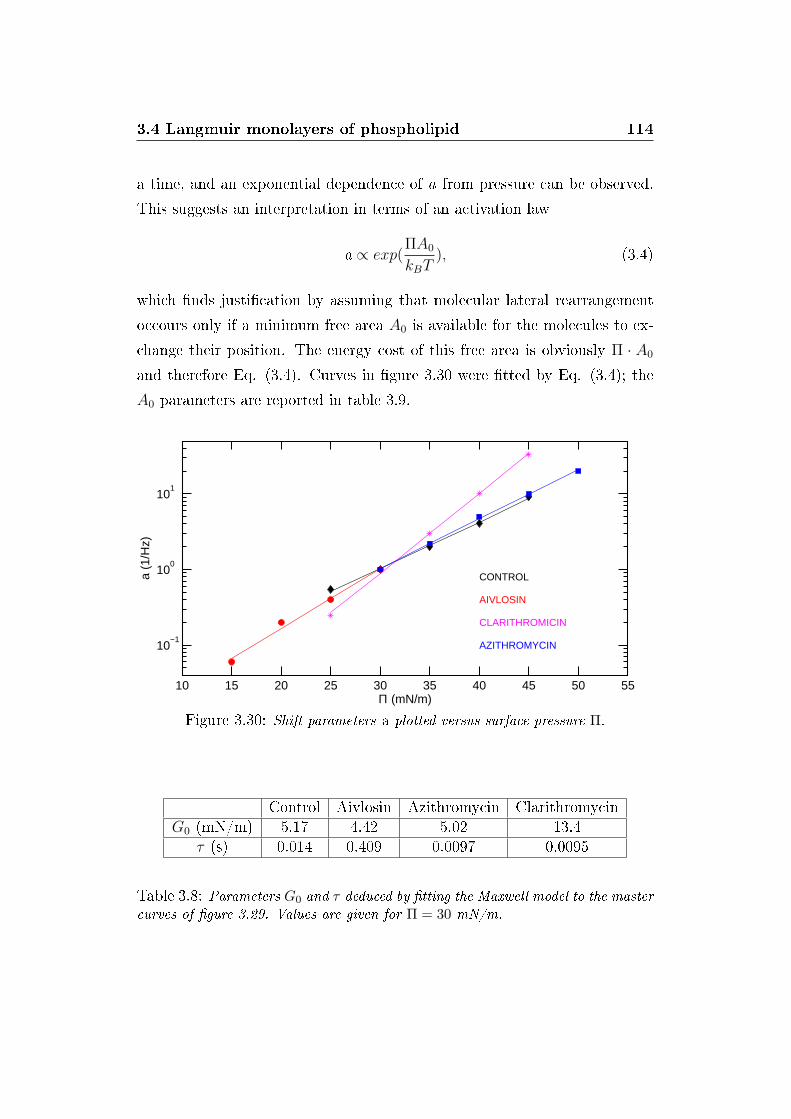
3.4 Langmuir monolayers of phospholipid 114
a time, and an exponential dependence of a from pressure can be observed.
This suggests an interpretation in terms of an activation law
a ∝ exp(ΠA0
kBT), (3.4)
which �nds justi�cation by assuming that molecular lateral rearrangement
occours only if a minimum free area A0 is available for the molecules to ex-
change their position. The energy cost of this free area is obviously Π · A0
and therefore Eq. (3.4). Curves in �gure 3.30 were �tted by Eq. (3.4); the
A0 parameters are reported in table 3.9.
10 15 20 25 30 35 40 45 50 55
10−1
100
101
Π (mN/m)
a (1
/Hz)
CONTROL
AIVLOSIN
CLARITHROMICIN
AZITHROMYCIN
Figure 3.30: Shift parameters a plotted versus surface pressure Π.
Control Aivlosin Azithromycin ClarithromycinG0 (mN/m) 5.17 4.42 5.02 13.4
τ (s) 0.014 0.409 0.0097 0.0095
Table 3.8: Parameters G0 and τ deduced by �tting the Maxwell model to the mastercurves of �gure 3.29. Values are given for Π = 30 mN/m.
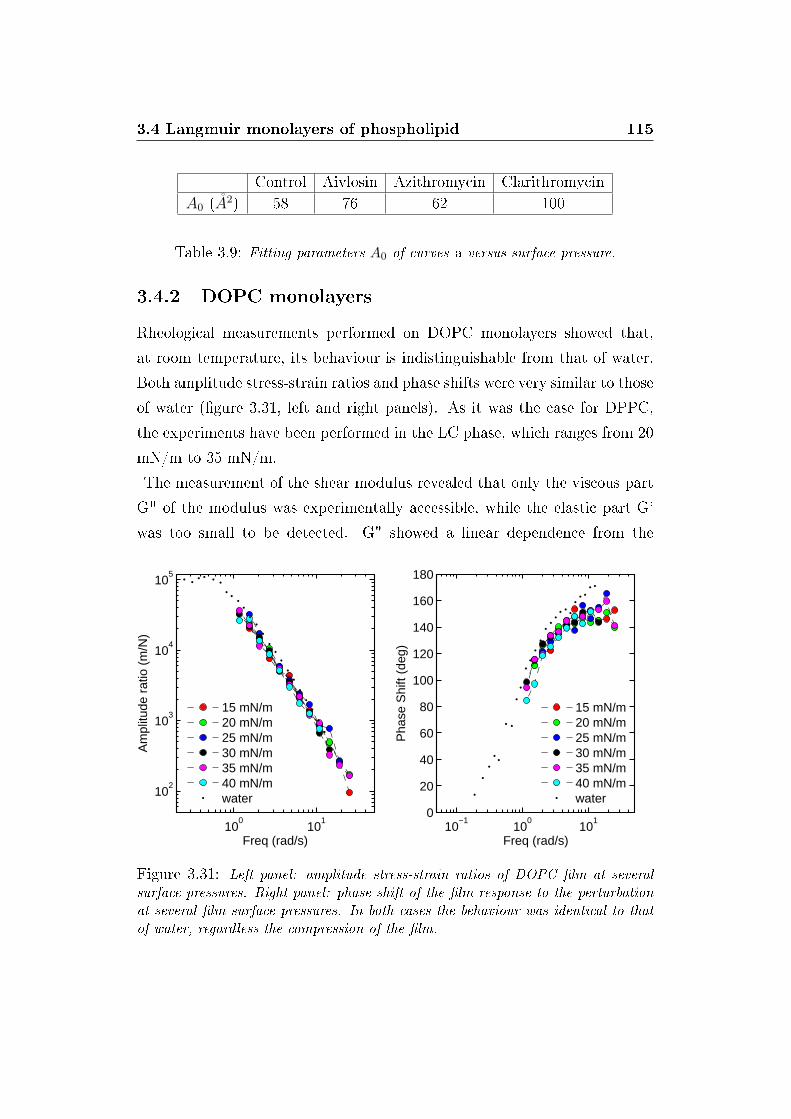
3.4 Langmuir monolayers of phospholipid 115
Control Aivlosin Azithromycin ClarithromycinA0 (A2) 58 76 62 100
Table 3.9: Fitting parameters A0 of curves a versus surface pressure.
3.4.2 DOPC monolayers
Rheological measurements performed on DOPC monolayers showed that,
at room temperature, its behaviour is indistinguishable from that of water.
Both amplitude stress-strain ratios and phase shifts were very similar to those
of water (�gure 3.31, left and right panels). As it was the case for DPPC,
the experiments have been performed in the LC phase, which ranges from 20
mN/m to 35 mN/m.
The measurement of the shear modulus revealed that only the viscous part
G" of the modulus was experimentally accessible, while the elastic part G'
was too small to be detected. G" showed a linear dependence from the
100
101
102
103
104
105
Freq (rad/s)
Am
plitu
de r
atio
(m
/N)
10−1
100
101
0
20
40
60
80
100
120
140
160
180
Freq (rad/s)
Pha
se S
hift
(deg
)
15 mN/m20 mN/m25 mN/m30 mN/m35 mN/m40 mN/mwater
15 mN/m20 mN/m25 mN/m30 mN/m35 mN/m40 mN/mwater
Figure 3.31: Left panel: amplitude stress-strain ratios of DOPC �lm at severalsurface pressures. Right panel: phase shift of the �lm response to the perturbationat several �lm surface pressures. In both cases the behaviour was identical to thatof water, regardless the compression of the �lm.
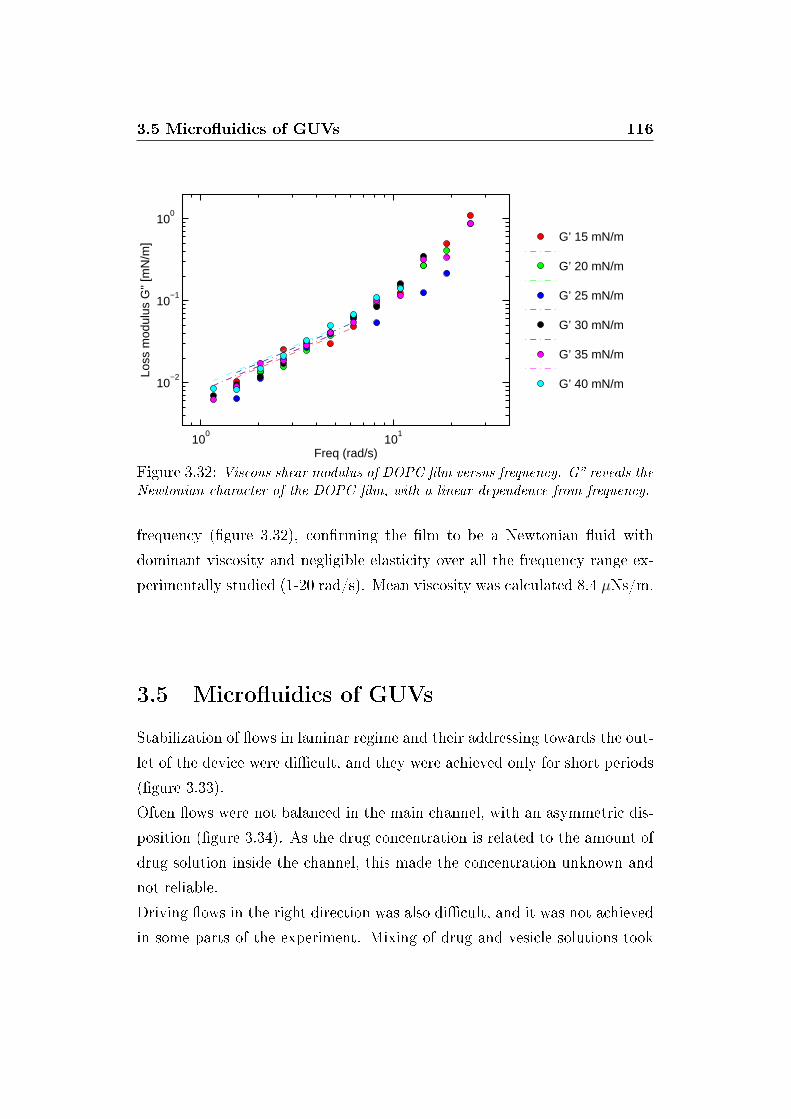
3.5 Micro�uidics of GUVs 116
100
101
10−2
10−1
100
Freq (rad/s)
Loss
mod
ulus
G"
[mN
/m]
G’ 15 mN/m
G’ 20 mN/m
G’ 25 mN/m
G’ 30 mN/m
G’ 35 mN/m
G’ 40 mN/m
Figure 3.32: Viscous shear modulus of DOPC �lm versus frequency. G� reveals theNewtonian character of the DOPC �lm, with a linear dependence from frequency.
frequency (�gure 3.32), con�rming the �lm to be a Newtonian �uid with
dominant viscosity and negligible elasticity over all the frequency range ex-
perimentally studied (1-20 rad/s). Mean viscosity was calculated 8.4 µNs/m.
3.5 Micro�uidics of GUVs
Stabilization of �ows in laminar regime and their addressing towards the out-
let of the device were di�cult, and they were achieved only for short periods
(�gure 3.33).
Often �ows were not balanced in the main channel, with an asymmetric dis-
position (�gure 3.34). As the drug concentration is related to the amount of
drug solution inside the channel, this made the concentration unknown and
not reliable.
Driving �ows in the right direction was also di�cult, and it was not achieved
in some parts of the experiment. Mixing of drug and vesicle solutions took
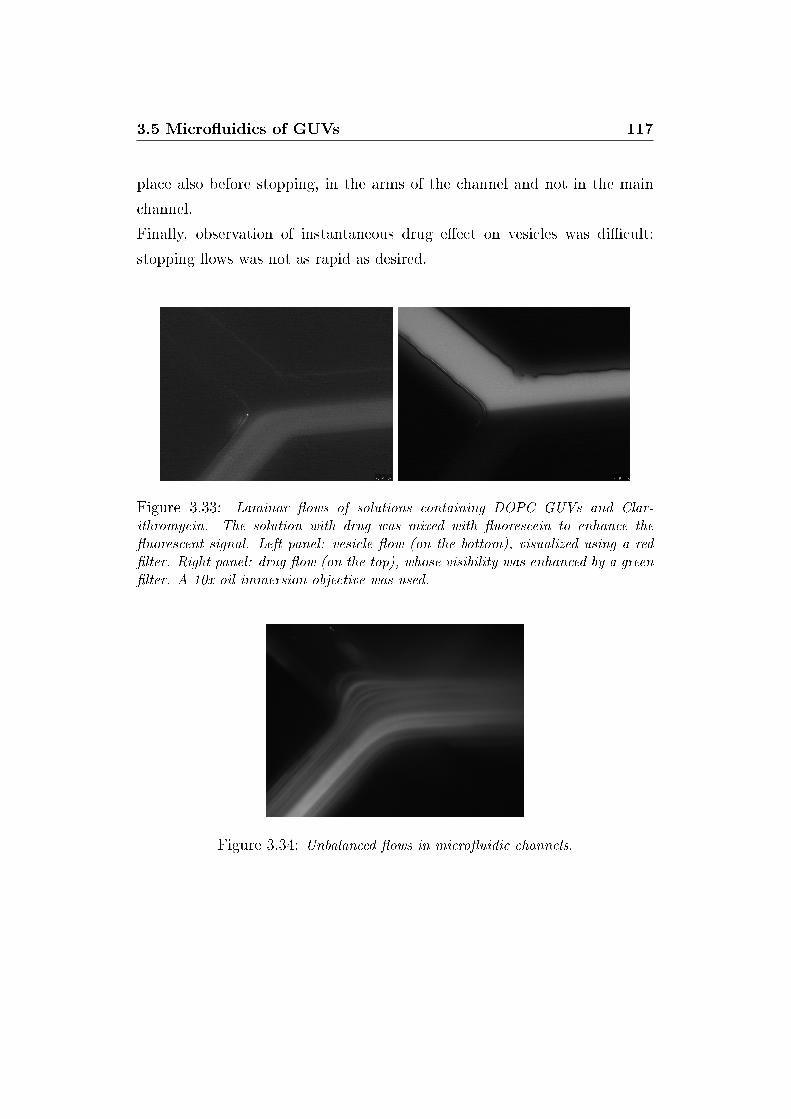
3.5 Micro�uidics of GUVs 117
place also before stopping, in the arms of the channel and not in the main
channel.
Finally, observation of instantaneous drug e�ect on vesicles was di�cult:
stopping �ows was not as rapid as desired.
Figure 3.33: Laminar �ows of solutions containing DOPC GUVs and Clar-ithromycin. The solution with drug was mixed with �uorescein to enhance the�uorescent signal. Left panel: vesicle �ow (on the bottom), visualized using a red�lter. Right panel: drug �ow (on the top), whose visibility was enhanced by a green�lter. A 10x oil immersion objective was used.
Figure 3.34: Unbalanced �ows in micro�uidic channels.
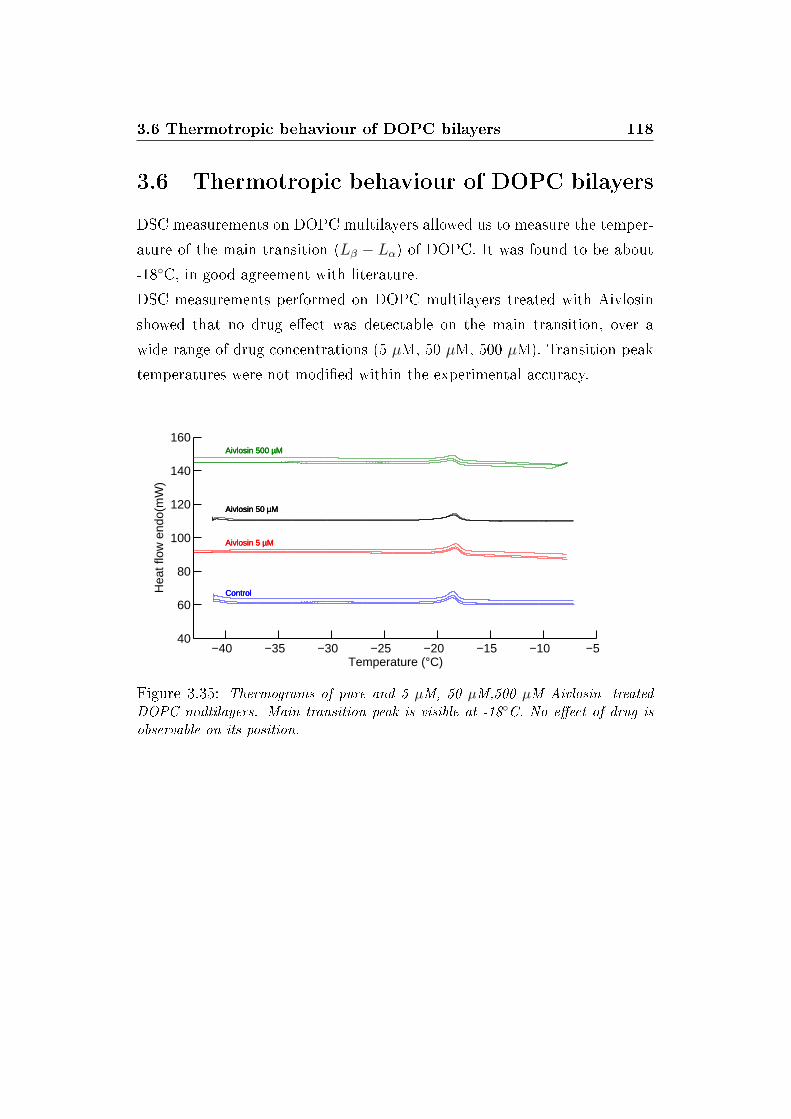
3.6 Thermotropic behaviour of DOPC bilayers 118
3.6 Thermotropic behaviour of DOPC bilayers
DSC measurements on DOPC multilayers allowed us to measure the temper-
ature of the main transition (Lβ − Lα) of DOPC. It was found to be about
-18◦C, in good agreement with literature.
DSC measurements performed on DOPC multilayers treated with Aivlosin
showed that no drug e�ect was detectable on the main transition, over a
wide range of drug concentrations (5 µM, 50 µM, 500 µM). Transition peak
temperatures were not modi�ed within the experimental accuracy.
−40 −35 −30 −25 −20 −15 −10 −540
60
80
100
120
140
160
ControlControlControl
Temperature (°C)
Hea
t flo
w e
ndo(
mW
)
Aivlosin 5 µMAivlosin 5 µMAivlosin 5 µM
Aivlosin 50 µMAivlosin 50 µMAivlosin 50 µM
Aivlosin 500 µMAivlosin 500 µMAivlosin 500 µM
Figure 3.35: Thermograms of pure and 5 µM, 50 µM,500 µM Aivlosin- treatedDOPC multilayers. Main transition peak is visible at -18◦C. No e�ect of drug isobservable on its position.

Chapter 4
Discussion
4.1 Morphological alterations of DOPC GUVs
Vesicles are very important in many di�erent areas of science and technol-
ogy. In basic research they serve as models for cell membranes and their
fusion, transport studies and investigations of membrane proteins that can
be reconstituted in vesicles (i.e. 'proteoliposomes'). They also serve as deliv-
ery vehicles for drugs, genetic material, enzymes and other (macro)molecules
into living cells and through other hydrophobic barriers in pharmacology,
medicine, genetic engineering, cosmetic industry and food industry [119].
They are also used as a support for semiconductor particles, in applications
such as the photoconversion of solar energy [120].
The major force holding membrane lipid molecules together are the London-
Van der Waals forces, which, in general, are attractive forces. These forces,
together with the con�gurational entropy of the hydrogen bond networks,
are involved along the acyl chains and are responsible for the organization of
phospholipids into various lyotropic structures. In addition to this global or-
ganization, lipid bilayers can be characterized by their dynamic equilibrium
thermal �uctuations including stretching and bending deformations.
Lipid:lipid interactions and mechanical properties of membranes, especially
bending rigidity, can be a�ected by incorporation of amphiphilic molecules,
4.1 Morphological alterations of DOPC GUVs 121
such as drug molecules, which perturbs the lipid packing. At low curvature,
as in the case of GUVs, stochastic �uctuations should enhance penetration of
exogenous molecules [121], making easy the study of the interaction between
these molecules and phospholipid membranes.
4.1.1 Micro�uidics
In previous work [69] addition of Azithromycin immediately triggered visible
GUVs �uctuations and the vesicle started budding (the mechanism that con-
trols the budding remains uncertain). In this work no budding was observed
after addition of drugs, probably because the microscopy experimental setup
did not allow to follow such fast vesicle dynamics.
To better understand the budding phenomenon and to test if it can be ob-
served using also di�erent drugs from Azithromycin, micro�uidic channels
were used. In particular, to monitor the instantaneous e�ect of mixing vesi-
cles with drug, Clarithromycin was used given its higher e�ect on phospho-
lipid membranes found in this work. Unfortunately, measurements of drug-
vesicle mixing e�ect by micro�uidics were performed unsuccessfully. Some
technical problems did not allow to obtain the required information about
the fast interactions between vesicle membrane and drug.
4.1.2 Antibiotics a�ect size distributions of GUVs
Vesicles not exposed to antibiotic showed spherical initial shape with sizes
ranging from few µm to tens of µm. This demonstrated the e�ciency of
electroformation method in preparing µm-sized vesicles.
After time intervals (few hours, one day, two days), largest GUVs disappeared
in samples treated with Azithromycin and Clarithromycin. It is likely that
4.1 Morphological alterations of DOPC GUVs 122
these drugs, added outside GUVs, are unable to cross the membrane bilayer,
thus preferentially insert into the outer membrane layer (at the phospholipid
acyl chain/polar headgroup interface) and a�ect the bilayer couple [122].
Let us suppose a vesicle at given area, A, given volume, V, and given area
di�erence between the two monolayers in the bilayer membrane area, ∆A.
In the presence of Azithromycin or Clarithromycin, the increase in the area
di�erence between the two lea�ets of the bilayer, ∆A, without change of V,
would lead to a rearrangement of the lipid molecules until destruction of the
vesicle. Since �uctuations of the largest vesicles should lead to considerable
movement of the membrane, a high proportion of foreign molecules should be
entrapped in the external monolayer and a�ect the equilibrium of the entire
bilayer, explaining the disappearance of the large vesicles [69].
The ine�ectiveness on numerical density of large GUVs found with Aivlosin
could be explained by a higher hydrophobicity of this antibiotic than Clar-
ithromycin and Azithromycin. This would induce a high solubility in the
hydrophobic region of phospholipid membrane: a relevant absorption could
take place deep inside the membrane, close to the bilayer centre. This could
not cause immediately a large area di�erence between the two lea�ets of the
vesicle bilayer, explaining the ine�ectiveness of this drug on the size distribu-
tions at relatively low concentrations (50 and 150 µM). Very high concentra-
tions of Aivlosin could induce instability of membranes, causing destruction
of vesicles and reduction of number of large vesicles.
4.1.3 Clusters
The formation of clusters, triggered by very high concentrations of Aivlosin,
could be explained by aggregates of separate vesicles or single vesicles which
have exploded into smaller vesicles.
One example of force which would draw vesicles together could be depletion
forces. The drug could cause very small (invisible nm-µm sized) vesicles to
4.1 Morphological alterations of DOPC GUVs 123
bud o� from larger vesicles, which then cause short range attraction by de-
pletion forces between the larger vesicles which form the aggregates (very
short range e�ect).
The vesicles could be exploding instead, and the large amounts of lipid
present in some collections could be accounted for by the explosion of multi-
lamellar vesicles.
Exploded vesicles in �gure 3.8 could indicate some kind of attraction to the
surface, which would be consistent with an attraction between vesicles lead-
ing to aggregates. On the other hand, the fact that these vesicles seem to
have exploded suggests that the aggregates formed by explosion also.
4.1.4 Loss of contrast: a possible variation of the mem-
brane permeability
When the untreated vesicles were sucked into a pipette and transferred to
a di�erent medium (glucose) in the observation chamber the stability of the
optical contrast (in phase contrast microscopy) proved that the vesicles re-
mained sealed after transfer.
A change of contrast is most likely caused by a variation of permeability of
the GUVs phospholipid membrane. The existence of permeability is very
interesting biologically, since breaching the bilayer would be dangerous to all
kinds of cells.
4.2 Antibiotics a�ect �ickering of GUVs 124
4.2 Antibiotics a�ect �ickering of GUVs
4.2.1 Triggering of thermal undulations
The absence of visible thermal undulations in untreated, just prepared vesi-
cles suggests a surface tension that is probably responsible for the sphericity
of the vesicles. As Angelova et al. [26], here the vesicles relaxed and �uctu-
ated after a few hours. Partial lipid degradation, as already noted by Faucon
and al. [110], may help to relax the vesicle tension.
The application of a small osmotic pressure appeared to be su�cient to
trigger large-scale surface undulations in untreated vesicles. Undulations in
vesicles containing 100 mM sucrose were typically triggered by an external
concentration of 125 mM glucose without complete modi�cation of the over-
all vesicle shape. The progressive evaporation of water in unsealed samples
achieved a similar result.
4.2.2 Bending modulus of control vesicles
Thermal �uctuations of GUVs constitute a useful tool to quantify the bending
elasticity of lipid bilayers. Fluctuation amplitudes being random variables,
the precision is directly related to the number of analysed contours. Determi-
nation of the bending modulus κ requires several hundreds (up to thousands)
vesicle contours to be digitized and analysed to obtain a signi�cant statistics
and a good accuracy.
The bending modulus κ of untreated DOPC GUVs was measured as 23.2 ±10.5 kBT, in excellent agreement with the literature [69] [109] [38]. It should
be taken into consideration that di�erences in the mode of preparation of
GUVs, in the temperature during the formation of GUVs, and in the compo-
sition of the bu�er can all induce strong discrepancies in the measured elastic
parameters. It is not clear whether the spreading of κ values within the same
4.2 Antibiotics a�ect �ickering of GUVs 125
sample resulted from the change in experimental methods or from di�erences
in bilayer composition. Natural lipids are variable and even one-component
lipids, mostly used as purchased, need not be completely pure. Additional
impurities may enter during sample preparation, in particular from glues and
other materials that seal the sample cell, or may appear gradually as a con-
sequence of chemical degradation.
4.2.3 Decrease of κ and formation of groups of κ-values
In several cases the measured κ values formed groups clearly distinguished.
The di�erences between the average κ values of adjacent groups were equal
to the lowest values of κ. Therefore each group corresponds to a vesicle com-
posed of a �xed number of bilayers. The lowest values can be attributed
to single bilayer vesicles. Interestingly, Aivlosin- and Azithromycin-treated
vesicles showed groups centred on values three times the fundamental κ, in-
dicating the presence of triple bilayers. Untreated vesicles showed no groups
further than the main one. In Clarithromycin-treated vesicles a short group
was visible centred on κ value six times the lowest: this group was statisti-
cally negligible, given its low population.
The bending modulus κ decreased by 30% in presence of Azithromycin (15.9
± 2.8 kBT), indicating that insertion of the antibiotic in the DOPC bilayer re-
duces the energy requirements for thermal �uctuations. This decrease could
be due to a modi�cation of the spontaneous curvature and/or to a higher
lateral di�usion of the constituents of the bilayer [38]. An even more ac-
centuated reduction of the bending modulus was observed in presence of
Clarithromycin, where κ was measured as 6.9 ± 3.2 kBT. This could be due
to a similar but more e�ective insertion of the Clarithromycin in the DOPC
bilayer.
Aivlosin reduced two times the bending modulus (12.5 ± 4.3 kBT and 14.8
± 4.2 kBT at 50 and 150 µM, respectively). The two concentrations induced
substantially the same reduction, indicating that at concentrations higher
4.3 E�ect of antibiotics on phospholipid monolayer rheology 126
than 50 µM saturation is reached and no further e�ects are observable on
vesicle membranes. The reduction of κ value could be again related to a
reduced energy requirement for thermal �uctuations, induced by insertion of
the antibiotic in the bilayer (even if in a deeper region than Azithromycin
and Clarithromycin).
The same reduction e�ect on the bending modulus seems to be induced by
insertion of antibiotics in the bilayer, regardless their exact position but more
depending on the speci�c characteristics of the antibiotic molecule.
4.3 E�ect of antibiotics on phospholipid mono-
layer rheology
4.3.1 Thermotropic phases of DPPCmonolayer and com-
pression modulus
Aivlosin and Clarithromycin did not a�ect the general phase bahaviour of
DPPC monolayer: coexistance between LE-LC phase, transition to LC phase
and solid (or untilted compressed) phase were all present in the Π-A isotherms
measured in this work.
All the antibiotics studied in this work, except Aivlosin, did not a�ect the
stability of the �lm outside the range of control sample (20-50 mN/m).
The increase of limit area in Clarithromycin-treated DPPC monolayer (from
49 A2/molecule of control to 55 A2/molecule) could be due to a kind of
interaction between drug and phospholipid molecules, with formation of
non-soluble drug-phospholipid complexes with higher area than phospho-
lipid alone. In this case, assuming an average diameter for the drug of 1 nm,
one can extrapolate a surface concentration of one drug molecule per 5-7
phospholipids units. This could be independently checked, e.g., by FT-IR
4.3 E�ect of antibiotics on phospholipid monolayer rheology 127
spectroscopy in ATR mode. The hypothesis of drug-phospholipid complexes
was corroborated by the e�ect of Clarithromycin on the compressibility mod-
ulus of the DPPC monolayer. The peak was shifted about 10% to higher
area/molecule, being this shift comparable with that of the limit area found
in the corresponding isotherm.
Only Aivlosin reduced the pressure of the �lm (15-30 mN/m). The stability
at lower pressures could be explained by some loss of sample due to formation
of water-soluble macromolecular complexes between the higly hydrophobic
Aivlosin and phospholipids. Thus, these complexes would seize part of phos-
pholipids from the air/water interface. If the hypothesis of soluble Aivlosin-
phospholipid complex was correct, it would indicate a higher hydrophobicity
of Aivlosin compared to Clarithromycin. In the latter, in fact, the interac-
tion between drug and phospholipid would not be strong enough to induce a
solubilization in water of phospholipids; di�erently, another mechanism of in-
teraction between Clarithromycin and phospholipids could exist. The limited
variation of limit area induced by Aivlosin (47 A2/molecule) in comparison
with control could be the result of the equilibration of two opposite phenom-
ena: the formation of macromolecular complexes described above would tend
to reduce the limit area of the �lm, while a partial intercalation of Aivlosin in
the monolayer would induce an increase of limit area. Finally, the increased
maximun value of compression modulus (about 400 mN/m) could be related
to a sti�ening of the monolayer, as con�rmed by the higher values of shear
moduli found for Aivlosin-treated monolayers (see �gure 3.28).
4.3.2 Rheology of pure DPPC monolayer
The reduction of the amplitude ratio is related to the compaction of the �lm
when Π increases.
In the low frequency regime, where a phase shift between stress and strain
about 90◦ was observable, the �lm behaved as a viscous system, regard-
4.3 E�ect of antibiotics on phospholipid monolayer rheology 128
less the surface pressure and, hence, its structure. High frequencies applied
stresses induced a faster response in the �lm, that is a lower phase shift.
The correlation rapidity of the two oscillations grew when the �lm become
more compressed. At high compressions the �lm was more elastic than an
expandend one: it ceased to behave as a viscous Newtonian �uid and became
a elastic system.
The variation of the elastic G' and viscous G" part of shear modulus ver-
sus angular frequency showed well the visco-elasticity of the Langmuir �lms
studied here. According to the frequency of the applied stress the monolayer
responded di�erently, indicating the existence of a high-frequency regime in
which the �lm behaves as a mainly elastic system, and a low-frequency regime
in which the �lm is a mainly viscous system. The transition from one regime
to the other is represented by the crossover between G' and G". Surface
pressure in�uences this property as shown by the reduction of the crossover
frequency; this is due to the rigidity of the �lm that increases with pressure:
more rigid �lms are likely to show an elastic response to a stress in a wider
frequency range than soft ones, shifting the onset of the viscous regime to
lower frequencies.
The Newtonian model �tted well to the experimental data at low frequen-
cies, com�rming that DPPC monolayer behaves as a Newtonian system in
this frequency range. The validity of the Newtonian model held for higher
frequency ranges at lowest surface pressures (0.5 - 5 rad/s at 25 mN/m),
where the elastic modulus a�ected less the viscous behaviour of the �lm. As
the surface pressure increased, the in�uence of G' on G" also increased and
the �t had to be performed on a shorter frequency range.
4.3.3 In�uence of antibiotics on the rheology of DPPC
monolayer
Rhelogical measurements of DPPC monolayer showed that its shear mod-
uli G' and G" undergo an increase of magnitude after exposition to Clar-
4.3 E�ect of antibiotics on phospholipid monolayer rheology 129
ithromycin 50 µM, indicating an increased compaction of the �lm. The mono-
layer treated with Clarithromycin showed Newtonian behaviour over almost
all the pressures analysed (except the highest pressure), at low frequencies.
Dynamic viscosities higher than control were obtained (5 mN/m increase
of surface pressure induced quadruplication of viscosity): this indicated a
very rapid loss of �uidity by the system with increase of surface pressure.
Crossover positions reported in table 3.6 showed a general lowering of the
onset frequency of the elastic regime: again, this could be related to a higher
rigidity of this system. Here it has been phenomenologically demonstrated
that it is possible to apply the time-pressure superposition to phospholipid
systems, such as Langmuir phospholipid monolayers: surface pressure of the
�lm played the role of temperature, giving appreciable results. Interesting
conclusions were drew by application of the Maxwell model to master curves:
although no variation of τ was found in comparison to control, G0 was de�-
nitely larger in the Clarithromycin-treated �lm. Moreover, �tting the curve a
versus Π with an activation law allowed us to calculate a A0 parameter much
higher (double) than control; if this parameter was associated to a confor-
mational area to be moved to modify the conformation of the �lm, this last
result would tie in with results from isotherms, indicating the formation of
non-soluble drug-phospholipid complexes, with size larger than phospholipid
alone. Being A0 and the limit area from isotherm di�erent, they could refer
to di�erent physical quantities.
Aivlosin 50 µM showed to have partially di�erent e�ects on the DPPC mono-
layer in comparison to Clarithromycin. Comparable magnitudes of shear
moduli G' and G" at high frequency (�gure 3.28) indicated that the Aivlosin-
treated monolayer is very visc-oelastic. At low frequency, the higher magni-
tudes of G' and G" in comparison to control showed a higher rigidity of the
�lm exposed to Aivlosin, with a mainly viscous behaviour. Viscosities calcu-
lated by Newtonian model were about 15 times higher than control (where
comparation was possible), indicating a very low �uidity of the Aivlosin-
treated monolayer. The accuracy of Maxwell model in describing this �lm
4.3 E�ect of antibiotics on phospholipid monolayer rheology 130
was not very high. Neverthless, a rough estimation of the parameters G0,
τ , and A0 was performed. This analysis indicated that the Aivlosin-treated
monolayer is described by a much higher characteristic relaxation time τ than
control: this could be related to the formation of macromolecular complexes
di�erently arranged, in such a way to induce their intercalation in the mono-
layer. The intercalation of these large complexes in the monolayer would
induce an increase of the rigidity of the monolayer. The value of A0 in this
case, slightly higher than control, could support the idea of a complex, even
if from τ one would expect a value of A0 much higher.
According to table 3.6 in the case of Azithromycin-treated DPPC monolayer,
at corresponding surface pressures the crossover between viscous and elastic
regime appeared at angular frequencies very similar to those of control DPPC
monolayer; this indicated that the visco-elastic behaviour of the DPPC mono-
layer is una�ected by interaction with Azithromycin. Analogously, according
to table 3.7, the dynamic viscosity was also comparable to that of control at
corresponding surface pressures. Moreover, after exposition to Azithromycin,
magnitudes of viscous and elastic shear moduli were found to be completely
similar to control over all the surface pressures analysed, both at low and high
angular frequency. Finally, both the Maxwell model and the horizontal shift
factors a from master curves showed that Azithromycin-treated monolayer
had characteristic values (G0, τ and A0) very close to those of control. Ac-
cording to the results presented above, Azithromycin showed to not in�uence
the rheology of Langmuir DPPC monolayers. In particular, the unmodi�ed
values of τ and A0 would indicate that no formation of drug-phospholipid
complexes takes place. On the basis of this conclusion, the Π-A isotherm of
DPPC monolayer treated with Azithromycin 35 µM should resemble that of
pure DPPC, without modi�cations of limit area in the LC phase.
Interestingly, it can be noted as only the pure DPPC monolayer was cor-
rectly described by the Maxwell model. All monolayers exposed to the drugs
showed a discrepancy with the model. This could be explained by the fact
that the control monolayer is homogeneous and it can be really described
4.3 E�ect of antibiotics on phospholipid monolayer rheology 131
by a Maxwell model with one single characteristic time. On the contrary,
the lack of adherence of experimental data to the model in the case of in-
teraction with antibiotics could be due to the formation of complexes: this
would reduce the homogeneity of the �lm, introducing more characteristic
times than in the simple Maxwell model. Thus, it is likely that a generalized
Maxwell model is suitable to describe such systems, containing two or several
characteristic relaxation times.
From the τ 's in table 3.8 a viscosity η can be obtained by considering that
η ∝ G”/ω → η ∝ G”τ . For each sample, this quantity appeared to be
roughly consistent with viscosity in table 3.7, obtained �tting experimental
data with Newtonian model. The two approaches show that Aivlosin induced
a high increase of viscosity of the phospholipid monolayer: this could be re-
lated to the drug-phospholipid complexes intercalated in the monolayer that
would increase both its rigidity and its viscosity.
4.3.4 Rheology of DOPC monolayer
As mentioned in section 1.4, DOPC at room temperature is well above its
main transition temperature (TC = −18◦C), unlike DPPC that is still below
its main transition (TC = +41◦C). As the experiments were performed at
room conditions, the �uidity of DOPC was very high. This made its signal
indistinguishable from that of water, within the experimental accuracy: the
measured behaviour of DOPC was that of a Newtonian �uid, with viscous
part of shear modulus proportional to the frequency over all the range ex-
perimentally analysed.
At room temperature DOPC is not a suitable system for ISR measurements,
in which �lms with high shear modulus are required. An identical signal
to that of water is obtained, with no information on the DOPC monolayer.
Instead, good ISR measurements were obtained with DPPC �lms.
4.4 Possible mechanism of antibiotic-phospholipid interaction
proposed 132
4.4 Possible mechanism of antibiotic-phospholipid
interaction proposed
A possible mechanism of interaction between the macrolide antibiotics stud-
ied and phospholipid model membranes is proposed in the last part of this
work.
Data in literature show that all three antibiotics studied here are charac-
terized by a hydrophobic behaviour. Hydrophobic interaction could be the
main interaction between antibiotics and phospholipids. However, despite
the common hydrophobic character, the antibiotics studied showed di�erent
e�ects on phospholipid model membranes.
Aivlosin was found to be more hydrophobic than other macrolides [56], even
if no previous work comparing the three antibiotics studied here. It is likely
Aivlosin inserts deep inside the phospholipid bilayer, due to its high hy-
drophobic interaction with phospholipids. Recalling the ADE model, this
would not induce an area di�erence between the inner and the outer lea�et
of the bilayer, avoiding rupture or instability of larger GUVs. The very hy-
drophobic character of Aivlosin could induce the formation of macromolec-
ular drug-phospholipid complexes, in interacting with phospholipid mono-
layers. These complexes could intercalate in the monolayer; successive sol-
ubilization in the bulk subphase could take place, as the formation of these
complexes at the air-water interface would be an out-of-equilibrium process.
In this case, phospholipids could arrange around the hydrophobic Aivlosin
molecule with hydrophobic tails inwards and hydrophilic heads outwards,
shielding the drug molecule from the water subphase and contemporarly
favouring the transferring of the complex in the bulk subphase. The e�ect of
Aivlosin-phospholipid complexes could be seizing part of the phospholipids
from the monolayer and, during the intercalation into the monolayer, increas-
ing its rigidity and viscosity.
Both Azithromycin and Clarithromycin could bind to the phospholipid bi-
layer, inserting into the outer membrane layer (at the phospholipid acyl
4.4 Possible mechanism of antibiotic-phospholipid interaction
proposed 133
chain/polar headgroup interface). Neverthless, their hydrophobic interac-
tion with phospholipid membrane would not be strong enough to allow
them to penetrate deeper in the bilayer. Data in literature show that Clar-
ithromycin has higher hydrophobic behaviour than its parent compound Ery-
thromycin [123]; as Azithromycin and Erythromycin are quite similar com-
pounds, it was suggested that Clarithromycin also has higher hydrophobicity
than Azithromycin. Due to its hydrophobicity, Clarithromycin-phospholipid
complexes would form: these complexes could be more strongly intercalated
into the monolayer, without subsequent solubilization in the bulk subphase.
Presumably, the lower hydrophobicity of Azithromycin avoids the formation
of drug-phospholipid complexes.
Chapter 5
Conclusions and outlook
5.1 Results obtained in this work
Object of this study is the interaction of macrolide antibiotics with phospho-
lipid model membranes. The properties investigated included the stability of
some of their aggregation forms (Giant Unilamellar Vesicles, GUV) and the
e�ects of the drugs on the mechanical moduli of the model membranes.
The techniques involved are video-image analysis for the GUVs and interfa-
cial shear rheometry for the Langmuir monolayers.
5.1.1 E�ect of Macrolide antibiotics on size distribu-
tions of GUVs
Azithromycin and Clarithromycin had analogous e�ect in reducing the frac-
tion of larger GUVs and therefore reducing also the average size. Notewor-
thy, this e�ect was found to be at saturation even at the lowest concentration
studied(50 µM). Thus, it could be useful to extend the present study to lower
concentration. No saturation e�ect was observed here with Clarithromycin,
where further reduction of mean size of GUVs took place at the highest con-
centration (150 µM).
Aivlosin did not induce any relevant e�ect on the fraction of GUVs at low
5.1 Results obtained in this work 135
concentrations (from 50 µM 400 µM). Extremely high concentrations (800
µM and 4 mM) induced several e�ects on GUVs (clusters, occacional explo-
sion and permeability variation).
5.1.2 Bending modulus of bilayers
Bending modulus κ of bilayer control vesicles was found to be in very good
agreement with literature [69]. Macrolide antibiotics reduced, in some extent,
this value, depending on the drug used: Clarithromycin showed the strongest
e�ect among the drug studied here, with analogous e�ect between Aivlosin
and Azithromycin. In some cases (Aivlosin and Azithromycin) a multimodal
distribution of κ was found: multiple values of κ would be related to multi-
lamellar vesicles, with the lowest κ referring to unilamellar vesicles.
5.1.3 Visco-elasticity of Langmuir phospholipid mono-
layers
Langmuir monolayers of DPPC showed a visco-elastic behaviour, very well
described by the Maxwell model over all the frequency range experimentally
analysed. This allowed us to plot master curves. Several properties of the
monolayer were studied: compressibility modulus, dynamic viscosity, viscous
G" and elastic G' shear moduli. The Newtonian model described adequately
the system at low frequencies (viscous regime). All the properties studied
were in very good agreement with literature.
5.1.4 Drug-phospholipid macromolecular complexes
Several results obtained in this work showed that macromolecular complexes
are likely to form by interaction of antibiotic molecules with phospholipids.
5.1 Results obtained in this work 136
The driving force leading to these complexes is likely to be the hydrophobic-
ity of the antibiotic: this would cause the formation of complexes that can
intercalate in the monolayer (Aivlosin and Clarithromycin). Several results
showed that Azithromycin does not a�ect the shear properties of the DPPC
monolayer, and, presumably, no drug-phospholipid complexes are formed
with this antibiotic.
Visco-elasticity of monolayer was preserved after interaction with antibiotics.
Nerverthless, discrepancies between data and the Maxwell model appeared
by interaction with Azithromycin, Clarithromycin, and Aivlosin (in increas-
ing e�ect order). To take into account the possible structural inhomogeneity
of the monolayer exposed to the drug, a more generalized model could be
used, characterized by a distribution of relaxation times τ and instantaneous
moduli G0.

Bibliography
[1] McConnell, H.M., Watts, T.H., Weis, R.M., Brian, A.A., Supported pla-
nar membranes in studies of cell-cell recognition in the immune system,
Biochim. Biophys. Acta 864 (1986) 95-106.
[2] Thompson, N.L., Palmer, A.G., Model cell membranes on planar sub-
strates, Comments Mol. Cell. Biophys. 5 (1988) 39-56.
[3] Sackmann, E., Supported membranes: scienti�c and practical applica-
tions,Science 271 (1996) 43-48.
[4] Seydel, J.K., Wiese, M. (Eds.), Drug-Membrane Interactions, Wiley-
VCH, Weinheim, 2002.
[5] Seydel J.K., Coats E.A., Cordes H.P., Wiese M., Drug membrane inter-
action and the importance for drug transport, distribution, accumula-
tion, e�cacy and resistance, Arch. Pharm. 327 (1994) 601610.
[6] Helfrich, W., Elastic properties of lipid bilayers: theory and possible
experiments, Z Naturforsch C 28 (1973) 693-703.
[7] Helfrich, W., and Servuss R. M., Undulations, steric interaction and
cohesion of fuid membranes, Nuovo Cimento D 3 (1984) 137-151.
[8] Yoon, Y.Z., Hale, J.P., Petrov, P.G., and Cicuta, P., Mechanical prop-
erties of ternary lipid membranes near a liquidliquid phase separation
boundary, J. Phys.: Condens. Matter 22 (2010) 062-101.
BIBLIOGRAPHY 139
[9] Pecreaux J., Dobereiner H. G., Prost J., Joanny J. F. and Bassereau P.,
Re�ned contour analysis of giant unilamellar vesicles, Eur. Phys. J. E
13 (2004) 27790.
[10] Betz, T., Lenz, M., Joanny, J-F. and Sykes, C., Atp-dependent mechan-
ics of red blood cells, Proc. Natl. Acad. Sci., 106 (2009) 15312-15317.
[11] Voet, D., Voet, J.G., Biochemistry, Wiley, 1995.
[12] University of Florida Agricultural and Biological Engineering, Web site
of David P. Chynoweth MSPH, Ph.D.
[13] Avanti Polar Lipids website.
[14] Berg, J.M., Tymoczko, J.L., Stryer, L., Biochemistry, W. H. Freeman
and Co., New York (U.S.A.), 2002.
[15] Zachowski, A., Devaux, P.F., Transmembrane movements of lipids, Ex-
perientia, 46 (1990) 644656.
[16] http://www.colorado.edu/intphys/Class/IPHY3730/image/membrane.jpg.
[17] Cullis, P.R., Hope, M.J., Tilcock, C.P.S., Lipid Polymorphism and the
Roles of Lipids in Membranes, Chemistry and Physics of Lipids, 40
(1986) 127-144.
[18] de Gennes, P.G. (1974) The Physics of Liquid Crystals, Oxford Univer-
sity Press, Oxford.
[19] Luzzati, V., Biological Membranes (Chapman, D., ed.), vol. 1, pp. 71-
123, (1968) Academic Press, London.
[20] Lewis, B.A., Engelman, D.M., Lipid Bilayer Thickness Varies Linearly
with Acyl Chain Length in Fluid Phosphatidylcholine Vesicles, J. Mol.
Biol., 166 (1983) 211-217.
[21] Bangham, A.D., Home, R. W., J. Mol. Biol. 8, (1964) 660-668.
BIBLIOGRAPHY 140
[22] Papahadjopoulos, D. (ed.), Ann. N.Y. Acad. Sci. 308, (1978) 1-412.
[23] Reusch, W., Virtual Textbook of Organic Chemistry, Michigan State
university, 1999.
[24] Angelova, M.I., Dimitrov, D.S., Liposome electroformation, Faraday
Discuss. Chem. Soc., 81 (1986) 303311.
[25] Needham, D., Evans, E., Structure and mechanical properties of giant
lipid (dmpc) vesicles bilayers from 20c below to 10c above the liquid
crystalcrystalline phase transition at 24c, Biochemistry, 27 (1988) 8261-
8269.
[26] Angelova, M.I., Soleau, S., Meleard, Ph., Faucon, J.F., Bothorel, P.,
Preparation of giant vesicles by external ac electric �elds. Kinetics and
applications. Progr. Colloid Polym. Sci., 89 (1992) 127-131.
[27] Montes, L.R., Alonso, A., Goni, F.M., Bagatolli, L.A., Giant unilamellar
vesicles electroformed from native membranes and organic lipid mixtures
under physiological conditions, Biophys. J., 93 (2007) 35483554.
[28] Hub, H.H., Zimmermann, U., Ringsdorf, H., Preparation of large unil-
amellar vesicles, FEBS Lett., 140 (1982) 254256.
[29] Baumgart, T., Hammond, A.T., Sengupta, P., Hess, S.T., Holowka,
D.A., Baird, B.A., Proc. Natl. Acad. Sci. U.S.A., 104 (2007) 31653170.
[30] Holowka, D., Baird, B., Structural studies on the membrane-bound im-
munoglobulin E-receptor complex. 1. Characterization of large plasma
membrane vesicles from rat basophilic leukemia cells and insertion of
amphipathic �uorescent probes, Biochemistry, 22 (1983) 34663474.
[31] Shimanouchi, T., Umakoshi, H., Kuboi, R., In Giant Vesicles, Walde,
P., Luisi, P. L., Eds., John Wiley Sons: New York, 2000; pp 369-377.
[32] Kuroiwa, T., Nakajima, M., Sato, S, Mukataka, S., Ichikawa, S., Maku
(Membrane) 32 (2007) 229233.
BIBLIOGRAPHY 141
[33] University of Texas, Houston Medicine website,
http://www.uth.tmc.edu/med/comm/alumniMag/2007-
Fall/articles/cover-00e-heart.html.
[34] V.I. Troitsky, Methods of deposition of molecular organized thin �lms.
[35] Ma, G., Allen, H.C., DPPC Langmuir Monolayer at the Air-Water Inter-
face: Probing the Tail and Head Groups by Vibrational Sum Frequency
Generation Spectroscopy, Langmuir, 22 (2006) 5341-5349.
[36] Kaganer, V.M., Structure and phase transitions in Langmuir monolay-
ers, Reviews of Modern Physics, Vol. 71, No. 3, 1999.
[37] KSV INSTRUMENTS LTD, Application note, Langmuir and Langmuir-
Blodgett Films: WHAT and HOW ?
[38] Rawicz W, Olbrich KC, McIntosh T, Needham D, Evans E., E�ect of
chain length and unsaturation on elasticity of lipid bilayers, Biophys. J.,
79 (2000) 32839.
[39] Berg, H.C., Random walks in biology (Extended Paperback ed.). Prince-
ton, N.J: Princeton University Press (1993).
[40] Tenchov, B., Koynova, R., Rapp, G., New Ordered Metastable Phases
between the Gel and Subgel Phases in Hydrated Phospholipids, Bioph.
J., 80 (2001) 18731890
[41] Janiak, M.J., Small, D.M., Shipley, G.G., Nature of the thermal pretran-
sition of synthetic phospholipids: dimyristoyl- and dipalmitoyllecithin,
Biochemistry, 15 (1976) 45754580.
[42] H.W. Meyer et al., Hydration of DMPC and DPPC at 4◦C produces
a novel subgel phase with convexconcave bilayer curvatures, Chemistry
and Physics of Lipids, 105 (2000) 149166.
[43] Laggner, P., Nonequilibrium phenomena in lipid membrane phase tran-
sitions, Colloque C1 (supplement au Journal de Physique 11), 3 (1993).
BIBLIOGRAPHY 142
[44] Leonenko,Z.V., Finot, E., Ma, H., Dahms, T.E.S., Cramb, D.T., In-
vestigation of Temperature-Induced Phase Transitions in DOPC and
DPPC Phospholipid Bilayers Using Temperature-Controlled Scanning
Force Microscopy, Bioph. J., 86 (2004) 37833793.
[45] Dr. Silvius, J.R., Thermotropic Phase Transitions of Pure Lipids in
Model Membranes and Their Modi�cations by Membrane Proteins,
Lipid-Protein Interactions, John Wiley Sons, Inc., New York, 1982.
[46] Dobereiner, H.G., Evans, E., Kraus, M., Seifert, U., Wortis, M., Map-
ping vesicle shapes into the phase diagram: A comparison of experiment
and theory, Phys. Rev. E 55 (1997) 4458-4474.
[47] Jorgensen, K., Ipsen, J. H., Mouritsen, O. G., Zuckermann, M. J., The
e�ect of anaesthetics on the dynamic heterogeneity of lipid membranes.
Chem. Phys. Lipids 65 (1993) 205216.
[48] Jorgensen, K., Ipsen, J. H., Mouritsen, O. G., Bennett, D., Zuckermann,
M. J., The e�ects of density �uctuations on the partitioning of foreign
molecules into lipid bilayers: application to anaesthetics and insecti-
cides, Biochim. Biophys. Acta, 1067 (1991) 241253.
[49] Wenz, J. J., Barrantes, F. J.. Steroid structural requirements for stabi-
lizing or disrupting lipid domains. Biochemistry 42 (2003) 1426714276.
[50] Agasosler, A.V., Tungodden, L.M., Cejka, D.,Bakstad, E., Sydnes,
L.K., Holmsen H., Chlorpromazine-induced increase in dipalmitoylphos-
phatidylserine surface area in monolayers at room temperature.
Biochem. Pharmacol. 61 (2001) 817-825.
[51] Saint-Laurent, A., Boudreau, N., Lariviere, D., Legault, J., Gaudreault,
R.C., Auger, M., Membrane interactions of a new class of anticancer
agents derived from arylchloroethylurea: a FTIR spectroscopic study.
Chem. Phys. Lipids 111 (2001) 163 175.
BIBLIOGRAPHY 143
[52] Mingeot-Leclercq, M.P., Tulkens, P.M., Aminoglycosides: nephrotoxic-
ity. Antimicrob. Agents Chemother. 43 (1999) 1003-1012
[53] A. Schanck, M. P. Mingeot-Leclercq, P. M. Tulkens, D. Carrier, I. C.
Smith, and H. C. Jarrell. Interactions of aminoglycoside antibiotics with
phospholipids. A deuterium nuclear magnetic resonance study. Chem.
Phys. Lipids 62 (1992) 153163.
[54] D. Tyteca, A. Schanck, Y. F. Dufrene, M. Deleu, P. J. Courtoy, P.
M. Tulkens, and M. P. Mingeot-Leclercq. The macrolide antibiotic
azithromycin interacts with lipids and a�ects membrane organization
and �uidity: studies on Langmuir-Blodgett monolayers, liposomes and
J774 macrophages. J. Membr. Biol. 192 (2003) 203215.
[55] G. Kaiser, Protein synthesis inhibitors: macrolides mechanism of action
animation. Classi�cation of agents, The Community College of Balti-
more County, Retrieved on July 31, 2009.
[56] Stuart, A.D., Brown, T.D.K., Imrie, G., Tasker, J.B., Mockett, A.P.A.,
Intra-cellular accumulation and trans-epithelial transport of aivlosin, ty-
losin and tilmicosin, The Pig Journal, 60 (2007) 2635.
[57] Eco Animal Health website, http://www.ecoanimalhealth.com/.
[58] Personal communication, Dr David Brown, Dept of Viriology, Cam-
bridge University.
[59] Pagine Sanitarie, Health care network web site
(http://www.paginesanitarie.com/euromedia/veterinari.nsf/
0e5ded19dfd64caa41256d2e003cc6cc/06cb52d7ea6c6ae8c125763400381d
8a?OpenDocument).
[60] http://www.rxlist.com/zithromax-drug.htm.
[61] U.S. Food and Drug Administration prescribing information.
BIBLIOGRAPHY 144
[62] http://en.wikipedia.org/wiki/Azithromycin.
[63] http://www.rxlist.com/biaxin-drug.htm.
[64] U.S. Food and Drug Administration prescribing information.
[65] http://en.wikipedia.org/wiki/Clarithromycin.
[66] Tyteca, D., Der Smissen, P., Van Bambeke, F., Leys, K., Tulkens, P.M.,
Courtoy, P.J., Mingeot-Leclercq, M.-P., Azithromycin, a lysosomotropic
antibiotic, impairs �uid-phase pinocytosis in cultured �broblasts, Eur.
J. Cell Bio., 80 (2001) 466 -478.
[67] Berquand, A., Fa, N., Dufrêne, Y.F., Mingeot-Leclercq, M.-P., Inter-
action of the Macrolide Antibiotic Azithromycin with Lipid Bilayers:
E�ect on Membrane Organization, Fluidity, and Permeability, Pharm.
Res., Vol. 22, No. 3, 2005.
[68] Tyteca, D., Schanck, A., Dufrene, Y.F., Deleu, M., Courtoy, P.J.,
Tulkens, P.M., Mingeot-Leclercq, M.P., The Macrolide Antibiotic
Azithromycin Interacts with Lipids and A�ects Membrane Organization
and Fluidity: Studies on Langmuir-Blodgett Monolayers, Liposomes and
J774 Macrophages, J. Membrane Biol. 192 (2003) 203-215.
[69] Fa, N., Lins, L., Courtoy, P.J., Dufrêne, Y., Van Der Smissen,
P., Brasseur, R., Tyteca, D., Mingeot-Leclercq, M.-P., Decrease of
elastic moduli of DOPC bilayers induced by a macrolide antibiotic,
azithromycin, Bioch. et Bioph. Acta, 1768 (2007) 18301838.
[70] Fa, N., Ronkart, S., Schanck, A., Deleu, M., Gaigneaux, A.,
Goormaghtigh, E., Mingeot-Leclercq, M.-P., E�ect of the antibiotic
azithromycin on thermotropic behavior of DOPC or DPPC bilayers,
Chem. and Phys. of Lip., 144 (2006) 108116.
[71] Brochard, F., and Lennon, J. F., Frequency spectrum of the �icker phe-
nomenon in erythrocytes, J. Physique, 36 (1975) 1035-1047.
BIBLIOGRAPHY 145
[72] Bao, G., Suresh, S., Cell and molecular mechanics of biological materials,
Nat Mater 2 (2003) 715725.
[73] Park, Y.K., Best, C.A., Badizadegan, K., Dasari, R.R., Feld, M.S.,
Kuriabova, T., Henle, M.L., Levine, A.J., Popescu, G., Measurement
of red blood cell mechanics during morphological changes, PNAS 107,
15 (2010) 6731-6736.
[74] Popescu, G., Ikeda, T., Goda, K., Best-Popescu, C.A., Laposata, M.,
Manley, S., Dasari, R.R., Badizadegan, K., Feld, M.S., Optical Mea-
surement of Cell Membrane Tension, PRL 97, 218101 (2006).
[75] Helfrich, W., Z. Naturforsch. 30c (1975) 841.
[76] Brochard, F., De Gennes, P. G., and Pfeuty, P., J. Physique 37 (1976)
1099.
[77] Zilker, A., Engelhardt, H. and Sackmann, E., Dynamic re�ection in-
terference contrast (RIC-) microscopy a new method to study surface
excitations of cells and to measure membrane bending elasticmoduli, J.
Phys. (Fr.). 48 (1987) 21392151.
[78] Evans, E.A., Structure and deformation properties of red blood cells:
concepts and quantitative methods, Methods Enzymol., 173 (1989) 335.
[79] Hènon, S., Lenormand, G., Richert, A., and F. Gallet, A new determi-
nation of the shear modulus of the human erythrocyte membrane using
optical tweezers, Biophys. J., 76 (1999) 11451151.
[80] Lee, W. G., Bang, H., Lee, J., Yun, H., Han, D. C., Combined
microchannel-type erythrocyte deformability test with optical tweezers.
I. Basic principles. J. Kor. Phys. Soc. 50 (2007) 1163.
[81] Zilker, A., Ziegler, M. and Sackmann E., Spectral analysis of erythrocyte
�ickering in the 0.34 mm1 regime by microinterferometry combined with
fast image processing, Phys. Rev. A, 46 (1992) 79988001.
BIBLIOGRAPHY 146
[82] Evans, J., Gratzer, W., Mohandas, N., Parker, K., and Sleep, J., Fluctu-
ations of the red blood cell membrane: relation to mechanical properties
and lack of ATP dependence, Biophys. J., 94 (2008) 41344144.
[83] Bo, L., Waugh, R.E., Determination of bilayer membrane bending sti�-
ness by tether formation from giant, thin-walled vesicles, Biophys. J.,
55 (1989) 509-517.
[84] Kummrow, M., Helfrich, W., Phys. Rev. A, Deformation of giant lipid
vesicles by electric �elds, 44 (1991) 8356.
[85] Farago, O., Pincus, P., Statistical mechanics of bilayer membrane with
a �xed projected area, Cond. Mat. Stat. Mech., (2008).
[86] Deserno, M., Notes on Di�erential Geometry, (2004) p.35,
http://www.cmu.edu/biolphys/deserno/Deserno_science.html.
[87] Milner, S.T., Safran, S.A., Dynamical �uctuations of droplets mi-
croemulsions and vesicles, Phys. Rew. A, 36 (1987) 4371-4379.
[88] Riley, K.F., Hobson, M.P. and Bence, S.J., Mathematical Methods
for Physics and Engineering, Cambridge University Press, Cambridge
(U.K.), 2nd edition, 2004.
[89] Seifert, U., Con�gurations of �uid membranes and vesicles, Adv. Phys.
46 (1997) 13137.
[90] Peterson, M.A., Shape dynamics of nearly spherical membrane bounded
�uid cells, Mol. Cryst. Liq. Cryst., 127 (1985) 257.
[91] Yoon, Y.Z., Hong, H., Brown, A., Kim, D.C., Kang, D.J., Lew, V.L.,
Cicuta, P., Flickering Analysis of Erythrocyte Mechanical Properties:
Dependence on Oxygenation Level, Cell Shape, and Hydration Level,
Bioph. J., 97 (2009) 1606-1615.
BIBLIOGRAPHY 147
[92] Brooks, C.F., Fuller, G.G., Frank, C.W., Robertson, C.R., An Interfacial
Stress Rheometer To Study Rheological Transitions in Monolayers at the
Air-Water Interface, Langmuir, 15 (1999) 2450-2459.
[93] Orsi, D., Cristofolini, L., Fontana, M.P., Equilibrium and out-of-
equilibrium dynamics in a molecular layer of azopolymer �oating on
water studied by Interfacial Shear Rheology, Journal of Non-Crystalline
Solids, article in press.
[94] Reynaert, S., Brooks, C.F., Moldenaers, P., Vermant, J., Fuller, G.G.,
Analysis of the magnetic rod interfacial stress rheometer, Journal of
Rheology, 52 (2008) 261-285.
[95] Larson, R.G., The structure and rheology of complex �uids, Oxford
University Press, New York, 1999.
[96] Ferry, J.D., Viscoelastic properties of polymers, 3rd ed., Wiley, New
York.
[97] Nakagawa, Y., Itai, S., Yoshida, T., Nagai, T., Physicochemical prop-
erties and stability in the acidic solution of a new macrolide antibiotic,
Clarithromycin, in comparison with Erythromycin, Chem. Pharm. Bull,
40 (1992) 725-728.
[98] Berndl, K., Kas, J., Lipowsky, R., Sackmann, E., Seifert, U., Shape
Transformations of Giant Vesicles: Extreme Sensitivity to Bilayer Asym-
metry, Europhys. Lett., 13 (1990) 659-664.
[99] Miao, L., Seifert, U., Wortis, M., Dobereiner, H.-G., Budding transitions
of �uid-bilayer vesicles: The e�ect of area-di�erence elasticity, Phys.
Rev. E 49 (1994) 5389, which contains additional references.
[100] Mathivet, L., Cribier, S., Devaux, P.F., Shape Change and Physical
Properties of Giant Phospholipid Vesicles Prepared in the Presence of
an AC Electric Field, Biophys. J. 70 (1996) 1112-1121.
BIBLIOGRAPHY 148
[101] Angelova, M.I., Soléau, S., Méléard, Ph., Faucon, F., Bothorel, P.,
Progress in Colloid and Polymer Science, 89 (1992) 127-131.
[102] Shimanouchi, T., Umakoshi, H., Kuboi, R., Kinetic Study on Giant
Vesicle Formation with Electroformation Method, Langmuir Letter, 25
(2009) 4835-4840.
[103] Borochov, N., Wachtel, E.J., Bach, D., Phase behavior of mixtures of
cholesterol and saturated phosphatidylglycerols, Chemistry and Physics
of Lipids 76 (1995) 85-92.
[104] Videira, R.A., Antunes-Madeira, M.C., Madeira, V.M., Biophysical
perturbations induced by ethylazinphos in lipid membranes, Chem.
Phys. Lipids 97 (1999) 139153.
[105] Whitesides, G.M., The origins and the future of micro�uidics, Nature,
442 (2006) 368-373.
[106] Helfrich, W., Size distributions of vesicles: the role of the e�ective
rigidity of membranes, J. Physique, 47 (1986) 321-329.
[107] Marsh, D., Handbook of Lipid Bilayers, CRC Press, Boca Raton,
Florida, USA, 1990.
[108] Duwe, H.P., Sackmann, E., Bending elasticity and Thermal excitations
of lipid bilayer vesicles: modulation by solutes, Physica A, 163 (1990)
410-428.
[109] Niggemann, G., Kummrow, M., Helfrich, W., The Bending Rigidity of
Phosphatidylcholine Bilayers: Dependences on Experimental Method,
Sample Cell Sealing and Temperature, J. Phys. II France, 5 (1995) 413-
425.
[110] Faucon, J.F., Mitov, M.D., Méléard, P., Bivas, I., Bothorel, P., Bending
elasticity and thermal �uctuations of lipid membranes. Theoretical and
experimental requirements, J. Phys. France, 50 (1989) 2389-2414.
BIBLIOGRAPHY 149
[111] Schneider, M.B., Jenkins, J.T., Webb, W. W., Thermal �uctuations of
large quasi-spherical bimolecular phospholipid vesicles, J. Physique, 45
(1984) 1457-1472.
[112] Engelhardt, H., Duwe, H.P., Sackmann, E., Bilayer bending elasticity
measured by Fourier analysis of thermally excited surface undulations
of �accid vesicles, J. Physique Lett., 46 (1985) L-395 - L-400.
[113] Adam, N.K., Proc. R. Soc. London, Ser. A 101, 516, 1922.
[114] Matyszewska, D., Bilewicz, R., DPPC monolayers as simple models
of biological membranes for studies of interactions with per�uorinated
compounds, Annales UMCS, Chemistry, vol. 63, Jan. 2008, pp. 201-210.
[115] Wustneck, R., Wustneck, N., Moser, B., Karageorgieva, V., Pison,
U., Surface Dilatational Behavior of Pulmonary Surfactant Components
Spread on the Surface of a Pendant Drop. 1. Dipalmitoyl Phosphatidyl-
choline and Surfactant Protein C, Langmuir, vol. 18, Feb. 2002, pp.
1119-1124.
[116] Kragel, J., Li, J.B., Miller, R., Bree, M., Kretzschmar, G., Mohwald,
H., Surface viscoelasticity of phospholipid monolayers at the air/water
interface, Colloid Polym. Sci., 274 (1996) 1183-1187.
[117] Ding, J., Warriner, H.E., Zasadzinski, J.A., Schwartz, D.K., Magnetic
needle viscometer for Langmuir monolayers, Langmuir, 18 (2002) 2800-
2806.
[118] Lucero Caro, A., Rodriguez Nino, M., Rodriguez Patino, J., The ef-
fect of pH on surface dilatational and shear properties of phospholipid
monolayers, Colloids and Surfaces A: Physicochemical and Engineering
Aspects, 327 (2008) 79-89.
[119] Gregoriadis, G.,(1984) Liposome Technology, CRC Press, Boca Raton,
FL.
BIBLIOGRAPHY 150
[120] Zhago, X.K., Baral, S., Rolandi, R., Fendler, J.H., J. Am. Chem. Soc.,
110 (1988) 1012-1024.
[121] Lentz, B.R., McIntyre, G.F., Parks, D.J., Yates, J.C., Massenburg,
D., Bilayer curvature and certain amphipaths promote poly(ethylene
glycol)-induced fusion of dipalmitoylphosphatidylcholine unilamellar
vesicles, Biochemistry, 31 (1992) 26432653.
[122] Svetina, S., Zeks, B., Membrane bending energy and shape determina-
tion of phospholipid vesicles and red blood cells, Eur. Biophys. J., 17
(1989) 101111.
[123] Goldman, R.C., Zakula, D., Flamm, R., Beyer, J., Capobianco, J.,
Tight Binding of Clarithromycin, Its 14-(R)-Hydroxy Metabolite, and
Erythromycin to Helicobacter pylori Ribosomes, ANTIMICROBIAL
AGENTS AND CHEMOTHERAPY, Vol. 38, No. 7, 1994, 1496-1500.
Acknowledgements
I would like to thank Prof. Luigi Cristofolini and Dr. Pietro Cicuta. This
work was made possible thanks to their e�orts, and they allowed me to live
an extraordinary professional and personal experience, such as the period
spent in Cambridge.
A hearty thank also to Aidan Brown, who have shared his work and ideas
with me over all the duration of my work, making a decisive contribution to
the success of this work.
Thanks also to Davide Orsi for his professional and human support during
the experiments performed in Parma.
A special thank to Dr. David T.K. Brown for his scienti�c support regarding
biological and pharmacological aspects of this work.
Thanks to all the members of the BSS group for the help received during the
weekly group meetings and throughout my working days at the Cavendish
Laboratory. Particular thank to Debjani Paul, for her kindness and helpful-
ness in preparing the micro�uidics devices used in this work.
Finally, I would like to thank my family for the support received during all
my university career. In every moment they believed in my abilities, helping
me to overcome the di�cult moments and sharing the joy for every small
goal achieved.