Embed Size (px)
Citation preview

UNIVERSITI PUTRA MALAYSIA
THE BUSINESS CYCLE SYNCHRONISATION IN EAST ASIA
LEE HOOI YEAN
FEP 2007 19

THE BUSINESS CYCLE SYNCHRONISATION IN EAST ASIA
By
LEE HOOI YEAN
Thesis Submitted to the School of Graduate Studies, Universiti Putra Malaysia, in Fulfilment of the Requirements for the Degree of Doctor of Philosophy
October 2007

Dedication
To the loving memory of my father
To my mother, for her love and undying dedication
To my husband, for his support and patience
To my son and daughter, who make life fun and meaningful
ii

Abstract of thesis presented to the Senate of Universiti Putra Malaysia in fulfilment of the requirement for the degree of Doctor of Philosophy
THE BUSINESS CYCLE SYNCHRONISATION IN EAST ASIA
By
LEE HOOI YEAN
October 2007
Chairman : Professor Azali bin Mohamed, PhD Faculty : Economics and Management
This study examines the business cycle synchronisation in East Asia as satisfying one of
the preconditions for forming an Optimum Currency Area (OCA). We extend the
existing literature by improving the methodology of assessing the business cycle
synchronisation in evaluating the suitability of a common currency area for East Asia
employing the Bayesian State-Space Based model. This model allows us to decompose
aggregate shocks into country-specific, regional and world common business cycles.
The importance of studying all three different shocks in one model is that studying a
subset of countries can lead one to believe that observed co-movement is particular to
that subset of countries when it in fact is common to a much larger group of countries.
Understanding the sources of international economic fluctuations is important for
making policy decisions. For example, if a country exhibits a large value of the share
accounted by the region common factor, then its business cycle movement is largely
synchronised to the region, indicating that a regional common monetary policy is more
effective to respond to the disturbances. As a benchmark of comparison, the business
cycle synchronisation in the European Union (EU) and the North American countries
iii

iv
are also examined. The empirical results suggest that the cost of renouncing individual
currencies to advance into a currency union in East Asia could be significant as the
output variation explained by country-specific factors is significant. It is worth noting
that while we do not find evidence of an East Asian cycle, no evidence of an EU cycle
is found either. This study also examines the endogeneity of OCA criteria. Theoretically,
the effect of increased trade integration (after the elimination of exchange fluctuations
among the countries in the region) on the business cycle synchronisation is ambiguous.
We assess the dynamic relationships between trade, finance, specialisation and business
cycle synchronisation for East Asia using the Generalised Method of Moments (GMM)
approach. The dynamic panel approach improves on previous efforts to examine the
business cycle synchronisation – trade link using panel procedures, which control for
the potential endogeneity of all explanatory variables. The overall effect of trade on
business cycles synchronisation is found to be positive, implying that increased trade
leads to more synchronised business cycles. As such, policy makers may have little to
worry about the region being unsynchronised in their business cycles as the business
cycles will become more synchronised after the monetary union is formed.

Abstrak tesis yang dikemukakan kepada Senat Universiti Putra Malaysia sebagai memenuhi keperluan untuk ijazah Doktor Falsafah
PENYELARASAN KITARAN PERNIAGAAN DI ASIA TIMUR
Oleh
LEE HOOI YEAN
October 2007 Pengerusi : Profesor Azali bin Mohamed, PhD Fakulti : Ekonomi dan Pengurusan Kajian ini meneliti penyelarasan kitaran perniagaan di Asia Timur sebagai memenuhi
salah satu daripada prasyarat bagi pembentukan Kawasan Mata Wang Optimum
(Optimum Currency Area). Kami menambah maklumat yang ada dengan memperbaiki
kaedah menaksir bagi penyelarasan kitaran perniagaan untuk menilai kesesuaian
kawasan mata wang bersama bagi Asia Timur dengan menggunakan Bayesian State-
Space Based model. Model ini membolehkan kita menyelerai kejutan agregat ke kejutan
tertentu di peringkat negara, kawasan dan global. Penelitian terhadap kumpulan negara
pengganti dapat mendorong sesebuah negara untuk menerima bahawa pergerakan
bersama yang dikaji adalah khusus untuk negara pengganti, yang sebenarnya sama
berbanding dengan kumpulan negara yang lebih besar. Oleh itu, ia adalah penting untuk
mengaji kesemua kejutan tersebut dalam satu model. Kefahaman sumber perubahan
ekonomi antarabangsa adalah penting untuk membuat keputusan dasar. Contohnya,
jikalau variasi output sesebuah negara adalah dipengaruhi oleh kejutan di kawasan Asia
Timur, dasar monetari di peringkat kawasan Asia Timur akan lebih berkesan untuk
mengatasi masalah makroekonomi. Sebagai penanda aras perbandingan, penyelarasan
ii
kitaran perniagaan dalam Kesatuan Eropah (EU) dan Negara-negara Amerika Utara
juga diteliti. Hasil empirik menunjukkan bahawa kos pelepasan mata wang individu
yang dijadikan pendahuluan dalam kesatuan mata wang mungkin besar kerana majoriti
variasi output di Asia Timur adalah dipengaruhi oleh faktor tertentu negara. Walaupun
Asia Timur tidak memenuhi criteria OCA, ia perlu diingati bahawa EU juga tidak
memenuhi criteria tersebut. Kajian ini juga meneliti endogeniti kriteria OCA. Secara
teorinya, kesan integrasi perdagangan yang meningkat (selepas penyingkiran perubahan
mata wang di kalangan negara-negara serantau) terhadap penyelarasan kitaran
perniagaan, adalah tidak jelas. Kajian ini menaksir hubungan dinamik antara
perdagangan, kewangan, dan pengkhususan dengan penyelarasan kitaran perniagaan
bagi Asia Timur, menggunakan pendekatan Kaedah Momen Teram (Generalised
Method of Moments). Pendekatan panel dinamik memperbaiki usaha terdahulu untuk
meneliti penyelarasan kitaran perniagaan – hubungan perdagangan dengan
menggunakan prosedur panel yang mengawal kemungkinan endogeniti bagi semua
perubahan keterangan. Hasil kajian menunjukkan bahawa peningkatan perdagangan di
Asia Timur akan menambahkan penyelarasan kitaran perniagaan. Ini menandakan
bahawa perdagangan yang meningkat mendorong ke arah lebih kitaran perniagaan
terselaras, pembuat dasar tidak perlu bimbang tentang kawasan yang tidak selaras dalam
kitaran perniagaan mereka kerana kitaran perniagaan akan menjadi lebih selaras selepas
kesatuan kewangan ditubuhkan.

ACKNOWLEDGEMENTS
The completion of this research has involved an enormous amount of contribution from
many people. Juggling work, family and study makes completing this Ph.D thesis an
even more challenging task. First and foremost, my heartily profound gratitude and
appreciation are addressed to my chief supervisor, Professor Dr. Azali bin Mohamed for
his continued guidance, motivation, support, and encouragement, and for his ability to
remain positive and energetic throughout the ups and downs of research. It is with
appreciation that I acknowledge the members of my supervisory committee, Professor
Dr. Ahmad Zubaidi Baharumshah and Professor Dr. Fatimah Mohd Arshad for their
guidance at various stages of the research process which has remarkably improved the
quality of the work. My gratitude also goes to Professor Dr. Muzafar Shah Habibullah
and Professor Dr. Zulkornain Yusop for their valuable comments and suggestions
during the proposal presentation of this research.
I am indebted to my employer (2000-2008), HELP University College for the steadfast
encouragement and generous financial support these many years. I would like to take
this opportunity to acknowledge several colleagues, coursemates and friends who
encouraged and motivated me at different stages of the study. I would like to thank Dr.
Lee Chin for providing me valuable advises and tips that helped me a lot in staying on
the right track. I am grateful to Lilian Chan and Michelle Phang, who were my constant
intellectual companions on this PhD journey. We started the PhD journey together. We
supported and encouraged each other.

ii
Last, but not least, my indebtedness to my family cannot be put in words. I am most
grateful to parents in-law and my brother in-law for all their support that made graduate
studies possible. My deepest gratitude goes to my husband for his love and patience
during the PhD period. One of the best experiences that we lived through in this period
was the birth of our son Ooi Zi Xuan and our daughter Ooi Xiang Yi, who provided an
additional and joyful dimension to our life mission. I owe a debt of gratitude to my late
father who inspired me with his love and faith in me; to my mother, my brother and
sisters for their love and support. There are no words to express the love and gratitude I
feel for all of you. Thank you from the bottom of my heart!

I certify that an Examination Committee met on 29 October 2007 to conduct the final examination of Lee Hooi Yean on her Doctor of Philosophy thesis entitled “Optimum Currency Areas in East Asia: Examination of Business Cycle Synchronisation” in accordance with Universiti Pertanian Malaysia (Higher Degree) Act 1980 and Universiti Pertanian Malaysia (Higher Degree) regulations in 1981. The Committee recommends that the candidates be awarded the degree of Doctor of Philosophy. Members of the Examination committee are as follows: Muzafar Shah Habibullah, Ph.D Professor Faculty of Economics and Management Universiti Putra Malaysia (Chairman) Zakariah Abdul Rashid, PhD Professor Faculty of Economics and Management Universiti Putra Malaysia (Internal Examiner) Zaleha Mohd Noor, PhD Head of Department Faculty of Economics and Management Universiti Putra Malaysia (Internal Examiner) Mansor Ibrahim, PhD Professor Kulliyyah of Economics and Management Sciences International Islamic University Malaysia (External Examiner)
___________________________________ HASANAH MOHD. GHAZALI, PhD Professor and Deputy Dean School of Graduate Studies Universiti Putra Malaysia
Date:

This thesis was submitted to the Senate of Universiti Putra Malaysia and has been accepted as fulfilment of the requirement for the degree of Doctor of Philosophy. The members of the Supervisory Committee were as follows:
Azali Mohamed, PhD Professor Faculty of Economics and Management Universiti Putra Malaysia (Chairman) Ahmad Zubaidi Baharumshah, PhD Professor Faculty of Economics and Management Universiti Putra Malaysia (Member) Fatimah Mohd Arshad, PhD Professor Faculty of Economics and Management Universiti Putra Malaysia (Member)
___________________________________ AINI IDERIS, PhD Professor and Dean School of Graduate Studies Universiti Putra Malaysia Date: 21 February 2008
ii

DECLARATION
I hereby declare that the thesis is based on my original work except for quotations and citations, which have been duly acknowledged. I also declare that it has not been previously or concurrently submitted for any other degree at UPM or other institutions.
__________________ LEE HOOI YEAN
Date: 21 November 2008
iii

TABLE OF CONTENTS
Page DEDICATION ii ABSTRACT iii ABSTRAK iv ACKNOWLEDGEMENTS v APPROVAL vi DECLARATION viii LIST OF TABLES xii LIST OF FIGURES xiv LIST OF APPENDICES LIST OF ABBREVIATIONS/GLOSSARY OF TERMS xix CHAPTER 1 INTRODUCTION 1 1.1 Overview 1 1.2 Brief History of Regionalism 8 1.2.1 Regional Trading Agreements 9 1.2.2 Past and Recent Failures of Regionalism in East Asia 11 1.3 The East Asian Financial Crisis and Regional Cooperation 16 1.4 Problem Statement 21 1.5 Objectives of Study 29 1.6 Significance of the Study 30 1.7 Plan and Organisation of the Study 33 2 LITERATURE REVIEW 34 2.1 Introduction
2.2 The Review of Optimal Currency Area (OCA) in Theory – The Traditional Approaches 34
2.2.1 Mundellian Approach to OCA Theory 35 2.2.2 McKinnon’s Approach to OCA Theory 37 2.3 The Literature Review of OCA Criteria 46
2.3.1 Measurement of Business Cycle 46 2.3.2 Symmetry of Business Cycle in OCA Context 53
2.4 The New OCA Theory 67 2.4.1 Krugman Specialisation Hypothesis 69 2.4.2 The “Endogeneity of OCA” Hypothesis 72 2.5 The Literature Review of the New OCA Theory 74 2.6 Concluding Remarks 78
iv

3 METHODOLOGY 80 3.1 Introduction 80 3.2 The Hypothesis 81 3.2.1 Symmetry of Business Cycles 81 3.2.2 Endogeneity of OCA 82 3.3 Methodology-Symmetry of Business Cycles 85 3.3.1 The Model Specification 85 3.3.2 State-Space Model 87 3.3.3 The Bayesian Estimation 94 3.3.4 Bayesian Model with Autocorrelation 101 3.3.5 The Posterior Simulators 111 3.3.6 Bayesian Computation in the State-Space Model 121 3.3.7 Markov Chain Monte Carlo (MCMC) Diagnostics 122 3.3.8 Other Estimation Issues 127
3.4 Methodology-Endogeneity of OCA 132 3.4.1 The Model Specification 132 3.4.2 The Measurement 133
3.4.3 Potential Problems of Estimation 139 3.4.4 The Generalised Method of Moments (GMM) Estimation 139 3.4.5 Test for the Validity of the GMM Estimators 140 3.4.6 Nonstationary Dynamic Panel and Panel Unit Root Tests 142 3.4.7 System GMM 145 3.5 The Source of Data 153 4 EMPIRICAL RESULTS AND DISCUSSIONS 155 4.1 Introduction 155 4.2 Symmetry of Business Cycles 156 4.2.1 Markov Chain Monte Carlo (MCMC) Diagnostics 156 4.2.2 Test for Heteroskedasticity 166
4.2.3 Bayesian Computation in the State-Space Model 167 4.3 Endogeneity of OCA 197 4.3.1 Nonstationary Dynamic Panel and Panel Unit Root Tests 197
4.3.2 Test for the Validity of the System GMM Instruments 200 4.3.3 System GMM Estimation 202
4.4 Concluding Remarks 211 5 SUMMARY, CONCLUSION AND POLICY IMPLICATION 214
5.1 Introduction 214 5.2 Summary 214
5.2.1 Symmetry of Business Cycle 216 5.2.2 Endogeneity of OCA 219
5.3 Lessons from EMU 222 5.4 Policy Implications 226 5.5 Limitation of Study and Suggestions for Future Research 228 5.6 Conclusions 231
v

vi
REFERENCES/BIBLIOGRAPHY 234 LIST OF APPENDICES 251 APPENDIX A APPENDIX B 252 APPENDIX C 263 APPENDIX D 267 APPENDIX E 271 APPENDIX F 275 APPENDIX G 279 APPENDIX H 286 APPENDIX I 293 BIODATA OF THE AUTHOR 300 LIST OF PUBLICATIONS
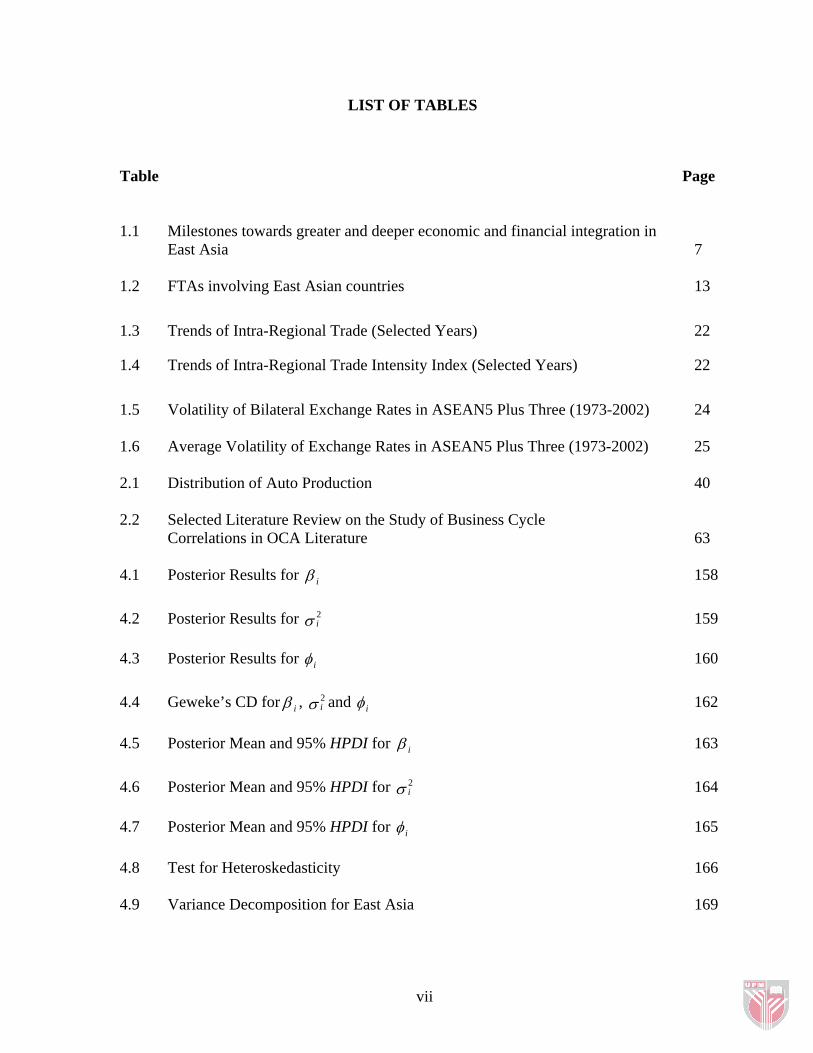
LIST OF TABLES
Table Page
1.1 Milestones towards greater and deeper economic and financial integration in East Asia 7 1.2 FTAs involving East Asian countries 13
1.3 Trends of Intra-Regional Trade (Selected Years) 22
1.4 Trends of Intra-Regional Trade Intensity Index (Selected Years) 22
1.5 Volatility of Bilateral Exchange Rates in ASEAN5 Plus Three (1973-2002) 24 1.6 Average Volatility of Exchange Rates in ASEAN5 Plus Three (1973-2002) 25 2.1 Distribution of Auto Production 40 2.2 Selected Literature Review on the Study of Business Cycle
Correlations in OCA Literature 63
4.1 Posterior Results for β i 158 4.2 Posterior Results for 159 σ 2
i
4.3 Posterior Results for φ i 160 4.4 Geweke’s CD for β i , and σ 2
i φ i 162 4.5 Posterior Mean and 95% HPDI for β i 163 4.6 Posterior Mean and 95% HPDI for 164 σ 2
i
4.7 Posterior Mean and 95% HPDI for φ i 165 4.8 Test for Heteroskedasticity 166 4.9 Variance Decomposition for East Asia 169
vii

4.10 Presence of World, Regional and Country-Specific Factors during Major Events for East Asian Countries 192
4.11 Variance Decomposition for European Union 194 4.12 Variance Decomposition for North America 196 4.13 The Panel Unit Root Tests 199 4.14 System GMM Estimation 206 4.15 Comparative Study of the Endogeneity of OCA Criteria 209 A.1 Posterior Results for β i (40,000 draws) 286 A.2 Posterior Results for (40,000 draws) 287 σ 2
i
A.3 Posterior Results for φ i (40,000 draws) 288 A.4 Geweke’s CD for β i , and σ 2
i φ i (40,000 draws) 289 A.5 Posterior Mean and 95% HPDI for β i (40,000 draws) 290 A.6 Posterior Mean and 95% HPDI for (40,000 draws) 291 σ 2
i
A.7 Posterior Mean and 95% HPDI for φ i (40,000 draws) 292 A.8 Posterior Results for β i
σ 2i
(50,000 draws) 293 A.9 Posterior Results for (50,000 draws) 294
viii
A.10 Posterior Results for φ i (50,000 draws) 295 A.11 Geweke’s CD for β i σ 2
i, and φ i (50,000 draws) 296 A.12 Posterior Mean and 95% HPDI for β i (50,000 draws) 297 A.13 Posterior Mean and 95% HPDI for (50,000 draws) 298 σ 2
i
A.14 Posterior Mean and 95% HPDI for φ i (50,000 draws) 299

LIST OF FIGURES
Figure Page
2.1 Aggregate Demand and Supply in Nation A and Nation B 36 2.2 The European Commission View 41 2.3 The Krugman View 41 2.4 Effectiveness of Devaluation as a Function of Openness 44 2.5 The Cost of a Monetary Union and the Openness of a Country 45 2.6 Business Cycle Symmetry, Trade Integration and the Monetary Regime 68 2.7 The Effect of a Country Joining Monetary Union
(The Krugman Specialisation Hypothesis) 70 2.8 The Effect of a Country Joining Monetary Union
(The “Endogeneity of OCA” Hypothesis) 72 3.1 Summary of Dynamic Relationships between Trade, Finance,
Specialisation and Business Cycle Synchronisation 84 4.1 The Median of Output Growth, World, Regional and Country-Specific Factor
for China (1970-2000) 171 4.2 The Median of Output Growth, World, Regional and Country-Specific Factor
for Indonesia (1970-2000) 174 4.3 The Median of Output Growth, World, Regional and Country-Specific Factor
for Japan (1970-2000) 177 4.4 The Median of Output Growth, World, Regional and Country-Specific Factor
for Korea (1970-2000) 178 4.5 The Median of Output Growth, World, Regional and Country-Specific Factor
for Malaysia (1970-2000) 181 4.6 The Median of Output Growth, World, Regional and Country-Specific Factor
for The Philippines (1970-2000) 185
ix
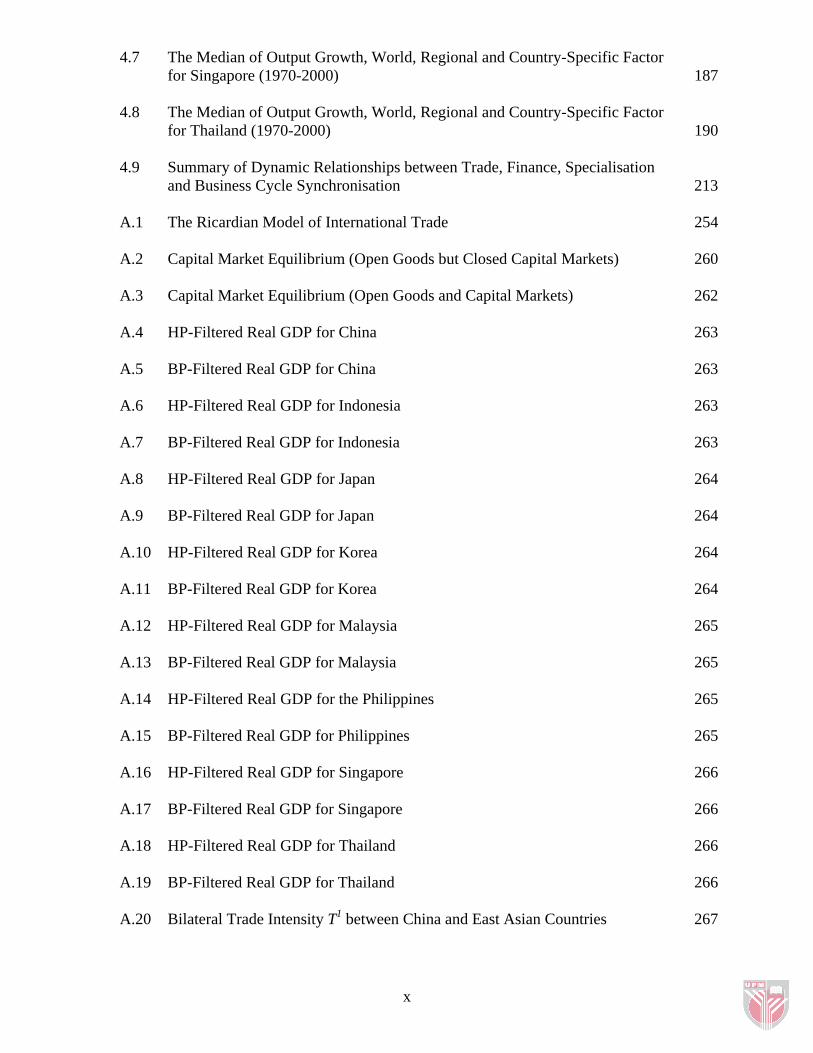
4.7 The Median of Output Growth, World, Regional and Country-Specific Factor for Singapore (1970-2000) 187
4.8 The Median of Output Growth, World, Regional and Country-Specific Factor
for Thailand (1970-2000) 190 4.9 Summary of Dynamic Relationships between Trade, Finance, Specialisation
and Business Cycle Synchronisation 213 A.1 The Ricardian Model of International Trade 254 A.2 Capital Market Equilibrium (Open Goods but Closed Capital Markets) 260
A.3 Capital Market Equilibrium (Open Goods and Capital Markets) 262 A.4 HP-Filtered Real GDP for China 263
A.5 BP-Filtered Real GDP for China 263
A.6 HP-Filtered Real GDP for Indonesia 263
A.7 BP-Filtered Real GDP for Indonesia 263
A.8 HP-Filtered Real GDP for Japan 264
A.9 BP-Filtered Real GDP for Japan 264
A.10 HP-Filtered Real GDP for Korea 264
A.11 BP-Filtered Real GDP for Korea 264
A.12 HP-Filtered Real GDP for Malaysia 265
A.13 BP-Filtered Real GDP for Malaysia 265
A.14 HP-Filtered Real GDP for the Philippines 265
A.15 BP-Filtered Real GDP for Philippines 265
A.16 HP-Filtered Real GDP for Singapore 266
A.17 BP-Filtered Real GDP for Singapore 266
A.18 HP-Filtered Real GDP for Thailand 266
A.19 BP-Filtered Real GDP for Thailand 266
A.20 Bilateral Trade Intensity T1 between China and East Asian Countries 267
x

A.21 Bilateral Trade Intensity T1 between Indonesia and East Asian Countries 267 A.22 Bilateral Trade Intensity T1 between Japan and East Asian Countries 268 A.23 Bilateral Trade Intensity T1 between Korea and East Asian Countries 268 A.24 Bilateral Trade Intensity T1 between Malaysia and East Asian Countries 269 A.25 Bilateral Trade Intensity T1 between the Philippines and East Asian Countries 269 A.26 Bilateral Trade Intensity T1 between Singapore and East Asian Countries 270 A.27 Bilateral Trade Intensity T1 between Thailand and East Asian Countries 270 A.28 Bilateral Trade Intensity T2 between China and East Asian Countries 271
A.29 Bilateral Trade Intensity T2 between Indonesia and East Asian Countries 271
A.30 Bilateral Trade Intensity T2 between Japan and East Asian Countries 272
A.31 Bilateral Trade Intensity T2 between Korea and East Asian Countries 272
A.32 Bilateral Trade Intensity T2 between Malaysia and East Asian Countries 273
A.33 Bilateral Trade Intensity T2 between the Philippines and East Asian Countries 273
A.34 Bilateral Trade Intensity T2 between Singapore and East Asian Countries 274
A.35 Bilateral Trade Intensity T2 between Thailand and East Asian Countries 274
A.36 Similarity of Production Structures and Specialisation (S) between China and East Asian Countries 275
A.37 Similarity of Production Structures and Specialisation (S) between Indonesia
and East Asian Countries 275 A.38 Similarity of Production Structures and Specialisation (S) between Japan
and East Asian Countries 276 A.39 Similarity of Production Structures and Specialisation (S) between Korea
and East Asian Countries 276 A.40 Similarity of Production Structures and Specialisation (S) between Malaysia
and East Asian Countries 277 A.41 Similarity of Production Structures and Specialisation (S) between the Philippines
and East Asian Countries 277
xi

A.42 Similarity of Production Structures and Specialisation (S) between Singapore and East Asian Countries 278
A.43 Similarity of Production Structures and Specialisation (S) between Thailand
and East Asian Countries 278
A.44 Financial Integration Index (F) between China and Indonesia 279 A.45 Financial Integration Index (F) between China and Japan 279 A.46 Financial Integration Index (F) between China and Korea 279 A.47 Financial Integration Index (F) between China and Malaysia 279 A.48 Financial Integration Index (F) between China and the Philippines 280 A.49 Financial Integration Index (F) between China and Singapore 280 A.50 Financial Integration Index (F) between China and Thailand 280 A.51 Financial Integration Index (F) between Indonesia and Japan 280 A.52 Financial Integration Index (F) between Indonesia and Korea 281 A.53 Financial Integration Index (F) between Indonesia and Malaysia 281 A.54 Financial Integration Index (F) between Indonesia and the Philippines 281 A.55 Financial Integration Index (F) between Indonesia and Singapore 281 A.56 Financial Integration Index (F) between Indonesia and Thailand 282 A.57 Financial Integration Index (F) between Japan and Korea 282 A.58 Financial Integration Index (F) between Japan and Malaysia 282 A.59 Financial Integration Index (F) between Japan and the Philippines 282 A.60 Financial Integration Index (F) between Japan and Singapore 283 A.61 Financial Integration Index (F) between Japan and Thailand 283 A.62 Financial Integration Index (F) between Korea and Malaysia 283 A.63 Financial Integration Index (F) between Korea and the Philippines 283 A.64 Financial Integration Index (F) between Korea and Singapore 284 A.65 Financial Integration Index (F) between Korea and Thailand 284
xii

xiii
A.66 Financial Integration Index (F) between Malaysia and the Philippines 284 A.67 Financial Integration Index (F) between Malaysia and Singapore 284 A.68 Financial Integration Index (F) between Malaysia and Thailand 285 A.69 Financial Integration Index (F) between the Philippines and Singapore 285 A.70 Financial Integration Index (F) between the Philippines and Thailand 285
A.71 Financial Integration Index (F) between the Singapore and Thailand 285

LIST OF APPENDICES
Appendix A 251 Appendix B 252 Appendix C 263 Appendix D 267 Appendix E 271 Appendix F 275 Appendix G 279 Appendix H 286 Appendix I 293
xiv

LIST OF ABBREVIATIONS/GLOSSARY OF TERMS
ABF Asian Bond Fund
ABF2 Asian Bond Fund 2
ABMI Asian Bond Markets Initiative
ACU Asian Currency Unit
AD Aggregate Demand
ADB Asian Development Bank
AFTA ASEAN Free Trade Area
ALADI Latin American Integration Association
AMF Asian Monetary Fund
APEC Asia-Pacific Economic Cooperation
APT ASEAN Plus Three (10 members of ASEAN plus China, Japan and Korea)
AR Autoregressive
ARCH Autoregressive Conditionally Heteroscedastic
AREAER Annual Report on Exchange Arrangements and Exchange Restrictions
ARMA Autoregressive Moving-Average
AS Aggregate Supply
ASA ASEAN Swap Arrangement
ASEAN Association of Southeast Asian Nations
ASEAN5 Founding members of ASEAN (Indonesia, Malaysia, Philippines, Singapore and Thailand) BACC Bayesian Analysis, Computation and Communication
BP Band-Pass
xv

BSA Bilateral Swap Arrangements
BUGS Bayesian Inference Using Gibbs Sampling
CACM Central American Common Market
CD Convergence Diagnostic
CEAO Communaute Economique de l’Afrique Occidentale
CID Covered Interest Differential
CMI Chiang Mai Initiative
COMESA Common Market of Eastern and Southern Africa
CPI Consumer Price Index
CUSFTA Canadian-US Free Trade Area
EAEC East Asian Economic Caucus
EAEG East Asian Economic Group
EAS East Asian Summit
EC European Commission
EEC European Economic Community
EFTA European Free Trade Area
EMEAP Executives’ Meeting of East-Asia-Pacific Central Banks
EMS European Monetary System
EMU The European Economic and Monetary Union
ERM Exchange Rate Mechanism
ERPD Economic Review and Policy Dialogue
EU European Union
FDI Foreign Direct Investment
xvi