Embed Size (px)
Citation preview

Geophys. J. Int. (2008) 172, 464–476 doi: 10.1111/j.1365-246X.2007.03566.xG
JIVol
cano
logy
,ge
othe
rmic
s,flui
dsan
dro
cks
Uplift and strength evolution of passive margins inferred from 2-Dconductive modelling
Marie Leroy, Frederic Gueydan and Olivier DauteuilGeosciences Rennes (UMR CNRS 6118), Universite de Rennes 1, 35042 Rennes Cedex, France. E-mail: [email protected]
Accepted 2007 July 27. Received 2007 May 22; in original form 2005 October 13
S U M M A R YPost-breakup vertical motions of passive margins are seen here as a result of the post-rift 2-Dthermal evolution. A 2-D finite element numerical model is performed to evaluate both thevertical and horizontal conduction that drive the thermal evolution of continental passive mar-gins, from breakup to post-breakup states. Initial temperature configurations corresponding tonon-volcanic and volcanic margins are tested, and lead to different thermal evolution of thelithosphere. For both margins, a thermal thickening is observed in the stretched lithosphere,whereas the unstretched lithosphere undergoes first (0–80 Ma) a thermal thinning and sec-ondly (after 80 Ma) a thermal thickening. In comparison with non-volcanic margins, volcanicmargins show a slower thermal thickening and a greater thermal thinning in stretched and un-stretched lithosphere, respectively. The variations with time of lithosphere thickness are thentranslated into isostatic vertical movements and reveal ‘seaward’ thermal induced subsidenceand ‘landward’ thermal induced uplift. The estimated uplift reaches up to 250 m in volcanicmargins and 120 m in non-volcanic margins. The modelled timing and amount of uplift in bothmargins are consistent with present-day topography of volcanic passive margins that stand twoto three times higher than non-volcanic margins. Using these thermal models, we finally showthat the 2-D strength of the margins drastically evolves with time from a seeward dominantstrength (0–80 Ma) toward a landward dominant strength (time larger than 80 Ma). These lat-eral strength evolution could have strong effect on the flexural response of the margin throughtime.
Key words: Numerical solutions; Heat flow; Rheology: crust and lithosphere.
1 I N T RO D U C T I O N
Passive margins are commonly seen as stable geodynamic fea-
tures, only affected by subsidence, driven first by tectonic and
then by thermal re-adjustments (McKenzie 1978). The inland to-
pography is assumed to be inherited from rifting and evolves with
erosion and isostatic response. However, many margins display a
continental part with a high topography that is likely related to
post-breakup vertical motions. Significant post-rifting uplift has
indeed been recognized in northwestern Europe (Stuevold & El-
dholm 1996; Japsen & Chalmers 2000), in West Africa (Partridge
& Maud 1987; Burke 1996), southeast Brazil (Cobbold et al. 2001;
Saenz et al. 2003) and India (Gunnel & Fleitout 2000). For exam-
ple, in South Africa, the uplift amount reached 900 m in Pliocene
(Partridge & Maud 1987). These uplift occurrences raise a major
problem that is to constrain the mechanisms controlling the post-
breakup rejuvenation of topography associated to the passive margin
uplift.
This topography rejuvenation has to be differentiated from the
topography inherited from the rifting of passive margins. Rifting re-
sults in a syn-rift topography caused by the rift flanks uplift that can
be added to the pre-rift inherited topography. Isostatic adjustment,
lithosphere flexure, depth-dependant extension, deep crustal flow
and thermal expansion due to small-scale convection are commonly
advocated to explain rift flank uplift (Beaumont et al. 1982; Buck
1986; Rowley & Sahagian 1986; Braun & Beaumont 1989; Weissel
& Karner 1989; Kruse et al. 1991; Chery et al. 1992; Hopper &
Buck 1996, 1998). All these processes occur during rifting and thus
could not explain the recognized post-rift uplift. The mechanisms re-
sponsible for post-breakup rift uplift remain poorly understood and
are matter of debate. Glacial rebound, lithospheric flexure due to
erosion and sedimentation, mantle plume effects and regional com-
pression have been proposed to explain post-rift uplift (Gilchrist
& Summerfield 1990; Nyblade & Robinson 1994; Stuevold &
Eldholm 1996; Japsen & Chalmers 2000; Cobbold et al. 2001).
For example, tectonic horizontal forces such as ridge-push or far-
field tectonic stresses may trigger margins reactivations in com-
pression and thus induce uplift (Cloetingh et al. 1990; Ransome &
de Wit 1992; Dore & Lundin 1996; Boldreel & Andersen 1998;
Hudec & Jackson 2002; Mosar et al. 2002). The uplift could also
be enhanced after the breakup by subcontinental hotspots, like in
the south of Africa where a significant uplift has been attributed
464 C© 2007 The Authors
Journal compilation C© 2007 RAS

Post-breakup passive margins thermal uplift 465
Figure 1. (a) Crustal geometry and principal features of non-volcanic (modified from Boillot 1979) and volcanic passive margins (modified from Geoffroy
2001). Volcanic margins are marked by intrusion and extrusion of large volumes of magma, sills and dykes, and by seaward dipping layers of sediments and
volcanics; (b) Mean height of 20 volcanic and non-volcanic passive margins plotted as a function of the age of the margins. Characteristics of the 20 passive
margins are displayed in Table 1. The type of margin is from Coffin & Eldholm (1992): Non-volcanic margins are plotted with black dots (full when the
non-volcanic aspect at breakup time is certain, empty when uncertain) and Volcanic margins are displayed with black triangles (full when the volcanic aspect
of the province at breakup time is certain, empty when the volcanic association with breakup time is uncertain).
to the ‘African Superswell’ (Nyblade & Robinson 1994; Gurnis etal. 2000). The edge-driven convection induced by sharp lithosphere
topography, could also promote the driven forces necessary for the
margins uplift (Buck 1986; King & Anderson 1998; Boutilier &
Keen 1999; Huismans et al. 2001). This small-scale convection was
used to study the convective destabilization of lithosphere cratonic
roots, with a high and steep lithosphere thickness difference. For
passive margins, the lithosphere thinning is much more gradual and
edge-driven convection is probably less favourable.
The origin of post-breakup uplift is still controversial and associ-
ated processes remain poorly understood. We propose here to study
the impact of the steep lateral thermal gradient produced by rifting
on the 2-D thermal evolution of the margins and thus on the lat-
eral isostatic evolution of the margin. This thermal re-adjustment
could have a major impact because rifted continental margins may
be contemporaneous to magmatic event yielding to volcanic or non-
volcanic margin according to the thickness of igneous crust on the
margin, and to the presence of a hotspot during breakup. Around
30 per cent of passive margins are said to be non-volcanic (North-
western Africa margins, for example), and 70 per cent volcanic (e.g.
Greenland, Norway, Namibia and Brazil margins, Ruppel 1995). In
addition to the structural difference of these two margin types de-
scribed by several authors (Boillot 1979; White & McKenzie 1989;
Banda et al. 1993; Gladczenko et al. 1997; Price et al. 1997; Brun
1999; Eldholm et al. 2000; Jackson et al. 2000) and displayed on
Fig. 1(a), these margins have distinct initial 2-D thermal state. Vol-
canic margins are indeed marked by warmer geotherms than that of
non-volcanic margins and are associated with voluminous intrusive
and extrusive volcanic activity (White & McKenzie 1989; Eldholm
1991; Skogseid et al. 1992; Gladczenko et al. 1997; Price et al. 1997;
Eldholm et al. 2000; Jackson et al. 2000). Moreover, positive tem-
peratures anomalies of 100–200 ◦C are generated by mantle plumes
beneath the lithosphere in the underlying asthenosphere (White &
McKenzie 1989). As well as the subsidence is strongly controlled
by the thermal re-adjustment of the lithosphere (McKenzie 1978),
that is, the initial thermal state of the margin and the heat flow at the
lithosphere base, this paper aims to constrain the thermal effects on
post breakup margin uplift in 2-D.
This hypothesis of margin uplift related to 2-D post-breakup
thermal adjustment is strengthened by the present-day margin to-
pography that is higher for volcanic margin (Fig. 1b). The mean
height of 20 margins were computed from the Digital Elevation
Model ETOPO 30 (full data in Table 1) and plotted as a function
of the margin age, estimated from the UNESCO geological map.
The topography of volcanic margins is higher (∼700 m) than that
of non-volcanic margins (∼300–350 m). Assuming that this topo-
graphy images the uplift history of the margins, this feature would
suggest that volcanic margins have undergone higher uplift since
breakup (two to three times higher), which may be the consequence
of its warmer breakup 2-D thermal state. As discussed above, the
present-day margin topography however results from the sum of
several processes like inherited rifting topography, post-rift erosion
rate, flexural deformation of margins and 2-D post-breakup thermal
re-adjustment.
C© 2007 The Authors, GJI, 172, 464–476
Journal compilation C© 2007 RAS

466 M. Leroy, F. Gueydan and O. Dauteuil
Table 1. Description of the 20 passive margins displayed on Fig. 1: localization, drifting age, type of margin [volcanic (V) or non-volcanic
(NV) from Coffin & Eldholm 1992].
Margin Country Mean height (m) Approximated Type of margin volcanic (V)
age (Ma) non volcanic (NV)
1 Greenland 488 55 V
2 Canada 445 130 NV
3 USA 372 160 V?
4 Brazil 674 130 V
5 Uruguay/Argentina 225 130 V?
6 Norway 750 60 V
7 Norway 836 60 V
8 British Isles 326 55 V
9 Spain/Portugal 558 130 NV
10 Senegal/Mauritania 234 160 NV
11 Gabon 556 130 NV
12 Namibia 1064 130 V
13 South Africa 951 130 V?
14 Yemen 886 40 V
15 Oman 360 17 NV
16 India 641 80 V
17 Australia 295 130 NV?
18 Australia 252 80 NV
19 Australia 700 80 V?
20 Australia 583 55 V?
Question marks stand for uncertainties for the type of margins. For the Greenland margin (n ◦1), we have subtracted from the mean
elevation calculated, the 2000 m corresponding to the supposed icecap thickness (see website:
http://www.geocities.com/Yosemite/4466/mapintro.html).
Thermal evolution of the oceanic part of the margins has been
widely studied (see for example, Parsons & Sclater 1977; Karner
1985; Stein & Stein 1992), but the continental lithosphere thermal
evolution is less constrained. The most famous post-rift thermal
model for passive margins is the 1-D conductive model proposed
by McKenzie (1978), which computed post-rift subsidence in the
stretched part of the continental margin. This model predicts the
tectonic and thermal subsidence and the timescale of each process.
The horizontal variations of temperature with time along the mar-
gin (from stretched to unstretched continental lithosphere), and the
related vertical motions in the unstretched part of the margin due
to isostatic compensation were however not discussed by McKen-
zie and are the objective of the present paper. Several others mod-
els have been performed on the 2-D thermal evolution of margin
(Cochran 1983; Gadd & Scrutton 1997; Vagnes 1997; Hansen &
Nielsen 2002) and show that lateral heat conduction has a signif-
icant effect on the basin subsidence and margin uplift histories.
Cochran (1983) suggests for example that uplift could be gener-
ated by thermal expansion in areas surrounding basins; but with
small amplitude (<50 m) and small duration (few Ma after the end
of rifting). From these considerations, we focus this study on the
role of initial thermal state of the lithosphere in post-rift continental
uplift.
First, we describe the 2-D numerical model that computes the tem-
perature evolution of the lithosphere with time, from an initial ther-
mal state. For sake of simplicity, convection has been disregarded in
this study. We chose to focus this study on the role of 2-D conduc-
tion in lithosphere thinning and thickening, and the related vertical
motions. Different initial thermal configurations, corresponding to
non-volcanic and volcanic margins, are tested and analysed in term
of thermal buoyancy forces and surface effects. Our results are then
tentatively compared with natural observations of passive margins
topography that provide indirect images of the uplift. Finally, the
strength evolution of margins is discussed.
2 2 - D T H E R M A L M O D E L
We have performed a 2-D thermal numerical model at lithosphere
scale to compute the isotherm re-adjustment driven by 2-D conduc-
tion of the two types of passive margins after the stretching event.
This re-adjustment depends on the initial thermal configuration, and
therefore, on the margin geometry.
2.1 Initial 2-D thermal state
This modelling assumes that the initial thermal state is that of the
drifting stage of a passive margin, when the oceanic crust is just
formed (Fig. 2). At this time, the continental crust is highly thinned
and stretched. The whole lithosphere is getting thinner towards the
ocean/continent boundary, as expressed by the 1200 ◦C isotherm
defining the base of the lithosphere (Fig. 2, stage 1). The 2-D ther-
mal modelling will thus capture the isotherm re-adjustment from this
initial thermal state towards the thermal equilibrium of the margin
(Fig. 2, stage 2). During the thermal re-adjustment, the continental
crust is assumed to keep the stretched shape acquired at the begin-
ning of the drifting stage. This assumption is in agreement with many
seismic profiles that show a strong Moho deflexion in present days
below passive margins (Mohriak & Dewey 1987; Gladczenko et al.1997; Bauer et al. 2000; Eldholm et al. 2000). The 2-D modelled
box is 600 km long and 150 km thick and consists of a continen-
tal lithosphere of thickness HL and a portion of the asthenosphere
(Fig. 2). The oceanic lithosphere has not been modelled, since our
main objective is to study the thermal evolution of the unstretched
continental domain of the passive margins, and its uplift. The studied
structure starts a few kilometres after the ocean/continent boundary,
as sketched in shaded rectangle on Fig. 2. The crustal thickness is
set to 30 km in the unstretched continental lithosphere and decreases
in the stretched lithosphere, near the ocean/continent boundary, to
reach 30/β km, β being the stretching factor.
C© 2007 The Authors, GJI, 172, 464–476
Journal compilation C© 2007 RAS

Post-breakup passive margins thermal uplift 467
Figure 2. Geometry and thermal structure of a passive margin in nature (left-hand side) and in the numerical model (right-hand side), (1) at the end of continental
breakup (initial state) and (2) tens of Ma after drifting, when the lithosphere is thermally re-equilibrated (stable thermal state). The 1200 ◦C isotherm defines
the lithosphere bottom. Its shape under continental part is defined from the initial thermal state, by the stretching factor β and value �x. The asthenosphere
temperature beneath the stretched part is set to 1200 ◦C + �T (�T varying between 0 and 200 ◦C for different model set up).
The initial thermal state was defined as follows. First, a 2-D steady
state is defined to account for a 100 km thick lithosphere at thermal
equilibrium in the stable margin (right of the model).
For this steady state, the temperature T(x, z) in the crust is:
Radiogenic crust [z < HRC(x)] :
T (x, z) = − r
2kcz
2 +(
qm
kc+ r
kcHRC(x)
)z + To;
(1)
Non − radiogenic crust [HRC(x) < z < HC (x)] :
T (x, z) = qm
kcz + r
2kcHRC(x)2 + T0
, (2)
where r, kc, qm and T 0 are the radiogenic heat production [which
occurred over a thickness H RC(x)], the crust conduction, the basal
heat flux and the surface temperature set to 300 ◦K, respectively.
x and y are the horizontal and vertical coordinates, respectively. xis increasing toward the right and y is increasing downward. The
thickness of the crust Hc(x) and the radiogenic crust H RC(x) are
two functions of the horizontal coordinate x, which are defined as
follows. The radiogenic crustal thickness is set to the third of the
crustal thickness: H RC(x) = HC(x)/3. In the unstretched part of the
lithosphere (x > x2, Fig. 2), the crustal thickness is H co = 30 km
(Table 1), while in the stretched part of the lithosphere (x < x 1),
H c = H co/β. For x 1 < x < x 2, a linear evolution of the crustal
thickness is imposed.
In the mantle, the temperatures are defined by:
Lithosphere mantle [z > HC (x)] :
T (x, z) = qm
km[z − HC (x)] + TM (x);
with TM (x) = qm
kcHc(x) + r
2kcHRC (x)2 + T0,
(3)
where km and kc are the mantle and crust conductions, respectively.
TM (x) is the Moho temperature. The thickness of the lithosphere
HL(x) could be derived from eq. (3) since at z = HL(x), the litho-
sphere temperature is TL = 1200 ◦C (Table 1):
HL (x) = km
qm[TL − TM (x)] + HC (x). (4)
Finally, in the asthenosphere [z > HL(x)], the temperature is set
to TL for x > x 2 and to TL + �T under the stretched lithosphere
(x < x 2, Fig. 2), in order to model the hot condition of volcanic
margins asthenosphere. We have chosen to consider this tempera-
ture anomaly as a localized feature in the mantle below the stretched
lithosphere because this thermal anomaly likely induced crustal un-
derplating and sills and dykes emplacement only in the vicinity
of the stretched crust (Fig. 1a). The value of this positive thermal
anomaly �T will be systematically varied in this study. We consider
here 200 ◦C as the maximum value for the temperature anomaly in
the mantle (White & McKenzie 1989).
From this 2-D steady state (eqs 1–3), the temperature profiles
are modified to account for the stretching factor β. For x < x 1, the
base of the lithosphere is changed from HL(x), eq. (4), to HL(x)/β
(Fig. 2). For x > x 2, the thickness of the lithosphere remains un-
changed to HL(x) and for x 1 < x < x 2, a linear interpolation of
the lithosphere thickness is imposed. The lateral variation of the
initial lithosphere thickness over the passive margin is, therefore,
controlled by the stretching factor β over the horizontal distance
�x = x 2 − x 1 (Fig. 2). These two parameters (β and �x) will be
used to characterize the initial thermal state. The thickness inter-
polation results in the initial state geometry displayed on Fig. 2.
Note that the particular unsmooth shape of the lithosphere at x2 is a
meshing effect in this area of the model but has no incidence on the
thermal evolution and on the model results. As well, in our thermal
modelling, the zone where the crust gets thinner is modelled with the
same length (�x) for volcanic and non-volcanic margins, although
it appears to be shorter in volcanic margins (Fig. 1a). This approx-
imation may not influence significantly the thermal structure, but
its role on the thermal evolution could however be studied in future
development of this model.
2.2 Governing equations and boundary conditions
The heat equation solved is the 2-D formulation of the time depen-
dant heat conduction, which reads:
ρ C∂T
∂t−
(k∂2T
∂z2+ k
∂2T
∂x2
)= r, (5)
where ρ and C are the material density and the heat capacity, re-
spectively. Values of these parameters for the crust and the mantle
can be found in Table 2. The radiogenic heat production is fixed
C© 2007 The Authors, GJI, 172, 464–476
Journal compilation C© 2007 RAS
468 M. Leroy, F. Gueydan and O. Dauteuil
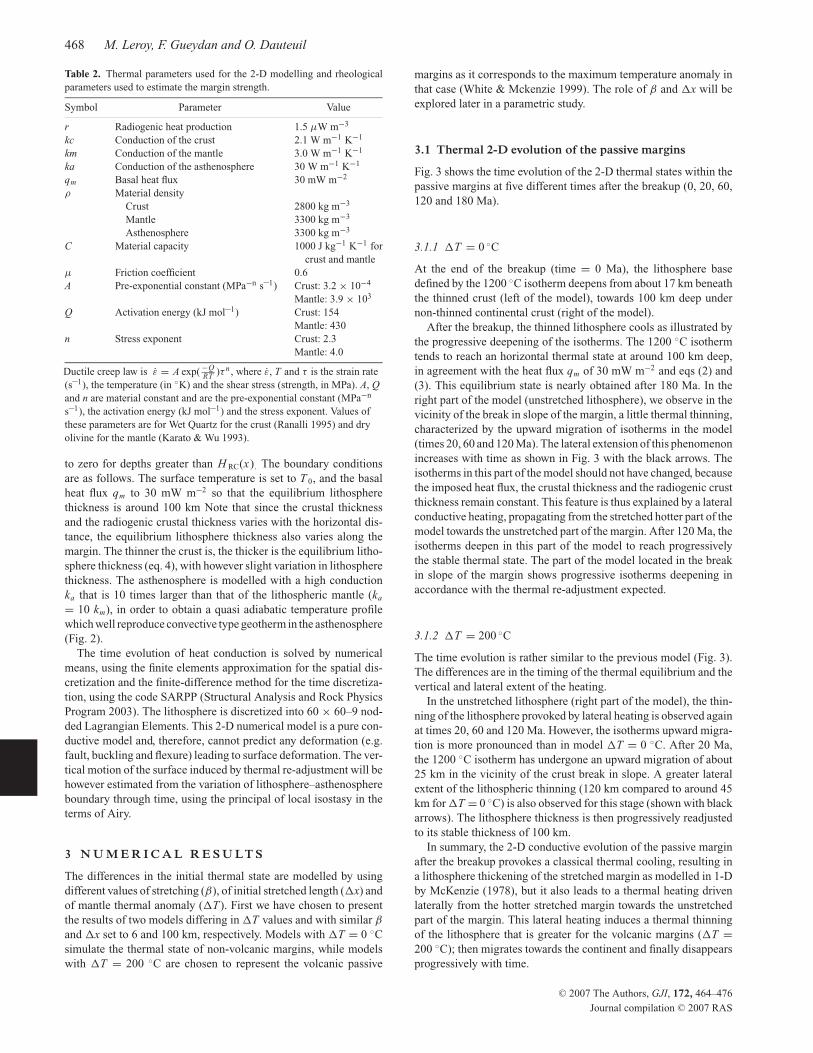
Table 2. Thermal parameters used for the 2-D modelling and rheological
parameters used to estimate the margin strength.
Symbol Parameter Value
r Radiogenic heat production 1.5 μW m−3
kc Conduction of the crust 2.1 W m−1 K−1
km Conduction of the mantle 3.0 W m−1 K−1
ka Conduction of the asthenosphere 30 W m−1 K−1
qm Basal heat flux 30 mW m−2
ρ Material density
Crust 2800 kg m−3
Mantle 3300 kg m−3
Asthenosphere 3300 kg m−3
C Material capacity 1000 J kg−1 K−1 for
crust and mantle
μ Friction coefficient 0.6
A Pre-exponential constant (MPa−n s–1) Crust: 3.2 × 10⁻⁴
Mantle: 3.9 × 10³
Q Activation energy (kJ mol–1) Crust: 154
Mantle: 430
n Stress exponent Crust: 2.3
Mantle: 4.0
Ductile creep law is ε = A exp( −QRT )τ n , where ε, T and τ is the strain rate
(s–1), the temperature (in ◦K) and the shear stress (strength, in MPa). A, Qand n are material constant and are the pre-exponential constant (MPa−n
s–1), the activation energy (kJ mol–1) and the stress exponent. Values of
these parameters are for Wet Quartz for the crust (Ranalli 1995) and dry
olivine for the mantle (Karato & Wu 1993).
to zero for depths greater than H RC(x). The boundary conditions
are as follows. The surface temperature is set to T 0, and the basal
heat flux qm to 30 mW m−2 so that the equilibrium lithosphere
thickness is around 100 km Note that since the crustal thickness
and the radiogenic crustal thickness varies with the horizontal dis-
tance, the equilibrium lithosphere thickness also varies along the
margin. The thinner the crust is, the thicker is the equilibrium litho-
sphere thickness (eq. 4), with however slight variation in lithosphere
thickness. The asthenosphere is modelled with a high conduction
ka that is 10 times larger than that of the lithospheric mantle (ka
= 10 km), in order to obtain a quasi adiabatic temperature profile
which well reproduce convective type geotherm in the asthenosphere
(Fig. 2).
The time evolution of heat conduction is solved by numerical
means, using the finite elements approximation for the spatial dis-
cretization and the finite-difference method for the time discretiza-
tion, using the code SARPP (Structural Analysis and Rock Physics
Program 2003). The lithosphere is discretized into 60 × 60–9 nod-
ded Lagrangian Elements. This 2-D numerical model is a pure con-
ductive model and, therefore, cannot predict any deformation (e.g.
fault, buckling and flexure) leading to surface deformation. The ver-
tical motion of the surface induced by thermal re-adjustment will be
however estimated from the variation of lithosphere–asthenosphere
boundary through time, using the principal of local isostasy in the
terms of Airy.
3 N U M E R I C A L R E S U LT S
The differences in the initial thermal state are modelled by using
different values of stretching (β), of initial stretched length (�x) and
of mantle thermal anomaly (�T). First we have chosen to present
the results of two models differing in �T values and with similar β
and �x set to 6 and 100 km, respectively. Models with �T = 0 ◦C
simulate the thermal state of non-volcanic margins, while models
with �T = 200 ◦C are chosen to represent the volcanic passive
margins as it corresponds to the maximum temperature anomaly in
that case (White & Mckenzie 1999). The role of β and �x will be
explored later in a parametric study.
3.1 Thermal 2-D evolution of the passive margins
Fig. 3 shows the time evolution of the 2-D thermal states within the
passive margins at five different times after the breakup (0, 20, 60,
120 and 180 Ma).
3.1.1 �T = 0 ◦C
At the end of the breakup (time = 0 Ma), the lithosphere base
defined by the 1200 ◦C isotherm deepens from about 17 km beneath
the thinned crust (left of the model), towards 100 km deep under
non-thinned continental crust (right of the model).
After the breakup, the thinned lithosphere cools as illustrated by
the progressive deepening of the isotherms. The 1200 ◦C isotherm
tends to reach an horizontal thermal state at around 100 km deep,
in agreement with the heat flux qm of 30 mW m−2 and eqs (2) and
(3). This equilibrium state is nearly obtained after 180 Ma. In the
right part of the model (unstretched lithosphere), we observe in the
vicinity of the break in slope of the margin, a little thermal thinning,
characterized by the upward migration of isotherms in the model
(times 20, 60 and 120 Ma). The lateral extension of this phenomenon
increases with time as shown in Fig. 3 with the black arrows. The
isotherms in this part of the model should not have changed, because
the imposed heat flux, the crustal thickness and the radiogenic crust
thickness remain constant. This feature is thus explained by a lateral
conductive heating, propagating from the stretched hotter part of the
model towards the unstretched part of the margin. After 120 Ma, the
isotherms deepen in this part of the model to reach progressively
the stable thermal state. The part of the model located in the break
in slope of the margin shows progressive isotherms deepening in
accordance with the thermal re-adjustment expected.
3.1.2 �T = 200 ◦C
The time evolution is rather similar to the previous model (Fig. 3).
The differences are in the timing of the thermal equilibrium and the
vertical and lateral extent of the heating.
In the unstretched lithosphere (right part of the model), the thin-
ning of the lithosphere provoked by lateral heating is observed again
at times 20, 60 and 120 Ma. However, the isotherms upward migra-
tion is more pronounced than in model �T = 0 ◦C. After 20 Ma,
the 1200 ◦C isotherm has undergone an upward migration of about
25 km in the vicinity of the crust break in slope. A greater lateral
extent of the lithospheric thinning (120 km compared to around 45
km for �T = 0 ◦C) is also observed for this stage (shown with black
arrows). The lithosphere thickness is then progressively readjusted
to its stable thickness of 100 km.
In summary, the 2-D conductive evolution of the passive margin
after the breakup provokes a classical thermal cooling, resulting in
a lithosphere thickening of the stretched margin as modelled in 1-D
by McKenzie (1978), but it also leads to a thermal heating driven
laterally from the hotter stretched margin towards the unstretched
part of the margin. This lateral heating induces a thermal thinning
of the lithosphere that is greater for the volcanic margins (�T =200 ◦C); then migrates towards the continent and finally disappears
progressively with time.
C© 2007 The Authors, GJI, 172, 464–476
Journal compilation C© 2007 RAS

Post-breakup passive margins thermal uplift 469
Figure 3. Thermal evolution of the lithosphere for two initial thermal configurations defined by �T = 0 and 200 ◦C, whith β = 6 and �x = 100 km. The
evolution is displayed for 0, 20, 60, 120 and 180 Ma after breakup of the margin. The upper white line fixes the radiogenic/non-radiogenic boundary, while
the lower white line defines the Moho depth. Twelve isotherms are plotted (one each 100 ◦C, from 0 to 1200 ◦C). The lateral progression of heating from the
thinner part of the margin towards the unstretched margin is highlighted by the black arrows. The horizontal and vertical length scales are the same and values
are given in kilometres. The base of the lithosphere in the stable unstretched continent is around 100 km.
3.2 Lithosphere thickness evolution and inferred vertical
motion of the margin
The time evolution of the lithosphere thicknesses in two vertical
cross-sections, located in the stretched and unstretched parts of the
margins, are displayed on Fig. 4. The location of the two vertical
cross-sections where the measurements have been done are reported
on Fig. 2 (point A at x = 25 km for the stretched lithosphere and point
B at x = 250 km for the unstretched lithosphere). The lithosphere
thicknesses are inferred from the 2-D results of Fig. 3. From the
lithosphere thickness evolution, the vertical motion of a point in
the passive margin is estimated by classical isostatic equilibrium.
Starting with a lithosphere thickness of HL0and a mean temperature
of TL/2, a given change in lithosphere thickness �z yields a change
in the topography �h. Isostatic equilibrium yield:
ρ0g(1 − α TL
2
)L0 = ρ0g
(1 − α TL
2
)× (L0 + �h − �z) + ρ0g�z,
(6)
where α is the coefficient of thermal expansion. The left-hand side
term of the equation corresponds to the pressure at the base of the
lithosphere of thickness Lo and of mean temperature TL/2. The right-
hand side term corresponds to the pressure at a depth of �z below
the new base of the lithosphere that has moved from L0 to L0 − �zwith respect to the surface that is now at �h.
This equation yields to the simple following relationship:
�h = αTL
2�z (7)
with α = 3.28 10−5 ◦K−1 and TL = 1200 ◦C, we get:
�h = 0.02 �z. (8)
Thus a 10 km rise in the 1200 ◦C isotherm implies an uplift of
200 m.
Because the vertical motion of the margin �h is directly related
to the change in lithosphere thicknesses �z, the time evolution of
�h and of the lithosphere thickness are exactly the same and are
thus reported in the same plot with two distinct scales (Fig. 4).
Thickening of lithosphere through time corresponds to subsidence
while thinning is related to uplift.
C© 2007 The Authors, GJI, 172, 464–476
Journal compilation C© 2007 RAS

470 M. Leroy, F. Gueydan and O. Dauteuil
Figure 4. Lithosphere thickness evolution in two parts of the model (Sections A and B located in Fig. 2), during thermal re-adjustment and related sub-
sidence/uplift. Lithosphere thickening/subsidence are observed in the stretched part of the margin (Section A in Fig. 2 and in inset), whereas lithosphere
thinning/uplift occurs in early stages in the unstretched part (Section B in Fig. 2 and in inset).
In the stretched part of the model (Section A, left-hand side part
of Fig. 4), the lithosphere thickness increases during the thermal re-
adjustment for the two models (�T = 0 and 200 ◦C). The thickening
and subsequent margin subsidence is fast during the first 100 Ma
(Fig. 4, left) and very similar for the two types of margins with a
80 km lithosphere thickening. This similarity is consistent with the
findings of McKenzie (1978) that shows that the post breakup sub-
sidence depends on β, which is the same for the two study models.
A little delay in time is however observed between the two curves
in early stages. The thickening/subsidence of non-volcanic margins
(�T = 0 ◦C) is more efficient between 0 and 100 Ma than that of
the volcanic margin (�T = 200 ◦C). This difference is explained
by a larger lateral conduction in the volcanic margin, leading to
a more pronounced lithosphere thinning in the unstretched part of
the margin. The timing of the modelled subsidence is also con-
sistent with the results of McKenzie (1978). The final amount of
subsidence we obtain (1700 m) is however 500 m smaller than his
estimation because we take into account the horizontal heat transfers
but not the density variations in layers. The subsidence in volcanic
models (�T = 200 ◦C) is delayed compared to non-volcanic models
(�T = 0 ◦C) due to increase of lateral heating. The thermal anomaly
�T seems, therefore, to control the subsidence rate.
In the unstretched margin (Section B, right-hand side part of
Fig. 4), the lithosphere thickness decreases in the first tens of mil-
lion years following the breakup, leading to passive margin uplift,
and then increases to tend towards the stable thickness of 100 km.
Large differences in lithosphere thinning and subsequent margin
uplift are here observed between volcanic and non-volcanic mar-
gins. The lithosphere thickness of volcanic margin decreases from
100 to 88 km in 50 Ma (240 m of uplift) while the non-volcanic
lithosphere thickness only attains 94 km (120 m of uplift) during 75
Ma. The maximum of thinning is obtained earlier for the volcanic
margins (�T = 200 ◦C) with larger values than for non-volcanic
margins. The passive margin uplift is approximately twice larger
for �T = 200 ◦C than that for �T = 0 ◦C (Fig. 5). The uplift
ceases after ∼80 Ma in the non-volcanic margin (NVM) and after
∼40 Ma in the volcanic margin (VM). After this thinning stage,
the lithosphere thickness increases in the two models and the stable
lithosphere thickness of around 100 km is reached after 280 Ma for
the non-volcanic margins, and after 320 Ma for the volcanic mar-
gins. Consequently, the margin topography progressively decreases
as a consequence of the subsidence.
Two different stages thus characterize the margin topography in
its unstretched part: first an uplift during the first 40–80 Ma after
breakup due to lateral heating that is followed by a general subsi-
dence that tends to progressively erase the margin topography. The
maximum amount of lateral heating and consequently of lithosphere
thinning and associated margin uplift are highly controlled by the
thermal sublithospheric anomaly �T , and therefore, by the initial
thermal state of the margin.
3.3 Maximum amount of uplift: parametric study
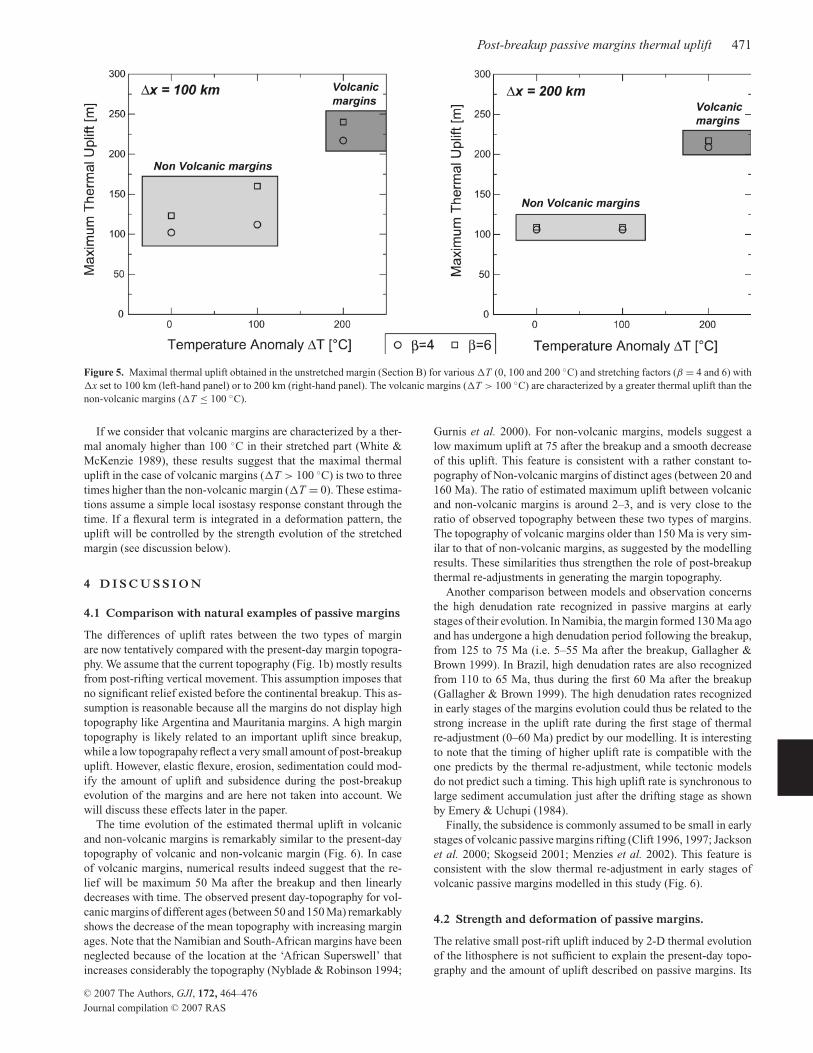
Fig. 5 displays the effect of the three parameters (�T , �x and β)
on the amount of maximal thermal uplift in metres computed in the
unstretched margin. The thermal anomaly beneath the margin �Thas the major influence, while �x and β has little effect on margin
uplift.
A decrease in β (from 6 to 4) leads to a smaller uplift in the
unstretched lithosphere. For �x = 100 and �T = 100, the uplift is 50
m smaller forβ =4, than forβ =6. Forβ =4, the initial thermal state
of the stretched lithosphere is indeed colder and induces, therefore,
smaller lateral heat transfers.
The effect of �x, the horizontal distance over which stretching
occurs, is the opposite of the effect of β: a decrease of �x induces
a slight increase in the amount of uplift by a few tens of metres. For
a smaller �x, the heat conducted laterally has a shorter distance to
cover, between stretched and unstretched margin and has less time to
dissipate. The uplift is thus greater and occurs earlier. In summary,
the more β is high and �x is small, the more the maximal uplift is
great. Consequently, a higher initial slope of the margin leads to a
greater uplift.
The effect of �T has been discussed in the previous sections: an
increase in �T leads to a significant increase in the amount of uplift.
The uplift for �T = 200 ◦C is almost twice that for �T = 0–100◦C, independently of the values of �x and β (Fig. 5).
C© 2007 The Authors, GJI, 172, 464–476
Journal compilation C© 2007 RAS
Post-breakup passive margins thermal uplift 471
Figure 5. Maximal thermal uplift obtained in the unstretched margin (Section B) for various �T (0, 100 and 200 ◦C) and stretching factors (β = 4 and 6) with
�x set to 100 km (left-hand panel) or to 200 km (right-hand panel). The volcanic margins (�T > 100 ◦C) are characterized by a greater thermal uplift than the
non-volcanic margins (�T ≤ 100 ◦C).
If we consider that volcanic margins are characterized by a ther-
mal anomaly higher than 100 ◦C in their stretched part (White &
McKenzie 1989), these results suggest that the maximal thermal
uplift in the case of volcanic margins (�T > 100 ◦C) is two to three
times higher than the non-volcanic margin (�T = 0). These estima-
tions assume a simple local isostasy response constant through the
time. If a flexural term is integrated in a deformation pattern, the
uplift will be controlled by the strength evolution of the stretched
margin (see discussion below).
4 D I S C U S S I O N
4.1 Comparison with natural examples of passive margins
The differences of uplift rates between the two types of margin
are now tentatively compared with the present-day margin topogra-
phy. We assume that the current topography (Fig. 1b) mostly results
from post-rifting vertical movement. This assumption imposes that
no significant relief existed before the continental breakup. This as-
sumption is reasonable because all the margins do not display high
topography like Argentina and Mauritania margins. A high margin
topography is likely related to an important uplift since breakup,
while a low topograpahy reflect a very small amount of post-breakup
uplift. However, elastic flexure, erosion, sedimentation could mod-
ify the amount of uplift and subsidence during the post-breakup
evolution of the margins and are here not taken into account. We
will discuss these effects later in the paper.
The time evolution of the estimated thermal uplift in volcanic
and non-volcanic margins is remarkably similar to the present-day
topography of volcanic and non-volcanic margin (Fig. 6). In case
of volcanic margins, numerical results indeed suggest that the re-
lief will be maximum 50 Ma after the breakup and then linearly
decreases with time. The observed present day-topography for vol-
canic margins of different ages (between 50 and 150 Ma) remarkably
shows the decrease of the mean topography with increasing margin
ages. Note that the Namibian and South-African margins have been
neglected because of the location at the ‘African Superswell’ that
increases considerably the topography (Nyblade & Robinson 1994;
Gurnis et al. 2000). For non-volcanic margins, models suggest a
low maximum uplift at 75 after the breakup and a smooth decrease
of this uplift. This feature is consistent with a rather constant to-
pography of Non-volcanic margins of distinct ages (between 20 and
160 Ma). The ratio of estimated maximum uplift between volcanic
and non-volcanic margins is around 2–3, and is very close to the
ratio of observed topography between these two types of margins.
The topography of volcanic margins older than 150 Ma is very sim-
ilar to that of non-volcanic margins, as suggested by the modelling
results. These similarities thus strengthen the role of post-breakup
thermal re-adjustments in generating the margin topography.
Another comparison between models and observation concerns
the high denudation rate recognized in passive margins at early
stages of their evolution. In Namibia, the margin formed 130 Ma ago
and has undergone a high denudation period following the breakup,
from 125 to 75 Ma (i.e. 5–55 Ma after the breakup, Gallagher &
Brown 1999). In Brazil, high denudation rates are also recognized
from 110 to 65 Ma, thus during the first 60 Ma after the breakup
(Gallagher & Brown 1999). The high denudation rates recognized
in early stages of the margins evolution could thus be related to the
strong increase in the uplift rate during the first stage of thermal
re-adjustment (0–60 Ma) predict by our modelling. It is interesting
to note that the timing of higher uplift rate is compatible with the
one predicts by the thermal re-adjustment, while tectonic models
do not predict such a timing. This high uplift rate is synchronous to
large sediment accumulation just after the drifting stage as shown
by Emery & Uchupi (1984).
Finally, the subsidence is commonly assumed to be small in early
stages of volcanic passive margins rifting (Clift 1996, 1997; Jackson
et al. 2000; Skogseid 2001; Menzies et al. 2002). This feature is
consistent with the slow thermal re-adjustment in early stages of
volcanic passive margins modelled in this study (Fig. 6).
4.2 Strength and deformation of passive margins.
The relative small post-rift uplift induced by 2-D thermal evolution
of the lithosphere is not sufficient to explain the present-day topo-
graphy and the amount of uplift described on passive margins. Its
C© 2007 The Authors, GJI, 172, 464–476
Journal compilation C© 2007 RAS

472 M. Leroy, F. Gueydan and O. Dauteuil
Figure 6. Mean height of volcanic and non-volcanic passive margins plotted as a function of the age of the margins compared to the thermal maximum uplift
computed with our model (�x = 100 km, β = 6 and �T = 0 and 200 ◦C for non volcanic margin and volcanic margin, respectively). Except for two margins
located in southern Africa and possibly submitted to the ‘Superswell’ effects, the topography evolution trend is similar with the thermal uplift computed in our
models.
contribution may amount to 10–25 per cent of the whole uplift. This
value shows that this process is not negligible. Others mechanisms
should thus be evoked to explain higher amount of uplift, such as
flexure response, small scale convection, tectonic stresses (far-field
stress like ridge-push), lower crustal flow towards the rift flanks,
and middle crustal flow towards the rift centre or mantle plumes
(Gilchrist & Summerfield 1990; Gilchrist et al. 1994; Van Der Beek
et al. 1995; Beaumont et al. 2000; Burov & Poliakov 2001; Huis-
mans et al. 2001; Leroy et al. 2004). Our estimate of uplift and sub-
sidence should thus be seen as a minimum estimate. Post-breakup
flexure of the margin, triggered by horizontal far-field stresses and
by loading of the stretched part (subsidence/sedimentation) and un-
loading of the unstretched part (erosion) of the margin, is the most
evoked mechanisms to explain margin uplift (Watts & Ryan 1976;
Bott 1996). To better constrain this effect on vertical motions, a mod-
elling of 2-D flexure with an elastic thickness that varies in time and
laterally along the margin because of transient thermal evolution is
absolutely required. The interest of the present 2-D thermal mod-
elling is to provide quantification of the strength and of the elastic
thickness of the passive margin through time, which is crucial to
accurately model the 2-D flexural response of the margin. From
the 2-D thermal states of the margin, we computed the strength of
the margin using brittle rheology and ductile flow laws described in
Table 2. From these estimates, we have defined the continent/margin
strength ratio that is the ratio of the overall strength of the un-
stretched part (computed as the depth integral of strength in profile B,
Fig. 2) over the overall strength of the stretched part (computed in
profile A, Fig. 2) (Fig. 7a). Similarly, from the 2-D thermal states,
the elastic thickness of the margin has been estimated by the depth
of the 450 ◦C isotherm (Pinet et al. 1991). As a consequence, the
elastic thickness Te is a linear function of the Moho temperature and
thus reflects the integrated strength of the continental lithosphere for
a flexural response of long-term geological loads (Burov & Watts
2006). A decrease of the Moho temperature will induce an increase
of Te. Using the 2-D thermal state of the margin through time, we
have computed the ratio of Te in the unstretched continental part
over Te in the stretched margin (Fig. 7b).
The time evolution of the continent/margin strength ratio is very
similar for both margins (Fig. 7a). Immediately after the breakup,
this ratio is around 600 for the two margins and then rapidly de-
creases. During the early stage of margins evolution, the unstretched
part is much stronger than the stretched part. A strength ratio inver-
sion occurs at 80 and 95 Ma for non-volcanic and volcanic margins,
respectively. After this time, the strength ratio is almost stable, the
stretched margin strength being slightly higher than the unstretched
margin strength. The time evolution of the continent/margin elastic
thickness ratio shows similar feature with different timing. Immedi-
ately after the breakup, the elastic thickness of the continent is 1.5–3
times larger than the elastic thickness of the margin, because of local
heating in the rifted region. After 15–30 Ma, the elastic thickness
of the margin becomes larger than the elastic thickness of the conti-
nent because of progressive and faster cooling of the rifted margin
and because of a lower crustal thickness. The change of the elastic
thickness ratio is faster than the change of the strength ratio because
C© 2007 The Authors, GJI, 172, 464–476
Journal compilation C© 2007 RAS

Post-breakup passive margins thermal uplift 473
Figure 7. (a) Ratio of the strength of the unstretched part of the margin over the strength of the stretched part of the margin (continent-to-margin strength
ratio) as a function of time. The integrated lithosphere strength is estimated from the 2-D thermal states, using rheological parameters given in Table 2 in the
unstretched part (profile B of Fig. 2) and in the stretched part (profile A, Fig. 2). (b) Ratio of the elastic thickness of the unstretched part of the margin over the
elastic thickness of the stretched part of the margin as a function of time.
elastic thickness is lineraly related to the Moho temperature while
the integrated strength of the margin reflects crustal and mantle
strength, that are non linearly dependant on the Moho temperature.
From these results, the style of margin deformation should consid-
erably vary through time. This strengthening of stretched margin
controls a flexural response of the margin that should be different in
the rifted part and in the undeformed part of the margin. The style
of elastic deformation will be a function of the elastic thickness,
Te. During the first 20 Ma of the post-breakup history, Te of the
stretched margin is low compared to that of the continent; leading
to elastic deformation with low wavelengths while in the continent,
larger wavelengths should dominate. The opposite is expected for
time larger than 20 Ma. Further numerical models are required to
quantify these effects.
Fig. 8 presents a synthetic view of the time evolution of the topo-
graphy, temperature, strength, and deformation of the two types of
margins. In early stages (phase 1, between 0 and ∼80 Ma), thermal
subsidence and thermal uplift occurs in the stretched and unstretched
part of the margins, respectively, because of thermal re-adjustment
and lateral heating. Consequently, the vertical load applied to the
margin drastically changes along the margin from a downward load
in the stretched part to a upward load in the unstretched part. This
large difference will increase with time and could trigger flexure
of the margin. Flexural deformation of the margin could enhance
subsidence and uplift. Flexural response will be maximum in the
less resistant part of the margin that is at that time the stretched
part. The differential applied load is maximum for volcanic margin,
and thus flexure and uplift enhancement is expected to be maximum
for the volcanic margin. The timing of these processes is faster for
volcanic margin. In later stages (phase 2, after 80 Ma, Fig. 8) the
entire margin undergoes subsidence that explains the decrease of
the topography in the unstretched part of the margin where uplift
previously prevailed. Lateral differences in vertical load applied to
the margin still exist because of the non-horizontality of the base of
the lithosphere. However, these lateral variations in applied load are
significantly less than that of early stage. Consequently, the flexural
response of the margin will be less favoured, and uplift and sub-
sidence less enhanced. At these times, the unstretched part of the
margin becomes the less resistant part of the margin. An applied
horizontal stress (far field stresses like ridge-push) would induce
an important deformation in this part of the margin and thus ex-
plain a possible tectonic uplift at these times. 2-D modelling that
will combine thermal, strength and flexural evolution of the margin
would be now crucial to accurately understand margin topography.
The present 2-D thermal modelling should be seen here as primary
models to document the impact of lateral variations in temperature
and strength through time during the post-breakup evolution of a
passive margin.
5 C O N C L U S I O N
A 2-D finite element numerical model was performed to evaluate the
vertical and horizontal conductive thermal evolution of continental
passive margins, from the breakup to the late thermal equilibrium,
and its role on the post-rift topography of volcanic and non-volcanic
passive margins. The main results are:
1. The thermal evolution occurs in two phases. The first phase
occurs between 0 and 80 Ma after the breakup and is characterized
by a thermal thinning of the unstretched lithosphere, and by a ther-
mal thickening in the stretched continental lithosphere. The second
phase occurs after 80 Ma and is characterized by the thickening of
the continental lithosphere in both zones.
2. Thermal thickening and thermal thinning lead to subsidence
and uplift, respectively. The thermal uplift induced by isostatic
movements is up to 250 m in the landward part of the volcanic
C© 2007 The Authors, GJI, 172, 464–476
Journal compilation C© 2007 RAS

474 M. Leroy, F. Gueydan and O. Dauteuil
Figure 8. Schematic drawing of the time evolution of the vertical motion of the margin inferred by 2-D thermal re-adjustments. The strength evolution, the
flexural response and subsequent increase in vertical motion of the margin are also reported for the two stages of the margin evolution.
margins and is about twice the computed uplift for non-volcanic
margins.
3. The numerical results are qualitatively consistent with the to-
pographic observations of passive margins in nature. The volcanic
passive margins are indeed two to three times higher than non-
volcanic margins but both margins are three to four times more
elevated in nature than in the model predictions. The thermal con-
duction contribution to the uplift may be small (10–25 per cent) and
others deformation mechanisms, such as flexure, small-scale con-
vection and tectonic movements, should play an important role in
vertical movements.
4. The inferred time evolution of the margin topography are con-
sistent with natural data. We have inferred maximum relief of the
margin after 40–80 Ma after the breakup and then a linear decrease
of the margin topography with time.
5. The stretched part of the continental margin is weaker than
the undeformed continent just after the breakup and progressively
becomes stronger than the undeformed continent. The elastic thick-
ness and the strength of the stretched margin becomes larger than the
elastic thickness and the strength of the undeformed continent after
20 and 80 Ma, respectively. This strength inversion during the post-
breakup history of the passive margin should have major impacts in
terms of vertical movements of the margin and more generally in
terms of style of deformation.
A C K N O W L E D G M E N T S
We thank R. Huismans and an anonymous reviewer for their com-
ments on a previous version of this manuscript. Fruitful discus-
sions with Michel Rabinowicz help us to improve this manuscript.
Groupement de Recherche ‘GDR Marges – volet Marges Anci-
ennes’, funded this work.
R E F E R E N C E S
Banda, E., Gallart, J., Garcia-Duenas, V., Danobeitia, J.J. & Makris, J., 1993.
Lateral variation of the crust in the Iberian peninsula: new evidence from
the Betic Cordillera, Tectonophysics, 221, 53–66.
Bauer, K. et al., 2000. Deep structure of the Namibia continental margin as
derived from integrated geophysical studies, J. geophys. Res., 105(B11),
25 829–25 853.
Beaumont, C., Keen, C.E. & Boutillier, R., 1982. Comparison of fore-
land and Atlantic type basins, Phil. Trans. Roy. Soc. Lond. A, 305, 295–
317.
C© 2007 The Authors, GJI, 172, 464–476
Journal compilation C© 2007 RAS

Post-breakup passive margins thermal uplift 475
Beaumont, C., Kooi, H. & Willett, S., 2000. Coupled tectonic-surface process
models with applications to rifted margins and collisional orogens, in
Geomorphology and Global Tectonics, pp. 29–55, ed. Summerfield, M.A.,
John Wiley & Sons, Chichester.
Boillot, G., 1979. Geologie des Marges Continentales, 139 pp, Masson,
Paris.
Boldreel, L.O. & Andersen, M.S., 1998. Tertiary compressional structures
on the Faroe-Rockall Plateau in relation to northeast Atlantic ridge-push
and Alpine foreland stresses, Tectonophysics, 300, 13–28.
Bott, M.P.H., 1996. Flexure associated with planar faulting, Geophys. J. Int.,126, F21–F24.
Boutilier, R.R. & Keen, C.E., 1999. Small-scale convection and divergent
plate boundaries, J. geophys. Res., 104(B4), 7389–7403.
Braun, J. & Beaumont, C., 1989. A physical explanation of the relation
between flank uplifts and the breakup unconformity at rifted continental
margins, Geology, 17, 760–764.
Brun, J.P., 1999. Narrow rifts versus wide rifts: inferences for the mechanics
of rifting from laboratory experiments, Phil. Trans. Roy. Soc. Lond., 357,695–712.
Buck, W.R., 1986. Small-scale convection induced by passive rifting: the
cause for uplift of rift shoulders, Earth Planet. Sci. Lett., 77, 362–372.
Burke, K., 1996. The African Plate, South African J. Geol., 99(4), 341–
409.
Burov, E. & Poliakov, A., 2001. Erosion and rheology controls on synrift
and postrift evolution: verifying old and new ideas using a fully coupled
numerical model, J. geophys. Res., 106(B8), 16 461–16 481.
Burov, E. & Watts, A.B., 2006. The long-term strength of continental litho-
sphere: “jelly sandwich” or “creme brulee”?, GSA Today, 16, 1.
Chery, J., Lucazeau, F., Daignieres, M. & Vilotte, J.P., 1992. Large uplift
of rift flanks: a genetic link with lithospheric rigidity, Earth Planet. Sci.Lett., 112(1–4), 195–211.
Clift, P., 1996. Plume tectonics as a cause of mass wasting on the southeast
Greenland continental margin, Marine Petrol. Geol., 13(7), 771–780.
Clift, P.D., 1997. Temperature anomalies under the Northeast Atlantic rifted
volcanic margins, Earth Planet. Sci. Lett., 146, 195–211.
Cloetingh, S., Gradstein, F.M., Kooi, H., Grant, A.C. & Kaminski, M., 1990.
Plate reorganisation: a cause of rapid late Neogene subsidence and sedi-
mentation around the North Atlantic?, J. Geol. Soc. Lond., 147, 495–506.
Cobbold, P.R., Meisling, K.E. & Mount, S.V., 2001. Reactivation of an
obliquely-rifted margin. Campos and Santos basins, SE Brazil, Am. Assoc.Petr. Geol., 85(11), 1925–1944.
Cochran, J.R., 1983. Effects of finite rifting times on the development of
sedimentary basins, Earth Planet. Sci. Lett., 66, 289–302.
Coffin, M.F. & Eldholm, O., 1992. Volcanism and continental break-up: a
global compilation of large igneous provinces, in Magmatism and theCauses of Continental Break-Up, pp. 17–30, eds Storey, B.C., Alabaster,
T. & Pankhurst, R.J., Geological Society Special Publications, London.
Dore, A.G. & Lundin, E.R., 1996. Cenozoic compressional structures on the
NE Atlantic margin: nature, origin and potential significance for hydro-
carbon exploration, Petrol. Geosci., 2, 299–311.
Eldholm, O., 1991. Magmatic-tectonic evolutions of a volcanic rifted margin,
Marine Geol., 102, 43–61.
Eldholm, O., Gladczenko, T.P., Skogseid, J. & Planke, S., 2000. Atlantic
volcanic margins: a comparative study, in Dynamics of the NorwegianMargin, pp. 411–428, ed. Nottvedt, A., Geological Society of London
Special Publications, London.
Emery, K.O. & E. Uchupi, 1984, The Geology of the Atlantic Ocean, 1050
pp., Springer Verlag, Berlin.
Fjeldskaar, W., Lindholm, C., Dehls, J.F. & Fjeldskaar, I., 2000. Postglacial
uplift, neotectonics and seismicity in Fennoscandia, Quater. Sci. Rev., 19,1413–1422.
Gadd, S.A. & Scrutton, R.A., 1997. An integrated thermomechanical model
for transform continental evolution, Geo-Marine Lett., 17, 21–30.
Gallagher, K. & Brown, R., 1999. The mesozoic denudation history of the
Atlantic margins of southern Africa and southeast Brazil and the rela-
tionship to offshore sedimentation, in The Oil and Gas Habitats of theSouth Atlantic, pp. 41–53, eds Cameron, N.R., Bate, R.H., & Clure, V.S.,
Geological Society of London Special Publications, London.
Geoffroy, L., 2001. The structure of volcanic margins: some problematics
from the North-Atlantic/Labrador-Baffin system, Marine Petrol. Geol.,18, 463–469.
Gilchrist, A.R. & Summerfield, M.A., 1990. Differential denudation and
flexural isostasy in formation of rifted-margin upwarps, Nature, 346, 739–
742.
Gilchrist, A.R., Kooi, H. & Beaumont, C., 1994. Post-Gondwana geomor-
phic evolution of southwestern Africa: implications for the controls on
landscape development from observations and numerical experiments, J.geophys. Res., 99(B6), 12 211–12 228.
Gladczenko, T.P., Hinz, K., Eldholm, O., Meyer, H., Neben S. & Skogseid, J.,
1997. South-Atlantic volcanic margins, J. Geol. Soc. Lond., 154, 465–470.
Gunnel, Y. & Fleitout, L., 2000. Morphotectonic evolution of the Western
Ghats India, in Geomorphology and Global Tectonics, pp. 89–121, ed.
Summerfield, M.A., John Wiley & Sons, Chichester.
Gurnis, M., Mitrovica, J.X., Ritsema, J. & Heijst, H.J.V., 2000. Constraining
mantle density structure using geological evidence of surface uplift rates:
the case of the African Superplume, Geochem., Geophys., Geosys., 1,
doi:1999GC000035.
Hansen, D.L. & Nielsen, S.B., 2002. Does thermal weakening explain basin
inversion? Stochastic modelling of the thermal structure beneath sedi-
mentary basins, Earth Planet. Sci. Lett., 198, 113–127.
Hopper, J.R. & Buck, W.R., 1996. The effect of lower crustal flow on conti-
nental extension and passive margin formation. J. Geophys. Res. – SolidEarth, 101(A10), 21–795, doi:96JB01644.
Hopper, J.R. & Buck, W.R., 1998. Styles of extensional decoupling. Geology,26(8), 699–702.
Hudec, M.R. & Jackson, M.P.A., 2002. Structural segmentation, inversion,
and salt tectonics on a passive margin: evolution of the Inner Kwanza
Basin, Angola, Geol. Soc. Am. Bull., 114(10), 1222–1244.
Huismans, R.S., Podladchikov, Y.Y. & Cloetingh, S., 2001. Transition from
passive to active rifting: relative importance of asthenospheric doming
and passive extension of the lithosphere, J. geophys. Res., 106(B6), 11
271–11 291.
Jackson, M.P.A., Cramez, C. & Fonck, J.M., 2000. Role of subaerial vol-
canic rocks and mantle plumes in creation of South Atlantic margins:
implications for salt tectonics and source rocks, Marine Petrol. Geol., 17,477–498.
Japsen, P. & Chalmers, J.A., 2000. Neogene uplift and tectonics around the
North Atlantic: overview, Global Planet. Change, 24, 165–173.
Karato, S.-I. & Wu, P., 1993. Rheology of the upper mantle: a synthesis.
Science, 260, 771–778.
Karner, G.D., 1985. Thermally induced residual topography within oceanic
lithospere. Nature, 318, 527–532.
Keen, C.E. & Boutillier, R.R., 2000. Interaction of rifting and hot horizontal
plume sheets at volcanic margins. J. geophys. Res., 105(B6), 13 375–13
387.
King, S.D. & Anderson, D.L., 1998. Edge-driven convection, Earth Planet.Sci. Lett., 160, 289–296.
Kruse, S., McNutt, M., Phipps-Morgan, J. & Royden, L., 1991. Lithospheric
extension near Lake Mead, Nevada – a model for ductile flow in the lower
crust, J. geophys. Res., 96, 4435–4456.
Leroy, M., Dauteuil, O. & Cobbold, P. 2004. Compression of passive mar-
gins: controls from oceanic lithosphere rheology, Geophys. J. Int., 159,400–411.
McKenzie, D., 1978. Some remarks on the development of sedimentary
basins, Earth Planet. Sci. Lett., 40, 25–32.
Menzies, M.A., Klemperer, S.I., Ebinger, C.J. & Baker, J., 2002. Char-
acteristics of volcanic rifted margins, Geol. Soc. Am. Special paper,
pp. 14.
Mohriak, W.U. & Dewey, J.F., 1987. Deep seismic reflectors in the Campos
basin, offshore Brazil, Geophys. J. Roy. Astronom. Soc., 89(1), 133–140.
Mosar, J., Lewis, G. & Torsvik, T.H., 2002. North Atlantic sea-floor spread-
ing rates: implications for the Tertiary development of inversion structures
of the Norwegian-Greenland Sea, J. Geol. Soc. Lond., 159, 503–515.
Nielsen, T.K. & Hopper, J.R., 2002. Formation of volcanic rifted margins:
are temperatures anomalies required? Geophys. Res. Lett., 29(21), 2002,
doi:10.1029/2002GL015681.
C© 2007 The Authors, GJI, 172, 464–476
Journal compilation C© 2007 RAS

476 M. Leroy, F. Gueydan and O. Dauteuil
Nyblade, A.A. & Robinson, S.W., 1994. The African superswell, Geophys.Res. Lett., 21(9), 765–768.
Parsons, B. & Sclater, J.G., 1977. An analysis of the variation of ocean floor
bathymetry and heat flow with age. J. geophys. Res., 82, 803–827.
Partridge, T.C. & Maud, R.R., 1987. Geomorphic evolution of southern
Africa since the Mesozoic, South African J. Geol., 90(2), 179–208.
Pinet, C., Jaupart, C., Mareschal, J.C., Gariepy, C., Benfait, G. & Lapointe,
R., 1991. Heat flow and structure of the lithosphere in the eastern Canadian
Shield, J. geophys. Res., 96, 19 941–19 963.
Price, S., Brodie, J., Whitham, A. & Kent, R., 1997. Mid-Tertiary rifting and
magmatism in the Traill Ø region, East Greenland, J. Geol. Soc. Lond.,154, 419–434.
Ranalli, G., 1995. Rheology of the Earth. Chapman & Hall, London.
Ransome, I.G.D. & de Wit, M.J., 1992. Preliminary investigations into a
microplate model for the South Western Cape, in Inversion Tectonics ofthe Cape Fold Belt, Karoo and Cretaceous Basins of Southern Africa,pp. 257–267, eds de Wit, M.J. & Ransome, I.G.D., Balkema, Rotterdam,
Holland.
Rowley, D.B. & Sahagian, D., 1986. Depth-dependent stretching: a different
approach. Geology, 14, 32–35.
Ruppel, C., 1995. Extensional processes in continental lithosphere, J. geo-phys. Res., 100, 24 187–24 215.
Saenz, C.A.T., Hackspacher, P. C., Neto, J.C.H., Iunes, P.J., Guedes, S.,
Ribeiro, L.F.B. & Paulo, S.R., 2003. Recognition of cretaceous, paleocene,
and neogene tectonic reactivation through apatite fission-track analysis in
Precambrian areas of southeast Brazil: association with the opening of the
South-Atlantic Ocean, J. South Am. Earth Sci., 15(7), 765–774.
SARPP, 2003. Structural Analysis and Rock Physics Program, LMS, Ecole
Polytechnique, Palaiseau, France.
Skogseid, J., 2001. Volcanic margins: geodynamic and exploration aspects,
Marine Petrol. Geol., 18, 457–461.
Skogseid, J., Pedersen, T., Eldholm, O. & Larsen, B.T., 1992. Tectonism and
magmatism during NE Atlantic continental break-up: the Vøring Margin,
in Magmatism and the Causes of Continental Break-Up, pp. 305–320,
eds Storey, B.C., Alabaster, T. & Pankhurst, R.J., Geological Society of
London Special Publication, London.
Stein, C.A. & Stein, S., 1992. A model for the global variation in oceanic
depth and heat flow with lithospheric age, Nature, 359, 123–129.
Stuevold, L.M. & Eldholm, O., 1996. Cenozoic uplift of Fennoscandia
inferred from a study of the mid-Norwegian margin, Global Planet.Changes, 12, 359–386.
Vagnes, E., 1997. Uplift at thermo-mechanically coupled ocean-continent
transforms: modeled at the Senja Fracture Zone, southwestern Barents
Sea, Geo-Marine Lett., 17, 100–109.
Van Der Beek, P., Andriessen, P. & Cloetingh, S., 1995. Morphotectonicevo-
lution of rifted continental margins: inferences from a coupled tectonic-
surface processes model and fission track thermochronology, Tectonics,14, 406–421.
Van Wijk, J.W., Huismans, R.S., ter Voorde, M. & Cloetingh, S.A.P.L., 2001.
Melt generation at volcanic continental margins: no need for a mantle
plume? Geophys. Res. Lett., 28(20), 3995–3998.
Watts, A.B. & Ryan, W.B.F., 1976. Flexure of the lithosphere and continental
margin basins, Tectonophysics, 36, 25–44.
Weissel, J.K. & Karner, G.D., 1989. Flexural uplift of rift flanks due to
mechanical unloading of the lithosphere during extension. J. geophys.Res., 94(B10), 13 919–13 950.
White, R. & McKenzie, D., 1989. Magmatism at rift zones: the generation
of volcanic continental margins, J. geophys. Res., 94(B6), 7685–7729.
C© 2007 The Authors, GJI, 172, 464–476
Journal compilation C© 2007 RAS