Embed Size (px)
Citation preview
Makara J. Technol. 19/3 (2015), 127-132 doi: 10.7454/mst.v19i3.3044
December 2015 | Vol. 19 | No. 3 127
Uplift of Shoreline Regions on Pagai Island due to the September 12, 2007 Mw 8.4 Earthquake Captured by SAR Image
Ashar Muda Lubis
Department of Physics, Faculty of Mathematics and Natural Sciences, Universitas Bengkulu, Bengkulu 38371, Indonesia
e-mail: [email protected]
Abstract At least 25 people were killed by the September 12, 2007 Mw 8.4 Bengkulu earthquake, and many buildings were destroyed in Bengkulu and West Sumatra provinces. It is very important to estimate the earth surface deformation due to the earthquake to understand the rupture size and its process. The aim of this research is to estimate the shoreline change and vertical displacement on Pagai Island associated with the September 12, 2007 Mw 8.4 Bengkulu earthquake. The intensity of ALOS-PALSAR satellite images is used to access the pattern of displacement. The result shows that Pagai Island demonstrated huge uplift due to the earthquake. In general, the result of uplift in the shoreline regions derived from Synthetic Aperture Radar (SAR) image has a good agreement with other methods, such as in situ measurements, InSAR, and Global Positioning System (GPS) observations. This result implies that the earthquake fault location was very close to/around Pagai Island. Using this method, we can easily estimate the pattern of deformation in very remote and very wide areas without any equipment on the ground. The only limitation is the method cannot provide quantitative displacement.
Abstrak
Kenaikan Daerah Garis Pantai di Pulai Pagai akibat Gempa Bumi pada 12 September 2007 dari Pengamatan Citra SAR. Setidaknya sebanyak 25 orang meninggal dunia akibat gempa bumi Bengkulu yang berkekuatan 8,4 Mw pada tanggal 12 September 2007, kemudian banyak juga bangunan yang rusak di Provinsi Bengkulu dan Sumatera Barat. Oleh itu sangat diperlukan memperkirakan deformasi permukaan bumi akibat gempa bumi ini dalam rangka memahami besaran gempa dan prosesnya. Tujuan dari penelitian ini adalah untuk memperkirakan perubahan garis pantai dan deformasi tanah secara vertikal di Pulau Pagai yang berhubungan dengan gempa bumi Bengkulu pada tanggal 12 September, 2007. Pada penelitian ini, intensitas citra dari satelit ALOS PALSAR digunakan untuk mengetahui pola perubahan pada permukaan tanah. Hasil penelitian menunjukkan bahwa Pulau Pagai mengalami kenaikan keatas akibat gempa ini. Secara umum, pengangkatan permukaan tanah di daerah pantai yang diperoleh dari Synthetic Aperture Radar (SAR) image memiliki korelasi baik jika dibandingkan dengan metode lain, seperti dengan metode pengukuran di lapangan (in situ), metode InSAR, dan metode pengamatan Global Positioning System (GPS). Hasil ini menunjukkan bahwa lokasi sesar dari gempa ini berada sangat dekat dengan/disekitar Pulau Pagai. Dengan menggunakan metode ini, kita dapat dengan mudah memperkirakan pola deformasi di daerah yang sangat terpencil dan sangat luas tanpa dibutuhkan peralatan di lapangan. Satu-satunya batasan adalah metode tidak dapat memberikan nilai deformasi yang diperoleh kuantitatif. Keywords: displacement, earthquake, in situ observation, SAR 1. Introduction On September 12, 2007, two large earthquakes with moment magnitudes (Mw) of 8.4 and 7.8 occurred in the southwestern part of Sumatera Island. As a result, at least 25 people were killed, 161 people were injured, 52,522 buildings were damaged or destroyed, and roads were damaged in Bengkulu and West Sumatera provinces.
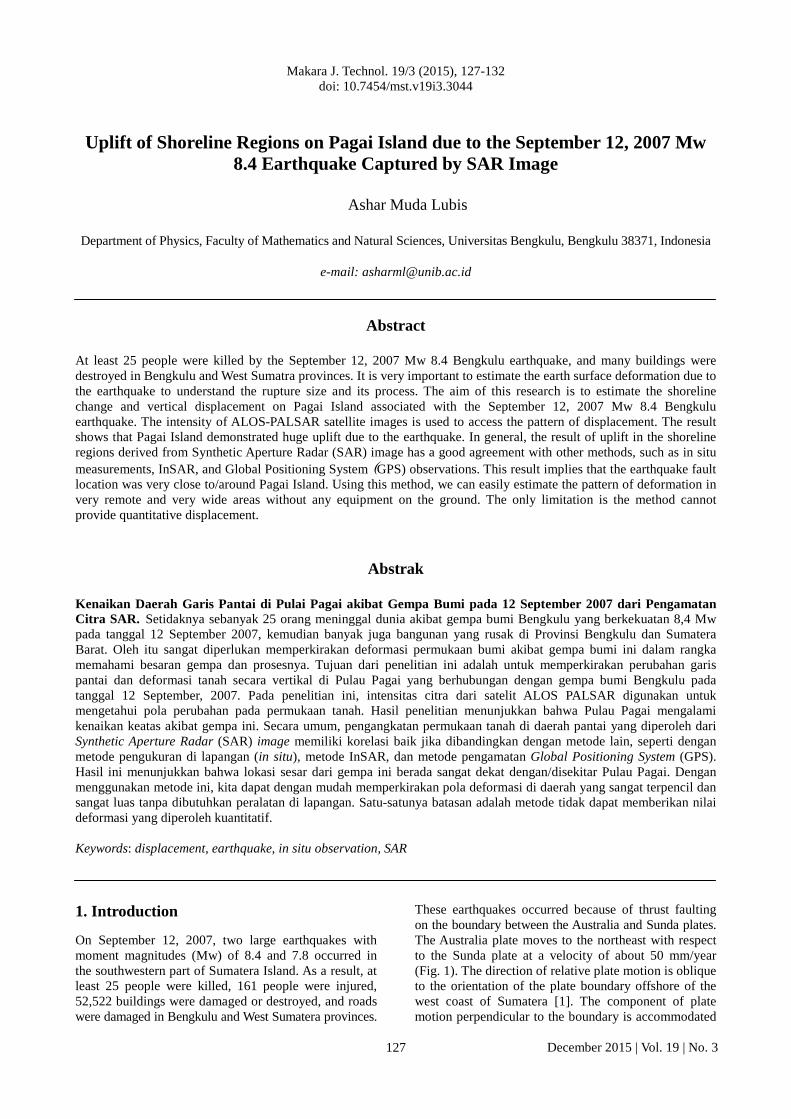
These earthquakes occurred because of thrust faulting on the boundary between the Australia and Sunda plates. The Australia plate moves to the northeast with respect to the Sunda plate at a velocity of about 50 mm/year (Fig. 1). The direction of relative plate motion is oblique to the orientation of the plate boundary offshore of the west coast of Sumatera [1]. The component of plate motion perpendicular to the boundary is accommodated
Lubis
Makara J. Technol. December 2015 | Vol. 19 | No. 3
128
by thrust faulting on the offshore plate boundary. Much of the component of plate motion parallel to the plate boundary is accommodated by strike-skip faulting on the Sumatera fault, which is inland on Sumatera Proper. The September 12, 2007 Mw 8.4 Bengkulu earthquake is the fourth earthquake of a magnitude greater than Mw 7.9 to have occurred in the past decade on or near the plate boundaries offshore of western Sumatera. This earthquake occurred just north of the source region of the Mw 7.9 Bengkulu earthquake on June 4, 2000. The September 12, 2007 Mw 7.8 earthquake occurred about 225 km northwest of the Mw 8.4 Bengkulu earthquake at the northern end of the aftershock zone. These two earthquakes and their aftershocks overlay the southern portion of the estimated 1833 rupture zone (Figure 1), which extends from approximately Eggano Island to the northern portion of Siberut Island. The great magnitude 9.2 earthquake of December 26, 2004, which produced the devastating Indian Ocean tsunami of that date, ruptured much of the boundary separating the India and Burma plates. Immediately to the south of the great 2004 earthquake zone, the Mw 8.6 Nias Island earthquake of March 28, 2005 ruptured a segment of the plate boundary separating the Australia and Sunda plates. After the occurrences of the December 26, 2004 earthquake, the Nias earthquake on March 28, 2005, and the September 12, 2007 Mw 8.4 Bengkulu earthquake, the Mentawai patch, the location of the latest great historical earthquake in 1797, remains a seismic gap (black rectangle on Figure 1) on the Sumatera Subduction zone, and it could rupture in the coming decades. Studying deformation data is one key to understanding earthquake mechanisms. Therefore, it is very important to assess the pattern of deformation due to the September 12, 2007 Mw 8.4 Bengkulu earthquake to understand the rupture area and its process. In this research, the uplift of the shoreline region and vertical deformation are investigated using Synthetic Aperture Radar (SAR) data. SAR uses a microwave, which has information of both the amplitude/intensity and phase. The intensity of the SAR images is utilized by comparing data before and after the earthquake to estimate the pattern of displacement. Principle of SAR measurement. The in situ observation cannot cover all the deformed areas, as it is difficult to enter some regions, in particular, very remote areas, and more time is needed to investigate many points. A promising method for obtaining the whole image of the crustal deformation along the rupture zones is remote sensing. Remote sensing techniques have been successfully applied for detecting surface changes caused by catastrophic events [2,3]. Moreover, various
SAR data sets have succeeded in detecting the pattern of vertical displacement of the great Mw 9.2 Sumatera–Andaman earthquake of December 2004 [4]. With a given distance, r, from the radar to the object, the measured received power, Pr, allows for the calculation of the backscatter coefficient, σo. In general, the backscattered power, Pr, received by the radar correlates to the transmitted power, Pt, as shown by the integral radar equation. If the antenna diagram is narrow enough (smaller than several degrees), the following approximate radar equation can be used [5]: where G is the antenna
amplification coefficient, λ is the wavelength, and )(0 θσ rt
is the coefficient of backscattering from a surface illuminated at an incidence angle of θ by the t-polarized wave when the r-polarized antenna receives radiation. The backscatter coefficient, σo, is equal to 10 × log10 (power ratio between transmitted and received). The backscatter coefficient, σo, is governed by soil properties that include the dielectric permittivity and surface geometry, known as the surface roughness. Surface roughness can change the radar response (backscattered intensity). Roughness is defined as the topographic expressions of surfaces at horizontal scales of centimeters to a few hundred meters. A single radar image is usually displayed as a grayscale image, but a
Figure 1. Plate Tectonic Setting in the Sumatera Region. The Numbers Represent the Years of the Occurrences of Historical Earthquakes. Two Balls indicate the Epicenters of the Occurrences of Two Large Earthquakes with Mws of 8.4 and 7.8
Uplift of Shoreline Regions on Pagai Island due to the September
Makara J. Technol. December 2015 | Vol. 19 | No. 3
129
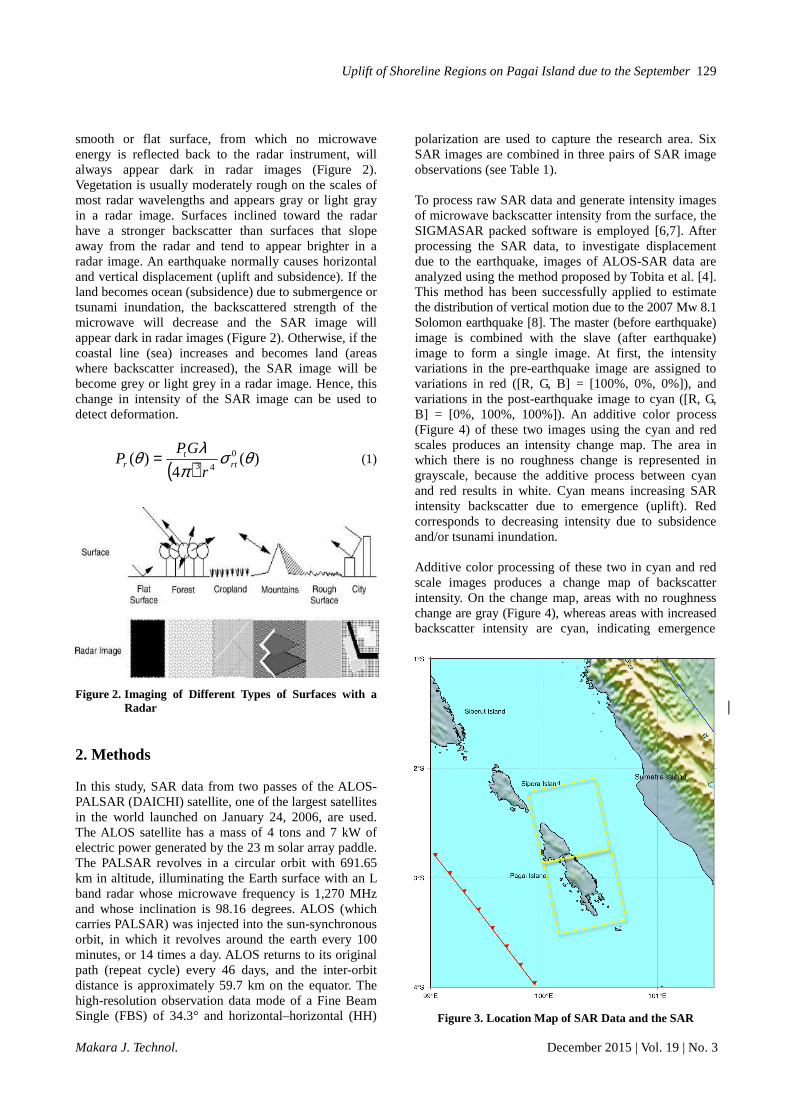
smooth or flat surface, from which no microwave energy is reflected back to the radar instrument, will always appear dark in radar images (Figure 2). Vegetation is usually moderately rough on the scales of most radar wavelengths and appears gray or light gray in a radar image. Surfaces inclined toward the radar have a stronger backscatter than surfaces that slope away from the radar and tend to appear brighter in a radar image. An earthquake normally causes horizontal and vertical displacement (uplift and subsidence). If the land becomes ocean (subsidence) due to submergence or tsunami inundation, the backscattered strength of the microwave will decrease and the SAR image will appear dark in radar images (Figure 2). Otherwise, if the coastal line (sea) increases and becomes land (areas where backscatter increased), the SAR image will be become grey or light grey in a radar image. Hence, this change in intensity of the SAR image can be used to detect deformation.
( ))(
4)( 0
43θσ
πλθ rt
tr
r
GPP =
(1)
Figure 2. Imaging of Different Types of Surfaces with a Radar
2. Methods In this study, SAR data from two passes of the ALOS-PALSAR (DAICHI) satellite, one of the largest satellites in the world launched on January 24, 2006, are used. The ALOS satellite has a mass of 4 tons and 7 kW of electric power generated by the 23 m solar array paddle. The PALSAR revolves in a circular orbit with 691.65 km in altitude, illuminating the Earth surface with an L band radar whose microwave frequency is 1,270 MHz and whose inclination is 98.16 degrees. ALOS (which carries PALSAR) was injected into the sun-synchronous orbit, in which it revolves around the earth every 100 minutes, or 14 times a day. ALOS returns to its original path (repeat cycle) every 46 days, and the inter-orbit distance is approximately 59.7 km on the equator. The high-resolution observation data mode of a Fine Beam Single (FBS) of 34.3° and horizontal–horizontal (HH)
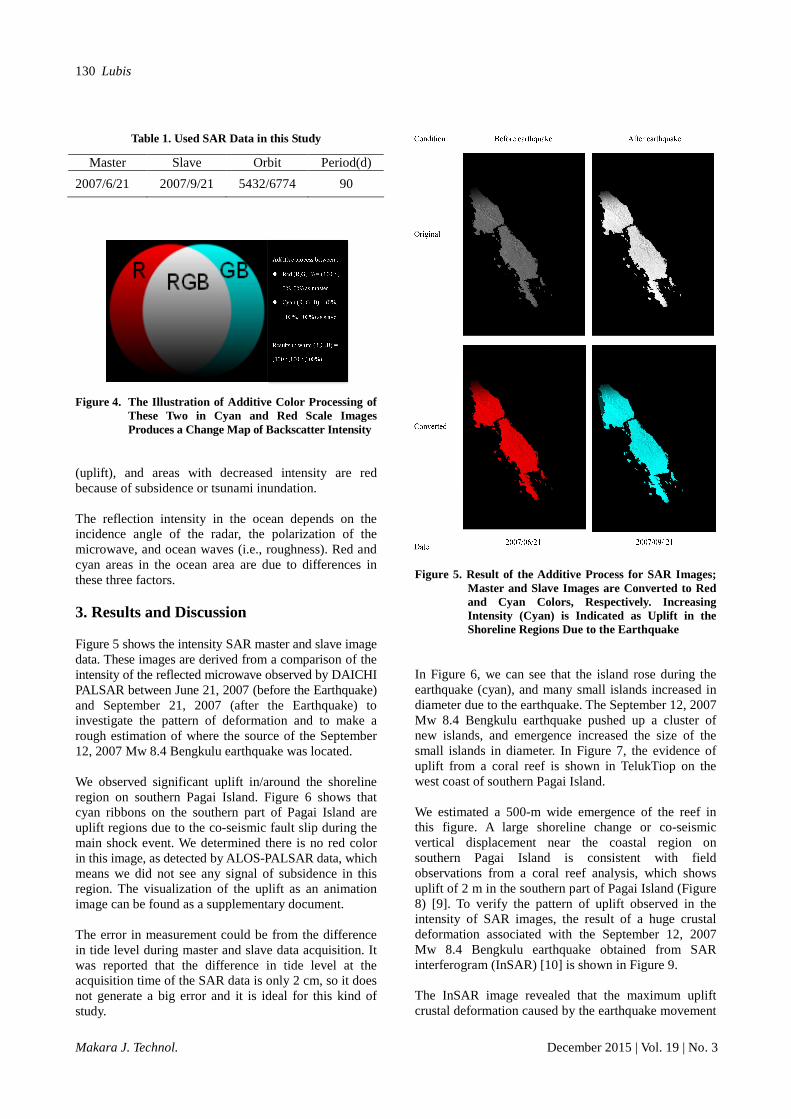
polarization are used to capture the research area. Six SAR images are combined in three pairs of SAR image observations (see Table 1). To process raw SAR data and generate intensity images of microwave backscatter intensity from the surface, the SIGMASAR packed software is employed [6,7]. After processing the SAR data, to investigate displacement due to the earthquake, images of ALOS-SAR data are analyzed using the method proposed by Tobita et al. [4]. This method has been successfully applied to estimate the distribution of vertical motion due to the 2007 Mw 8.1 Solomon earthquake [8]. The master (before earthquake) image is combined with the slave (after earthquake) image to form a single image. At first, the intensity variations in the pre-earthquake image are assigned to variations in red ([R, G, B] = [100%, 0%, 0%]), and variations in the post-earthquake image to cyan ([R, G, B] = [0%, 100%, 100%]). An additive color process (Figure 4) of these two images using the cyan and red scales produces an intensity change map. The area in which there is no roughness change is represented in grayscale, because the additive process between cyan and red results in white. Cyan means increasing SAR intensity backscatter due to emergence (uplift). Red corresponds to decreasing intensity due to subsidence and/or tsunami inundation. Additive color processing of these two in cyan and red scale images produces a change map of backscatter intensity. On the change map, areas with no roughness change are gray (Figure 4), whereas areas with increased backscatter intensity are cyan, indicating emergence
Figure 3. Location Map of SAR Data and the SAR
Lubis
Makara J. Technol. December 2015 | Vol. 19 | No. 3
130
Table 1. Used SAR Data in this Study
Master Slave Orbit Period(d)
2007/6/21 2007/9/21 5432/6774 90
Figure 4. The Illustration of Additive Color Processing of
These Two in Cyan and Red Scale Images Produces a Change Map of Backscatter Intensity
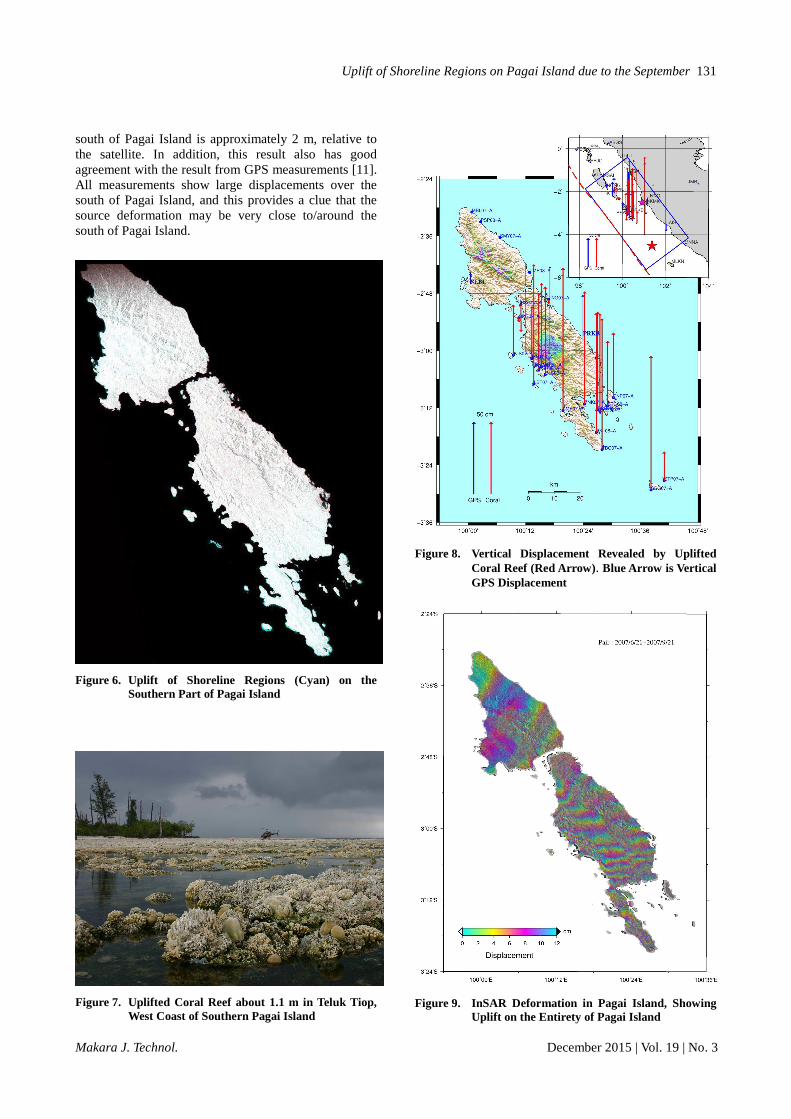
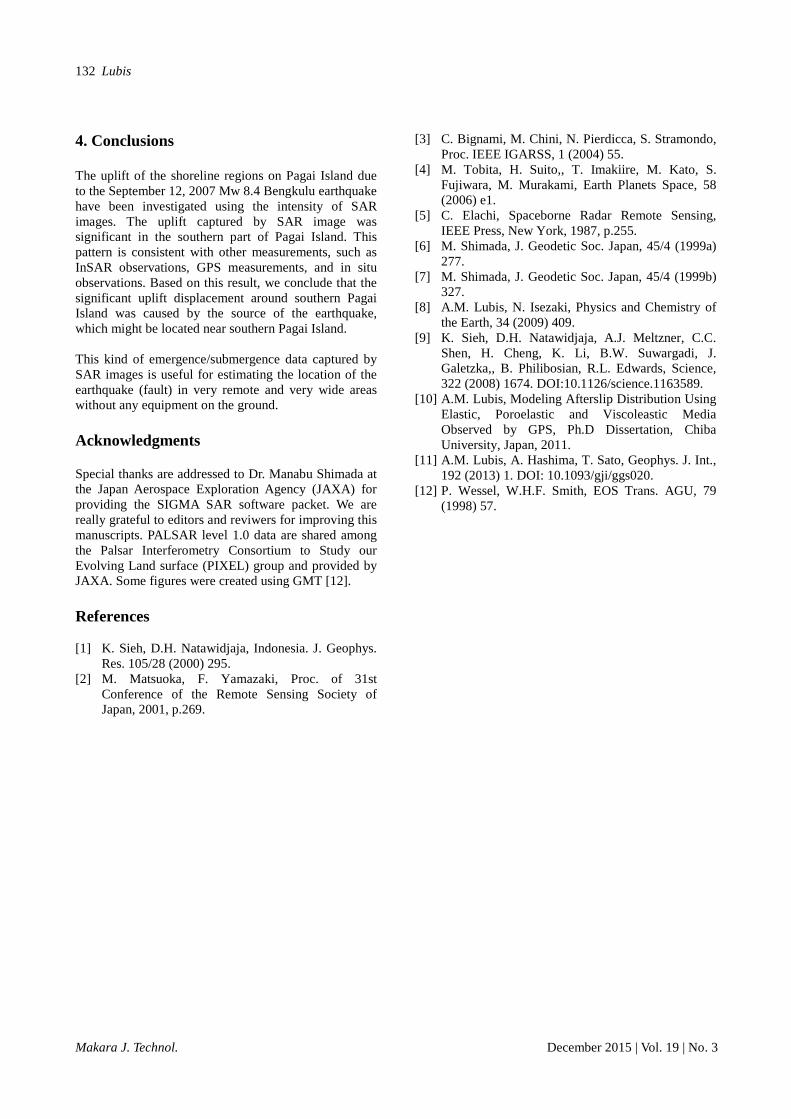
(uplift), and areas with decreased intensity are red because of subsidence or tsunami inundation. The reflection intensity in the ocean depends on the incidence angle of the radar, the polarization of the microwave, and ocean waves (i.e., roughness). Red and cyan areas in the ocean area are due to differences in these three factors. 3. Results and Discussion Figure 5 shows the intensity SAR master and slave image data. These images are derived from a comparison of the intensity of the reflected microwave observed by DAICHI PALSAR between June 21, 2007 (before the Earthquake) and September 21, 2007 (after the Earthquake) to investigate the pattern of deformation and to make a rough estimation of where the source of the September 12, 2007 Mw 8.4 Bengkulu earthquake was located. We observed significant uplift in/around the shoreline region on southern Pagai Island. Figure 6 shows that cyan ribbons on the southern part of Pagai Island are uplift regions due to the co-seismic fault slip during the main shock event. We determined there is no red color in this image, as detected by ALOS-PALSAR data, which means we did not see any signal of subsidence in this region. The visualization of the uplift as an animation image can be found as a supplementary document. The error in measurement could be from the difference in tide level during master and slave data acquisition. It was reported that the difference in tide level at the acquisition time of the SAR data is only 2 cm, so it does not generate a big error and it is ideal for this kind of study.
Figure 5. Result of the Additive Process for SAR Images;
Master and Slave Images are Converted to Red and Cyan Colors, Respectively. Increasing Intensity (Cyan) is Indicated as Uplift in the Shoreline Regions Due to the Earthquake
In Figure 6, we can see that the island rose during the earthquake (cyan), and many small islands increased in diameter due to the earthquake. The September 12, 2007 Mw 8.4 Bengkulu earthquake pushed up a cluster of new islands, and emergence increased the size of the small islands in diameter. In Figure 7, the evidence of uplift from a coral reef is shown in TelukTiop on the west coast of southern Pagai Island. We estimated a 500-m wide emergence of the reef in this figure. A large shoreline change or co-seismic vertical displacement near the coastal region on southern Pagai Island is consistent with field observations from a coral reef analysis, which shows uplift of 2 m in the southern part of Pagai Island (Figure 8) [9]. To verify the pattern of uplift observed in the intensity of SAR images, the result of a huge crustal deformation associated with the September 12, 2007 Mw 8.4 Bengkulu earthquake obtained from SAR interferogram (InSAR) [10] is shown in Figure 9. The InSAR image revealed that the maximum uplift crustal deformation caused by the earthquake movement
Uplift of Shoreline Regions on Pagai Island due to the September
Makara J. Technol. December 2015 | Vol. 19 | No. 3
131
south of Pagai Island is approximately 2 m, relative to the satellite. In addition, this result also has good agreement with the result from GPS measurements [11]. All measurements show large displacements over the south of Pagai Island, and this provides a clue that the source deformation may be very close to/around the south of Pagai Island.
Figure 6. Uplift of Shoreline Regions (Cyan) on the Southern Part of Pagai Island
Figure 7. Uplifted Coral Reef about 1.1 m in Teluk Tiop, West Coast of Southern Pagai Island
Figure 8. Vertical Displacement Revealed by Uplifted Coral Reef (Red Arrow). Blue Arrow is Vertical GPS Displacement
Figure 9. InSAR Deformation in Pagai Island, Showing Uplift on the Entirety of Pagai Island
Lubis
Makara J. Technol. December 2015 | Vol. 19 | No. 3
132
4. Conclusions The uplift of the shoreline regions on Pagai Island due to the September 12, 2007 Mw 8.4 Bengkulu earthquake have been investigated using the intensity of SAR images. The uplift captured by SAR image was significant in the southern part of Pagai Island. This pattern is consistent with other measurements, such as InSAR observations, GPS measurements, and in situ observations. Based on this result, we conclude that the significant uplift displacement around southern Pagai Island was caused by the source of the earthquake, which might be located near southern Pagai Island. This kind of emergence/submergence data captured by SAR images is useful for estimating the location of the earthquake (fault) in very remote and very wide areas without any equipment on the ground. Acknowledgments Special thanks are addressed to Dr. Manabu Shimada at the Japan Aerospace Exploration Agency (JAXA) for providing the SIGMA SAR software packet. We are really grateful to editors and reviwers for improving this manuscripts. PALSAR level 1.0 data are shared among the Palsar Interferometry Consortium to Study our Evolving Land surface (PIXEL) group and provided by JAXA. Some figures were created using GMT [12]. References [1] K. Sieh, D.H. Natawidjaja, Indonesia. J. Geophys.
Res. 105/28 (2000) 295. [2] M. Matsuoka, F. Yamazaki, Proc. of 31st
Conference of the Remote Sensing Society of Japan, 2001, p.269.
[3] C. Bignami, M. Chini, N. Pierdicca, S. Stramondo, Proc. IEEE IGARSS, 1 (2004) 55.
[4] M. Tobita, H. Suito,, T. Imakiire, M. Kato, S. Fujiwara, M. Murakami, Earth Planets Space, 58 (2006) e1.
[5] C. Elachi, Spaceborne Radar Remote Sensing, IEEE Press, New York, 1987, p.255.
[6] M. Shimada, J. Geodetic Soc. Japan, 45/4 (1999a) 277.
[7] M. Shimada, J. Geodetic Soc. Japan, 45/4 (1999b) 327.
[8] A.M. Lubis, N. Isezaki, Physics and Chemistry of the Earth, 34 (2009) 409.
[9] K. Sieh, D.H. Natawidjaja, A.J. Meltzner, C.C. Shen, H. Cheng, K. Li, B.W. Suwargadi, J. Galetzka,, B. Philibosian, R.L. Edwards, Science, 322 (2008) 1674. DOI:10.1126/science.1163589.
[10] A.M. Lubis, Modeling Afterslip Distribution Using Elastic, Poroelastic and Viscoleastic Media Observed by GPS, Ph.D Dissertation, Chiba University, Japan, 2011.
[11] A.M. Lubis, A. Hashima, T. Sato, Geophys. J. Int., 192 (2013) 1. DOI: 10.1093/gji/ggs020.
[12] P. Wessel, W.H.F. Smith, EOS Trans. AGU, 79 (1998) 57.