Embed Size (px)
Citation preview
URBAN GUIDED TRANSIT:
Positioning rail and its rubber-tyred competitors
RD VAN DER MEULEN and LC MÖLLER
Railway Corporate Strategy CC; PO Box 241, Wingate Park 0153, South Africa Mobile 083 275 7004; Fax 088 012 345 2017, e-mail [email protected]
ABSTRACT Railways are inherently competitive when they exploit their strengths of heavy axle load, high speed, and many coupled vehicles. However, urban guided transit, whether steel- or rubber tyred, naturally achieves neither heavy axle load nor high speed: Many coupled vehicles are its only comparative advantage. Four lighter guided transit modes have therefore made inroads into rail’s traditional domain. The authors hypothesized that country and city attributes influenced which guided transit mode or modes fitted particular cities. They populated a database with ninety-eight variables from three hundred and thirty cities, and applied the statistical interventions multivariate factor analysis and structural equation modeling to it. Findings included seven country latent variables whose regression coefficients pointed to the positioning of Heavy Metro, Automated Guided Transit, Monorail, Light Metro, Bus Rapid Transit, and Light Rail: Heavy Metro and Light Rail now represent the poles of an urban guided transit continuum, in which rubber-tyred automated modes have penetrated rail’s traditional market space. In conclusion, green cities require more nuanced guided transit solutions that also address lower capacity requirements. In South Africa, alternative contemporary guided transit solutions to the challenges of long commutes to and from low density communities should be considered. 1 INTRODUCTION 1.1 The research context Heavy- and light urban rail are well established around the world. However, alternative guided transit offerings are ascending—steel tyred automated Light Metro, which is essentially driverless Light Rail, plus the three rubber-tyred modes Automated Guided Transit, Monorail, and Bus Rapid Transit. Urban guided transit usually achieves only low axle load and low speed, so the rail mode is vulnerable to encroachment from rubber-tyred modes, for example in South Africa by bus rapid transit. 1.2 Guided transport genetic technologies The inherent competitiveness of guided transport, of which guided urban transit is a subset, is best examined by considering its degrees-of-freedom-of-movability vis-à-vis other modes. Three degrees of freedom of movability (e.g. aerial- and submarine transport) offer high, spatial mobility, but at relatively high cost. Two degrees-of-freedom-of-movability (e.g. unguided surface transport) offer lower, surface mobility at lower cost. One degree-of-freedom-of-movability (e.g. guided surface transport) offers only limited, linear mobility, back and forth on a guideway, but at relatively low cost in high-volume corridors. Limited mobility disadvantages the comparative value of transport service, so
Dr. Dave van der Meulen and Fienie Möller Urban Guided Transit: Positioning rail and its rubber-tyred competitors
Proceedings of the 31st Southern African Transport Conference 9 -11 July 2012 Page 2 of 11
guided transport modes must offer compensating advantages to compete successfully against modes that offer higher mobility. It follows that such compensating advantages should inhere in the technologies that differentiate guided transport from modes with more degrees-of-freedom-of-movability. A vehicle-guideway pair precisely locates vertical loads, and securely applies lateral loads, technologies named Supporting and Guiding by Vuchic (2007: 449). One may leverage Supporting and Guiding by combining two or many vehicles, to scale capacity as required, a technology the authors named Coupling. Supporting, Guiding, and Coupling are the three genetic technologies that uniquely distinguish guided surface transport from all other modes: The extent to which particular guided transport modes exploit their three genetic technologies determines their inherent competitiveness. 1.3 Application to railway positioning Steel-wheel-on-steel-rail contact mechanics develop vertical- and lateral force com-ponents, corresponding to the Supporting and Guiding genetic technologies: They enable respectively heavier axle load and higher speed than other guided transport modes. Cross-breaking Supporting and Guiding, yields four railway market spaces. Three of them are inherently competitive, exploiting two or more of rail’s genetic technologies—Heavy Haul (Supporting and Coupling), High-speed Intercity (Guiding and Coupling), and Heavy Intermodal (Supporting, Guiding, and Coupling)—to demonstrate robust sustainability in competition with other transport modes. The authors have already developed grounded understanding of railway positioning in those three market spaces (Van der Meulen & Möller, 2008). The next section, the topic of this paper, addresses the fourth market space where rail is inherently weak. 1.4 The challenge for urban rail By railway standards, human passengers do not achieve high axle load, even in double deck vehicles. Furthermore, comfort criteria and the physical laws that relate acceleration, coasting, retardation, and station dwell time max out urban transit capacity at ±80km/h. Therefore urban rail cannot maximally exploit either the Supporting- or the Guiding genetic technology: It is confined to a potentially weak market space in which it can exploit only the Coupling genetic technology. The latter maximizes passenger capacity per direction per hour by forming vehicles into trains to achieve shorter mean headways than would the same number of independent vehicles. However, where urban rail does not realize its capacity potential by failing to exploit at least the coupling genetic technology, it is vulnerable to competition from the rubber-tyred modes Automated Guided Transit, Bus Rapid Transit, and Monorail: Their rubber tyres impose comparatively light axle load constraints and they do not attain high speed for the same reasons as rail. Therefore, where urban rail cannot or does not exploit its Coupling genetic technology, rubber-tyred urban guided transit incurs minimal competitive disadvantage, and is able to encroach on rail’s domain. The authors examined how the following rubber tyred and steel tyred modes related to each other in urban settings. 2 CONTENDING URBAN GUIDED TRANSIT MODES
Dr. Dave van der Meulen and Fienie Möller Urban Guided Transit: Positioning rail and its rubber-tyred competitors
Proceedings of the 31st Southern African Transport Conference 9 -11 July 2012 Page 2 of 11
2.1 Current contenders Heavy Metro and Light Rail are well established. However, Light Metro, Automated Guided Transit, Monorail, and Bus Rapid Transit are ascending: These six contending modes are described below1. Note that standard buses are present in all cities. Aside from their absence of guidance, they cannot contribute understanding to a study of differences among modes. Standard buses were nevertheless included in the database as country aggregates, to control for their symbiotic influence on guided urban transit. 2.2 Heavy Metro Heavy Metro maximally exploits rail’s genetic technologies in urban settings. For statistical purposes, the authors grouped the rubber-tyred systems found on some Paris Métro lines, and similar systems in Montréal, Santiago, and Mexico City with Heavy Metro: Despite rubber-tyred Supporting and Guiding, their gleaming running rails and wheel flanges indicate that these steel components are not redundant.
2.3 Light Rail and Trams This study merged Light Rail and Trams, because neither attains fully controlled right of way (Vuchic 2007: 47). By definition, at 10-11 tonnes/axle, their exploitation of rail’s Supporting genetic technology is weak. Likewise the built environment limits exploitation of rail’s Guiding genetic technology to very low speed. Typically only a small number of vehicles is coupled. Technically, their inherent competitiveness is marginal. 2.4 Light Metro Light Metro takes Light Rail to the next level with fully segregated right-of-way. Light axle load minimizes the cost of elevated structures, while typically small vehicle profiles minimize the cost of civil works, particularly underground. Driverless operation offers consistent performance and operational flexibility free from the labour issues that disturb systems with human operators. Not unexpectedly, rubber-tyred modes offer prime competition in the light axle load guided transit field. In a contest where the maximum speed of all modes is approximately equal, leaders must leverage headway through high acceleration and retardation to maximize capacity. Having no pretence at high axle load, the following modes exploit the consistent-ly high adhesion of rubber tyres to encroach on what has been rail’s eminent domain. 2.5 Automated Guided Transit Automated Guided Transit (Vuchic, 2007, p.455), e.g. VAL and similar systems, offers a solution for compact cities. Rubber tyres constrain axle load, but offer consistently higher acceleration and higher retardation than steel-on-steel. As for automated Light Metro, light axle load and small vehicle profile minimize the cost of civil works. Automated operation offers consistent, precise high performance plus operational flexibility.
1 While other one-off systems do exist, they have not yet achieved critical mass in the market.
Dr. Dave van der Meulen and Fienie Möller Urban Guided Transit: Positioning rail and its rubber-tyred competitors
Proceedings of the 31st Southern African Transport Conference 9 -11 July 2012 Page 2 of 11
2.6 Monorail Monorail excels where pre-existing built environment allows only elevated infrastructure with a small ground-level footprint. Transit-grade (as distinct from amusement park) monorail technology has converged on rubber tyred straddle systems. Capacity and performance is therefore comparable to Automated Guided Transit: Once again, auto-mated operation offers consistent, precise high performance plus operational flexibility. 2.7 Bus Rapid Transit Bus Rapid Transit reputedly rolls out faster at lower cost than comparable rail systems. Its place in guided urban transit is justified by the narrow concrete runway provided to support its relatively heavy 12-13 tonne axle load, plus aspiration to virtual guidance by lane tracking systems. Bi-articulated buses even emulate rail’s Coupling genetic technology. 2.8 The research question The foregoing descriptions suggested the possibility of gradual transformation in urban guided transit solutions as some new investments promote lighter guided transit solutions. The research question was therefore Which country- and city green- and socio-economic attributes and relations fit guided transit solutions to particular cities? The methodology follows that previously published by Van der Meulen & Möller (2012), so only key aspects are mentioned below. 3 METHODOLOGY 3.1 The research design Global research requires a high-level top-down approach. Adopting a corporate citizenship perspective admitted data from the public domain. Borrowing from organizational ecology indicated a longitudinal design, to examine whole-industry adaptation over time. Scientific descriptive research requires a set of variables, i.e. the columns, and a set of cases, i.e. the rows, in a database. While data for countries is common to other research and abundantly available, the authors found that data for cities was hard to come by. This study therefore necessarily traded off the detailed information available to case studies or defined-setting studies, against the limited number of variables for which data were consistently available across all cities. 3.2 Selection of variables The authors used two categorical variables (Country Name and City Name) to describe the global setting, plus 96 scalar variables to describe countries, cities, and transit solutions. Comprehensive operational definitions, measurement scales, and source references, either documentary or uniform resource locator, for each of the variables mentioned below, are available at www.railcorpstrat.com/Databases/Operational%20Definitions.pdf . The essential variables to describe and measure the country setting were selected from World Bank Development Indicators: Themes identified by content analysis of Time magazine for a twelve-month period suggested the 28 indicators actually used out of 298
Dr. Dave van der Meulen and Fienie Möller Urban Guided Transit: Positioning rail and its rubber-tyred competitors
Proceedings of the 31st Southern African Transport Conference 9 -11 July 2012 Page 2 of 11
available. In addition, authors’ judgment selected International Road Federation road network- and vehicle population statistics, and Fuel Price (proxies for the amount of competition); and Economic Freedom Index and Income Inequality (proxies for gover-nance and societal attributes). The essential variables to describe and measure the city setting were Surface Area, Metropolitan Population, Population Growth Rate, World Cities Score, Green Cities Score, and Smart Card Application. The variables that describe transit resources and -contri-bution, namely Inaugural Year, Number of Operators, Status of Project, Network Coverage, Rolling Stock Fleet, Passenger Journeys, Number of Routes, Number of Stations, and Employee Count, were measured separately for each mode. 3.3 Selection of cases This study used the entire population of cities for which sufficient data could be found to populate the database in respect of the transit modes that served them: Sample size is therefore a non-issue. The longitudinal research design captured the growth dynamics of the global urban transit industry for the three consecutive years 2009-2011. To add a fourth, projected year, 2012, some 500 concurrent greenfields- and brownfields projects in various stages of progress were also included, measured on a five-point scale (Proposed 1, Feasibility Study 2, In Design 3, Under Construction 4, and Operational 5). The latter value of course also applied to all cases for the years 2009-2011. Where necessary, the raw data for agglomerations with more than one guided transit mode were adjusted to match them to the population and area that they served. Details of the affected agglomerations accompany the applicable operational definitions. 3.4 A dedicated urban guided transit database The authors constructed a new, dedicated, urban guided transit database using the variables and cases mentioned above. Comprising two data subsets, namely countries and cities, it is available at www.railcorpstrat.com/Databases/Database%20and%20Factor%20Loading%20Matrices.xls. The database contains 330 cities in 68 countries, each with four years’ data for the years 2009-2012, for a total of 1320 cases: This yielded (1320 cases) x ((2+96) variables) = 129 360 observations. 3.5 Statistical analysis Reflecting the research question, exploratory factor analysis was first undertaken sepa-rately for country- and for city descriptive variables, using Statgraphics Centurion XV software. A multivariate statistical technique that explains relations among many variables in terms of a smaller number of latent variables, factor analysis reduced the initial thirty-six country variables to seven country-related latent variables, namely Country Stature, Economic Development Level, Energy Demand Level and alter ego Alternative Energy Acceptance, Services Contribution to GDP; Trade Contribution to GDP, and Societal Development Level. Similarly, factor analysis reduced the initial 60 city variables to seven city-related latent variables, namely Heavy Metro Position, Automated Guided Transit
Dr. Dave van der Meulen and Fienie MPositioning rail and its rubber-
Proceedings of the 31st Southern African Transport Conference 9
Position, Monorail Position, Light Metro PositionImpediments. The authors named the latent variables in the light of the variables that loaded onto them, informed by their contextual appreciation of urban rail in its city and country settings: The separate factor loading matrices for couable at www.railcorpstrat.com/Databases/Database%20and%20Factor%20Loading%20Matrices.xls. Thereafter, structural equation modeling using these latent variables. The path diagram in Figure 1 shows the significant standardized regression coefficients as arrows pointing to the dependent latent variables with correlations at the 0.05 level. Positive correlations indicate opposition. The next section interprets the statistical findings in urban transit language.
Figure 1: The path diagram output from structural equation mo deling
4 FINDINGS
Dr. Dave van der Meulen and Fienie Möller Urban Guided Transit: -tyred competitors
Southern African Transport Conference 9 -11 July 2012
Light Metro Position, Light Rail Position. The authors named the latent variables in the light of the variables that
m, informed by their contextual appreciation of urban rail in its city and country settings: The separate factor loading matrices for countries and cities are avail
www.railcorpstrat.com/Databases/Database%20and%20Factor%20Loading%20M
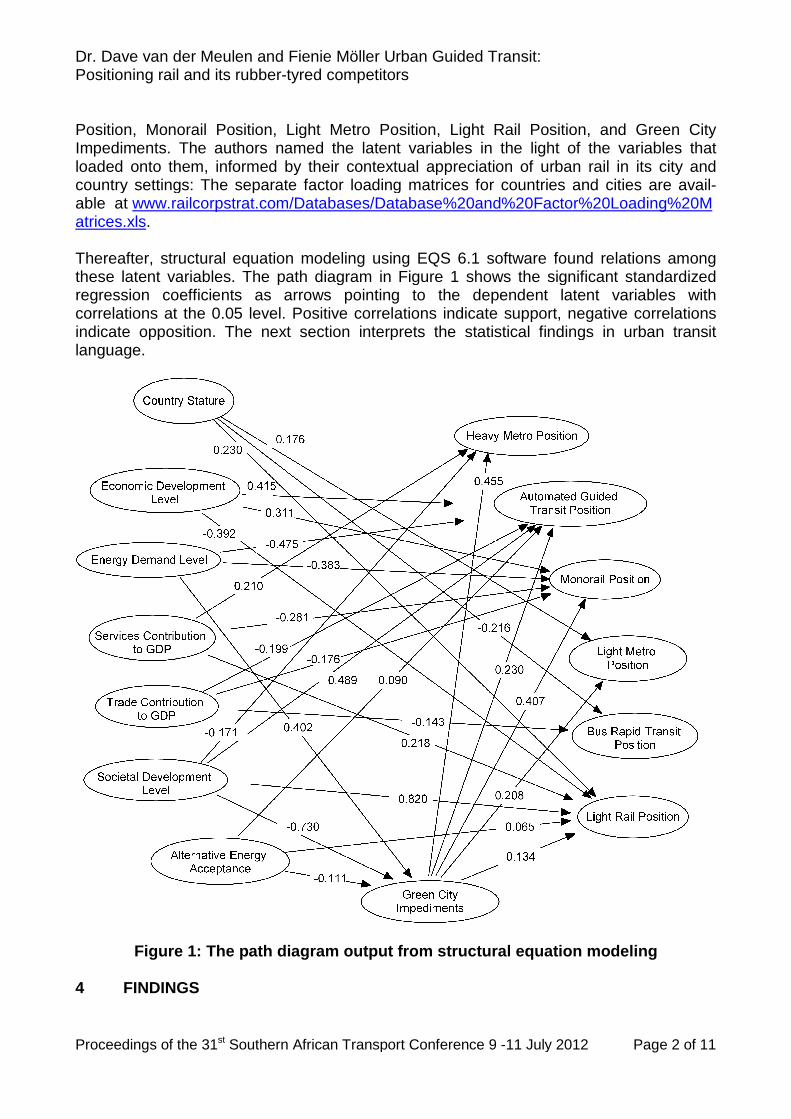
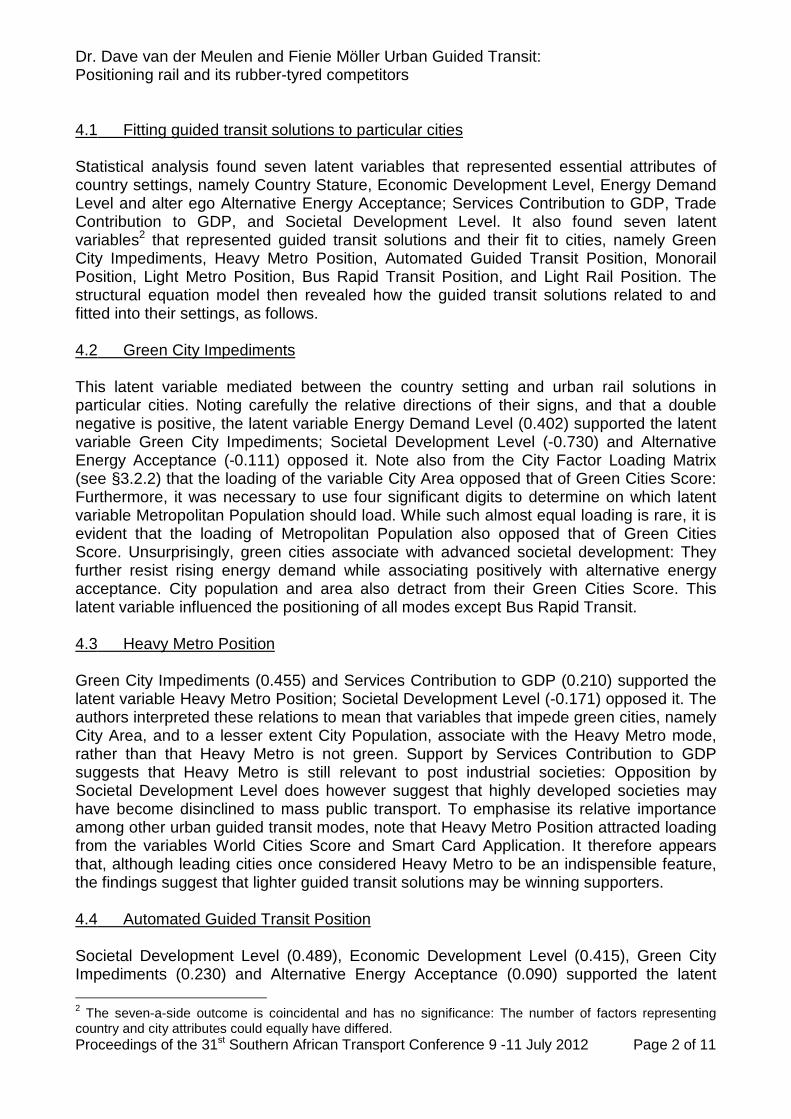
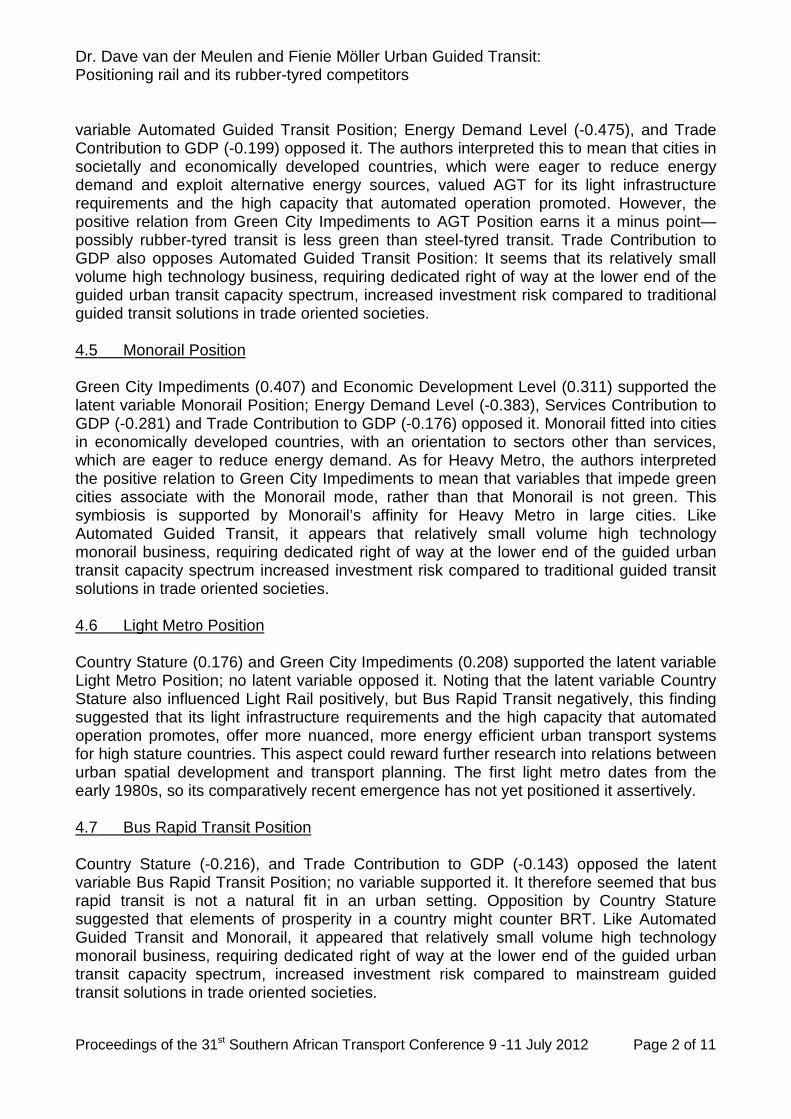
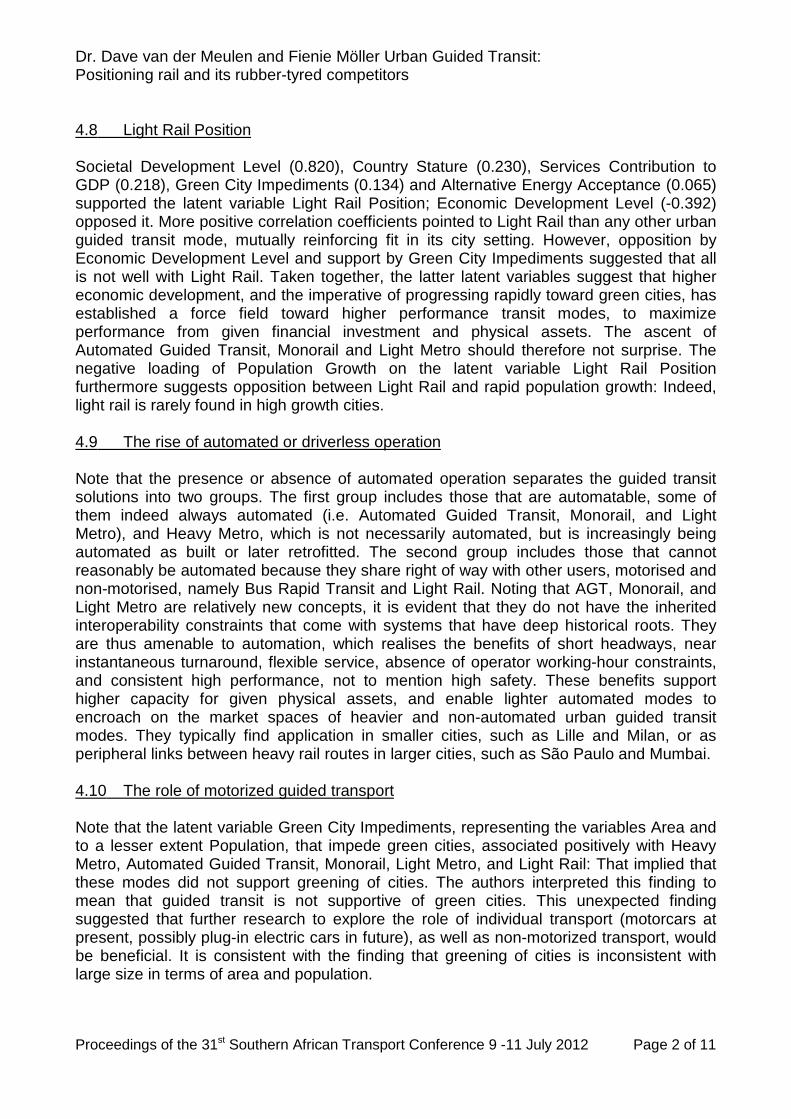
Thereafter, structural equation modeling using EQS 6.1 software found relations among these latent variables. The path diagram in Figure 1 shows the significant standardized regression coefficients as arrows pointing to the dependent latent variables with correlations at the 0.05 level. Positive correlations indicate support, negative correlations indicate opposition. The next section interprets the statistical findings in urban transit
The path diagram output from structural equation mo deling
11 July 2012 Page 2 of 11
Light Rail Position, and Green City . The authors named the latent variables in the light of the variables that
m, informed by their contextual appreciation of urban rail in its city and ntries and cities are avail-
www.railcorpstrat.com/Databases/Database%20and%20Factor%20Loading%20M
software found relations among these latent variables. The path diagram in Figure 1 shows the significant standardized regression coefficients as arrows pointing to the dependent latent variables with
indicate support, negative correlations indicate opposition. The next section interprets the statistical findings in urban transit
The path diagram output from structural equation mo deling
Dr. Dave van der Meulen and Fienie Möller Urban Guided Transit: Positioning rail and its rubber-tyred competitors
Proceedings of the 31st Southern African Transport Conference 9 -11 July 2012 Page 2 of 11
4.1 Fitting guided transit solutions to particular cities Statistical analysis found seven latent variables that represented essential attributes of country settings, namely Country Stature, Economic Development Level, Energy Demand Level and alter ego Alternative Energy Acceptance; Services Contribution to GDP, Trade Contribution to GDP, and Societal Development Level. It also found seven latent variables2 that represented guided transit solutions and their fit to cities, namely Green City Impediments, Heavy Metro Position, Automated Guided Transit Position, Monorail Position, Light Metro Position, Bus Rapid Transit Position, and Light Rail Position. The structural equation model then revealed how the guided transit solutions related to and fitted into their settings, as follows. 4.2 Green City Impediments This latent variable mediated between the country setting and urban rail solutions in particular cities. Noting carefully the relative directions of their signs, and that a double negative is positive, the latent variable Energy Demand Level (0.402) supported the latent variable Green City Impediments; Societal Development Level (-0.730) and Alternative Energy Acceptance (-0.111) opposed it. Note also from the City Factor Loading Matrix (see §3.2.2) that the loading of the variable City Area opposed that of Green Cities Score: Furthermore, it was necessary to use four significant digits to determine on which latent variable Metropolitan Population should load. While such almost equal loading is rare, it is evident that the loading of Metropolitan Population also opposed that of Green Cities Score. Unsurprisingly, green cities associate with advanced societal development: They further resist rising energy demand while associating positively with alternative energy acceptance. City population and area also detract from their Green Cities Score. This latent variable influenced the positioning of all modes except Bus Rapid Transit. 4.3 Heavy Metro Position Green City Impediments (0.455) and Services Contribution to GDP (0.210) supported the latent variable Heavy Metro Position; Societal Development Level (-0.171) opposed it. The authors interpreted these relations to mean that variables that impede green cities, namely City Area, and to a lesser extent City Population, associate with the Heavy Metro mode, rather than that Heavy Metro is not green. Support by Services Contribution to GDP suggests that Heavy Metro is still relevant to post industrial societies: Opposition by Societal Development Level does however suggest that highly developed societies may have become disinclined to mass public transport. To emphasise its relative importance among other urban guided transit modes, note that Heavy Metro Position attracted loading from the variables World Cities Score and Smart Card Application. It therefore appears that, although leading cities once considered Heavy Metro to be an indispensible feature, the findings suggest that lighter guided transit solutions may be winning supporters. 4.4 Automated Guided Transit Position Societal Development Level (0.489), Economic Development Level (0.415), Green City Impediments (0.230) and Alternative Energy Acceptance (0.090) supported the latent 2 The seven-a-side outcome is coincidental and has no significance: The number of factors representing country and city attributes could equally have differed.
Dr. Dave van der Meulen and Fienie Möller Urban Guided Transit: Positioning rail and its rubber-tyred competitors
Proceedings of the 31st Southern African Transport Conference 9 -11 July 2012 Page 2 of 11
variable Automated Guided Transit Position; Energy Demand Level (-0.475), and Trade Contribution to GDP (-0.199) opposed it. The authors interpreted this to mean that cities in societally and economically developed countries, which were eager to reduce energy demand and exploit alternative energy sources, valued AGT for its light infrastructure requirements and the high capacity that automated operation promoted. However, the positive relation from Green City Impediments to AGT Position earns it a minus point—possibly rubber-tyred transit is less green than steel-tyred transit. Trade Contribution to GDP also opposes Automated Guided Transit Position: It seems that its relatively small volume high technology business, requiring dedicated right of way at the lower end of the guided urban transit capacity spectrum, increased investment risk compared to traditional guided transit solutions in trade oriented societies. 4.5 Monorail Position Green City Impediments (0.407) and Economic Development Level (0.311) supported the latent variable Monorail Position; Energy Demand Level (-0.383), Services Contribution to GDP (-0.281) and Trade Contribution to GDP (-0.176) opposed it. Monorail fitted into cities in economically developed countries, with an orientation to sectors other than services, which are eager to reduce energy demand. As for Heavy Metro, the authors interpreted the positive relation to Green City Impediments to mean that variables that impede green cities associate with the Monorail mode, rather than that Monorail is not green. This symbiosis is supported by Monorail’s affinity for Heavy Metro in large cities. Like Automated Guided Transit, it appears that relatively small volume high technology monorail business, requiring dedicated right of way at the lower end of the guided urban transit capacity spectrum increased investment risk compared to traditional guided transit solutions in trade oriented societies. 4.6 Light Metro Position Country Stature (0.176) and Green City Impediments (0.208) supported the latent variable Light Metro Position; no latent variable opposed it. Noting that the latent variable Country Stature also influenced Light Rail positively, but Bus Rapid Transit negatively, this finding suggested that its light infrastructure requirements and the high capacity that automated operation promotes, offer more nuanced, more energy efficient urban transport systems for high stature countries. This aspect could reward further research into relations between urban spatial development and transport planning. The first light metro dates from the early 1980s, so its comparatively recent emergence has not yet positioned it assertively. 4.7 Bus Rapid Transit Position Country Stature (-0.216), and Trade Contribution to GDP (-0.143) opposed the latent variable Bus Rapid Transit Position; no variable supported it. It therefore seemed that bus rapid transit is not a natural fit in an urban setting. Opposition by Country Stature suggested that elements of prosperity in a country might counter BRT. Like Automated Guided Transit and Monorail, it appeared that relatively small volume high technology monorail business, requiring dedicated right of way at the lower end of the guided urban transit capacity spectrum, increased investment risk compared to mainstream guided transit solutions in trade oriented societies.
Dr. Dave van der Meulen and Fienie Möller Urban Guided Transit: Positioning rail and its rubber-tyred competitors
Proceedings of the 31st Southern African Transport Conference 9 -11 July 2012 Page 2 of 11
4.8 Light Rail Position Societal Development Level (0.820), Country Stature (0.230), Services Contribution to GDP (0.218), Green City Impediments (0.134) and Alternative Energy Acceptance (0.065) supported the latent variable Light Rail Position; Economic Development Level (-0.392) opposed it. More positive correlation coefficients pointed to Light Rail than any other urban guided transit mode, mutually reinforcing fit in its city setting. However, opposition by Economic Development Level and support by Green City Impediments suggested that all is not well with Light Rail. Taken together, the latter latent variables suggest that higher economic development, and the imperative of progressing rapidly toward green cities, has established a force field toward higher performance transit modes, to maximize performance from given financial investment and physical assets. The ascent of Automated Guided Transit, Monorail and Light Metro should therefore not surprise. The negative loading of Population Growth on the latent variable Light Rail Position furthermore suggests opposition between Light Rail and rapid population growth: Indeed, light rail is rarely found in high growth cities. 4.9 The rise of automated or driverless operation Note that the presence or absence of automated operation separates the guided transit solutions into two groups. The first group includes those that are automatable, some of them indeed always automated (i.e. Automated Guided Transit, Monorail, and Light Metro), and Heavy Metro, which is not necessarily automated, but is increasingly being automated as built or later retrofitted. The second group includes those that cannot reasonably be automated because they share right of way with other users, motorised and non-motorised, namely Bus Rapid Transit and Light Rail. Noting that AGT, Monorail, and Light Metro are relatively new concepts, it is evident that they do not have the inherited interoperability constraints that come with systems that have deep historical roots. They are thus amenable to automation, which realises the benefits of short headways, near instantaneous turnaround, flexible service, absence of operator working-hour constraints, and consistent high performance, not to mention high safety. These benefits support higher capacity for given physical assets, and enable lighter automated modes to encroach on the market spaces of heavier and non-automated urban guided transit modes. They typically find application in smaller cities, such as Lille and Milan, or as peripheral links between heavy rail routes in larger cities, such as São Paulo and Mumbai. 4.10 The role of motorized guided transport Note that the latent variable Green City Impediments, representing the variables Area and to a lesser extent Population, that impede green cities, associated positively with Heavy Metro, Automated Guided Transit, Monorail, Light Metro, and Light Rail: That implied that these modes did not support greening of cities. The authors interpreted this finding to mean that guided transit is not supportive of green cities. This unexpected finding suggested that further research to explore the role of individual transport (motorcars at present, possibly plug-in electric cars in future), as well as non-motorized transport, would be beneficial. It is consistent with the finding that greening of cities is inconsistent with large size in terms of area and population.
Dr. Dave van der Meulen and Fienie Möller Urban Guided Transit: Positioning rail and its rubber-tyred competitors
Proceedings of the 31st Southern African Transport Conference 9 -11 July 2012 Page 2 of 11
Note also that BRT is not among the abovementioned five modes that associate, either positively or negatively, with Green City Impediments. One should not be tempted to entertain a finding that was not brought to light by the statistical intervention. Therefore, to preempt jumping to the conclusion that BRT is at least not positively associated with Green City Impediments, note that it displaces many relatively less green road vehicles by a smaller number of relatively more green road vehicles, with net green benefit. 4.11 The significance of Inaugural Year Note that the variable Inaugural Year loads negatively on the Position latent variable for all modes. The authors interpreted this to mean that a system’s historical roots could burden its ability to adapt to an emerging future; put differently, the strengths provided by guided transport modes’ genetic technologies can be weaknesses if they are not exploited. Further research with more variables would be needed to understand the phenomenon. 5 CONCLUSIONS 5.1 A global perspective on urban guided transit The foregoing findings demonstrated a range of country- and city green- and socio-economic attributes and relations that fit guided transit solutions to particular cities. The two traditional urban rail solutions, Heavy Metro and Light Rail, evidently now represent the poles of a continuum of urban guided transit solutions, rather than the only solutions. Heavy Metro leads high capacity urban transit, not just in throughput past a choke point, such as a tunnel, but in maximum corridor capacity despite offering high quality service through frequent stops. Light Rail leads green urban transit, attracting support from the latent variables Societal Development Level, Country Stature, Services Contribution to GDP, Green City Impediments and Alternative Energy Acceptance. Those latent variables satisfy cities that value greenness, but nowadays it may be difficult to justify Light Rail’s capacity cost-benefit ratio, other than in existing cities where its legacy right of way avoids the prohibitive expense of acquiring it from scratch. The other urban guided transit modes, Automated Guided Transit, Monorail, Light Metro, and Bus Rapid Transit, have emerged in recent years to contest the market space be-tween Heavy Metro and Light Rail. Here low speed and light axle load have rendered rail inherently weak, and it has lost ground to alternative solutions in cities where urban rail’s high capacity and green strengths are not sufficient to secure investment therein. These light axle load modes, rubber-tyred Automated Guided Transit, Monorail, and Bus Rapid Transit, and steel-tyred Light Metro, have positioned themselves at mid-market, where they can compete upscale against Heavy Metro, and downscale against Light Rail. Over time, they stand to reshape the urban guided transit market space, in particular insofar as it appears that smaller, greener cities will demand more nuanced guided transit solutions. 5.2 A South African perspective on urban guided transit In addition to the foregoing conclusions, the findings also have particular implications for spatial development in the South African context, both now and when fossil fuels have become more expensive than they are at present.
Dr. Dave van der Meulen and Fienie Möller Urban Guided Transit: Positioning rail and its rubber-tyred competitors
Proceedings of the 31st Southern African Transport Conference 9 -11 July 2012 Page 2 of 11
Firstly, tension exists between contemporary technological solutions and the need to create employment. Automated operation displaces human drivers and destroys jobs, so one would expect resistance against such systems. Notwithstanding that, the ability to run trains around the clock should contribute value to a developmental economy, by enabling its relatively low-skilled workforce to be employed in industrial jobs that require shift work, and that are not conveniently accessible without 24/7 public transport. Second, when advancing into the era in which rail should form the transport backbone by virtue of its low specific energy consumption, the roles of commercial- industrial-, and residential development should be informed by integrated transport considerations, not vice-versa. The apartheid legacy complicates the issue, among other because it has led to comparatively long commuting distances to and from low density communities. Does this uniquely South African market space admit one of the emerging urban guide transit solutions? These issues have not yet elicited professional- or public scrutiny … 6 REFERENCES Van der Meulen, R.D. & Möller, L.C. 2008. Ultimate interoperability: Line-haul railways as global corporate citizens. Proceedings of the 8th World Congress on Railway Research. Seoul, Korea. Van der Meulen, R.D. & Möller, L.C. 2012. European- and global urban guided transit: Green- and socio-economic fit. Proceedings of the Transport Research Arena. Athens, Greece. Vuchic, V.R. 2007. Urban transit systems and technology. Hoboken, NJ: Wiley.